NESTLÉ HOLDINGS, INC. (A Wholly Owned Subsidiary of Nestlé ... · PDF...
70
NESTLÉ HOLDINGS, INC. (A Wholly Owned Subsidiary of Nestlé S.A.) AND SUBSIDIARIES A N N U A L F I N A N C I A L R E P O R T Management Report *** Responsibility Statement *** Consolidated Financial Statements December 31, 2008 and 2007 (With Independent Auditors’ Report Thereon)
Transcript of NESTLÉ HOLDINGS, INC. (A Wholly Owned Subsidiary of Nestlé ... · PDF...
NESTLÉ HOLDINGS, INC. (A Wholly Owned Subsidiary of Nestlé S.A.)
AND SUBSIDIARIES
A N N U A L F I N A N C I A L R E P O R T
Management Report
***
Responsibility Statement
***
Consolidated Financial Statements
December 31, 2008 and 2007
(With Independent Auditors’ Report Thereon)

NESTLÉ HOLDINGS, INC. (A Wholly Owned Subsidiary of Nestlé S.A.)
AND SUBSIDIARIES
December 31, 2008 and 2007
1
Management Report
Nestlé Holdings, Inc. (“NHI”) (hereinafter, together with its subsidiaries, referred to as “the Company”) is a wholly owned subsidiary of Nestlé S.A., incorporated in Switzerland, which is the holding company of the Nestlé group of companies. NHI is the holding company for Nestlé S.A.’s principal operating subsidiaries in the United States, other than Nestlé Waters North America, Inc. and Alcon Laboratories, Inc.
The Company manufactures food and beverages as well as products related to the nutrition, health and wellness industries and distributes its products primarily in the United States of America. Such products include: soluble coffee, chocolate-based drinks, dairy products, infant nutrition, healthcare nutrition, performance nutrition, ice cream, frozen and chilled food, culinary aids and chocolate and confectionary. Other business activities include pet foods, juvenile life insurance, weight management products and. infant products.
Key Figures
(US Dollars in millions) 2008 2007 change %
Net sales $21,092.4 $18,324.4 15.1%
Growth excluding acquisitions 6.8% 8.3%
Growth excluding acquisitions and pricing 1.5% 3.4%
Earnings before interest, taxes,
and other expenses ("EBIT") $2,286.7 $2,031.2 12.6%
as a % of net sales 10.8% 11.1%
Net financing costs ($749.7) ($943.7) (20.6%)
Income tax expense ($1,194.2) ($421.5) 183.3%
Net Income $317.6 $632.1 (49.8%)
as a % of net sales 1.5% 3.4%
Operating cash flows $722.0 $566.1 27.5%
as a % of net sales 3.4% 3.1%
Capital expenditures $801.9 $841.8 (4.7%)
Overview
The last twelve months will likely be remembered for the unprecedented and rapid changes in the economic environment, the sharply falling stock markets, a global crisis of confidence, rising
NESTLÉ HOLDINGS, INC. (A Wholly Owned Subsidiary of Nestlé S.A.)
AND SUBSIDIARIES
December 31, 2008 and 2007
2
unemployment, and volatile raw material prices. In this environment, NHI delivered strong sales growth and a solid EBIT margin.
Raw material cost pressure began to increase significantly in 2007 and prevailed well into 2008. Their impact in 2008 is very visible in the high level of pricing achieved as well as the impact on cost of goods sold. Our ability to take such necessary pricing action and to do so while continuing to achieve a good positive level of growth, excluding the impact of acquisitions and pricing, is testimony to the strength of our brands.
Pricing, and volume growth (excluding the impact of acquisitions and pricing), were significant factors in our ability to defend EBIT margins. Just as important, however, was our continued improvement in the product mix, as we continue to drive our nutrition, health and wellness strategy across all our product categories and our accelerated drive for efficiencies from farm gate to consumer. Operational efficiency incorporates areas such as the supply chain, our factories, administrative costs, and improved returns on our marketing and trade spends.
Sales
For the year ended December 31, 2008, consolidated net sales totaled $21.1 billion, representing an increase of 15.1% compared to the same period last year. The acquisitions of Novartis Nutrition Corporation (“Healthcare Nutrition”) and Gerber Products Company, Gerber Finance Company and Gerber Life Insurance Company (collectively referred to as “Gerber”), in July and September of 2007, respectively, contributed 8.7% to sales growth in 2008.
Nestlé USA Brands sales growth was attributable to price increases as well as volume and product mix when compared to 2007. Two notable product lines driving 2008 growth were ambient dairy and ready-to-drink products. Offsetting this growth, a few product lines experienced slight declines in sales since 2007 such as individually wrapped chocolate candies and sugar confections. A few prominent brands in this segment include Coffee-Mate, Juicy Juice, Nesquik, Stouffers, Lean Cuisine, Nestlé Crunch, and Nestlé Toll House.
PetCare sales growth was driven primarily by the dry dog and cat food product lines through sales volume, product mix, and product pricing in comparison to 2007. Dry dog and cat food commanded a significant market presence. A few notable brands in this segment include Beneful, Alpo, Purina One, Purina Dog Chow, Mighty Dog, Friskies, and Purina Cat Chow.
Ice Cream sales declined slightly in comparison to 2007 as consumers shifted to lower priced generic brands over premium name brands in 2008. However, product mix and price increases offset much of this volume decline.
Nutrition sales grew slightly excluding the 2007 acquisitions of Healthcare Nutrition and Gerber.
Profitability – leveraging the focus on nutrition, health and wellness
EBIT for the year ended December 31, 2008 grew 12.6% to $2.3 billion, with EBIT margins slightly decreasing by 0.3% of net sales compared to last year. The 2007 acquisitions of Healthcare Nutrition and Gerber made positive contributions to improvements in profitability. Growth, along with pricing actions and cost saving initiatives, improved EBIT margin although these efforts were mostly offset by higher energy costs and inflationary increases in commodities and other raw material input costs across all business segments.

NESTLÉ HOLDINGS, INC. (A Wholly Owned Subsidiary of Nestlé S.A.)
AND SUBSIDIARIES
December 31, 2008 and 2007
3
Taken together, commodity and other raw material input costs drove cost of goods sold up by 237 basis points, from 45.8% to 48.2% of net sales when compared to 2007. In the same period, non-production costs, as a percentage of net sales, fell 212 basis points primarily driven by efficiencies in marketing, general and administrative overhead costs.
Net Profit Margin – other items of interest
Net financing costs decreased 20.6% or $194.0 million in comparison to the prior financial year primarily due to lower interest rates on financial liabilities, mostly bonds and commercial paper, which was slightly offset by financial asset interest income which decreased at a slower pace in 2008.
The Company's tax charge for 2008 increased primarily as a result of transactions associated with the Company's 2007 acquisitions of Healthcare Nutrition and Gerber. In 2008, the Company transferred certain assets to its foreign affiliates in order to achieve alignment with Nestlé's business structure. These sales resulted in additional tax expense without any significant impact on the pre-tax financial results of the Company.
Cash flow
Operating cash flow increased by $155.9 million, or 27.5%, in 2008 when compared to 2007, primarily due to growth in the Company’s EBIT, which was partially offset by increased tax payments. Capital expenditures decreased 4.7% in comparison to the high level of investment incurred in the prior year. Capital expenditures in 2009 are anticipated to decline compared with the levels of 2008 and 2007.
Principal risks and uncertainties
Risk Management
At the Nestlé S.A. level, the Nestlé Group Enterprise Risk Management Framework (ERM) is designed to identify, communicate, and mitigate risks in order to minimize their potential impact on the Nestlé group of companies, including NHI. A “Top-Down” assessment occurs annually and focuses on the global risk portfolio. It is intended to allow management to make sound decisions on the future operations of the Company. Risk assessments are the responsibility of line management; this applies equally to a segment or a corporate function, and any mitigating actions identified in the assessments are the responsibility of the individual line management. If Nestlé S.A. intervention is required, responsibility for mitigating actions will generally be determined by the Executive Board of Nestlé S.A. The results of the ERM are presented to the Executive Board and Audit Committee of Nestlé S.A. annually.
Factors Affecting Results
The Company’s reputation is based on consumers’ trust. Any major event triggered by a serious food safety or other compliance issue could potentially impact the Company’s reputation or brand image. The Company has all required policies, processes and controls in place to mitigate against such an event.
The Company is dependent on sustainable supplies of a number of raw materials, packaging materials and services/utilities. Any major event triggered by natural hazards (drought, flood, etc.), change in macro-economic environment (shift in production patterns, “biofuels,” excessive trading) resulting in input price volatilities and/or capacity constraints could potentially impact the Company’s financial results. The Company has all required policies, processes and controls in place to mitigate against such an event.
NESTLÉ HOLDINGS, INC. (A Wholly Owned Subsidiary of Nestlé S.A.)
AND SUBSIDIARIES
December 31, 2008 and 2007
4
The Company’s liquidities/liabilities (currency, interest rate, derivatives, and/or hedging, pension funding obligations, commercial credit) could potentially be impacted by any major event in the financial markets. NHI, along with its parent company Nestlé S.A., has necessary policies, processes and controls in place to mitigate against such an event.
The Company is dependent on sustainable supplies of finished goods for all product categories. A major event in one of the Company’s key plants, at a key supplier, contract manufacturers, co-packers, and/or key warehouse facility could potentially lead to a supply disruption and impact upon the Company’s financial results. Necessary business continuity plans are established and regularly maintained in order to mitigate against such an event.
Security, political stability, legal and regulatory, macro-economic, foreign trade, labor, and/or infrastructure risks could potentially also impact upon the Company’s ability to do business. Events such as a human pandemic could potentially also impact upon the Company’s ability to operate. Any of these events could potentially lead to a supply disruption and impact upon the Company’s financial results. Regular monitoring and ad hoc business continuity plans are established in order to mitigate against such an event.
Outlook
The US economy was severely impacted in the second half of the year by the ongoing financial crisis. The purchasing power and decision-making of the typical US consumer was directly affected as a result of continued layoffs and loss of wealth. While the Company is not immune to these developments, it is well positioned with strong, high quality brands, which are valued by the consumer. It is committed to achieving continued growth in 2009 in line with the Nestle model by addressing the short term concerns of the consumer through its high quality price-value portfolio of product offerings.
NESTLÉ HOLDINGS, INC. (A Wholly Owned Subsidiary of Nestlé S.A.)
AND SUBSIDIARIES
6
Auditors’ Report 7
Consolidated Financial Statements 8
Notes to Consolidated Financial Statements 12
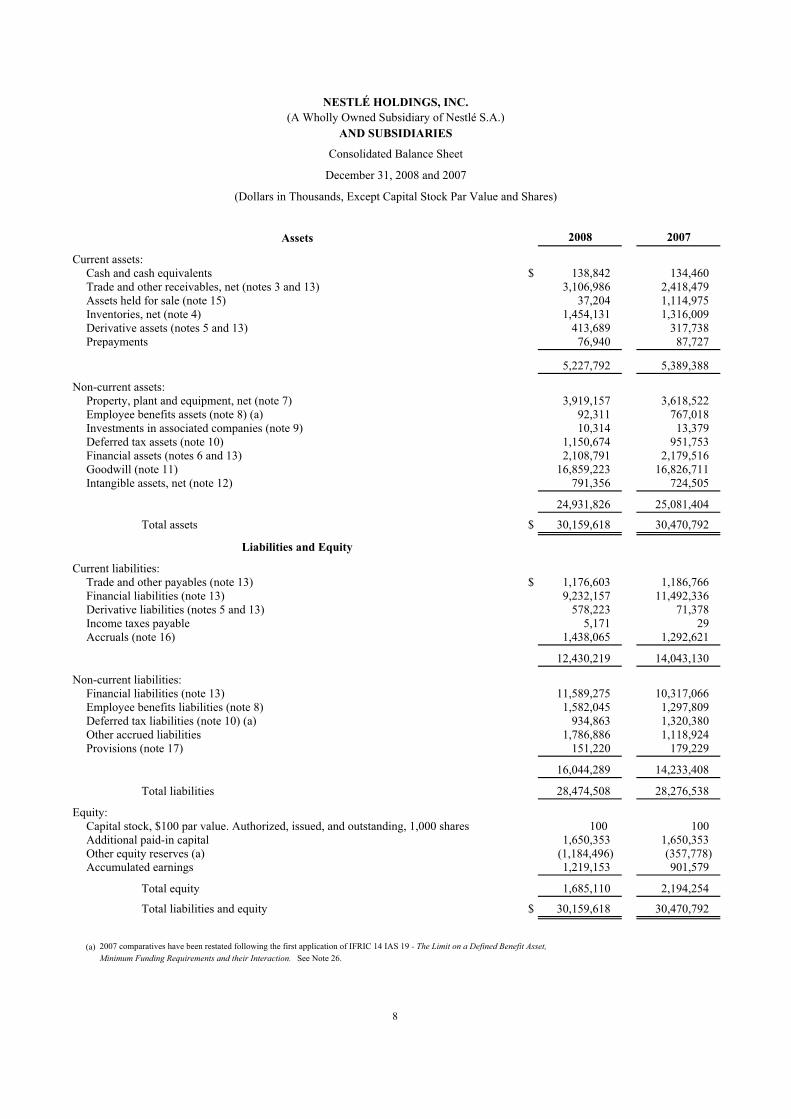
NESTLÉ HOLDINGS, INC.(A Wholly Owned Subsidiary of Nestlé S.A.)
AND SUBSIDIARIES
Consolidated Balance Sheet
December 31, 2008 and 2007
(Dollars in Thousands, Except Capital Stock Par Value and Shares)
Assets 2008 2007
Current assets:Cash and cash equivalents $ 138,842 134,460 Trade and other receivables, net (notes 3 and 13) 3,106,986 2,418,479 Assets held for sale (note 15) 37,204 1,114,975 Inventories, net (note 4) 1,454,131 1,316,009 Derivative assets (notes 5 and 13) 413,689 317,738 Prepayments 76,940 87,727
5,227,792 5,389,388
Non-current assets:Property, plant and equipment, net (note 7) 3,919,157 3,618,522 Employee benefits assets (note 8) (a) 92,311 767,018 Investments in associated companies (note 9) 10,314 13,379 Deferred tax assets (note 10) 1,150,674 951,753 Financial assets (notes 6 and 13) 2,108,791 2,179,516 Goodwill (note 11) 16,859,223 16,826,711 Intangible assets, net (note 12) 791,356 724,505
24,931,826 25,081,404
Total assets $ 30,159,618 30,470,792
Liabilities and Equity
Current liabilities:Trade and other payables (note 13) $ 1,176,603 1,186,766 Financial liabilities (note 13) 9,232,157 11,492,336 Derivative liabilities (notes 5 and 13) 578,223 71,378 Income taxes payable 5,171 29 Accruals (note 16) 1,438,065 1,292,621
12,430,219 14,043,130
Non-current liabilities:Financial liabilities (note 13) 11,589,275 10,317,066 Employee benefits liabilities (note 8) 1,582,045 1,297,809 Deferred tax liabilities (note 10) (a) 934,863 1,320,380 Other accrued liabilities 1,786,886 1,118,924 Provisions (note 17) 151,220 179,229
16,044,289 14,233,408
Total liabilities 28,474,508 28,276,538
Equity:Capital stock, $100 par value. Authorized, issued, and outstanding, 1,000 shares 100 100 Additional paid-in capital 1,650,353 1,650,353 Other equity reserves (a) (1,184,496) (357,778) Accumulated earnings 1,219,153 901,579
Total equity 1,685,110 2,194,254
Total liabilities and equity $ 30,159,618 30,470,792
(a) 2007 comparatives have been restated following the first application of IFRIC 14 IAS 19 - The Limit on a Defined Benefit Asset,
Minimum Funding Requirements and their Interaction. See Note 26.
8

NESTLÉ HOLDINGS, INC.(A Wholly Owned Subsidiary of Nestlé S.A.)
AND SUBSIDIARIES
Consolidated Income Statement
For the Years Ended December 31, 2008 and 2007
(Dollars in Thousands)
2008 2007
Net sales $ 21,092,352 18,324,372
Cost of goods sold (10,166,222) (8,399,888)
Distribution expenses (1,860,922) (1,571,474)
Marketing, general and administrative expenses (5,805,684) (5,553,171)
Royalties to affiliated company (972,867) (768,651)
Earnings before interest, taxes and other expenses (a) 2,286,657 2,031,188
Net financing costs (note 18) (749,704) (943,674)
Share of results from associated companies (2,182) (939)
Net other expense (note 19) (29,382) (36,992)
Income from continuing operations before income taxes 1,505,389 1,049,583
Income tax expense (note 20) (1,194,188) (421,526)
Income from continuing operations 311,201 628,057
Income from discontinued operations, net of taxes 6,373 4,026
Net income $ 317,574 632,083
9

NESTLÉ HOLDINGS, INC.(A Wholly Owned Subsidiary of Nestlé S.A.)
AND SUBSIDIARIESConsolidated Statement of Recognized Income and Expense
For the Years Ended December 31, 2008 and 2007
(Dollars in Thousands)
2008 2007Net income $ 317,574 632,083
Fair value adjustments on cash flow hedges:
Recognized in other equity reserves (238,806) 49,662
Removed from other equity reserves 5,446 (121,621)
Net change in fair value of available-for-sale assets:
Unrealized results (123,199) 11,722
Recognition of realized results in the income statement 5,645 -
Foreign currency translation differences for foreign operations (4,033) 1,674
Defined benefit plan actuarial (losses)/gains (note 8) (a) (989,997) 376,168
Taxes on equity items (note 20) (a) 518,226 (121,696)
Income and expense recognized directly in equity (826,718) 195,909
Total recognized (expense) and income $ (509,144) 827,992
(a) 2007 comparatives have been restated following the first application of IFRIC 14 IAS 19 - The Limit
on a Defined Benefit Asset, Minimum Funding Requirements and their Interaction. See note 26.
10

NESTLÉ HOLDINGS, INC.(A Wholly Owned Subsidiary of Nestlé S.A.)
AND SUBSIDIARIESConsolidated Statement of Cash Flows
For the Years Ended December 31, 2008 and 2007
(Dollars in Thousands)
2008 2007Cash flows from operating activities:
Net income $ 317,574 632,083
Adjustments to reconcile net income to net cash provided by operating activities:
Depreciation of property, plant, and equipment (note 7) 427,471 365,874
(Gain) loss on sales of property, plant, and equipment (3,022) 13,225
Provision for impairment of property, plant, and equipment (note 7) 35,516 8,853
Amortization of intangible assets (note 12) 92,935 62,985
Gain on disposal of assets held for sale and other (10,783) (16,665)
Decrease (increase) in cash surrender value of Company-owned life insurance policies 56,336 (42,407)
Increase in provisions 21,591 20,544
Decrease in deferred income taxes (note 20) (61,073) (17,671)
Change in working capital (excluding effects from acquisitions and divestitures):
Trade and other receivables (651,050) (213,882)
Inventories (152,714) 1,734
Prepaid taxes and current tax payable 5,142 (38,335)
Prepayments and other current assets 10,806 7,128
Trade and other payables and other liabilities 654,486 (202,701)
Accruals 143,393 14,555
Increase (decrease) in working capital 10,063 (431,501)
Other movements, net (164,579) (29,203)
Total adjustments 404,455 (65,966)
Net cash provided by operating activities 722,029 566,117
Cash flows from investing activities:
Expenditure on property, plant and equipment (note 7) (801,890) (841,796)
Proceeds from sale of property, plant and equipment 18,577 5,157
Business acquisitions, net of cash acquired (note 24) (122,633) (5,163,135)
Disposals of assets held for sale and other 1,157,345 311,242
Expenditure on intangible assets (note 12) (179,419) (56,792)
Investments in available-for-sale securities (155,602) (58,316)
Other movements 11,234 29,047
Net cash used in investing activities (72,388) (5,774,593)
Cash flows from financing activities:
Net (repayment) borrowings of commercial paper (2,189,514) 4,794,995
Net borrowings of line of credit 29,099 —
Bonds issued 2,585,288 1,691,348
Bonds repaid (1,636,437) (1,132,682)
Notes to affiliates issued 1,600,068 1,201,927
Notes to affiliates repaid (801,555) (1,293,219)
Other changes in financial liabilities (228,175) (21,942)
Net cash (used in) provided by financing activities (641,226) 5,240,427
Net increase in cash and cash equivalents 8,415 31,951
Cash and cash equivalents at beginning of year 134,460 100,835
Effect of exchange rate changes on opening balances (4,033) 1,674
Cash and cash equivalents at end of year $ 138,842 134,460
Supplemental information:
Cash paid for:
Interest $ 781,154 786,661
Taxes 651,461 513,987
11

NESTLÉ HOLDINGS, INC. (A Wholly Owned Subsidiary of Nestlé S.A.)
AND SUBSIDIARIES
Notes to Consolidated Financial Statements
December 31, 2008 and 2007
(Dollars in Thousands)
12
(1) Significant Accounting Policies and Changes in Accounting Policies
Nestlé Holdings, Inc. (“NHI”) (hereinafter, together with its subsidiaries, referred to as “the Company”) is a wholly owned subsidiary of Nestlé S.A., incorporated in Switzerland, which is the holding company of the Nestlé group of companies. NHI is the holding company for Nestlé S.A.’s principal operating subsidiaries in the United States, other than Nestlé Waters North America, Inc. and Alcon Laboratories, Inc. NHI was incorporated in the State of Delaware in 1983 under registration number 830330118. NHI is a corporation and has unlimited duration. The address of the registered office of NHI is 1209 Orange Street, Wilmington, Delaware 19801.
The Company manufactures food and beverages as well as products related to the nutrition, health and wellness industries and distributes its products primarily in the United States of America. Such products include: soluble coffee, chocolate-based drinks, dairy products, infant nutrition, healthcare nutrition, performance nutrition, ice cream, frozen and chilled food, culinary aids and chocolate and confectionary. Other business activities include pet foods, juvenile life insurance, weight management products and. infant products.
The consolidated financial statements were authorized for issue by the Company’s directors on April 30, 2009.
(a) Significant Accounting Policies
Basis of Preparation
The consolidated financial statements of the Company comply with International Financial Reporting Standards (“IFRS”) as adopted by the International Accounting Standards Board (“IASB”), and with the interpretations issued by the International Financial Reporting Interpretations Committee (“IFRIC”) and its predecessor.
The consolidated financial statements have been prepared on an accrual basis and under the historical cost convention, except that the following assets and liabilities are stated at their fair value: derivative financial instruments, investments held for trading, available-for-sale investments and recognized assets and liabilities subject to fair value hedges.
Assets held for sale are stated at the lower of carrying amount or fair value less costs to sell.
The preparation of consolidated financial statements requires management to make estimates and assumptions that affect the reported amounts of assets and liabilities and the disclosure of contingent assets and liabilities as of December 31, 2008 and 2007, and the reported amounts of income and expenses for the years then ended. Actual results could differ from those estimates.
The estimates and underlying assumptions are reviewed on an ongoing basis. Revisions to accounting estimates are recognized in the period in which the estimate is revised if the revision affects only that period or in the period of the revision and future periods if the revision affects both current and future periods. The areas affected by estimation include goodwill, employee benefits, provisions, impairment tests, income taxes and financial assets and liabilities.

NESTLÉ HOLDINGS, INC. (A Wholly Owned Subsidiary of Nestlé S.A.)
AND SUBSIDIARIES
Notes to Consolidated Financial Statements
December 31, 2008 and 2007
(Dollars in Thousands)
13
Scope of Consolidation
The consolidated financial statements are comprised of those of NHI and its subsidiaries. All material intercompany profits, transactions and balances have been eliminated. The subsidiary companies, which are wholly and directly owned by NHI and incorporated in the United States, are as follows:
Nestlé USA, Inc. Nestlé Purina PetCare Company Nespresso USA, Inc. Nestlé Capital Corporation Nestlé NPR, Inc. NPB Services, Inc. TSC Holdings, Inc. Jenny Craig Holdings, Inc. Nestlé HealthCare Nutrition, Inc. (formerly Novartis Nutrition Corporation) Gerber Life Insurance Company Gerber Products Company
Investments in associated companies, including joint ventures, in which the Company either owns at least a 20% but less than a 50% interest, or where the Company owns less than a 20% interest but has significant influence but does not exercise control, are accounted for under the equity method. Investments in which the Company has less than a 20% interest and does not have significant influence are reported at cost.
Foreign Currency
For the Company, transactions in currencies other than the Company’s functional currency (U.S. Dollars) are recorded at the rate of exchange at the transaction date. Monetary assets and liabilities that are denominated in foreign currencies are translated at the year-end rates of exchange. Any resulting exchange differences are taken to the consolidated income statement.
On consolidation, assets and liabilities of the Company denominated in their functional currencies are translated into U.S. Dollars at year end exchange rates. Income and expense items are translated into U.S. Dollars at the annual average rate of exchange or at the rate on the date of the transaction for significant items.
Differences arising from the retranslation of opening net assets of the Company, together with differences arising from the restatement of the net results for the year of the Company and its subsidiaries from average or actual rates to year-end rates, are recognized in the consolidated statement of recognized income and expense.

NESTLÉ HOLDINGS, INC. (A Wholly Owned Subsidiary of Nestlé S.A.)
AND SUBSIDIARIES
Notes to Consolidated Financial Statements
December 31, 2008 and 2007
(Dollars in Thousands)
14
Segmental Information
Segmental information is based on the Company’s divisional management structure. Assets disclosed in the segmental information footnote are comprised of operational assets including trade and other receivables, inventories, and property, plant and equipment. Liabilities disclosed in the segmental information footnote are comprised of trade and other payables and accruals. Earnings before interest and taxes (“EBIT”) exclude net financing costs, share of results from associated companies, discontinued operations, other expense and income tax expense. The Company generates substantially all of its net sales within the United States.
Valuation Methodology Presentation and Definitions
Cash and Cash Equivalents
Cash and cash equivalents include cash at bank and in hand, bank deposits and fixed-term investments whose maturities are three months or less from the date of acquisition.
Financial Instruments
Classes of financial instruments
The Company aggregates its financial instruments into classes based on their nature and characteristics. The details of financial instruments by class are disclosed in the notes to the consolidated financial statements.
Financial assets
The Company designates its financial assets into the following categories, as appropriate: loans and receivables, financial assets at fair value through profit and loss and available-for-sale assets.
Financial assets are initially recognized at fair value plus directly attributable transaction costs. Subsequent remeasurement of financial assets is determined by their designation that is revisited at each reporting date.
Derivatives embedded in other contracts are separated and treated as stand-alone derivatives when their risks and characteristics are not closely related to those of their host contracts and the respective host contracts are not carried at fair value.
At each balance sheet date, the Company assesses whether its financial assets are impaired. Impairment losses are recognized in the consolidated income statement when there is objective evidence of impairment. These losses are never reversed unless they refer to a debt instrument measured at fair value and classified as available-for-sale and the increase in fair value can objectively be related to an event occurring after the recognition of the impairment loss.
Financial assets are derecognized (in full or partly) when the Company’s rights to cash flows from the respective asset have expired or have been transferred and the Company has neither exposure to the risks inherent in those assets nor entitlement to rewards from them.
NESTLÉ HOLDINGS, INC. (A Wholly Owned Subsidiary of Nestlé S.A.)
AND SUBSIDIARIES
Notes to Consolidated Financial Statements
December 31, 2008 and 2007
(Dollars in Thousands)
15
Loans and receivables
Loans and receivables are non-derivative financial assets with fixed or determinable payments that are not quoted in an active market. This category includes the following three classes of financial assets: loans, trade and other receivables.
Subsequent to initial measurement, loans and receivables are carried at amortized cost using the effective interest rate method less appropriate allowances for doubtful receivables.
Allowances for doubtful receivables represent the Company’s estimates of incurred losses arising from the failure or inability of customers to make payments when due. These estimates are based on the ageing of customers’ balances, specific credit circumstances and the Company’s historical bad receivables experience.
Loans and receivables are further classified as current and non-current depending whether these are expected to be realized within twelve months after the balance sheet date or beyond.
Financial assets at fair value through profit and loss
The financial assets at fair value through profit and loss category are trading derivatives. Trading derivatives are derivatives for which hedge accounting is not applied because these are either not designated as hedging instruments or not effective as hedging instruments.
Subsequent to initial measurement, trading derivatives are carried at fair value and all their gains and losses, realized and unrealized, are recognized in the consolidated income statement.
Available-for-sale assets
Available-for-sale assets are those non-derivative financial assets that are either designated as such upon initial recognition or are not classified in any of the other financial assets categories. This category includes the following classes of financial assets: cash and cash equivalents, investments in securities, cash surrender value of Company-owned life insurance and investments in companies where the Company does not exercise management control or have significant influence.
Subsequent to initial measurement, available-for-sale assets are stated at fair value with all unrealized gains or losses recognized in the consolidated statement of recognized income and expense through the other equity reserves until their disposal, at which time such gains or losses previously recognized against equity are recognized in the consolidated income statement, except as noted below.
Life insurance policies are reported at their cash surrender value with any changes in cash surrender value being recognized in the consolidated income statement. An investment in a foreign entity comprised of unquoted equity securities in which the Company holds a non-controlling interest and no significant influence over operations is measured at cost.

NESTLÉ HOLDINGS, INC. (A Wholly Owned Subsidiary of Nestlé S.A.)
AND SUBSIDIARIES
Notes to Consolidated Financial Statements
December 31, 2008 and 2007
(Dollars in Thousands)
16
Available-for-sale assets are further classified as current and non-current depending on whether these are expected to be realized within twelve months after the balance sheet date or beyond.
Financial liabilities at amortized cost
Financial liabilities are initially recognized at the fair value of consideration received less directly attributable transaction costs.
Subsequent to initial measurement, financial liabilities are recognized at amortized cost unless they are part of a fair value hedge relationship (see fair value hedges). The difference between the initial carrying amount of the financial liabilities and their redemption value is recognized in the consolidated income statement over the contractual terms using the effective interest rate method. This category includes the following four classes of financial liabilities: trade and other payables, commercial paper, bonds and other financial liabilities.
Financial liabilities at amortized cost are further classified as current and non-current depending whether these will fall due within twelve months after the balance sheet date or beyond.
Financial liabilities are derecognized (in full or partly) when the Company is discharged from its obligation, they expire, they are cancelled or replaced by a new liability with substantially modified terms.
Derivative financial instruments
A derivative is a financial instrument that changes its values in response to changes in the underlying variable, requires no or little net initial investment and is settled at a future date. Derivatives are mainly used to manage exposures to foreign exchange, interest rate and commodity price risk. The classification of derivatives is determined upon initial recognition and monitored on a regular basis.
Derivatives are initially recognized at fair value. These are subsequently remeasured at fair value on a quarterly basis. The fair values of exchange-traded derivatives are based on respective market prices, while the fair values of the over-the-counter derivatives are based on accepted mathematical models based on market data and assumptions. Derivatives are carried as assets when their fair value is positive and as liabilities when their fair value is negative. Any gains or losses arising from changes in fair values of derivatives that do not qualify for hedge accounting are recognized directly in the consolidated income statement.
The Company’s derivatives mainly consist of currency forwards and options, commodity futures and options, interest rate swaps and interest rate and currency swaps.
The use of derivatives is governed by policies approved by the Nestlé S.A. Board of Directors, which provide written principles on the use of derivatives consistent with the Company’s overall risk management strategy.

NESTLÉ HOLDINGS, INC. (A Wholly Owned Subsidiary of Nestlé S.A.)
AND SUBSIDIARIES
Notes to Consolidated Financial Statements
December 31, 2008 and 2007
(Dollars in Thousands)
17
Hedge accounting
The Company designates and documents certain derivatives as hedging instruments against changes in fair values of recognized assets and liabilities (fair value hedges) and highly probable forecast transactions (cash flow hedges). The effectiveness of such hedges is demonstrated at inception and verified on a quarterly basis, using prospective and retrospective testing.
Fair value hedges
The Company uses fair value hedges to mitigate the foreign currency and interest rate risks of its recognized assets and liabilities. The changes in fair values of hedging instruments are recognized in the consolidated income statement. Hedged items are also stated at fair value in respect of the risk being hedged, with any gain/loss being recognized in the consolidated income statement.
Cash flow hedges
The Company uses cash flow hedges to mitigate currency and/or commodity risks of highly probable forecasted transactions, such as purchases of raw materials, finished goods and equipment as well as the variability of expected interest payments.
The effective part of the changes in fair value of hedging instruments are recognized in the consolidated statement of recognized income and expense through the hedge reserve, while any ineffective part is recognized immediately in the consolidated income statement. When the hedged item results in the recognition of a non-financial asset or liability, the gains or losses previously recognized in the consolidated statement of recognized income and expense are included in the measurement cost of the asset or of the liability. Otherwise the gains or losses previously recognized in the consolidated statement of recognized income and expense are removed and recognized in the consolidated income statement at the same time as the hedged transaction.
Fair values
The Company determines the fair values of its financial instruments using market prices for quoted instruments and widely accepted valuation techniques for other instruments.
Valuation techniques include discounted cash flows, standard valuation models based on market parameters, dealer quotes for similar instruments and use of comparable arm’s length transactions.
When fair values of unquoted instruments cannot be measured with sufficient reliability, the Company carries such instruments at cost less impairments, if applicable.
Inventories
Raw materials and purchased finished goods are valued at purchase cost. Work in progress and manufactured finished goods are valued at production cost. Production cost includes direct

NESTLÉ HOLDINGS, INC. (A Wholly Owned Subsidiary of Nestlé S.A.)
AND SUBSIDIARIES
Notes to Consolidated Financial Statements
December 31, 2008 and 2007
(Dollars in Thousands)
18
production costs and an appropriate proportion of production overheads and factory depreciation. Movements in raw materials inventories and purchased finished goods are accounted for using the FIFO (first-in, first-out) method. The weighted average cost method is used for other inventories. An allowance is established when the net realizable value of any inventory item is lower than the value calculated using the methods noted above.
Property, Plant and Equipment
Property, plant and equipment are stated at historical cost and are depreciated to the residual value using the straight-line method over their estimated useful lives. The residual values are 30% on administrative buildings and nil for all other asset types. The Company reviews the depreciation periods on an annual basis. Land is not depreciated.
The rates of depreciation used are based on the following useful lives:
Buildings and land improvements 20 to 40 yearsPlant and machinery 8 to 13 yearsTools, furniture and sundry 5 yearsVehicles 5 to 8 yearsInformation technology equipment 3 to 4 years
Leased Assets
Assets acquired under long-term finance leases are capitalized and amortized in accordance with the Company’s policy on property, plant and equipment. The associated obligations are included in financial liabilities. Leasehold improvements are amortized over their useful life or lease term, whichever is shorter.
Rents payable under operating leases are charged to the consolidated income statement on a straight-line basis over the term of the lease.
Goodwill
Goodwill, representing the excess of the cost of acquisitions over the fair value of the identifiable net assets acquired, is capitalized. Goodwill is not amortized but tested for impairment at least annually and upon the occurrence of an indication of impairment.
Intangible Assets
Intangible assets include acquired or internally developed intangible assets, primarily software and various rights connected with business activities. These assets are amortized on a straight-line basis over their estimated useful lives (between 3 and 20 years), unless such lives are indefinite. Intangible assets with indefinite useful lives are systematically tested for impairment at least annually and upon the occurrence of an indication of impairment. Amortization of intangible assets is allocated to marketing, general and administrative expenses in the consolidated income statement. The Company reviews the amortization periods on an annual basis.
NESTLÉ HOLDINGS, INC. (A Wholly Owned Subsidiary of Nestlé S.A.)
AND SUBSIDIARIES
Notes to Consolidated Financial Statements
December 31, 2008 and 2007
(Dollars in Thousands)
19
Impairment of Assets
The carrying amounts of the Company’s long-lived assets, other than pension assets and deferred tax assets are reviewed at least annually to determine whether there is any indication of impairment. Indications could be unfavorable development of a business under competitive pressures or severe economic slowdown in a given market as well as reorganization of the operations to leverage their scale. If any such indication exists, the asset’s recoverable amount is estimated (see below).
For goodwill, assets that have an indefinite useful life and for intangible assets that are not yet available for use, the recoverable amount is estimated at each balance sheet date.
An impairment loss is recognized whenever the carrying amount of an asset or its cash-generating unit exceeds its recoverable amount. Impairment losses are recognized in the consolidated income statement.
When a decline in the fair value of an available-for-sale financial asset has been recognized directly in the consolidated statement of recognized income and expense and there is objective evidence that the asset is impaired, the cumulative loss that had been recognized directly in equity is recognized in the consolidated income statement even though the financial asset has not been derecognized. The amount of the cumulative loss that is recognized is the difference between the acquisition cost and current fair value, less any impairment loss previously recognized.
(i) Calculation of recoverable amount
The recoverable amount is the greater of fair value less cost to sell and value in use. In assessing value in use, the estimated future cash flows are discounted to their present value using a pre-tax discount rate that reflects current market assessments of the time value of money and the risks specific to the asset. For an asset that does not generate largely independent cash inflows, the recoverable amount is determined for the cash-generating unit to which the asset belongs.
(ii) Reversals of impairment
An impairment loss is reversed if there has been a change in the estimates used to determine the recoverable amount, and is reversed only to the extent that the asset’s carrying amount does not exceed the carrying amount that would have been determined, net of depreciation or amortization, if no impairment loss had been recognized. Impairment losses related to investments in equity instruments classified as available-for-sale and goodwill are not reversed through the consolidated income statement.
Assets Held for Sale and Discontinued Operations
Immediately before classification as held for sale, the carrying amounts of the assets (and all assets and liabilities in a disposal group) are measured in accordance with applicable accounting policies. Then, on initial classification as held for sale, non-current assets and disposal groups are recognized at the lower of carrying amount or fair value less cost to sell.

NESTLÉ HOLDINGS, INC. (A Wholly Owned Subsidiary of Nestlé S.A.)
AND SUBSIDIARIES
Notes to Consolidated Financial Statements
December 31, 2008 and 2007
(Dollars in Thousands)
20
Impairment losses on initial classification as held for sale are included in the consolidated income statement. The same applies to gains and losses on subsequent measurements.
A discontinued operation is a component of the Company’s business that represents a separate major line of business or geographical area of operations or is a subsidiary acquired exclusively with a view to resell.
Classification as a discontinued operation occurs upon disposal or when the operation meets the criteria to be classified as held for sale, if earlier.
Pensions and Retirement Benefits
The Company accounts for its defined benefit plans in accordance with IAS 19, Employee Benefits
(revised 2004). The liabilities of the Company arising from its defined benefit obligations are determined using the projected unit credit method. The Company’s external actuaries perform valuations on an annual basis. Such plans are either externally funded, with the plan assets held separately from those of the Company in independently administered funds, or unfunded with the related liabilities recorded on the consolidated balance sheet.
For the funded defined benefit plans, the deficit or excess of the fair value of plan assets over the present value of the defined benefit obligation is recognized as a liability or an asset on the consolidated balance sheet, taking into account any unrecognized actuarial gains or losses and past service costs. However, an excess of assets is recognized only to the extent that it represents a future economic benefit which is actually available to the Company, for example in the form of refunds from the plan or reductions in future contributions to the plan.
Actuarial gains and losses arise mainly from changes in actuarial assumptions and differences between actuarial assumptions and what has actually occurred. They are recognized outside of net income in the period in which they occur directly in the consolidated statement of recognized income and expense.
For defined benefit plans, the pension cost charged to the consolidated income statement consists of current service cost, interest cost, expected return on plan assets and past service cost. The past service cost for the enhancement of pension benefits is accounted for when such benefits vest or become a constructive obligation. The expected rate of return on plan assets takes into consideration historical asset class returns, current market conditions, portfolio strategy, future market expectations, and is determined by plan investment and actuarial advisors.
The Company also provides for benefits under defined contribution plans. Contributions to these plans are charged to the consolidated income statement as incurred.
In addition, the Company provides post employment health care benefit plans to eligible retired employees. These plans are accounted for in accordance with IAS 19.

NESTLÉ HOLDINGS, INC. (A Wholly Owned Subsidiary of Nestlé S.A.)
AND SUBSIDIARIES
Notes to Consolidated Financial Statements
December 31, 2008 and 2007
(Dollars in Thousands)
21
Full pensions and retirement benefit reporting is done twice a year in June and December, at which point actuarial gains and losses for the period are determined.
Share-Based Payment
Share-based payments are granted to certain key members of management. Liabilities arising from such transactions are recognized in the consolidated income statement over the vesting period. Share-based payments are comprised of Nestlé S.A. Share Appreciation Rights (“SARs”) and Nestlé S.A. Restricted Stock Units (“RSUs”).
Share Appreciation Rights
The Company granted SARs to key members of management, entitling employees to a cash payment. No SARs have been granted subsequent to July 2005. The amount of the cash payment is determined based on the increase in the share price of Nestlé S.A. from grant date until exercise date. SARs are fair valued at each reporting date and measured using the Black-Scholes option pricing model, taking into account the terms and conditions upon which the instruments were granted. The cost of such transactions is adjusted for the forfeitures of the participants’ rights that no longer satisfy the plan conditions, as well as for early vesting.
Restricted Stock Units
In January 2006, the Company began granting RSUs to key members of management, entitling employees to a cash payment. The fair value of the RSUs corresponds to the market price when granted, recognized over the three year vesting period and remeasured for subsequent changes in the market price.
Other Accrued Liabilities
Other accrued liabilities are comprised mainly of amounts expected to be paid under the Company’s long-term management incentive plan and other Company obligations.
Provisions
Provisions include liabilities of uncertain timing or amounts that arise from restructuring, environmental, litigation and other risks. Provisions are recognized when a legal or constructive obligation exists stemming from a past event, when it is probable that a cash outflow will be necessary to settle the obligation and when the amount of the obligation can be reasonably estimated. Obligations from restructuring plans are recognized when detailed formal plans have been established and when there is a valid expectation that such plan will be carried out.
Events after the Balance Sheet Date
The values of assets and liabilities at the balance sheet date are adjusted if there is evidence that subsequent adjusting events warrant a modification of these values. Such adjustments are made up
NESTLÉ HOLDINGS, INC. (A Wholly Owned Subsidiary of Nestlé S.A.)
AND SUBSIDIARIES
Notes to Consolidated Financial Statements
December 31, 2008 and 2007
(Dollars in Thousands)
22
to the date of issuance of the consolidated financial statements. Other non-adjusting events are disclosed in the notes.
Net Sales
Net sales represent the sales of products and services, net of general price reductions and sales taxes. Net sales are recognized in the consolidated income statement when shipped and when the significant risks and rewards of ownership of the goods have been transferred to the buyer.
Expenses
Cost of goods sold is determined on the basis of the cost of production or of purchase, adjusted for the variation of inventories (which are measured as described in the policy on inventories). All other expenses, including those in respect of advertising and promotions, are recognized when the Company has the right of access to the goods or when it receives the services.
Net Financing Costs
Net financing costs include interest on borrowings to or from third parties and affiliated companies. Borrowing costs are recognized as an expense in the period in which they are incurred. Exchange differences on financial assets and liabilities, the results of interest hedging instruments that are recognized in the consolidated income statement, and amortization of financing premiums and discounts are also presented in net financing costs.
Net Other Income (Expense)
These comprise all exit costs including but not limited to profit and loss on disposal of property, plant and equipment, profit and loss on disposal of businesses, onerous contracts, restructuring costs, impairment of property, plant and equipment, intangibles and goodwill.
Restructuring costs are restricted to dismissal indemnities and employee benefits paid to terminated employees upon the reorganization of a business. Dismissal indemnities paid for normal attrition are part of the expenses by function.
Taxation
Taxes include current taxes on income and other taxes such as taxes on capital and adjustments relating to prior years. Income tax is recognized in the consolidated income statement, except to the extent that it relates to items directly taken to equity, in which case it is recognized in the consolidated statement of recognized income and expense.
Deferred taxation is the tax attributable to the temporary differences that appear when taxation authorities recognize and measure assets and liabilities with rules that differ from those of the consolidated financial statements.
Deferred taxes are calculated under the liability method at the rates of tax expected to prevail when the temporary differences reverse. Any changes of tax rates are recognized in the consolidated
NESTLÉ HOLDINGS, INC. (A Wholly Owned Subsidiary of Nestlé S.A.)
AND SUBSIDIARIES
Notes to Consolidated Financial Statements
December 31, 2008 and 2007
(Dollars in Thousands)
23
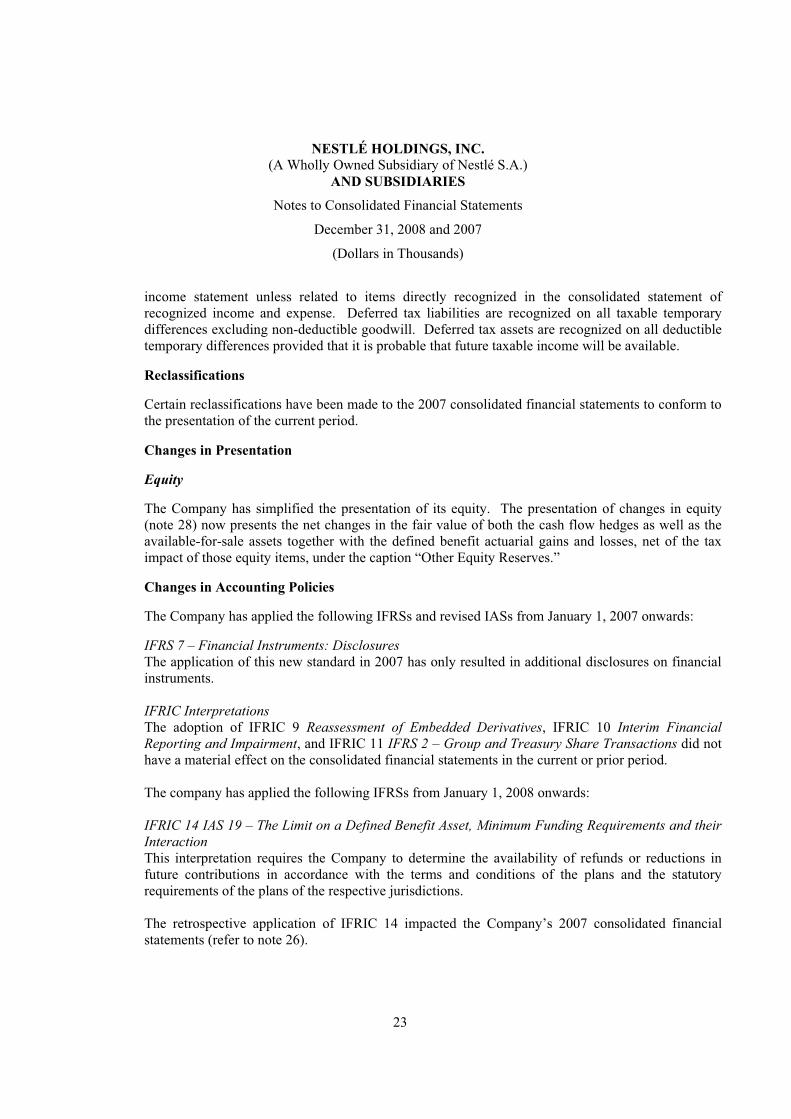
income statement unless related to items directly recognized in the consolidated statement of recognized income and expense. Deferred tax liabilities are recognized on all taxable temporary differences excluding non-deductible goodwill. Deferred tax assets are recognized on all deductible temporary differences provided that it is probable that future taxable income will be available.
Reclassifications
Certain reclassifications have been made to the 2007 consolidated financial statements to conform to the presentation of the current period.
Changes in Presentation
Equity
The Company has simplified the presentation of its equity. The presentation of changes in equity (note 28) now presents the net changes in the fair value of both the cash flow hedges as well as the available-for-sale assets together with the defined benefit actuarial gains and losses, net of the tax impact of those equity items, under the caption “Other Equity Reserves.”
Changes in Accounting Policies
The Company has applied the following IFRSs and revised IASs from January 1, 2007 onwards:
IFRS 7 – Financial Instruments: Disclosures
The application of this new standard in 2007 has only resulted in additional disclosures on financial instruments.
IFRIC Interpretations
The adoption of IFRIC 9 Reassessment of Embedded Derivatives, IFRIC 10 Interim Financial
Reporting and Impairment, and IFRIC 11 IFRS 2 – Group and Treasury Share Transactions did not have a material effect on the consolidated financial statements in the current or prior period.
The company has applied the following IFRSs from January 1, 2008 onwards:
IFRIC 14 IAS 19 – The Limit on a Defined Benefit Asset, Minimum Funding Requirements and their
Interaction
This interpretation requires the Company to determine the availability of refunds or reductions in future contributions in accordance with the terms and conditions of the plans and the statutory requirements of the plans of the respective jurisdictions.
The retrospective application of IFRIC 14 impacted the Company’s 2007 consolidated financial statements (refer to note 26).

NESTLÉ HOLDINGS, INC. (A Wholly Owned Subsidiary of Nestlé S.A.)
AND SUBSIDIARIES
Notes to Consolidated Financial Statements
December 31, 2008 and 2007
(Dollars in Thousands)
24
Reclassification of Financial Assets – Amendments to IAS 39 – Financial Instruments: Recognition
and Measurement and IFRS 7 – Financial Instruments: Disclosures
These amendments allow entities to reclassify non-derivative financial assets out of fair value through profit or loss if the assets are no longer held for the purpose of selling or repurchasing and if the entity has the intention and ability to hold them for the foreseeable future or until maturity.
The Company did not reclassify any financial assets out of the fair value through the profit or loss category in 2008.
The following changes in IFRS and IAS may affect the Company after December 31, 2008:
IFRS 3 Revised – Business Combinations
This standard will be effective for the first annual reporting period beginning on or after July 1, 2009. The Company will thus apply it prospectively as from January 1, 2010 onwards. The revised standard will cause the following changes:
Acquisition costs will be expensed;
For a business combination in which the acquirer achieves control without buying all of the equity of the acquiree, the remaining minority (non-controlling) equity interests are measured either at fair value or at the non-controlling interests’ proportionate share of the acquiree’s net identifiable assets;
Upon obtaining control in a business combination achieved in stages, the acquirer shall remeasure its previously held equity interest at fair value and recognize a gain or a loss in the consolidated income statement; and
Changes in the contingent consideration of an acquisition will be accounted for outside goodwill, in the consolidated income statement.
IAS 27 Revised – Consolidated and Separate Financial Statements
This standard will be applicable prospectively for the first annual reporting period beginning on or after July 1, 2009, the Company will thus apply it as from January 1, 2010 onwards. The revised standard stipulates that a change in the minority (non-controlling) interest of an acquiree that does not result in a loss of control shall be recognized in equity.
IFRS 8 – Operating Segments
In November 2006, the IASB published IFRS 8 Operating Segments, which supersedes IAS 14 Segment Reporting and is effective for annual periods beginning on or after January 1, 2009. IFRS 8 impacts the manner by which entities identify operating segments and requires additional disclosures. The Company is currently evaluating the impact of the adoption of IFRS 8 on the segment disclosures.
IAS 1 Revised – Presentation of Financial Statements
In September 2007, the IASB published the revised version of IAS 1 Presentation of Financial
Statements, which is effective for annual periods beginning on or after January 1, 2009. This revised standard introduces a statement of comprehensive income but permits an option to present an income
NESTLÉ HOLDINGS, INC. (A Wholly Owned Subsidiary of Nestlé S.A.)
AND SUBSIDIARIES
Notes to Consolidated Financial Statements
December 31, 2008 and 2007
(Dollars in Thousands)
25
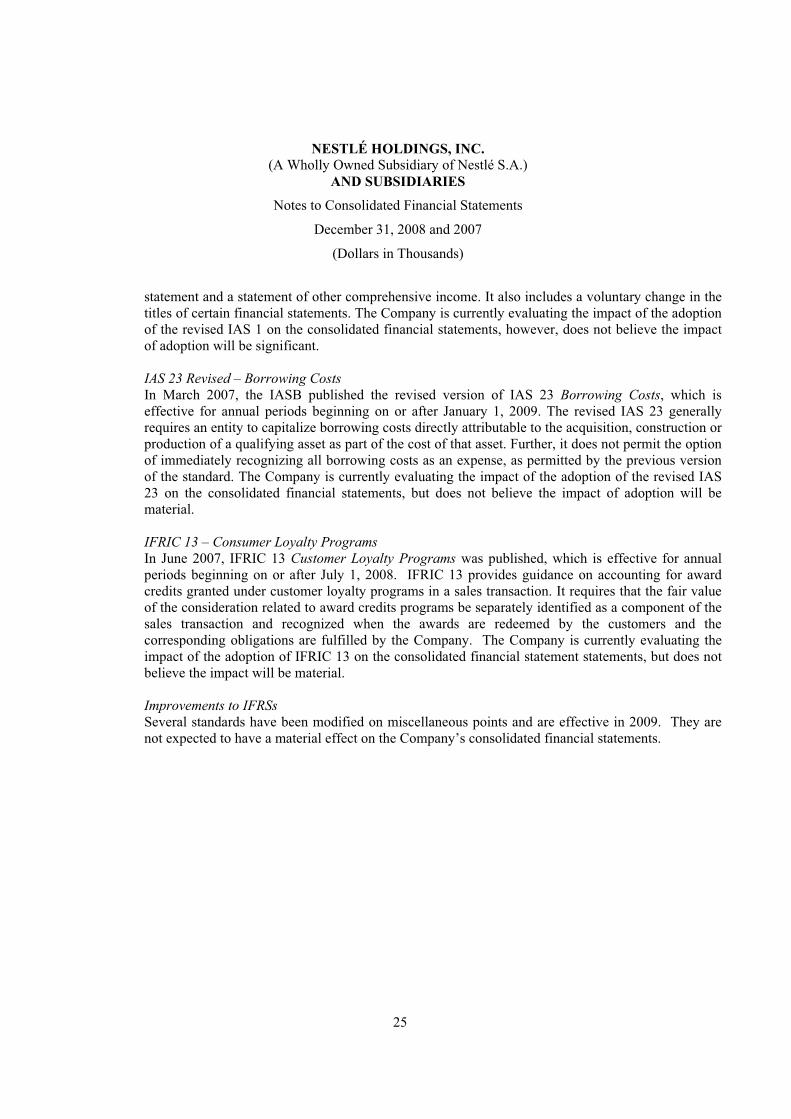
statement and a statement of other comprehensive income. It also includes a voluntary change in the titles of certain financial statements. The Company is currently evaluating the impact of the adoption of the revised IAS 1 on the consolidated financial statements, however, does not believe the impact of adoption will be significant.
IAS 23 Revised – Borrowing Costs
In March 2007, the IASB published the revised version of IAS 23 Borrowing Costs, which is effective for annual periods beginning on or after January 1, 2009. The revised IAS 23 generally requires an entity to capitalize borrowing costs directly attributable to the acquisition, construction or production of a qualifying asset as part of the cost of that asset. Further, it does not permit the option of immediately recognizing all borrowing costs as an expense, as permitted by the previous version of the standard. The Company is currently evaluating the impact of the adoption of the revised IAS 23 on the consolidated financial statements, but does not believe the impact of adoption will be material.
IFRIC 13 – Consumer Loyalty Programs
In June 2007, IFRIC 13 Customer Loyalty Programs was published, which is effective for annual periods beginning on or after July 1, 2008. IFRIC 13 provides guidance on accounting for award credits granted under customer loyalty programs in a sales transaction. It requires that the fair value of the consideration related to award credits programs be separately identified as a component of the sales transaction and recognized when the awards are redeemed by the customers and the corresponding obligations are fulfilled by the Company. The Company is currently evaluating the impact of the adoption of IFRIC 13 on the consolidated financial statement statements, but does not believe the impact will be material.
Improvements to IFRSs
Several standards have been modified on miscellaneous points and are effective in 2009. They are not expected to have a material effect on the Company’s consolidated financial statements.

NESTLÉ HOLDINGS, INC. (A Wholly Owned Subsidiary of Nestlé S.A.)
AND SUBSIDIARIES
Notes to Consolidated Financial Statements
December 31, 2008 and 2007
(Dollars in Thousands)
26
(2) Segmental Information
Segmental information is as follows:
Nestlé USA Brands (i) PetCare Ice Cream Nutrition (i) Other (i) Total
2008Net sales $ 9,045,026 6,328,753 2,178,262 3,468,660 71,651 21,092,352
EBIT (ii) 967,773 983,939 10,368 321,241 3,336 2,286,657
Segment assets 4,193,569 2,004,806 1,070,222 1,155,523 56,154 8,480,274
Segment liabilities 1,219,518 509,775 181,139 690,045 14,191 2,614,668
Capital expenditures 266,331 307,725 132,043 88,046 7,745 801,890
Depreciation of segment assets 163,340 104,011 97,383 60,890 1,847 427,471
Impairment of segment assets (iii) 4,449 (1,074) 32,141 - - 35,516
Restructuring costs 9,059 - 5,673 2,298 - 17,030
2007Net sales $ 8,431,950 5,553,634 2,195,445 2,091,099 52,244 18,324,372
EBIT (ii) 974,169 904,720 (25,120) 175,539 1,880 2,031,188
Segment assets 2,757,646 1,647,896 1,056,587 972,387 31,377 6,465,893
Segment liabilities 1,225,510 429,846 223,545 586,838 13,648 2,479,387
Capital expenditures 415,327 248,398 138,824 35,640 3,607 841,796
Depreciation of segment assets 141,507 94,900 90,342 37,901 1,224 365,874
Impairment of segment assets (iii) - 4,844 4,009 - - 8,853
Restructuring costs 5,051 - 1,256 14,745 - 21,052
(i) Nestlé USA Brands primarily consist of beverage, prepared foods, confections and snacks, and other food products. Nutrition primarily consists of baby foods, baby care products, medical nutritional food products and performance related food products. Other is comprised of certain immaterial segments.
(ii) The Company determines EBIT by allocating corporate expenses to its operating segments based on activity based cost drivers.
(iii) See note 7.
NESTLÉ HOLDINGS, INC. (A Wholly Owned Subsidiary of Nestlé S.A.)
AND SUBSIDIARIES
Notes to Consolidated Financial Statements
December 31, 2008 and 2007
(Dollars in Thousands)
27
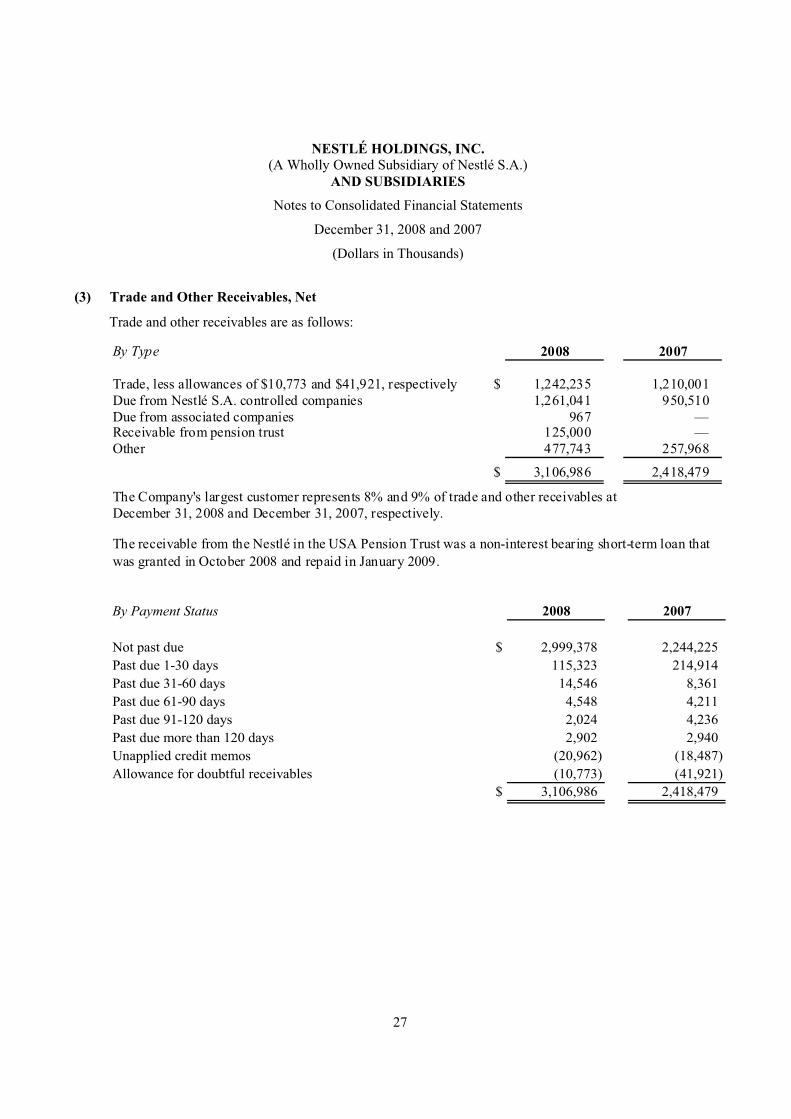
(3) Trade and Other Receivables, Net
Trade and other receivables are as follows:
By Type 2008 2007
Trade, less allowances of $10,773 and $41,921, respectively $ 1,242,235 1,210,001 Due from Nestlé S.A. controlled companies 1,261,041 950,510 Due from associated companies 967 — Receivable from pension trust 125,000 — Other 477,743 257,968
$ 3,106,986 2,418,479
The Company's largest customer represents 8% and 9% of trade and other receivables atDecember 31, 2008 and December 31, 2007, respectively.
The receivable from the Nestlé in the USA Pension Trust was a non-interest bearing short-term loan that
was granted in October 2008 and repaid in January 2009.
By Payment Status 2008 2007
Not past due $ 2,999,378 2,244,225
Past due 1-30 days 115,323 214,914
Past due 31-60 days 14,546 8,361
Past due 61-90 days 4,548 4,211
Past due 91-120 days 2,024 4,236
Past due more than 120 days 2,902 2,940
Unapplied credit memos (20,962) (18,487)
Allowance for doubtful receivables (10,773) (41,921)
$ 3,106,986 2,418,479
NESTLÉ HOLDINGS, INC. (A Wholly Owned Subsidiary of Nestlé S.A.)
AND SUBSIDIARIES
Notes to Consolidated Financial Statements
December 31, 2008 and 2007
(Dollars in Thousands)
28
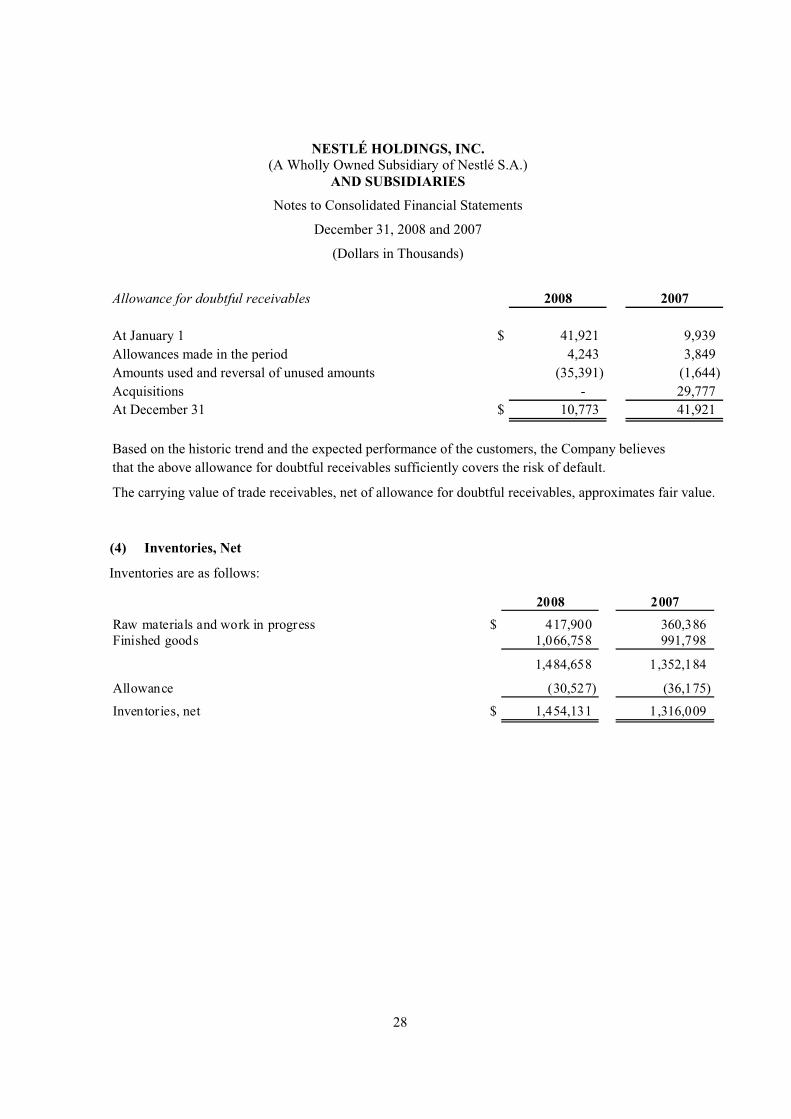
Allowance for doubtful receivables 2008 2007
At January 1 $ 41,921 9,939
Allowances made in the period 4,243 3,849
Amounts used and reversal of unused amounts (35,391) (1,644)
Acquisitions - 29,777
At December 31 $ 10,773 41,921
Based on the historic trend and the expected performance of the customers, the Company believes
that the above allowance for doubtful receivables sufficiently covers the risk of default.
The carrying value of trade receivables, net of allowance for doubtful receivables, approximates fair value.
(4) Inventories, Net
Inventories are as follows:
2008 2007
Raw materials and work in progress $ 417,900 360,386Finished goods 1,066,758 991,798
1,484,658 1,352,184
Allowance (30,527) (36,175)
Inventories, net $ 1,454,131 1,316,009

NESTLÉ HOLDINGS, INC. (A Wholly Owned Subsidiary of Nestlé S.A.)
AND SUBSIDIARIES
Notes to Consolidated Financial Statements
December 31, 2008 and 2007
(Dollars in Thousands)
29
(5) Derivative Assets and Liabilities
2008 2007Contractual Contractual or notional or notional
Fair value amount Fair value amount
Fair value hedges:Currency forwards $ – – 23,061 347,478 Interest rate swaps 115,986 1,550,000 45,658 1,500,000Interest rate and currency swaps 237,833 1,571,524 213,917 2,258,703
Cash flow hedges:Currency forwards and options 595 10,164 701 79,720Interest rate swaps – – 14 100,000 Interest rate and currency swaps 42,925 655,001 15,834 352,889Commodity futures and options 528 5,860 5,048 51,102
Trading:Currency options – – 140 981Interest rate swaps – – 7,518 250,000 Commodity futures 15,822 104,574 5,847 9,512
$ 413,689 3,897,123 317,738 4,950,385
Derivative Assets
2008 2007Contractual Contractual or notional or notional
Fair value amount Fair value amountFair value hedges:
Currency forwards $ – – 897 14,675 Interest rate and currency swaps 205,643 1,478,544 – –
Cash flow hedges:Currency forwards 9,772 79,279 – – Interest rate swaps 211,406 3,665,000 60,826 2,825,000 Interest rate and currency swaps 80,369 401,372 – – Commodity futures and options 27,920 120,982 3,732 40,846
Trading:Interest rate options – – 1,393 259,632Commodity futures 43,113 236,145 4,530 8,596
$ 578,223 5,981,322 71,378 3,148,749
Derivative Liabilities

NESTLÉ HOLDINGS, INC. (A Wholly Owned Subsidiary of Nestlé S.A.)
AND SUBSIDIARIES
Notes to Consolidated Financial Statements
December 31, 2008 and 2007
(Dollars in Thousands)
30
Net gains (losses) recorded in the consolidated income statement for fair valuehedges:
2008 2007Hedged items $ 253,727 (192,429)
Hedging instruments (210,714) 155,449
Net gain (loss) $ 43,013 (36,980)
The ineffective portion of cash flow hedges recorded during the years ended December 31, 2008
and 2007, in the consolidated income statement, was $(17,815) and $0, respectively.
(6) Financial Assets
Non-current financial assets are as follows:
2008 2007Cash surrender value of Company-owned life insurance policies $ 688,339 756,682
Available-for-sale securities 1,329,009 1,340,153
Tax settlement receivable 28,857 29,262
Contract loans receivable 43,281 35,044
Other 19,305 18,375
$ 2,108,791 2,179,516
Available-for-sale securities primarily represent portfolio assets totaling $1,232,580 and $1,241,883 at December 31, 2008 and 2007, respectively. These portfolio assets include both debt and equity securities acquired originally through the purchase of Gerber in September 2007. Additionally, the Company was party to a legal amalgamation dated January 1, 2003 whereby the former Ralston Purina Canada, a wholly owned subsidiary of Nestlé Purina PetCare Company, and Nestlé Canada, Inc. (old) were combined, via exchange of share capital, to form Nestlé Canada, Inc. (new). In exchange for its 5,698 common shares of the former Ralston Purina Canada, the Company received 34,000 Class A voting convertible preferred shares of Nestlé Canada, Inc. (new) representing a 12.9% non-controlling net investment in a foreign entity and is classified as an available-for-sale equity security in accordance with IAS 39. The investment is recorded at its historical cost of $93,287 since the underlying equity instruments are not quoted on a public stock exchange.
Contract loans, acquired originally through the purchase of Gerber Life in September 2007, represent funds borrowed by insurance policy holders against the cash value of their corresponding whole life insurance policies. If a borrower’s contract loan (principal and interest) equates to the cash surrender value of the corresponding policy, then this policy would decrease by the amount of the outstanding policy holder’s contract loan.

NESTLÉ HOLDINGS, INC. (A Wholly Owned Subsidiary of Nestlé S.A.)
AND SUBSIDIARIES
Notes to Consolidated Financial Statements
December 31, 2008 and 2007
(Dollars in Thousands)
31
(7) Property, Plant and Equipment
Property, plant and equipment are comprised of the following:
Tools, Information
Land and Plant and Furniture Technology Total Total
Buildings Machinery and Sundry Vehicles Equipment 2008 2007
Gross value:
At January 1 $ 1,728,446 3,783,859 263,336 123,725 253,953 6,153,319 5,203,343
Additions 219,263 456,138 71,514 13,569 41,406 801,890 841,796
Disposals/other (30,262) (122,746) (8,601) 3,206 (8,207) (166,610) (149,828)
Business acquisitions (403) (4,975) (2,331) (41) (275) (8,025) 258,008
Business divestitures (5,340) (9,837) (4,776) (121) (235) (20,309) —
At December 31 $ 1,911,704 4,102,439 319,142 140,338 286,642 6,760,265 6,153,319
Accumulated depreciation:
At January 1 $ (566,489) (1,535,779) (145,799) (81,372) (205,358) (2,534,797) (2,275,640)
Depreciation (59,572) (285,772) (37,944) (13,796) (30,387) (427,471) (365,874)
Disposals/other 41,078 89,998 8,984 (198) 12,301 152,163 115,570
Impairment of assets (note 19) (5,483) (25,446) (4,587) — — (35,516) (8,853)
Business divestitures 371 2,212 1,746 62 122 4,513 —
At December 31 (590,095) (1,754,787) (177,600) (95,304) (223,322) (2,841,108) (2,534,797)
Net at December 31 $ 1,321,609 2,347,652 141,542 45,034 63,320 3,919,157 3,618,522
The 2008 impairment was attributable primarily to fixed assets used in the production lines of the Ice Cream segment and fixed assets used in the selling of Nescafe in the Nestlé USA Brands segment. The impairment recognized in 2007 resulted from fixed assets used in the production lines of the Ice Cream and PetCare segments. The impairment charge (included in net other expense) was calculated by deducting the anticipated proceeds from the sale of the assets from the net book value of the assets.
In 2008, the Company recorded purchase accounting adjustments in the Nutrition segment related to the acquisition of Novartis Nutrition Corporation and Gerber amounting to $(763) and $(7,573), respectively. Acquisitions added $311 of real property in 2008. In 2007, the Company acquired certain real property related to the purchase of Novartis Nutrition Corporation and Gerber amounting to $46,011 and $211,631, respectively. Additional smaller acquisitions added $366 of real property in 2007.

NESTLÉ HOLDINGS, INC. (A Wholly Owned Subsidiary of Nestlé S.A.)
AND SUBSIDIARIES
Notes to Consolidated Financial Statements
December 31, 2008 and 2007
(Dollars in Thousands)
32
In 2008, the Company divested itself of its Stixx and Treasures lines of business in the Nestlé USA Brands segment and the Baby Care Accessories line of business in the Nutrition segment.
There were capital lease financed purchases of $1,041 in 2008 and none in 2007. The net book value of assets held under finance leases included in property, plant and equipment at December 31, 2008 and 2007 was $24,204 and $60,394, respectively.
At December 31, 2008 and 2007, property, plant and equipment included $375,796 and $547,572, respectively, of assets under construction. There were $137,153 and $80,040 (note 22) in commitments for future capital expenditures as of December 31, 2008 and 2007, respectively.
NESTLÉ HOLDINGS, INC. (A Wholly Owned Subsidiary of Nestlé S.A.)
AND SUBSIDIARIES
Notes to Consolidated Financial Statements
December 31, 2008 and 2007
(Dollars in Thousands)
33
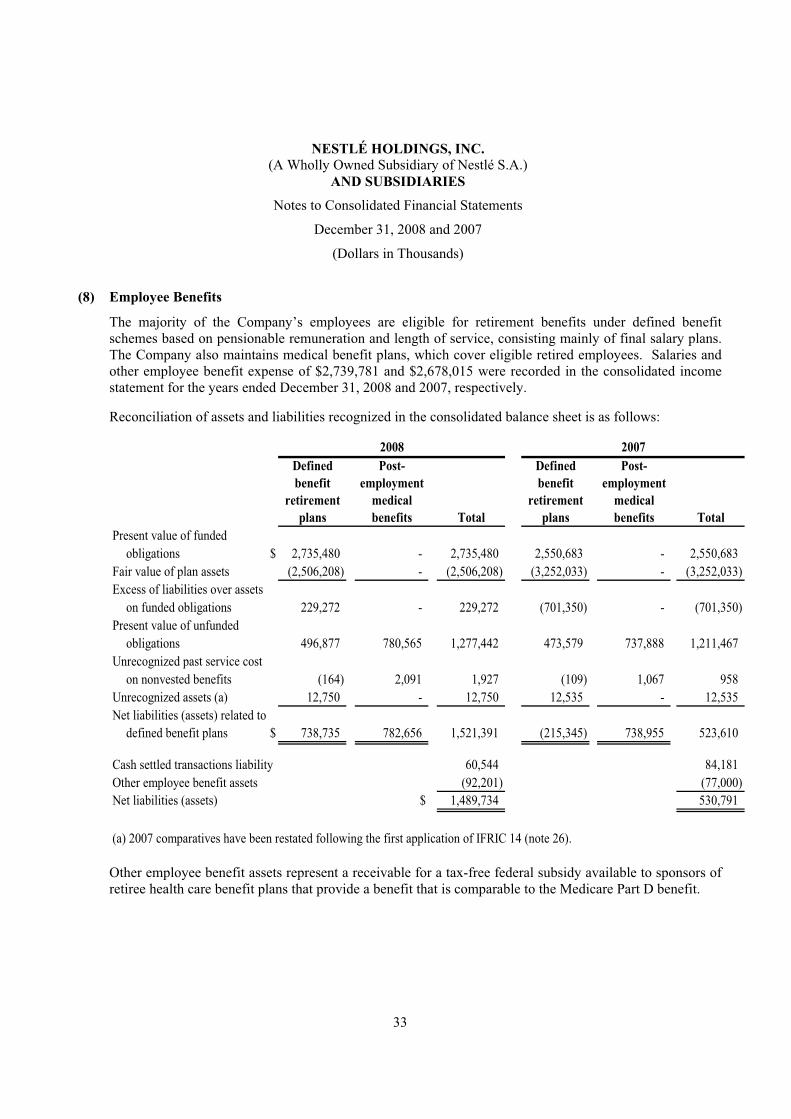
(8) Employee Benefits
The majority of the Company’s employees are eligible for retirement benefits under defined benefit schemes based on pensionable remuneration and length of service, consisting mainly of final salary plans. The Company also maintains medical benefit plans, which cover eligible retired employees. Salaries and other employee benefit expense of $2,739,781 and $2,678,015 were recorded in the consolidated income statement for the years ended December 31, 2008 and 2007, respectively.
Reconciliation of assets and liabilities recognized in the consolidated balance sheet is as follows:
Present value of funded
obligations $ 2,735,480 - 2,735,480 2,550,683 - 2,550,683
Fair value of plan assets (2,506,208) - (2,506,208) (3,252,033) - (3,252,033)
Excess of liabilities over assets
on funded obligations 229,272 - 229,272 (701,350) - (701,350)
Present value of unfunded
obligations 496,877 780,565 1,277,442 473,579 737,888 1,211,467
Unrecognized past service cost
on nonvested benefits (164) 2,091 1,927 (109) 1,067 958
Unrecognized assets (a) 12,750 - 12,750 12,535 - 12,535
Net liabilities (assets) related to
defined benefit plans $ 738,735 782,656 1,521,391 (215,345) 738,955 523,610
Cash settled transactions liability 60,544 84,181
Other employee benefit assets (92,201) (77,000)
Net liabilities (assets) $ 1,489,734 530,791
(a) 2007 comparatives have been restated following the first application of IFRIC 14 (note 26).
2008 2007Defined benefit
retirement plans
Post-employment
medical benefits Total
Defined benefit
retirement plans
Post-employment
medical benefits Total
Other employee benefit assets represent a receivable for a tax-free federal subsidy available to sponsors of retiree health care benefit plans that provide a benefit that is comparable to the Medicare Part D benefit.
NESTLÉ HOLDINGS, INC. (A Wholly Owned Subsidiary of Nestlé S.A.)
AND SUBSIDIARIES
Notes to Consolidated Financial Statements
December 31, 2008 and 2007
(Dollars in Thousands)
34
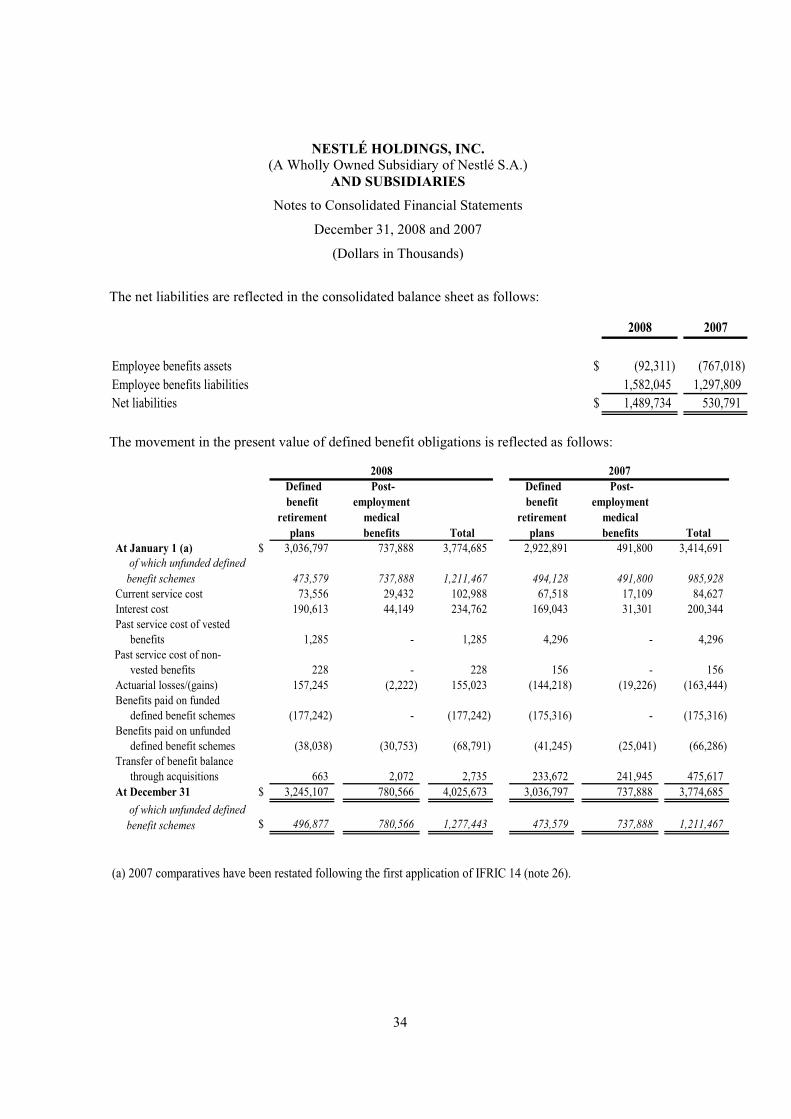
The net liabilities are reflected in the consolidated balance sheet as follows:
2008 2007
Employee benefits assets $ (92,311) (767,018)
Employee benefits liabilities 1,582,045 1,297,809
Net liabilities $ 1,489,734 530,791
The movement in the present value of defined benefit obligations is reflected as follows:
At January 1 (a) $ 3,036,797 737,888 3,774,685 2,922,891 491,800 3,414,691
473,579 737,888 1,211,467 494,128 491,800 985,928
Current service cost 73,556 29,432 102,988 67,518 17,109 84,627
Interest cost 190,613 44,149 234,762 169,043 31,301 200,344
Past service cost of vested
benefits 1,285 - 1,285 4,296 - 4,296
vested benefits 228 - 228 156 - 156
Actuarial losses/(gains) 157,245 (2,222) 155,023 (144,218) (19,226) (163,444)
Benefits paid on funded
defined benefit schemes (177,242) - (177,242) (175,316) - (175,316)
Benefits paid on unfunded
defined benefit schemes (38,038) (30,753) (68,791) (41,245) (25,041) (66,286)
Transfer of benefit balance
through acquisitions 663 2,072 2,735 233,672 241,945 475,617
At December 31 $ 3,245,107 780,566 4,025,673 3,036,797 737,888 3,774,685
$ 496,877 780,566 1,277,443 473,579 737,888 1,211,467
(a) 2007 comparatives have been restated following the first application of IFRIC 14 (note 26).
of which unfunded defined
benefit schemes
Past service cost of non-
of which unfunded defined
benefit schemes
2008 2007 Defined benefit
retirement plans
Post-employment
medical benefits Total
Defined benefit
retirement plans
Post-employment
medical benefits Total

NESTLÉ HOLDINGS, INC. (A Wholly Owned Subsidiary of Nestlé S.A.)
AND SUBSIDIARIES
Notes to Consolidated Financial Statements
December 31, 2008 and 2007
(Dollars in Thousands)
35
The movement in the fair value of defined benefit assets is reflected as follows:
At January 1 $ (3,252,033) - (3,252,033) (2,665,807) - (2,665,807)
Expected return on plan assets (267,552) - (267,552) (234,023) - (234,023)
Employer contributions (4,302) - (4,302) (66,000) - (66,000)
Actuarial losses/(gains) 850,175 - 850,175 (212,724) - (212,724)
Benefits paid on funded - -
defined benefit schemes 176,891 - 176,891 175,316 - 175,316
Transfer of benefit balance - -
through acquisitions (9,387) - (9,387) (248,795) - (248,795)
At December 31 $ (2,506,208) - (2,506,208) (3,252,033) - (3,252,033)
2008 2007 Defined benefit
retirement plans
Post-employment
medical benefits Total
Defined benefit
retirement plans
Post-employment
medical benefits Total
The major categories of plan assets as a percentage of total plan assets are as follows:
2008 2007
At December 31Equities 52.0% 53.0%
Bonds 29.0% 26.0%
Alternative investments 19.0% 21.0%
Total 100.0% 100.0%

NESTLÉ HOLDINGS, INC. (A Wholly Owned Subsidiary of Nestlé S.A.)
AND SUBSIDIARIES
Notes to Consolidated Financial Statements
December 31, 2008 and 2007
(Dollars in Thousands)
36
Actuarial losses (gains) of defined benefit schemes recognized in the consolidated statement of recognized income and expense are reflected as follows:
Experience adjustments on plan assets $ 850,175 - 850,175 (212,724) - (212,724)
Experience adjustments on plan liabilities 53,569 (21,388) 32,181 (156,005) (19,226) (175,231)
Change of assumptions on plan liabilites 103,461 19,166 122,627 - - -
Transfer to unrecognized assets 215 - 215 11,787 - 11,787
- - (15,201) - - -
At December 31 $ 1,007,420 (2,222) 989,997 (356,942) (19,226) (376,168)
Change in fair value of other employee
benefit assets
2008 2007Defined benefit
retirement plans
Post-employment
medical benefits Total
Defined benefit
retirement plans
Post-employment
medical benefits Total
The evolution of the defined benefit obligation, plan assets and experience adjustments are as follows:
2008 2007 2006 2005
Present value of funded obligations $ 2,735,480 2,550,683 2,428,015 2,417,800
Fair value of plan assets (2,506,208) (3,252,033) (2,665,807) (2,396,095)
Excess of liabilities over assets on
funded obligations $ 229,272 (701,350) (237,792) 21,705
Present value of unfunded obligations $ 1,277,442 1,211,467 985,928 956,700
Experience adjustments:
Plan Assets $ (850,175) 212,724 142,208 26,759
Plan Liabilities (32,181) 175,231 (20,293) 46,215
At December 31 $ (882,356) 387,955 121,915 72,974
NESTLÉ HOLDINGS, INC. (A Wholly Owned Subsidiary of Nestlé S.A.)
AND SUBSIDIARIES
Notes to Consolidated Financial Statements
December 31, 2008 and 2007
(Dollars in Thousands)
37
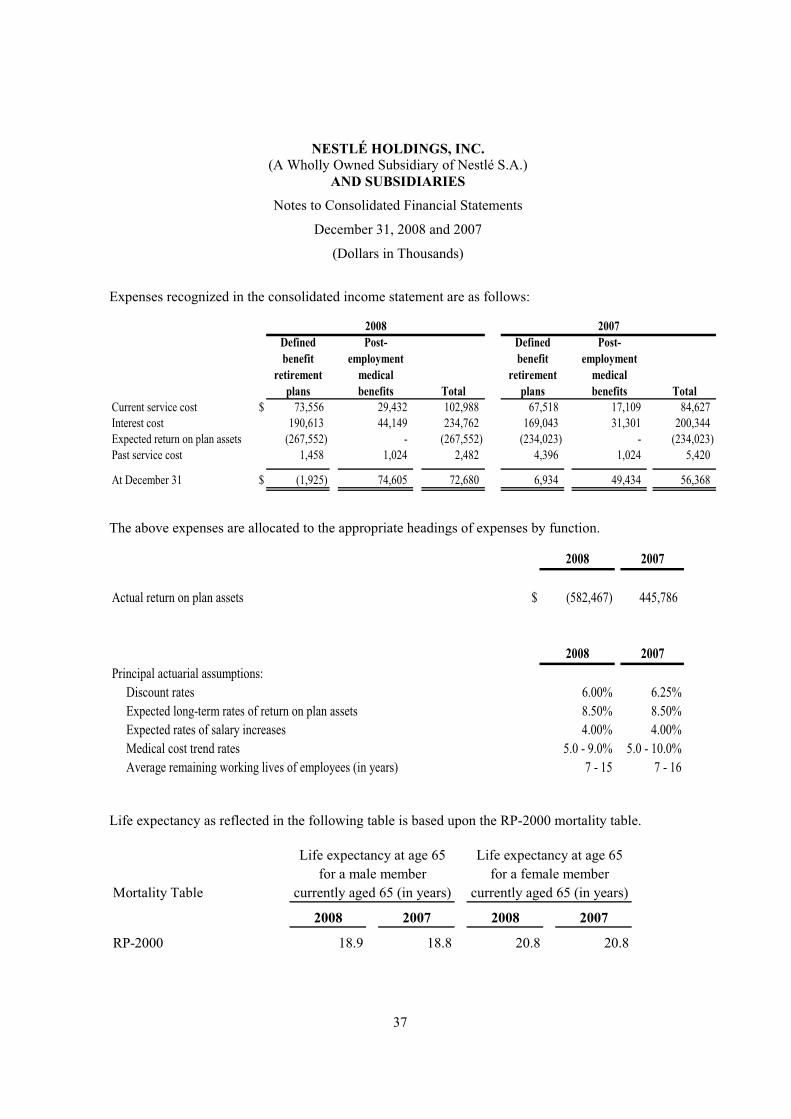
Expenses recognized in the consolidated income statement are as follows:
Current service cost $ 73,556 29,432 102,988 67,518 17,109 84,627
Interest cost 190,613 44,149 234,762 169,043 31,301 200,344
Expected return on plan assets (267,552) - (267,552) (234,023) - (234,023)
Past service cost 1,458 1,024 2,482 4,396 1,024 5,420
At December 31 $ (1,925) 74,605 72,680 6,934 49,434 56,368
2008 2007Defined benefit
retirement plans
Post-employment
medical benefits Total
Defined benefit
retirement plans
Post-employment
medical benefits Total
The above expenses are allocated to the appropriate headings of expenses by function.
2008 2007
Actual return on plan assets $ (582,467) 445,786
2008 2007
Principal actuarial assumptions:
Discount rates 6.00% 6.25%
Expected long-term rates of return on plan assets 8.50% 8.50%
Expected rates of salary increases 4.00% 4.00%
Medical cost trend rates 5.0 - 9.0% 5.0 - 10.0%
Average remaining working lives of employees (in years) 7 - 15 7 - 16
Life expectancy as reflected in the following table is based upon the RP-2000 mortality table.
Mortality Table
2008 2007 2008 2007
RP-2000 18.9 18.8 20.8 20.8
Life expectancy at age 65
for a male member
currently aged 65 (in years)
Life expectancy at age 65
for a female member
currently aged 65 (in years)

NESTLÉ HOLDINGS, INC. (A Wholly Owned Subsidiary of Nestlé S.A.)
AND SUBSIDIARIES
Notes to Consolidated Financial Statements
December 31, 2008 and 2007
(Dollars in Thousands)
38
A one percentage point increase in assumed medical cost trend rates would increase the defined benefit obligation by $30,540 and increase the sum of service cost and interest cost components by $2,893. A one percentage point decrease in assumed medical cost trend rates would decrease the defined benefit obligation by $27,440 and decrease the sum of service cost and interest cost components by $2,553.
The Company sponsors and contributes to employee savings plans. Contributions are determined by either the matching of employee contributions or discretionary contributions, as defined by the plans. Amounts charged to expense for defined contribution plans totaled $84,317 in 2008 and $69,084 in 2007. As of December 31, 2008 and 2007, the Company recorded an accrued liability totaling $22,076 and $23,252 (note 16), respectively, in connection with certain defined contribution plans that call for annual lump sum payments and a discretionary contribution.
Share-based Payments
Two forms of share-based payments are issued to select NHI personnel; share appreciation rights (“SARs”) and restricted stock units (“RSUs”). These are Nestlé S.A. SARs and RSUs cash-settled share-based payments. In 2008, Nestlé S.A. common stock split one share for ten shares and, accordingly, 2007 comparable disclosures have been updated. For the year ended December 31, 2008 and 2007, combined SARs and RSUs expense totaled $1,084 and $56,934, respectively.
Share Appreciation Rights
At January 1, 2003, the Company began granting SARs to key members of management, entitling employees to a cash payment. All of the SARs vest after the employee has completed three years of service from the grant date and expire if the employee has not elected to receive a cash payment within seven years from the grant date. Upon voluntary resignation or termination of employment for cause, all SARs granted and outstanding become null and void without any compensation. However, upon termination of employment, as a result of death, redundancy, disability, retirement, termination without cause or divestiture, all SARs granted and outstanding vest immediately.

NESTLÉ HOLDINGS, INC. (A Wholly Owned Subsidiary of Nestlé S.A.)
AND SUBSIDIARIES
Notes to Consolidated Financial Statements
December 31, 2008 and 2007
(Dollars in Thousands)
39
The table below summarizes SARs grants through December 31, 2008:
NumberGrant date of SARsJanuary 1, 2003 2,683,750
April 1, 2003 12,910
July 1, 2003 2,750
October 1, 2003 1,080
January 1, 2004 2,183,360
April 1, 2004 7,490
July 1, 2004 370
October 1, 2004 3,270
January 1, 2005 2,387,340
April 1, 2005 14,130
July 1, 2005 2,470
Total 7,298,920
The number and weighted average exercise prices of the SARs at December 31, 2008 and 2007 are listed in the following table. Comparable prior year amounts have been restated in response to the Nestlé S.A. stock split. The weighted average Nestlé S.A. stock price was CHF 47.05 in 2008 and CHF 48.71 in 2007. The weighted average exercise prices below were translated from Swiss francs, the denomination currency of Nestlé S.A. stock, at the December 31, 2008 and 2007 spot rates; the exchange rates were 0.9472 and 0.8881 USD/CHF, respectively.
Weighted Average Weighted Averageaverage exercise Number remaining average exercise Number remaining
price of SARs contractual life price of SARs contractual life
Outstanding at the beginning of the period $ 26.47 3,432,280 24.45 5,528,050
Forfeited during the period 28.74 (14,520) 26.29 (61,740)
Exercised during the period 28.18 (1,325,300) 26.66 (2,034,030)
Outstanding at the end of the period 28.26 2,092,460 2.4 years 26.47 3,432,280 3.4 years
Exercisable at the end of the period $ 28.26 2,092,460 26.50 2,683,220
2008 2007
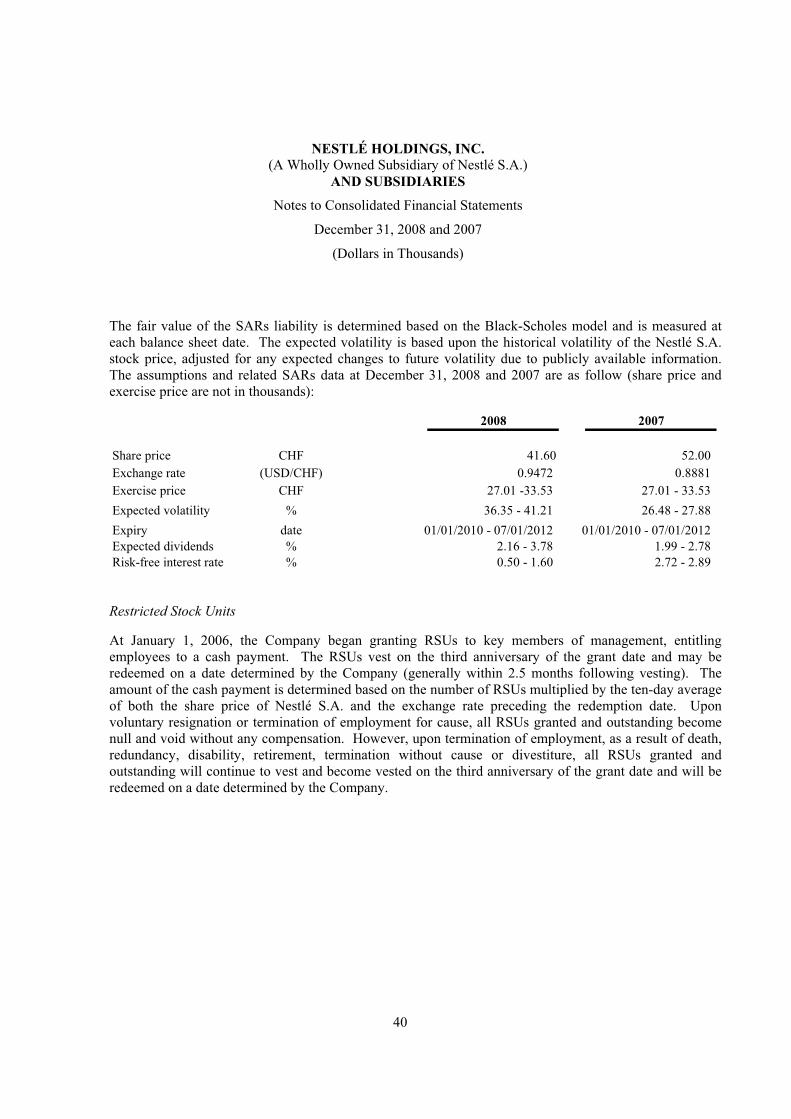
NESTLÉ HOLDINGS, INC. (A Wholly Owned Subsidiary of Nestlé S.A.)
AND SUBSIDIARIES
Notes to Consolidated Financial Statements
December 31, 2008 and 2007
(Dollars in Thousands)
40
The fair value of the SARs liability is determined based on the Black-Scholes model and is measured at each balance sheet date. The expected volatility is based upon the historical volatility of the Nestlé S.A. stock price, adjusted for any expected changes to future volatility due to publicly available information. The assumptions and related SARs data at December 31, 2008 and 2007 are as follow (share price and exercise price are not in thousands):
2008 2007
Share price CHF 41.60 52.00
Exchange rate (USD/CHF) 0.9472 0.8881
Exercise price CHF 27.01 -33.53 27.01 - 33.53
Expected volatility % 36.35 - 41.21 26.48 - 27.88
Expiry date 01/01/2010 - 07/01/2012 01/01/2010 - 07/01/2012
Expected dividends % 2.16 - 3.78 1.99 - 2.78
Risk-free interest rate % 0.50 - 1.60 2.72 - 2.89
Restricted Stock Units
At January 1, 2006, the Company began granting RSUs to key members of management, entitling employees to a cash payment. The RSUs vest on the third anniversary of the grant date and may be redeemed on a date determined by the Company (generally within 2.5 months following vesting). The amount of the cash payment is determined based on the number of RSUs multiplied by the ten-day average of both the share price of Nestlé S.A. and the exchange rate preceding the redemption date. Upon voluntary resignation or termination of employment for cause, all RSUs granted and outstanding become null and void without any compensation. However, upon termination of employment, as a result of death, redundancy, disability, retirement, termination without cause or divestiture, all RSUs granted and outstanding will continue to vest and become vested on the third anniversary of the grant date and will be redeemed on a date determined by the Company.
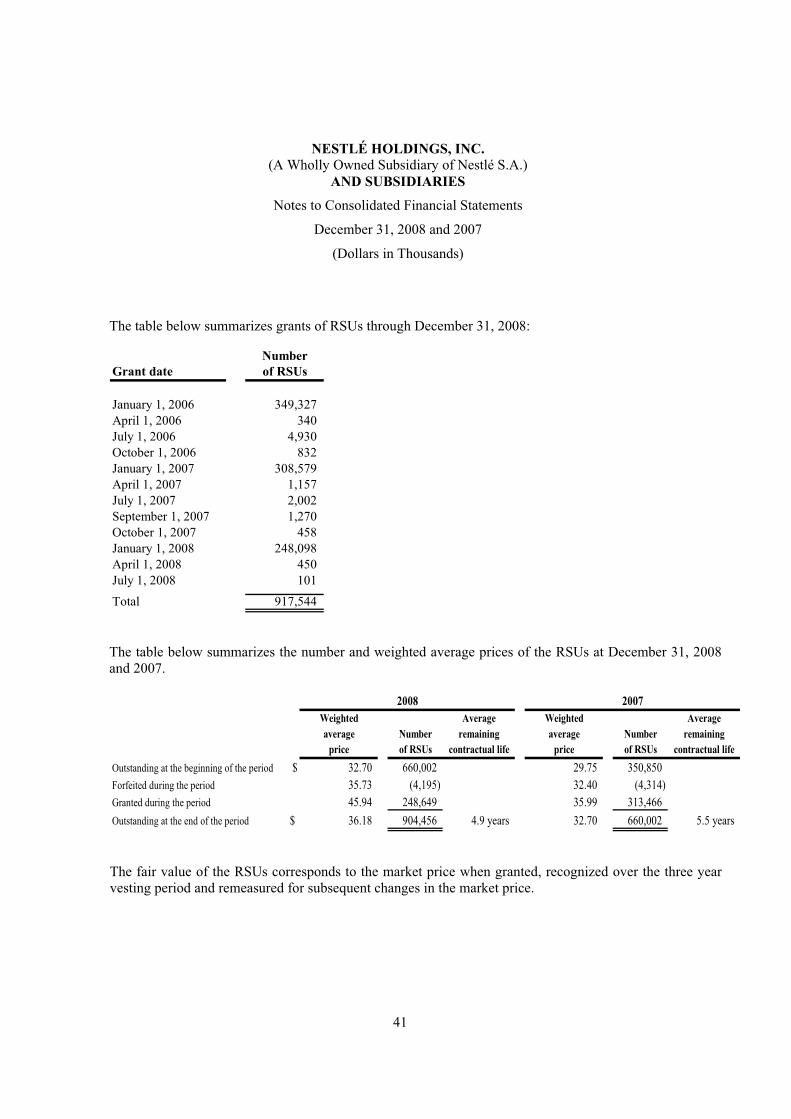
NESTLÉ HOLDINGS, INC. (A Wholly Owned Subsidiary of Nestlé S.A.)
AND SUBSIDIARIES
Notes to Consolidated Financial Statements
December 31, 2008 and 2007
(Dollars in Thousands)
41
The table below summarizes grants of RSUs through December 31, 2008:
NumberGrant date of RSUs
January 1, 2006 349,327
April 1, 2006 340
July 1, 2006 4,930
October 1, 2006 832
January 1, 2007 308,579
April 1, 2007 1,157
July 1, 2007 2,002
September 1, 2007 1,270
October 1, 2007 458
January 1, 2008 248,098
April 1, 2008 450
July 1, 2008 101
Total 917,544
The table below summarizes the number and weighted average prices of the RSUs at December 31, 2008 and 2007.
Weighted Average Weighted Averageaverage Number remaining average Number remaining
price of RSUs contractual life price of RSUs contractual life
Outstanding at the beginning of the period $ 32.70 660,002 29.75 350,850
Forfeited during the period 35.73 (4,195) 32.40 (4,314)
Granted during the period 45.94 248,649 35.99 313,466
Outstanding at the end of the period $ 36.18 904,456 4.9 years 32.70 660,002 5.5 years
20072008
The fair value of the RSUs corresponds to the market price when granted, recognized over the three year vesting period and remeasured for subsequent changes in the market price.

NESTLÉ HOLDINGS, INC. (A Wholly Owned Subsidiary of Nestlé S.A.)
AND SUBSIDIARIES
Notes to Consolidated Financial Statements
December 31, 2008 and 2007
(Dollars in Thousands)
42
(9) Investments in Associated Companies
The Company has the following investments in associated companies:
Ownership interest Net book value2008 2007 2008 2007
Williams Inland Distributors, LLC 45.0% 45.0% $ 1,843 1,770
Joint Juice, Inc. 33.0% 33.0% 1,645 7,332
Starbucks Ice Cream Partnership 50.0% 50.0% 1,072 524
Beverage Partners North America 50.0% 50.0% 5,754 3,753
$ 10,314 13,379
The Company’s share of recognized profit or loss in the associated companies for the years ended December 31, 2008 and 2007 was $(2,182) and $(939), respectively.
Unaudited summary financial information for associated companies – 100%:
2008 Assets Liabilities Revenues Prof it/(Loss)
Williams Inland Distributors, LLC $ 6,310 2,214 34,518 358
Joint Juice, Inc . 6,040 31,071 12,288 (17,694)
Starbucks Ice Cream Partnership 2,620 419 12,218 3,153
Beverage Partners North America 40,111 28,606 31,490 4,001
$ 55,081 62,310 90,514 (10,182)
2007 Assets Liabilities Revenues Prof it/(Loss)
Williams Inland Distributors, LLC $ 6,640 2,683 33,954 412
Joint Juice, Inc . 10,898 19,255 13,925 (15,819)
Starbucks Ice Cream Partnership 1,755 708 17,765 2,191
Beverage Partners North America 41,848 34,343 58,641 5,309
$ 61,141 56,989 124,285 (7,907)
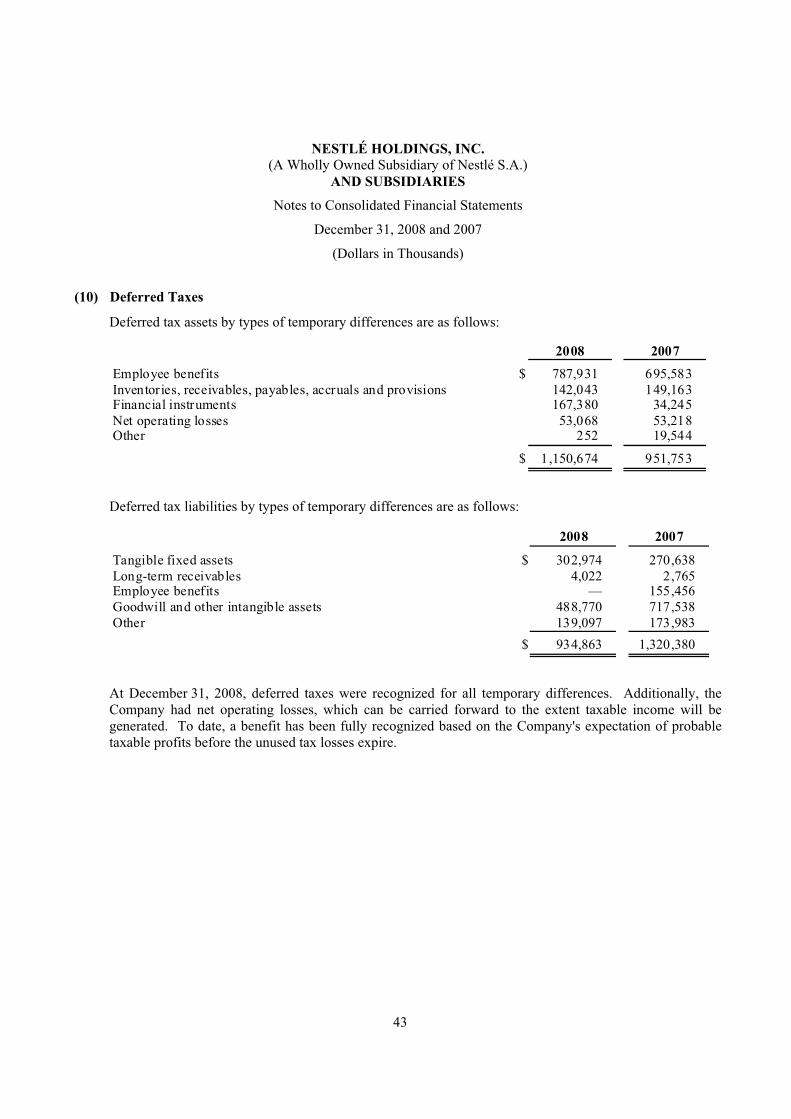
NESTLÉ HOLDINGS, INC. (A Wholly Owned Subsidiary of Nestlé S.A.)
AND SUBSIDIARIES
Notes to Consolidated Financial Statements
December 31, 2008 and 2007
(Dollars in Thousands)
43
(10) Deferred Taxes
Deferred tax assets by types of temporary differences are as follows:
2008 2007
Employee benefits $ 787,931 695,583 Inventories, receivables, payables, accruals and provisions 142,043 149,163 Financial instruments 167,380 34,245
Net operating losses 53,068 53,218 Other 252 19,544
$ 1,150,674 951,753
Deferred tax liabilities by types of temporary differences are as follows:
2008 2007
Tangible fixed assets $ 302,974 270,638
Long-term receivables 4,022 2,765 Employee benefits — 155,456 Goodwill and other intangible assets 488,770 717,538
Other 139,097 173,983
$ 934,863 1,320,380
At December 31, 2008, deferred taxes were recognized for all temporary differences. Additionally, the Company had net operating losses, which can be carried forward to the extent taxable income will be generated. To date, a benefit has been fully recognized based on the Company's expectation of probable taxable profits before the unused tax losses expire.

NESTLÉ HOLDINGS, INC. (A Wholly Owned Subsidiary of Nestlé S.A.)
AND SUBSIDIARIES
Notes to Consolidated Financial Statements
December 31, 2008 and 2007
(Dollars in Thousands)
44
(11) Goodwill
Goodwill is as follows:
2008 2007
Gross goodwill at January 1(a)
$ 16,898,301 13,460,931
Goodwill from acquisitions (note 24) 32,512 3,437,370
At December 31 16,930,813 16,898,301
Accumulated impairments at January 1 (71,590) (71,590)
Impairment of goodwill – –
At December 31 (71,590) (71,590)
Net goodwill, at December 31 $ 16,859,223 16,826,711
(a ) In accordance with IFRS 3, Business Combinations, gross value includes prior years' accumulated amortization.
In 2008, the Company acquired the net assets of certain local franchise operations of Jenny Craig Holdings, Inc. resulting in goodwill of $4,118. Purchase accounting adjustments in 2008 attributable to the 2007 acquisitions of Gerber and Novartis Nutrition Corporation increased goodwill by $9,187 and $18,007, respectively. Other purchase accounting adjustments made to smaller prior acquisitions resulted in additional goodwill in 2008 of $1,200.
In 2007, the Company recorded $3,189,531 and $296,845 of goodwill as a result of the purchases of Gerber and Novartis Nutrition Corporation, respectively. Additionally, smaller acquisitions, including Trim Way and Eskimo Pie, contributed $10,114 and $1,762 of goodwill, respectively, in 2007. Purchase accounting adjustments of $(60,882) were made in 2007 to the 2006 goodwill attributed to the Jenny Craig Holdings Inc. and Joseph’s Gourmet Pasta and Sauces Company acquisitions.
Impairment Testing for Cash Generating Units (“CGUs”) containing Goodwill
Impairment reviews have been conducted for goodwill allocated to 15 CGUs, which is the lowest level at which the goodwill is monitored for internal management purposes. Detailed results of the impairment tests are presented below for the three main CGUs tested, representing 82% of the net book value at December 31, 2008. For purpose of the tests, they are the following CGUs: PetCare, Infant Nutrition and Ice Cream.
PetCare
Goodwill related to the 2001 acquisition of Ralston Purina has been allocated for the impairment test to the Cash Generating Unit (“CGU”) of the product category PetCare. The carrying amounts of all goodwill items allocated to this CGU total $8,172,447 at December 31, 2008.
NESTLÉ HOLDINGS, INC. (A Wholly Owned Subsidiary of Nestlé S.A.)
AND SUBSIDIARIES
Notes to Consolidated Financial Statements
December 31, 2008 and 2007
(Dollars in Thousands)
45
The recoverable amount of the CGU is higher than its carrying amount. The recoverable amount has been determined based upon a value-in-use calculation. Deflated cash flow projections covering the next 50 years, discounted at a weighted-average of 6.1%, were used in this calculation. The cash flows for the first five years were based upon financial plans approved by Company management; years six to ten were based upon Company management’s best expectations, which are consistent with the Company’s approved strategy for this period. Cash flows were assumed to be flat for years 11 to 50, although Company management expects continuing growth. Cash flows have been adjusted to reflect specific business risks.
Main assumptions, based on past experiences and current initiatives, were the following:
Sales: annual growth between 3.9% and 7.9% over the first ten year period;
EBIT margin evolution: steadily improving margin over the period, in a range of 0.1% – 0.3% per year, consistent with sales growth and portfolio rationalization.
Assumptions used in the calculation are consistent with the expected long-term average growth rate of the PetCare business. The key sensitivity for the impairment test is the growth in sales and EBIT margin. Assuming no growth in the cash flow projections would not result in the carrying amount exceeding the recoverable amount. An increase of 1% in the discount rate assumption would not change the conclusions of the impairment test.
Infant Nutrition
Goodwill related to the 2007 acquisition of Gerber has been allocated for the impairment test to the CGU of the Infant Nutrition business. As of December 31, 2008, the carrying amount of all goodwill items allocated to this CGU total $3,198,718.
The recoverable amount of the CGU is higher than its carrying amount. The recoverable amount has been determined based upon a value-in-use calculation. Deflated cash flow projections covering the next 50 years, discounted at a weighted-average of 6.1%, were used in this calculation. The cash flows for the first five years were based upon financial plans approved by Company management; years six to ten were based upon Company management’s best expectations, which are consistent with the Company’s approved strategy for this period. Cash flows were assumed to be flat for years 11 to 50, although Company management expects continuing growth. Cash flows have been adjusted to reflect specific business risks.
Main assumptions, based on past experiences and current initiatives, were the following:
Sales: annual growth between 2% and 5% over the five year period;
EBIT margin evolution: steadily improving margin over the period, in a range of 0.1% – 0.5% per year.
The key sensitivity for the impairment test is the growth in sales and EBIT margin. Assuming no sales growth and no improvement in EBIT margin over the entire period would not result in the carrying amount exceeding the recoverable amount. An increase of 1% in the discount rate assumption would not change the conclusions of the impairment test.
NESTLÉ HOLDINGS, INC. (A Wholly Owned Subsidiary of Nestlé S.A.)
AND SUBSIDIARIES
Notes to Consolidated Financial Statements
December 31, 2008 and 2007
(Dollars in Thousands)
46
Ice Cream
Goodwill related to the 2003 acquisition of Dreyer’s Grand Ice Cream, Inc. as well as the former Nestlé Ice Cream Company has been allocated for the impairment test to the Ice Cream CGU. The carrying amounts of all goodwill items allocated to this CGU total $2,505,612 at December 31, 2008.
The recoverable amount of the CGU is higher than its carrying amount. The recoverable amount has been determined based upon a value-in-use calculation. Deflated cash flow projections covering the next 50 years, discounted at 6.1%, were used in this calculation. The cash flows for the first five years were based upon financial plans approved by Company management; years six to ten were based upon Company management’s best expectations, which are consistent with the Company’s approved strategy for this period. Cash flows were assumed to be flat for years 11 to 50, although Company management expects continuing growth. Cash flows have been adjusted to reflect the specific business risks.
Main assumptions, based on past experiences and current initiatives, were the following:
Sales: annual growth between 2% and 5% over the first ten year period;
EBIT margin evolution: steadily improving margin over the period, in a range of 0.7% - 2.7% consistent with sales growth and enhanced cost management and efficiency.
The key sensitivity for the impairment test is the growth in sales and EBIT. Limiting sales growth to only 4.0% until 2017 and 0% thereafter would not result in the carrying amount exceeding the recoverable amount. Reaching 80% of the expectations in terms of EBIT growth would not result in the carrying amount exceeding the recoverable amount. An increase of 1% in the discount rate assumption would not change the conclusions of the impairment test.

NESTLÉ HOLDINGS, INC. (A Wholly Owned Subsidiary of Nestlé S.A.)
AND SUBSIDIARIES
Notes to Consolidated Financial Statements
December 31, 2008 and 2007
(Dollars in Thousands)
47
(12) Intangible Assets
Intangible assets, which include acquired or internally developed intangible assets, primarily software and various rights connected with business activities, are as follows:
2008 2007
Gross intangible assets at January 1 $ 1,042,577 588,182
of which indefinite useful life 141,300 –
Additions 179,419 56,792
Other 34 –
Intangible assets from acquisitions 2,240 1,225,021
Reclass to assets held for sale (note 24) (21,907) (827,418)
At December 31 1,202,363 1,042,577
of which indefinite useful life 121,500 141,300
Accumulated amortization at January 1 (318,072) (255,087)
Amortization of intangible assets (92,935) (62,985)
At December 31 (411,007) (318,072)
Net intangible assets, at December 31 $ 791,356 724,505
In 2008, the Company recorded purchase accounting adjustments that increased the value of the intangible assets acquired in connection with the 2007 purchases of Gerber and Novartis Nutrition Corporation by $2,240, including indefinite-lived assets of $2,107. During 2007, the Company acquired certain indefinite-lived intangible assets with a fair value of $968,718 and definite-lived intangible assets with a fair value of $256,303 from the acquisition of Gerber and Novartis Nutrition Corporation. Indefinite-lived intangible assets represent trademarks which management expects to contribute to the cash flows of the Company indefinitely.
During 2008 and 2007, the Company reclassified indefinite-lived intangible assets totaling $26,407 and $827,418, respectively, to assets held for sale in accordance with IFRS 3. (notes 15 and 25)

NESTLÉ HOLDINGS, INC. (A Wholly Owned Subsidiary of Nestlé S.A.)
AND SUBSIDIARIES
Notes to Consolidated Financial Statements
December 31, 2008 and 2007
(Dollars in Thousands)
48
(13) Financial Instruments
Financial assets and liabilities 2008 2007
Cash and cash equivalents 138,842$ 134,460$
Trade and other receivables, net 3,106,986 2,418,479
Derivative assets 413,689 317,738
Financial assets - non-current 2,108,791 2,179,516
Total financial assets 5,768,308 5,050,193
Trade and other payables 1,176,603 1,186,766
Financial liabilities - current 9,232,157 11,492,336
Derivative liabilities 578,223 71,378
Financial liabilities - non-current 11,589,275 10,317,066
Total financial liabilities 22,576,258 23,067,546
Net financial position (16,807,950)$ (18,017,353)
By category 2008 2007
Loans and receivables 3,149,408$ 2,466,040$
Derivative assets(a)
413,689 317,738
Available-for-sale assets 2,205,211 2,266,415
Total financial assets 5,768,308 5,050,193
Financial liabilities at amortized cost 17,304,588 18,151,911
Financial liabilities at fair value under hedge accounting 4,693,447 4,844,257
Derivative liabilities (a)
578,223 71,378
Total financial liabilities 22,576,258 23,067,546
Net financial position (16,807,950)$ (18,017,353)
(a) Include derivatives classified as trading (note 5)
The Company does not apply the fair value option.
The carrying value of financial liabilities at amortized cost approximates the fair value.
Fair value hierarchy per classes of financial instruments
The Company determines the fair value of its financial instruments on the basis of the following hierarchy. The fair value of instruments that are quoted in active markets is determined based on current market prices. This applies to commodity futures that are traded on terminal exchanges and to listed bonds. The

NESTLÉ HOLDINGS, INC. (A Wholly Owned Subsidiary of Nestlé S.A.)
AND SUBSIDIARIES
Notes to Consolidated Financial Statements
December 31, 2008 and 2007
(Dollars in Thousands)
49
fair value of the other instruments is determined on the basis of valuation techniques such as discounted cash flow calculations or other pricing models.
Bonds
Car rying value (in 000's)
Comments Coupon Effe ctive
Year of issue/ maturity 2008 2007
Eurobonds:USD 534,760 (d), (e) — 6.25 2001-2008 $ – 521,154 USD 400,000 (c) 3.50 3.81 2005-2008 – 398,335
USD 300,000 (c) 5.00 5.19 2006-2008 – 300,341 USD 250,000 (f) 3.88 3.42 2003-2009 – 249,860 AUD 300,000 (b) 5.50 5.68 2005-2009 211,040 254,069
EUR 250,000 (b) 2.13 2.97 2005-2009 347,310 347,865 USD 300,000 (c) 4.38 4.49 2005-2009 304,521 300,892 GB P 100,000 (b) 5.13 5.24 2006-2009 148,272 197,408 GB P 100,000 (b) 5.13 5.39 2007-2009 148,040 196,651
AUD 200,000 (b) 6.00 6.23 2006-2010 146,061 172,745 CHF 200,000 (a) 2.75 2.75 2007-2010 187,151 177,076 CHF 200,000 (b) 2.75 2.56 2007-2010 186,933 176,412
NOK 1,000,000 (b) 4.75 4.80 2007-2010 145,884 167,366 AUD 100,000 (b) 6.00 6.62 2007-2010 66,789 79,829 HUF 10,000,000 (b) 6.88 7.20 2007-2010 50,602 56,971CHF 100,000 (a) 2.75 2.43 2008-2010 93,952 –
CHF 125,000 (b) 2.75 3.00 2008-2010 119,588 – NOK 500,000 (b) 4.75 5.87 2008-2010 72,322 – NZD 100,000 (b) 8.25 8.53 2008-2010 59,045 –
USD 500,000 (c) 4.75 4.90 2007-2011 508,456 508,049 NOK 1,000,000 (a) 5.00 5.55 2008-2011 143,528 – AUD 300,000 (a) 7.25 7.37 2008-2011 210,122 –
AUD 300,000 (b) 7.25 7.90 2008-2011 216,789 – CHF 300,000 (a) 2.25 2.30 2008-2011 280,356 – USD 750,000 (c) 4.00 3.87 2008-2011 778,616 – CHF 200,000 (b) 3.00 3.03 2007-2012 199,111 177,079
CHF 150,000 (a) 3.00 2.72 2008-2012 141,791 – CHF 325,000 (b) 3.00 2.72 2008-2012 321,792 – CHF 450,000 (b) 2.50 2.57 2006-2013 430,419 386,261
CHF 250,000 (b) 2.63 2.66 2007-2018 231,857 209,036
Other bonds issued by Nestlé Purina PetCare C ompany:USD 82,775 9.25 5.90 1989-2009 85,027 87,417 USD 47,680 7.75 6.25 1995-2015 51,587 52,010
USD 63,210 9.30 6.46 1991-2021 78,378 79,113 USD 78,963 8.63 6.46 1992-2022 93,951 94,614 USD 43,927 8.13 6.47 1993-2023 50,605 50,870USD 51,164 7.88 6.45 1995-2025 58,488 58,717
Total debt obligations 6,168,383 5,300,140
Less current portion (1,244,210) (1,219,830)
Non-current portion 4,924,173 4,080,310
Fair Value of Bonds $ 6,255,447 5,315,000
(a) Subject to a currenc y swap that creates a USD liability at fixed rates.(b) Subject to an interest rate and currency swap that creates a USD liability at floating rates.(c) Subject to an interest rate swap that creates a USD liability at floating rates.
(d) Turbo Zero-Equity-Link issue with warrants on Nestlé S.A. shares. (e) The debt component is recognized under financial liabilities while the equity component has been recorded by Nestlé S.A, which received the
the premiums related to the warrants issued.
(f) The step-up fixed rate callable medium term note was called by the Company in M arch 2008 in acordance with terms a nd conditions.
Interest rates
NESTLÉ HOLDINGS, INC. (A Wholly Owned Subsidiary of Nestlé S.A.)
AND SUBSIDIARIES
Notes to Consolidated Financial Statements
December 31, 2008 and 2007
(Dollars in Thousands)
50
For the years ended December 31, 2008 and December 31, 2007, bonds subject to fair value hedges were carried at fair value for $4,693,447 and $3,752,897, respectively, and the related derivatives were shown under derivative assets for $353,819 and $259,575, respectively and under derivative liabilities for $205,643 and $0, respectively.
Amounts subject to an interest rate and/or currency swap that creates a liability at floating rates in the currency of the issuer are carried at fair value. Amounts subject to an interest rate and currency swap that creates a liability at fixed rates in the currency of the issuer are carried at amortized cost.
(14) Financial Risks
In the course of its business, the Company is exposed to a number of financial risks: credit risk, liquidity risk, market risk (including foreign currency risk and interest rate risk), commodity price risk and other risks (including equity price risk and settlement risk). This note presents the Company’s objectives, policies and processes for managing its financial risk and capital.
Financial risk management is an integral part of the way the Company is managed. The Nestlé S.A. Board of Directors establishes the Nestlé S.A. Group’s financial policies and the Nestlé S.A. Chief Executive Officer establishes objectives in line with these policies. An Asset and Liability Management Committee (ALMC), under the supervision of the Nestlé S.A. Chief Financial Officer, is then responsible for setting financial strategies, which are executed by the Nestlé S.A. Centre Treasury, the Regional Treasury Centers and, in specific local circumstances, by the affiliated companies. The activities of the Centre Treasury and of the various Regional Treasury Centers are supervised by a separate Middle Office, which verifies the compliance of the strategies proposed and/or operations executed within the approved guidelines and limits set by the ALMC. Approved Treasury Management Guidelines define and classify risks as well as determine, by category of transaction, specific approval, limit and monitoring procedures. In accordance with the aforementioned policies, the Company only enters into derivative transactions relating to assets, liabilities or anticipated future transactions.
Credit Risk
Credit Risk Management
Credit risk arises because the counterparty may fail to perform its obligations. The Company is exposed to credit risk on financial instruments such as liquid assets, derivative assets and trade receivable portfolios.
The Company’s objective is to set credit limits based on a counterparty value computed with their probability of default. The methodology used to set the list of counterparty limits includes Enterprise Value (EV), counterparty Credit Ratings (CR) and Credit Default Swaps (CDS). Evolution of counterparties is monitored daily, taking into consideration EV, CR and CDS evolution by the Nestlé S.A. As a result of this daily review, changes on investment limits and risk allocation are carried out.
The Company avoids the concentration of credit risk on its liquid assets by spreading them over several institutions and sectors.
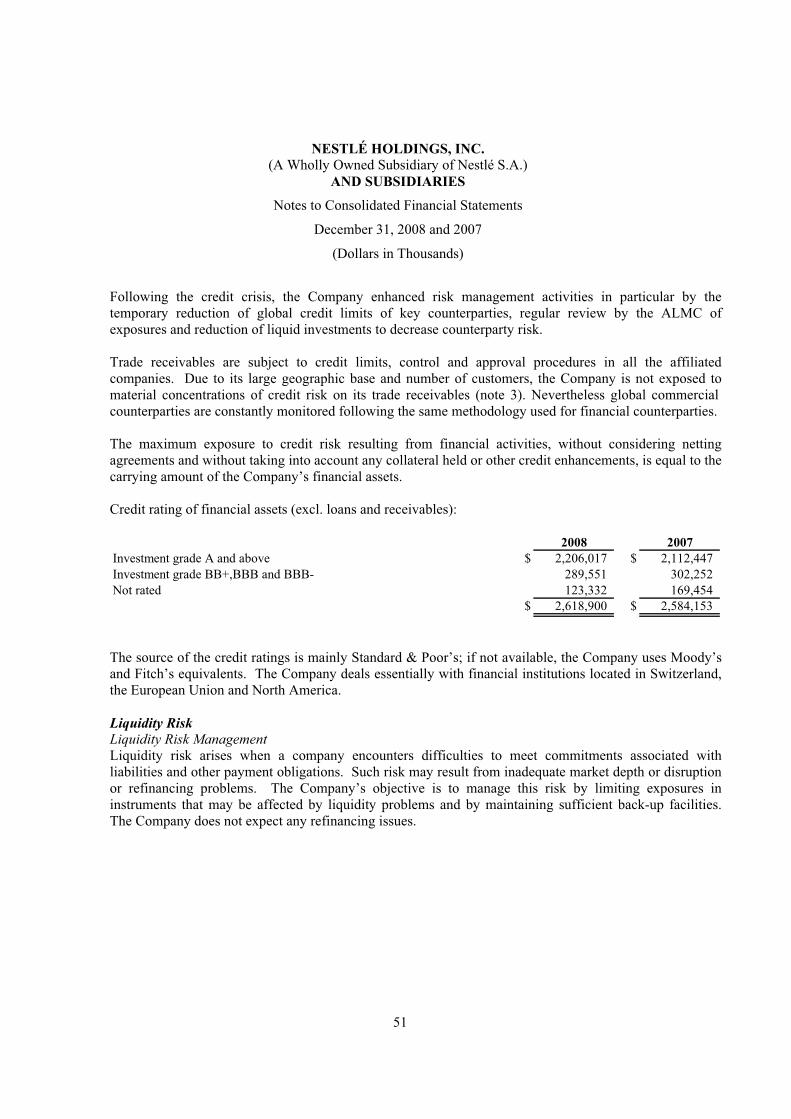
NESTLÉ HOLDINGS, INC. (A Wholly Owned Subsidiary of Nestlé S.A.)
AND SUBSIDIARIES
Notes to Consolidated Financial Statements
December 31, 2008 and 2007
(Dollars in Thousands)
51
Following the credit crisis, the Company enhanced risk management activities in particular by the temporary reduction of global credit limits of key counterparties, regular review by the ALMC of exposures and reduction of liquid investments to decrease counterparty risk.
Trade receivables are subject to credit limits, control and approval procedures in all the affiliated companies. Due to its large geographic base and number of customers, the Company is not exposed to material concentrations of credit risk on its trade receivables (note 3). Nevertheless global commercial counterparties are constantly monitored following the same methodology used for financial counterparties.
The maximum exposure to credit risk resulting from financial activities, without considering netting agreements and without taking into account any collateral held or other credit enhancements, is equal to the carrying amount of the Company’s financial assets.
Credit rating of financial assets (excl. loans and receivables):
2008 2007Investment grade A and above $ 2,206,017 $ 2,112,447
Investment grade BB+,BBB and BBB- 289,551 302,252
Not rated 123,332 169,454
$ 2,618,900 $ 2,584,153
The source of the credit ratings is mainly Standard & Poor’s; if not available, the Company uses Moody’s and Fitch’s equivalents. The Company deals essentially with financial institutions located in Switzerland,the European Union and North America.
Liquidity Risk
Liquidity Risk Management
Liquidity risk arises when a company encounters difficulties to meet commitments associated with liabilities and other payment obligations. Such risk may result from inadequate market depth or disruption or refinancing problems. The Company’s objective is to manage this risk by limiting exposures in instruments that may be affected by liquidity problems and by maintaining sufficient back-up facilities. The Company does not expect any refinancing issues.
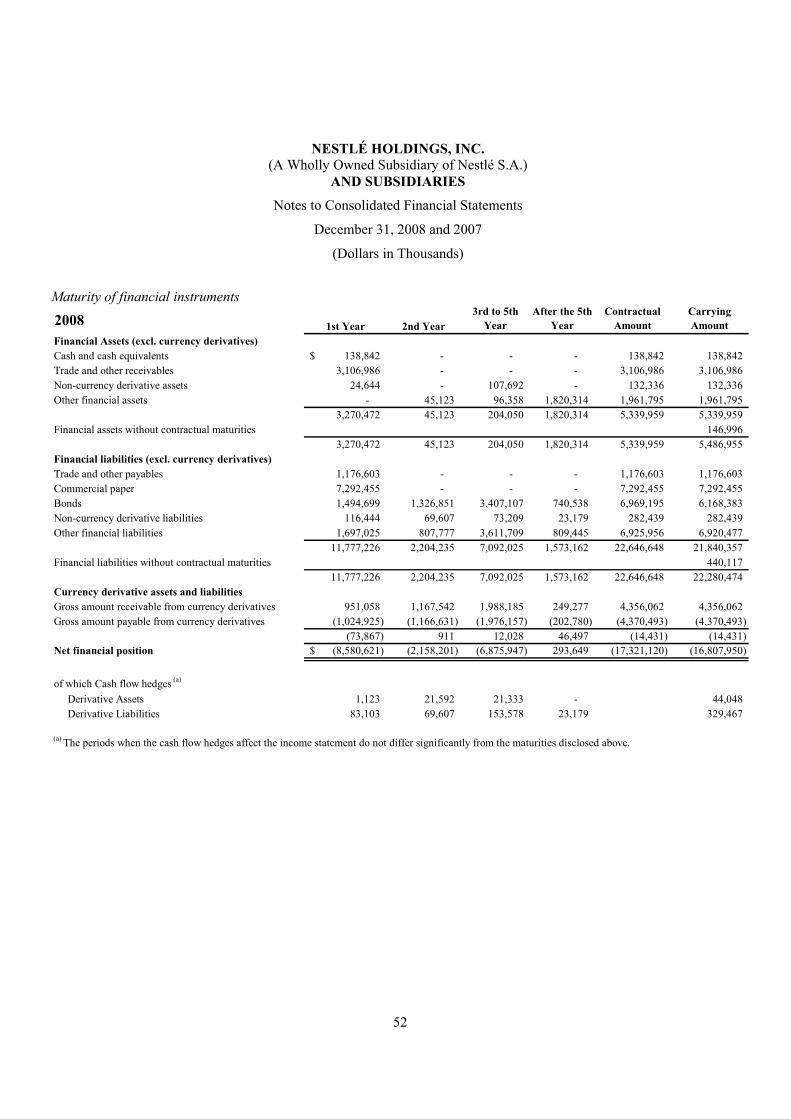
NESTLÉ HOLDINGS, INC. (A Wholly Owned Subsidiary of Nestlé S.A.)
AND SUBSIDIARIES
Notes to Consolidated Financial Statements
December 31, 2008 and 2007
(Dollars in Thousands)
52
Maturity of financial instruments
2008 1st Year 2nd Year3rd to 5th
YearAfter the 5th
YearContractual
AmountCarryingAmount
Financial Assets (excl. currency derivatives)Cash and cash equivalents 138,842$ - - - 138,842 138,842
Trade and other receivables 3,106,986 - - - 3,106,986 3,106,986
Non-currency derivative assets 24,644 - 107,692 - 132,336 132,336
Other financial assets - 45,123 96,358 1,820,314 1,961,795 1,961,795
3,270,472 45,123 204,050 1,820,314 5,339,959 5,339,959
Financial assets without contractual maturities 146,996
3,270,472 45,123 204,050 1,820,314 5,339,959 5,486,955
Financial liabilities (excl. currency derivatives)Trade and other payables 1,176,603 - - - 1,176,603 1,176,603
Commercial paper 7,292,455 - - - 7,292,455 7,292,455
Bonds 1,494,699 1,326,851 3,407,107 740,538 6,969,195 6,168,383
Non-currency derivative liabilities 116,444 69,607 73,209 23,179 282,439 282,439
Other financial liabilities 1,697,025 807,777 3,611,709 809,445 6,925,956 6,920,477
11,777,226 2,204,235 7,092,025 1,573,162 22,646,648 21,840,357
Financial liabilities without contractual maturities 440,117
11,777,226 2,204,235 7,092,025 1,573,162 22,646,648 22,280,474
Currency derivative assets and liabilitiesGross amount receivable from currency derivatives 951,058 1,167,542 1,988,185 249,277 4,356,062 4,356,062
Gross amount payable from currency derivatives (1,024,925) (1,166,631) (1,976,157) (202,780) (4,370,493) (4,370,493)
(73,867) 911 12,028 46,497 (14,431) (14,431)
Net financial position (8,580,621)$ (2,158,201) (6,875,947) 293,649 (17,321,120) (16,807,950)
of which Cash flow hedges(a)
Derivative Assets 1,123 21,592 21,333 - 44,048
Derivative Liabilities 83,103 69,607 153,578 23,179 329,467
(a)The periods when the cash flow hedges affect the income statement do not differ significantly from the maturities disclosed above.
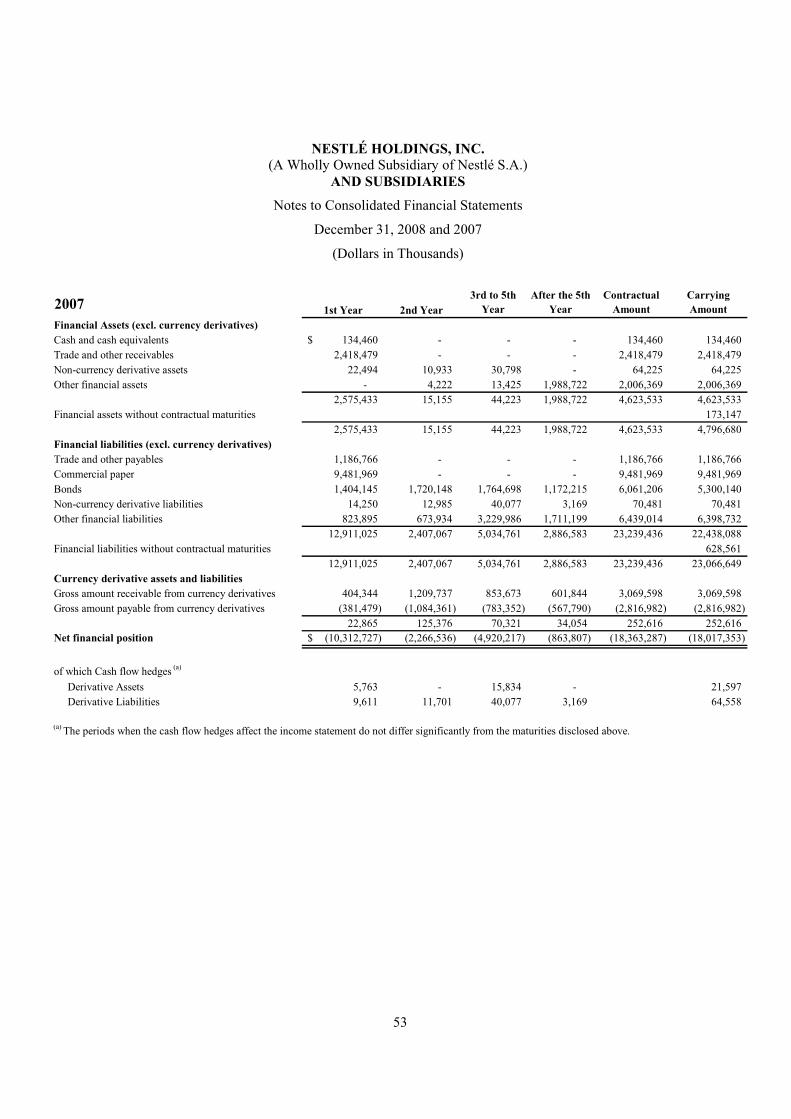
NESTLÉ HOLDINGS, INC. (A Wholly Owned Subsidiary of Nestlé S.A.)
AND SUBSIDIARIES
Notes to Consolidated Financial Statements
December 31, 2008 and 2007
(Dollars in Thousands)
53
2007 1st Year 2nd Year3rd to 5th
YearAfter the 5th
YearContractual
AmountCarrying Amount
Financial Assets (excl. currency derivatives)Cash and cash equivalents 134,460$ - - - 134,460 134,460
Trade and other receivables 2,418,479 - - - 2,418,479 2,418,479
Non-currency derivative assets 22,494 10,933 30,798 - 64,225 64,225
Other financial assets - 4,222 13,425 1,988,722 2,006,369 2,006,369
2,575,433 15,155 44,223 1,988,722 4,623,533 4,623,533
Financial assets without contractual maturities 173,147
2,575,433 15,155 44,223 1,988,722 4,623,533 4,796,680
Financial liabilities (excl. currency derivatives)Trade and other payables 1,186,766 - - - 1,186,766 1,186,766
Commercial paper 9,481,969 - - - 9,481,969 9,481,969
Bonds 1,404,145 1,720,148 1,764,698 1,172,215 6,061,206 5,300,140
Non-currency derivative liabilities 14,250 12,985 40,077 3,169 70,481 70,481
Other financial liabilities 823,895 673,934 3,229,986 1,711,199 6,439,014 6,398,732
12,911,025 2,407,067 5,034,761 2,886,583 23,239,436 22,438,088
Financial liabilities without contractual maturities 628,561
12,911,025 2,407,067 5,034,761 2,886,583 23,239,436 23,066,649
Currency derivative assets and liabilitiesGross amount receivable from currency derivatives 404,344 1,209,737 853,673 601,844 3,069,598 3,069,598
Gross amount payable from currency derivatives (381,479) (1,084,361) (783,352) (567,790) (2,816,982) (2,816,982)
22,865 125,376 70,321 34,054 252,616 252,616
Net financial position (10,312,727)$ (2,266,536) (4,920,217) (863,807) (18,363,287) (18,017,353)
of which Cash flow hedges(a)
Derivative Assets 5,763 - 15,834 - 21,597
Derivative Liabilities 9,611 11,701 40,077 3,169 64,558
(a)The periods when the cash flow hedges affect the income statement do not differ significantly from the maturities disclosed above.

NESTLÉ HOLDINGS, INC. (A Wholly Owned Subsidiary of Nestlé S.A.)
AND SUBSIDIARIES
Notes to Consolidated Financial Statements
December 31, 2008 and 2007
(Dollars in Thousands)
54
Market risk
The Company is exposed to risks from movements in foreign currency exchange rates, interest rates and market prices that affect its assets, liabilities and anticipated future transactions.
Foreign currency risk
Foreign currency risk management
The Company is exposed to foreign currency risk from transactions. Transaction exposure arises because the Company undertakes transactions in foreign currencies. Transactional exposures are managed within a prudent and systematic hedging policy in accordance with the Company’s specific business needs.
The Company’s objective is to manage its foreign currency exposure through the use of currency forwards, futures, swaps and options.
Financial instruments by currency
2008 USD CHF EUR GBP AUD Other TotalFinancial Assets (excl. currency derivatives)Cash and cash equivalents 138,842$ - - - - - 138,842
Trade and other receivables 3,105,638 - - - - 1,348 3,106,986
Non-currency derivative assets 132,336 - - - - - 132,336
Other financial assets 2,090,474 - - - - 18,317 2,108,791
5,467,290 - - - - 19,665 5,486,955
Financial liabilities (excl. currency derivatives)Trade and other payables 1,172,207 2,622 608 146 - 1,020 1,176,603
Commercial paper 7,292,455 - - - - - 7,292,455
Bonds 2,009,628 2,192,951 347,310 296,311 850,801 471,382 6,168,383
Non-currency derivative liabilities 282,439 - - - - - 282,439
Other financial liabilities 7,360,594 - - - - - 7,360,594
18,117,323 2,195,573 347,918 296,457 850,801 472,402 22,280,474
Currency derivative assets and liabilitiesGross amount receivable from currency derivatives - 2,234,222 360,684 302,076 892,211 566,869 4,356,062
Gross amount payable from currency derivatives (4,370,493) - - - - - (4,370,493)
(4,370,493) 2,234,222 360,684 302,076 892,211 566,869 (14,431)
Net financial position (17,020,526)$ 38,649 12,766 5,619 41,410 114,132 (16,807,950)
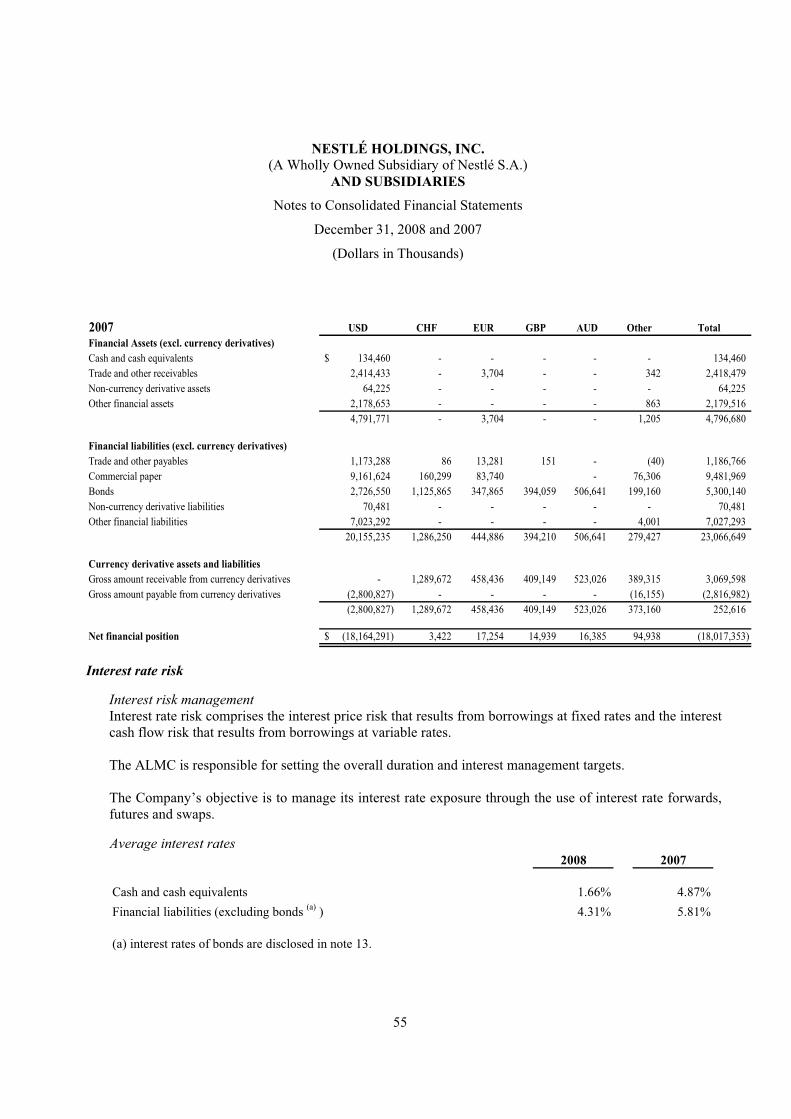
NESTLÉ HOLDINGS, INC. (A Wholly Owned Subsidiary of Nestlé S.A.)
AND SUBSIDIARIES
Notes to Consolidated Financial Statements
December 31, 2008 and 2007
(Dollars in Thousands)
55
2007 USD CHF EUR GBP AUD Other TotalFinancial Assets (excl. currency derivatives)Cash and cash equivalents 134,460$ - - - - - 134,460
Trade and other receivables 2,414,433 - 3,704 - - 342 2,418,479
Non-currency derivative assets 64,225 - - - - - 64,225
Other financial assets 2,178,653 - - - - 863 2,179,516
4,791,771 - 3,704 - - 1,205 4,796,680
Financial liabilities (excl. currency derivatives)Trade and other payables 1,173,288 86 13,281 151 - (40) 1,186,766
Commercial paper 9,161,624 160,299 83,740 - 76,306 9,481,969
Bonds 2,726,550 1,125,865 347,865 394,059 506,641 199,160 5,300,140
Non-currency derivative liabilities 70,481 - - - - - 70,481
Other financial liabilities 7,023,292 - - - - 4,001 7,027,293
20,155,235 1,286,250 444,886 394,210 506,641 279,427 23,066,649
Currency derivative assets and liabilitiesGross amount receivable from currency derivatives - 1,289,672 458,436 409,149 523,026 389,315 3,069,598
Gross amount payable from currency derivatives (2,800,827) - - - - (16,155) (2,816,982)
(2,800,827) 1,289,672 458,436 409,149 523,026 373,160 252,616
Net financial position (18,164,291)$ 3,422 17,254 14,939 16,385 94,938 (18,017,353)
Interest rate risk
Interest risk management
Interest rate risk comprises the interest price risk that results from borrowings at fixed rates and the interest cash flow risk that results from borrowings at variable rates.
The ALMC is responsible for setting the overall duration and interest management targets.
The Company’s objective is to manage its interest rate exposure through the use of interest rate forwards, futures and swaps.
Average interest rates
2008 2007
Cash and cash equivalents 1.66% 4.87%
Financial liabilities (excluding bonds (a)
) 4.31% 5.81%
(a) interest rates of bonds are disclosed in note 13.
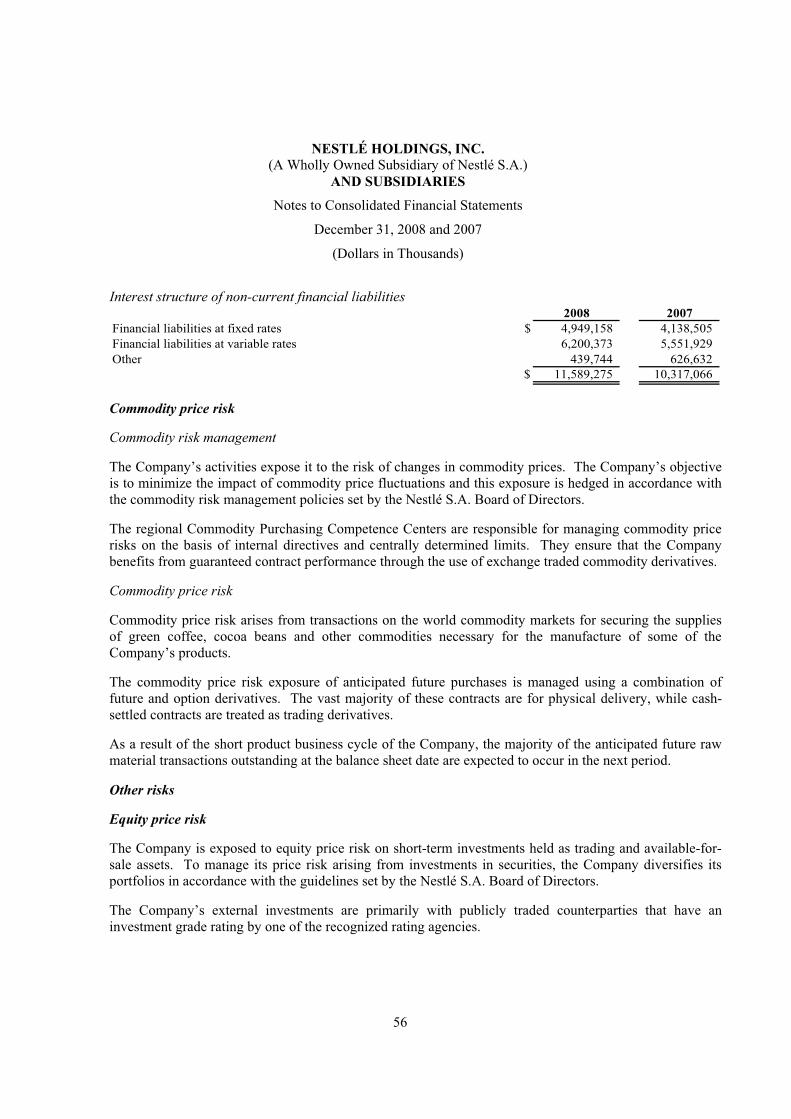
NESTLÉ HOLDINGS, INC. (A Wholly Owned Subsidiary of Nestlé S.A.)
AND SUBSIDIARIES
Notes to Consolidated Financial Statements
December 31, 2008 and 2007
(Dollars in Thousands)
56
Interest structure of non-current financial liabilities 2008 2007
Financial liabilities at fixed rates $ 4,949,158 4,138,505
Financial liabilities at variable rates 6,200,373 5,551,929
Other 439,744 626,632
$ 11,589,275 10,317,066
Commodity price risk
Commodity risk management
The Company’s activities expose it to the risk of changes in commodity prices. The Company’s objective is to minimize the impact of commodity price fluctuations and this exposure is hedged in accordance with the commodity risk management policies set by the Nestlé S.A. Board of Directors.
The regional Commodity Purchasing Competence Centers are responsible for managing commodity price risks on the basis of internal directives and centrally determined limits. They ensure that the Company benefits from guaranteed contract performance through the use of exchange traded commodity derivatives.
Commodity price risk
Commodity price risk arises from transactions on the world commodity markets for securing the supplies of green coffee, cocoa beans and other commodities necessary for the manufacture of some of the Company’s products.
The commodity price risk exposure of anticipated future purchases is managed using a combination of future and option derivatives. The vast majority of these contracts are for physical delivery, while cash-settled contracts are treated as trading derivatives.
As a result of the short product business cycle of the Company, the majority of the anticipated future raw material transactions outstanding at the balance sheet date are expected to occur in the next period.
Other risks
Equity price risk
The Company is exposed to equity price risk on short-term investments held as trading and available-for-sale assets. To manage its price risk arising from investments in securities, the Company diversifies its portfolios in accordance with the guidelines set by the Nestlé S.A. Board of Directors.
The Company’s external investments are primarily with publicly traded counterparties that have an investment grade rating by one of the recognized rating agencies.

NESTLÉ HOLDINGS, INC. (A Wholly Owned Subsidiary of Nestlé S.A.)
AND SUBSIDIARIES
Notes to Consolidated Financial Statements
December 31, 2008 and 2007
(Dollars in Thousands)
57
Settlement risk
Settlement risk results from the fact that the Company may not receive financial instruments from its counterparties at the expected time. This risk is managed by monitoring counterparty activity and settlement limits.
Value at risk (VaR)
Description of the method
The VaR is a single measure to assess market risk. The VaR estimates the size of losses given current positions and possible changes in financial markets. The Company uses historic simulation to calculate VaR based on the historic data for a 250 days period.
The VaR calculation is based on a 95% confidence level and, accordingly, does not take into account losses that might occur beyond this level of confidence.
The VaR is calculated on the basis of exposures outstanding at the close of business and does not necessarily reflect intra-day exposures.
Objective of the method
The Company uses the described VaR analysis to estimate the potential one-day loss in the fair value of its financial and commodity instruments.
The Company cannot predict the actual future movements in market rates and commodity prices, therefore the below VaR numbers neither represent actual losses nor consider the effects of favorable movements in underlying variables. Accordingly, these VaR numbers may only be considered indicative of future movements to the extent the historic market patterns repeat in the future.
VaR figures
The VaR computation includes the Company’s financial assets and liabilities that are subject to foreign currency, interest rate and commodity price risk.
The estimated potential one-day loss from the Company’s foreign currency and interest rate risk sensitive instruments combined, as calculated using the above described historic VaR model, are $30,805 and $8,835 for the years ended December 31, 2008 and 2007, respectively.
The estimated potential one-day loss from the Company’s commodity price risk sensitive instruments, as calculated using the above described historic VaR model, are $3,008 and $888 for the years ended December 31, 2008 and 2007, respectively.

NESTLÉ HOLDINGS, INC. (A Wholly Owned Subsidiary of Nestlé S.A.)
AND SUBSIDIARIES
Notes to Consolidated Financial Statements
December 31, 2008 and 2007
(Dollars in Thousands)
58
Capital Risk Management
The Company’s capital management strategy is to maintain a sound capital base to support the continued development of the Company’s operations, utilizing various funding sources available to it. Substantially all of the Company’s debt is guaranteed by Nestlé S.A. which allows the Company to borrow from third parties at lower interest rates. In order to ensure that the return on invested capital is optimized, the Company establishes strict limits on annual additions of property, plant and equipment.
(15) Assets held for sale
2008 2007Business units $ 12,904 285,652
Intangible assets 24,300 829,323
$ 37,204 1,114,975
Business units held for sale represent certain wholly owned foreign subsidiaries which the Company acquired ownership of in connection with the 2007 purchase of Gerber and the 2001 purchase of Ralston Purina and intends to sell or transfer to its respective foreign affiliated companies. In 2008, Gerber Finance Company, an indirect subsidiary of the Company, sold 100% of the shares in the Polish company Alima-Gerber S.A. to Nestlé Polska S.A., a related party, for a sales price of $70,817 and recorded a gain of $38,721 related to this sale. In 2008, Gerber Finance Company also sold 100% of the shares in Gerber Holdings de Mexico, S.A. De C.V. to Marcas Nestlé S.A. De C.V., a related party, for a sales price of $193,603 and recorded a loss of $34,521 related to this sale. Additionally, Gerber Products Company, a direct subsidiary of the Company, sold 100% of the shares of Gerber Products Company of Puerto Rico, Inc. in 2008 to Nestlé Puerto Rico, a related party, for a sales price of $12,432 and recorded a gain of $3,528 related to this sale. As of December 31, 2008, the Company was actively engaged in and progressing with the sale, transfer and liquidation of the remaining subsidiaries and expects their disposition will be completed in 2009.
Intangible assets held for sale at December 31, 2008 consist of intellectual property of $24,300 acquired in the 2007 purchase of Novartis Nutrition Corporation. This intellectual property was sold to Nestlé S.A. on January 1, 2009 (note 25). At December 31, 2007, intangible assets held for sale primarily represented intellectual property acquired in the Gerber acquisition of $827,418. Substantially all of the intellectual property for Gerber was sold to Nestlé S.A. in 2008 for a sales price of $839,123. The Company recorded a gain of $14,098 related to this sale.

NESTLÉ HOLDINGS, INC. (A Wholly Owned Subsidiary of Nestlé S.A.)
AND SUBSIDIARIES
Notes to Consolidated Financial Statements
December 31, 2008 and 2007
(Dollars in Thousands)
59
(16) Accruals
Accruals are as follows:
2008 2007
Accrued trade spend and promotional expenses $ 327,785 280,506 Accrued payroll 500,272 377,014 Accrued interest 168,298 163,589 Accrued life insurance policy reserves 110,869 141,904 Accrued defined contribution expense (note 8) 22,076 23,252 Other accrued expenses 308,765 306,356
$ 1,438,065 1,292,621
(17) Provisions
Provisions are as follows:
Restructuring Environmental Other Total
December 31, 2007 $ 52,441 29,704 97,084 179,229
Provisions made in the period 22,185 – 23,256 45,441 Amounts used (23,627) (4,073) (23,525) (51,225)
Unused amounts reversed (7,759) (19) (16,072) (23,850)
Acquisitions – – 854 854
Other 4,845 – (4,074) 771
December 31, 2008 $ 48,085 25,612 77,523 151,220
Restructuring
During the fourth quarter of 2007, the Company announced several initiatives to reorganize its Infant Nutrition business and consolidate the Infant Nutrition operations previously located in Glendale, California into the newly acquired Gerber business. The functions previously performed in California were relocated to New Jersey. As part of these actions, restructuring provisions of $5,331 and $11,395 for related severance pay and other costs were recorded in 2008 and 2007, respectively, of which $9,666 and $1,282 was paid out in 2008 and 2007, respectively. The remaining balance is expected to be utilized during 2009.
Additionally, headcount reductions in both the HealthCare Nutrition and Ice Cream businesses resulted in restructuring charges of $1,749 and $5,708, respectively, in 2008 and $3,350 and $1,256, respectively, in 2007, of which $2,225 of the Healthcare Nutrition provisions were utilized in 2008 and $2,408 and $314 of the Ice Cream provisions were utilized in 2008 and 2007, respectively. Headcount reductions in the Nestlé

NESTLÉ HOLDINGS, INC. (A Wholly Owned Subsidiary of Nestlé S.A.)
AND SUBSIDIARIES
Notes to Consolidated Financial Statements
December 31, 2008 and 2007
(Dollars in Thousands)
60
USA Brands sales division in 2008 resulted in restructuring charges of $9,399, of which $5,125 was utilized. The remaining balance is expected to be utilized over the next several years.
During 2008 and 2007, the Company used $697 and $1,960, respectively of its restructure severance reserves related to the consolidation of its PetCare operations in St. Louis, Missouri. The remaining balance is expected to be paid out in the next three to four years.
In early 2006, the Company announced plans to consolidate the Hand Held Foods group’s sales broker network into the Nestlé sales organization and combine certain back office functions with the Prepared Foods group. An $8,400 restructure provision was established, of which $372 and $1,539 was utilized in 2008 and 2007, respectively.
In August 2006, the Company announced the intended move of the Power Bar business to the headquarters location of Nestlé USA. The Company recorded a $5,900 restructure reserve in 2006 for the move and utilized $97 and $3,750 of it in 2008 and 2007, respectively.
During 2005, the Company recorded a restructure provision of $15,355 related to various outsourcing and reorganization plans involving Corporate, Human Resources, Finance and Control and other business areas. Additional reserves of $3,900 were established in 2007. These reserves were reduced by $1,518 and $2,341 in payments in 2008 and 2007, respectively. The remainder is expected to be utilized within the next two years.
In 2005, the Company announced the discontinuance of operations at three confectionary manufacturing facilities and recorded a restructure provision of $8,111 for related severance pay, of which $1,059 and $397 was used in 2008 and 2007, respectively, and the remainder is expected to be utilized within the next year. The plants were closed in 2006.
Other Provisions
The Company has obligations under the terms of an onerous distribution agreement (“Drayage Agreement”) required by the U.S. Federal Trade Commission (FTC) as a condition of the closure of the Dreyer’s Nestlé merger in 2003. The Company paid out $13,155 in 2006 and recognized $1,914 in additional provision in 2006 related to the unwind of the discount as the contract extends out to 2008. In 2008 and 2007, the Company reversed $10,024 and $4,901, respectively, of the obligation. No obligation remains at December 31, 2008.
In 2008, the Company recorded a provision mainly related to a settlement supervised by the U.S. Department of Labor resulting in the Company compensating hourly employees at certain manufacturing facilities for time spent at the workplace on activities conducted both pre-shift and post-shift. The Company paid out $6,355 in 2008 related to this matter.
The remainder of other provisions is comprised primarily of costs related to closed facilities, non-cancelable lease agreements for warehouse and office facilities that the Company ceased to use and a provision to reflect rent expense on certain operating leases, which expire through 2013, on a straight-line basis through their expiration dates.
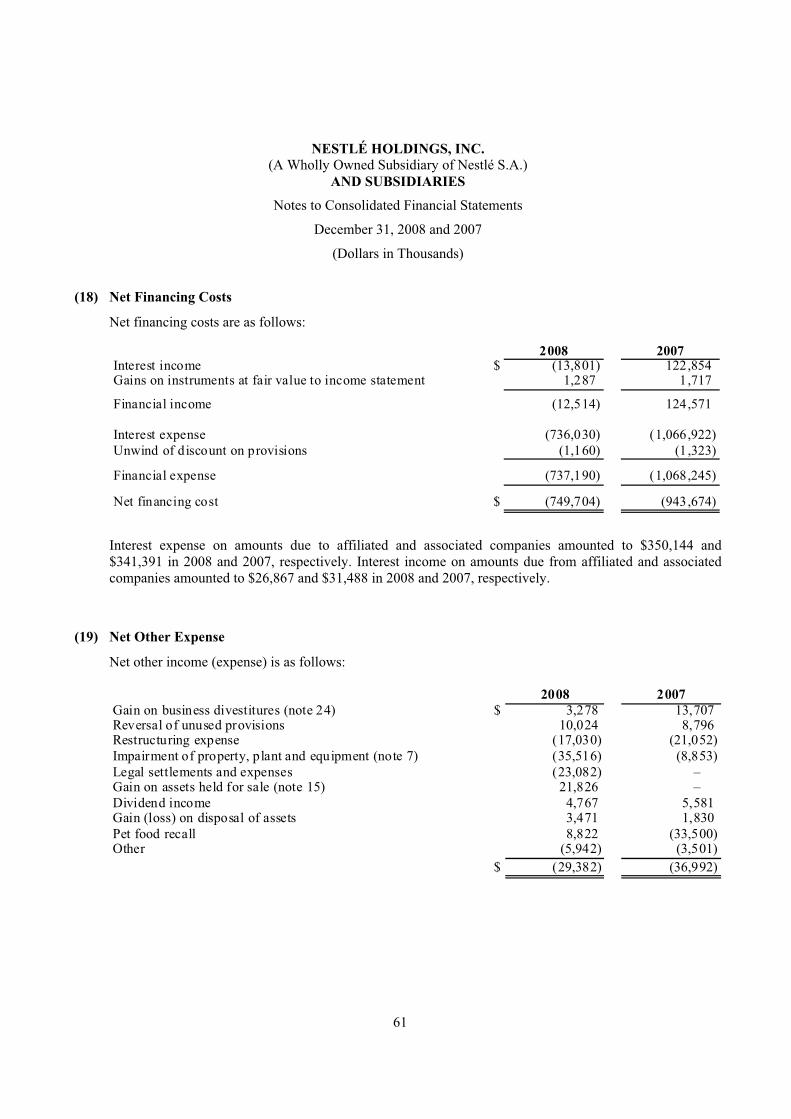
NESTLÉ HOLDINGS, INC. (A Wholly Owned Subsidiary of Nestlé S.A.)
AND SUBSIDIARIES
Notes to Consolidated Financial Statements
December 31, 2008 and 2007
(Dollars in Thousands)
61
(18) Net Financing Costs
Net financing costs are as follows:
2008 2007Interest income $ (13,801) 122,854Gains on instruments at fair value to income statement 1,287 1,717
Financial income (12,514) 124,571
Interest expense (736,030) (1,066,922)
Unwind of discount on provisions (1,160) (1,323)
Financial expense (737,190) (1,068,245)
Net financing cost $ (749,704) (943,674)
Interest expense on amounts due to affiliated and associated companies amounted to $350,144 and $341,391 in 2008 and 2007, respectively. Interest income on amounts due from affiliated and associated companies amounted to $26,867 and $31,488 in 2008 and 2007, respectively.
(19) Net Other Expense
Net other income (expense) is as follows:
2008 2007Gain on business divestitures (note 24) $ 3,278 13,707 Reversal of unused provisions 10,024 8,796 Restructuring expense (17,030) (21,052)Impairment of property, plant and equipment (note 7) (35,516) (8,853)
Legal settlements and expenses (23,082) – Gain on assets held for sale (note 15) 21,826 – Dividend income 4,767 5,581 Gain (loss) on disposal of assets 3,471 1,830
Pet food recall 8,822 (33,500)Other (5,942) (3,501)
$ (29,382) (36,992)
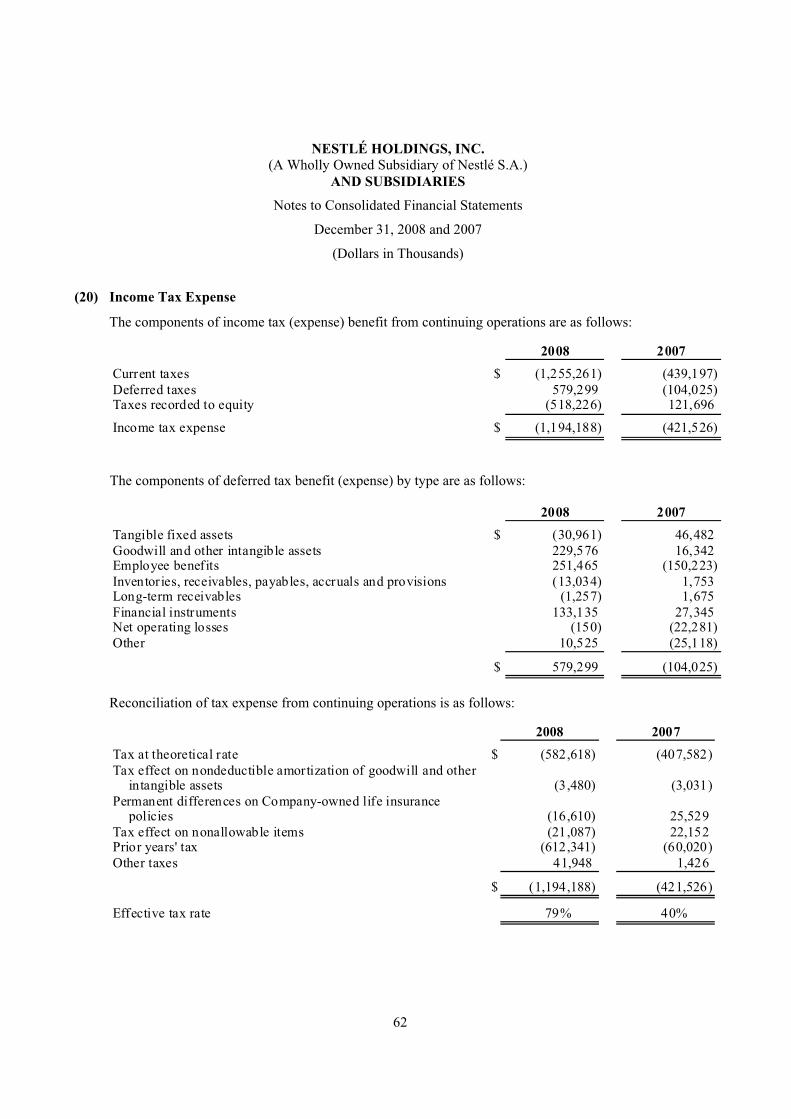
NESTLÉ HOLDINGS, INC. (A Wholly Owned Subsidiary of Nestlé S.A.)
AND SUBSIDIARIES
Notes to Consolidated Financial Statements
December 31, 2008 and 2007
(Dollars in Thousands)
62
(20) Income Tax Expense
The components of income tax (expense) benefit from continuing operations are as follows:
2008 2007
Current taxes $ (1,255,261) (439,197)
Deferred taxes 579,299 (104,025)Taxes recorded to equity (518,226) 121,696
Income tax expense $ (1,194,188) (421,526)
The components of deferred tax benefit (expense) by type are as follows:
2008 2007
Tangible fixed assets $ (30,961) 46,482 Goodwill and other intangible assets 229,576 16,342 Employee benefits 251,465 (150,223)
Inventories, receivables, payables, accruals and provisions (13,034) 1,753 Long-term receivables (1,257) 1,675
Financial instruments 133,135 27,345 Net operating losses (150) (22,281)Other 10,525 (25,118)
$ 579,299 (104,025)
Reconciliation of tax expense from continuing operations is as follows:
2008 2007
Tax at theoretical rate $ (582,618) (407,582)
Tax effect on nondeductible amortization of goodwill and otherintangible assets (3,480) (3,031)
Permanent differences on Company-owned life insurancepolicies (16,610) 25,529
Tax effect on nonallowable items (21,087) 22,152 Prior years' tax (612,341) (60,020)Other taxes 41,948 1,426
$ (1,194,188) (421,526)
Effective tax rate 79% 40%
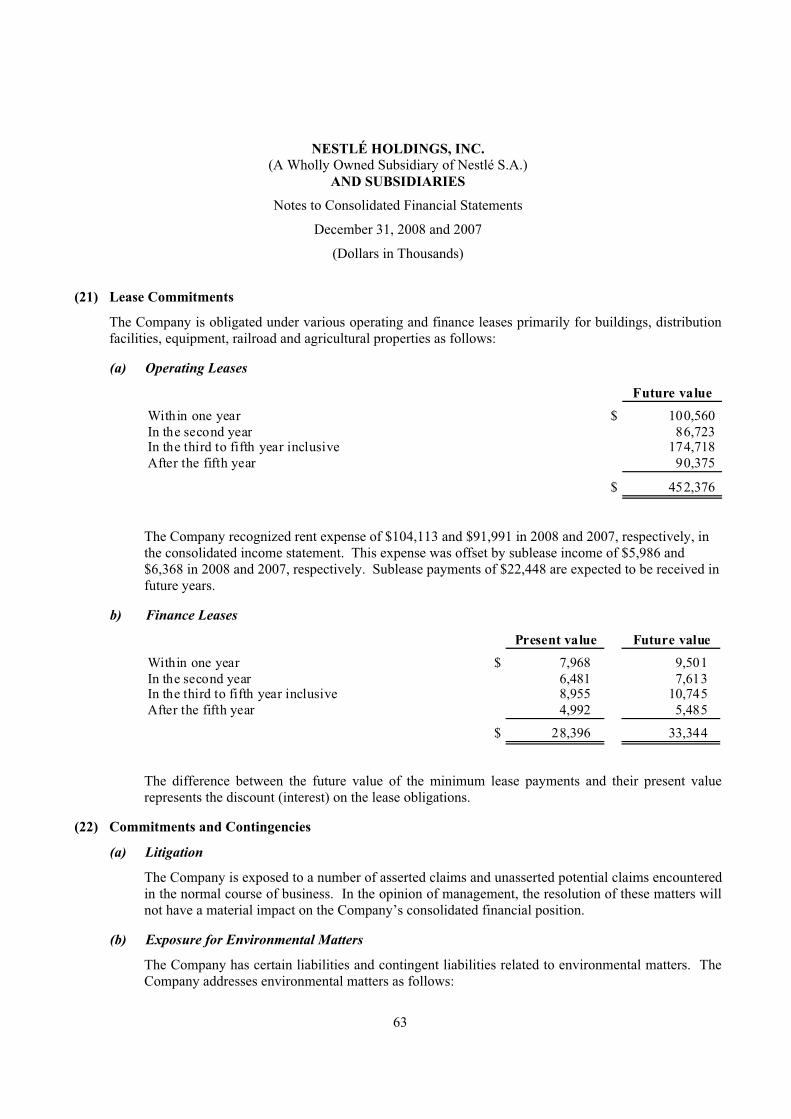
NESTLÉ HOLDINGS, INC. (A Wholly Owned Subsidiary of Nestlé S.A.)
AND SUBSIDIARIES
Notes to Consolidated Financial Statements
December 31, 2008 and 2007
(Dollars in Thousands)
63
(21) Lease Commitments
The Company is obligated under various operating and finance leases primarily for buildings, distribution facilities, equipment, railroad and agricultural properties as follows:
(a) Operating Leases
Future value
Within one year $ 100,560 In the second year 86,723 In the third to fifth year inclusive 174,718 After the fifth year 90,375
$ 452,376
The Company recognized rent expense of $104,113 and $91,991 in 2008 and 2007, respectively, in the consolidated income statement. This expense was offset by sublease income of $5,986 and $6,368 in 2008 and 2007, respectively. Sublease payments of $22,448 are expected to be received in future years.
b) Finance Leases
Present value Future value
Within one year $ 7,968 9,501 In the second year 6,481 7,613 In the third to fifth year inclusive 8,955 10,745 After the fifth year 4,992 5,485
$ 28,396 33,344
The difference between the future value of the minimum lease payments and their present value represents the discount (interest) on the lease obligations.
(22) Commitments and Contingencies
(a) Litigation
The Company is exposed to a number of asserted claims and unasserted potential claims encountered in the normal course of business. In the opinion of management, the resolution of these matters will not have a material impact on the Company’s consolidated financial position.
(b) Exposure for Environmental Matters
The Company has certain liabilities and contingent liabilities related to environmental matters. The Company addresses environmental matters as follows:

NESTLÉ HOLDINGS, INC. (A Wholly Owned Subsidiary of Nestlé S.A.)
AND SUBSIDIARIES
Notes to Consolidated Financial Statements
December 31, 2008 and 2007
(Dollars in Thousands)
64
(i) Situations where the Company is found liable for remediation or cleanup efforts by the U.S. Environmental Protection Agency (“EPA”) or other governmental agencies on specific sites represent known liabilities. In these instances, it is the Company’s policy to accrue for environmental cleanup costs when they are assessed. As assessments and cleanups proceed, these liabilities are reviewed and adjusted as additional information becomes available regarding the nature and extent of contamination, methods of remediation required, other actions by governmental agencies or private parties, and the amount, if any, of available coverage by the Company’s insurance carriers.
(ii) The Company has also received “Notices of Potential Liability” from, or has been identified as a “Potentially Responsible Party” by the EPA or other government agencies regarding the alleged disposal of hazardous material at various sites around the country that allegedly require environmental cleanup. These represent contingent liabilities.
These proceedings are being vigorously defended or resolutions are being negotiated. Although the outcome of these proceedings is unknown, management does not believe that any resulting liability would be material to the consolidated financial position of the Company.
(c) Commitments for Expenditures on Property, Plant, and Equipment
The Company was committed to expenditures on property, plant, and equipment of $137,153 and $80,040 at December 31, 2008 and December 31, 2007, respectively (note 7).
(23) Business Acquisitions and Divestitures
a) Acquisitions
2008
In April 2008, the Company acquired the net assets of certain local franchise operations of Jenny Craig Holdings, Inc. for $4,334, resulting in goodwill of $4,118 at the date of acquisition. Net sales and net income for the period are not significantly impacted by this acquisition.
2007
Novartis Nutrition Corporation
Effective July 1, 2007, the Company acquired the net assets of Novartis Nutrition Corporation for $506,118 in cash which was accounted for using the purchase method of accounting in accordance with IFRS 3 (revised 2005), Business Combinations. The fair value of the identifiable net assets acquired was $209,273, resulting in goodwill of $296,845 at the acquisition date, including direct costs of acquisition. In 2008, the Company recorded purchase accounting adjustments which increased the value of the goodwill by $18,007. Novartis Nutrition Corporation is a leading manufacturer and supplier of medical products to consumers and patients.

NESTLÉ HOLDINGS, INC. (A Wholly Owned Subsidiary of Nestlé S.A.)
AND SUBSIDIARIES
Notes to Consolidated Financial Statements
December 31, 2008 and 2007
(Dollars in Thousands)
65
Gerber
Effective September 1, 2007, the Company acquired 100% of the U.S. operations of Gerber Products Company, Gerber Finance Company and their related foreign subsidiaries as well as Gerber Life Insurance Company for $4,804,948 in cash which was accounted for using the purchase method of accounting in accordance with IFRS 3 (revised 2005), Business Combinations. The fair value of the identifiable net assets acquired was $1,615,417, resulting in goodwill of $3,189,531 at the acquisition date, including direct costs of acquisition. In 2008, the Company recorded purchase accounting adjustments which increased the value of the goodwill by $9,187. Gerber, founded in 1928, is a leading manufacturer and marketer of infant food and infant related products and juvenile insurance.
The net (loss) income of Novartis Nutrition Corporation and Gerber included in the consolidated income statement for the year ended December 31, 2007 is $(15,259) and $5,821, respectively. The Company’s net sales and net income for the year ended December 31, 2007 would have been $19,624,733 and $740,497, respectively, if the acquisitions had been effective January 1, 2007.
b) Divestitures
2008
Albers
Effective October 1, 2008, the Company sold the Albers corn meal and grits products business for $4,950. The Company recorded a gain on sale of $3,942 related to this divestiture (note 19).
Stixx and Treasures
Effective December 1, 2008, the Company sold the Stixx and Treasures confections product lines for $2,500. The Company recorded a gain of $319 related to this divestiture (note 19).
Baby Care Accessories
Effective December 31, 2008, the Company sold the Baby Care Accessories division for $33,361. The division, which sold baby bottles, nipples, cups, eating utensils and breastfeeding products, was acquired in connection with the 2007 purchase of Gerber. The Company recorded a loss of $983 related to this divestiture.
2007
Turtles
Effective June 1, 2007, the Company sold the U.S. Turtles business for $18,188. The Company recorded a gain of $13,707 related to this divestiture (note 19).

NESTLÉ HOLDINGS, INC. (A Wholly Owned Subsidiary of Nestlé S.A.)
AND SUBSIDIARIES
Notes to Consolidated Financial Statements
December 31, 2008 and 2007
(Dollars in Thousands)
66
(24) Notes to the Consolidated Statement of Cash Flows
a) Acquisitions
The Company’s fair value of assets and liabilities acquired during 2008 and 2007 are summarized below:
2008 2007Cash $ - 13,469
Trade and other receivables 48 342,380
Inventories 184 275,486
Prepaids 19 5,203
Current financial assets (i) (4,532) 253,333
Property, plant and equipment (8,025) 258,008
Deferred tax assets 7,708 51,805
Long term financial assets (22,485) 1,224,572
Other non-current assets 9,387 16,446
Goodwill (note 11) 32,512 3,437,370
Intangible assets (i) 4,633 1,223,595
Trade and other payables 497 (120,035)
Accrued liabilities 736 (320,587)
Current financial liabilities 106,316 (4,254)
Non-current financial liabilities (1,305) (57,103)
Deferred tax liabilities (2,570) (582,703)
Provisions (854) (5,880)
Other accrued liabilities 364 (834,501)
Total acquisition cost 122,633 5,176,604
Cash acquired - (13,469)
Cash outflow for acquisition $ 122,633 5,163,135
(i) Current financial assets primarily represent certain wholly owned foreign subsidiaries which the Company acquired with the intent to sell or transfer to its respective foreign affiliated companies. This balance, plus activity subsequent to the acquisition date, was included in assets held for sale at December 31, 2007 (note 15). Additionally, intangible assets of $21,907 and $827,418 (notes 12 and 15) were reclassified to assets held for sale as of December 31, 2008 and 2007, respectively, in accordance with IFRS 3.
The carrying amounts of assets and liabilities determined in accordance with IFRS immediately before the combination do not differ significantly from those disclosed above except for internally generated intangible assets, goodwill and the related deferred tax balances.

NESTLÉ HOLDINGS, INC. (A Wholly Owned Subsidiary of Nestlé S.A.)
AND SUBSIDIARIES
Notes to Consolidated Financial Statements
December 31, 2008 and 2007
(Dollars in Thousands)
67
Divestitures
The Company’s book value of assets and liabilities divested in 2008 and 2007 is summarized below.
2008 2007Inventories $ 14,776 3,481 Property , plant and equipment 15,796 – Trade and other payables 4,212 – Accrued liabilities 2,787 – Other accrued liabilities (38) 1,000
Net book value 37,533 4,481
Gain from divestitures, net (note 19) 3,278 13,707
Cash inf low from business divestitures $ 40,811 18,188
(25) Events after the Balance Sheet Date
Other than the following, the Company was not aware of specific events or transactions occurring after December 31, 2008, and up to the issue date that would have a material impact on the presentation of the accompanying consolidated financial statements.
The following Eurobonds were issued under the U.S. Debt Issuance Program:
Issue Date Coupon Maturity
1/28/2009 USD 150,000 2.000% 1/28/2013
3/20/2009 USD 125,000 2.000%(a)
1/28/2013
Face value
(a) Subject to an interest rate swap that creates a USD liability at floating rates.
On January 1, 2009, Nestlé Healthcare Nutrition, Inc. sold certain intellectual property to Nestlé SA, for an estimated sale price of $30,100. The carrying amount of $24,300 is included in assets held for sale in the December 31, 2008 consolidated balance sheet (note 15).
On January 12, 2009, Dreyer’s Grand Ice Cream, Inc. announced that it will stop production at its manufacturing facility in Houston, Texas by the beginning of April 2009. A restructuring provision of $8,400 was recorded in January, 2009. The Company recorded an impairment of $27,050 for the fixed assets associated with the closure in December 2008.
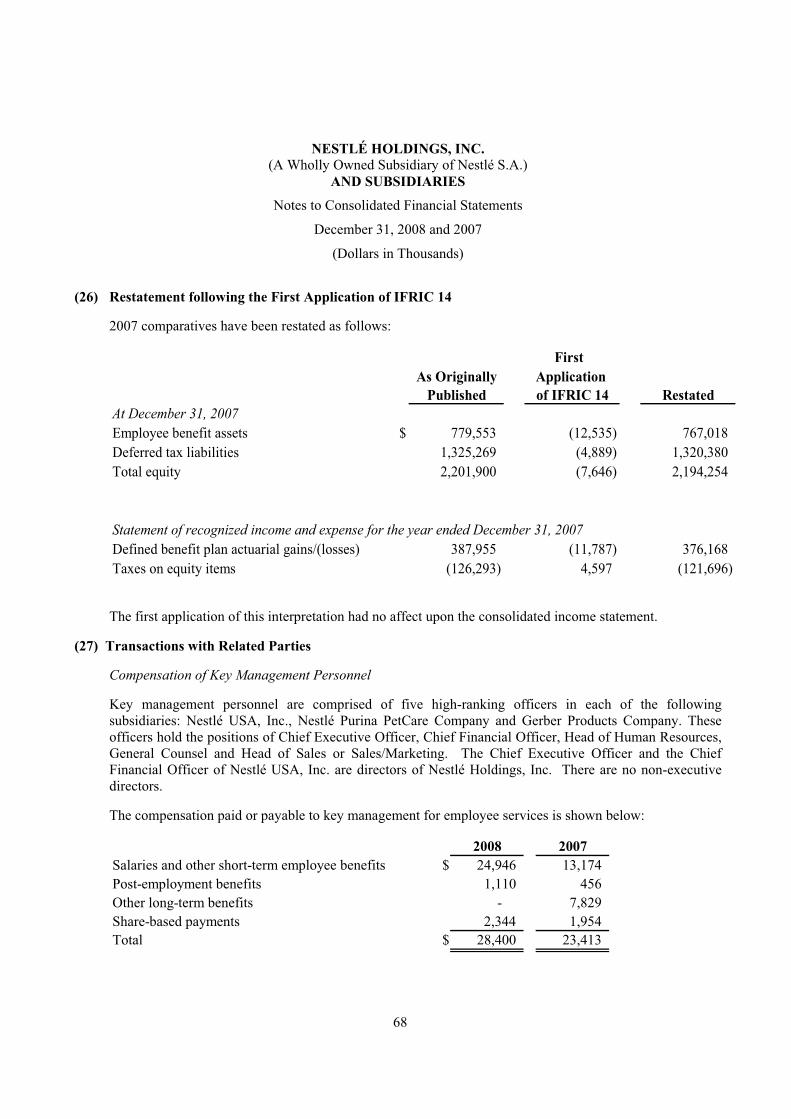
NESTLÉ HOLDINGS, INC. (A Wholly Owned Subsidiary of Nestlé S.A.)
AND SUBSIDIARIES
Notes to Consolidated Financial Statements
December 31, 2008 and 2007
(Dollars in Thousands)
68
(26) Restatement following the First Application of IFRIC 14
2007 comparatives have been restated as follows:
First As Originally Application
Published of IFRIC 14 RestatedAt December 31, 2007
Employee benefit assets $ 779,553 (12,535) 767,018
Deferred tax liabilities 1,325,269 (4,889) 1,320,380
Total equity 2,201,900 (7,646) 2,194,254
Statement of recognized income and expense for the year ended December 31, 2007
Defined benefit plan actuarial gains/(losses) 387,955 (11,787) 376,168
Taxes on equity items (126,293) 4,597 (121,696)
The first application of this interpretation had no affect upon the consolidated income statement.
(27) Transactions with Related Parties
Compensation of Key Management Personnel
Key management personnel are comprised of five high-ranking officers in each of the following subsidiaries: Nestlé USA, Inc., Nestlé Purina PetCare Company and Gerber Products Company. These officers hold the positions of Chief Executive Officer, Chief Financial Officer, Head of Human Resources, General Counsel and Head of Sales or Sales/Marketing. The Chief Executive Officer and the Chief Financial Officer of Nestlé USA, Inc. are directors of Nestlé Holdings, Inc. There are no non-executive directors.
The compensation paid or payable to key management for employee services is shown below:
2008 2007Salaries and other short-term employee benefits $ 24,946 13,174
Post-employment benefits 1,110 456
Other long-term benefits - 7,829
Share-based payments 2,344 1,954
Total $ 28,400 23,413
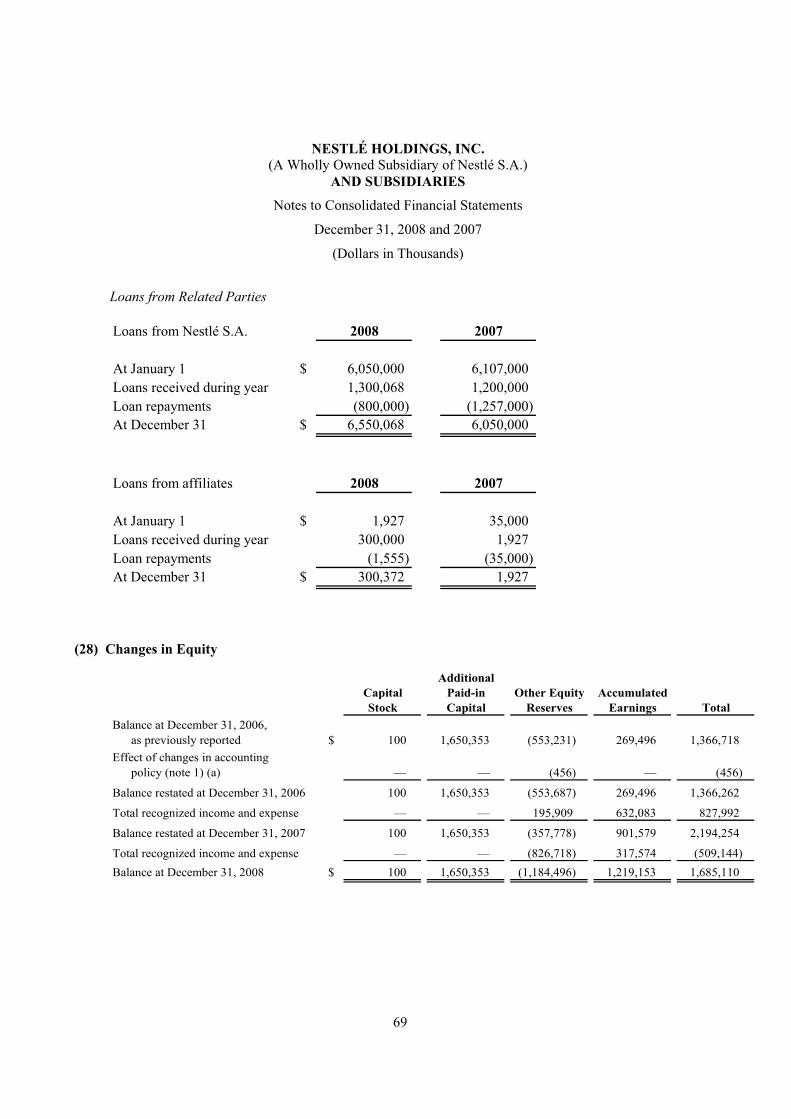
NESTLÉ HOLDINGS, INC. (A Wholly Owned Subsidiary of Nestlé S.A.)
AND SUBSIDIARIES
Notes to Consolidated Financial Statements
December 31, 2008 and 2007
(Dollars in Thousands)
69
Loans from Related Parties
Loans from Nestlé S.A. 2008 2007
At January 1 $ 6,050,000 6,107,000
Loans received during year 1,300,068 1,200,000
Loan repayments (800,000) (1,257,000)
At December 31 $ 6,550,068 6,050,000
Loans from affiliates 2008 2007
At January 1 $ 1,927 35,000
Loans received during year 300,000 1,927
Loan repayments (1,555) (35,000)
At December 31 $ 300,372 1,927
(28) Changes in Equity
AdditionalCapital Paid-in Other Equity AccumulatedStock Capital Reserves Earnings Total
Balance at December 31, 2006,
as previously reported $ 100 1,650,353 (553,231) 269,496 1,366,718
Effect of changes in accounting
policy (note 1) (a) — — (456) — (456)
Balance restated at December 31, 2006 100 1,650,353 (553,687) 269,496 1,366,262
Total recognized income and expense — — 195,909 632,083 827,992
Balance restated at December 31, 2007 100 1,650,353 (357,778) 901,579 2,194,254
Total recognized income and expense — — (826,718) 317,574 (509,144)
Balance at December 31, 2008 $ 100 1,650,353 (1,184,496) 1,219,153 1,685,110


![Nestlé Nigeria - Cowryassetcowryasset.com/cowry_admin/reports_archives/reports[211].pdf · Nestle Nigeria Plc Posts Average FY 2018 Performance… Nestle Nigeria Plc (NESTLE _) recorded](https://static.fdocuments.us/doc/165x107/5e3411afeb10c4350f24992f/nestl-nigeria-211pdf-nestle-nigeria-plc-posts-average-fy-2018-performance.jpg)