Nestlé Group 2013 identity card 2013 en.pdf · Analysis of sales, ... Contact Media ... We have...
12
Nestlé Group 2013
Transcript of Nestlé Group 2013 identity card 2013 en.pdf · Analysis of sales, ... Contact Media ... We have...

Nestlé Group 2013

ResultsSales
Trading operating profit
as % of sales
Profit for the year attributable to shareholders of the parent (Net profit)
as % of sales
Balance sheet and Cash flow statementEquity attributable to shareholders of the parent
before proposed appropriation of profit of Nestlé S.A.
Net financial debt
Ratio of net financial debt to equity (gearing)
Operating cash flow
Free cash flow (a)
Capital expenditure
as % of sales
Key figures (consolidated)
In millions of CHF (except for data per share) 2013
92 158
14 047
15.2%
10 015
10.9%
62 575
14 690
23.5%
14 992
10 486
4 928
5.3%
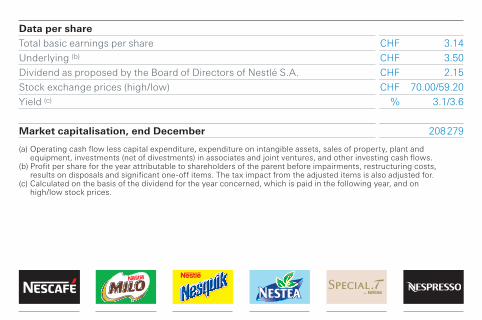
Data per shareTotal basic earnings per share
Underlying (b)
Dividend as proposed by the Board of Directors of Nestlé S.A.
Stock exchange prices (high/low)
Yield (c)
Market capitalisation, end December
(a) Operating cash flow less capital expenditure, expenditure on intangible assets, sales of property, plant and equipment, investments (net of divestments) in associates and joint ventures, and other investing cash flows.
(b) Profit per share for the year attributable to shareholders of the parent before impairments, restructuring costs, results on disposals and significant one-off items. The tax impact from the adjusted items is also adjusted for.
(c) Calculated on the basis of the dividend for the year concerned, which is paid in the following year, and on high/low stock prices.
3.14
3.50
2.15
70.00/59.20
3.1/3.6
208 279
CHF
CHF
CHF
CHF
%

Analysis of sales, trading operating profit and organic growth (OG)
By operating segment
In millions of CHF
Zone Europe
Zone Americas
Zone Asia, Oceania and Africa
Nestlé Waters
Nestlé Nutrition
Other (a)
Unallocated items (b)
Total Group
OG
0.8%
5.3%
5.6%
2.0%
8.2%
5.4%
4.6%
Trading
operatingprofit
2 331
5 151
3 558
680
1 961
2 175
(1 809)
14 047
Sales
15 568
28 375
18 859
7 231
9 826
12 299
92 158

By product
In millions of CHF
Powdered and Liquid Beverages
Water
Milk products and Ice cream
Nutrition and HealthCare
Prepared dishes and cooking aids
Confectionery
PetCare
Unallocated items (b)
Total Group
(a) Mainly Nespresso, Nestlé Professional and Nestlé Health Science.(b) Mainly corporate expenses as well as research and development costs.
OG
4.6%
1.8%
5.8%
7.6%
0.3%
5.0%
6.8%
4.6%
Trading
operatingprofit
4 649
678
2 632
2 228
1 876
1 630
2 163
(1 809)
14 047
Sales
20 495
6 773
17 357
11 840
14 171
10 283
11 239
92 158

www.nestle.com
Contact
MediaNestlé S.A.Corporate Media RelationsAvenue Nestlé 55 CH-1800 Vevey (Switzerland)Tel. +41 (0)21 924 22 00Fax +41 (0)21 922 63 [email protected]
InvestorsNestlé S.A. Investor RelationsAvenue Nestlé 55 CH-1800 Vevey (Switzerland)Tel. +41 (0)21 924 35 09Fax +41 (0)21 924 28 [email protected]
ShareholdersShare register: registrations, transfers, address changes, dividends, etc.Nestlé S.A.Share Transfer OfficeZugerstrasse 8 CH-6330 Cham (Switzerland)Tel. +41 (0)41 785 20 20Fax +41 (0)41 785 20 [email protected]

Company profileNestlé has sold its products in 196 countries, has 447 factories in 86 countries
and 333 000 employees.
Employees by geographic area
Europe*
Americas
Asia, Oceania and Africa
Total
* 10 175 employees in Switzerland in 2013.
Factories by geographic area
Europe
Americas
Asia, Oceania and Africa
Total
2013
140
164
143
447
2013
28.0%
32.5%
39.5%
100.0%

1866 Foundation of Anglo-Swiss Condensed Milk Co.
1867 Henri Nestlé’s Infant cereal developed
1905 Nestlé and Anglo-Swiss Condensed Milk Co. (new name after merger)
1929 Merger with Peter, Cailler, Kohler Chocolats Suisses S.A.
1934 Launch of Milo
1938 Launch of Nescafé
1947 Nestlé Alimentana S.A. (new name after merger with Maggi)
1948 Launch of Nestea and Nesquik
1969 Vittel (initially equity interest only)
1971 Merger with Ursina-Franck
1973 Stouffer (with Lean Cuisine)
1974 L’Oréal (associate)
The Nestlé Story – all the way to Nutrition, Health and Wellness
1977 Nestlé S.A. (new name), Alcon (disposed in August 2010)
1981 Galderma (joint venture with L’Oréal – full acquisition announced for 2014)
1985 Carnation (with Coffee-mate and Friskies)
1986 Creation of Nestlé Nespresso S.A. and Herta
1988 Buitoni-Perugina and Rowntree (with KitKat)
1990 Cereal Partners Worldwide (joint venture with General Mills)
1991 Beverage Partners Worldwide (joint venture with Coca-Cola)
1992 Perrier (with Poland Spring)
1993 Creation of Nestlé Sources Internationales (2002: Nestlé Waters)
1997 Creation of Nutrition Strategic Business Division (2006: Nestlé Nutrition)
1998 Sanpellegrino and Spillers Petfoods, Launch of Nestlé Pure Life
2000 PowerBar (disposal announced for 2014)
2001 Ralston Purina

2002 Schöller, Chef America and Dairy Partners Americas (joint venture with Fonterra)
Laboratoires innéov (joint venture with L’Oréal)
2003 Mövenpick and Dreyer’s
2005 Wagner
2006 Creation of FoodServices Strategic Business Division (2009: Nestlé Professional)
Lactalis Nestlé Produits Frais (associate)
Jenny Craig (disposed in 2013), Uncle Tobys and Delta Ice Cream
2007 Novartis Medical Nutrition, Gerber, Henniez
2008 Ruzanna
2010 Kraft Food’s frozen pizza, Waggin’Train, Malher, Technocom and Vitaflo
2011 Creation of Nestlé Health Science and Nestlé Institute of Health Sciences
Yinlu, Hsu Fu Chi (partnerships)
2012 Wyeth Nutrition
2013 Pamlab

Our ambitionNestlé’s ambition is to enhance the quality of consumer’s lives through nutrition, health and
wellness. We offer healthier and tastier choices throughout all stages of a consumer’s life and
at any time of the day. Based on science and Research and Development, we permanently
innovate our portfolio of food and beverages.
We have reinforced this strategy by extending the boundaries of nutrition with Nestlé Health
Science, enabling us to develop nutritional solutions based on science to help prevent and treat
various health conditions. With the recent setting up of Nestlé Skin Health, we are extending the
boundaries of health and wellness further, into the field of specialised medical skin treatment.
It is our firm belief that for a company to be successful over time, and create value for its
shareholders, it must also create value for society. We call this “Creating Shared Value”. Built on
strong foundations of compliance and sustainable business practices, this is our way of doing
business and of being the trusted leader in Nutrition, Health and Wellness.

The Nestlé Roadmap toGood Food, Good Life
In recent years the Nestlé
4x4x4 Roadmap has helped us
build both a strong alignment
within our Company and
a deep understanding of
what we want to achieve,
strategically and financially,
and how to go about it.
Our commitment is to provide
Good Food, Good Life.
Operational pillars
Competitive advantages
Growth drivers
Com
plia
nce
– Su
stai
nabilit
y Creating Shared Valu
e
Nestlé culture, values and principles
Nutrition, Health and Wellness Emerging
markets andPopularly Positioned Products
Out-of-home consumption
Premiumisation
Unmatchedproduct
and brandportfolio
Unmatched research and development
capabilityUnmatched geographic
presence
People, culture, values
and attitude
Consumerengagement
Operationalefficiency
Whenever,wherever, however
Innovation and renovation
Our objective is to be the leader in Nutrition Health and Wellness, and the industry reference for financial performance, trusted by all stakeholders