NESIC INNOVATION...Resolving Customer Issues NESIC Tamba City Innovations in Regional Healthcare...
91
ANNUAL REPORT 2019 NESIC INNOVATION
Transcript of NESIC INNOVATION...Resolving Customer Issues NESIC Tamba City Innovations in Regional Healthcare...

ANNUAL REPORT 2019
N E S I C I N N O V A T I O N

Introduction
02 Our Vision
03 Our Businesses
04 Our Competence
10 Our History
12 Our Connection to Daily Life
Medium- to Long-Term Growth Strategy, Earnings Trends
14 Message from the President
20 Financial & Non-Financial Highlights
22 Social Value Creation Model
24 Medium-Term Management Plan
Realignment of Offices to Accelerate
Innovation
29 Financial and Capital Strategy
Special Feature: CO-CREATION IN ACTION
C O N T E N T SKey Issues and Growth Initiatives
36 Materiality Issues
38 Human Resources and
Organizational Climate
41 Relationships of Trust with Stakeholders
Corporate Governance
43 Message from the Chairman
44 Corporate Governance
48 Dialogue on NESIC with Outside Directors
52 Directors & Corporate Auditors
54 Corporate Overview
55 Stock Information
56 Financial Section
34 02 Creating Business with Business Partners
NESIC
Innovation in Co-Creation Work
32 01 Resolving Customer Issues
NESIC Tamba City
Innovations in Regional Healthcare
ANNUAL REPORT 2019

ANNUAL REPORT 2019
NES I C I N N O V AT I O N
AANNUAL REPORT 2019
Editorial PolicyNEC Networks & System Integration Corporation (NESIC) has published its Annual Report as an integrated report since 2016. For the Annual Report, NESIC reports on a wide range of corporate activities, including its business strategy for the creation and provision of social value and for our growth over the medium to long term, as well as the initiatives it pursues under that strategy. In Annual Report 2019, based on the themes of co-creation and innovation, we intro-duce our initiatives for continuing to create new value for society through Groupwide innovation and co-creation with customers and partners. With the aim of furthering everyone’s understanding of the NESIC Group, we endeavor to disclose highly valuable information while making iterative improvements based on feedback we receive through dialogue with investors and other stakeholders. Accordingly, please provide us with your feedback after reading this report. Full details, including on our financial results and medium-term business strategy, are available on the “Investor Relations” section of our website. In addition, the “CSR” section of our website provides more detail on our initiatives relating to corporate social responsibility.
Period CoveredApril 1, 2018 to March 31, 2019(Certain information related to the period following that noted above is also included.)
Scope of ReportNEC Networks & System Integration Corporation and consolidated subsidiaries
Guidelines International Integrated Reporting Council (IIRC) Integrated Reporting Framework
Global Reporting Initiative (GRI) GRI Standards
ISO 26000 (Guidance on social responsibility) Minister of Economy, Trade and Industry Guidance for Collaborative Value Creation
Contact Investor Relations
https://www.nesic.co.jp/english/ir/ Responsible department: IR Group of the Corporate Finance &
Controller Division
Sustainability-Related Information https://www.nesic.co.jp/english/csr/ Environment-Related Information
https://www.nesic.co.jp/english/csr/environment.html Responsible department: CSR Promotion & Corporate
Communications Division
DisclaimerThis report contains forecasts, outlooks, targets, plans, and other forward-looking statements concerning the business performance, financial condition, and other aspects of the management of the NEC Networks & System Integration Corporation Group. These forward-looking statements are based on information NEC Networks & System Integration Corporation had as of the time this report was prepared and on certain premises judged to be reasonable. These judgments and premises, by their nature, are subjective and charac-terized by uncertainty. Furthermore, forward-looking statements are not guarantees of future results and actual performance could be greatly affected by various factors.
Company names, product names, and logos contained this report are the trademarks or registered trademarks of the respective companies.
About the CoverBy bringing together the technologies and strengths of its customers and partners, NESIC is keen to spur innovation while accelerating co- creation. The cover was designed to express these intentions of NESIC.
01ANNUAL REPORT 2019

O U R V I S I O N
Corporate Message
NEC Networks & System Integration Corporation Group Statement
The NEC Networks & System Integration Corporation Group enables communities throughout the world to
enjoy a safe, secure and plentiful tomorrow by continually facilitating more welcoming and convenient
communications, and supporting a connected society, from the floor of the ocean to the far reaches of
outer space, with proven technologies and reliable services cultivated over many years.
The NEC Networks & System Integration Corporation Group Statement and Corporate Message were crafted based on discussions involving all employees.

Digital Solutions BusinessThe Digital Solutions Business offers systems and services for informa-tion and communications technology (ICT), such as corporate networks and IT, that are essential for business. Using cutting-edge digital technol-ogies, such as artificial intelligence (AI), the Internet of Things (IoT), and robotic process automation (RPA), NESIC proposes work styles that lead to higher productivity and the evolution of businesses, as well as work styles that allow employees to work anywhere and anytime. We support diverse and sophisticated work styles in response to social issues, such as balancing childcare or nursing care while working to the best of their ability.
Network Infrastructures BusinessThe Network Infrastructures Business builds systems and provides ser-vices for network infrastructure requiring the latest technology and high reliability, including networks for telecom carriers and ICT infrastructure that support society, such as national and local governments, broadcast-ers, and road- and railway-related businesses. We contribute to providing safe and comfortable daily lives.
Engineering & Support Services BusinessThe Engineering & Support Services Business provides maintenance, operating and monitoring, outsourcing, and other support services as well as construction for our ICT systems and services. Leveraging its con-struction capabilities, NESIC offers ICT infrastructure to overseas custom-ers as well. We underpin safe and secure systems and services through our comprehensive domestic service network and strive to build global infrastructure.
O U R B U S I N E S S E S
Since its founding as a telecommunications construction company in 1953, the NEC Networks & System Integration Corporation (NESIC) Group has expanded its business fields in tune with changes in
the times and technology. Today, NESIC creates various communications systems and services integrating various equipment, software, networks, and services, as well as brand new cutting-edge/
venture technologies for its diverse base of customers, such as companies, telecom carriers, governments, and social infrastructure providers. Furthermore, the Company is a comprehensive
provider of operating and monitoring, maintenance, and outsourcing services.
03ANNUAL REPORT 2019

Technological Capabilities & CredibilityC O M P E T E N C E 1
Provision of optimal solutions
Technological Capabilities for Integrating Diverse Products and Services
NESIC has built a unique position as a system integrator with construction capabilities by fusing together its ICT, which is kept in tune with the changing times, with its telecommunications construction technol-ogies, which have been accumulated since its founding. NESIC has a wide range of technological capa-bilities centered on communications, from ICT services for corporations, to mission critical communications infrastructure for public use such as networks of telecom carriers and fire and ambu-lance emergency network systems. The Company offers comprehensive, high-quality services that are highly dependable, including for system design, integration, installation, operation, and maintenance, from the selection of equipment to outsourcing. The technological capabilities we have accumulated to satisfy the stringent requirements and expecta-tions of customers of the NEC Group are also utilized in services and various vendor products inside and outside Japan in tune with the needs of other customers. These capabilities are also being used for cloud-based services, which many companies have begun to adopt lately, and cutting-edge/venture technologies, and have led to the provision of optimal solutions for customers.
NEC products
NESICICT
Construction capabilities
Global products
Domestic vendor
products
Cloud services
Companies
Telecom carriers
Cutting-edge/ venture
technologies
Governments and social
infrastructure providers
04 ANNUAL REPORT 2019

Development of Network Infrastructure for Telecom CarriersNESIC cross-develops assets, includ-ing its maintenance service network in Japan, and deploys network engi-neers with the advanced technical skills only found in the NEC Group, to support overseas vendors who do not have these functions inside Japan, contributing to the creation of advanced networks for telecom carriers. Looking ahead, NESIC will work to enhance its capabilities ahead of the full-fledged rollout of 5G infrastructure through 5G Pagoda, a Japan–Europe joint project to create international standards for 5G, and 5G Lab, which trains personnel and verifies technologies.
Example / Initiative Leveraging Core Competencies
Employee Qualifications
Employees with managing engineer or technical
supervisor qualifications
approx.1,500
Employees with advanced ICT qualifications
approx.800
ANNUAL REPORT 2019 05

Nationwide Business CapabilitiesIn order to support infrastructure that underpins safety and security in society and the networks of tele-com carriers, including the salespeople and systems engineers who respond to customers across the country, we have put into place a service network with more than 400 locations in Japan, in addition to help desk services for network servers and security; operation centers that collectively address needs for network operation, monitoring, and maintenance services; and comprehensive technical centers able to provide one-stop services from technology assessments to repairs with logistics functions. Our 24/7 full-service structure is able to dispatch people and deliver products within a couple of hours anywhere in Japan—a unique strength that underpins the development of society forward creating welcoming and con-venient lifestyles.
Domestic Service Bases
Over 400
2
24/7 full-service structure able to respond within a couple of
hours anywhere in Japan
C O M P E T E N C E
06 ANNUAL REPORT 2019

Nationwide Business CapabilitiesSecurity Operation Center (SOC)To combat cyberattacks, which are becoming increasingly clever and sophisticated, NESIC has established its Security Operation Center (SOC) to operate and monitor customer networks. In addition to monitoring through systems, the SOC is able to identify risks and assess their degree of urgency based on analysis by security analysts who have extensive experi-ence and knowhow, through services for operating and monitoring the net-works of the NEC Group and other companies, as well as government agencies. Combined with network operation services, NESIC is able to rapidly pro-vide a complete range of services from alarm notifications to their follow-up. NESIC offers a full range of services, from security consulting to basic design and construction of networks, security services that protect nation-wide networks, and security opera-tion services through the SOC. We address all the cybersecurity needs of our customers.
Example / Initiative Leveraging Core Competencies
ANNUAL REPORT 2019 07

Business Creation CapabilitiesNESIC has a unique corporate culture defined by its mind-set of providing customer-oriented hospitality, nurtured from being on the front lines for its customers, and a willingness to always take on the chal-lenge of creating new businesses. This corporate culture translates into an ability to create unique business models and new businesses. These unique business models entail fully understanding the issues and needs of our customers, devel-oping solutions through co-creation with cutting-edge companies and startups as partners utilizing the latest technology, in addition to the use of in-house resources, validating these solutions by ourselves, and evaluating their ease-of-use and effectiveness before delivering them to customers. Using this know-how, we provide customers with solutions in the form of convenient, easy-to-use service. Amid advances in digital transformation (DX), we are fully deploying our strengths to properly address the needs of our customers who are changing their focus from products to services.
3
Creation of businesses after putting operations into practice in-house
Networks Startup Firms
Cutting-edge/ Venture
Technologies
Customers
ICT / Construction
Partners
Hardware / Software
Cloud Services
Co-Creation with Partners
Self-Implementation
Business Creation
NESIC
Nationwide Business
Capabilities
Technological Capabilities &
Credibility
C O M P E T E N C E
08 ANNUAL REPORT 2019

Business Creation CapabilitiesProvision of In-House Tested Solutions for Work-Style Innovation The Company began tackling work-style innovation in 2007. Through co-creation and by constantly validating and putting into practice new tech-nologies in-house, the Company aims to realize innovations that resolve social issues, such as alleviating labor shortages and improving productivity. Beginning in autumn 2019, NESIC will adopt a distributed work model for corporate staff departments, in line with the aim of preventing a dete-rioration in the ability to innovate and reducing the stress of employees who commute long distances to work in Tokyo, issues that are peculiar to Japan (see page 28). We are evaluat-ing the effectiveness of distributed work models while utilizing cloud-based services and making sweeping reforms to business processes to resolve issues that arise in communi-cation, management, and administra-tive work. Validated outcomes and know-how are then delivered as solu-tions to our customers.
Example / Initiative Leveraging Core Competencies
09ANNUAL REPORT 2019

O U R H I STORY
NESIC has continued to change and grow, adding new strengths in tune with the times for its core business of inno-vating and developing communications technologies. Honing these strengths, the Company is keen to provide new value and pursue its vision of becoming a “communication services orchestrator.”
1953–Founding: Telecommunication Construction
1960s–Overseas Infrastructure Construction
1990s–System Integrator
Constructed the first television broadcasting facility
Changed the company name to NEC System Integration & Construction, Ltd.
Constructed communications equipment on Mt. Everest (enabling broadcast from the peak of Mt. Everest for the first time)
Strengthened sales structure for private sector by creating a specialized division
Reinforced nationwide net-work by setting up a business unit for regional sales
Listed on the Tokyo Stock Exchange
Expanded the enterprise system integration business
Business for New Common Carriers (NCCs) took on signifi-cant scale Received major orders from new private-sector communi-cations companies
Nippon Electric Installation Company established in a spin-off from NEC Corporation
Conducted first overseas proj-ect (construction and installa-tion of switching equipment in the Philippines)
Constructed satellite telecom infrastructure for the 1968 Olympic Games, in Mexico City
Established S-iDC (Strategic Internet Data Center), NESIC’s first data center
Constructed microwave tele-com infrastructure for five Central American countries (simultaneous construction in multiple countries)
Acquired special construction business and general construc-tion business licenses for seven categories of construc-tion business
Established the first overseas affiliate, in Brazil
Main Initiatives
Net SalesOver ¥10 billion
1974Over ¥100 billion
1989Over ¥200 billion
1997
History of Honing Core Competencies
Growth through Construction Capabilities and Refinement of ICT
Alongside advances in technology, NESIC broadened its reach in the telecommunications infrastructure field to such areas as mobile base stations. The Company also expanded business to provide ICT to corporations by creating voice networks, enabling it to provide construction, system integration, and maintenance services. Accordingly, we have set up sales bases across the country and broadened our nationwide responsiveness.
Refinement of Construction Technologies as a Telecom Infrastructure Constructor
NESIC was established in a spin-off of the telecommunications engi-neering division from NEC Corporation in 1953. The Company has steadily built up its construction capabilities, centered on NEC products, while tapping into growing demand for telecommunica-tions infrastructure in Japan and overseas. We have also obtained and advanced high-quality technologies, which are symbolic of the NEC Group.
Changes in the Business Environment
1950sReconstruction after World War II. Era of construction in broadcasting and telecommunications infrastructure
1960s–1970sIncrease in international communications and satellite communications, expansion in demand for telecommunications infrastruc-ture construction worldwide
1980s–1990sTelecom liberalization, birth of New Common Carriers (NCCs)
Technological Capabilities
(Construction capabilities) &
Credibility
Technological Capabilities
(Construction capabilities + ICT)
& Credibility
Nationwide Business
Capabilities
10 ANNUAL REPORT 2019

2010sSolution Provider
Launched EmpoweredOffice work-style innovation solutions business and implemented it internally in certain sections
¥292.2 billionFY2015/3 (record high)
¥277.9 billionFY2019/3
Implemented initiatives in high-speed mobile networks and next-generation broadcasting
Launched MVNO service for IoT
Introducted telework system Companywide (spawned from a “Women’s Project Experiment” idea created by female employees)
NESIC’s industry sector classification in the stock market changed from “construction” to “informa-tion & communication”
Established K&N System Integrations Corporation as a joint venture in mobile infrastructure construction
Realigned head office to spur further innovation
Established CVC Fund to create new businesses through open innovation with startup firms
Launched joint business in low-power, wide-area (LPWA) communications protocol for IoT Established sDOC (Service Delivery Operations
Center)
2000sAdvance of IP and broadband net-works, integration of communications and broadcasting
2010sExpansion of the use of cloud; IoT and Fourth Industrial Revolution
Creation of New Businesses through Technological Capabilities and Nationwide Responsiveness
NESIC has reinforced its strengths by building a full-service network of more than 400 support and service bases across Japan through aggressive M&As, including a merger in 2007 with NEC Telenetworks Co., Ltd., a company with strength in the service field, and turning Q&A Corporation, which operates contact centers, into a subsidiary in 2013. Furthermore, NESIC has greatly expanded the products and services it offers, including through turning the innovative technologies of startups into services while advancing co-creation with partners, as well as creat-ing EmpoweredOffice work-style innovation solutions and other new businesses that leverage its unique techno-logical capabilities.
2020sToward Becoming a Communication Services Orchestrator
Nationwide Business
Capabilities
Technological Capabilities &
Credibility
Practiced EmpoweredOffice in all sections upon transfer of head office to Bunkyo Ward Tokyo (Iidabashi Head Office)
Business Creation
Capabilities
Changed the company name to NEC Networks & System Integration Corporation
Established nTOC (Network Total Operation Center)
11ANNUAL REPORT 2019

OUR CO N N ECTI O N TO DA I LY L I F E
NESIC Contributes to a Safe, Secure, and Plentiful Tomorrow in Various Contexts of Daily Life.
3 AirportsVisual Docking Guidance Systems (VDGS), airport information, and a broad array of other services.
6 Fire-fighting & Ambulance
Construction of command systems and radio systems enabling rapid responses to 119 emergency calls, and the provision of multilingual call center services.
8 Disaster Prevention
Warning systems that pro-vide information at times of emergency (earthquake, tsunami, typhoon, etc.) via simultaneous announce-ments over disaster preven-tion communication systems for greater safety and security in daily life.
5 Mobile Communications Network
Installation of mobile base stations indispensable for daily communication via smartphone and flip phone, and overall network support, together with system inte-gration of core networks.
9 Shops and Public Facilities
Creation of convenient user environments for customers including Wi-Fi networks, information distribution sys-tems, and value-added video services.
7 Railways and Roads
Support for public transpor-tation by constructing and maintaining telecommunica-tions networks and other systems for railway and highway traffic control.
4 HotelsComprehensive hotel solu-tions such as telephones and switching equipment, room management systems, and systems for providing guests with information.
1 BroadcastingConstruction, operation, and maintenance of digital TV broadcasting facilities and relay stations, and studio facilities, as well as installation of fiber-optic cable for next-generation 4K and 8K broadcasting.
2 Work-Style InnovationBy bringing together various cloud-based tools and applying cutting-edge technologies, we make new work styles that foster innovation a reality, with venues where employees across organizations and companies can create together as a single team in a work environment free from specific loca-tions. Accordingly, it allows people to work from home or satellite offices, with a focus on resolving issues that arise in communication, management, and administrative work.
12
3
4
5
7
6
7
8 9
12 ANNUAL REPORT 2019

OUR CO N N ECTI O N TO DA I LY L I F E
15 Comprehensive Technical Centers
Comprehensive technical services ranging from distri-bution control functions that run 24/7, to new- technology evaluation and SI, and maintenance and repair.
16 Data CentersKeeping of customers’ IT assets in secure, robust environments, and provision of wide-ranging operation, outsourcing, and cloud services
17 Contact CentersICT system failure response, help desk, and other sup-port services for customer system administrators and system users, and interpre-tation services in multiple languages.
NESIC’s service platform
14 Network Total Operation Centers
24/7 customer network support ranging from secu-rity monitoring to network operation.
NESIC utilizes its strengths in technological capabilities & credibility, nationwide business capabilities, and business creation capabilities to provide customers with total solutions that help increase their productivity and resolve their issues.
10
14
15
16
11
12
13
17
10 PlantsProvision of IoT systems able to detect and manage the location of people and things in real time at plants and other production sites.
11 OceansInstallation of submarine cables that support interna-tional communication, and support for earthquake warning systems by inte-grating submarine seismometers.
13 Local Governments
Provision of networks used by local governments to protect citizens, provide municipal services, and pro-mote citizen convenience and security, and tourism information services for local revitalization.
12 SpaceSupport for control systems used to communicate with and operate asteroid explo-ration, and other types of satellites and probes.
13ANNUAL REPORT 2019

Pushing Forward and Moving Beyond Borders as a Communication Services Orchestrator
Message from the President
Yushi UshijimaPresident
14 ANNUAL REPORT 2019

NESIC’s Unique Strengths
Two years have passed since I was appointed President of NESIC. During this time, I have deepened my under-standing of our strengths and issues in preparation for future growth. Over the past year, my attention has been focused on formulating medium- and long-term growth strategies that leverage our strengths. In 2017, when I returned to NESIC as President after serving at a subsidiary, I rediscovered its unique strengths, and when fully leveraged, NESIC has the potential to become a “Strong and Attractive Company” that is better than its rivals in terms of both services and earnings. NESIC boasts technological capabilities and reliability, derived from its proprietary technological capabilities in construction, installation, and ICT, and the advanced level of technologies and services it has accu-mulated as a NEC Group company, which is applied to multivendor services. Another strength is its nationwide business capabilities with a sales network spanning the entire country of Japan and the robust maintenance ser-vice network required of a company that supports public infrastructure without experiencing downtime, such as for telecom carriers and government agencies. Furthermore, NESIC has been gaining the unique ability to create businesses with these advantages. Taking EmpoweredOffice work-style innovation solutions as an example, the Company tests out new products and ser-vices on its own and provides them to customers as easy-to-use solutions. With this ingrained in its corpo-rate culture, NESIC has recently been focusing its energy on providing new services that incorporate cutting-edge technologies. Another example is our collaboration with Zoom Video Communications, Inc. (see page 34). Zoom Video Communications was approached by a number of Japanese firms to bring its solutions to the Japanese market, but NESIC was able to seal a sales partnership agreement thanks to it being the first firm to contact Zoom Video Communications with a passionate approach. This successful arrangement boosted NESIC’s profile among other startup firms in the U.S., creating a virtuous cycle of collaboration with new companies. I believe one of NESIC’s core competencies is its ability to discover cutting-edge/venture technologies and rapidly translate them into new value without encountering complications.
Vision for 2030: Communication Services Orchestrator
Within common global frameworks like the Sustainable Development Goals (SDGs), governments, the private sector, and even individuals are increasingly expected to change their attitudes and behavior toward the global environment and the sustainable development of soci-ety. Japan is facing issues that threaten the sustainability of society, such as its declining workforce, and compa-nies must step up to address both social issues and economic development. In addition, taking an overhead view of technology over the next ten years or so until 2030, changes in busi-ness and social structures are likely to accelerate with the increasing adoption of digital technology, including AI and IoT. In Japan, fifth-generation (5G) telecommuni-cations systems will commence operations in 2020, offering higher speeds, larger data volumes, simultane-ous multiple connections, lower latencies, and greater reliability. These features could have an unprecedented, major impact on industries, such as remote medicine and self-driving cars. Looking further ahead, digital tech-nology will converge with 5G infrastructure to create innovative new services. With these significant changes afoot, NESIC aims for sustainable development along with society by leverag-ing its strengths in the communications domain where it has had a presence since its founding. “Communication services orchestrator” is our corporate vision for creating a more welcoming and convenient society through com-munications by the year 2030. Amid the paradigm shift from products to services, NESIC must transform its traditional business model as a systems integrator that leans towards products, into a business model that includes systems integration for cloud-based services. To this end, the Company must produce a new value chain that incorporates a variety of services while accelerating co-creation with business partners. The meaning of “orchestrator” is to create new innovations that excite our customers by combining vari-ous partners and services into an optimal solution for customers to use.
Message from the President
15ANNUAL REPORT 2019

Focusing on Digital Solutions and 5G Infrastructure
Digital solutions and 5G infrastructure are the two domains where we will concentrate our management resources in order to achieve our vision for society. With regard to digital solutions, a variety of cloud-based digital services have begun to be provided in tune with the shift to the cloud. Regarding 5G infrastructure, the Company expects capital investments to pick up in earnest from 2021. With this in mind, we believe the migration to 5G, including measures to deal with greater data volume, will take place during the current medium-term management plan. Furthermore, we expect local governments and companies to roll out their own local 5G service networks. Looking further ahead, we antici-pate the arrival of a “digital x 5G” era with new digital services based on 5G infrastructure, and expect com-pletely new services that utilize cutting-edge networks to begin emerging. In other words, customers of ordinary companies will be able to use networks of the same quality as telecom carriers, and this will create demand for system integration for cutting-edge backbone
Message from the President
networks, as well as construction of base stations, and even proposals and provisions of new services based on this infrastructure. NESIC will be able to fully leverage its core competencies in this coming era, and build an “Only 1” position. In order to make steady progress on this road map, we must come up with ideas that defy conventional wisdom and transcend existing frameworks. In last year’s report, I said “I would not mind changing everything except our core value of contributing to society through communications technologies.” This represents our true intentions. In order to latch onto business opportunities amid the wave of digital transformation, NESIC must transition across borders, from traditional domains centered on product-based system integration to cloud-based ser-vice domains. Technological barriers must also be over-come in order to provide services that customers find easy to use while taking full advantage of the latest digital and 5G technologies. Amid the rapid changes taking place around the world, the Company must fur-ther refine its core competencies and move more quickly in order to survive competition from rivals. In other words, NESIC must surmount borders drawn by
The meaning of “orchestrator”
is to create new innovations
that excite our customers by
combining various partners and
services into an optimal solu-
tion for customers to use.
16 ANNUAL REPORT 2019

the competition. We must also break down walls between organizations and lift our capabilities above and beyond current borders, and clear away the barriers that exist in various markets and technologies. Our determination to make this transformation over borders, barriers, or walls happen is mirrored in the Beyond Borders theme of the medium-term manage-ment plan (FY2020/3 to FY2022/3).
First Step Toward Our Vision: Beyond Borders 2021 Medium-Term Management Plan
With our eyes on the long-term road map, we are build-ing a business structure and framework able to respond to major changes in the business environment. Our cur-rent medium-term management plan is positioned as a stepping stone for a leap ahead in growth under the next medium-term plan. NESIC will surmount perfor-mance barriers by focusing efforts on the reinforcement of existing operations and the creation of new businesses. The Company targets ¥310 billion in net sales by the fiscal year ending March 31, 2022. As the top line shifts above the ¥300 billion level, NESIC aims to achieve tar-gets for operating income of ¥20 billion, operating margin of 6.5%, and ROE of 10% or higher, to achieve profitability on a par with its sector peers. All of these management targets are aimed at record-setting levels. The Company already started investing in growth in the previous fiscal year, and is advancing mea-sures to attain these targets under the current medium-term management plan. We believe these targets are achievable, given the business environment, our ability to execute, and the progress made thus far on mea-sures. In particular, we are keen to reach our operating margin target, mainly through cost reductions as a result of increasing management efficiency. NESIC plans to spend ¥13 billion on growth investments over the next three years with the intention of translating strong top-line expansion into profit growth over the medium and long terms. The Company will also invest heavily in human resources while strengthening growth businesses, co-creation, and alliances.
Measures Based on Our Basic Strategy
One of our basic strategies for moving Beyond Borders is to strengthen competitiveness and growth potential for the digital & 5G era. In the digital domain, NESIC launched the digital transformation (DX) project as a Companywide initiative in April 2018 to marshal internal resources and advance initiatives in digital businesses. In addition to Zoom, we introduced Workato (a workflow automation service that increases work efficiency by linking together cloud services), box (a secure storage service that facilitates online collaboration), and other cutting-edge services. We are accelerating the rollout of these services. In 5G, NESIC is participating in 5G!Pagoda, a project to create international standards for 5G between Japan and Europe, and has started cre-ating a foothold for establishing 5G technologies. The Company is also making steady progress on new busi-ness schemes for the future. NESIC has launched a joint business with Sony Network Communications Inc. and ORIX Corporation for ELTRES™, a new specification for LPWA (a low-power, wide-area communications protocol for remote area communications), which is a promising platform for IoT. NESIC has also established a joint ven-ture with KDDI Corporation to install mobile base sta-tions, with the aim of expanding business by leveraging the strengths of both companies. The second basic strategy is to strengthen the base, schemes, and structure to create advanced technologies and new businesses. Specifically, a central premise of this strategy is the co-creation of businesses with prom-ising startup firms that boast innovative technologies. In January 2018, NESIC established its own Corporate Venture Capital (CVC) Fund, and has already invested in four startup firms in the U.S. and Japan. Among these firms is Savioke, Inc., a company with autonomous deliv-ery robot technology that can be used in hotels and healthcare settings. It has also invested in ALE Co., Ltd., an aerospace venture aimed at applying our expertise in aerospace operations, including satellites and probes, to the private sector. We hope these investments will lead to the advanced of dream-inspiring new businesses. In April 2019, NESIC invested in Sozo Ventures, a venture capital fund in the U.S. that targets startup firms with more developed cutting-edge/venture technologies. In May 2019, NESIC partnered with Plug and Play Tech Center, an accelerator in Silicon Valley, with the inten-tion of discovering promising technologies and applying them to communications platforms (see page 39).
Message from the President
17ANNUAL REPORT 2019

Organizational Reforms for Beyond Borders
Our third basic strategy is to accelerate innovation through All-NESIC. To date, NESIC has grown its busi-nesses with organizations targeting each market, such as corporations, telecom carriers, and social infrastructure providers. Since becoming President, I have noticed that, amid the sharing of technologies across organizations, the scattering of engineers with expertise in similar tech-nologies is inefficient. To take full advantage of the resourcefulness and strengths of our engineers, we must marshal all of our resources and leverage them as a combined force for the entire company. With this in mind, in April 2019, NESIC reformed its market-focused organization into the Digital Solutions Business Unit and the Network Infrastructures Business Unit to create an organizational structure that is more specialized and competitive with strategies aligned toward digital solu-tions and 5G infrastructure. The Digital Solutions Business Unit consolidates businesses that provide ser-vices, such as system integration and other work-style innovation solutions, with systems engineering for enter-prises, system integration for ICT platforms, and other service functions. The Network Infrastructures Business Unit combines system integration functions in the public network domain, such as social infrastructure and prom-ising 5G-related networks. Bringing together core func-tions in installation and maintenance that had been scattered across previous business units, the Engineering & Support Services Business Unit was created to pursue higher levels of productivity and increase project quality through collaboration with the two aforementioned busi-ness units. Looking at the business portfolio from another angle, NESIC plans to increase profitability while growing sales in the Digital Solutions and Network Infrastructures Business Units by enhancing competitiveness and creating new businesses. In the Engineering & Support Services Business Unit, the Company aims to improve profitability by enhancing efficiency in resource deployment. In addition, the Business Design Operations Unit has been created with the mission to investigate new tech-nologies and create new businesses with employees who had been previously scattered across business units and head office functions, aiming to increase
co-creation with business partners including startup firms, and also to create business using digital technolo-gies. This unit is also in charge of Companywide tech-nology strategies, new business planning, partnering, and alliances. The Business Design Operations Unit will also develop business in domains where NESIC has not traditionally had a presence.
Challenging New “Only 1” Work-Style Innovation
As a catalyst for advancing these strategies, NESIC is realigning its office locations around the head office in a bid to accelerate work-style innovation. One aim of the realignment is to decentralize corporate staffing func-tions. We plan to reduce floor space at the head office by 60% and redistribute staff to activity bases in about 10 locations in the Tokyo metropolitan area. Around 60–70% of corporate staff will work at activity bases within a 30-minute commute, or telework from home, instead of commuting to the head office. The aim of this realignment is to turn the disadvantages of decentraliza-tion into advantages by using various digital technolo-gies to their fullest potential while rethinking work processes from scratch. We will then propose this frame-work as a solution to our customers. Through decentral-ized work styles, employees will have an opportunity to achieve a better work–life balance and potentially become more creative. This way of working should also boost our ability to innovate, a widespread issue in Japan. NESIC is also setting up innovation bases with cutting-edge technologies to promote co-creation and the cre-ation of new businesses. With our venture bases in the U.S., we will demonstrate to our customers new initia-tives for communicating, such as between offices with the feeling of sharing the same physical space. As a pioneer in work-style innovation, NESIC will con-tinue to come up with new work styles that are two or three steps ahead of the competition, by utilizing the technologies and expertise it has accumulated over the past 10+ years.
Message from the President
18 ANNUAL REPORT 2019

Moving Beyond Borders with Communication
I believe we must move aggressively forward while taking full advantage of the abilities of each and every employee in order to steadily push on changes that will allow us to overcome many barriers. Communication in our company is key to making this happen. With this in mind, I have vis-ited our bases across the country to directly talk to many of our employees about the concepts behind the medium-term management plan. I am taking care to com-municate with all levels of employees, with eye-catching digital signage on office floors and by answering ques-tions posed by employees on a talking program called Ushijima Radio (see page 41). I am proud of the changes we have made at NESIC over the past two years to facili-tate the undertaking of new challenges.
Communication is essential in people’s everyday lives, and I believe advances in communication will lead to solutions for all issues faced by society. This belief is reflected in “an inclusive and sustainable society created through communications,” the Company’s vision. With an eye on 2030, NESIC will strive to overcome various hurdles through unified efforts and advance toward its 2030 vision for creating a more welcoming and convenient society through communications as a “communication services orchestrator.” We hope you will support us as we continue to take on new challenges.
With an eye on 2030, NESIC will strive to
overcome various hurdles through unified
efforts and advance toward its 2030 vision
for creating a more welcoming and
convenient society through communications
as a “communication services orchestrator.”
We hope you will support us as we continue
to take on new challenges.
President
Message from the President
19ANNUAL REPORT 2019
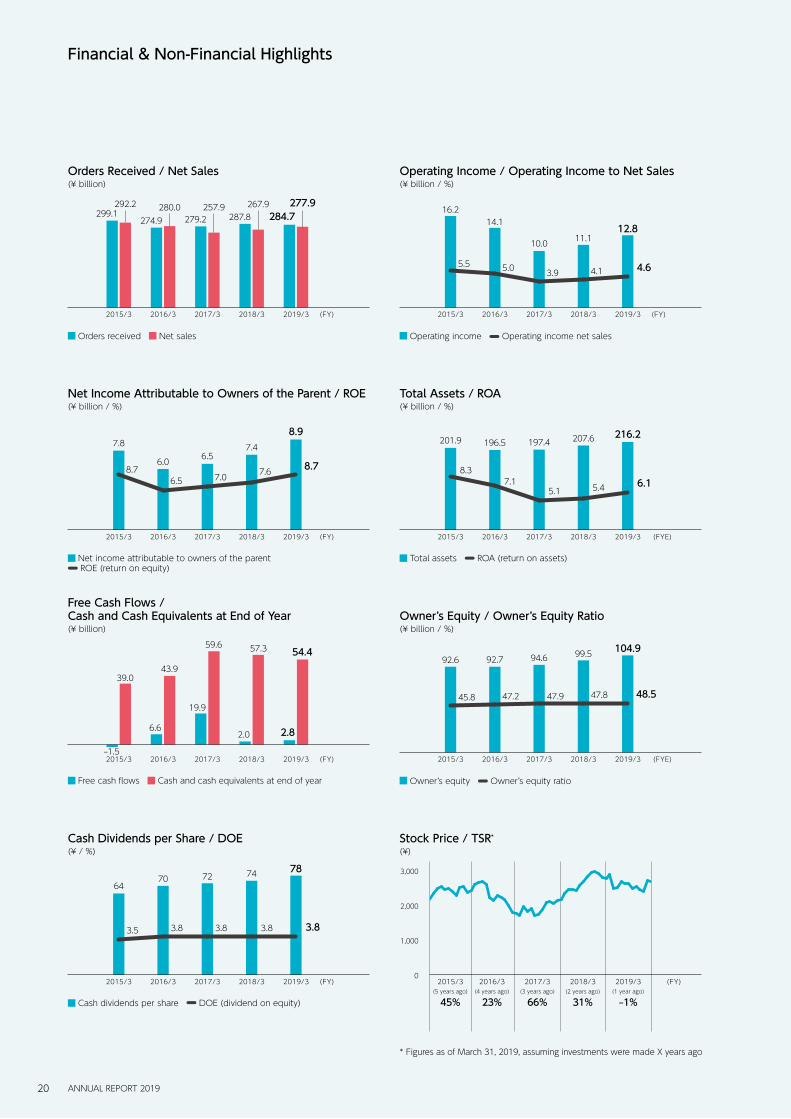
Financial & Non-Financial Highlights
2015/3 2016/3 2017/3 2018/3 2019/3 (FY)
284.7299.1274.9 279.2
292.2 280.0 257.9 277.9287.8
267.9
Orders Received / Net Sales(¥ billion)
Orders received Net sales
12.811.1
5.5 5.0 3.9 4.1
16.214.1
10.0
4.6
(FY)2015/3 2016/3 2017/3 2018/3 2019/3
Operating Income / Operating Income to Net Sales(¥ billion / %)
Operating income Operating income net sales
(FY)
2.8
–1.5
6.6
19.9
39.043.9
59.654.4
2.0
57.3
2015/3 2016/3 2017/3 2018/3 2019/3
Free Cash Flows / Cash and Cash Equivalents at End of Year(¥ billion)
Free cash flows Cash and cash equivalents at end of year
104.9
45.8 47.947.2
92.6 92.7 94.6
48.5
99.5
47.8
(FYE)2015/3 2016/3 2017/3 2018/3 2019/3
Owner’s Equity / Owner’s Equity Ratio(¥ billion / %)
Owner’s equity Owner’s equity ratio
8.97.4
8.76.5 7.0
7.6
7.8
6.06.5
8.7
(FY)2015/3 2016/3 2017/3 2018/3 2019/3
Net Income Attributable to Owners of the Parent / ROE(¥ billion / %)
Net income attributable to owners of the parent ROE (return on equity)
216.2
8.37.1
5.1
201.9 196.5 197.4
6.1
207.6
5.4
(FYE)2015/3 2016/3 2017/3 2018/3 2019/3
Total Assets / ROA(¥ billion / %)
Total assets ROA (return on assets)
78
3.5 3.8 3.8
6470 72
3.8
74
3.8
(FY)2015/3 2016/3 2017/3 2018/3 2019/3
Cash Dividends per Share / DOE(¥ / %)
Cash dividends per share DOE (dividend on equity)
2015/3(5 years ago)
45%
2016/3(4 years ago)
23%
2017/3(3 years ago)
66%
2018/3(2 years ago)
31%
2019/3(1 year ago)
–1%
(FY)0
1,000
2,000
3,000
Stock Price / TSR*
(¥)
* Figures as of March 31, 2019, assuming investments were made X years ago
20 ANNUAL REPORT 2019

Financial & Non-Financial Highlights
(FY)
2,248 2,1463,253
6,113 6,108
10,745
2,427
7,599
2016/3 2017/3 2018/3 2019/3
EmpoweredOffice Visitors(Companies / Individuals)
Companies Individuals
Male employees (end of fiscal year) Female employees (end of fiscal year) New graduate hires Mid-career hires (non-consolidated basis)
2016/3 2017/3 2018/3 2019/3 (FY)
1,136 1,262 1,368
6,328 6,3106,375
135 135
29 25
122
41
1,329
7,464 7,572 7,7437,657
6,328
112
8
Number of Employees / Number of New Graduate Hires / Number of Mid-Career Hires(Employees)
(FY)
24.0
20.3 19.718.9
2016/3 2017/3 2018/3 2019/3
Average Overtime (per month) (Non-consolidated)(Hours)
1,412 1,471
785
2,0262,177 2,274
614 706
1,489
757
2,272
1,515
(FYE)2016/3 2017/3 2018/3 2019/3
Employees with Qualifications (Non-consolidated) (Total number of people)(Employees)
Employees with advanced ICT qualifications Employees with managing engineer or technical supervisor qualifications
16.2 16.719.1
17.3
54.766.6
65.568.1
2016/3 2017/3 2018/3 2019/3 (FYE)
Average Length of Service / Ratio of Continued Employment Past Age 60 (Non-consolidated) (Years / %)
Outside Evaluations
(FYE)
19 20
25
2.22.8
2.1 2.1
3.7
2.5
27
3.0
2.3
2016/3 2017/3 2018/3 2019/3
Number of Non-Japanese Employees / Ratio of Women in Management Positions / Ratio of Employees with Disabilities (Non-consolidated)(Employees/ %)
Number of non-Japanese employees Ratio of women in management positions Ratio of employees with disabilities
Average length of service Ratio of continued employment past age 60
2016 2017 2018 2019
SNAM Sustainability Index (Announced in June)
Certified Health and Productivity Management Organization (Announced in February)
* Established in February 2017
21ANNUAL REPORT 2019

Social Value Creation Model
NESIC’s vision for society is “an inclusive and sustainable society created through communications.” To make this society a reality, we have established a social value creation model based on co-creation with partners and putting new ideas into practice ourselves, with the overriding objective of integrating various technologies and providing them to custom-ers as easy-to-use solutions. Based on this value creation model, we will continue to create new businesses and services. NESIC has identified three core areas (materiality) where it can provide value to society through 2030, namely “create environments in which everyone can work more vigorously,” “develop pleasant and plentiful communities with cutting-edge technolo-gies,” and “provide robust services that underpin safety and security in evolving society.”
Vision for SocietyAn inclusive and sustainable society created through communications
Sound and highly transparent management
Strengthen innovation capabilities that create new value
Create work environments where employees can
work vigorously
Materiality Issues (Initiatives for growth at NESIC) See page 36–37
Means of Creating Value
Customers
Hardware/ Software
Cutting-edge/ Venture Technologies
Networks
Cloud Services
Startup Firms
ICT /Construction
Partners
Nationwide Business
Capabilities
Integration
Competence
Pursuing a customer- oriented approach to business
Co-Creation with
Partners
Self-Implementation
Technological Capabilities &
Credibility
Business Creation
Capabilities
ANNUAL REPORT 201922

To carry on with the creation of value for society, the Company is implementing three important initiatives (material-ity) for ensuring growth: “sound and highly transparent management,” “strengthen innovation capabilities to create new value,” and “create work environments where employees can work vigorously.” NESIC aims to increase its corporate value over the long term by contributing to the development of society and the Sustainable Development Goals (SDGs) through the continued implementation of this value creation model.
society created through communications
Materiality Issues See pages 36–37
(Initiatives to provide value to society through 2030)
Growth Fields
Create environments in which everyone can work more vigorously
Develop pleasant and plentiful commu-nities with cutting-edge technologies
Provide robust services that underpin safety and security in evolving society
Digital
5G
Sustain Imp
rovement
in Co
rpo
rate Value
ANNUAL REPORT 2019 23

Beyond Borders 2021Medium-Term Management Plan
Review of Previous Medium-Term Management Plan
Under the previous medium-term management plan, which spanned from FY2017/3 to FY2019/3, NESIC was regretta-bly unable to achieve its management targets, as growth in business for enterprises did not fully offset the sharp declines in business for telecom providers and the social infrastructures business during the first year of the plan. Toward the new medium-term management plan, however, NESIC has seen some results. Looking at profitability, the gross margin reached a record-setting level of 17% and ROE improved more than 2 percentage points. To reinforce our business foundation, we took steps to strengthen our growth potential and core competencies, launching the DX (digi-tal transformation) business and accelerating co-creation with partners.
Positioning of New Medium-Term Management Plan
When devising the new medium-term management plan, we defined the most important initiatives to undertake over the next three years within the context of our vision for 2030 and our aim of sustaining growth. The social vision we aim to achieve by 2030 is “a more welcoming and convenient society through communications.” New technologies and services are constantly being created by startups and other companies. While leveraging its own strengths, NESIC aims to be a “communication services orchestrator” that creates new social value in collaborative initiatives with various partners including startup firms. Based on this outlook, our new medium-term management plan prioritizes the strengthening of our growth potential and profitability through revisions to the business structure in line with changes in the business environment over the next five to 10 years.
2016/3 2017/3 2018/3 2019/3 (FY)
Previous medium-term management plan
6.5
280.0 257.9 267.9 277.9
7.07.6
5.03.9 4.1
8.7
4.6
Results(¥billion / %)
Net sales Ratio to net sales ROE
Positioning of Medium-Term
Management Plan toward FY22/3
Contribute to achievement of the SDGs by realizing our vision (Aim to maximize both social and economic value)
2030 Vision
Social vision to realize
A more welcoming and convenient society through communications
Our future vision
Communication Services Orchestratorthat produces a new value chain
leveraging our strengths, through collaboration
with partners
Targets of Previous Plan
Net Sales
Over ¥300 billion
Ratio to Net Sales
Over 5.5%
Operating Income
Over ¥16.5 billion
ROE
Over 10%
Strengthen
growth power and earnings power
by enhancing the business structure and constitution in anticipa-tion of environmental changes within
the next five to ten years.
2019
Strengthening of competitive-ness in existing businesses
Creation of new businesses and revenue sources
Renewal of record-high performance
24 ANNUAL REPORT 2019

Medium- and Long-Term Outlook for the Business Environment
Amid the increasingly borderless world, companies are transforming their business models, processes, and work styles in order to enhance their international competitiveness. On the technology side, advances in digital technology and faster, more sophisticated networking technology (5G) will lead to the creation of services never seen before, and pos-sibly change the world. Moreover, labor shortages are likely to become a major problem for both NESIC and its cus-tomers. While they represent threats to NESIC in the sense that they may undermine existing operations, we also view them as major business opportunities for creating new services.
Beyond Borders 2021 Medium-Term Management Plan
Under Beyond Borders 2021 medium-term management plan, which commenced in the fiscal year ending March 31, 2020, alongside the achievements we have made to date, we aim to shift to a new business model centered on digital and 5G, and accelerate the creation of new businesses, with the view that resolving social issues and riding the wave of technological innovation will lead to opportunities for business expansion. NESIC intends to change its business structure for the coming era of “Digital x 5G,” a future where digital and 5G technologies converge, while strengthening systems to create new businesses with cutting-edge/venture technologies and accelerating innovation across organiza-tional boundaries. Through these initiatives, we aim to surmount various borders, realize sustainable growth, and help resolve social issues through our business activities.
Measures Taken toward New Medium-Term Management Plan
To ride this wave of change, NESIC has taken Companywide measures to strengthen its growth power, which include launching digital-related businesses, rolling out advanced services, forging new partnerships, and developing frame-works for co-creation with startups.
Opportunities Threats
Creation of new business opportunities
Contraction of construction business
5G
Need for higher productivity and outsourcing of operations among
customers
Securing of human resources and succession of technologies
Labor shortage
DigitalizationDiversification and leveling of
earnings opportunitiesChanges in existing
SI model
Strengthening of Growth Power
Started up DX business & launched advanced services
Promoted new business schemes/partnerships
Created a foothold for establish-ing 5G technologies (Participation in 5G! Pagoda)
Strengthening of Competence
Reorganized into three business units—Digital Solutions BU, Network Infrastructures BU, and Engineering & Support Services BU– to exert expertise and competitiveness
Consolidated advanced technol-ogies and business creation functions, and created Business Design Operations Unit
Acceleration of Collaboration with Partners
Collaboration with startups for business creation (Discovery of cutting-edge solutions and services)
25ANNUAL REPORT 2019

Medium-Term Management Plan
Reorganization and Positioning of Business Segments
Guided by these objectives, in April 2019, NESIC reorganized its operations into three business segments comprising the Digital Solutions Business, which provides system integration for office ICT platforms and related services for enter-prises; the Network Infrastructures Business, which offers system integration and related services for highly public networks to telecom carriers, governments, and social infrastructure providers; and the Engineering & Support Services Business, which concentrates all con-struction functions and support service functions, such as maintenance, operations, and monitoring. In the Digital Solutions Business and Network Infrastructures Business, which are positioned as growth-driving businesses, NESIC aims for growth in both net sales and operating income. In the Engineering & Support Services Business, our focus is on improving profitability through achieving greater effi-ciencies in Companywide platforms for construction work and support services.
Additionally, as a part of our business-reform efforts, we are accelerating initiatives to reform work styles and offices with an eye on speeding up innovation. We are challenging ourselves to come up with cutting-edge ways of working that go beyond traditional concepts for offices. While accumulating and providing know-how, we are keen to turn EmpoweredOffice into a business that drives innovation in our customers’ businesses (see page 28).
Coming Era of “Digital x 5G”
In the coming era of “Digital x 5G,” the close integration of ICT and networking technologies should bring about inno-vative changes in services. Against this backdrop, we believe our role will increase significantly as a creative force in business, advancing the EmpoweredOffice work-style innovation solutions and other pioneering businesses, and lever-aging our core competencies in business platforms for providing a full range of services, from building mission critical networks for telecom carriers and social infrastructure providers, to ICT services for enterprises. NESIC aims to contribute to the realization of a welcoming and convenient society by honing these core competen-cies and deepening its expertise.
Management Targets
While raising the level of net sales to more than ¥300 billion, NESIC has set the following management targets as a waypoint for achieving higher levels of profitability in line with industry standards.
(¥ billion)
FY2019/3 (Results) FY2022/3 (Targets) (Reference) Record-high
Net Sales 277.9 310.0 292.2FY2015/3
Operating Income (Ratio to net sales)
12.8(4.6%)
20.0(6.5%)
16.2FY2015/3
(5.5%)FY2015/3
ROE 8.7% 10% or more 9.6%FY2014/3
80
10
Ratio to net sales (%)
6
100 120
FY19/3 FY22/3
Upper figures: Net salesLower figures: Operating income
80.45.9
90.47.2
95.010.5 110.0
11.099.88.4 105.0
8.5
Engineering & Support Services
Digital Solutions
Network Infrastructures
Net sales (¥ billion)
Medium-Term Targets for Each Segment
26 ANNUAL REPORT 2019

Business Strategy
Digital Solutions Business
Engineering & Support Services Business
Increasing Efficiency of Construction and Maintenance Services, Nurturing and Advancing ResourcesWe aim to increase the efficiency of our business operations while reinforcing our operational capacity in all Companywide functions, such as construction and maintenance, by consolidating and integrating our construction functions and maintenance system inside and outside Japan. To this end, we are expand-ing training for all related engineers and focusing on improvements in project quality and management capabilities, while encouraging employees to learn multiple skills and promoting succession of technologies.
Masafumi GoujiSenior Vice President and Member of the Board Executive General Manager, Engineering & Support Services Business Unit
Advancing Business through DX Leveraging the latest digital technologies, we create unprecedented work-style and business processes of the like never seen before. And we will evolve the work-style innovation business to further advance services that spur innovation and strengthen the businesses of our customers. With this aim, we are acceler-ating the creation of business through co-creation with companies that have cutting-edge/venture technologies while putting these new technologies into practice in-house.
Osamu NodaSenior Vice President and Member of the Board Executive General Manager, Digital Solutions Business Unit Executive General Manager, Business Design Operations Unit
Network Infrastructures Business
Developing 5G across All Businesses, Centered on Operations for Telecom CarriersWe intend to expand operations for telecom carriers by leveraging our full-layer system integration capabilities, from mobile communications base stations to backbone networks, while reinforcing our technological capabilities for more advanced communications technologies like 5G. At the same time, we will accelerate business development in services compatible with 5G technology, and strengthen our ability to provide innovative solutions combining cutting-edge technologies, such as 5G, in the public infrastructure field.
Masaya KadotaSenior Vice President
Executive General Manager, Network Infrastructures Business Unit
27ANNUAL REPORT 2019
Medium-Term Management Plan
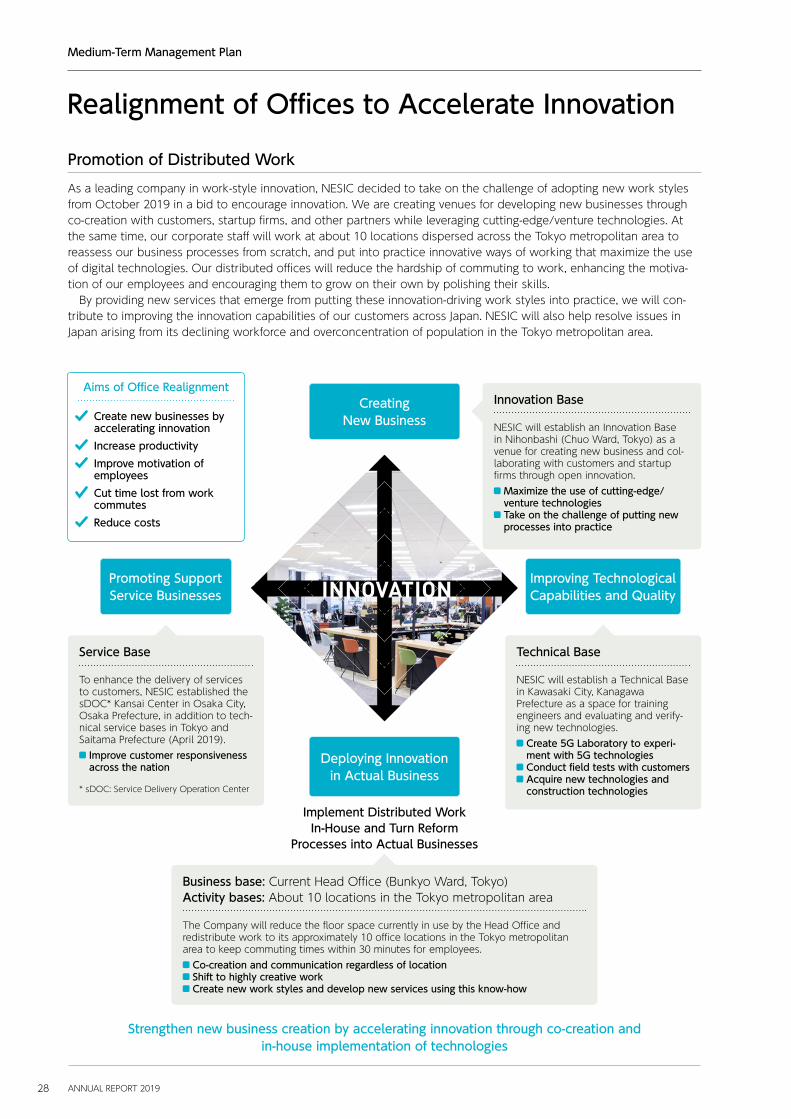
Promotion of Distributed Work
As a leading company in work-style innovation, NESIC decided to take on the challenge of adopting new work styles from October 2019 in a bid to encourage innovation. We are creating venues for developing new businesses through co-creation with customers, startup firms, and other partners while leveraging cutting-edge/venture technologies. At the same time, our corporate staff will work at about 10 locations dispersed across the Tokyo metropolitan area to reassess our business processes from scratch, and put into practice innovative ways of working that maximize the use of digital technologies. Our distributed offices will reduce the hardship of commuting to work, enhancing the motiva-tion of our employees and encouraging them to grow on their own by polishing their skills. By providing new services that emerge from putting these innovation-driving work styles into practice, we will con-tribute to improving the innovation capabilities of our customers across Japan. NESIC will also help resolve issues in Japan arising from its declining workforce and overconcentration of population in the Tokyo metropolitan area.
Creating New Business
Improving Technological Capabilities and Quality
Promoting Support Service Businesses
Deploying Innovation in Actual Business
Realignment of Offices to Accelerate Innovation
Implement Distributed Work In-House and Turn Reform
Processes into Actual Businesses
Create new businesses by accelerating innovation
Increase productivity
Improve motivation of employees
Cut time lost from work commutes
Reduce costs
Innovation Base
NESIC will establish an Innovation Base in Nihonbashi (Chuo Ward, Tokyo) as a venue for creating new business and col-laborating with customers and startup firms through open innovation.
Maximize the use of cutting-edge/ venture technologies Take on the challenge of putting new processes into practice
Service Base
To enhance the delivery of services to customers, NESIC established the sDOC* Kansai Center in Osaka City, Osaka Prefecture, in addition to tech-nical service bases in Tokyo and Saitama Prefecture (April 2019).
Improve customer responsiveness across the nation
* sDOC: Service Delivery Operation Center
Technical Base
NESIC will establish a Technical Base in Kawasaki City, Kanagawa Prefecture as a space for training engineers and evaluating and verify-ing new technologies.
Create 5G Laboratory to experi-ment with 5G technologies Conduct field tests with customers Acquire new technologies and construction technologies
Business base: Current Head Office (Bunkyo Ward, Tokyo) Activity bases: About 10 locations in the Tokyo metropolitan area
The Company will reduce the floor space currently in use by the Head Office and redistribute work to its approximately 10 office locations in the Tokyo metropolitan area to keep commuting times within 30 minutes for employees.
Co-creation and communication regardless of location Shift to highly creative work Create new work styles and develop new services using this know-how
INNOVATION
Strengthen new business creation by accelerating innovation through co-creation and in-house implementation of technologies
Aims of Office Realignment
28 ANNUAL REPORT 2019

Financial and Capital Strategy
Maximizing Financial Value Focused on Improving ROENESIC has designated ROE as an important manage-ment benchmark for enhancing shareholder value by consistently realizing returns in excess of the cost of capital. In the fiscal year ended March 31, 2019, ROE was 8.7%, a year-on-year improvement for the third con-secutive year, thanks to stronger profitability resulting from greater cost efficiency, a shift to high-value-added projects, and top-line growth on the back of a stronger corporate structure. For the new medium-term manage-ment plan, we are targeting an ROE of 10% or higher. To achieve this target, the Company is rolling out mea-sures for each business unit to increase margins and asset efficiency, the basic components of ROE, to guide their business activities. These measures are put through a PDCA cycle. More specifically, management aims to strengthen existing businesses; expand net sales and added value by creating new businesses utilizing cutting-edge/ven-ture technologies and partnerships; improve profitability by strengthening the cost structure through reduction of material costs and outsourcing costs, increase of in house production, and greater efficiencies in selling, general and administrative (SG&A) expenses; and improve working capital efficiency by shortening the cash conversion cycle. I am confident that we can increase ROE with all employees working together toward improvement, by setting objectives for each busi-ness and employee based on the above.
NESIC believes that sustained improvements in corporate value result from the enhancement of shareholder value and the value it provides to society, by addressing the expectations of stakeholders, including shareholders, investors, cus-tomers, employees, and business partners. To this end, the Company will engage in activities to consistently realize and maximize returns that exceed the cost of capital while aiming to improve return on equity (ROE), an indicator of capital efficiency. At the same time, NESIC will take action to improve non-financial value, with a focus on materiality and other key issues affecting the Company, in a bid to contribute to the resolution of social issues. We understand the importance of accurately disclosing these values to stakeholders.
Under the medium-term management plan, NESIC intends to invest aggressively in businesses to carry out its growth strategy for the coming era of “Digital x 5G.” From the standpoint of improving ROE, however, man-agement will continue to focus on making suitable deci-sions, by setting appropriate criteria for screening investments based on their characteristics with due con-sideration paid to quantitative factors such as future cash flow, qualitative factors such as strategic position-ing, and the time frame for returns on investments within the context of managing risk from the ICT industry’s rapid pace of technological change. After investments are made, management will periodically evaluate and assess their progress, while building investment know-how with the aim of increasing investment sophistication. NESIC has an obligation to consistently provide highly dependable services, such as building public infrastruc-ture for the national government, local governments, and telecom carriers. The Company must therefore maintain a sound financial position. Management intends to secure cash on hand equivalent to about two months of net sales in preparation for sudden capital requirements. In the event that more capital is required alongside growth or for major investments, management will prioritize the use of debt, without undermining financial soundness, in addition to the accumulation of cash on hand equivalent to more than two months of net sales, with due consideration paid to shareholder value.
NESIC aims to sustain growth in corpo-rate value by maximizing financial value focused on improving ROE and increasing non-financial value centered on material-ity issues.
Hiroyuki SekizawaSenior Vice President and Member of the Board
29ANNUAL REPORT 2019

Increasing Non-Financial Value Centered on Materiality Issues, Improving EngagementTo sustain improvement in corporate value, we believe it is necessary to focus our efforts on increasing non-finan-cial value, such as ESG and management resources including personnel and service platforms, the well-spring of our core competencies that create value. NESIC has identified new materiality issues in line with its vision for 2030. Human resources and organizational climate as well as technologies and expertise are partic-ularly important management resources for NESIC as a company that aims to be a “communication services orchestrator” that produces new value chains through open innovation. Over the course of the medium-term management plan, NESIC will invest actively in the train-ing of personnel who will underpin business growth and
the establishment of core bases for training engineers and evaluating and validating new technologies such as 5G, while at the same time investing in businesses. We will also update our infrastructure to improve working environments for employees and to enhance our ability to spur innovation. NESIC aims to increase both financial and non-finan-cial value. At the same time, the Company will improve the visibility of this corporate value through two-way communication with stakeholders, including sharehold-ers, investors, customers, employees, and business part-ners, from the belief in the importance of portraying its activities in an accurate manner. For this reason, man-agement intends to improve its engagement with stake-holders through IR, PR, and CSR activities. I will actively engage in communication even further with investors
Optimizing the business portfolio with a view to capi-tal efficiency is an important issue for management to address in order to sustain improvements in ROE and profit growth. For this reason, when assessing busi-nesses, management intends to optimize the business
portfolio by selectively concentrating and reshuffling businesses while relying on predetermined evaluation methodologies, including matrixes of return on invested capital (ROIC) and growth potential, in addition to assessing profits.
Financial value Non-financial value
Sustain Improvement in Corporate Value
Reinforce portfolio
management
• Reinforce existing businesses• Create new businesses
Growth in net sales
• Improve cost structure (increase efficiency of material and outsourcing costs, advance in-house production)
Cost of sales ratio
Margin
• Increase operating expense efficiency
• Reduce admin. staff expenses
SG&A expense efficiency
• Improve cash-conversion cycle
TurnoverROE
Leverage
• Further strengthen governance of investments
• Reduce assets
• Utilize debt while considering financial soundness
Improve information disclosure through IR and
PR activities
Sharpen core competencies such as personnel training,
improve ESG
Through engagement
Through expansion of non-financial
capital
Working capital
efficiency
Fixed asset
efficiencyFY2022/3ROE target: 10% or higher
Financial and Capital Strategy
30 ANNUAL REPORT 2019

and other stakeholders around the world, and will mirror their feedbacks in management.
* Please see “Materiality Issues” on pages 36–37 for information on our efforts to increase non-financial capital. Please see “Relationships of Trust with Stakeholders” on pages 41–42 for details on our engagement with stakeholders
Review of Consolidated Performance in FY2019/3In the fiscal year ended March 31, 2019, consolidated net sales and profits both increased, and we set a record high for net income attributable to owners of the parent. Net sales expanded on growth in busi-ness for enterprises, centered on work-style innova-tion fields, and brisk demand in the network field for telecom carriers. Orders received were almost unchanged, reflecting the reactionary fall of orders for major projects in the previous year and cancellation of orders for mega solar projects. On the earnings front, profits increased on the back of strong improvement in profitability, despite increased spending on growth, thanks to greater cost efficiency and a higher ratio of sales of high-value-added projects, on top of stronger sales overall.
(¥ billion)
FY2018/3 FY2019/3
Orders received 287.8 284.7
Net sales 267.9 277.9
Gross margin 16.5% 17.2%
Operating income (Ratio to net sales)
11.1 (4.1%)
12.8 (4.6%)
Net income attribut-able to owners of the parent (Ratio to net
sales)
7.4 (2.7%)
8.9(3.2%)
ROE 7.6% 8.7%
Shareholder ReturnsUnder a healthy financial position, having secured the necessary funds for investing in growth, NESIC aims to provide stable returns to shareholders while taking into consideration shareholder expectations and comprehen-sive assessments of dividends on equity (DOE), consoli-dated earnings, and free cash flows. For shareholders
(FY)2020/3(Forecast)
2019/32018/32017/32016/32015/32014/32013/32012/32011/32010/32009/32008/32007/3
80
78
14
Cash Dividends per Share(¥)
Stable expansion in shareholder returnsPlans to increase dividends for 13th consecutive year
holding NESIC stock with long-term investment horizons, the Company emphasizes DOE over the dividend payout ratio, which can be swayed by short-term earnings, as a benchmark for dividends, with the objective of providing steady returns to shareholders. Based on this policy, NESIC distributed a dividend of ¥78 per share for the fiscal year ended March 31, 2019, an increase of ¥2 per share compared with its planned dividend and an increase of ¥4 per share over the fiscal year ended March 31, 2018, and plans to distribute a divi-dend of ¥80 per share for the fiscal year ending March 31, 2020, representing the 13th consecutive fiscal year of dividend increases. Regarding share buybacks, another form of shareholder returns, the Company bases its deci-sion on a comprehensive analysis of requirements for growth investments, the current share price, the cost of capital, and improvements in shareholder value.
Aiming to Sustain Improvements in Corporate ValueNESIC aims to realize an inclusive and sustainable soci-ety created through communications. To achieve this vision, we must become a “strong and attractive com-pany” that is supported and chosen by shareholders, investors, customers, employees, business partners, and other stakeholders. In addition to maximizing financial value centered on ROE and strengthening non-financial value based on materiality issues, I will spare no effort in regard to sustaining improvements in corporate value with the understanding of my role of engaging with all of our stakeholders to further their understanding of NESIC and its business activities.
31ANNUAL REPORT 2019

CO-CREATION IN ACTION 01
Tamba City Innovation in Regional Healthcare
Identification of Vaccination-Related Issues Mr. Kitano Vaccinations are key to living a healthy life, and must be administered 19 times to children between the ages of 0 and 3 years. Depending on the vaccine, the length of time that must pass before the next vacci-nation is administered is different. Citizens need to get their vaccinations in due time without forgetting, and doctors must make sure the correct vaccination is given. In Japan, cities are responsible for notifying their resi-dents about vaccinations and making sure that doctors administered the vaccinations, which entail a consider-able amount of work. Every year, there are dozens of cases involving improper handling of vaccinations, though this has yet to result in a major health problem. That is why I have long thought that this is a problem in need of a solution.Ms. Otsuki I also have viewed this as a problem. We began to look for a solution for managing vaccination-related administrative work, and have worked with NESIC over the past year or so to roll out a vaccination verification system.
Co-Creation in ActionYoshida We began building this system from scratch, a major challenge for NESIC. Although our direct customer is Tamba City, provided that both doctors and city resi-dents, in other words, the customers of our customer, would actually be using the system, we knew it would have to be a highly polished system when it rolls out. During the planning stage, we held discussions with Tamba City all day from morning till night. The city had a strong sense of mission, and was not looking for a par-tial solution. Mr. Kitano Since the system touches on the livelihoods of people, we could not make compromises on its secu-rity or convenience in any way. During the development phase, I occasionally expressed some harsh words to you, but I was also being grilled by the doctor’s associa-tion. At some points during the project, I could not see how it would end.Yoshida We frequently talked directly with the doctors. Even if doctors spend an extra minute with each patient, that means their workload increases by 100 minutes for every 100 patients. The doctors were therefore keen to minimize their workload as much as possible. This is
Tamba City, in Hyogo Prefecture, aims to strengthen its regional healthcare system, which is a pillar of the local community. Together with Tamba City, NESIC developed a vaccination verification system, the first ever in Japan. Below is an introduc-tion to the “co-creation in action” for this system, which has brought about major innovations to regional healthcare.
Resolving Customer Issues
NESIC
32 ANNUAL REPORT 2019

Targeted SDGs
why we put a huge amount of effort into the user inter-face, which is a determining factor for convenience. Following numerous discussions involving the both of you, we finally settled on a system that can finish proce-dures with a few taps without requiring any text input. Ms. Otsuki The finished system has received very posi-tive reviews from doctors. Doctors who were skeptical at the development stage gave positive feedback on its convenience after the system was deployed. In addition to increasing the vaccination rates of residents, the system eliminated administrative work for the city while providing real-time information on the status of vaccina-tions to citizens. I strongly believe the system has been helpful for everyone involved. Mr. Kitano Looking back, I feel that NESIC worked dili-gently until the conclusion of the project. When deploy-ing this system, I was reminded of the importance of trial and error when testing out new ideas, as well as of finding common ground between participants with dif-ferent perspectives in order to dive deeper into discus-sions on how to resolve issues together. We would not have been able to develop such a system that met our requirements without the commitment of the team at NESIC.
Yoshida The systems engineers I collaborated spent a considerable amount of time studying up on vaccina-tions. Looking back, I truly enjoyed the time I spent talk-ing to the doctors and Tamba City officials about how to improve the usability of the system. I was strongly encouraged when I found out that the doctors who were initially against the system were in support of it at the end. Due to the success of deploying this system with Tamba City, we have received inquiries from other municipalities about deploying it in their cities.
Creating Communities That Offer More Pleasant LifestylesMs. Otsuki NESIC and Tamba City are currently develop-ing a healthcare information communication system that will support the livelihoods of city residents from the standpoint of healthcare services. Everyone involved in this project is cooperating well together, partly because of the success of the vaccination verification system. Mr. Kitano I hope that this system will contribute to the creation of communities that offer more pleasant life-styles by improving healthcare from the standpoint of “caring” for city residents instead of “managing” them. Yoshida Tablets have already been distributed to health-care providers and new functions can be simply added, enabling various improvements. NESIC is keen to realize multifaceted solutions for issues faced by society.
MEMBERS
Under our motto of “No Attack! No chance!!,” we are creating communities based on our pillar of strengthening regional healthcare systems.
Mayor Shinichi Taniguchi
Special tablets are given to medi-cal institutions and IC cards are distributed to city residents eligi-ble for vaccinations. Tamba City and its medical institutions are connected over secure MVNO (Mobile Virtual Network Operator) networks, which are completely closed to ensure security. With this infrastructure, the system manages vaccination schedules and the status of vac-cinations for city residents.
System Overview
City Residents Doctors Tamba City
Determine necessary vaccina-tions by swiping IC card on a tablet
Register vaccination history
Dedicated server Identify vaccination status at each healthcare provider
E-mail notification for next vaccination
IC Card
Tablet
Yoshitaka YoshidaKobe Branch Office
NEC Networks & System Integration Corporation
Ms. Hidemi OtsukiHealth Section, Health Department
Tamba City
Mr. Hiroshi KitanoHealth Section, Health Department
Tamba City
33ANNUAL REPORT 2019

Zoom Contracts with First Sales Partner in Japan to Roll Out ServicesNoda NESIC has had personnel stationed in San Jose, California (U.S.) for quite a while with the objective of finding new products and services to market. When we came across the Zoom video conferencing solution, we were impressed by its extreme convenience, such as its compatibility with any device, its reliable communication capabilities, and the technology’s ability to convey a sense of immediacy and the vibe of meetings across space and time. NESIC has had experience using other video conferencing software as a part of its solutions for work-style innovation, but because Zoom was the best hands down, we contacted Zoom Video Communications about introducing their solution to the Japanese market.
Mr. Saga Actually, we were approached by a number of Japanese firms, but NESIC contacted us early on and we could sense the Company’s passion for our solutions. We were also drawn to NESIC by its approach for deploying communications technologies to improve the productivity of its organization, and therefore decided to enter into our first-in-Japan sales partnership agreement with NESIC in order to bring our solution to the Japanese market. Noda In Japan, companies were just beginning to seri-ously consider telework and remote work options, and customers were increasingly introducing these innovative work styles. I was really excited to be able to introduce the Zoom system to customers in Japan. We also assigned Zoom accounts to all of our employees so that the entire Company can experiment with how it can be used more.
NESIC Innovation in Co-Creation Work
CO-CREATION IN ACTION 02Creating Business with Business Partners
In September 2017, NESIC began domestic sales of the Zoom video conferencing solution developed by Zoom Video Communications, Inc., headquartered in Silicon Valley in the U.S. Zoom is an easy-to-use video conferencing system that connects people and organizations inside and outside companies anytime and anywhere. This system facilitates work-style innovation by enabling teleworkers and employees outside of the office to participate in internal meetings, while offering a new format for meetings and collaborative work with overseas business partners. Zoom, which has facilitated work-style innovation in a collaborative effort by NESIC and Zoom Video Communications, is already in use by over 500 companies in Japan.
Mr. Eric S. Yuan, CEO of Zoom Video Communications, Inc., and Osamu Noda, Senior Vice President at NESIC (at Zoom’s office)
34 ANNUAL REPORT 2019

Targeted SDGs
Major Benefits of Co-CreationMr. Saga I visited the head office of NESIC and was impressed by its forward-looking development of innova-tive solutions. I thought the concept and technologies behind SmoothSpace2 were quite innovative in that people are able to connect and conduct conferences with Zoom in real time and through life-size video. I was also very pleased to learn that the entire Company is committed to creating solutions through iterative improvements while applying the innovative solutions they have developed in their own operations. Noda Thank you for those words. SmoothSpace2 is able to simultaneously connect multiple Zoom Rooms (meet-ing rooms), giving you a lifelike experience through large projection screens. It is also possible to broaden the range of applications with multi-region connectivity and interactions with other Zoom subscribers. NESIC uses Zoom for communication between its bases across Japan and its overseas locations, and the customers who visit our premises to see it in action often end up using it the same way. Zoom is a new concept in com-munications that goes beyond the evolution of video conferencing, as it enables quick customer responses and greater work efficiency, such as through remote instruction and double-checking at local worksites.Mr. Saga As a single tool, Zoom can be paired with other hardware and innovations to create solutions that meet customer needs, and this would not have been possible without the help of NESIC. I can see the major benefits that have resulted from our co-creation with NESIC. Noda When creating new solutions, on occasion we find areas that could be improved from a technical standpoint, and convey these points to the head office in the U.S.
Mr. Saga Yes, I am aware that we have fine-tuned some services on the advice we received from NESIC. Our CEO Eric S. Yuan is someone who has built his career as an engineer, and we always want all of our customers to be happy with the services we provide. We therefore always welcome any feedback that can help make our services better. We highly value NESIC as not just a sales partner, but also as a partner for collaboration on the technology side.Noda I am extremely pleased to hear that. Zoom also offers the extra benefit of enhancing the reputation of the NESIC brand. When we approach a potential new customer and talk about Zoom, this more often than not heightens the customer’s interest in working with us.
Taking Our Capacity for Co-Creation GloballyMr. Saga During the launch phase for Zoom in Japan with NESIC, I was quite excited to hear that it would help realize work-style innovation and create new forms of communication. Noda Yes, we think Zoom can help resolve many issues in society, and could become a global standard for the development of new forms of communication around the world, in addition to our partnership in Japan. Mr. Saga I believe this can be done with NESIC as our partner. While mutually increasing value, I hope that we can develop new forms of communication never seen before and facilitate communication around the world.
MEMBERS
Mr. Fuminori SagaCountry General Manager, Japan
Zoom Video Communications, Inc.
Osamu NodaSenior Vice President and Member
of the Board
Executive General Manager, Digital Solutions Business Unit
Executive General Manager, Business Design Operations Unit
NEC Networks & System Integration Corporation
Features of EmpoweredOffice Work-Style Innovation Solutions
Help customers achieve work-style
innovation
Propose integrated products and
technologies to resolve customer issues
By projecting video on a wall, SmoothSpace2 facil-itates communication through a lifelike experi-ence between people in remote locations
35ANNUAL REPORT 2019

In May 2019, NESIC unveiled its new medium-term management plan, “Beyond Borders 2021.” The Company also identified six materiality issues that should be addressed in order to contribute to the sustainable development of society and its own sustainable growth.
Materiality Issues
Materiality Identification ProcessThe process for identifying materiality issues entailed discussions from various angles by the secretariat team, which involved the corporate planning, investor relations and CSR sections, within the context of a long-term stand-point and initiatives unique to NESIC, while taking into consideration the opinions of investors obtained at ESG meetings. Top management also repeatedly discussed the issues, earnestly debating which issues it should address in order to achieve sustainable development of society and the Company. After listening to the opinions of outside direc-tors, management determined specific materiality issues that NESIC should address.
An inclusive and sustainable society created through communications
Initiatives to Provide Value to Society through 2030
Create environments in which everyone can work more vigorously
Develop pleasant and plentiful communities with cutting-edge technologies
Provide robust services that underpin safety and security in evolving society
Initiatives for Growth at NESIC
Sound and highly transparent management
Strengthen governance through dialogue with stakeholders
Promote compliance with an eye on diversity
Strengthen innovation capabili-ties to create new value
Promote a culture that encour-ages change and embrace of new challenges
Accelerate co-creation and the use of various services in our own business practices to better understand the customers’ point of view
Create work environments where employees can work vigorously
Improve the well-being of employees
Encourage frank and open discussions, and enhance the corporate culture as a facilitator of self-growth
Vision for Society
Confirmation of social issues (overseas / domestic)
Global issues such as the SDGs, ISO 26000, and GRI were con-firmed, and megatrends listed by research institutions.
STEP1Interviews and internal discussion on important initiatives at NESIC
Interviews with top management and free discussions among top management were held on the vision for society and the vision for NESIC, within the context of important initiatives that the Company should undertake.
STEP 2
36 ANNUAL REPORT 2019

Vision for Society When identifying its materiality, NESIC came up with “an inclusive and sustainable society created through communications” as a long-term vision for society. Our aim is to create, through communications technologies, a society in which people all over the world can acquire the information they need and have equal access to education and healthcare. This is a society in which walls throughout the world will be torn down in order to realize peace through the promotion of open communication. The society that we aim for will also contribute to resolving various social issues through com-munications and the sharing of ideas between people all over the world.
こここここここここここここここここここここここここここここここここここここここここSDGsここここここここここここここ
Initiatives for growth at NESIC To continue growing as a company through such value creation efforts, NESIC must further strengthen its own business foundation. To this end, the Company has selected the following three priority initiatives. We believe communication, such as through co-creation and dialogue, is important for our own growth as a company.
Sound and highly transparent management Strengthen governance through dialogue with stakeholders Promote compliance with an eye on diversity
While aiming for further growth, NESIC engages in governance and compliance activities that form the foundation for continuing to be a sound company acknowledged by all stakeholders. Amid advances in diversity and accelerating co-creation and innovation, all of us need to take action based on high ethical standards in order to maintain and strengthen our relationship of trust with society. To that end, we will reinforce governance and pro-mote compliance through engaging in dia-logue with various stakeholders.
Strengthen innovation capabilities to create new value Promote a culture that encourages change and embrance of new challenges Accelerate co-creation and the use of various services in our own business practices to better understand the customers’ point of view
Innovation is the source of our ability to continue providing value to society. Management is focusing its efforts on encouraging employees to take on new challenges and spur new change through not only iterative improvements, but also various initiatives starting from scratch. We intend to offer new value through easier-to-use systems and services by accelerating efforts to co-create with stakeholders, using various services in our own business prac-tices to better understand the customers’ point of view.
Create work environments where employees can work vigorously Improve the well-being of employees Encourage frank and open discussions, enhance the corporate culture as a facilitator of self-growth
People are the source of innovation. As a front-runner in work styles, NESIC strives to create systems that allow employees to work without having to worry about their physical or mental health and have a bal-anced social life. Our aim is to nurture a corporate culture where employees are highly motivated and engage in frank and open discussions within an invigorating environment that facilitates self-growth. We aim to realize work environments that allow each and every employee to thrive and work to the best of their abilities.
Initiatives to Provide Value to Society through 2030NESIC has selected three initiatives to prioritize in its provision of value to society via communications through 2030.
Create environments in which everyone can work more vigorously
We aim to provide environments where everyone, regardless of age, gender, or nationality, can work vigorously and to the best of their abilities without regard to location.
Develop pleasant and plentiful commu-nities with cutting-edge technologies
We aim to help develop communities, such as smart cities, where people can lead exciting and fulfilling lives with safety and convenience, and where various informa-tion services are provided on robust com-munication platforms using the latest mobile technologies, etc.
Provide robust services that underpin safety and security in evolving society
We will support the development and advancement of ICT essential for economic growth by creating safe and secure services that offer high quality and national reach.
Candidate materiality issues and internal discussions
A list of candidate materiality issues was created based on the vision for society and the Company initiatives to be undertaken to realize the visions that were examined in steps 1 and 2, which was followed by dis-cussions with top management
STEP 3Interviews with outside directors
The candidate materiality issues proposed in Step 3 were explained to the outside directors, who offered their insight.
STEP 4Identification of materiality issues
The Executive Committee deter-mined materiality issues based on internal and external opinions. The issues were reported to the Board of Directors.
STEP 5
37ANNUAL REPORT 2019

NESIC’s greatest management resource is its human resources. We identified “create environments in which everyone can work more vigorously” as one of materiality initiative. While further refining systems so that our diverse workforce can continue to work with peace of mind, we endeavor to create an open organizational climate that provides venues for free discussion and encourages employees to take on challenges, in order to accelerate co-creation and innovation in a bid to create new value, giving all of our employees the opportunity to leverage their abilities to their fullest.
Basic ApproachBased on its basic policy for human resource develop-ment, NESIC takes a systematic and effective approach to training its employees so that they can leverage their qualifications and abilities to their fullest toward achiev-ing the Company’s management objectives.
Basic Policy for Human Resource Development(1) As a part of its management plan, NESIC continu-
ously, systematically, and strategically trains human resources based on rank.
(2) NESIC actively nurtures experts with specialized technical skills, knowledge, and know-how.
(3) NESIC creates a culture that encourages self-innova-tion and initiatives to develop one’s own capabilities.
(4) NESIC effectively trains personnel through an inte-grated human resource management system.
Hiring People Who Inspire InnovationRegarding hiring practices, based on its basic policy of reliably securing promising personnel by hiring new graduates, and acquiring human resources with exper-tise in technologies and businesses by recruiting experi-enced professionals, NESIC seeks out people who are willing and have the capability to take on challenges, who do not impose limits on themselves, and who are keen to innovate. NESIC has put in place systems for actively hiring vet-eran engineers with the expert knowledge and special-ized skills and extensive experience in domains different from those of the Company, in order to take advantage of cutting-edge/venture technologies, such as AI, cloud computing, and robotics, and to continue creating new businesses in a fast-moving process. Through these hiring activities, the Company aims to secure diverse human resources, nurture an innovation mind-set, and foster a corporate culture where employ-ees can maximize their individual abilities.
Human Resources and Organizational Climate
Creating Environments That Sustain Confortable Work StylesNESIC began its own efforts at work-style innovation more than 10 years ago. In addition to the introduction of its telework system, the Company combines a variety of cloud-based tools with cutting-edge/venture technol-ogies to resolve communication issues and various other problems, creating work environments that allow employees to work from home or satellite offices anytime, anywhere. We provide venues that enable co-creation as a single team across organizational and corporate borders. Starting in autumn 2019, NESIC will focus on imple-menting distributed work (see page 28). The Company has opened about 10 satellite offices in the Tokyo met-ropolitan area so that employees will not have to com-mute longer than 30 minutes, thereby reducing the physical and mental stress of commuting and creating opportunities for employees to reassess their work–life balance. By reducing the physical burden on employees and freeing up their time, we expect to see improve-ments in their motivation, more drive to self-improve by polishing their own skills or adding new skills, and sparks of innovation.
Telework Use (Fiscal year ended March 31, 2019)
2.6 days per month per employee
PC Mobile
Realizing a work style that is not bound by time or loca-tion, thanks to cutting-edge/venture technologies
Video conferencing solution
Communication platform
Cloud storage (file sharing)
38 ANNUAL REPORT 2019

Human Resource Strategy to Enhance Core Competencies
Ability to Create New BusinessesTo achieve the targets in the medium-term management plan “Beyond Borders 2021,” it is important that we con-tinue to create new businesses while strengthening our ability to co-create. NESIC established the Business Design Operations Unit, based on a Companywide digital transformation (DX) project it launched in 2018, with the objective of
Toward Accelerating InnovationPartnership Agreement with Plug and Play Tech Center in Silicon Valley, U.S.NESIC is accelerating the deployment of cutting-edge/venture technologies inside and outside Japan in response to major changes in technology. The Company is focusing particularly on business creation with startup firms, having established its Corporate Venture Capital (CVC) Fund and invested in other venture capital funds in the U.S. In July 2019, NESIC signed a partnership agreement with Plug and Play Tech Center (headquar-ters: California, U.S., founder and CEO: Saeed Amidi) with the intention of further strengthening the creation of business with startup firms, creating new businesses that go beyond its own boundaries, and advancing innova-tion. Together, we have taken steps to discover cutting-edge solutions/services. Along with this new partnership agreement, NESIC set up a booth on the main floor of Plug and Play Tech Center, and increased the number of employees stationed in the U.S. Our booth featured SmoothSpace2, a solution for visual and audio communications between separate spaces, connected to our head office in Tokyo, demonstrating its efficient way of com-municating using environments that provide the feeling of being in the same office space. By sharing a space with startup firms in the U.S., which have a different work culture, NESIC is able to put into practice work styles that spur co-creation and new innova-tion by invigorating bidirectional communication. We will con-tinue to train employees who are able to generate even higher value-added services.
The Plug and Play Tech Center is connected with NESIC using SmoothSpace2
enhancing its ability to create new businesses, one of its core competencies. In this unit, the Company plans to triple the number of specialists with the expertise and know-how in DX tech-nology, software, business development, and consulting, which currently stand at 20, over the next three years. We are focusing our efforts on creating new businesses in potential growth fields such as the DX business, work-style innovation, image recognition and analysis, and 5G services.
2018
2019
Companywide DX Project
Business Design Operations Unit
Strengthen capabilities of cutting-edge/venture technology experts, employees specializing in DX technology, busi-ness development, software technology, and consulting
Specialized Organizations
39ANNUAL REPORT 2019

Technological CapabilitiesTo further refine the broad range of technical skills that support our operations, we have defined Companywide high-priority qualifications that employees should obtain in a bid to improve their knowledge of technologies while covering the educational cost of obtaining these qualifications and offering courses taught by in-house instructors.
Companywide High-Priority Qualifications Information processing engineers (network specialists, registered information security specialists) Project management professionals First-class electrical work operation and management engineers
Human Resources and Organizational Climate
Supporting Career Advancement to Improve Motivation and Encourage Self-GrowthNESIC takes an integrated approach to human resource development that combines personnel systems and compensation, planned personnel rotations, and training opportunities at the appropriate time. Employees peri-odically discuss with their superiors about their career plans and progress on improving their skills with the intention of enhancing their own careers. We have frameworks in place to allow employees to take on new roles through an internal job posting system.
Internal Job Posting System
This system allows employees to apply for internal jobs on their own, responding to internal needs for per-sonnel resulting from moves into new business fields and greater focus on priority businesses.
Job Challenge System
This system encourages employees to take on new roles (new sections), mainly through skills development and career formation.
Position Entry SystemThis system allows employees to apply for desired positions within the Company.
Career Reviews
These reviews of work-related inter-ests, aptitude, and desires for trans-fers of employees are used by their superiors in career development and personnel training processes.
System Details
Securing engineers and passing down technical exper-tise are major issues for NESIC, a company involved in a wide variety of business fields. NESIC aims to expand the scope of activity for elderly people through its Senior Partner System for employees who have reached the mandatory retirement age but wish to continue working. Since the fiscal year ended March 31, 2016, the Company has maintained over 50% of continued employment after mandatory retirement. As more of our engineers with various qualifications and diverse experi-ences approach their retirement age, we will expand their range of opportunities to continue working after reaching the mandatory retirement age, passing down their technical knowledge to younger employees in a bid to maintain and strengthen our technological capabilities.
Supporting the Success of Women in the Workplace (Promoting diversity)It is important to promote diversity among employees in order to accelerate innovation, and our initiatives to pro-mote the empowerment of women in the workplace is one such initiative. We are advancing a variety of measures to this end, including initiatives to increase the ratio of women in management positions. Every year since the fiscal year ended March 31, 2017, as a company that believes in the importance of communication, we have held meet-ings for female employees to share their opinions with each other and with female outside directors. In the fiscal year ended March 31, 2019, we held such a meeting with directors (the President and two female outside directors) and 12 female employees (three senior managers and above, and nine newly appointed to management positions). The participants talked about what the Company needs to do to further pro-mote the success of women in the workplace, and their ideas will be reflected in future measures.
Target Ratio for Women in Management Positions
1,411 employeesTotal number of employees with high-priority qualifications:
49 employeesNumber of employees who acquired qualifications during the fiscal year ended March 31, 2019:
5% (3.7% as of March 31, 2019)By March 31, 2021
40 ANNUAL REPORT 2019

Maintaining and strengthening relationships of trust with stakeholders important to NESIC, such as its customers, employees, shareholders, investors, suppliers, and business partners, is essential to sustaining growth of the Company. We strive to reflect the opinions and requests of our stakeholders in management.
Communication with CustomersEver since its founding, NESIC has placed a high priority on creating relationships of trust with customers. In order to continue growing toward its aim of becoming a “strong and attractive company,” NESIC will continue efforts to win the trust and support of its customers by providing valuable services and solutions.
Relationships of Trust with Stakeholders
Communication between the President and EmployeesSince his appointment, the President Ushijima has consistently placed emphasis on his communication with employees. With more employees working from remote locations, such as through teleworking, and at local bases distantly located from the head office, it is becoming more important for the President to directly convey his message and hear the opinions of employees in order to share their thoughts. We aim to make communica-tion even more effective through various techniques and innovations.
Briefing for Medium-Term Management Plan “Beyond Borders 2021”“Beyond Borders 2021” is the new medium-term manage-ment plan that was launched in the fiscal year ending March 31, 2020. At a total of 15 briefings held in 10 loca-tions, the President conveyed his thoughts behind the new plan to all employees and explained in his own words the initiatives he is undertaking.
“Ushijima Lunch” Meetings“Ushijima Lunch” meetings are an opportunity for the President and young employees to openly share their opinions with each other. By talking frankly and openly about the President’s thoughts and the dreams of and daily issues faced by young employees, we aim to increase the motivation of younger people. In the fiscal year ending March 31, 2020, we started to have “Ushijima Lunch” meetings with general managers.
“Ushijima Radio”In February 2019, the President started an Internet broad-cast (streaming audio) so that everyone can hear his voice directly. In addition to providing his own thoughts as President, he aims to share opinions through two-way communication by addressing the thoughts and opinions of employees who listen to Ushijima Radio and the thoughts freely written down by employees on the in-house social network system. He answers questions about the medium-term management plan and work-style innovation, as well as inviting employees as guests to talk about the challenges they face in various fields, including a young employee involved in the Hayabusa 2 project. The ultimate aim is to pro-mote communication across boundaries formed by organization and rank.
Ushijima Radio recording session
Conveying Messages via In-House Digital SignageMessages from the President are shown on digital signage placed around offices as an alternative to bulletin boards. He posts brief messages such as “Let’s Break! (break ste-reotypes for creating the future)” and “Challenge!,” to draw the attention of employees to important topics and inspire them.
Message (“Let’s Break!”) from the President shown on in-house digi-tal signage
Main Initiatives
Hold NESIC Customer’s Fair, a private exhibition/seminar for customers (held in Tokyo and Osaka in 2019)
Conduct customer surveys to implement improvement measures by sharing the results within the Company (Annual survey and inquiries upon completion of projects)
Present awards for outstanding customer satisfaction activities (once a year)
Invite outside instructors to give presentations on cus-tomer satisfaction (once a year)
Topics in FY2019/3
Improvement in customer satisfaction index compared with the previous customer survey conducted in FY2018/3 (achieved highest score)
Examples of awards received from customers Award for rapidly repairing public communication facili-
ties in the wake of a major earthquake in Hokkaido Award for ensuring secure transition to modernized
communication platform for all customer locations, maintaining a high-quality deployment system over a six-year period
Award for a system using Wi-Fi and GPS that has con-tributed to the advancement of regional information and resolution of tourism issues
41ANNUAL REPORT 2019

Communication with Shareholders and InvestorsNESIC has a disclosure policy of explaining its business conditions and management policies to shareholders and other stakeholders in an accurate and timely manner. Management periodically engages in dialogue with shareholders and investors on capital markets in Japan and overseas, including through briefings and interviews. In addition to meetings through the investor relations section, NESIC periodically provides opportunities for dialogue with top management including the President, such as briefings for investors and one-on-one meetings (25 individual meetings were held with the President and/or Associate Senior Vice President in FY2019/3). Since the fiscal year ended March 31, 2018, meetings have been held with investors in charge of ESG. In the fiscal year ended March 31, 2019, a total of seven meetings were arranged between domestic and foreign institutional investors and the CSR sec-tion. The opinions and requests received from these meetings are directly reported to all Board members, including independent directors/auditors, from investor relations in an effort to engage in constructive dialogue with capital market participants.
Communication with SuppliersNESIC utilizes labor suppliers who subcontract work for installation, construction, and network integration orders received by NESIC, as well as hardware suppliers for pro-curing equipment used in system integration. NESIC views labor and hardware suppliers as important stake-holders essential for the operations of NESIC. NESIC holds briefings on business trends, visits the sites of sup-pliers, and conducts surveys as part of its efforts for valuing communication with suppliers. In the fiscal year ending March 31, 2020, the Company began strengthen-ing its collaborative structure and instilling awareness of suppliers in a bid to increase contributions to the SDGs throughout its supply chain, while promoting sustainable and ethical procurement activities.
Main Initiatives for Suppliers
Hold business trend briefings (once a year)
Hold safety and quality meetings (every other month)
Conduct inspections and surveys (CSR surveys, quality audits, information security audits) (for a total of 281 companies in FY2019/3)
Briefing on business trends with suppliers
Opinion (1) Investment decisions based on ESG must be considered from a long-term perspective.
The medium-term management plan should be viewed as a mile-stone for NESIC’s long-term vision beyond three years.
NESIC’s vision/mission is unclear due to its many priority businesses.
Response to these opinions:Under the medium-term manage-ment plan “Beyond Borders 2021,” which began in the fiscal year ending March 31, 2020, NESIC aims to be a company that achieves sus-tainable growth based on its vision for the future through 2030. To that end, the Company established the medium-term management plan by examining and drawing up key initia-tives that it should undertake in the next three years (see pages 24–27).
Opinion (2) As it does with its management strategy, I want NESIC to identify materiality issues (key manage-ment issues) that it believes are uniquely important from the stand-point of creating social value over the long term.
Response to this opinion:When reevaluating materiality issues to coincide with the announcement of its medium-term management plan, NESIC identified important issues based on two perspectives, namely initiatives for providing value to society and initiatives to achieve growth through 2030 (see pages 36–37).
Opinion (3) In addition to protecting minority shareholders as a listed subsidiary, I would like to know more about the benefits that NESIC stands to gain from its parent company. This information should be stated in its annual report.
Response to this opinion:The annual report now includes an explanation of the benefits on being a listed subsidiary in addition to protection for the interests of minor-ity shareholders (see page 46).
Examples of Opinions Received at Meetings with Investors and NESIC’s Responses
Relationships of Trust with Stakeholders
42 ANNUAL REPORT 2019

Relationships of Trust with Stakeholders
NESIC aims to reinforce corporate
governance while prioritizing
dialogue with stakeholders
Message from the Chairman
Maintaining and Improving Our Optimal Corporate Governance Structure
NESIC aims to resolve the issues of its customers and society through the design of more welcoming and con-venient communications so that everyone around the world can enjoy a safe, secure, and plentiful tomorrow, as exemplified by the NEC Networks & System Integration Corporation Group Statement. We believe corporate governance is the basis for our business activ-ities and a facilitator of sustainable growth and improve-ments in corporate value over the medium to long term. NESIC is one-of-a-kind in the sense that it benefits from being a member of the NEC Group and a listed company (see page 46). This also means that it is increasingly important to protect the rights of general shareholders, and management has been strengthening systems to protect their rights. Since 2016, NESIC has increased the number of independent directors and auditors who do not have any conflicts of interest with general shareholders. Today, three out of 10 directors are independent outside directors, and two out of four auditors are independent outside auditors. Over one-third of the members on the Board of Directors are inde-pendent outside directors or outside auditors. In order to ensure transparency in management, in 2016, NESIC established an advisory panel consisting mainly of out-side directors to discuss issues related to the nomina-tion and compensation of directors and auditors. As a result, in June 2019, the Company introduced a transfer-restricted stock compensation system with the objective of aligning the values of directors involved in business execution with those of shareholders. As the core busi-ness activities of NESIC center on communication, dia-logue with various stakeholders is highly valued. The investor relations department reports on the opinions of general shareholders and investors, and shares them with management to reflect them in business decisions. NESIC makes every effort to improve corporate value and ensure transparency in management by continuing to strengthen its corporate governance structure.
Reinforcing the Diversity and Oversight Functions of the Board of Directors
As the chairman of the Board of Directors, I make sure that all members, including outside directors, participate fully and enthusiastically in deliberations. To improve the quality of discussions, we have outside directors visit worksites to further their understanding of our busi-nesses. For important corporate matters and proposals presented to the Board of Directors, we hold pre- meeting briefings and exchange opinions while reflect-ing external opinions in our decision-making. For partic-ularly important matters, discussions are held several times by the Board of Directors. When creating the medium-term management plan, we held many lively discussions. I believe the makeup of our outside directors should emphasize diversity in terms of experience, knowledge, specialization, and gender, because opinions based on different backgrounds is important. In June 2019, NESIC welcomed Ms. Kuniko Muramatsu, who has advanced knowledge of CSR and corporate ethics, as a new out-side director. It has become increasingly important for companies to address social issues, including the SDGs. Also, I believe compliance is at the core of all business activi-ties. The NESIC Group engages in business with compli-ance as its highest priority in order to earn and maintain the trust of its stakeholders, including customers, share-holders, and citizens, as a company that works to resolve social issues. We will continue to contribute to society through our business activities, and with each and every employee acting with strong ethical views, we will make every effort to increase corporate value further.
Chairman of the Board
43ANNUAL REPORT 2019

Corporate Governance (As of June 30, 2019)
NESIC believes that enhancing corporate governance is critical for realizing an advanced society with vibrant communi-cation and for sustaining increases in corporate value. We therefore strive to build a management system that enables quick decision-making so that we can respond promptly to changes in the operating environment, and work to ensure management soundness and transparency by practicing timely, appropriate disclosure.
History of Enhancing Corporate Governance at NESIC
Measure Objective
2000 Introduces executive officer system Clearly separate supervisory function from business execution function
2005
Reduces number of directors to ten or fewer from 20 or fewer Expedite decision-making
Shortens directors’ term of office to one year Clarify management responsibilities of directors
2006Appoints first independent outside auditor (introduces independent director/auditor (ID/A) system)
Improve management transparency
2008 Appoints an independent outside director, increasing the number of ID/A to two Improve management transparency
2012
Appoints an independent outside director, increasing the number of ID/A to three
Improve management transparency
Appoints first female director Improve the diversity of directors
2015 Appoints an independent outside auditor, increasing the number of ID/A to four Improve management transparency
2016
Strengthens compliance with Corporate Governance Code: implements evalua-tion of the Board’s effectiveness and systematizes training for directors and cor-porate auditors
Strengthen management oversight function
Appoints first independent outside director with experience in corporate management
Improve diversity of directors
Establishes advisory panel consisting mainly of independent outside directors to discuss nomination and compensation
Improve management transparency
2017Appoints an independent outside director (a female CEO from a different indus-try), increasing the number of ID/A to fiveIntroduces stock-linked remuneration
Improve management transparency Improve the diversity of directors Enhance remuneration system linked to improvements in corporate value
2019 Introduces transfer-restricted stock remuneration system Enhance remuneration system linked to improvements in corporate value
Corporate Governance SystemBoard of DirectorsThe Board of Directors consists of 10 directors (eight men and two women), including three outside directors. NESIC endeavors to strengthen the management struc-ture, such as by clarifying the management responsibili-ties of each director, who serve one-year terms.
Board of Corporate AuditorsThe Board of Corporate Auditors consists of four audi-tors, including two outside auditors. The auditors con-duct business audits and accounting audits, and supervise directors on the performance of their duties.
Outside auditorsOutside directors
44 ANNUAL REPORT 2019

NESIC’s Business Execution, Management Oversight, and Internal Control Framework
Accounting Auditors
Corporate Ethics Hotline (Hotline for internal reporting and consultation)
Affiliates
Corporate Staff, and Marketing & Sales and Business Operations Units
and Divisions
Management Section of Affiliated Companies
Business Execution
Management and Supervision
Elect/Dismiss Elect/Dismiss
Audit
(Executive Officers)
Cooperate
Manage/Monitor
Cooperate
Supervise
Cooperate
Audit
Audit
Cooperate
Elect/Dismiss
Board of Corporate Auditors (Corporate Auditors)
General Meeting of Shareholders
Board of Directors (Directors)
Management Quality Improvement Committee
Corporate Auditing Division
Executive CommitteeBusiness Execution
Committee
Independent Directors / AuditorsTo further strengthen its corporate governance, since 2006, NESIC has nominated qualified independent directors and auditors who do not have any conflicts of interest with general shareholders. NESIC has a total of five independent directors and auditors, comprising three directors and two auditors, who satisfy the requirements for independent directors and auditors, as defined by the Tokyo Stock Exchange.
This represents more than one-third of the total number of directors and auditors. Regarding the composition of independent directors, NESIC aims to strengthen its corporate governance structure by promoting diversity, including the appoint-ment of a new director in June 2018 who has specialized knowledge in business administration and accounting, as well as a director in June 2019 who has advanced knowledge of corporate ethics and CSR.
Name Reason for Nomination Main Concurrent Positions
Attendance during FY2019/3
Board of Directors
Board of Corporate Auditors
Hisayoshi Fuwa
Hisayoshi Fuwa has extensive experience as a corporate manager, which has been benefit to management at the Company. He also has the ability to provide appropri-ate advice and ideas on the Company’s overall management from a standpoint inde-pendent from the managers who execute business. He is expected to continue to supervise management toward improvements in the Company’s corporate value.
— 13/13 —
Michiko Ashizawa
Michiko Ashizawa has the ability to provide appropriate advice and supervise the Company’s management from an objective standpoint, backed by her spe-cialized knowledge in business administration. She is expected to continue to supervise management toward improvements in the Company’s corporate value.
• Associate Professor, School of Economics and Business Administration, Yokohama City University
• Associate Professor, Graduate School of International Management, Yokohama City University
• Part-Time Instructor, Graduate School of Business Administration, Keio University
• Outside Director (audit and supervisory committee member), Netyear Group Corporation
11/11 —
Kuniko Muramatsu
Kuniko Muramatsu has the ability to provide appropriate advice and supervise the Company’s management from an objective standpoint, backed by her advanced knowledge of CSR and compliance and her global insight.
• Representative Director of the Board, Wellness Systems Institute
• Senior Researcher, Business Ethics Research Center• Outside Director, YOKOWO CO., LTD.
— —
Yuji Kikuchi
Yuji Kikuchi has specialized knowledge of the Companies Act and corporate gover-nance as an attorney. He is expected to supervise business execution from a fair and objective standpoint as an outsider through his extensive knowledge and experience.
• Partner, Tokyo Hatchobori Law Office 13/13 15/15
Masayuki Horie
Masayuki Horie possesses deep insight on internal controls and IT risk management in corporate management as a university professor. He has the ability to monitor the business execution of directors from a fair and objective standpoint as an outsider.
• Professor, College of Commerce, Nihon University 12/13 14/15
Notes:1. Michiko Ashizawa’s attendance at the Board of Directors meetings is for after her appointment as director at the 86th General Meeting of Shareholders held
on June 21, 2018.2. Kuniko Muramatsu was newly appointed as director at the 87th General Meeting of Shareholders held on June 21, 2019.
45ANNUAL REPORT 2019

Shares Held for Strategic ReasonsNESIC may own shares in other companies for the pur-pose of building, maintaining, and strengthening busi-ness ties and relationships. Shares held for strategic reasons are examined in detail every year by the Board of Directors in terms of whether the aim and meaning of owning these shares align with their cost of capital.
Fiscal Year Ended March 31, 2019
Category No. of RecipientsTotal Amount
(¥ million)
Directors 13 185
Outside directors 4 26
Auditors 4 44
Outside auditors 2 10
Notes:1. Directors who also serve as employees do not receive a salary (including
bonus) as an employee.2. Includes three directors who retired as of the 86th General Meeting of
Shareholders held on June 21, 2018.3. The director retirement bonus system was discontinued as of the conclu-
sion of the 75th General Meeting of Shareholders held on June 26, 2007.
Corporate Governance
Regarding the execution of voting rights for these strate-gic shareholdings, management decides whether to vote in approval or disapproval of matters based on a com-prehensive evaluation that centers on whether it contributes to medium- to long-term improvements in the corporate value of the NESIC Group and the com-pany in which it holds shares.
Director RemunerationTo maintain competitiveness in the industry and provide incentives to improve performance, remuneration for the Company’s directors is based on a compensation struc-ture set at appropriate levels while taking into account their duties and achievements in order to link their per-formance to corporate results. Remuneration consists of a monthly salary set at a level commensurate with rank, a bonus that reflects an evaluation of personal performance in the previous fiscal year, and incentives to improve medium- and long-term performance. For incentives to improve medium- and long-term performance, the Company has provided remuneration linked to its share price in the past. Starting in June 2019, however, NESIC introduced restricted-transfer stock remuneration with the objective of aligning the values of directors with those of share-holders, and increased the ratio of this remuneration to about 10% of the total. Remuneration for directors in non-executive positions is a fixed amount not linked to the Company’s perfor-mance in light of their role of supervising business execution. Director remuneration is determined by a representa-tive director authorized by the Board of Directors, within an upper limit for total remuneration set by resolution of the General Meeting of Shareholder based on compen-sation standards, while referring to the opinion of an advisory panel, which consists mainly of independent Board members (outside directors).
Breakdown of Director Remuneration
As a member of the NEC Group, NESIC benefits greatly from the privilege of being in charge of system building and main-tenance services among the services provided by NEC Group companies, and from being able to tap into recogni-tion of the NEC brand and having access to business resources, such as technological capabilities and human resources. In addition to the field of 5G, which has drawn attention of late NEC has exceptional technological capabili-ties in the digital realm, including facial recognition technol-ogy, which NESIC can actively deploy to increase corporate value. With that said, however, NESIC is an independent listed company that engages in business while making business decisions on its own accord. This translates into credibility as a listed company from our customers and business
partners, while improving the morale of our employees and making it easier to hire talented human resources. With a wide range of products and services that go beyond NEC products, NESIC is able to develop business in tune with the needs of its customers and society. Independent businesses generate over 70% of net sales. In particular, one of NESIC’s unique strengths is its application of the NEC Group’s relent-less focus on quality to the development of multivendor services. In order to benefit from these advantages as a member of the NEC Group and as a listed company, NESIC must have systems in place for protecting the rights of general share-holders. With this in mind, the Company is strengthening its corporate governance structure by, for example, enhancing the composition of its independent directors and auditors.
Relationship with Parent Company
Transfer-restricted stock remuneration
About 10%
Short-term performance-linked compensation
About 35%
Fixed compensation
About 55%
* Theoretical values calculated from standard amounts
46 ANNUAL REPORT 2019

Evaluation of the Board of Directors’ EffectivenessIn accordance with the Corporate Governance Code, NESIC evaluates the effectiveness of its Board of Directors every year, and makes diligent efforts toward its strengthening and improvement.
Corporate Governance
Message from the Newly Appointed Outside Director
I have served as the manager of the corporate communications department, head of the corporate ethics office, and leader of diversity promotion at a foreign semi-conductor manufacturer. They were followed by my role as an advisor for corporate ethics, diversity, and corporate governance based on the concept of creating foun-dations that enable organizations to drive sustainable growth. At NESIC, top management has made a commitment to giving compliance the highest priority, and I believe management has struck a balance between offensive and defensive approaches to business, clarifying the Company’s direction in the medium-term management plan. Management intends to accelerate innovation with an eye on longer-term growth, and I believe the spread of diversity and inclusion is fundamental to achieving this. An environment in which all employees can express their diverse viewpoints and leverage their skills will lead to improvements in their productivity as individuals and growth as a team. The Company’s operations are closely tied to resolving social issues, and communication is key to co-creation with such a diverse base of stakeholders, in my opinion. Utilizing the practical experience and specialized knowledge I gained from work-ing at a global company, I aim to help NESIC improve corporate value by providing advice from diverse viewpoints in order to heighten the effectiveness of the Company’s corporate governance even further.
Kuniko MuramatsuOutside Director
Initiatives to further increase
effectiveness
Enhance discussions on medium- to long-term business strategy, and provide more opportu-nities to follow up and exchange opinions on these discussions Expand opportunities to provide the knowl-edge necessary for directors to properly perform their expected duties and responsibilities
Evaluation results
In FY 2019/3, the evalua-tion concluded that the Board of Directors is functioning effectively and operating appropri-ately overall.
Evaluation method
Every year, all members of the Board of Directors fill out questionnaires on the overall effectiveness of the Board of Directors, and interviews are con-ducted with certain members.
Evaluation criteria
Composition of the Board of Directors Operational methods of the Board of Directors Role of the Board of Directors Support systems for Board members
47ANNUAL REPORT 2019

Dialogue on NESIC with Outside Directors
Key Changes in the Board of Directors over the Past Year
Ashizawa Looking back over the past year, there were a large number of matters related to new business, including partnerships with other companies. For instance, there were discussions on whether common goals existed with partner firms, and the nature of our complementary relationships. I believe NESIC began to take steps toward making solid advances. Fuwa The Company’s Board of Directors takes their time discussing matters. When deliberating on new busi-nesses, certain proposals were occasionally revised to reflect the opinions of the Board of Directors.
NESIC held a dialogue between two outside
directors where they exchanged their opin-
ions on changes in the Board of Directors
over the past year, with a focus on corporate
governance and strategic issues.
Ashizawa For developing new business, while prop-erly identifying risks, I believe the members of the Board of Directors take an “offensive” corporate governance posture of encouraging people to take on new challenges. Fuwa Compared with last year, the pre-meeting brief-ings on matters presented before the Board of Directors were more helpful this year. I believe this translated into more efficient and lively meetings of the Board of Directors. Furthermore, I see improvements in the man-agement of investment risks, an issue that was raised in last year’s annual report. From the standpoint of an out-side director, I shared my views on risks for each project with the Board of Directors, and during deliberations of matters, I made sure there was adequate discussion on specific issues in risk management. Ashizawa Speaking of risks, I think management should conduct further discussions on the burden placed on each company by the risks associated with NESIC’s increased collaboration with partner companies.
Hisayoshi FuwaOutside Director
2011 President, Representative Director of the Board and Chief Executive Officer (CEO), JVC KENWOOD Holdings, Inc. (currently JVC KENWOOD Corporation) President and Representative Director of the Board, Victor Company of Japan, Limited President, Kenwood Corporation President, J&K Car Electronics Corporation President and Representative Director of the Board, JVC KENWOOD Corporation
2012 Senior Adviser, JVC KENWOOD Corporation2016 Outside Director of the Company (present position)
48 ANNUAL REPORT 2019

a distance from these fields, giving them a fresh perspec-tive, in my opinion. In management, the situational awareness, ability to take action, and decisiveness to tackle issues of the management teams in charge of actual business execution are tested on a daily basis. By assessing these abilities from a comprehensive stand-point aligned with corporate governance, outside direc-tors are able to detect from a different angle important matters that may be overlooked by management.Ashizawa I have asked the Company to examine increasing the ratio of outside directors to at least one-third of the total, because diverse opinions are also valu-able for the Board. I believe there are two points to discuss with regard to corporate governance for a listed subsidiary like NESIC. The first is whether more synergies can be generated with its parent company. Directors from NEC have talked excitedly about this topic, and a lively discussion ensued. From the standpoint of enhancing corporate value, I believe it is also vital to hold discussions on NEC’s proposals for assets that could feasibly be utilized in projects, as well as on recent case studies at NEC. However, such discussions should always be framed within the context of
Further Strengthening “Offensive” Corporate Governance
Ashizawa I believe NESIC’s Board of Directors is grad-ually evolving from a management approach to monitor-ing business execution. In order to strengthen “offensive” corporate governance, I think management should spend more time discussing strategies. For example, more time needs to be spent on talking about broader strategies, even for individual projects. Instead of think-ing about risks and returns on an individual project basis, management should take a broader view that includes other businesses as well. It is also important to discuss the Companywide use of management resources within the context of management and financial strate-gies. I have already conveyed my concerns about these issues, and they have been shared with all members of the Board of Directors. Fuwa The executive officers have an abundance of knowledge and experience in specialized fields, while the outside directors have a duty to examine matters at
Michiko AshizawaOutside Director
1996 Joined Century Audit Corporation (currently KPMG AZSA LLC), International Department * Retired in May 2001
2003 Joined Industrial Revitalization Corporation of Japan2006 Joined Advantage Partners LLP
(currently Advantage Partners, Inc.)2013 Associate Professor in Faculty of Liberal Arts (currently
the School of Economics and Business Administration) at Yokohama City University (present position) Associate Professor in Graduate School of International Management at Yokohama City University (present position)
2016 Part-time instructor in Graduate School of Business Administration at Keio University (present position)
2018 Outside Director of the Company (present position)
49ANNUAL REPORT 2019

I think the Company should improve diversity in terms of gender representation and international experience. This applies not only to the makeup of the Board of Directors, but also to employees in order to spur innovation into the future. It is generally the male employees who come to the pre-meeting briefings for outside directors about business and other matters, but I believe the female employees I have met at periodic meetings for female employees also provide valuable opinions on various matters. As a first step, I would like to see the appoint-ment of a female executive officer as soon as possible.Fuwa The advisory panel also discusses director compensation, which has been linked to performance. In the discussion we had this fiscal year, we talked about the link between NESIC’s long-term vision and compensation, and I proposed grants of stock with restrictions on transfer. As a result, although the overall compensation framework does not change, the General Meeting of Shareholders approved the provision of a portion of compensation as stock grants. NESIC is a company with a high public utility and social profile, so I thought it would be effective to motivate directors to enhance corporate value from a longer-term perspective.
Vision for 2030 & Beyond Borders 2021 Medium-Term Management Plan
Ashizawa I give high marks to the Beyond Borders management plan, which aims to overcome existing frameworks from a variety of perspectives amid signifi-cant changes in the external environment. This medium-term management plan can truly leverage the Company’s capabilities such as its ability to take the lead over rivals to propose work-style innovations or platforms for dis-covering new products in Silicon Valley, for example. I think it is an exciting plan. Fuwa I agree. I believe now is the time for a drastic change in business structures, including business portfo-lios. The Company was not aware of this when drawing up the medium-term management plan, but when it was testing access in new markets several years ago, it examined how its existing technologies could be further refined. About two years ago, NESIC identified the spe-cific business domains on which to focus its energy and the combination of these domains (its business portfo-lio). That has led to strategic partnerships in recent years. The new medium-term management plan takes this momentum a step further, in my opinion.
protecting minority shareholders and, on this point, I am keenly aware of my responsibilities as an outside direc-tor. On the rare occasion, I criticize comments when I feel that they lean too much toward NEC’s perspective.Fuwa It is my understanding that the discussion on having outside directors represent more than one-third of the Board of Directors is not just about the ratio of members, but also about exercising the leadership of each Board member to create a governance framework that shareholders can accept. I am paying close atten-tion to this point. The directors from NEC comment from the viewpoint of their approach to corporate gover-nance of the Company. Outside auditors also freely state their opinions at meetings of the Board of Directors with the intention of maintaining and improv-ing the Company’s corporate governance structure. Ashizawa Various discussions were held by the advisory panel, and I voiced my opinions on diversity in particular. For example, the age group of directors tends to be the same generation as the President, so I would like to see more discussions on age diversity. Moreover,
Dialogue on NESIC with Outside Directors
I am excited to see how
the management plan will
leverage NESIC’s core
competencies. Ashizawa
50 ANNUAL REPORT 2019

Ashizawa We voiced our opinions when the medium-term management plan was being formulated. The expression “ability to create business,” one of the Company’s core competencies, is emblematic of NESIC’s strengths from the external standpoint of an outside director, and an example of its uniqueness. For example, NESIC employees discovered Zoom, a highly competi-tive product in the U.S., and turned it into a successful business in Japan. Although NESIC thinks this is a natural process, from an outsider’s perspective, I believe it is a source of its unique ability to create value. I believe pointing out strengths and weaknesses unaware to NESIC is an important role played by outside directors. Fuwa I think the medium-term management plan is a road map for achieving the Company’s vision of lever-aging its core competencies in pursuit of new business creation. Naturally, as the Company targets new domains with rivals also entering the fray, NESIC must reinforce its ability to analyze competitive factors of the market. In order to prosper in a fiercely competitive environ-ment, I believe the executive officer team needs to con-stantly ask themselves what NESIC’s value proposition is from a broad viewpoint, while leveraging its core com-petencies in both new and existing businesses. Our dis-cussions frequently include talk about the attractive aspects of markets or potential business partners. In my opinion, NESIC needs to think about what kinds of value it can provide through their highly compelling products and services. The other day, I talked with some manag-ers in the EmpoweredOffice business, and I am confident in their ability to create new value with the abundant know-how they have accumulated in the business. Ashizawa I believe NESIC should address two issues. The first is getting all employees, not just directors, on board with the Company’s strategic direction in order to ensure steady progress. To this end, the President needs to sound like a “broken record” and constantly talk about the strategic framework with employees at every opportunity for discussion. The second issue is the importance of conveying how NESIC provides value and contributes to society. I therefore think more emphasis needs to be placed on the Company’s message about contributing to the SDGs. It may be hard for people to understand how IT services can contribute to society, but taking EmpoweredOffice as an example, the Company can state its contribution to the SDGs in the context of reducing energy consumption while support-ing job satisfaction and economic growth. I intend to have more in-depth discussions at the Board of Directors on encouraging NESIC employees to think of themselves as global players and actively seek out knowledge out-side of the Company.
Fuwa I agree. Regarding the SDGs, I think it is impor-tant for NESIC to explore an open society and discover value that will be necessary to society in the future while expanding across the borders of current markets. This rings true in its Beyond Borders slogan. Together with the executive officers, I will do my best to reflect this on management going forward.
I think now is the time for
a drastic change in
business structures. Fuwa
51ANNUAL REPORT 2019

Directors & Corporate Auditors (As of June 21, 2019)
Masao WadaChairman of the Board
Osamu NodaSenior Vice President and Member of the Board
Yushi UshijimaPresident
Junji AshidaMember of the Board
Morihiko KudoMember of the Board
Masafumi GoujiSenior Vice President and Member of the Board
Hisayoshi FuwaMember of the Board(Outside Director)
Michiko AshizawaMember of the Board(Outside Director)
Kuniko MuramatsuMember of the Board(Outside Director)
Hiroyuki SekizawaSenior Vice President and Member of the Board
Directors
52 ANNUAL REPORT 2019

Directors & Corporate Auditors (As of June 21, 2019)
Komei SakanashiCorporate Auditor (Full-Time)
Naoki IwasakiCorporate Auditor (Full-Time)
Yuji KikuchiCorporate Auditor (Outside Auditor)
Masayuki HorieCorporate Auditor (Outside Auditor)
Corporate management
Business administration and planning
Finance and accounting Legal affairs
Internal controls and risk
managementCSR
Hisayoshi FuwaMember of the Board(Outside Director)
Michiko AshizawaMember of the Board(Outside Director)
Kuniko MuramatsuMember of the Board(Outside Director)
Yuji KikuchiCorporate Auditor (Outside Auditor)
Masayuki HorieCorporate Auditor (Outside Auditor)
Corporate Auditors
Backgrounds and Specializations of Outside Directors and Outside Auditors
53ANNUAL REPORT 2019

Corporate Overview (As of March 31, 2019)
Name NEC Networks & System Integration Corporation
Head Office Iidabashi First Tower,
2-6-1 Koraku, Bunkyo-ku, Tokyo
112-8560, Japan
URL: https://www.nesic.co.jp/english/
Established December 1, 1953
Registered as a Stock Company November 26, 1953
Capital ¥ 13,122,000,000
Number of Employees 4,841 (Non-consolidated), 7,743 (Consolidated)
Fiscal Year April 1–March 31
Ordinary General Shareholders Meeting Annual meeting held in June
Listing Tokyo Stock Exchange, First Section
Ticker Code 1973
Accounting Auditor KPMG AZSA LLC
Transfer Agent Sumitomo Mitsui Trust Bank, Limited
1-4-1, Marunouchi, Chiyoda-ku, Tokyo
100-8233, Japan
SNAM Sustainability Index
Certified Health and Productivity Management
Organization 2019
Top Hundred Telework Pioneers
“Kurumin” certification mark*1
Highest-grade “Eruboshi” certification*2
Outside Evaluations
Major Consolidated Subsidiaries
Overseas
NESIC BRASIL S/A
NESIC (Thailand) Ltd.
NESIC PHILIPPINES, INC.
Networks & System Integration Saudi Arabia Co. Ltd.
ICT Star Group Myanmar Co., Ltd.
Japan
NEC Magnus Communications, Ltd.
NICHIWA Co.
NEC Net Innovation, Ltd.
Q&A Corporation
K&N System Integrations Corporation
NEC Networks & System Integration Services, Ltd.
*1 The “Kurumin” mark is a symbol of the certification granted to companies that have established an action plan and achieved targets in accordance with Japan’s Act on Advancement of Measures to Support Raising Next-Generation Children.
*2 The “Eruboshi” logo is a symbol of the certification granted to companies that have formulated an action plan in accordance with Japan’s Act on Promotion of Women’s Participation and Advancement in the Workplace, and are implementing initiatives to a high standard.
54 ANNUAL REPORT 2019

Stock Information (As of March 31, 2019)
Number of Shareholders 7,591
Common Stock Authorized 100,000,000 shares
Issued 49,773,807 shares
Trading Unit 100 shares
Major Shareholders (Top 10)
Name of Shareholder
Number of Shares Held (Thousands)
Percentage of Total Shares Outstanding
(%)
NEC Corporation 19,106 38.49
Japan Trustee Services Bank, Ltd.*1 (Sumitomo Mitsui Trust Bank, Limited beneficiary trust account, NEC Corporation retirement benefit trust account)
6,400 12.89
Japan Trustee Services Bank, Ltd. (Trust account) 3,852 7.76
The Master Trust Bank of Japan, Ltd. (Trust account) 2,899 5.84
Sumitomo Realty & Development Co., Ltd. 1,200 2.42
Japan Trustee Services Bank, Ltd. (Trust account No. 9) 1,034 2.08
Employees’ Stock Ownership Plan 697 1.41
GOVERNMENT OF NORWAY 649 1.31
THE BANK OF NEW YORK MELLON 140044 502 1.01
SSBTC CLIENT OMNIBUS ACCOUNT 491 0.99
*1 Shares held by Japan Trustee Services Bank, Ltd. (Sumitomo Mitsui Trust Bank, Limited beneficiary trust account, NEC Corporation retirement benefit trust account) give NEC Corporation material voting rights because NEC Corporation has contributed shares of the Company to its retirement benefit trust. The percentage of material voting rights held by NEC Corporation as of March 31, 2019 was 51.48%.
*2 Percentage of total shares outstanding is calculated based on the total number of shares outstanding minus trea-sury stock (138,615 shares) and effectively non-held stock (100 shares) despite the Company being listed on the shareholder registry for this stock.
Breakdown of Shareholders by Type(%)
(FYE)
80
100
60
40
20
02017/3
8.60.3
21.2
41.1
1.0
27.8
2016/3
8.00.3
23.6
41.0
0.6
26.6
2015/3
7.40.3
17.2
41.1
0.4
33.6
2018/3
8.20.3
18.7
41.2
0.9
30.7
2019/3
7.10.3
21.9
41.2
0.7
28.8
Financial institutions Investment securities firms Other institutions Foreign entities (institutions, individuals) Individuals and others Treasury stock
55ANNUAL REPORT 2019

56 ANNUAL REPORT 2019

Financial Section58 CONSOLIDATED TEN-YEAR SUMMARY
CONSOLIDATED FINANCIAL STATEMENTS
60 CONSOLIDATED BALANCE SHEETS
62 CONSOLIDATED STATEMENTS OF INCOME
63 CONSOLIDATED STATEMENTS OF COMPREHENSIVE INCOME
64 CONSOLIDATED STATEMENTS OF CHANGES IN NET ASSETS
66 CONSOLIDATED STATEMENTS OF CASH FLOWS
68 NOTES TO CONSOLIDATED FINANCIAL STATEMENTS
88 INDEPENDENT AUDITOR’S REPORT
57ANNUAL REPORT 2019

CONSOLIDATED TEN-YEAR SUMMARY
FY2010/3 FY2011/3 FY2012/3 FY2013/3 FY2014/3 FY2015/3 FY2016/3 FY2017/3 FY2018/3 FY2019/3
Performance Indicators (Millions of yen) (Thousands of U.S. dollars) *1
Orders received ¥222,046 ¥212,277 ¥215,373 ¥241,271 ¥280,071 ¥299,097 ¥274,946 ¥279,241 ¥287,831 ¥284,739 $2,565,447
Net sales 217,727 217,948 204,658 235,716 270,326 292,164 279,961 257,912 267,939 277,949 2,504,270
Gross profit 32,938 33,132 32,079 37,182 44,690 48,110 45,162 42,585 44,265 47,681 429,597
Operating income 9,867 10,835 9,747 12,483 14,418 16,158 14,111 9,974 11,057 12,774 115,091
Operating income to net sales (%) 4.5 5.0 4.8 5.3 5.3 5.5 5.0 3.9 4.1 4.6 —
Net income attributable to owners of the parent 5,644 4,660 4,474 7,246 8,257 7,791 5,996 6,549 7,357 8,885 80,052
Financial Condition (Fiscal year end) (Millions of yen) (Thousands of U.S. dollars) *1
Total assets*2 ¥146,543 ¥149,464 ¥149,130 ¥167,472 ¥189,059 ¥201,904 ¥196,505 ¥197,386 ¥207,643 ¥216,171 $1,947,661
Net assets 73,849 77,005 80,074 85,974 89,166 94,173 94,397 96,674 101,732 107,608 969,528
Owner’s equity 73,213 76,445 79,503 85,266 87,514 92,559 92,738 94,611 99,473 104,888 945,022
Cash Flows (Millions of yen) (Thousands of U.S. dollars) *1
Cash flows from operating activities ¥16,070 ¥ (1,595) ¥18,595 ¥ (1,723) ¥23,313 ¥ 2,460 ¥ 9,435 ¥22,634 ¥ 4,779 ¥ 8,396 $ 75,646
Cash flows from investing activities (1,885) (1,904) (2,648) (3,429) (5,504) (3,929) (2,822) (2,697) (2,802) (5,604) (50,491)
Free cash flows 14,184 (3,499) 15,946 (5,152) 17,809 (1,469) 6,613 19,936 1,976 2,791 25,155
Cash flows from financing activities (1,382) (337) (3,979) (2,066) (3,824) (4,127) (1,402) (4,144) (4,366) (5,615) (50,590)
Cash and cash equivalents at end of year 29,514 25,587 37,456 30,315 44,434 38,951 43,889 59,648 57,281 54,354 489,719
Per-Share Indicators (Yen) (Thousands of U.S. dollars) *1
EPS ¥ 113.50 ¥ 93.72 ¥ 89.98 ¥ 145.73 ¥ 166.06 ¥ 156.72 ¥ 120.80 ¥ 131.94 ¥ 148.23 ¥ 179.02 $ 1.61
BPS 1,472.14 1,537.19 1,598.77 1,714.74 1,760.06 1,864.61 1,868.25 1,906.03 2,004.04 2,113.19 19.04
Cash dividends 25.00 26.00 28.00 45.00 60.00 64.00 70.00 72.00 74.00 78.00 0.70
Key Indicators (%)
ROE*3 8.0 6.2 5.7 8.8 9.6 8.7 6.5 7.0 7.6 8.7 —
ROA*4 6.7 7.3 6.3 7.7 8.2 8.3 7.1 5.1 5.4 6.1 —
Owner’s equity ratio 50.0 51.1 53.3 50.9 46.3 45.8 47.2 47.9 47.8 48.5 —
DOE 1.8 1.7 1.8 2.7 3.5 3.5 3.8 3.8 3.8 3.8 —
Payout ratio 22.0 27.7 31.1 30.9 36.1 40.8 57.9 54.6 49.9 43.6 —
Other
Number of employees 5,998 5,939 5,936 6,024 7,164 7,260 7,464 7,572 7,657 7,743 —
Number of shares outstanding (FYE) 49,773,807 49,773,807 49,773,807 49,773,807 49,773,807 49,773,807 49,773,807 49,773,807 49,773,807 49,773,807 —
*1 U.S. dollar amounts have been translated from yen, for convenience only, at the rate of ¥110.99 = US$1.00 as of March 31, 2019.*2 Partial revisions to accounting standards for tax-benefit accounting (Corporate Accounting Standard No. 28, February 16, 2018) have been adopted from
the fiscal year ended March 31, 2019. Accordingly, the figures for the fiscal year ended March 31, 2015 to the fiscal year ended March 31, 2018 have been retroactively adjusted to comply with this revision.
*3 ROE (Return on Equity): Net income attributable to owners of the parent / Owner’s equity during the term [Average of owner’s equity at the beginning of the term and at the end of the term] x 100
*4 ROA (Return on Assets): Ordinary income / Total assets during the term [Average of total assets at the beginning of the term and at the end of the term] x 100
58 ANNUAL REPORT 2019

CONSOLIDATED TEN-YEAR SUMMARY
FY2010/3 FY2011/3 FY2012/3 FY2013/3 FY2014/3 FY2015/3 FY2016/3 FY2017/3 FY2018/3 FY2019/3
Performance Indicators (Millions of yen) (Thousands of U.S. dollars) *1
Orders received ¥222,046 ¥212,277 ¥215,373 ¥241,271 ¥280,071 ¥299,097 ¥274,946 ¥279,241 ¥287,831 ¥284,739 $2,565,447
Net sales 217,727 217,948 204,658 235,716 270,326 292,164 279,961 257,912 267,939 277,949 2,504,270
Gross profit 32,938 33,132 32,079 37,182 44,690 48,110 45,162 42,585 44,265 47,681 429,597
Operating income 9,867 10,835 9,747 12,483 14,418 16,158 14,111 9,974 11,057 12,774 115,091
Operating income to net sales (%) 4.5 5.0 4.8 5.3 5.3 5.5 5.0 3.9 4.1 4.6 —
Net income attributable to owners of the parent 5,644 4,660 4,474 7,246 8,257 7,791 5,996 6,549 7,357 8,885 80,052
Financial Condition (Fiscal year end) (Millions of yen) (Thousands of U.S. dollars) *1
Total assets*2 ¥146,543 ¥149,464 ¥149,130 ¥167,472 ¥189,059 ¥201,904 ¥196,505 ¥197,386 ¥207,643 ¥216,171 $1,947,661
Net assets 73,849 77,005 80,074 85,974 89,166 94,173 94,397 96,674 101,732 107,608 969,528
Owner’s equity 73,213 76,445 79,503 85,266 87,514 92,559 92,738 94,611 99,473 104,888 945,022
Cash Flows (Millions of yen) (Thousands of U.S. dollars) *1
Cash flows from operating activities ¥16,070 ¥ (1,595) ¥18,595 ¥ (1,723) ¥23,313 ¥ 2,460 ¥ 9,435 ¥22,634 ¥ 4,779 ¥ 8,396 $ 75,646
Cash flows from investing activities (1,885) (1,904) (2,648) (3,429) (5,504) (3,929) (2,822) (2,697) (2,802) (5,604) (50,491)
Free cash flows 14,184 (3,499) 15,946 (5,152) 17,809 (1,469) 6,613 19,936 1,976 2,791 25,155
Cash flows from financing activities (1,382) (337) (3,979) (2,066) (3,824) (4,127) (1,402) (4,144) (4,366) (5,615) (50,590)
Cash and cash equivalents at end of year 29,514 25,587 37,456 30,315 44,434 38,951 43,889 59,648 57,281 54,354 489,719
Per-Share Indicators (Yen) (Thousands of U.S. dollars) *1
EPS ¥ 113.50 ¥ 93.72 ¥ 89.98 ¥ 145.73 ¥ 166.06 ¥ 156.72 ¥ 120.80 ¥ 131.94 ¥ 148.23 ¥ 179.02 $ 1.61
BPS 1,472.14 1,537.19 1,598.77 1,714.74 1,760.06 1,864.61 1,868.25 1,906.03 2,004.04 2,113.19 19.04
Cash dividends 25.00 26.00 28.00 45.00 60.00 64.00 70.00 72.00 74.00 78.00 0.70
Key Indicators (%)
ROE*3 8.0 6.2 5.7 8.8 9.6 8.7 6.5 7.0 7.6 8.7 —
ROA*4 6.7 7.3 6.3 7.7 8.2 8.3 7.1 5.1 5.4 6.1 —
Owner’s equity ratio 50.0 51.1 53.3 50.9 46.3 45.8 47.2 47.9 47.8 48.5 —
DOE 1.8 1.7 1.8 2.7 3.5 3.5 3.8 3.8 3.8 3.8 —
Payout ratio 22.0 27.7 31.1 30.9 36.1 40.8 57.9 54.6 49.9 43.6 —
Other
Number of employees 5,998 5,939 5,936 6,024 7,164 7,260 7,464 7,572 7,657 7,743 —
Number of shares outstanding (FYE) 49,773,807 49,773,807 49,773,807 49,773,807 49,773,807 49,773,807 49,773,807 49,773,807 49,773,807 49,773,807 —
*1 U.S. dollar amounts have been translated from yen, for convenience only, at the rate of ¥110.99 = US$1.00 as of March 31, 2019.*2 Partial revisions to accounting standards for tax-benefit accounting (Corporate Accounting Standard No. 28, February 16, 2018) have been adopted from
the fiscal year ended March 31, 2019. Accordingly, the figures for the fiscal year ended March 31, 2015 to the fiscal year ended March 31, 2018 have been retroactively adjusted to comply with this revision.
*3 ROE (Return on Equity): Net income attributable to owners of the parent / Owner’s equity during the term [Average of owner’s equity at the beginning of the term and at the end of the term] x 100
*4 ROA (Return on Assets): Ordinary income / Total assets during the term [Average of total assets at the beginning of the term and at the end of the term] x 100
59ANNUAL REPORT 2019

CONSOLIDATED BALANCE SHEETSNEC Networks & System Integration Corporation and Consolidated Subsidiaries As of March 31, 2019 and 2018
Millions of yen
Thousands of U.S. dollars
(note 3)
2019 2018 2019
ASSETS
Current assets:
Cash and cash equivalents ¥ 54,354 ¥ 57,281 $ 489,719
Notes and accounts receivable (notes 4 and 23) 106,553 103,911 960,023
Electronically recorded monetary claims (note 4) 606 494 5,459
Inventories (note 7) 13,181 8,237 118,758
Other current assets 6,423 5,414 57,870
Allowance for doubtful accounts (82) (121) (738)
Total current assets 181,036 175,218 1,631,101
Non-current assets:
Property and equipment
Land 2,410 2,410 21,713
Buildings and structures 10,033 9,763 90,395
Machinery, equipment and vehicles 173 182 1,558
Tools, furniture and fixtures 15,016 14,826 135,291
Construction in progress 499 222 4,495
Other 392 258 3,531
Accumulated depreciation (18,309) (17,570) (164,960)
Property and equipment, net 10,217 10,093 92,053
Intangibles, net of accumulated amortization (note 8) 6,234 5,384 56,167
Investments and other assets
Investment securities (notes 5 and 6) 635 516 5,721
Asset for retirement benefits (note 11) 364 444 3,279
Deferred tax assets (note 10) 13,600 12,714 122,533
Other assets (note 23) 4,144 3,309 37,336
Allowance for doubtful accounts (62) (37) (558)
Total investments and other assets 18,682 16,947 168,321
Total non-current assets 35,134 32,425 316,551
Total assets ¥216,171 ¥207,643 $1,947,661
60 ANNUAL REPORT 2019

Millions of yen
Thousands of U.S. dollars
(note 3)
2019 2018 2019
LIABILITIES AND NET ASSETS
Current liabilities:
Short-term bank loans (note 9) ¥ 2,284 ¥ 4,086 $ 20,578
Current installments of long-term debt (note 9) 231 3,171 2,081
Notes and accounts payable (notes 4 and 23) 40,274 39,574 362,861
Electronically recorded obligations 807 728 7,270
Advances received (note 23) 6,290 3,811 56,671
Accrued income taxes (note 10) 3,175 3,768 28,606
Accrued bonuses to directors 117 102 1,054
Accrued warranty on products 113 116 1,018
Accrued losses on sales contracts (note 7) 1,980 557 17,839
Other current liabilities 17,053 16,957 153,644
Total current liabilities 72,328 72,874 651,662
Non-current liabilities:
Long-term debt (note 9) 3,896 842 35,102
Liability for retirement benefits (note 11) 30,609 30,428 275,781
Other liabilities (notes 10 and 12) 1,729 1,765 15,577
Total non-current liabilities 36,234 33,037 326,461
Total liabilities 108,562 105,911 978,124
Shareholders’ equity (note 13):
Common stock: 13,122 13,122 118,226
Authorized 100,000,000 shares; issued and outstanding 49,773,807 shares at March 31, 2019 and 2018
Capital surplus 16,659 16,655 150,094
Retained earnings 79,520 74,357 716,460
Treasury stock, at cost; 138,615 shares at March 31, 2019 and 137,435 shares at March 31, 2018
(279) (276) (2,513)
Total shareholders’ equity 109,022 103,858 982,268
Accumulated other comprehensive income:
Net unrealized holding gains on other securities (note 5) 31 42 279
Foreign currency translation adjustments (471) (374) (4,243)
Accumulated adjustments for retirement benefits (note 11) (3,694) (4,053) (33,282)
Total accumulated other comprehensive income (4,134) (4,385) (37,246)
Non-controlling interests 2,719 2,258 24,497
Total net assets 107,608 101,732 969,528
Total liabilities and net assets ¥216,171 ¥207,643 $1,947,661
The accompanying notes to consolidated financial statements are an integral part of these consolidated financial statements.
61ANNUAL REPORT 2019

CONSOLIDATED STATEMENTS OF INCOMENEC Networks & System Integration Corporation and Consolidated Subsidiaries Years ended March 31, 2019 and 2018
Millions of yen
Thousands of U.S. dollars
(note 3)
2019 2018 2019
Net sales (note 23) ¥277,949 ¥267,939 $2,504,270
Cost of sales (notes 7 and 23) 230,268 223,674 2,074,673
Gross profit 47,681 44,265 429,597
Selling, general and administrative expenses (notes 16 and 17)
34,906 33,208 314,496
Operating income 12,774 11,057 115,091
Other income (expense):
Interest income 40 35 360
Interest expense (95) (127) (855)
Dividends income of insurance 193 197 1,738
Insurance benefit 70 41 630
Gains on sale of investments in subsidiaries and affiliates
— 38 —
Gain on sales of non-current assets (note 18) — 283 —
Loss on disposal of non-current assets (53) (120) (477)
Foreign exchange loss (43) (51) (387)
Business restructuring expenses for subsidiaries and affiliates
— (56) —
Other, net 136 (18) 1,225
Subtotal 248 222 2,234
Income before income taxes 13,023 11,279 117,334
Income taxes (note 10):
Current 4,894 4,548 44,094
Deferred (1,052) (790) (9,478)
Subtotal 3,842 3,757 34,615
Net Income 9,180 7,521 82,710
Net Income attributable to:
Non-controlling interests 295 164 2,657
Owners of the parent ¥ 8,885 ¥ 7,357 $ 80,052
The accompanying notes to consolidated financial statements are an integral part of these consolidated financial statements.
62 ANNUAL REPORT 2019

CONSOLIDATED STATEMENTS OF COMPREHENSIVE INCOMENEC Networks & System Integration Corporation and Consolidated Subsidiaries Years ended March 31, 2019 and 2018
Millions of yen
Thousands of U.S. dollars
(note 3)
2019 2018 2019
Net Income ¥9,180 ¥7,521 $82,710
Other comprehensive income arising during the year (note 19):
Net unrealized holding loss on other securities (11) 7 (99)
Foreign currency translation adjustments (143) 81 (1,288)
Adjustments for retirement benefit 359 1,101 3,234
Share of other comprehensive income of entities accounted for using equity method
(1) 0 (9)
Total other comprehensive income arising during the year
203 1,190 1,828
Comprehensive income ¥9,383 ¥8,712 $84,539
Comprehensive income attributable to:
Owners of the parent ¥9,136 ¥8,486 $82,313
Non-controlling interests 247 225 2,225
The accompanying notes to consolidated financial statements are an integral part of these consolidated financial statements.
63ANNUAL REPORT 2019

CONSOLIDATED STATEMENTS OF CHANGES IN NET ASSETSNEC Networks & System Integration Corporation and Consolidated Subsidiaries Years ended March 31, 2019 and 2018
Numbers of shares of
common stock(Thousands)
Millions of yen
Shareholders’ equity
Common stock
Capital surplus
Retained earnings
Treasury stock Total
Balance at April 1, 2017 49,773 ¥13,122 ¥16,652 ¥70,622 ¥(272) ¥100,124
Changes arising during the year:
Cash dividends (3,623) (3,623)
Profit attribute to owners of the parent 7,357 7,357
Purchase of treasury stock (4) (4)
Disposition of treasury stock 0 0 0
Change in ownership interest of parent due to transactions with non-controlling interests
3 3
Net changes in accounts other than shareholders’ equity —
Total changes during the year — — 3 3,734 (4) 3,733
Balance at March 31, 2018 49,773 13,122 16,655 74,357 (276) 103,858
Changes arising during the year:
Cash dividends (3,722) (3,722)Profit attribute to owners of the parent 8,885 8,885Purchase of treasury stock (3) (3)Disposition of treasury stock 0 0 0Change in ownership interest of parent due to capital increase of consolidated subsidiaries
4 4
Net changes in accounts other than shareholders’ equity —
Total changes during the year — — 4 5,163 (3) 5,164Balance at March 31, 2019 49,773 ¥13,122 ¥16,659 ¥79,520 ¥(279) ¥109,022
Millions of yen
Accumulated other comprehensive income
Net unrealized holding gains
on other securities
Foreign currency
translation adjustments
Accumulated adjustments
for retirement benefits Total
Non-controlling interests
Total net assets
Balance at April 1, 2017 ¥ 35 ¥(394) ¥(5,154) ¥(5,513) ¥2,062 ¥ 96,674
Changes arising during the year:
Cash dividends — (3,623)
Profit attribute to owners of the parent — 7,357
Purchase of treasury stock — (4)
Disposition of treasury stock — 0
Change in ownership interest of parent due to transactions with non-controlling interests
— 3
Net changes in accounts other than shareholders’ equity 7 20 1,101 1,128 196 1,324
Total changes during the year 7 20 1,101 1,128 196 5,057
Balance at March 31, 2018 42 (374) (4,053) (4,385) 2,258 101,732
Changes arising during the year:
Cash dividends — (3,722)Profit attribute to owners of the parent — 8,885Purchase of treasury stock — (3)Disposition of treasury stock — 0Change in ownership interest of parent due to capital increase of consolidated subsidiaries
— 4
Net changes in accounts other than shareholders’ equity (11) (97) 359 250 460 711
Total changes during the year (11) (97) 359 250 460 5,876Balance at March 31, 2019 ¥ 31 ¥(471) ¥(3,694) ¥(4,134) ¥2,719 ¥107,608
64 ANNUAL REPORT 2019

Thousands of U.S. Dollars (note 3)
Shareholders’ equity
Common stock
Capital surplus
Retained earnings
Treasury stock Total
Balance at April 1, 2018 $118,226 $150,058 $669,943 $(2,486) $935,741
Changes arising during the year:
Cash dividends (33,534) (33,534)
Net income 80,052 80,052
Purchase of treasury stock (27) (27)
Disposition of treasury stock 0 0 0
Change in ownership interest of parent due to capital increase of consolidated subsidiaries
36 36
Net changes in accounts other than shareholders’ equity —
Total changes during the year — 36 46,517 (27) 46,526
Balance at March 31, 2019 $118,226 $150,094 $716,460 $(2,513) $982,268
Thousands of U.S. Dollars (note 3)
Accumulated other comprehensive income
Net unrealized holding gains
on other securities
Foreign currency
translation adjustments
Accumulated adjustments
for retirement benefits Total
Non-controlling interests
Total net assets
Balance at April 1, 2018 $378 $(3,369) $(36,516) $(39,508) $20,344 $916,587
Changes arising during the year:
Cash dividends — (33,534)
Net income — 80,052
Purchase of treasury stock — (27)
Disposition of treasury stock — 0
Change in ownership interest of parent due to capital increase of consolidated subsidiaries
— 36
Net changes in accounts other than shareholders’ equity (99) (873) 3,234 2,252 4,144 6,405
Total changes during the year (99) (873) 3,234 2,252 4,144 52,941
Balance at March 31, 2019 $279 $(4,243) $(33,282) $(37,246) $24,497 $969,528
The accompanying notes to consolidated financial statements are an integral part of these consolidated financial statements.
65ANNUAL REPORT 2019

CONSOLIDATED STATEMENTS OF CASH FLOWSNEC Networks & System Integration Corporation and Consolidated Subsidiaries Years ended March 31, 2019 and 2018
Millions of yen
Thousands of U.S. dollars
(note 3)
2019 2018 2019
Cash flows from operating activities:
Net income before income taxes ¥13,023 ¥ 11,279 $117,334
Depreciation and amortization 2,764 2,526 24,903
Amortization of goodwill 247 251 2,225
Increase (decrease) in allowance for doubtful accounts (11) 12 (99)
(Increase) decrease in asset for retirement benefits 251 310 2,261
Increase (decrease) in liability for retirement benefits 517 872 4,658
Increase (decrease) in accrued bonuses to directors 14 34 126
Increase (decrease) in accrued warranty on products (2) (7) (18)
Increase (decrease) in accrued losses on sales contracts 1,422 (90) 12,811
Interest and dividend income (58) (46) (522)
Interest expense 95 127 855
(Increase) decrease in notes and accounts receivable (2,934) (13,061) (26,434)
(Increase) decrease in inventories (4,951) 266 (44,607)
Increase (decrease) in notes and accounts payable 824 3,801 7,424
Other, net 2,724 2,326 24,542
Subtotal 13,927 8,604 125,479
Interest and dividend received 58 47 522
Interest paid (95) (127) (855)
Income taxes paid (5,495) (3,744) (49,508)
Net cash provided by operating activities 8,396 4,779 75,646
66 ANNUAL REPORT 2019

Millions of yen
Thousands of U.S. dollars
(note 3)
2019 2018 2019
Cash flows from investing activities:
Purchase of property and equipment (1,922) (1,628) (17,316)
Proceeds from sale of property and equipment 5 386 45
Purchase of intangibles (2,578) (1,532) (23,227)
Proceeds from sales of intangibles 15 11 135
Purchase of investment securities (162) (27) (1,459)
Loans receivable made — (2) —
Collection of loans receivable 1 3 9
Proceeds from sales of investments in subsidiaries and affiliates
— 74 —
Other, net (962) (87) (8,667)
Net cash used in investing activities (5,604) (2,802) (50,491)
Cash flows from financing activities:
Net increase (decrease) in short-term bank loans (1,750) (111) (15,767)
Repayments of long-term debt (3,186) (171) (28,705)
Proceeds from long-term debt 3,300 — 29,732
Proceeds from sale and purchase of treasury stock, net (2) (4) (18)
Dividends paid to shareholders (3,717) (3,620) (33,489)
Dividends paid to non-controlling interest (27) (23) (243)
Proceeds from share issuance to non-controlling interest 245 — 2,207
Other, net (474) (435) (4,270)
Net cash used in financing activities (5,615) (4,366) (50,590)
Effect of exchange rate changes on cash and cash equivalents
(104) 22 (937)
Net increase (decrease) in cash and cash equivalents (2,927) (2,366) (26,371)
Cash and cash equivalents at beginning of year 57,281 59,648 516,091
Cash and cash equivalents at end of year ¥54,354 ¥ 57,281 $489,719
The accompanying notes to consolidated financial statements are an integral part of these consolidated financial statements.
67ANNUAL REPORT 2019

NOTES TO CONSOLIDATED FINANCIAL STATEMENTSNEC Networks & System Integration Corporation and Consolidated Subsidiaries March 31, 2019 and 2018
1. BASIS OF PREPARATIONNEC Networks & System Integration Corporation (the “Company”) and its domestic subsidiaries maintain their books of account in conformity with accounting prin-ciples generally accepted in Japan. Its foreign subsidiaries maintain their books of account in conformity with those of their countries of domicile. The accompanying consolidated financial statements have been compiled from the consolidated financial statements prepared by the Company as required under the Japanese Financial Instruments and Exchange Law and, have been prepared in accordance with accounting principles generally accepted in Japan, which are different in certain respects as to the application and disclosure requirements of IFRSs. As permitted by the Japanese Financial Instruments and Exchange Law, amounts of less than one million yen have been omitted. As a result, the totals shown in the accompanying consolidated financial statements (both in yen and U.S. dollars) do not necessarily agree with the sum of the individual amounts.
2. SUMMARY OF SIGNIFICANT ACCOUNTING POLICIES(a) ConsolidationThe Company has 17 subsidiaries (companies over which the Company has the ability to control their operations) as of March 31, 2019 (17 subsidiaries as of March 31, 2018) (the “Group”).
(Changes in the scope of consolidation)K&N System Integrations Corporation has been estab-lished in May 2018, and it is included in the consolidated financial statements from the current fiscal year.
The accompanying consolidated financial statements include the accounts of the Company and the significant companies controlled directly or indirectly by the Company. All significant intercompany balances and transactions have been eliminated in consolidation. The financial statements of the 6 subsidiaries with year-end of December 31 have been used for consolida-tion. All material transactions that occurred in the period from such year-end to March 31, which is the Company’s year-end, have been adjusted. The difference between the carrying amount and the underlying net assets at fair value at the respective dates of acquisition is allocated to identifiable assets and liabilities based on fair market value at the dates of acquisition. The unallocated portion of the difference, which is recognized as goodwill, is amortized by the straight-line method over a period of up to 20 years in which the future benefit of each investment is expected. The Company also has 2 affiliates accounted for using equity method. If the year-end of affiliates differs from that of the Company, financial statements prepared by their year-end are utilized in consolidation.
(b) Foreign currency translationMonetary assets and liabilities denominated in foreign currencies are translated into yen at the exchange rates
prevailing at the balance sheet dates. All revenues and expenses associated with foreign currencies are trans-lated at the rates of exchange prevailing when such transactions were made. The resulting exchange gain or loss is credited or charged to income. The revenue and expense accounts of the foreign subsidiaries are translated into yen at the average exchange rates prevailing during the year, and, except for the components of shareholders’ equity, the balance sheet accounts are translated at the rates of exchange in effect at the balance sheet date. The components of shareholders’ equity are translated at their historical exchange rates. Translation adjustments, except for the portion included in non-controlling interests, are presented as a separate component of net assets in the accompanying consolidated financial statements.
(c) Cash equivalentsCash and cash equivalents include all highly liquid invest-ments – generally with original maturities of three months or less – that are readily convertible to known amounts of cash and have negligible risk of changes in value due to their short maturities.
(d) Investment securitiesMarketable securities classified as other securities are measured at fair value with any changes in unrealized holding gain or loss, net of the applicable income taxes, included directly in net assets. Non-marketable securities classified as other securities are carried at cost. Cost of securities sold is determined by the moving-average method.
(e) InventoriesWork in process is stated at the lower of cost or net selling value determined on a specific project basis. Purchased goods and materials are stated at the lower of cost or net selling value determined primarily by the moving-average method.
(f) Depreciation and amortizationDepreciation of property and equipment is principally computed by the straight-line method. Significant renewals and improvements are capitalized. Maintenance and repair costs are charged to expense. The useful lives of property and equipment are summarized as follows: Buildings and structures 3 to 50 years Machinery, equipment and vehicles 2 to 17 years Tools, furniture and fixtures 2 to 20 years
Intangibles are amortized by the straight-line method over their estimated useful lives. Software for sale is amortized based on projected sales volumes over the estimated effective periods (within 3 years). Software for internal use is amortized by the straight-line method over the estimated useful lives (within 5 years).
(g) Allowance for doubtful accountsThe allowance for doubtful accounts is provided at an amount determined based on the historical experience
68 ANNUAL REPORT 2019

of bad debt with respect to ordinary receivables, and an estimate of uncollectible amounts determined by refer-ence to specific doubtful receivables from customers which are experiencing financial difficulties.
(h)Accrued warranty on productsAccrued warranty on products is provided for at the esti-mated warranty cost.
(i) Accrued losses on sales contractsAccrued losses on sales contracts are provided for at the amount of estimated losses for work in process at the balance sheet date. Among sales orders of the Company on hand at the balance sheet date, for projects in which the estimated cost is expected to exceed the amount of the sales order, such excess costs on sales contracts are accrued.
(j) LeasesLeased assets related to finance lease transactions without title transfer are depreciated by the straight-line method, with the lease term as their useful lives and no residual value.
(k) Research and development costsResearch and development costs are charged to expense as incurred.
(l) Retirement benefitsLiability for retirement benefits is provided mainly at an amount calculated based on the retirement benefit obli-gation and the fair value of the pension plan assets at the balance sheet dates, as adjusted for the actuarial gain or loss and past service costs that are yet to be recognized. The retirement benefit obligation is attributed to each period by the straight-line method over the esti-mated years of services of the eligible employees. Actuarial gain or loss is amortized from the subsequent year that it occurs by the straight-line method within the average remaining years (11 to 18 years) of service of the employees. Past service costs are amortized beginning from the year it is incurred by the straight-line method within the average remaining years (12 to 18 years) of service of the employees. Certain consolidated subsidiaries use a simplified method for calculating retirement benefit asset and li-ability and retirement benefit costs. For lump-sum payment plans, the payment for volun-tary retirement at fiscal year-end is deemed as retirement benefit obligation, and for annuity payment plans, the actuarial obligation on pension finance calculation in the recent years is deemed as the retirement benefit obligation.
(m) Income taxesDeferred tax assets and liabilities are determined based on the differences between financial reporting and the tax bases of the assets and liabilities and are measured using the enacted tax rates and laws which will be in effect when the differences are expected to reverse.
(n) Derivative financial instrumentsDerivatives are recorded at their fair value with any changes in unrealized gain or loss charged or credited to income, except for those which meet the criteria for deferral hedge accounting under which unrealized gain or loss, net of the applicable income taxes, is directly included in net assets.Methods for significant hedge accounting(i) Hedge accounting method Deferral hedge accounting is applied. For forward
exchange contracts, the allocation method is applied if the criteria for the allocation method are met.
(ii) Hedging instruments and hedged items Hedging instruments: Forward exchange contracts Hedged items: Any monetary receivables and pay-
ables and planned trading transactions that are denominated in foreign currencies.
(iii) Hedging policy The Company uses derivative transaction in accor-
dance with internal policies to mitigate and avoid the foreign exchange fluctuation risk.
(iv) Hedging evaluation Hedge effectiveness is evaluated by comparing the
total changes in values of hedging instruments and hedged items for the periods from the commence-ment of hedge contracts to the evaluation dates. For forward exchange contracts which meet the criteria for the allocation method, the evaluation of hedge effectiveness is omitted.
(o) Revenue recognitionThe percentage-of-completion method is applied if the outcome of the construction activity can be estimated reliably, otherwise, the completed-contract method is applied. The percentage of completion as of the end of the reporting period is estimated based on the percent-age of the cost incurred to the estimated total cost.
(p) Accrued bonuses to directorsThe Company and its domestic consolidated subsidiaries provide accrued bonuses to directors based on the estimated amounts to be paid in respect of the year.
(q) Accounting for consumption taxesConsumption taxes generally withheld upon sale, as well as those paid for purchases of goods or services, are recorded as a liability or an asset, and are excluded from relevant revenue, costs or expenses.
(r) ReclassificationsCertain reclassifications have been made to the consoli-dated financial statements for the year ended March 31, 2018 to conform to the presentation for the year ended March 31, 2019.
(s) Accounting standards and guidance issued but not yet adopted
The following accounting standards and guidance were issued but not yet adopted.
69ANNUAL REPORT 2019

“Accounting Standard for Revenue Recognition” (ASBJ Statement No. 29, March 30, 2018)“Implementation Guidance on Accounting Standard for Revenue Recognition” (ASBJ Guidance No. 30, March 30, 2018)
(1) Overview International Accounting Standards Board (IASB) and
the Financial Accounting Standards Board (FASB) had jointly developed comprehensive accounting stan-dards on revenue recognition and had issued “Revenue from Contracts with Customers” (which is called “IFRS 15” in IASB, and “Topic 606” in FASB) in May 2014, and IFRS 15 applies to an annual reporting period beginning on or after January 1 2018, and Topic 606 applies to an annual reporting period be-ginning after December 15, 2017. In these circum-stances, the ASBJ has developed comprehensive accounting standards on revenue recognition and has issued the above accounting standard and implemen-tation guidance.
The ASBJ followed two policies in developing a new revenue standard. Basically, incorporate all IFRS 15 requirements for international comparability as one of the benefits from conformity with IFRS 15, and con-sider additional alternative treatments where they would make application easier for the practice of business in Japan, within the extent of that would not significantly hinder international comparability.
(2) Effective date Effective from the beginning of the fiscal year ending
March 31, 2022.
(3) Effects of the application of the standards The Company and its consolidated domestic subsid-
iaries are currently in the process of determining the effects of these new standards on the consolidated financial statements.
(t) Changes in presentation(Changes in consolidated statements of income)“Insurance benefit”, which was included in “Other, net” under “Other income (expense)” in the previous fiscal year, is presented separately in the current fiscal year due to an increase in materiality. To reflect this change in presentation, the amount of ¥41 million included in “Other, net” in the previous fiscal year is reclassified into “Insurance benefit”. In addition, “Relocation expenses in subsidiaries and associates” under “Other income (expense)”, which was presented separately in the previous fiscal year, is in-cluded in “Other, net” in the current fiscal year because its materiality has declined. Also, “Foreign exchange loss”, which was included in “Other, net” under “Other income (expense)” in the previ-ous fiscal year, is presented separately in the current fiscal year due to an increase in materiality. To reflect this change in presentation, the amount of ¥51 million in-cluded in “Other, net” in the previous fiscal year is reclas-sified into “Foreign exchange loss”.
(Changes following the adoption of “Partial Amendments to Accounting Standard for Tax Effect Accounting”)The Group adopted “Partial Amendments to Accounting Standard for Tax Effect Accounting” (ASBJ Statement No. 28, February 16, 2018) and changed the classification of “Deferred tax assets” to “Investments and other assets”, and “Deferred tax liabilities” to “Non-current liabilities”. Simultaneously, footnotes for “Income Taxes” are also changed. As a result, in the previous fiscal year, “Deferred tax assets” of ¥4,524 million classified as “Current assets” is reclassified into “Investments and other assets”. In addition, the Group set off “Deferred tax assets” against “Deferred tax liabilities” of the same taxable entity, and “Total assets” are decreased by ¥406 million compared to the amount before the change. As for the notes related to tax effect accounting, those specified in notes 8 (excluding total amount of valuation allowance) and 9 of “Accounting Standard for Tax Effect Accounting”, which are required in paragraphs 3 to 5 of Statement No.28, are additionally included. However, this additional information corresponding to the previous fiscal year is not disclosed, in accordance with the transitional treatments prescribed in paragraph 7 of Statement No.28.
3. U.S. DOLLAR AMOUNTSThe translation of yen amounts into U.S. dollar amounts is included solely for the convenience of readers outside Japan and has been made, as a matter of arithmetic computation only, at ¥110.99 = U.S.$1.00, the approxi-mate rate of exchange on March 31, 2019. The transla-tion should not be construed as a representation that the yen amounts have been, could have been, or could in the future be, converted into U.S. dollars at that or any other rate.
NOTES TO CONSOLIDATED FINANCIAL STATEMENTS
70 ANNUAL REPORT 2019

4. NOTES AND ELECTRONICALLY RECORDED MONETARY CLAIMS MATURINGNotes and electronically recorded monetary claims are settled on the clearing date. As financial institutions in Japan were closed on March 31, 2019 and 2018, the following notes and electronically recorded monetary claims maturing on these fiscal year-ends and collected or paid on their following business days, are included in the consolidated bal-ance sheets.
Millions of yenThousands of U.S. dollars
2019 2018 2019
Notes receivable ¥146 ¥75 $1,315
Electronically recorded monetary claims 36 18 324
Notes payable 31 30 279
5. INVESTMENT SECURITIESThe components of unrealized gain or loss on marketable securities classified as other securities at March 31, 2019 and 2018 are summarized as follows:
Millions of yen Thousands of U.S. dollars
March 31, 2019 Carrying
valueAcquisition
costUnrealized gain (loss)
Carrying value
Acquisition cost
Unrealized gain (loss)
Securities whose carrying value exceeds their acquisition cost:
Equity securities ¥144 ¥ 96 ¥47 $1,297 $ 864 $423
Subtotal 144 96 47 1,297 864 423
Securities whose acquisition cost exceeds their carrying value:
Equity securities 31 32 (1) 279 288 (9)
Subtotal 31 32 (1) 279 288 (9)
Total ¥175 ¥129 ¥45 $1,576 $1,162 $405
Millions of yen
March 31, 2018 Carrying
valueAcquisition
costUnrealized gain (loss)
Securities whose carrying value exceeds their acquisition cost:
Equity securities ¥179 ¥ 98 ¥ 80
Subtotal 179 98 80
Securities whose acquisition cost exceeds their carrying value:
Equity securities 49 74 (25)
Subtotal 49 74 (25)
Total ¥228 ¥172 ¥ 55
71ANNUAL REPORT 2019

Sales of securities classified as other securities for the years ended March 31, 2019 and 2018 are summarized as follows:
Millions of yenThousands of U.S. dollars
2019 2018 2019
Proceeds from sales ¥18 ¥4 $162
Gain(Loss) on sales 18 3 162
Unlisted equity securities of ¥373 million ($3,360 thousand) and ¥223 million at March 31, 2019 and 2018, respectively, are not included in the above table because there is no market value thereof and future cash flows cannot be estimated therefor, thus, making it extremely difficult to measure the fair value.
Impairment loss recognized on investment securitiesDuring the fiscal year ended March 31, 2019, the Company recognized impairment losses of ¥25 million ($225 thousand) and ¥3 million ($27 thousand) on avail-able-for-sale securities with and without market value,
respectively. During the fiscal year ended March 31, 2018, the Company recognized impairment losses of ¥11 mil-lion and ¥0 million on available-for-sale securities with and without market value, respectively. Securities with market value are fully impaired if their market value as at fiscal year-end falls below 50% of their original cost. If the decline in their market value is be-tween 30% and 50%, the recoverability of their market value is taken into account to determine the amount of losses. Securities without market value are impaired if the net asset per share falls below 50% of original cost due to deterioration of issuers’ financial conditions.
6. INVESTMENT IN AN AFFILIATEThe aggregate carrying amount of investment in an affiliates as of March 31, 2019 and 2018 are ¥86 million ($774 thou-sand) and ¥64 million, respectively,
7. INVENTORIESa) Inventories at March 31, 2019 and 2018 are as follows:
Millions of yenThousands of U.S. dollars
2019 2018 2019
Work in process ¥ 6,827 ¥5,858 $ 61,510
Purchased goods and materials 6,354 2,379 57,248
Total ¥13,181 ¥8,237 $118,758
b) Losses from revaluation of the lower of cost or net selling value included in cost of sales for the years ended March 31, 2019 and 2018 were ¥260 million ($2,342 thousand) and ¥149 million, respectively.
c) Losses on sales contracts included in cost of sales for the years ended March 31, 2019 and 2018 were ¥1,588 mil-lion ($14,307 thousand) and ¥338 million, respectively.
d) Accrued losses on sales contracts and work in process corresponding to the loss contract are not offset in the accompanying consolidated balance sheets.Work in process inventories corresponding to accrued losses on sales contracts at March 31, 2019 and 2018 are as follows.
Millions of yenThousands of U.S. dollars
2019 2018 2019
Work in process ¥642 ¥263 $5,784
NOTES TO CONSOLIDATED FINANCIAL STATEMENTS
72 ANNUAL REPORT 2019

8. GOODWILLGoodwill at March 31, 2019 and 2018 is recorded in the accompanying consolidated balance sheets under the follow-ing captions:
Millions of yenThousands of U.S. dollars
2019 2018 2019
Intangibles, net of accumulated amortization ¥1,146 ¥1,394 $10,325
According to Article 32 of the “Practical Guidelines on Accounting Standards for Capital Consolidation Procedures in Preparing Consolidated Financial Statements” (Accounting Practice Committee Statement No. 7 amended on November 28, 2014 by the Japan Institute of Certified Public Accountants), goodwill is amortized.
9. SHORT-TERM BANK LOANS AND LONG-TERM DEBTShort-term bank loans and long-term debt are unsecured. The weighted average interest rates of current installments of long-term debt for the years ended March 31, 2019 and 2018 were approximately 0.4% and 0.4% and those of long-term debt for the years ended March 31, 2019 and 2018 were approximately 0.4% and 0.4%, respectively.
The annual maturities of long-term debt at March 31, 2019 are as follows:
Year ending March 31, Millions of yenThousands of U.S. dollars
2020 ¥ 231 $ 2,081
2021 231 2,081
2022 3,231 29,110
2023 231 2,081
2024 202 1,819
2025 and thereafter — —
As of March 31, 2019 and 2018, the Group have entered into contracts for committed credit lines totaling ¥9,000 million ($81,088 thousand) with two domestic banks and have unused committed lines of credit amounting to ¥9,000 million.
10. INCOME TAXESIncome taxes applicable to the Company and its domestic subsidiaries comprise corporation, enterprise and inhabit-ants’ taxes, which, in the aggregate, resulted in a statutory tax rate of approximately 30.6% and 30.9% for 2019 and 2018, respectively. Income taxes of the foreign subsidiaries are based generally on the tax rates applicable in their countries of incorporation. The effective tax rates reflected in the consolidated statements of income for the years ended March 31, 2019 and 2018 differed from the statutory tax rate for the following reasons:
2019 2018
Statutory tax rate 30.6% 30.9%
Effect of:
Expenses not deductible for tax purposes 1.4 1.5
Inhabitant tax per capita levy 1.1 1.2
Tax credit (2.2) (0.3)
Increase/(Decrease) in valuation allowance (1.6) (0.3)
Amortization of goodwill 0.2 0.2
Other, net 0.0 0.1
Effective tax rate 29.5% 33.3%
73ANNUAL REPORT 2019

Tax effects of significant temporary differences and tax loss carry-forwards that resulted in deferred tax assets or liabilities at March 31, 2019 and 2018 are as follows:
Millions of yenThousands of U.S. dollars
2019 2018 2019
Deferred tax assets:
Accrued employees’ bonuses ¥ 2,409 ¥ 2,211 $ 21,704
Social security contribution on employees’ bonuses 346 316 3,117
Allowance for doubtful accounts 29 33 261
Accrued enterprise tax 282 282 2,540
Loss on revaluation of inventories 1,307 1,278 11,775
Unrealized profit on inventories 17 17 153
Accrued losses on sales contracts 603 162 5,432
Depreciation 228 200 2,054
Asset retirement obligations 271 240 2,441
Liability for retirement benefits 9,390 9,304 84,602
Stock dividends 106 106 955
Impairment loss on investment securities 31 29 279
Tax loss carry-forwards (Note) 1,290 1,696 11,622
Other 495 408 4,459
Subtotal 16,809 16,288 151,446
Valuation allowance on tax loss carry-forwards (Note) (1,101) — (9,919)
Valuation allowance on total deductible temporary differences and other (1,540) — (13,875)
Subtotal (2,641) (2,975) (23,794)
Total 14,167 13,313 127,642
Deferred tax liabilities:
Asset for retirement benefits (60) (56) (540)
Restoration cost for asset retirement obligations (164) (151) (1,477)
Goodwill (201) (251) (1,810)
Liability adjustment account (136) (147) (1,225)
Other (17) (26) (153)
Total (580) (634) (5,225)
Net deferred tax assets ¥13,587 ¥12,678 $122,416
(Note) The amounts of tax loss carry-forward and related deferred tax assets by carry-forward period
Millions of yen
March 31, 2019 Due within one year
Due after one year through
two years
Due after two years through
three years
Due after three years
through four years
Due after four years through
five yearsDue after five years Total
Tax loss carry-forward (*1) ¥ 1 ¥ 7 ¥ 9 ¥ 0 ¥152 ¥ 1,119 ¥ 1,290
Valuation allowance (1) (7) (9) (0) (0) (1,082) (1,101)
Deferred tax assets — — — — 151 37 189(*2)
Thousands of U.S. dollars
March 31, 2019 Due within one year
Due after one year through
two years
Due after two years through
three years
Due after three years
through four years
Due after four years through
five yearsDue after five years Total
Tax loss carry-forward (*1) $ 9 $ 63 $ 81 $ 0 $1,369 $10,081 $11,622
Valuation allowance (9) (63) (81) (0) (0) (9,748) (9,919)
Deferred tax assets — — — — 1,360 333 1,702(*2)
(*1) Tax loss carry-forward is after multiplying the statutory tax rate.(*2) Deferred tax assets of ¥189 million ($1,702 thousand) are recognized for tax loss carry-forward of ¥1,290 million ($11,622 thousand), which is after multi-
plying the statutory tax rate, of the consolidated subsidiaries. As for the above tax loss carry-forward, valuation allowance has not been recognized for the part that deemed to be recoverable since future taxable
income will be available.
NOTES TO CONSOLIDATED FINANCIAL STATEMENTS
74 ANNUAL REPORT 2019

11. RETIREMENT BENEFIT PLANSThe Company and its consolidated subsidiaries have funded or unfunded defined benefit plans and defined contribution plans. Lump-sum or annuity payments are paid from the corporate defined benefit pension plans, all of which are funded based on the employees’ job grade and length of service. Lump-sum payments are paid from unfunded lump-sum payment plans based on the employees’ job grade, performance and length of service.
Certain consolidated subsidiaries use a simplified method for calculating retirement benefit asset and liability and retirement benefit costs For lump-sum payment plans, the payment for volun-tary retirement at fiscal year-end is deemed as retirement benefit obligation, and for annuity payment plans, the actuarial obligation on pension finance calculation in the recent years is deemed as the retirement benefit obligation.
The information for the Company’s and the consolidated subsidiaries’ defined benefit plans at March 31, 2019 and 2018 for the years then ended is as follows.
(1) Movement in retirement benefit obligations
Millions of yenThousands of U.S. dollars
2019 2018 2019
Retirement benefit obligation at beginning of year ¥59,929 ¥59,713 $539,949
Service cost 2,596 2,585 23,389
Interest cost 537 541 4,838
Actuarial gain or loss (614) (989) (5,532)
Benefits paid (2,421) (1,948) (21,812)
Changes arising from the changes in accounting policy from the simplified method to the standard method 175 — 1,576
Other 22 27 198
Retirement benefit obligation at end of year ¥60,226 ¥59,929 $542,625
Note: The above table excludes certain plans that have adopted the simplified method.
(2) Movements in plan assets
Millions of yenThousands of U.S. dollars
2019 2018 2019
Plan assets at beginning of year ¥30,471 ¥29,407 $274,538
Expected return on plan assets 751 722 6,766
Actuarial gain or loss (986) 127 (8,883)
Contributions paid by the employer 1,117 1,116 10,063
Benefits paid (992) (900) (8,937)
Other (3) (2) (27)
Plan assets at end of year ¥30,358 ¥30,471 $273,520
Note: The above table excludes certain plans that have adopted the simplified method.
(3) Reconciliation of changes in liability for retirement benefits whose plans adopted the simplified method
Millions of yenThousands of U.S. dollars
2019 2018 2019
Liability for retirement benefits at beginning of year ¥ 526 ¥576 $ 4,739
Retirement benefit costs 36 60 324
Benefits paid (5) (42) (45)
Changes arising from the changes in accounting policy from the simplified method to the standard method (165) — (1,486)
Other (15) (67) (135)
Liability for retirement benefits at end of year ¥ 376 ¥526 $ 3,387
75ANNUAL REPORT 2019

(4) Reconciliation from retirement benefit obligations and plan assets to liability (asset) for retirement benefits
Millions of yenThousands of U.S. dollars
2019 2018 2019
Funded retirement benefit obligation ¥ 32,316 ¥ 32,417 $ 291,161
Plan assets (30,817) (30,919) (277,655)
1,498 1,497 13,496
Unfunded retirement benefit obligation 28,745 28,486 258,987
Net liability for retirement benefits ¥ 30,244 ¥ 29,984 $ 272,493
Liability for retirement benefits ¥ 30,609 ¥ 30,428 $ 275,781
Asset for retirement benefits (364) (444) (3,279)
Net liability for retirement benefits ¥ 30,244 ¥ 29,984 $ 272,493
Note: The above table includes certain plans that have adopted the simplified method.
(5) Retirement benefit costs
Millions of yenThousands of U.S. dollars
2019 2018 2019
Service cost ¥2,596 ¥2,585 $23,389
Interest cost 537 541 4,838
Expected return on plan assets (751) (722) (6,766)
Net actuarial loss amortization 1,377 1,534 12,406
Past service costs amortization (500) (574) (4,504)
Retirement benefit costs calculated by the simplified method 36 60 324
Other (1) (0) (9)
Retirement benefit costs ¥3,295 ¥3,424 $29,687
(6) Adjustments for retirement benefit
Millions of yenThousands of U.S. dollars
2019 2018 2019
Past service costs ¥ (500) ¥ (574) $(4,504)
Actuarial gains and losses 1,005 2,652 9,054
Total ¥ 505 ¥2,077 $ 4,549
(7) Accumulated adjustments for retirement benefit
Millions of yenThousands of U.S. dollars
2019 2018 2019
Unrecognized prior service costs ¥(1,724) ¥(2,224) $(15,532)
Unrecognized actuarial gains and losses 7,001 8,006 63,077
Total ¥ 5,276 ¥ 5,782 $ 47,535
NOTES TO CONSOLIDATED FINANCIAL STATEMENTS
76 ANNUAL REPORT 2019

(8) Plan assets(a) The components of plan assets
Millions of yenThousands of U.S. dollars
2019 2018 2019
Debt securities ¥14,100 ¥15,376 $127,038
Equity securities 4,562 4,645 41,102
General account 3,623 3,612 32,642
Alternative 7,609 6,368 68,555
Other 463 468 4,171
Total ¥30,358 ¥30,471 $273,520
Note: Total plan assets include ¥318 million ($2,865 thousand) and ¥413 million in a retirement benefit trust established for the corporate pension plan as of March 31, 2019 and 2018, respectively. Alternative is mainly investment to hedge fund.
(b) Long-term expected rate of returnCurrent and target asset allocations, historical and expected returns on various categories of plan assets have been considered in determining the long-term expected rate of return.
(9) Actuarial assumptionsThe principal actuarial assumptions at March 31, 2019 and 2018 (expressed as weighted averages) are as follows: 2019 2018
Discount rate 0.9% 0.9%
Long-term expected rate of return 2.5% 2.5%
Expected increase rate of salary 4.1% 4.1%
The amounts to be paid by the Company and its consolidated subsidiaries to the defined contribution plans were ¥472 million ($4,252 thousand) and ¥479 million for the years ended March 31, 2019 and 2018.
12. ASSET RETIREMENT OBLIGATIONSThe asset retirement obligations are based on estimated future restoration obligations related to leasehold contracts of head office and other facilities. The obligations are calculated based on the estimated office rental period of mainly 20 years and a discounted rate of 1.7%. The following table provides Company’s total asset retirement obligations for the years ended March 31, 2019 and 2018:
Millions of yenThousands of U.S. dollars
2019 2018 2019
Balance, beginning of year ¥777 ¥781 $7,000
Obligations incurred by asset acquisition 91 8 819
Obligations settled (5) (42) (45)
Accretion expense 10 10 90
Remeasurements — 18 —
Balance, end of year ¥873 ¥777 $7,865
77ANNUAL REPORT 2019

13. SHAREHOLDERS’ EQUITYUnder Japanese laws and regulations, the entire amount paid for new shares is required to be designated as common stock. However, a company may, by resolution of the Board of Directors, designate an amount not exceeding one half of the price of the new shares as additional paid-in capital, which is included in capital surplus. The Companies Act provides that an amount equal to 10% of distributions from retained earnings paid by the Company and its Japanese subsidiaries be appropriated as a legal earnings reserve. No further appropriations are required when the total amount of the additional paid-in capital and the legal earnings reserve equals 25% of their respective stated capital. The Companies Act also
provides that additional paid-in capital and legal earnings reserve are available for appropriations by the resolution of the shareholders. The legal earnings reserve amounted to ¥546 million ($4,919 thousand) as of both March 31, 2019 and 2018. Legal earnings reserve is included in retained earnings in the accompanying consolidated balance sheets. Cash dividends charged to retained earnings for the years ended March 31, 2019 and 2018 represent divi-dends paid out during those years. The amount available for dividends is based on the amount recorded in the Company’s non-consolidated books of account in accordance with the Companies Act.
The movement of treasury stock is as follows:Shares
2019 2018
At beginning of year 137,435 135,911
Increase - purchase of odd lot shares 1,277 1,534
Decrease - sale of odd lot shares 97 10
At end of year 138,615 137,435
a) Dividends paid during the year ended March 31, 2018 The following was approved by the Board of Directors on April 27, 2017. (a) Total dividends ¥1,786 million (b) Cash dividends per common share ¥36 (c) Record date March 31, 2017 (d) Effective date June 2, 2017 The following was approved by the Board of Directors on October 31, 2017. (a) Total dividends ¥1,836 million (b) Cash dividends per common share ¥37 (c) Record date September 30, 2017 (d) Effective date December 4, 2017
b) Dividends to be paid after March 31, 2018 although record date for payment falls within the year ended March 31, 2018
The following was approved by the Board of Directors on April 27, 2018. (a) Total dividends ¥1,836 million (b) Dividend source Retained earnings (c) Cash dividends per common share ¥37 (d) Record date March 31, 2018 (e) Effective date May 31, 2018
c) Dividends paid during the year ended March 31, 2019 The following was approved by the Board of Directors on April 27, 2018. (a) Total dividends ¥1,836 million ($16,542 thousand) (b) Cash dividends per common share ¥37 ($0.33) (c) Record date March 31, 2018 (d) Effective date May 31, 2018
The following was approved by the Board of Directors on October 30, 2018. (a) Total dividends ¥1,886 million ($16,992 thousand) (b) Cash dividends per common share ¥38 ($0.34) (c) Record date September 30, 2018 (d) Effective date December 4, 2018
NOTES TO CONSOLIDATED FINANCIAL STATEMENTS
78 ANNUAL REPORT 2019

d) Dividends to be paid after March 31, 2019 although record date for payment falls within the year ended March 31, 2019
The following was approved by the Board of Directors on April 26, 2019. (a) Total dividends ¥1,985 million ($17,884 thousand) (b) Dividend source Retained earnings (c) Cash dividends per common share ¥40 ($0.36) (d) Record date March 31, 2019 (e) Effective date May 31, 2019
14. CONTINGENT LIABILITIESAt March 31, 2019 and 2018, the Company was contingently liable as guarantor of indebtedness of the Company’s employees in the aggregate amount of ¥1 million ($9 thousand) and ¥4 million, respectively.
15. LEASES(1) Finance leasesUnder finance leases that do not transfer ownership of the leased property to the lessee Most of finance lease transactions are telecommunications equipment in Enterprise network business, and capital-ized lease assets and lease obligations in the balance sheet. Finance lease assets that do not deem to transfer owner-ship of the leased property to the lessee are depreciated using the straight-line method over the period of the lease, with zero residual value.
(2) Operating leasesFuture minimum operating lease payments subsequent to March 31, 2019 and 2018 for non-cancelable operating leases are summarized as follows:
Millions of yenThousands of U.S. dollars
2019 2018 2019
Due within one year ¥2,966 ¥2,521 $26,723
Due over one year 5,440 3,064 49,013
Total ¥8,407 ¥5,585 $75,745
16. SELLING, GENERAL AND ADMINISTRATIVE EXPENSESThe significant components of selling, general and administrative expenses for the years ended March 31, 2019 and 2018 are as follows:
Millions of yenThousands of U.S. dollars
2019 2018 2019
Employees salary ¥16,584 ¥16,035 $149,418
Provision for bonuses to directors 56 38 504
Retirement benefit costs 1,181 1,232 10,640
Provision of allowance for doubtful accounts — 13 —
17. RESEARCH AND DEVELOPMENT COSTSResearch and development costs included in selling, general and administrative expenses amounted to ¥784 million ($7,063 thousand) and ¥425 million for the years ended March 31, 2019 and 2018, respectively.
18. GAIN ON SALES OF NON-CURRENT ASSETSGain on sales of non-current assets are due to the sales of buildings and land of company dormitory for the year ended March 31, 2018.
79ANNUAL REPORT 2019

19. OTHER COMPREHENSIVE INCOMEThe reclassification adjustment and the related income tax effects allocated to each component of other comprehen-sive income for the years ended March 31, 2019 and 2018 are as follows:
Millions of yenThousands of U.S. dollars
2019 2018 2019
Net unrealized holding gain on other securities:
Unrealized holding gain(loss) arising during the year ¥ (48) ¥ (0) $ (432)
Reclassification adjustment for gain/loss realized in net income 29 11 261
Before tax amount (19) 10 (171)
Tax effect 7 (3) 63
Net-of-tax amount (11) 7 (99)
Foreign currency translation adjustments:
Foreign currency translation adjustments arising during the year (137) 83 (1,234)
Reclassification adjustment for gain/loss realized in net income (8) — (72)
Before tax amount (145) 83 (1,306)
Tax effect 2 (2) 18
Net-of-tax amount (143) 81 (1,288)
Adjustments for retirement benefit:
Adjustments for retirement benefit arising during the year (371) 1,117 (3,342)
Reclassification adjustment for gain/loss realized in net income 877 960 7,901
Before tax amount 505 2,077 4,549
Tax effect (146) (976) (1,315)
Net-of-tax amount 359 1,101 3,234
Share of other comprehensive income of entities accounted for using equity method
Share of other comprehensive income of entities accounted for using equity method arising during the year (1) 0 (9)
Total other comprehensive income ¥ 203 ¥1,190 $ 1,828
20. AMOUNTS PER SHAREYen U.S. dollars
2019 2018 2019
Net income per share ¥ 179.02 ¥ 148.23 $ 1.61
Net assets per share 2,113.19 2,004.04 19.04
The basis of calculation for net income per share and net income per share is as shown below.
Millions of yenThousands of U.S. dollars
2019 2018 2019
Net income attributable to owners of the parent ¥ 8,885 ¥ 7,357 $80,052
Amounts not attributable to common stock — — —
Net income attributable to owners of the parent related to common stock 8,885 7,357 80,052
Average number of shares during the term (thousands of shares) 49,635 49,637 49,635
NOTES TO CONSOLIDATED FINANCIAL STATEMENTS
80 ANNUAL REPORT 2019

21. FINANCIAL INSTRUMENTSConditions of Financial instruments(1) Management policyThe Group makes short-term deposits or uses high-security financial instruments for fund management purposes. The Group obtains funding for capital expenditure plans mainly through bank loans. The Group utilizes derivative financial instruments to hedge various risks as described in detail below and does not enter into derivatives for trading or speculative purposes.
(2) Financial instruments and risksThe notes, accounts receivable and electronically recorded monetary claims are exposed to credit risk of customers. Operating receivables and payables denominated in foreign currencies are exposed to foreign currency fluctuation risk. Marketable and investment securities, except for short-term investments, are held for business and capital alliances with business associates, and are exposed to stock market fluctuation risk. Maturities of notes, accounts payable and electroni-cally recorded obligations are within one year. Debts are for funding capital expenditure, and their maximum maturities are 5 years and 6 years after the balance sheet date for the years ended March 31, 2019 and 2018, respectively. Part of the obligations has floating interest rates and is exposed to interest rate risk. In order to hedge the foreign exchange rates fluctua-tion risk associated with operating receivables and pay-ables denominated in foreign currencies, forward foreign exchange contracts are used. Hedge accounting is applied for certain derivative transactions. Please refer to note 2 (n).
(3) Financial instruments risk management1) Credit riskTo mitigate and quickly capture collectability issues, the Group regularly monitors customers’ credit status, and performs due date controls and balance controls for each customer.
When the Group utilizes derivatives or deposits money and purchases securities for cash management purposes, to mitigate the counterparty risk, the counter-parties to these transactions are financial institutions with high credit ratings.
2) Market riskThe Group comprehends foreign currency fluctuation risk by currency and by month, and to mitigate the risk, the Group enters into a forward exchange contract for hedg-ing the cash flow fluctuation risk associated with operat-ing receivables and payables denominated in foreign currencies. To mitigate the stock market fluctuation risk, the Group regularly monitors stock prices and financial status of its business associates and continuously considers whether the Group should hold the stock. Derivative transactions entered into by the Group are in accordance with policies and rules that provide for risk management, approvals, reporting and verifications.
3) Liquidity riskTo mitigate the liquidity risk, the Group prepares and updates its funds management plan on a timely basis, and maintains an appropriate level of liquidity through its cash and cash equivalents and unused committed lines.
(4) Supplemental explanation regarding fair value of financial instruments
Fair value of financial instruments is measured based on the quoted market price, if available, or reasonably assessed value if a quoted market price is not available. Fair value of financial instruments for which quoted market price is not available is calculated based on cer-tain assumptions, and the fair value may differ if different assumptions are used. In addition, the contract amount of the derivative transactions described below in note 22 (DERIVATIVES) does not represent the market risk of the derivative transactions.
(5) Concentration of credit riskAt both March 31, 2019 and 2018, 30% and 24% of operating receivables were receivables from a certain major customer.
81ANNUAL REPORT 2019

Fair value of financial instrumentsThe carrying amount on the consolidated balance sheets, fair value and differences as of March 31, 2019 and 2018 are as follows. Financial instruments, of which the fair value is extremely difficult to measure, are not included. (Please see (2) “Financial instruments of which the fair value is extremely difficult to measure”)
Millions of yen Thousands of U.S. dollars
March 31, 2019 Carrying amount Fair value Differences
Carrying amount Fair value Differences
Assets:
(1) Cash and cash equivalents ¥ 54,354 ¥ 54,354 ¥— $ 489,719 $ 489,719 $—
(2) Notes and accounts receivable 106,553 960,023
(3) Electronically recorded monetary claims 606 5,459
Allowance for doubtful accounts (22) (198)
107,138 107,138 — 965,294 965,294 —
(4) Investment securities 175 175 — 1,576 1,576 —
Total ¥161,667 ¥161,667 ¥— $1,456,590 $1,456,590 $—
Liabilities:
(1) Notes and accounts payable ¥ 40,274 ¥ 40,274 ¥— $ 362,861 $ 362,861 $—
(2) Electronically recorded obligations 807 807 — 7,270 7,270 —
(3) Short-term bank loans 2,284 2,284 — 20,578 20,578 —
(4) Current installments of long-term debt 231 231 — 2,081 2,081 —
(5) Long-term debt 3,896 3,896 — 35,102 35,102 —
Total ¥ 47,494 ¥ 47,494 ¥— $ 427,912 $ 427,912 $—
Derivative transactions ¥ — ¥ — ¥— $ — $ — $—
Millions of yen
March 31, 2018 Carrying amount Fair value Differences
Assets:
(1) Cash and cash equivalents ¥ 57,281 ¥ 57,281 ¥—
(2) Notes and accounts receivable 103,911
(3) Electronically recorded monetary claims 494
Allowance for doubtful accounts (55)
104,350 104,350 —
(4) Investments securities 228 228 —
Total ¥161,860 ¥161,860 ¥—
Liabilities:
(1) Notes and accounts payable 39,574 39,574 ¥—
(2) Electronically recorded obligations 728 728 —
(3) Short-term bank loans 4,086 4,086 —
(4) Current installments of long-term debt 3,171 3,171 —
(5) Long-term debt 842 842 —
Total ¥ 48,403 ¥ 48,403 ¥—
Derivative transactions ¥ — ¥ — ¥—
(Note) 1. Allowance for doubtful accounts are deducted from the above Notes and accounts receivable, and Electronically recorded monetary claims. 2. Derivative receivables and liabilities are on a net basis.
NOTES TO CONSOLIDATED FINANCIAL STATEMENTS
82 ANNUAL REPORT 2019

(1) Fair value measurement of financial instrumentsAssets:1) Cash and cash equivalents
2) Notes receivable, accounts receivable
3) Electronically recorded monetary claimsThe carrying amount approximates fair value because of the short maturity of these instruments.
4) Investment securitiesThe fair value of equity securities is calculated by the quoted market price. Please see note 5 (INVESTMENT SECURITIES) for information by category.
Liabilities:1) Notes payable, accounts payable
2) Electronically recorded obligations
3) Short-term bank loans
4) Current installments of long-term debtThe carrying amount approximates fair value because of the short maturity of these instruments.
5) Long-term debtFair value of long-term debts is based on the present value of future cash flows discounted using the current borrowing rate for similar debt with comparable maturity.
Derivative transactions:Please see note 22 (DERIVATIVES).
(2) Financial instruments of which the fair value is extremely difficult to measure
Millions of yenThousands of U.S. dollars
2019 2018 2019
Unlisted equity securities ¥460 ¥287 $4,144
The above securities are not included in ”Assets:(4) Investment securities”, as market prices are not available and also future cash flows cannot be estimated reliably. Thus, the fair value cannot be reasonably obtained.
(3) Projected future redemption of monetary claims and securities with maturities at March 31, 2019Millions of yen
Due within one year
Due after one year through
five years
Due after five years through
ten yearsDue after ten years
Cash and cash equivalents ¥ 54,354 ¥— ¥— ¥—
Notes and accounts receivable 106,553 — — —
Electronically recorded monetary claims 606 — — —
¥161,514 ¥— ¥— ¥—
Thousands of U.S. dollars
Due within one year
Due after one year through
five years
Due after five years through
ten yearsDue after ten years
Cash and cash equivalents $ 489,719 $— $— $—
Notes and accounts receivable 960,023 — — —
Electronically recorded monetary claims 5,459 — — —
$1,455,212 $— $— $—
83ANNUAL REPORT 2019

(4) The annual maturities of long-term debt and other interest-bearing debt at March 31, 2019Millions of yen
Due within one year
Due after one year through two years
Due after two years through three years
Due after three years through
four years
Due after four years through
five yearsDue after five years
Short-term bank loans ¥2,284 ¥ — ¥ — ¥ — ¥ — ¥—
Long-term debt 231 231 3,231 231 202 —
Thousands of U.S. dollars
Due within one year
Due after one year through two years
Due after two years through three years
Due after three years through
four years
Due after four years through
five yearsDue after five years
Short-term bank loans $20,578 $ — $ — $ — $ — $—
Long-term debt 2,081 2,081 29,110 2,081 1,819 —
22. DERIVATIVESThe Company enters into forward exchange contracts with major Japanese banks in order to manage certain risks arising from adverse fluctuations in foreign currency exchange rates.
At March 31, 2019 and 2018, there is no derivative transactions to report.
23. RELATED PARTY TRANSACTIONS(1) The Company’s balances with related parties and related transactions
NEC Corporation owned 51.48% and 51.49% of the Company’s outstanding common stock as of both March 31, 2019 and 2018, respectively. Balances with NEC Corporation at March 31, 2019 and 2018, and related transactions for the years then ended are summarized as follows:
Millions of yenThousands of U.S. dollars
2019 2018 2019
Construction and maintenance of network system:
Transactions:
Sales ¥63,859 ¥60,855 $575,358
Balances:
Accounts receivable ¥30,791 ¥25,250 $277,421
Advances received ¥ 313 ¥ 386 $ 2,820
Purchases of communication device:
Transactions:
Purchases ¥46,191 ¥44,171 $416,172
Balances:
Accounts payable ¥13,615 ¥12,533 $122,668
Advance payments ¥ 408 ¥ — $ 3,676
NOTES TO CONSOLIDATED FINANCIAL STATEMENTS
84 ANNUAL REPORT 2019

24. SEGMENT INFORMATIONThe reported segments of the Company are the business units for which the Company is able to obtain respective financial information separately in order for the Board of Directors to conduct periodic investigation to determine the distribution of management resources and evaluate their business results. The “Enterprises networks business,” “Carrier net-works business” and “Social infrastructures business” are the Company’s reportable segments. The Company com-bines business segments which have similar economic characteristics into these reportable segments. The busi-ness segments are based on the operation headquarters by service lines, which are the units used for internal reporting for performance management. The Enterprises networks business mainly renders service integration relating to ICT solution for enterprises. The segment renders total office solution services based on ICT with securities or environmental solutions and related operating/monitoring services, as well as outsourcing
services using our own data centers and contact centers. The Carrier networks business mainly renders service integration for telecom carriers’ ICT platforms (from mobile communications base stations to core networks), including systems integration, installation, and related services such as operations and monitoring, and systems integration of large-scale, wide-area, carrier-grade ICT platforms and data centers and the related operations/ monitoring services. The Social infrastructures business mainly renders service integration of ICT infrastructure for governments and public utilities (broadcasters, electric power compa-nies, etc.), such as systems integration, installation and operation/monitoring services, and these services pro-vided by foreign subsidiaries. Segment sales, income, assets and others are calcu-lated by accounting methods similar to those employed to prepare the accompanying consolidated financial statements.
The reported segment information for the Company and its consolidated subsidiaries for the years ended March 31, 2019 and 2018 is summarized as follows:
Millions of yen
March 31, 2019 Enterprise networks Carrier networks
Social infrastructures Others Adjustments Total
Sales:
(1) Sales to third parties ¥122,775 ¥70,529 ¥77,260 ¥7,383 ¥ — ¥277,949
(2) Intersegment sales — — — — — —
Total ¥122,775 ¥70,529 ¥77,260 ¥7,383 ¥ — ¥277,949
Segment income ¥ 13,408 ¥ 4,714 ¥ 3,454 ¥ 276 ¥ (9,078) ¥ 12,774
Segment assets ¥ 52,593 ¥35,161 ¥49,112 ¥2,766 ¥76,537 ¥216,171
Others:
Depreciation and amortization ¥ 1,543 ¥ 351 ¥ 169 ¥ — ¥ 698 ¥ 2,764
Purchases of property and equipment, and intangible assets
1,975 672 210 1 1,718 4,578
Investment to entities accounted for using equity method 41 — 45 — — 86
Thousands of U.S. dollars
March 31, 2019 Enterprise networks Carrier networks
Social infrastructures Others Adjustments Total
Sales:
(1) Sales to third parties $1,106,180 $635,453 $696,098 $66,519 $ — $2,504,270
(2) Intersegment sales — — — — — —
Total $1,106,180 $635,453 $696,098 $66,519 $ — $2,504,270
Segment income $ 120,803 $ 42,472 $ 31,119 $ 2,486 $ (81,791) $ 115,091
Segment assets $ 473,853 $316,794 $442,490 $24,921 $689,584 $1,947,661
Others:
Depreciation and amortization $ 13,902 $ 3,162 $ 1,522 $ — $ 6,288 $ 24,903
Purchases of property and equipment, and intangible assets
17,794 6,054 1,892 9 15,478 41,246
Investment to entities accounted for using equity method 369 — 405 — — 774
85ANNUAL REPORT 2019

Millions of yen
March 31, 2018 Enterprise networks Carrier networks
Social infrastructures Others Adjustments Total
Sales:
(1) Sales to third parties ¥110,887 ¥64,902 ¥85,192 ¥6,957 ¥ — ¥267,939
(2) Intersegment sales — — — — — —
Total ¥110,887 ¥64,902 ¥85,192 ¥6,957 ¥ — ¥267,939
Segment income ¥ 10,797 ¥ 5,021 ¥ 3,399 ¥ 263 ¥ (8,424) ¥ 11,057
Segment assets ¥ 44,999 ¥30,750 ¥54,383 ¥1,862 ¥76,054 ¥208,050
Others:
Depreciation and amortization ¥ 1,418 ¥ 361 ¥ 131 ¥ — ¥ 615 ¥ 2,526
Purchases of property and equipment, and intangible assets
1,469 288 229 16 1,746 3,750
Investment to entities accounted for using equity method 40 — 24 — — 64
Notes: 1. “Others” includes purchases of information and telecommunications equipment, etc., which are not included in the reported segments. 2. “Adjustments” of ¥–9,078 million ($–81,791 thousand) and ¥–8,424 million in segment income for the years ended March 31, 2019 and 2018, respec-
tively, are mainly administrative operation expenses. 3. “Adjustments” of ¥76,537 million ($689,584 thousand) and ¥76,054 million in segment assets at March 31, 2019 and 2018, respectively, mainly consist
of surplus funds (cash and deposits), land, long-term deposits and assets relating to the administrative operations of the parent company. 4. Segment income is adjusted with operating income in the consolidated statements of income. 5. “Purchases of property and equipment, and intangible assets” for the years ended March 31, 2019 and 2018 include long-term prepaid expenses and
their amortization. 6. The Company has reorganized the business structures as of April 1, 2019 and will change the reportable segments from the year ended March 31,
2020 from “Enterprise Networks Business”, “Carrier Networks Business” and “Social Infrastructures Business” to “Digital Solutions Business”, “Network Infrastructures Business” and “Engineering & Support Services Business”.
Related informationRelated segment information for the years ended March 31, 2019 and 2018 are as follows:(1) Information by products and services Please refer to the reported segment information.
(2) Geographical information 1) Sales Disclosures are omitted because sales to Japanese customers are over 90% of sales in the consolidated state-
ments of income. 2) Property and equipment Disclosures are omitted because property and equipment located in Japan are over 90% of property and equip-
ment in the consolidated balance sheets.
(3) Information by major customers
Millions of yenThousands of U.S. dollars
2019 2018 2019
Customer name:
NEC Corporation
Sales ¥68,808 ¥67,203 $619,947
The above sales are related to the “Enterprise networks” segment, “Carrier networks” segment and “Social infrastruc-tures” segment.
NOTES TO CONSOLIDATED FINANCIAL STATEMENTS
86 ANNUAL REPORT 2019

Information of impairment loss on fixed assets by reported segments for the years ended March 31, 2019 and 2018There are no amounts to report.
Information of amortization of goodwill and balances of goodwill by reported segments as of and for the years ended March 31, 2019 and 2018
Millions of yen
March 31, 2019 Enterprise networks Carrier networks
Social infrastructures Others Adjustments Total
Amortization of goodwill ¥ 22 ¥ 224 ¥— ¥— ¥— ¥ 247
Balances of goodwill 127 1,018 — — — 1,146
Thousands of U.S. dollars
March 31, 2019 Enterprise networks Carrier networks
Social infrastructures Others Adjustments Total
Amortization of goodwill $ 198 $2,018 $— $— $— $ 2,225
Balances of goodwill 1,144 9,171 — — — 10,325
Millions of yen
March 31, 2018 Enterprise networks Carrier networks
Social infrastructures Others Adjustments Total
Amortization of goodwill ¥ 27 ¥ 224 ¥— ¥— ¥— ¥ 251
Balances of goodwill 150 1,243 — — — 1,394
Negative goodwill incurred by reported segments for the years ended March 31, 2019 and 2018There are no amounts to report.
(Subsequent events)Change of the reportable segmentsThe Company has reorganized the business structures as of April 1, 2019 to accelerate the Company’s growth as well as strengthen the business structures for the Company’s competitiveness and, accordingly, will change the reportable segments from the year ended March 31, 2020 from “Enterprise Networks Business”, “Carrier Networks Business” and “Social Infrastructures Business” to “Digital Solutions Business”, “Network Infrastructures Business” and “Engineering & Support Services Business”. The Group is currently in the process of determining each reportable segment’s sales revenue, profit or loss, and other effects on the consolidated financial statements in the newly designed reportable segments.
87ANNUAL REPORT 2019

INDEPENDENT AUDITOR’S REPORT
88 ANNUAL REPORT 2019

2-6-1 Koraku, Bunkyo-ku, Tokyo112-8560, JapanTelephone: +81-3-6699-7000Website: http://www.nesic.co.jp/english/ 191100400-EI-00