NESDB ECONOMIC REPORT - nesdb.go.th · 962 Krung Kasem Road, Pomprab, Bangkok 10100 Office of the...
32
www.nesdb.go.th 962 Krung Kasem Road, Pomprab, Bangkok 10100 Office of the National Economic and Social Development Board (NESDB) NESDB ECONOMIC REPORT Press Release 9.30 a.m. May 21, 2018 Thai Economic Performance in Q1 and Outlook for 2018 NESDB ECONOMIC REPORT Macroeconomic Strategy and Planning Office The Thai economy in the first quarter of 2018 expanded by 4.8 percent, accelerating from 4.0 percent growth in the previous quarter. After seasonally adjusted, the Thai economy in the first quarter expanded by 2.0 percent (%QoQ sa). On the expenditure side, the expansion was supported by the acceleration of private consumption, government consumption, total investment, and a robust export growth. On the production side, the manufacturing and the wholesale and retail trade expanded at an accelerated rate. The hotel and restaurant as well as the transportation sectors maintained high growth momentum. Meanwhile, the agricultural and the construction sectors reversed from the contraction in the preceding quarter to favorable growth rates. The Thai economy in 2018 is expected to expand in the range of 4.2 – 4.7 percent, supported by (i) the improvement of the world economic growth and rising global commodity prices which will further support export of goods and service, (ii) the favorable expansion of government consumption and the acceleration of public investment, (iii) the clearer pace of private investment recovery, and (iv) the improvement of household income conditions. All in all, it is expected that export value of goods will expand by 8.9 percent. Private consumption and total investment will grow by 3.7 and 4.7 percent respectively. The headline inflation is forecasted to be in the range of 0.7 - 1.7 percent and the current account will register a surplus of 8.4 percent of GDP. Economic management for the year 2018 should focus on (1) Promoting key economic sectors by: (i) fostering export sector to continually expand and reach its full potential, (ii) supporting private investment growth by pushing up investment projects approved by the Board of Investment to be materialized and started their operation, pursuing public infrastructure investment as well as building up investors’ confidence, and (iii) sustaining the expansion of service sector particularly the tourism sector by maintaining security and improving facilities, promoting tourism on high-income and long-distance traveling markets, together with extending airport capacity as well as improving transportation system to connect secondary tourist attractions to distribute tourist revenue to the local community. (2) Expediting key public investment to achieve the growth target by (i) expediting procurement processes for the rest of the year, coupled with improving the efficacy of the government’s and state- owned enterprises’ capital budget disbursement to be not less than 66.7 and 77.0 percent of total capital budget, respectively, (ii) continually driving key infrastructure projects as well as encouraging investors to invest in key economic areas, and (iii) progressing pivotal transportation and logistics infrastructure projects as well as key urban and economic areas development at both regional and provincial levels. (3) Supporting small farmers and low income groups as well as strengthening the SMEs and local economies by focusing on (i) strengthening agricultural production and farm income particularly on some agricultural products of which prices have recovered slowly, preparing measures to handle the increasing agricultural output in the market, coupled with close monitoring and preparation for unfavorable weather conditions that could impact agricultural production, and supporting large-scale farming, (ii) supporting the low income and glass-root economies as well as SMEs particularly on the continuation of the social welfare smart card project and ensuring sufficiency and accessibility of funds for credit provisioning measures particularly for those who vulnerable to rising oil prices and interest rates, (iii) assisting and developing SMEs affected by changing business patterns and consumers’ behavior, changing demographics, changing production technology, as well as Baht appreciation trend. (4) Arranging labor force both in terms of quantity and quality of labor to facilitate expansion of economic and investment activities. Economic Projection of 2018 (%YoY) 2016 2017 2018 Year Year Q3 Q4 Q1 Year (f) GDP (CVM) 3.3 3.9 4.3 4.0 4.8 4.2-4.7 GFCF 2.8 0.9 1.2 0.3 3.4 4.7 Private 0.5 1.7 2.5 2.4 3.1 3.9 Public 9.5 -1.2 -1.6 -6.0 4.0 8.6 Private Consumption 3.0 3.2 3.4 3.4 3.6 3.7 Government Consumption 2.2 0.5 1.8 0.2 1.9 3.0 Export of Goods 1 0.1 9.7 12.5 11.6 9.9 8.9 Volume 1 0.5 5.9 8.7 7.0 5.0 4.9 Import of Goods 1 -5.1 14.4 13.0 14.6 16.3 12.7 Volume 1 -2.5 8.4 8.8 8.3 9.2 6.7 Current Account to 11.7 10.6 12.1 9.3 13.3 8.4 GDP (%) Inflation 0.2 0.7 0.4 0.9 0.6 0.7-1.7 Note: 1 base on the Bank of Thailand’s data
-
Upload
nguyenliem -
Category
Documents
-
view
214 -
download
0
Transcript of NESDB ECONOMIC REPORT - nesdb.go.th · 962 Krung Kasem Road, Pomprab, Bangkok 10100 Office of the...

www.nesdb.go.th
962 Krung Kasem Road, Pomprab, Bangkok 10100 Office of the National Economic and Social Development Board (NESDB)
NESDB ECONOMIC REPORT
Press Release 9.30 a.m. May 21, 2018
Thai Economic Performance in Q1 and Outlook for 2018
NESDB ECONOMIC REPORT
Macroeconomic Strategy and Planning Office
The Thai economy in the first quarter of 2018 expanded by 4.8 percent,
accelerating from 4.0 percent growth in the previous quarter. After seasonally
adjusted, the Thai economy in the first quarter expanded by 2.0 percent
(%QoQ sa).
On the expenditure side, the expansion was supported by the acceleration of
private consumption, government consumption, total investment, and a robust
export growth. On the production side, the manufacturing and the wholesale
and retail trade expanded at an accelerated rate. The hotel and restaurant as well
as the transportation sectors maintained high growth momentum. Meanwhile, the
agricultural and the construction sectors reversed from the contraction in the
preceding quarter to favorable growth rates.
The Thai economy in 2018 is expected to expand in the range of 4.2 – 4.7
percent, supported by (i) the improvement of the world economic growth and
rising global commodity prices which will further support export of goods and
service, (ii) the favorable expansion of government consumption and the
acceleration of public investment, (iii) the clearer pace of private investment
recovery, and (iv) the improvement of household income conditions. All in all, it
is expected that export value of goods will expand by 8.9 percent. Private
consumption and total investment will grow by 3.7 and 4.7 percent respectively.
The headline inflation is forecasted to be in the range of 0.7 - 1.7 percent and the
current account will register a surplus of 8.4 percent of GDP.
Economic management for the year 2018 should focus on (1) Promoting key
economic sectors by: (i) fostering export sector to continually expand and reach
its full potential, (ii) supporting private investment growth by pushing up
investment projects approved by the Board of Investment to be materialized and
started their operation, pursuing public infrastructure investment as well as
building up investors’ confidence, and (iii) sustaining the expansion of service
sector particularly the tourism sector by maintaining security and improving
facilities, promoting tourism on high-income and long-distance traveling
markets, together with extending airport capacity as well as improving
transportation system to connect secondary tourist attractions to distribute tourist
revenue to the local community. (2) Expediting key public investment to
achieve the growth target by (i) expediting procurement processes for the rest
of the year, coupled with improving the efficacy of the government’s and state-
owned enterprises’ capital budget disbursement to be not less than 66.7 and 77.0
percent of total capital budget, respectively, (ii) continually driving key
infrastructure projects as well as encouraging investors to invest in key economic
areas, and (iii) progressing pivotal transportation and logistics infrastructure
projects as well as key urban and economic areas development at both regional
and provincial levels. (3) Supporting small farmers and low income groups as
well as strengthening the SMEs and local economies by focusing on (i)
strengthening agricultural production and farm income particularly on some
agricultural products of which prices have recovered slowly, preparing measures
to handle the increasing agricultural output in the market, coupled with close
monitoring and preparation for unfavorable weather conditions that could impact
agricultural production, and supporting large-scale farming, (ii) supporting the
low income and glass-root economies as well as SMEs particularly on the
continuation of the social welfare smart card project and ensuring sufficiency
and accessibility of funds for credit provisioning measures particularly for those
who vulnerable to rising oil prices and interest rates, (iii) assisting and developing SMEs affected by changing business patterns and consumers’
behavior, changing demographics, changing production technology, as well as
Baht appreciation trend. (4) Arranging labor force both in terms of quantity and
quality of labor to facilitate expansion of economic and investment activities.
Economic Projection of 2018
(%YoY)
2016 2017 2018
Year Year Q3 Q4 Q1 Year
(f)
GDP (CVM) 3.3 3.9 4.3 4.0 4.8 4.2-4.7
GFCF 2.8 0.9 1.2 0.3 3.4 4.7
Private 0.5 1.7 2.5 2.4 3.1 3.9
Public 9.5 -1.2 -1.6 -6.0 4.0 8.6
Private Consumption 3.0 3.2 3.4 3.4 3.6 3.7
Government Consumption 2.2 0.5 1.8 0.2 1.9 3.0
Export of Goods1 0.1 9.7 12.5 11.6 9.9 8.9
Volume1 0.5 5.9 8.7 7.0 5.0 4.9
Import of Goods1 -5.1 14.4 13.0 14.6 16.3 12.7
Volume1 -2.5 8.4 8.8 8.3 9.2 6.7
Current Account to 11.7 10.6 12.1 9.3 13.3 8.4
GDP (%)
Inflation 0.2 0.7 0.4 0.9 0.6 0.7-1.7
Note: 1 base on the Bank of Thailand’s data
Macroeconomic Strategy and Planning Office
NESDB Economic Outlook
May 21, 2018 2
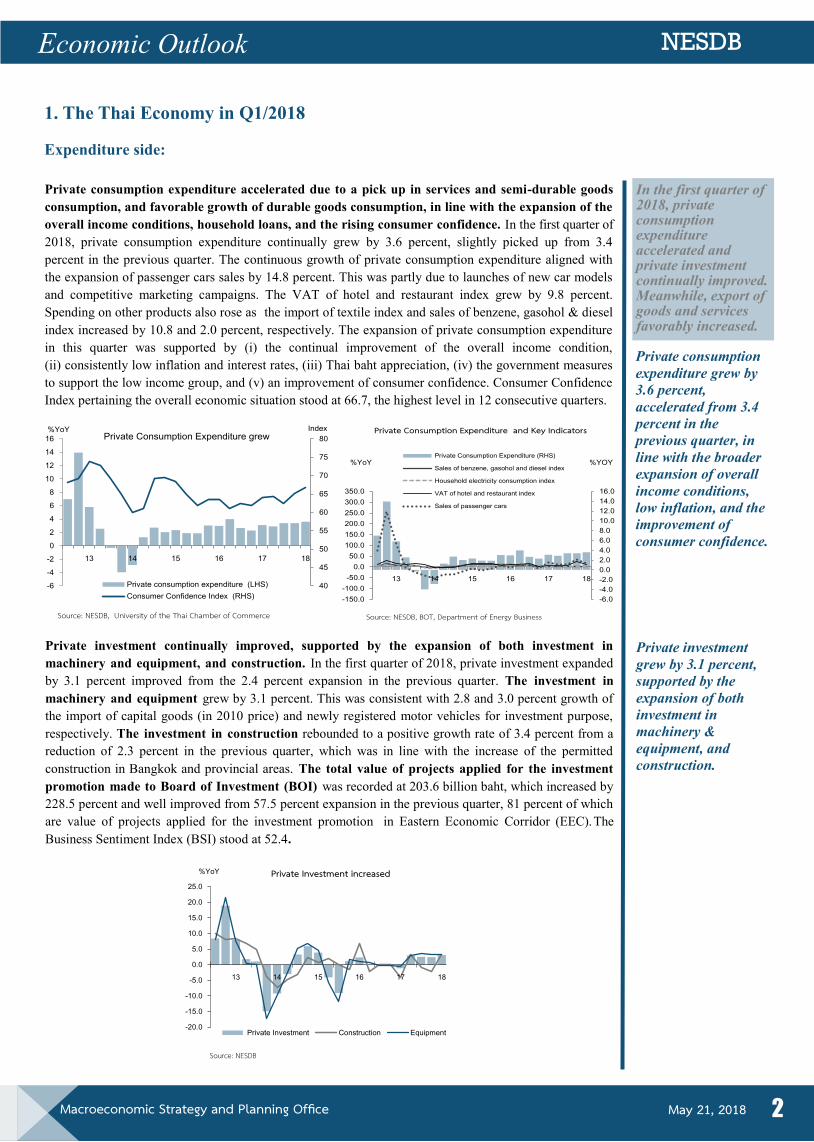
Private consumption expenditure accelerated due to a pick up in services and semi-durable goods
consumption, and favorable growth of durable goods consumption, in line with the expansion of the
overall income conditions, household loans, and the rising consumer confidence. In the first quarter of
2018, private consumption expenditure continually grew by 3.6 percent, slightly picked up from 3.4
percent in the previous quarter. The continuous growth of private consumption expenditure aligned with
the expansion of passenger cars sales by 14.8 percent. This was partly due to launches of new car models
and competitive marketing campaigns. The VAT of hotel and restaurant index grew by 9.8 percent.
Spending on other products also rose as the import of textile index and sales of benzene, gasohol & diesel
index increased by 10.8 and 2.0 percent, respectively. The expansion of private consumption expenditure
in this quarter was supported by (i) the continual improvement of the overall income condition,
(ii) consistently low inflation and interest rates, (iii) Thai baht appreciation, (iv) the government measures
to support the low income group, and (v) an improvement of consumer confidence. Consumer Confidence
Index pertaining the overall economic situation stood at 66.7, the highest level in 12 consecutive quarters.
Private investment continually improved, supported by the expansion of both investment in
machinery and equipment, and construction. In the first quarter of 2018, private investment expanded
by 3.1 percent improved from the 2.4 percent expansion in the previous quarter. The investment in
machinery and equipment grew by 3.1 percent. This was consistent with 2.8 and 3.0 percent growth of
the import of capital goods (in 2010 price) and newly registered motor vehicles for investment purpose,
respectively. The investment in construction rebounded to a positive growth rate of 3.4 percent from a
reduction of 2.3 percent in the previous quarter, which was in line with the increase of the permitted
construction in Bangkok and provincial areas. The total value of projects applied for the investment
promotion made to Board of Investment (BOI) was recorded at 203.6 billion baht, which increased by
228.5 percent and well improved from 57.5 percent expansion in the previous quarter, 81 percent of which
are value of projects applied for the investment promotion in Eastern Economic Corridor (EEC). The
Business Sentiment Index (BSI) stood at 52.4.
1. The Thai Economy in Q1/2018
In the first quarter of 2018, private consumption expenditure accelerated and private investment continually improved. Meanwhile, export of goods and services favorably increased.
Expenditure side:
Private consumption
expenditure grew by
3.6 percent,
accelerated from 3.4
percent in the
previous quarter, in
line with the broader
expansion of overall
income conditions,
low inflation, and the
improvement of
consumer confidence.
Private investment
grew by 3.1 percent,
supported by the
expansion of both
investment in
machinery &
equipment, and
construction.
Source: NESDB, University of the Thai Chamber of Commerce
40
45
50
55
60
65
70
75
80
-6
-4
-2
0
2
4
6
8
10
12
14
16
Index%YoYPrivate Consumption Expenditure grew
Private consumption expenditure (LHS)
Consumer Confidence Index (RHS) -6.0
-4.0
-2.0
0.0
2.0
4.0
6.0
8.0
10.0
12.0
14.0
16.0
-150.0
-100.0
-50.0
0.0
50.0
100.0
150.0
200.0
250.0
300.0
350.0
%YOY%YoY
Private Consumption Expenditure and Key Indicators
Private Consumption Expenditure (RHS)
Sales of benzene, gasohol and diesel index
Household electricity consumption index
VAT of hotel and restaurant index
Sales of passenger cars
Source: NESDB, BOT, Department of Energy Business
Source: NESDB
-20.0
-15.0
-10.0
-5.0
0.0
5.0
10.0
15.0
20.0
25.0
%YoY Private Investment increased
Private Investment Construction Equipment

Macroeconomic Strategy and Planning Office
NESDB Economic Outlook
May 21, 2018 3
Exports in US dollar term maintained its high growth rate, in accordance with the continued
economic expansion of key trading partners and the increased commodity prices in the world
market. Export value in the first quarter of 2018 was recorded at 61.8 billion US dollars, representing a
9.9 percent growth (continually expanded for 7 consecutive quarters). The export quantity increased by
5.0 percent, supported by the strong growth in the exports of manufacturing product of 9.7 percent. Export
price increased by 4.7 percent, reflected the increase in prices of crude oil, refined fuel, chemicals, and
plastic resin. Excluding unwrought gold, export value grew by 11.2 percent. In baht term, export value
decreased by 1.3 percent, compared with a 3.9 percent growth in the previous quarter.
Export value of agricultural commodities declined by 1.5 percent, compared with a 13.6 percent
growth in the previous quarter, due to the reduction in the export volume of some agricultural products,
such as rubber and tapioca. Meanwhile, export quantity of other key agricultural products still continue to
expand. Export value of manufacturing products expanded with the highest growth in 21 quarters by
14.1 percent, following the improvement of global economy. Export value of fishery products increased
by 6.5 percent. Meanwhile, export value of other products fell by 30.7 percent as a result of the decline
in the export of non-monetary gold. Export items with increased value included rice (21.1 percent),
tapioca (28.7 percent), vehicle parts & accessories (15.4 percent), passenger cars (18.5 percent), pick up
& trucks (1.8 percent), telecommunication equipment (37.7 percent), computer parts & accessories (16.1
percent), and machinery & equipment (9.4 percent). On the other hand, export items with decreased
value included rubber (-34.8 percent), sugar (-0.8 percent), rubber products (-2.8 percent), pineapple
canned/prepared or preserved (-39.0 percent), and optical appliance & instruments (-3.1 percent).
Export in US dollar
term maintained its
high growth rate of
9.9 percent. Export
value excluding
unwrought gold
increased by 11.2
percent.
Export quantity
increased by 5.0
percent and export
price increased by 4.7
percent.
In baht term, export
value decreased by 1.3
percent, which was in
accordance with the
movements in
exchange rate.
Export value of
manufacturing
products accelerated
both in quantity and
price, in accordance
with the improvement
of trading partners’
economies and
increased commodity
prices in the world
market. Meanwhile,
export value of
agricultural
commodities declined
due to the reduction
in the export value of
some products.
Source: Bank of Thailand
-10.0
-5.0
0.0
5.0
10.0
15.0
20.0
Q1/13 Q1/14 Q1/15 Q1/16 Q1/17 Q1/18
%YoY Export Indices
Price Value Volume
Source: Bank of Thailand
-100.0
-50.0
0.0
50.0
100.0
150.0
200.0
Q1/13 Q1/14 Q1/15 Q1/16 Q1/17 Q1/18
%YoY Export Classified by Product Group
Agriculture Fishery
Foresty Mining
Manufacturing
Export Value of Major Product in US Dollar Term %YoY 2016 2017 Share
Q1/18 (%) 2018
Year Year Q1 Q2 Q3 Q4 Q1 Agriculture -6.2 20.0 20.5 19.2 28.4 13.6 7.1 -1.5
Rice -4.4 17.2 -7.2 19.3 43.9 20.5 2.2 21.1 Rubber -12.1 35.7 78.3 37.9 22.9 11.7 1.9 -34.8 Tapioca -19.0 -7.0 -18.5 -13.7 5.8 2.7 1.1 28.7
Manufacturing -1.2 10.3 5.9 12.5 9.6 13.1 88.7 14.1 Sugar -8.6 7.0 -19.3 32.0 26.0 -9.5 1.0 -0.8 Crustaceans canned, prepared, or preserved -3.9 6.2 21.7 11.6 4.7 -5.8 0.3 -12.8 Rubber products 8.1 41.2 51.5 32.4 37.1 44.3 2.1 -2.8 Apparels and Textile Materials -5.5 3.9 3.2 1.1 3.9 7.4 2.9 8.3 Electronics -2.8 14.2 10.3 16.5 11.3 18.4 14.7 13.3
- Computer parts & accessories -8.6 5.8 -0.8 4.4 2.5 16.6 6.1 16.1 - Integrated circuits & parts -0.1 7.1 11.7 11.1 3.4 3.6 3.3 7.4 - Printed circuits -6.9 10.5 13.9 9.7 4.0 15.9 0.5 0.9 - Telecommunication equipment 1.5 51.1 21.6 71.6 49.6 60.4 2.3 37.7
Electrical appliances 3.5 6.2 9.5 4.1 3.1 8.5 6.0 9.6 Metal & steel -0.2 14.8 17.3 16.1 8.6 17.9 4.6 17.3 Automotive 3.2 6.3 2.6 2.3 2.6 18.1 15.7 15.7
- Passenger car 22.8 -7.1 -19.1 -9.8 -10.8 13.5 4.6 18.5 - Pick up and trucks -20.9 11.8 15.8 4.3 -1.8 30.2 3.1 1.8 - Vehicle parts & accessories 5.2 13.6 13.4 9.7 14.4 16.9 6.6 15.4
Machinery & equipment -0.3 7.3 4.2 11.5 13.2 0.9 8.5 9.4 Chemicals -5.0 20.8 23.1 14.4 24.8 21.4 3.5 27.8 Petro-chemical products -3.7 11.2 7.3 16.1 10.9 10.7 5.5 17.7 Petroleum products -30.9 32.6 43.0 36.7 29.7 26.0 3.4 41.1
Fishery 15.1 4.8 2.1 10.4 11.5 -4.1 0.8 6.5 Crustaceans 38.5 7.2 -4.8 8.4 17.8 4.2 0.4 13.6
Other Exports 75.5 -19.6 -35.0 -44.3 49.8 -43.1 2.0 -30.7 Non-monetary gold (excl. articles of goldsmiths) 89.8 -20.7 -37.5 -45.4 52.7 -46.6 1.9 -31.5
Total Exports (Customs basis) 0.5 9.9 4.9 10.9 12.0 11.7 100.0 11.3 Exports, f.o.b. (BOP basis) 0.1 9.7 6.8 7.9 12.5 11.6 98.3 9.9 Export Value (exclude gold) -1.6 10.8 9.2 9.8 11.2 12.8 96.5 11.2 Source: Bank of Thailand

Macroeconomic Strategy and Planning Office
NESDB Economic Outlook
May 21, 2018 4
Export markets: exports to all major markets expanded favorably. Exports to the US, EU (15), and
Japan increased by 9.3, 10.0, and 23.4 percent, respectively, which were in line with the continued
improvement of the US, EU, and Japan economies. Meanwhile, exports to China increased by 0.6 percent,
decelerated from 14.2 percent growth in the previous quarter mainly due to the reduction in exports of
rubber and rubber products. Exports to ASEAN (9) expanded by 15.2 percent, due to the expansion of
export to ASEAN (5) by 15.7 percent and CLMV countries by 14.5 percent. Exports to the Middle East (15)
continued to expand by 12.4 percent, due to an increase in exports of vehicles, parts & accessories,
precious stones & jewelry, and woods & wood products. Similarly, exports to Australia expanded by 14.3
percent, due to the expansion of exports in vehicles, parts & accessories, air conditioning machines, and
plastics products.
Exports to major
markets expanded
favorably, especially
US, EU (15), China,
Japan, ASEAN (9),
Australia, and the
Middle East (15). This
was in line with the
improvement of key
trading partners’
economies.
Import value in US dollar term accelerated, in accordance with the expansion of exports and domestic
demand. In the first quarter of 2018, the value of import was recorded at 55.2 billion US dollars, grew by
16.3 percent. Import price and quantity increased by 6.6 percent and 9.2 percent, respectively. The import
volume of raw materials & intermediate goods, capital goods, and consumer goods increased by 9.0, 2.9
and 15.7 percent respectively, associated with the expansion of exports, manufacturing production, and
domestic demand. Import value excluding unwrought gold expanded by 16.0 percent. In Thai baht term,
the import value increased by 4.5 percent.
Import value in US
dollar term expanded
by 16.3 percent due to
the increase of both
quantity and price.
Export Value to Key Markets in US Dollar Term
%YOY 2016 2017 Share
Q1/18 (%) 2018
Year Year Q1 Q2 Q3 Q4 Q1 Total Exports (Mil US$) (Customs basis) 215,388 236,694 56,456 57,090 61,888 61,259
100.00 62,829
(%YoY) 0.5 9.9 4.9 10.9 12.0 11.7 11.3 United States 1.8 8.3 7.4 7.0 8.1 10.7 10.6 9.3 Japan 2.1 8.9 -2.5 20.1 10.4 9.3 10.3 23.4 EU (15) 1.0 7.6 9.2 5.5 4.5 11.4 9.5 10.0 China 0.3 23.7 36.5 26.0 21.7 14.2 11.5 0.6 ASEAN (9) -0.7 8.9 0.0 15.0 9.6 11.7 25.9 15.2 - ASEAN (5)* -1.1 6.0 -8.9 17.2 5.3 13.1 15.0 15.7 - CLMV** -0.0 13.1 15.3 11.8 16.2 9.9 10.9 14.5 Middle East (15) -15.1 -5.1 -23.1 -0.4 0.7 6.4 3.5 12.4 Australia 5.5 1.9 -3.0 -4.8 -0.1 17.2 4.5 14.3 Hong Kong -3.0 7.3 6.3 13.0 7.7 2.8 5.1 1.3 India -2.6 25.8 18.3 13.3 27.3 46.3 3.2 31.0 South Korea -0.7 14.6 24.2 24.2 11.3 0.8 2.0 4.2 Taiwan -4.5 18.2 15.9 22.1 23.3 11.3 1.6 11.5
Note: * ASEAN (5) consist of Brunei, Indonesia, Malaysia, Philippines, and Singapore ** CLMV consist of Cambodia, Laos, Myanmar, and Vietnam Source: Bank of Thailand
-20.0
-15.0
-10.0
-5.0
0.0
5.0
10.0
15.0
20.0
Q1/13 Q1/14 Q1/15 Q1/16 Q1/17 Q1/18
%YoY Import Indices
Price Value Volume
Source: Bank of Thailand Source: Bank of Thailand
-30.0
-20.0
-10.0
0.0
10.0
20.0
30.0
40.0
50.0
Q1/13 Q1/14 Q1/15 Q1/16 Q1/17 Q1/18
%YoYImport Classified by Economic Classification
Consumer goods
Raw materials and intermediate goods
Capital goods
Total
Macroeconomic Strategy and Planning Office
NESDB Economic Outlook
May 21, 2018 5
Overall, import value of all categories increased. Import value of raw materials and intermediate goods
accelerated with a 17.9 percent growth, which was in line with the continually expansion of the exports
and the improvement in manufacturing production. Import of capital goods continued to expand by 6.7
percent due to increase in both import quantity and price. Import value of consumer goods increased by
21.3 percent, in accordance with the continual expansion of domestic demand. Meanwhile, other imports
expanded by 26.0 percent. Import items with increased value were crude oil, petroleum products,
materials of base metal, power-generating machinery & parts, other machinery & mechanical appliances
& parts, aircrafts, food, beverage, & dairy products, animal & fishery products, and non-monetary gold.
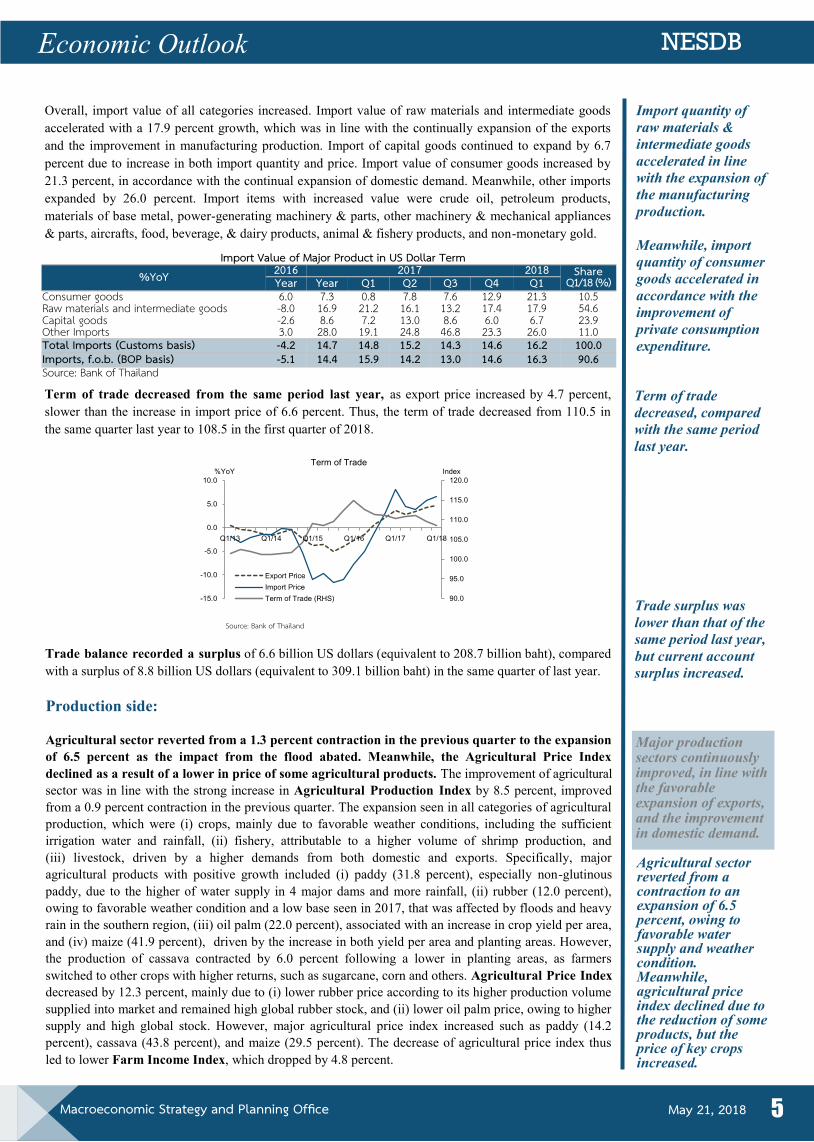
Term of trade decreased from the same period last year, as export price increased by 4.7 percent,
slower than the increase in import price of 6.6 percent. Thus, the term of trade decreased from 110.5 in
the same quarter last year to 108.5 in the first quarter of 2018.
Term of trade
decreased, compared
with the same period
last year.
Trade balance recorded a surplus of 6.6 billion US dollars (equivalent to 208.7 billion baht), compared
with a surplus of 8.8 billion US dollars (equivalent to 309.1 billion baht) in the same quarter of last year.
Import quantity of
raw materials &
intermediate goods
accelerated in line
with the expansion of
the manufacturing
production.
Meanwhile, import
quantity of consumer
goods accelerated in
accordance with the
improvement of
private consumption
expenditure.
Agricultural sector reverted from a 1.3 percent contraction in the previous quarter to the expansion
of 6.5 percent as the impact from the flood abated. Meanwhile, the Agricultural Price Index
declined as a result of a lower in price of some agricultural products. The improvement of agricultural
sector was in line with the strong increase in Agricultural Production Index by 8.5 percent, improved
from a 0.9 percent contraction in the previous quarter. The expansion seen in all categories of agricultural
production, which were (i) crops, mainly due to favorable weather conditions, including the sufficient
irrigation water and rainfall, (ii) fishery, attributable to a higher volume of shrimp production, and
(iii) livestock, driven by a higher demands from both domestic and exports. Specifically, major
agricultural products with positive growth included (i) paddy (31.8 percent), especially non-glutinous
paddy, due to the higher of water supply in 4 major dams and more rainfall, (ii) rubber (12.0 percent),
owing to favorable weather condition and a low base seen in 2017, that was affected by floods and heavy
rain in the southern region, (iii) oil palm (22.0 percent), associated with an increase in crop yield per area,
and (iv) maize (41.9 percent), driven by the increase in both yield per area and planting areas. However,
the production of cassava contracted by 6.0 percent following a lower in planting areas, as farmers
switched to other crops with higher returns, such as sugarcane, corn and others. Agricultural Price Index
decreased by 12.3 percent, mainly due to (i) lower rubber price according to its higher production volume
supplied into market and remained high global rubber stock, and (ii) lower oil palm price, owing to higher
supply and high global stock. However, major agricultural price index increased such as paddy (14.2
percent), cassava (43.8 percent), and maize (29.5 percent). The decrease of agricultural price index thus
led to lower Farm Income Index, which dropped by 4.8 percent.
Production side:
Major production sectors continuously improved, in line with the favorable expansion of exports, and the improvement in domestic demand.
Trade surplus was
lower than that of the
same period last year,
but current account
surplus increased.
Import Value of Major Product in US Dollar Term %YoY 2016 2017 Share
Q1/18 (%) 2018
Year Year Q1 Q2 Q3 Q4 Q1 Consumer goods 6.0 7.3 0.8 7.8 7.6 12.9 10.5 21.3 Raw materials and intermediate goods -8.0 16.9 21.2 16.1 13.2 17.4 54.6 17.9 Capital goods -2.6 8.6 7.2 13.0 8.6 6.0 23.9 6.7 Other Imports 3.0 28.0 19.1 24.8 46.8 23.3 11.0 26.0 Total Imports (Customs basis) -4.2 14.7 14.8 15.2 14.3 14.6 100.0 16.2 Imports, f.o.b. (BOP basis) -5.1 14.4 15.9 14.2 13.0 14.6 90.6 16.3 Source: Bank of Thailand
Source: Bank of Thailand
90.0
95.0
100.0
105.0
110.0
115.0
120.0
-15.0
-10.0
-5.0
0.0
5.0
10.0
Q1/13 Q1/14 Q1/15 Q1/16 Q1/17 Q1/18
Index%YoYTerm of Trade
Export Price
Import Price
Term of Trade (RHS)
Agricultural sector reverted from a contraction to an expansion of 6.5 percent, owing to favorable water supply and weather condition. Meanwhile, agricultural price index declined due to the reduction of some products, but the price of key crops increased.

Macroeconomic Strategy and Planning Office
NESDB Economic Outlook
May 21, 2018 6
Manufacturing sector accelerated with a 3.7 percent growth, in tandem with the favorable expansion of export and the faster growth in domestic demand. Manufacturing Production Index of the domestic-oriented industries and the industries with export share of 30-60 percent to total production increased by 4.0 and 7.2 percent, respectively. Meanwhile, the key export-oriented products expanded well but the index slightly declined due to the reduction of some specific products. The capacity utilization rate reached 72.4 percent, which was the highest rate for the last 5 years (only Q1).
Manufacturing sector grew by 3.7 percent accelerated from 3.4 percent growth in the previous
quarter, in line with the favorable expansion of export and the improvement of domestic demand.
Meanwhile, the first quarter capacity utilization rate reached 72.4 percent, a peak over the last 5
years (only Q1). The acceleration in manufacturing production was alongside with the 3.9 percent
increase in Manufacturing Production Index (MPI). Manufacturing Production Index of the industries
with 30-60 percent export share to total production grew by 7.2 percent accelerated from 5.0 percent
growth in the previous quarter, in tandem with the acceleration of major industries such as 12.0 percent
growth of vehicle, 9.1 percent growth in animal processing and preservation, and 3.8 percent growth of
motorcycles. Besides, sugar production continually grew by 11.7 percent. Manufacturing Production
Index of the domestic-oriented industries (with export share of less than 30 percent to total
production) increased by 4.0 percent, accelerated from 2.7 percent growth in the previous quarter, owing
to the growth in major industries such as production of plastics and synthetics rubber (8.7 percent),
refined petroleum products (20.6 percent), and vegetable and animal oils and fats (38.8 percent), including
the favorable expansion of basic iron and steel production (3.1 percent). Manufacturing Production
Index of export-oriented industries (with export share of more than 60 percent to total production) slightly declined by 0.6 percent, due mainly to the decline in production of other rubber products (4.3
percent) and processing and preserving of fish (5.1 percent). Meanwhile, most of other productions
favorably expanded such as computers and peripheral equipment (10.2 percent), electronic components
(2.7 percent), and domestic appliances (7.3 percent). The strengthening recovery and more broad-based
growth of manufacturing sector production led to a significant rise in the average capacity utilization
rate, which reached 72.4 percent, the highest record over the last 5 years (only Q1), improving from 67.4
percent and 69.6 percent in the previous quarter and in the same quarter last year. There were clearly seen
in (i) more than 80 percent average capacity utilization industries, of which 7 sectors of 21 sectors,
including the production of sugar (134.1 percent), plastics and synthetics rubber (98.5 percent), vehicles
(93.4 percent), refined petroleum products (88.1 percent), processing and preserving of meat (86.3
percent), motorcycles (80.2 percent), computers and peripheral equipment (80.1 percent) and (ii) 60-80
percent average capacity utilization industries, which included the production of electronic
components and boards (76.2 percent), rubber tyres and tubes (69.1 percent), wearing apparel, except fur
apparel (67.2 percent), other general-purpose machinery (66.8 percent), plastic products (63.8 percent),
and domestic appliances (63.7 percent).
Manufacturing Production Index with positive growth included vehicles (12.0 percent), refined
petroleum products (20.6 percent), vegetable and animal oils and fats (38.8 percent), plastics and
synthetics rubber (8.7 percent), and computers and peripheral equipment (10.2 percent), etc.
Manufacturing Production Index with negative growth included tobacco products (-31.2 percent),
distilling, rectifying and blending of spirits (-29.6 percent), and other rubber products (-4.3 percent), etc.
-20
-10
0
10
20
(%YoY)
Agr. production index
Agr. price index
Farm income index
Source: Office of Agricultural Economics
Farm Income Index decreased by 4.8 percent due to decreased in prices of agricultural products while production increased.
-75
-50
-25
0
25
50
75
100
125
Q1/14 Q1/15 Q1/16 Q1/17 Q1/18
(%YoY)Paddy
Cassava
USS no.3
oil palm
Sugarcane
The prices of paddy and cassava increasedwhile prices of rubber, oil palm and sugarcane declined.
Source: Office of Agricultural Economics
Manufacturing Production Index increased by 3.9 percent and the capacity utilization rate averaged at 72.4 percent.
Source : Office of Industrial Economics
0.0
20.0
40.0
60.0
80.0
-20.0
-15.0
-10.0
-5.0
0.0
5.0
10.0
Q1/14 Q1/15 Q1/16 Q1/17 Q1/18
MPI Export<30%
Export 30-60% Export>60%
%Cap U (RHS)
(%YoY) %
Macroeconomic Strategy and Planning Office
NESDB Economic Outlook
May 21, 2018 7
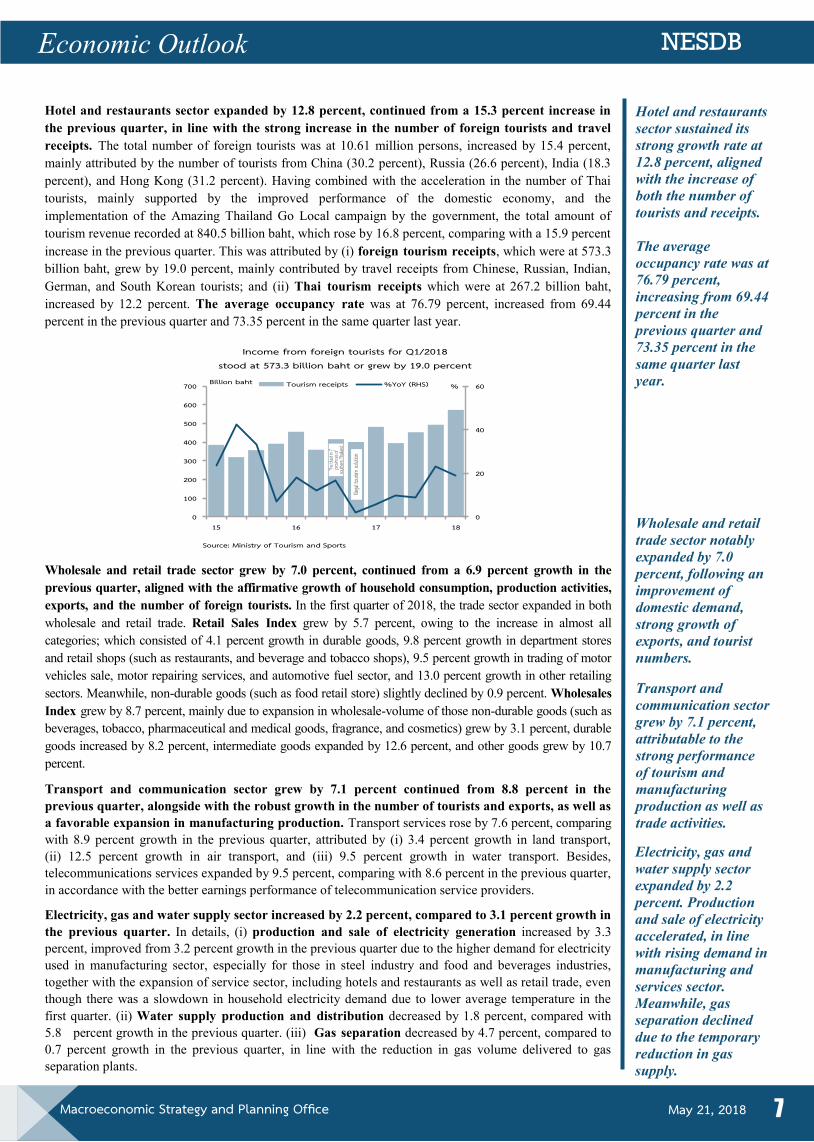
Hotel and restaurants sector expanded by 12.8 percent, continued from a 15.3 percent increase in
the previous quarter, in line with the strong increase in the number of foreign tourists and travel
receipts. The total number of foreign tourists was at 10.61 million persons, increased by 15.4 percent,
mainly attributed by the number of tourists from China (30.2 percent), Russia (26.6 percent), India (18.3
percent), and Hong Kong (31.2 percent). Having combined with the acceleration in the number of Thai
tourists, mainly supported by the improved performance of the domestic economy, and the
implementation of the Amazing Thailand Go Local campaign by the government, the total amount of
tourism revenue recorded at 840.5 billion baht, which rose by 16.8 percent, comparing with a 15.9 percent
increase in the previous quarter. This was attributed by (i) foreign tourism receipts, which were at 573.3
billion baht, grew by 19.0 percent, mainly contributed by travel receipts from Chinese, Russian, Indian,
German, and South Korean tourists; and (ii) Thai tourism receipts which were at 267.2 billion baht,
increased by 12.2 percent. The average occupancy rate was at 76.79 percent, increased from 69.44
percent in the previous quarter and 73.35 percent in the same quarter last year.
Wholesale and retail
trade sector notably
expanded by 7.0
percent, following an
improvement of
domestic demand,
strong growth of
exports, and tourist
numbers.
Hotel and restaurants
sector sustained its
strong growth rate at
12.8 percent, aligned
with the increase of
both the number of
tourists and receipts.
The average
occupancy rate was at
76.79 percent,
increasing from 69.44
percent in the
previous quarter and
73.35 percent in the
same quarter last
year.
Wholesale and retail trade sector grew by 7.0 percent, continued from a 6.9 percent growth in the
previous quarter, aligned with the affirmative growth of household consumption, production activities,
exports, and the number of foreign tourists. In the first quarter of 2018, the trade sector expanded in both
wholesale and retail trade. Retail Sales Index grew by 5.7 percent, owing to the increase in almost all
categories; which consisted of 4.1 percent growth in durable goods, 9.8 percent growth in department stores
and retail shops (such as restaurants, and beverage and tobacco shops), 9.5 percent growth in trading of motor
vehicles sale, motor repairing services, and automotive fuel sector, and 13.0 percent growth in other retailing
sectors. Meanwhile, non-durable goods (such as food retail store) slightly declined by 0.9 percent. Wholesales
Index grew by 8.7 percent, mainly due to expansion in wholesale-volume of those non-durable goods (such as
beverages, tobacco, pharmaceutical and medical goods, fragrance, and cosmetics) grew by 3.1 percent, durable
goods increased by 8.2 percent, intermediate goods expanded by 12.6 percent, and other goods grew by 10.7
percent.
Transport and communication sector grew by 7.1 percent continued from 8.8 percent in the
previous quarter, alongside with the robust growth in the number of tourists and exports, as well as
a favorable expansion in manufacturing production. Transport services rose by 7.6 percent, comparing
with 8.9 percent growth in the previous quarter, attributed by (i) 3.4 percent growth in land transport,
(ii) 12.5 percent growth in air transport, and (iii) 9.5 percent growth in water transport. Besides,
telecommunications services expanded by 9.5 percent, comparing with 8.6 percent in the previous quarter,
in accordance with the better earnings performance of telecommunication service providers.
Electricity, gas and water supply sector increased by 2.2 percent, compared to 3.1 percent growth in
the previous quarter. In details, (i) production and sale of electricity generation increased by 3.3
percent, improved from 3.2 percent growth in the previous quarter due to the higher demand for electricity
used in manufacturing sector, especially for those in steel industry and food and beverages industries,
together with the expansion of service sector, including hotels and restaurants as well as retail trade, even
though there was a slowdown in household electricity demand due to lower average temperature in the
first quarter. (ii) Water supply production and distribution decreased by 1.8 percent, compared with
5.8 percent growth in the previous quarter. (iii) Gas separation decreased by 4.7 percent, compared to
0.7 percent growth in the previous quarter, in line with the reduction in gas volume delivered to gas
separation plants.
0
20
40
60
0
100
200
300
400
500
600
700
15 16 17 18
%Billion baht Tourism receipts %YoY (RHS)
Income from foreign tourists for Q1/2018stood at 573.3 billion baht or grew by 19.0 percent
Source: Ministry of Tourism and Sports
The bla
st in 7
pro
vinces
of sou
thern
Thailan
d
Illegal
touris
m sol
ution
Transport and
communication sector
grew by 7.1 percent,
attributable to the
strong performance
of tourism and
manufacturing
production as well as
trade activities.
Electricity, gas and
water supply sector
expanded by 2.2
percent. Production
and sale of electricity
accelerated, in line
with rising demand in
manufacturing and
services sector.
Meanwhile, gas
separation declined
due to the temporary
reduction in gas
supply.

Macroeconomic Strategy and Planning Office
NESDB Economic Outlook
May 21, 2018 8
Construction sector increased by 1.2 percent, improving from a 5.3 percent decline in the previous
quarter. The public construction slightly decreased by 0.1 percent, but improved from a 7.1 percent
decline in the previous quarter, due to a 12.1 percent growth of state-owned enterprise construction
accelerating from a 9.9 growth in the previous quarter. Meanwhile, government construction decreased by
5.4 percent, slower than a contraction of 13.7 percent in the last quarter of 2017. The private
construction increased by 3.4 percent, significantly improved from a 2.3 percent decline in the previous
quarter following the improvement in construction of residential buildings and factory buildings, which
increased by 4.1 and 3.4 percent, respectively. Construction Materials Price Index increased by 2.8
percent, following a rise in prices of concrete (3.5 percent), cement (4.0 percent), and wood and wood
products (2.9 percent), especially steel and steel products, which grew by 8.3 percent due to a continuous
steel price hike in the world market since last year.
Employment: agricultural employment improved, in tandem with a recovery in major agricultural
production, while non-agricultural employment dropped. In the first quarter of 2018, the employment
slightly decreased by 0.2 percent, improving from a 0.6 percent decline in the previous quarter. This was
mainly due to an expansion of 6.0 percent in agricultural employment, improving from reduction of 1.2
and 2.0 percent in the third quarter and the fourth quarter of 2017, respectively, in tandem with a
favorable expansion of major agricultural production, such as paddy, rubber, oil palm, and maize, etc.
Meanwhile, non-agricultural employment decreased by 2.8 percent following the decrease in employment
of construction, wholesale and retail sales, and automobile repair sector. Similarly, employment in
manufacturing sector declined by 0.03 percent improved from the contraction in the last 3 consecutive
quarters, in line with the consistent improvement of manufacturing production. Unemployment in the first
quarter was recorded at 470,000 persons and the unemployment rate was at 1.2 percent.
Construction sector
expanded by 1.2
percent, improved
from the contraction
in 3 preceding
quarters.
Employment declined
by 0.2 percent,
improved from 0.6
percent decline in the
previous quarter.
Unemployment rate
stood at 1.2 percent.
0.0
0.2
0.4
0.6
0.8
1.0
1.2
1.4
36.4
36.6
36.8
37.0
37.2
37.4
37.6
37.8
38.0
38.2
38.4
38.6
Employment (LHS)
Unemployment rate (RHS)
(%)(Million Persons)
Employment declined by 0.2 percent but improved from the previous quarter, following an expansion of employment in
agricultural sector. Unemployment rate was low at 1.2 percent.
Source: National Statistics Office
Employed Persons by Industry
%YOY Shared Q1/18
2016 2017 2018 Year Year Q1 Q2 Q3 Q4 Q1 Jan Feb Mar
Employed 100.0 -0.9 -0.6 -0.6 0.4 -1.6 -0.6 -0.2 -0.4 -0.2 -0.3 - Agricultural 31.2 -4.3 0.3 -1.4 6.3 -1.2 -2.0 6.0 7.0 5.4 4.5 - Non-Agricultural 68.8 0.8 -1.0 -0.3 -2.1 -1.8 0.1 -2.8 -3.3 -2.4 -2.4
Manufacturing 16.8 -2.6 -2.9 -1.5 -4.2 -4.0 -1.8 -0.03 -2.1 -0.8 3.4 Construction 5.6 3.1 -8.2 -8.7 -11.8 -6.8 -4.3 -11.8 -13.7 -10.7 -9.4 Wholesale and retail trade; repair of motor vehicles and motorcycles
16.8 2.5 -0.2 0.9 1.0 -2.6 0.02 -2.8 -5.7 0.7 -2.6
Accommodation and food service activities
7.5 3.2 1.8 4.2 -2.7 -1.0 6.8 -1.3 -1.1 1.6 -4.8
Total labor force (Million persons) 38.3 38.1 38.2 38.3 38.2 37.7 38.1 37.8 38.4 38.1 employed (Million persons) 37.7 37.5 37.4 37.5 37.6 37.2 37.4 37.1 37.6 37.3
Unemployment (Hundred thousand persons)
3.8 4.5 4.6 4.6 4.5 4.2 4.7 4.7 4.9 4.4
Unemployment Rate (%) 1.0 1.2 1.2 1.2 1.2 1.1 1.2 1.3 1.3 1.2 Source: NSO

Macroeconomic Strategy and Planning Office
NESDB Economic Outlook
May 21, 2018 9
On the revenue side, in the second quarter of the fiscal year 2018 (January - March 2018) the net
government revenue collection stood at 527.4 billion baht, an increase by 5.5 percent from the same
quarter last year and higher than the official target by 2.8 percent. This was partly due to an increase of
revenue collected from VAT, corporate income tax, petroleum income tax, and excise tax on vehicle.
Meanwhile, the revenue collection from personal income tax decreased by 3.1 percent due to revision of
the Revenue Code on the allowance and exemption after deduction of expenses. Furthermore, the excise
tax collections on beer and spirits decreased by 14.7 percent and 9.0 percent respectively.
For the first half of the 2018 fiscal year, the net government revenue collection stood at 1,075.0 billion
baht, increased by 2.5 percent from the same period last year and higher than the official target by 3.7
percent.
The net government
revenue collection
increased by 5.5
percent and was
higher than the target
by 2.8 percent.
Fiscal Conditions:
The current
expenditure
disbursement
increased whereas the
capital expenditure
disbursement
decreased.
Government Revenue
Fiscal Year (Billion Baht)
2016 2017 2018 Year Year Q1 Q2 Q3 Q4 Q1 Q2 H1
Net Government Revenue 2,394.6 2,355.7 548.2 500.1 689.9 617.5 547.5 527.4 1,075.0
Compared with the target (%) 0.4 0.5 4.4 -1.5 -1.4 1.2 4.5 2.8 3.7 YOY (%) 8.2 -1.6 -6.5 1.5 -3.8 3.1 -0.1 5.5 2.5
Source: Ministry of Finance
On the expenditure side, the total budget disbursement in the second quarter of the fiscal year 2018 was
at 680.2 billion baht, a decrease by 2.1 percent from the second quarter of FY2017. Classified by its
source of funds, the government disbursements were as follows: (i) the 2018 annual budget
disbursement in this quarter was at 572.9 billion baht declined by 0.6 percent from the same period of
last year (equivalent to 19.8 percent of the annual budget, lower than the target of 22.0 percent but higher
than the disbursement rate of 19.7 percent in the same period last year). The current expenditure
disbursement increased slightly by 0.3 percent (equivalent of 21.0 percent of the annual budget, lower
than the target of 22.0 percent but higher than the disbursement rate of 20.1 percent in the same period
last year). On the other hand, the capital expenditure disbursement decreased by 5.0 percent from the
same period of last year (equivalent to 15.1 percent of the annual budget, lower than the target of 22.0
percent and higher than the disbursement rate of 18.2 percent in the same period last year). (ii) The carry-over
budget disbursement was at 58.0 billion baht, which decreased by 3.1 percent from the second quarter of
2017. (iii) State-owned enterprises’ capital expenditure budget (excluding PTT)1 was expected to
disburse at 51.0 billion baht, rose from the same period last year by 28.6 percent. (iv) The off-budget
loans were disbursed at 626.1 million baht, consisting of a 581.5 million baht disbursement on the Water
Resource Management and Road Transport System Project’s loans and a 44.6 million baht disbursement
on the Development Policy Loan (DPL).
For the first half of the 2018 fiscal year, (i) the total budget disbursement was at 1,470.7 billion baht,
a 1.2 percent increase from the same period of 2017 (with a 50.7 percent disbursement rate, lower than the
target of 52.3 percent but higher than the disbursement rate of 49.7 percent in the same period last year).
This was consisted of a 180.9 billion baht of the capital expenditure disbursement which decreased by 5.3
percent (with a 29.2 percent disbursement rate, lower than the target of 43.1 percent and the disbursement
rate of 35.2 percent in the same period last year). However, the disbursement rate in the second half of FY 2018
tended to be accelerated once adding purchasing order (PO). In detail, the actual disbursement rate plus
PO in the first half of 2018 was at 54.8 percent of total capital expenditure budget, higher than the same
period last year of 44.0 percent. (ii) The disbursement of the carry-over budget stood at 127.7 billion baht,
equivalent to 39.4 percent of the total carry-over budget. (iii) State-owned enterprises’ capital expenditure
budget (excluding PTT) disbursement was expected to disburse at 109.9 billion baht. (iv) The off-budget
loans disbursement amounted to 1.6 billion baht.
The disbursement
rate of capital budget
in the second half of
FY2018 is expected to
accelerate as
indicated by the PO of
54.8 percent at the
end of the first half of
FY2018, compared
with 44.0 percent over
the same period last
year.
1 This number included the annual capital budget disbursement of 2.28 billion baht of annual budget.

Macroeconomic Strategy and Planning Office
NESDB Economic Outlook
May 21, 2018 10
Public Debt at the end of March 2018 was accumulated at 6.5 trillion baht or equivalent to 39.2 percent
of GDP. The public debt was comprised of domestic loans of 6.2 trillion baht (37.6 percent of GDP) and
foreign loans of 270.0 billion baht (1.6 percent of GDP).
Fiscal Balance: in the second quarter of fiscal year 2018, the budgetary balance recorded a deficit of 95.1
billion baht, while the non-budgetary balance recorded a surplus of 52.4 billion baht. The government
conducted a cash balance management through borrowing for a total of 124.4 billion baht. Therefore, the
cash balance after debt financing recorded a net surplus of 81.6 billion baht. Combined with 180.9 billion
baht of treasury reserve at the end of the first quarter, the treasury reserve stood at 262.6 billion baht at the
end of the second quarter of fiscal year 2018.
For the first half of the 2018 fiscal year, the budgetary balance recorded a deficit of 517.1 billion baht
and the non-budgetary balance recorded a deficit of 29.5 billion baht. The government has conducted a
cash balance management through borrowing total of 285.4 billion baht. Therefore, the cash balance after
debt financing recorded a net deficit of 261.2 billion baht.
At the end of the
second quarter of
FY2018, the treasury
reserve stood at 262.6
billion baht.
The public debt
remained under the
fiscal prudential
framework at 39.2
percent of GDP.
-40
-20
0
20
40
60
80
100
-400,000
-200,000
0
200,000
400,000
600,000
800,000
1,000,000
YOY (%)Million THB
Source: GFMIS
Annual Budget Disbursement
Capital Exp. (LHS)
Current Exp. (LHS)
Annual budget disbursement Growth Rates (RHS)
0
5
10
15
20
25
30
35
%
Source: GFMIS
The 2nd Quarter Annual Budget Disbursement and Target Rates
Total Annual Exp. Disbursement Rate
Capital Exp. Disbursement Rate
Total Annual Exp. Target
Capital Exp. Target
0
5
10
15
20
25
30
35
40
45
50
0
1,000
2,000
3,000
4,000
5,000
6,000
7,000
% of GDPBillion Baht
Source: PDMO and NESDB
Public Debt (Accumulated)
foreign loans domestic loans Total Accumulated Debt to GDP (RHS)
0
50,000
100,000
150,000
200,000
250,000
300,000
0
100,000
200,000
300,000
400,000
500,000
600,000
700,000
10 11 12 13 14 15 16 17 18
Source: MOF
Statement of Government Operations
Treasury Reserve (LHS)
Financing (RHS)
Million BahtMillion Baht

Macroeconomic Strategy and Planning Office
NESDB Economic Outlook
May 21, 2018 11
Policy interest rate
remained unchanged,
while Fed together
with Bank of Canada
and Bank Negara
Malaysia and PBOC
raised their rates.
Nonetheless, most
central banks
maintained
accommodative policy
stance.
Interest rate remained
stable, whereas real
interest rate increased
as inflation
decelerated.
The policy rate kept unchanged at 1.50 percent over the first quarter
At the meeting on February 14 and 28 March, the Monetary Policy Committee (MPC) left its policy rate
on hold at 1.50 percent to maintain accommodative policy stance, thereby supporting a gradual rise of
inflation towards target range. Meanwhile, central banks in major advanced economies gradually moved
forward to a less accommodative stance, aligned with the improvement of economic activities and clearer
signs of inflationary pressures. In particular, the Federal Reserve decided to raise its policy rate by 0.25
percent to a range of 1.50 – 1.75 percent in the meeting on 21 – 22 March, with a signal of the more
aggressive response to tight labor market conditions and rising wage pressures. Thus, markets anticipated
a faster pace of Fed’s normalization. Besides, the European Central Bank (ECB) started to reduce the pace
of its monthly asset purchases by 30 billion Euros, starting from January 2018. Among others, Bank of
Canada and Bank Negara Malaysia raised their policy rates in January, and the People Bank of China
(PBOC) then raised its reverse repo rate (RRR) after Fed rate hike on March. However, other central
banks in the region maintained their accommodative stance that remain appropriate in fostering a more
broad-based recovery and supporting inflation back to their target ranges, amidst financial asset price and
capital flows volatilities in emerging markets in the presence of inflation inertia to converge to their
targets observed in many countries.
In April 2018, the central banks of both advanced economies and others in the region kept their monetary
policy direction steady as last month. Yet, the European Central Bank (ECB) and Bank of Japan stated that
dynamic inflation is likely to undershoot their targets and thus would take more time to achieve. In addition, the
People’s Bank of China (PBOC) cut its reserve requirement ratio (RRR) by 1.00 percent, starting from 25 April
onward; on the move to boost liquidity and in turn help ease a tightening financial conditions from deleverage
measures.
Financial Conditions:
Policy Interest Rate
(%)
At the end of
2016 2017 2018
Year Year Q1 Q2 Q3 Q4 Q1 Jan Feb Mar Apr
USA 0.50-0.75 1.25-1.50 0.75-1.00 1.00-1.25 1.00-1.25 1.25-1.50 1.50-1.75 1.25-1.50 1.25-1.50 1.50-1.75 1.50-1.75
EU 0.00 0.00 0.00 0.00 0.00 0.00 0.00 0.00 0.00 0.00 0.00
England 0.25 0.50 0.25 0.25 0.25 0.50 0.50 0.50 0.50 0.50 0.50
Japan -0.10 -0.10 -0.10 -0.10 -0.10 -0.10 -0.10 -0.10 -0.10 -0.10 -0.10
Australia 1.50 1.50 1.50 1.50 1.50 1.50 1.50 1.50 1.50 1.50 1.50
New Zealand 1.75 1.75 1.75 1.75 1.75 1.75 1.75 1.75 1.75 1.75 1.75
Canada 0.50 1.00 0.50 0.50 1.00 1.00 1.25 1.25 1.25 1.25 1.25
Russia 10.00 7.75 9.75 9.00 8.50 7.75 7.25 7.75 7.50 7.25 7.25
China 4.35 4.35 4.35 4.35 4.35 4.35 4.35 4.35 4.35 4.35 4.35
Korea, South 1.25 1.50 1.25 1.25 1.25 1.50 1.50 1.50 1.50 1.50 1.50
India 6.25 6.25 6.75 6.50 6.50 6.25 6.00 6.25 6.00 6.00 6.00
Indonesia 4.75 4.25 4.75 4.75 4.25 4.25 4.25 4.25 4.25 4.25 4.25
Malaysia 3.00 3.00 3.00 3.00 3.00 3.00 3.25 3.25 3.25 3.25 3.25
Thailand 1.50 1.50 1.50 1.50 1.50 1.50 1.50 1.50 1.50 1.50 1.50
Source: Collected by NESDB
All commercial banks and Specialized Financial Institutions (SFIs) kept their 12-month deposit and
lending rates at the same level as in the previous quarter. In the first quarter of 2018, 12-month fixed
deposit rates and MLR interest rates remained unchanged at 0.93 percent and 6.20 percent, respectively.
However, real deposit rates and real MLR rates increased to 0.75 percent and 5.57 percent, respectively,
as headline inflation rate declined.
In April 2018, deposit and lending rates of all commercial banks and specialized financial institutions
maintained the same rates as at the end of the fourth quarter of 2017.

Macroeconomic Strategy and Planning Office
NESDB Economic Outlook
May 21, 2018 12
Private loan
(excluding accrued
interest) of Depository
Corporations
continuously
accelerated over the
last 2 quarters, in line
with strengthened
economic recovery .
Thai baht against US
dollar appreciated,
supported by current
account surplus and
foreign inflows in the
bond market.
Private loan (excluding accrued interest) of Depository Corporations continuously accelerated over
the last 2 quarters, in line with economic recovery that became more pronounced. At the end of the
first quarter of 2018, private loan of depository corporations grew by 4.6 percent, accelerated from a 4.1
and 3.3 percent growth in the fourth and third quarter of 2017, consecutively. The loan expansion was
supported by the growth of both business and household loan. In particular, the expansion of business
loan, in line with the economic performance, was mainly supported by the growth of loan for wholesale &
retail and real estate activities. Likewise, household loan accelerated both from banks and Specialized
Financial Institutions (SFIs), due to the pick up in housing loan and hire purchase loan in line with the
improvement of housing demands and domestic car market. Meanwhile, non-performing loan to total
outstanding loan ratio was at 2.93 percent, similar to those in the fourth quarter of 2017.
2 The BOT began using the new NEER and REER in March 2014. The base year would also be changed to 2012, that the indicators could capture the true
structure of trade in line with changing international dynamics.
Thai Baht against US Dollar appreciated. During the first quarter of 2018, an average exchange rate
was at 31.54 baht per US dollar, appreciating 4.3 percent from the previous quarter. During the first
month of the quarter, Thai baht persistently appreciated, as foreign investors increasingly bought assets in
emerging countries because global economic sentiment showed a positive prospect. In addition, the US
dollar was under the depreciation pressures due to risk factors such as rising long term US fiscal deficit
and rising US - China trade tension. However, in February, Thai baht shortly depreciated amid global
stock market correction which was driven by the anticipation of a faster Fed’s interest rate hike in 2018.
However, this depreciation pressure subsided since the correction ended, and Thai baht’s persistently
appreciated until the end of the quarter. In the first quarter of 2018, average Thai baht against trading
partners (NEER)2 appreciated by 1.7 percent from the previous quarter. This was in line with a 0.5-percent
appreciation of the real effective exchange rate (REER).
In April, Thai baht has returned to be depreciated since the US government bond yield increased. The
higher US bond yield was the result of (i) an anticipation that US inflation would reach its 2 percent target
in 2018, and (ii) an increasing oil price. This caused foreign investors to speculate for a rising US dollar,
and sell assets in emerging markets, including short-term bond in Thai bond market. As a result, on
average, Thai baht in April was at 31.31 baht per US dollar, depreciating 0.2 percent from March average.
0
2
4
6
8
10
12
0
2
4
6
8
10
12
14 15 16 17 18
% YOY% YOY
private loan (excluding accrued interest)
Business loan (RHS)
Household loan (RHS)
Private loan (excluding accrued interest) of Depository Corporations accelerated from the previous quarter
Source: Bank of Thailand
-8
-4
0
4
8
12
16
20
0
1
2
3
4
5
6
7
8
9
10
14 15 16 17 18
% YOY% YOY
Business loan
wholesale & retail (RHS)
real estate activities (RHS)
Business loan expanded from the acceleration of loan for wholesale & retail and real estate activities
Source: Bank of Thailand
-6
-4
-2
0
2
4
6
8
10
12
14
16
18
20
0
2
4
6
8
10
12
14 15 16 17 18
% YOY% YOY
Household loan hire purchase (RHS)
housing (RHS)
Household loan expanded from the acceleration of hire purchase loan and housing loan
Source: Bank of Thailand

Macroeconomic Strategy and Planning Office
NESDB Economic Outlook
May 21, 2018 13
SET index became
more volatile due to
investors’ concerns
over the Fed’s
tightening and
uncertainty in trade
tension between the
US and China.
SET index during the first quarter fluctuated around a downward trend. One of key factors was the
fear of investors over tightening monetary policy stance of the Fed. Set Index had risen significantly since
the end of last year before the market correction in the end of January as global investors concerned that
the Fed would tighten the financial conditions faster. This factor curbed market sentiment to be risk-off
and created downward volatility pressures to the global stock markets. Furthermore, the international
trade policies between the US and China was another main influence for the tightening market conditions
in this quarter, resulting in downward pressure on SET index from the February onward. In addition, SET
index was also affected by a domestic event at the end of quarter as the market overreacted on the
announcement of key commercial banks on waiving transfer fee, causing selling-off sentiment on banking
stocks. As a result, SET index closed at 1,776.26 at the end of first quarter, increased from 1,753.71 at the
end of last year.
The Thai government bond yields at the end of quarter changed gradually from the end of last
year. The yields of government short-term bonds had declined since the beginning of the year before it
began to pick up at the end of quarter, whereas the long term yields fluctuated within the narrow range.
The yield of 10-year Thai government bond had declined since the beginning of the quarter before rising
in response to the acceleration of the US 10-year Treasury rates at the end of January and moved within
the narrow range until the end of quarter. At the end of first quarter of 2018, the 10-year Thai government
bond yield was at 2.56 percent per annum which rose from 2.54 percent per annum at the end of last year,
while the 6-month and 2-year ones were at 1.22 and 1.34 percent per annum, a decline from 1.37 and 1.47
percent per annum at the end of last year.
The government
short-term bond
yields picked up at the
end of quarter
following the long-
term yields.
Thai Baht appreciated against US dollar from the previous quarter
Source : CEIC, Bank of Thailand
31.0
32.0
33.0
34.0
35.0
36.090
95
100
105
110
115
120
Jan 16 Apr 16 Jul 16 Oct 16 Jan 17 Apr 17 Jul 17 Oct 17 Jan 18
Index
NEER REER Baht/US dollar (RHS)
Baht US dollar
SET Index became more volatile and the 10Y government bond yield picked up
Source: CEIC
2.2
2.3
2.4
2.5
2.6
2.7
2.8
1,600
1,650
1,700
1,750
1,800
1,850
Dec-17 Jan-18 Feb-18 Mar-18 Apr-18
bps
SET Index 10Y Thai Govt. Bond Yield (RHS)
1.0
1.2
1.4
1.6
1.8
2.0
2.2
2.4
2.6
2.8
1M 6M 2 4 6 8 10
%
Q4/17
Q1/18
Apr-18
The government bond yield curve shifted upward, at the end of April
Source: ThaiBMA

Macroeconomic Strategy and Planning Office
NESDB Economic Outlook
May 21, 2018 14
In April, financial conditions remained tightened by the US-China trade tension and the fear that the Fed
would raise interest rates faster than market expectation. In the beginning of the month, SET index as well
as other Emerging Markets’ indices plunged down as the market responded to the Chinese government
announcement as she might employ tariff measures in retaliation to the US trade policies; meanwhile
short-term government bond yields began to pick up. However, SET index recovered afterward as the
market sentiment was easing and was supported by a favorable domestic condition. Nonetheless, the
market became tightening in the third week of the month due to an escalating crude oil price in
association with acerbations of the US 10-year Treasury yield and US dollar appreciation. SET index
declined afterward as well as a shift in the Thai government bond yield curve. At the end of the month,
SET index closed at 1,780.11 slightly increased from 1,776.26 at the end of last month; whereas the 6
month, 2 Year and 10 Year government bond yields were at 1.36, 1.51 and 2.62 percent per annum,
respectively.
Capital and financial account recorded a net outflow of 0.7 billion US dollars in the first quarter of
2018, relative to a net outflow of 6.0 billion US dollars in the previous quarter. The declined outflow was
caused by (i) decreasing of Thai direct investment, and (ii) inflows from a net sell position of foreign
bond.
The outflows of
capital and financial
account declined due
to a net sell of foreign
bond and a decrease
in Thai direct
investment.
Capital Flow
(Billion USD) 2016 2017 2018
Year Q1 Q2 Q3 Q4 Year Q1 Q2 Q3 Q4 Q1 Jan Feb Mar - Direct Investment -10.3 -1.2 -1.8 -7.4 0.1 -11.6 -1.0 -4.0 -2.0 -4.6 0.3 0.3 -0.1 0.1
Thai investor -13.4 -4.7 -3.2 -3.3 -2.3 -20.7 -3.5 -5.5 -4.0 -7.7 -2.2 -0.5 -0.7 -1.0 Foreign investor 3.1 3.5 1.3 -4.1 2.3 9.1 2.5 1.5 2.1 3.0 2.5 0.8 0.6 1.0
- Portfolio Investments -2.8 1.7 0.9 2.8 -8.2 -2.5 -1.4 -1.3 2.5 -2.3 -1.7 2.0 -2.7 -1.0 Thai investor -4.3 -0.8 1.3 -2.8 -2.0 -12.0 -3.7 -2.7 -2.9 -2.6 -0.5 -0.5 0.3 -0.3 Foreign investor 1.5 2.6 -0.4 5.5 -6.2 9.5 2.3 1.5 5.4 0.3 -1.2 2.5 -3.0 -0.7
Others -7.9 -0.4 -0.4 -3.1 -4.0 -4.1 -4.6 -0.5 0.0 0.9 0.7 2.7 -0.5 -1.6 Capital and financial ac-count -21.0 0.2 -1.3 -7.8 -12.1 -18.2 -7.0 -5.7 0.5 -6.0 -0.7 5.0 -3.3 -2.4
Source: BOT
Current account registered a surplus of 17.1 billion US dollars (539.7 billion baht). This was a result of
a trade surplus of 6.6 billion US dollars and a surplus in services, and primary and secondary income of
10.5 billion US dollars.
Current account
registered a surplus,
an increase from the
same period last year.
Source: Bank of Thailand
-10,000
-5,000
0
5,000
10,000
15,000
20,000
Q1/13 Q1/14 Q1/15 Q1/16 Q1/17 Q1/18
Mil. USD
Current account balance, Trade balance,Net services, primary income and secondary income
Current account balance
Trade balance
Net services, primary income and secondary income
International reserve at the end of March 2018 stood at 215.6 billion US dollars (excluding net forward
position of 35.8 billion US dollars), which was equivalent to 3.5 times of short-term foreign debt, or to an
import value of 11.7 months (given the average of import value in the first quarter of 2018).
International reserve
at the end of March
2018 stood at 215.6
billion US dollars.

Macroeconomic Strategy and Planning Office
NESDB Economic Outlook
May 21, 2018 15
3 In April 2018, headline inflation was 1.1 percent, Core inflation was 0.6 percent. In the first 4 months of 2018, headline inflation was 0.7 percent, Core
inflation was 0.6 percent. 4 In April 2018, Producer Price Index (PPI) decreased by 0.8 percent. In the first 4 months of 2018, PPI decreased by 1.3 percent.
Headline inflation
was average at 0.6
percent. Both Non-
Food and Beverage
price index and Food-
and-Beverage price
index decelerated.
Producer Price Index
(PPI) decreased by
1.5 percent. The price
of agriculture
products and
manufactured
products decreased,
while price of mining
products increased.
Producer Price Index (PPI): In the first quarter of 2018, Producer Price Index decreased by 1.5 percent. The price of agriculture products decreased by 6.1 percent as price of crops, live-stocks, and fish &
fishery products decreased. The price of manufactured products decreased by 0.9 percent due to a
decrease in price of rubber & plastic products. Meanwhile, the price of mining products increased by
2.5 percent due to an increase in the price of lignite, petroleum, & natural gas.4
Headline inflation: In the first quarter of 2018, headline inflation was average at 0.6 percent. Food-and-
Beverage price index slightly increased by 0.04 percent, decelerating from 0.2 percent in the previous
quarter due to a slowdown in prices of fish and aquatic animals and a decline in prices of meats, eggs &
dairy products, and vegetables & fruits. Non-Food and Beverage price index increased by 1.0 percent,
decelerating from 1.3 percent in the previous quarter as the domestic retail fuel price slowed down, which
made energy index increased by 3.0 percent, decelerating from 5.2 percent in the previous quarter. Core
inflation stood at 0.6 percent.3
Source: Bank of Thailand
60,000
110,000
160,000
210,000
260,000
Q1/13 Q1/14 Q1/15 Q1/16 Q1/17 Q1/18
Mil. USD International Reserves
International Reserves
-6
-4
-2
0
2
4
Q1/13 Q1/14 Q1/15 Q1/16 Q1/17 Q1/18
%YoYHeadline inflation in the first quarter of 2018
was at 0.6 percent
Headline Inflation
Core Inflation
PPI
Source: Ministry of Commerce

Macroeconomic Strategy and Planning Office
NESDB Economic Outlook
May 21, 2018 16
2. Crude Oil price in Q1 of 2018
The crude oil price in the global market increased. In the first quarter of 2018, the average crude oil
price in the 4 major markets (Dubai, Oman, Brent, and WTI) stood at 64.15 USD per barrel, increased
from the same period last year by 20.5 percent, and from the previous quarter by 9.0 percent.
The major factors contributed to the increase of global crude oil price included (i) the improvement of the
major economies that induced demand for crude oil, especially in the US, Europe, and China, (ii) the
improvement of cooperation among OPEC members and Non-OPEC oil exporter for production cuts, and
(iii) the persistent geopolitical tensions which could affect production, including the conflict between
Saudi Arabia & Iran, and the US sanction against Iran.
The crude oil price
increased due to the
improvement of the
global economy, high
compliance of OPEC
and Non-OPEC
output cut, and the
geopolitical tensions
among the Middle
East countries. Crude oil price
Year USD per Barrel (%YoY)
OMAN DUBAI BRENT WTI Average OMAN DUBAI BRENT WTI Average 2014 Year 96.82 96.48 99.49 92.71 96.38 -8.2 -8.5 -8.6 -5.6 -7.7
2015 Year 51.17 50.87 53.61 48.84 51.12 -47.1 -47.3 -46.1 -47.3 -47.0
2016
Q1 31.20 31.30 35.09 32.46 32.51 -40.9 -39.8 -36.2 -33.3 -37.6
Q2 43.30 43.03 46.96 45.61 44.72 -29.4 -29.6 -26.1 -21.3 -26.7
Q3 43.66 43.10 46.99 45.01 44.69 -12.5 -13.3 -8.4 -3.4 -9.5
Q4 48.68 48.19 51.12 49.32 49.32 19.6 18.6 14.6 17.0 17.4
Year 41.71 41.40 45.04 43.10 42.81 -18.5 -18.6 -16.0 -11.7 -16.3
2017
Q1 53.44 53.00 54.60 51.90 53.24 71.3 69.4 55.6 59.9 63.7
Q2 49.80 49.55 50.92 48.31 49.65 15.0 15.1 8.4 5.9 11.0
Q3 50.55 50.34 52.22 48.20 50.33 15.8 16.8 11.1 7.1 12.6
Q4 59.20 59.18 61.55 55.42 58.84 21.6 22.8 20.4 12.4 19.3
Year 53.24 53.02 54.82 50.96 53.01 27.7 28.1 21.7 18.2 23.8
Q1 63.82 63.52 66.90 62.35 64.15 19.4 19.8 22.5 20.1 20.5
2018 Jan. 66.18 66.05 69.09 63.70 66.25 22.9 23.2 24.6 21.1 23.0
Feb. 62.18 61.92 64.90 60.59 62.40 13.1 14.0 16.0 13.4 14.1
Mar. 63.11 62.60 66.72 62.77 63.80 22.5 22.6 27.3 26.4 24.7
Apr. 68.15 68.12 71.72 66.25 68.56 29.9 31.1 33.7 30.0 31.2 Source: Thaioil Plc and EPPO.

Macroeconomic Strategy and Planning Office
NESDB Economic Outlook
May 21, 2018 17
The world economy in the first quarter of 2018 has continually strengthened, led by the accelerated
growth of the US economy, a solid expansion of the Eurozone, and the above-target growth of the
Chinese economy. Strong growths in the major economies have brought about higher world trade volume
and commodity prices, and encouraged a more pronounced recovery in developing economies.
The continual pace of expansion has been pivotal in closing the output gap and attaining above-potential
growth of advanced economies, particularly the US and Canada. In the meantime, developing economies
has notably shifted towards potential growth which consequently narrowed their output gap.
Consequently, unemployment rates declined in many major economies and inflationary pressures have
become clearer in various countries, particularly in Northern America where inflation rates have moved
around the monetary target and thus allowed central banks to continue their monetary policy
normalization. As a result, the US Federal Reserve has increased the Fed Fund rate, together with
continued normalizing the balance sheet, while the Bank of Canada raised its policy rate for the third time
since July 2017. Likewise, the European Central Bank (ECB) has started to reduce its monthly asset
purchase by 30 billion euro since January 2018 as well as in some Asian central banks, such as Bank
Negara Malaysia which decided to hike the policy rate for the first time since 2016. In contrast, the Bank
of Japan (BoJ) and other central banks in developing economies still maintain accommodative monetary
policy in order to support a broader-based economic recovery and drive inflation to achieve the target.
Nevertheless, strong expansion of US economy, amid rapid pace of monetary normalization both in the
rates hike and balance sheet reduction, combined with investors’ long-term inflationary pressure
expectation, and the rising trend of the US’ bond supply raised the 10-year US bond yields up to 2.8
percent in the first quarter of 2018, compared with 2.4 percent in the fourth quarter of 2017, and marked
as the highest rate in 4 years. This was significantly in line with an uptrend of 10-year bond yields in other
major countries.
The US economy expanded at the highest pace in 11 quarters, driven by private investment, government consumption expenditures and net exports. Meanwhile, unemployment rate stood at the lowest rate in 17 years.
3. The World Economy in Q1 of 2018
The world economy in
the first quarter of
2018 has strengthened,
led by the accelerated
growth in the US and
favorable growth in
Eurozone and China.
The Eurozone economy slowed down from the previous quarter, following a decline in industrial production and domestic consumption.
Bond Yield (percent per annum)
Country 3-5 Year 10 Year
Q1/17 Q4/17 Q1/18 Q1/17 Q4/17 Q1/18 USA 1.5 1.8 2.3 2.4 2.4 2.8 Italy 0.2 0.0 0.1 2.2 1.9 2.0 UK 0.5 0.8 1.0 1.3 1.3 1.5 Germany -0.6 -0.5 -0.2 0.4 0.4 0.6 Source: CEIC
Meanwhile, the US’ latest trade protection measures became more provoking. On March 8th 2018, the US
officially raised tariffs on steel and aluminum imports by 25 and 10 percent, respectively, and on March
22nd, imposed additional tariffs planned on more than 1,300 import products from China (approximately
50 billion US dollars in value). In response, on April 2nd, China announced trade retaliation measure
planned against the US by increasing tariffs on 128 import products from the US (approximately 3 billion
US dollars in value) and later on April 4th announced additional tariffs on 106 products, worth a total of
around 50 billion US dollars.
The US economy expanded at highest pace in 11 quarters (Advance estimate). In the first quarter of
2018, the US economy expanded by 2.9 percent, accelerating from 2.6 percent in the previous quarter.
The growth was mainly driven by private investment, government consumption expenditures and net
exports. Private investment expanded by 5.8 percent, accelerating from 3.6 percent in the fourth quarter of
2017, marked as the highest rate in 11 quarters. This continual economic growth has led the
unemployment rate to remain at the lowest rate in 17 years at 4.1 percent. Meanwhile, inflationary
pressure has become more pronounced. The PCE inflation rate increased by 1.8 percent in the first
quarter, from 1.7 percent in the preceding quarter, and is close to the Fed’s target of 2 percent. A more
pronounced economic strengthening and inflationary pressure caused the FOMC to hike its policy rate in
the meeting on March 20 – 21th 2018 by 0.25 percent to the range of 1.50 - 1.75 percent, the first policy
rate hike in 2018 and was the sixth rate hike since December 2015.
The Eurozone economy expanded by 2.5 percent, down from 2.8 percent in the previous quarter,
following some slowdowns in Germany, France, and Italy economies. This was due to a deceleration in
industrial production growth and domestic consumption. Nonetheless, consumer confidence in April 2018

Macroeconomic Strategy and Planning Office
NESDB Economic Outlook
May 21, 2018 18
continued to expand for the sixth consecutive months, reflecting better political conditions in the region.
Additionally, a continued economic growth has caused the unemployment rate in the first quarter of 2018
to decline to 8.5 percent, the lowest level in nine years. Nevertheless, the inflation rate decelerated from
1.4 percent in the previous quarter to 1.2 percent and remained below the monetary policy target. As a
result, in the April 26th 2018 meeting, the ECB decided to keep its policy rate unchanged and maintained
asset purchases of 30 billion euro per month until the end of September 2018.
The Japanese economy expanded by 0.9 percent, slowing from 1.8 percent in the previous quarter as a
result of slower growths of private and government consumption. Residential private investment
contracted continually from the previous quarter, while non-residential private investment grew at a
slower pace. Nevertheless, manufacturing production still showed a positive sign as shown by the
purchasing managers index (PMI) reaching the highest level in 16 quarters, in line with the continued
exports of goods and services as well as overall private investment. Public investment accelerated from the
fiscal year 2017 - 2020 fiscal stimulus packages and the preparation for 2020 Tokyo Olympics. The
unemployment rate was at 24-year low, whereas wages slowly rose. The inflation rate rose to 1.3 percent but
is still below the 2-percent policy target. Therefore, on April 27th, the Bank of Japan (BOJ) continued to
maintain its policy rate and kept the level of quantitative easing unchanged.
The Chinese economy grew by 6.8 percent, similar growth as in the previous quarter. The main drivers were
the strong expansions in manufacturing and service sectors, particularly in advanced technology manufacturing
and information technology services. Exports accelerated and marked as the highest expansion in 20 quarters.
In addition, domestic consumption grew robustly while investment continued to slow down as a result of the
economic rebalancing policies and also measures for mitigating financial risks and corporate debt levels. The
Yuan appreciated by 4.2 percent from higher foreign exchange reserves. In the first quarter of 2018, foreign
reserve increased to 3,142.8 billion US dollars from 3,139.9 billion US dollars at the end of the previous
quarter. Meanwhile, on March 22nd the People's Bank of China recently increased the rate on 7-day reverse
repurchase agreements to 2.55 percent from 2.50 percent.
NIEs economies mostly accelerated from the previous quarter. The Singapore and Hong Kong economies
expanded by 4.3 and 4.7 percent, accelerating from 3.6 and 3.4 percent in the previous quarter,
respectively. South Korea maintained its growth rate at 2.8 percent, while Taiwan decelerated to 3.0
percent from 3.3 percent in the previous quarter. ASEAN economies mostly continued to improve driven
by the persistent growth in exports as well as domestic consumption which corresponded to the
improvement of the labor market. Inflation was higher mainly from rising food prices. In the first quarter
of 2018, Vietnam, Indonesia, Malaysia, and the Philippines grew by 7.4, 5.1, 5.4, and 6.8 percent,
respectively, compared with 7.7, 5.2, 5.9, and 6.5 percent in the previous quarter consecutively.
The Japanese
economic expansion
was at 0.9 percent,
slowing from the
previous quarter due
to the slower
consumption, both
private and
government .
The Chinese economy
expanded by 6.8
percent, mainly
contributed by the
growth in
manufacturing,
services, and exports.
However, investment
decelerated.
GDP growth, Inflation and Export growth in several key economies
Export (%YoY) GDP (%YoY) Inflation (%YoY)
2016 2017 2018 2016 2017 2018 2016 2018 2017 Year Year Q4 Q1 Year Year Q4 Q1 Year Year Q4 Q1
USA -3.6 6.5 7.8 7.7 1.5 2.3 2.6 2.9 1.3 2.1 2.1 2.2 EU 0.0 9.4 15.9 18.2 1.8 2.5 2.8 2.5 0.2 1.5 1.4 1.2 Japan 3.2 8.3 9.6 10.1 1.0 1.7 1.8 0.9 -0.1 0.5 0.6 1.3 China -7.7 7.9 9.6 14.1 6.7 6.9 6.8 6.8 2.0 1.6 1.8 2.2 Hong Kong -0.6 7.6 6.1 8.8 2.1 3.8 3.4 4.7 2.4 1.5 1.6 2.5 India -1.3 12.9 13.5 4.6 7.9 6.3 7.2 - 5.0 3.3 4.6 4.6 Indonesia -3.4 16.3 13.4 8.8 5.0 5.1 5.2 5.1 3.5 3.8 3.5 3.3 South Korea -5.9 15.8 8.4 10.1 2.9 3.1 2.8 2.8 1.0 1.9 1.5 1.3 Malaysia -4.6 14.7 16.8 19.8 4.2 5.9 5.9 5.4 2.1 3.8 3.6 1.8 Philippines -2.4 19.7 13.4 -6.0 6.9 6.7 6.5 6.8 1.8 3.2 3.3 4.4 Singapore -5.5 10.4 11.2 9.7 2.2 3.6 3.6 4.3 -0.5 0.6 0.5 0.2 Taiwan -1.8 13.2 10.4 10.6 1.4 2.8 3.3 3.0 1.4 0.6 0.4 1.6 Thailand 0.1 9.7 11.6 9.9 3.3 3.9 4.0 4.8 0.2 0.7 0.9 0.6 Vietnam 9.0 21.4 24.8 25.1 6.2 6.8 7.7 7.4 2.7 3.5 2.7 2.8 Source: CEIC, Collected by NESDB
NIEs economies
mostly accelerated
due to strengthened
exports and
manufacturing.
The ASEAN
economies grew
favorably, driven by
the momentum in
exports and domestic
consumption.

Macroeconomic Strategy and Planning Office
NESDB Economic Outlook
May 21, 2018 19
The world economy in 2018 is expected to grow by 4.1 percent, supported by the acceleration of the US
economic growth, which is entering the longest economic expansion with additional supports from the US
tax reform under the Tax Cuts and Jobs Act, as well as the favorable growth momentum of the Eurozone
and the expected an above-official target expansion of the Chinese economy. Meanwhile, the Japanese
economy tends to experience a gradual slowdown. The sustained improvement of the major economies,
coupled with the rise in the world trade volume and global commodity prices, could encourage a more
broad-based and pronounced recovery and strengthened growth in developing and emerging economies.
Particularly, the growth in India, Brazil, and the Middle East are expected to accelerate to 7.2, 2.3, and 3.4
percent, compared with 6.3, 1.0, and 2.6 percent in 2017, respectively.
As a result of the sustained economic expansion of major economies, the output gap of some advanced
countries has been closed and become positive in this year, as seen in the US, Canada and the UK. At the
same time, output gaps in other major economies have started to narrow down. Under these conditions,
the US, Canada, Eurozone, the UK, and other key developing economies are expected to continue
pursuing their monetary policy normalization specifically in the latter half of this year, which will
consequently lead to an upward trend of the global interest rate cycle. Short term interest rates will likely
increase in line with policy rate hikes in major economies, while long term interest rates tend to advance
following a positive global growth and inflation expectation, together with balance sheet reduction, and
quantitative tapering in major economies, which will eventually increase global bond supply.
The US economy is projected to expand by 2.7 percent, accelerated from 2.3 percent in 2017, and higher
than the previous projection due to a higher than expected growth in the first quarter. Growth is expected
to be driven by an improvement in household consumption expenditures, in line with strengthened labor
market where the full employment level is reached with unemployment rate staying below 4.0 percent. In
addition, private investment is expected to increase, owing to an improvement in business confidence,
coupled with additional stimulus from the tax reform and job creation policies. Furthermore, government
consumption expenditures and public investment, especially in infrastructure, will also become key
growth drivers. This above-potential growth tends to persistently put an upward pressure on wage and, in
turn, on inflation rate, of which would continue to increase to the 2 percent target. Thus, in the baseline
scenario, it is expected that the FOMC will hike its policy rate twice during the remaining of this year.
There will also be a possibility of an additional policy rate hike in the case of a significant increase in
inflationary pressure than expected. The Eurozone economy is estimated to grow by 2.4 percent, compared
to a 2.5 percent growth in 2017. Key supporting factors are a continuous strong expansion of domestic demand,
following an improvement in market sentiment after the more ease political conditions in several countries, and
a 9-year lowest unemployment rate of 8.5 percent in the first quarter of 2018 . Nonetheless, it is important to
closely monitor political situations in key countries, especially Italy's political conditions and the Brexit’s
negotiation. Under the baseline scenario, due to a gradual increase in inflationary pressure, it is thus expected
that the ECB will maintain asset purchases of 30 billion euro per month until the end of September 2018 with
the possibility of asset purchases reduction in the second half of the year. The Japanese economy is
estimated to expand by 1.2 percent, decelerated from 1.7 percent in 2017 following a slower pace in
private consumption. However, the manufacturing sector will continue to grow and further support the
overall economy following better export performance which has been benefited from Yen depreciation
trend. In addition, public investment is also likely to keep their momentum from additional budget
disbursement, continued fiscal stimulation, and 2020 Tokyo Olympics preparation. On the other hand, a
delay in wage-rise will cause inflationary pressure to increase only slowly. As a result, the BOJ is likely to
keep its expansionary stance, including by holding its key policy rate and maintaining asset purchases at
80 trillion Yen. The Chinese economy is anticipated to grow by 6.7 percent in 2018, decelerating slowly
from 6.9 percent in 2017. The growth will continue to be driven by strong private consumption and
exports, which is in line with the improvement of manufacturing production, and the expansion in exports.
Meanwhile, infrastructure investments are expected to accelerate as a result of the Belt and Road
Initiatives, while investments in service and manufacturing sectors are expected to be stimulated under the
Made in China 2025 campaign. However, there still remains downside risks in the financial sector, as
credit to non-financial corporations remains high at 162.5 percent to GDP while new real estate loan tends
to pick up. Likewise, the result of further implementation on structural reform, coupled with restoring
4. The World Economic Outlook for 2018

Macroeconomic Strategy and Planning Office
NESDB Economic Outlook
May 21, 2018 20
financial stability measures, tighter restrictions on real estate speculation will eventually soften the pace
of economic expansion. The NIEs is anticipated to expand despite a gradual slower pace as growth
returns to be normalized. Taiwan and Singapore economies are expected to grow by 2.7 and 3.2 percent,
compared with 2.8 and 3.6 in 2017, respectively. South Korea economy is likely to keep its pace at 3.1
percent, while Hong Kong is estimated to grow by 4.0 percent in 2018 accelerated from 3.8 percent in the
previous quarter. Likewise, the ASEAN Economies are forecasted to grow continuously due to strong
exports as well as improving domestic demand driven by strengthened labor market conditions and
stronger growth of public investment, supporting the expansion of manufacturing sector. It is expected
that Indonesia, Philippines, and Vietnam will grow by 5.4, 6.8, and 6.8 percent in 2018, compared with
the growth of 5.1, 6.7, and 6.8 percent in 2017, respectively. On the other hand, Malaysia is likely to
decelerate to 5.7 percent growth from 5.9 percent due to interest rate hike and the Ringgit appreciation.
Nevertheless, the economic expansion, the capital flows, and the exchange rates between major currencies
over the rest of the year are still subjected to volatility with respect to several risk factors, which need to
be closely monitored and assessed. Key risk factors include: (1) the US’s trade protection policy and the
trade retaliation by major US’s trade partners, the outturn of NAFTA renegotiation, and other US’s additional
economic measures which might halt global economic and trade volume growth, (2) faster-than-expected
increase of interest rates in key economies and in the global financial markets, resulted by (i) the
monetary policy normalization in key countries, both in terms of interest rates increase and balance sheet
reduction being faster than economic fundamentals to which economic growth might be susceptible,
especially under the rising trend of oil prices and trade protection which will result in higher inflationary
pressures than assumed in the base case, and (ii) the change in investors’ long-term inflation outlook, the
upward trend of global bond quantity resulted from US fiscal deficit, and key countries’ balance sheet
reduction which may cause faster-than-expected increase in long-term interest rates, (3) geopolitical
uncertainties, particularly in the Middle East, which may affect confidence and overall economic recovery
as well as the volatility of oil prices as they may rise faster than anticipated, and (4) the political
conditions in major countries, including the US midterm election, the Italian government formation which
might affect consumer and business sentiments, and the UK’s political conditions which may result in
uncertainties surrounding Brexit negotiations.

Macroeconomic Strategy and Planning Office
NESDB Economic Outlook
May 21, 2018 21
In the remainder of the year 2018, the Thai economy tends to continually improve given the current
accelerating pace of global economic recovery and the increased world price of commodities, government
measures to support further economic expansion through government and private consumption expenditure,
improvements in investment conditions of both private and public sectors, and the revitalized household
income condition. Nevertheless, the year-on-year growth pace in the rest of the year 2018 tends to slow down,
due to the higher base in the latter half of 2017 while global commodity price and interest rate have continued
their upward trend, whereas world economy and global financial system would experience uncertain situations
from the trade protection policies imposed by major advanced economies against their trade partners, changes
in monetary stances globally, and foreign policies from those world leading countries.
5. Thai Economic Outlook for 2018
Supporting factors for the economic growth:
1) Exports are likely to maintain its favorable growth pace as the global economic expansion gains
its momentum, which could support the expansion of manufacturing production and thus
further support the overall economic growth. The improvement of global recovery strengthened
exports expansion from 7.3 percent in the first half of 2017 to 12.0 percent in the second half of 2017.
Correspondingly, the manufacturing production accelerated from a growth of 1.5 percent in the first
half of 2017 to 3.8 percent in the second half, while its growth contribution evidently increased from
0.4 percent in the first half to 1.0 percent in the latter half. Likewise, the export value in US dollar
term continued to grow at 9.9 percent in the first quarter of 2018 while manufacturing sector further
grew by 3.7 percent which contributed to the overall economic growth by 1.0 percent. For the
remainder of the year, the global economic expansion is expected to gain its momentum and under
the base case scenario the global economy is expected to grow by 4.1 percent, the same pace seen in
2017. These will thereby continue to drive growths of exports and manufacturing production further,
and eventually the overall economic expansion.
2) Government spending and public investment are likely to expand favorably and with a faster
growth in the remaining of the year. In terms of government spending, the budget disbursement
rate under the 2018 annual budget over the first half of fiscal year was 50.7 percent, and it is
anticipated to be disbursed at least 92.0 percent over the fiscal year (excluding FY2018
supplementary budget). Whereas, the disbursement of FY2018 supplementary budget, worth 150
billion baht, is expected to start disbursement in the second quarter of 2018. The government
spending would then speed up and eventually boost up the overall growth. Similarly, the growth
momentum from public investment is likely to accelerate, aligned with the capital budget under the
annual budget framework and the state-owned enterprise budget framework, worth 636,465 million
baht and 776,930 million baht, with a high annual growth of 17.5 and 33.7 percent, respectively.
Meanwhile, the disbursement rate of capital budget for the remainder of the year tends to pick up as
shown by the total amount of issuing a purchase order (PO), of which worth 348,576.9 million baht
and accounting for 54.8 percent of the annual budget, increased from 44.0 percent of the same period
last year. In addition, the disbursement of large-scale infrastructure projects sped up after more
projects has started construction, particularly the projects under the 2016 Transportation Action Plan,
worth 1,383,939.0 million baht, of which 14 underlying projects have been under construction,
accounted for 705,510.0 million baht. For the projects under the 2017 Transportation Action Plan,
there have been 4 projects under construction, worth 18,514.1 million baht. Furthermore, the projects
under the Eastern Economic Corridor (EEC) Development Plan have shown further progress and
thereby are expected to start to disburse from some large-scale projects in the latter half of 2018, and
be able to speed up their associated disbursement rates in the coming year of 2019 onwards.

Macroeconomic Strategy and Planning Office
NESDB Economic Outlook
May 21, 2018 22
3) Private investment tends to recover more pronouncedly. This was evidenced by a growth of 2.5 percent
in the latter half of 2017 and 3.1 percent in the first quarter of 2018, increasing from 0.9 percent in the first
half of 2017. Rising in private investment was in line with the increase in capacity utilization in
manufacturing sector with the average of 67.1 percent during 2017, improving from 65.3 percent in 2016.
Therefore, private investment in 2018 is expected to improve noticeably with the following factors: (i) The
fast increase of capacity utilization in manufacturing sector which will encourage production sector to invest
in machinery and equipment (accounted for 80 percent of private investment) as to expand production
capacity. This upward trend has been observed in the first quarter of 2018, where the capacity utilization
average rate reached 72.4 percent, marked as the highest first quarter capacity utilization rate in 5 years,
compared with 69.6 and 67.4 percent in the first quarter and the fourth quarter of 2017, respectively. In
details, from the total of 21 industries, capacity utilization rate in 7 industries were higher than 80 percent
and 6 industries were in the range of 60 – 80 percent. (ii) A significant rise of the total value of Board of
Investment (BOI)’s investment promotion. This is reflected by a growth of 22.4 percent (642 billion baht) in
2017, and a 228.5 percent (203.6 billion baht) in the first quarter of 2018 (This is divided into an investment
of 165.4 billion bath for Eastern Economic Corridor (EEC), increased from 12.3 billion baht in the same
period last year. (iii) The progress of public infrastructure investment projects and the improving overall
economic condition which are expected to support better construction investment, reflected by an increase
in a number of construction permitted areas in the first quarter (a growth of 6.3 percent in Bangkok, 5.0
percent in municipal area, and 39.2 percent in sub-district administrative area). (iv) The improvement of
business sentiment in accordance with favorable growth in exports and domestic demand as observed by the
Business Sentiment Index (BSI) in the first quarter which stood at 52.4, highest level in 24 quarter.
Major public infrastructure investment
projects have been increasingly progressed and
the disbursements for these projects are expected
to rise accordingly. As of 8th May 2018, there are
18 projects under the 2016 Transport Action Plan
(20 projects in total) and the 2017 Transport
Action Plan (36 projects in total) that have been
proceeded into a construction phase. The total
budget of 724,015 million baht is divided into:
(i) 14 projects in the 2016 Transport Action Plan
with the total investment value of 705,501
million baht, and (ii) 4 projects in the 2017
Transport Action Plan with the total investment
value of 18,514 million baht. It is expected that
more projects would be proceeded into a
construction phase in the near future.
For the projects under the Eastern Economic
Corridor Plan (EEC), as of 27th March 2018, the
cabinet has already approved the construction of
high speed train linking three major airports.
Meanwhile, the Aircraft Maintenance, Repair
and Overhaul (MRO) and the 3rd phase of Laem
Chabang (LCB) Port projects are expected to be
submitted to the EEC committees for
consideration during the second half of this year.
In addition, the Eastern Economic Corridor Act
B.E. 2561 has been announced in the government
gazette and could be enforced since 10th May
2018, which will be able to significantly hasten
all important projects under the EEC Plan.
Progresses of Key Public Infrastructure Investment Projects
Bidding Process131,004 MB.
Under Construction/Preparing for Construction 705,501 MB.
Under PPP process/ feasibility study &
negotiation process291,359 MB.
Cabinet ApprovalProcess
224,1544 MB.
PPP Committee’s Consideration Process
1.High-speed train route: Bangkok – Hua Hin (94,673 MB.)
2.High-speed train route: Bangkok – Rayong (152,528 MB.)
3.Mass Rapid Transit Light Red and Dark Red Line (44,158 MB.)
Feasibility Study and Negotiation Process
High-speed train route: Bangkok – Phitsanulok(Thai – Japan Cooperation)
Project Budget(MB.)
Progress(Percent)
Dual-track rail: Jira – Khon Kaen 23,803 68.17Coastal port (Port A)at Laem Chabang Port 1,864 100.00
Container depotat Laem Chabang: Stage I 2,031 98.80
Intercity motorway:Pattaya – Map Ta Phut 17,819 73.89
Intercity Motorway:Bang Pa In – Nakhon Ratchasima 76,600 34.71
Mass Rapid Transit Orange Line: Thailand Cultural Centre – Minburi 109,541 8.62
Meter gauge (1 meter) rail development Prachuab – Chumporn 17,250 0.05
Meter gauge (1 meter) rail development Mab Kabao – Jira 29,499 0.43
Meter gauge (1 meter) rail development Lopburi – Pak Nam Pho 24,722 0.25
Train route: Bangkok – NakhonRatchasima (Thai – China Cooperation) 179,413 Construction
started Intercity Motorway: Bang Yai –Kanchanaburi 49,120 8.30
Mass Rapid Transit Pink Line:Khae Rai – Minburi 56,691 Site entry
Mass Rapid Transit Yellow Line:Lat Phrao – Samrong 54,644 Site entry
Suvarnabhumi airport: Stage II 62,503 78.66
Progress of 20 public investment projects under Transport Action Plan Year 2016, (1,383,938.89 MB. budget*)
Mass Rapid Transit Purple Line: Tao Pun – Rat Burana
131,004 MB.
1. The High-Speed Rail Linked 3 Airport Project (Don Muang – Suvarnabhumi –U-Tapao) (224,544 MB.)
Source: Ministry of Transport (8 May 2018)
*initially 1,796,385 MB,1 Dec 2015 cabinet decisions
6. Truck rest area on the main routes
1. Ferry Serviceacross Gulf of Thailand
5. Double Track Rail Network: Huahin – Prachuap Khiri Khan
7. Baggage System Upgrade at Suvarnabhumi airport
9-17 Dual Track Rail Stage 2: Paknampho – Den Chai/ Jira– Ubonratchathani/ Khonkaen – Nong Khai/ Chumporn – Surat Thani/ Surat Thani– Songkha/ Den Chai –Chiang Mai/ Den Chai – Chiang Rai– Chiang Khong/ Ban Pai –Nakorn Phanom/ Hat Yai – Padang Beza
22. Intercity Motorway (Nakorn Phatom –Cha Am)
In Service737.53 MB.
Construction18,514.08 MB.
Pre-Bidding34,507.61 MB.
Cabinet ApprovalProcess
472,000.79 MB.
PPP Committee’s Consideration
Process 251,544.82 MB.
Feasibility Study
And Delays 41,511.24 MB.
Progress of 36 public investment projects under Transport Action Plan Year 2017, (895,757.55 MB. budget*)
2. Common Ticket System
4. Regional airport development
3. Intermodal Facility – Chiang Khong
8. Express Way Rama 3 – Dao Kanong – Outer Ring (West)
21. Public Bus Procurement and Stations
18. Mass Rapid Transit Light Red Line Extension: Taling Chan – Sirirajand Taling Chan – Salaya
19. Commuter Train Dark Red Line: Rangsit –Thammasat University Rangsit
20. Northern Route N2 and E-W Corridor
23. Motorway Hat Yat – Thailand– Malaysia Border
24. Expressway Kratu – Patong
25. Cross-border Logistics Centerat Nakorn Phanom
26. Airport Rail Link Extension
27. Mass Rapid Transit Orange Line:Taling Chan – Thailand Cultural Centre
28. Aircraft Maintenance, Repair, and Overhaul Facility Development at U-Tapao Airport
29. Lam Cha Bang port: Phase 3Proposal Completed
(Procurement)46,881.92 MB.
30-31. Regional Logistics Center in regional cities and Border provinces
32. Mass Transit in Phuket
33. Development of Ferry Terminal, Golf of Thailand
34. Mass Rapid Transit Blue Line: Bang kae – Sai 4
35 - 36. Mass Rapid Transit: Dark GreenSamutprakarn – Bang Pu and Dark Green Kukot – Lumluka
* 13 Dec 2016 cabinet decisionsSource: Ministry of Transport (8 May 2018)
Construction Plan of 5 major infrastructure investment projects under EEC
Current status Project
Agen
cy
CY2018 CY2019 CY2020 CY2021 CY2022 CY2023 CY2024
Q1:20
18Q2
:2018
Q3:20
18Q4
:2018
Q1:20
19Q2
:2019
Q3:20
19Q4
:2019
Q1:20
20Q2
:2020
Q3:20
20Q4
:2020
Q1:20
21Q2
:2021
Q3:20
21Q4
:2021
Q1:20
22Q2
:2022
Q3:20
22Q4
:2022
Q1:20
23Q2
:2023
Q3:20
23Q4
:2023
Q1:20
24Q2
:2024
Q3:20
24Q4
:2024
PPP Project under EEC project list
Drafting TOR 1. The High-Speed Rail Linked 3 Airport Project (HSR) State Railway of Thailand
Making report 2. U-Tapao Rayong-Pattaya International Airport (UTP) Port Authority of Thailand
Preparing for EEC committee
3. Maintenance Repair and Overhaul for U-TapaoAirport (MRO) Thai Airways
Making report 4. Map Ta Phut Industrial Port Phase III (MTP) Industrial Estate Authority of Thailand
Preparing for EEC committee 5. Laem Chabang Port Phase III (LCB) Port Authority of
Thailand
Source: Ministry of Transport (8 May 2018)

Macroeconomic Strategy and Planning Office
NESDB Economic Outlook
May 21, 2018 23
4) The improvement of household income conditions, particularly those in agricultural sector which is
supported by the following factors: (i) The expansion of key agricultural products which is expected to
grow favorably following the proper level of water in major dams being highest level in 11 year, which
will thereby contribute to continual expansion of agricultural output. (ii) An improvement of major
agricultural product prices. In the first quarter of 2018, major agricultural products prices notably
improved in particular jasmine rice and cassava prices which being higher than the first quarter’s 10-year
average as well as a pleasant cane price. Meanwhile, oil palm and rubber prices are expected to gradually
trend higher following an increasing crude oil prices and rising global demand which will eventually
reduce stock level in major economies. The improvement in agricultural production and product prices
was in line with the increase of employment in agricultural sector (31.2 percent of total employment) of
6.0 percent, compared with the contraction of 1.2 and 2.0 percent in the third and fourth quarter of 2017,
respectively. Likewise, household income in other sectors tends to be more pronounced following the
persistent expansion of exports, manufacturing production, and tourism.
In the first quarter of 2018, the
average capacity utilization rate stood at
72.4 percent, the highest record over the
last 5 years, improving from 67.4
percent and 69.6 percent in the previous
quarter and in the same quarter of last
year. Out of 21 key industries, there
were 13 industries which the capacity
utilization rates were higher than 60
percent. Among these 13 industries,
there were (i) 7 industries which have
more than 80 percent capacity
utilization rate, (ii) 1 industry which
have 70-79 percent capacity utilization
rate, and (iii) 5 industries which have 60
-69 percent capacity utilization rate.
This is expected to be key factor to
encourage the business sector to further
increase their capacity utilization and thus essentially supported private investment in 2018, particularly investment in
machinery and equipment, which accounted for 80.35 percent of private investment.
Capacity Utilization Rate
In the first quarter of 2018, the important crops prices have been increased, especially (jasmine) paddy and cassava prices, which registered high levels and were higher than their respective 10-year-average of the first-quarter levels. At the same time, the price of sugarcane, as already hit the 10-year highest first-quarter level last year (2017), declined from the high base in the first-quarter of this year and, somewhat, remained close to the 10-year-average of the first-quarter level. These recoveries in major crops prices, therefore, played an important role in improving farmers income.
On the other hand, rubber and oil palm
prices were correlated with the movements of
crude oil price in the global market. Thus,
owing to a reduction in oil price in 2011, the
recoveries of rubber and oil palm prices have
been sluggish. However, the combinations of
(i) an increase in crude oil price through the
year 2018, (ii) a higher usage demand for rubber and oil palm, following the recovery in world economic
conditions, and (iii) the government measures to alleviate agricultural prices, it is expected that the rubber and
oil palm prices as well as farmers income would be rebounded in the near future.
The movements of the important crop prices in 2018
%YOY Weight 2011
2016 2017 2018 Year Year Q1 Q2 Q3 Q4 Q1
1. More than 80 percent capacity utilization rate, of which 7industries Sugar 2.77 40.5 43.8 115.1 23.7 9.6 26.8 134.1 Plastics and synthetics rubber 4.24 92.4 96.8 91.2 95.8 98.4 101.9 98.5 Vehicles 15.88 82.3 83.4 82.5 76.6 88.6 86.1 93.4 Refined petroleum products 3.10 81.4 84.3 77.8 80.2 89.7 89.6 88.1 Processing and preserving of meat 2.25 79.5 83.0 79.9 78.4 86.0 87.8 86.3 Motorcycles 1.53 70.7 72.6 77.2 71.6 68.9 72.5 80.2 Computers and peripheral equipment 3.24 57.8 77.9 75.3 73.2 78.5 84.4 80.1
2. 70 - 79 percent capacity utilization rate, of which 1 industry Electronic components and boards 7.52 73.0 75.0 73.2 75.5 75.7 75.7 76.2
3. 60 - 69 percent capacity utilization, of which 5 industries Rubber tyres and tubes 1.61 66.8 68.6 68.5 67.2 69.2 69.5 69.1 Wearing apparel 2.88 68.0 66.7 67.5 66.2 65.5 67.7 67.2 Other general-purpose machinery 2.12 62.5 56.6 66.8 67.3 45.3 46.9 66.8 Plastic products 2.90 63.2 62.7 63.3 61.4 63.6 62.5 63.8 Domestic appliances 1.96 61.9 60.0 59.7 58.2 61.4 60.7 63.7
Source: Office of Industrial Economics
11,68412,708
14,13012,212
14,99815,87814,220
13,08010,814
9,269
14,313
0.0
5,000.0
10,000.0
15,000.0
20,000.0
Q1-5
1
Q1/5
2
Q1-5
3
Q1/5
4
Q1-5
5
Q1/5
6
Q1-5
7
Q1/5
8
Q1-5
9
Q1/6
0
Q1-6
1
(Jasmine) Paddy Prices(Baht Ton)
1.721.17
1.86
2.90
1.96 2.08 2.20 2.201.81 1.51
2.16
0.00.51.01.52.02.53.03.5
Q1-5
1
Q1/5
2
Q1-5
3
Q1/5
4
Q1-5
5
Q1/5
6
Q1-5
7
Q1/5
8
Q1-5
9
Q1/6
0
Q1-6
1
Cassava Prices(Baht Kg.)
594.3707.3
876.0932.7 955.3 918.0 868.7 850.3757.7
975.6
771.6
0.0200.0400.0600.0800.0
1,000.01,200.0
Q1-5
1
Q1/5
2
Q1-5
3
Q1/5
4
Q1-5
5
Q1/5
6
Q1-5
7
Q1/5
8
Q1-5
9
Q1/6
0
Q1-6
1
Sugarcane Prices
(Baht Ton)
10-year-average of first-quarter levels: 13,028 10-year-average of first-quarter levels: 2.00
10-year-average of first-quarter levels : 837.110-year-average of first-quarter price levels
%YoY
2017/Q4 2018/Q1
(Jasmine) Paddy
13,028 Baht Ton
29.2 54.4
Cassava 2..00 Baht/Kg. 30.8 43.8
71.8643.58
93.95
151.64
102.5681.02
62.5746.06
36.54
74.87
42.97
0.020.040.060.080.0100.0120.0140.0
0.0
50.0
100.0
150.0
200.0
Q1-5
1
Q1/5
2
Q1-5
3
Q1/5
4
Q1-5
5
Q1/5
6
Q1-5
7
Q1/5
8
Q1-5
9
Q1/6
0
Q1-6
1
Rubber Prices(Baht Kg.) USD Barrel
10-year-average of first-quarter levels : 73.4
5.34
3.37 3.64
6.94
5.35
3.36
5.14 5.07 4.86 5.38
3.10
0.020.040.060.080.0100.0120.0140.0
0.0
2.0
4.0
6.0
8.0
Q1-5
1
Q1/5
2
Q1-5
3
Q1/5
4
Q1-5
5
Q1/5
6
Q1-5
7
Q1/5
8
Q1-5
9
Q1/6
0
Q1-6
1
Oil Palm Prices(Baht Kg.)
10-year-average of first-quarter levels: 4.7USD Barrel
Drought

Macroeconomic Strategy and Planning Office
NESDB Economic Outlook
May 21, 2018 24
1) The high base in key production sectors which will curb the year-on-year expansion in the
latter half of the year: Although the quarter-on-quarter economic growth rate in the remaining of the
year tends to maintain its favorable pace as global and domestic economic recovery increasingly gain
momentum, the extent of year-on-year growth is likely to soften due to the high growth base in the
second half of the year 2017, particularly in agricultural and non-agricultural sectors such as
manufacturing and hotel and restaurant sectors.
2) Commodity prices, inflation, and interest rates in the world markets tend to increase. A
continual economic recovery in several major economies, in particular the US economy, which has
narrowed down output gaps and built a room for more rapid pace of monetary policy normalization
both in terms of policy rate increase and balance sheet normalization which will eventually raise
short and long term interest rates in the global market. Simultaneously, oil and primary commodity
prices in the world market will increase as a result of improving global demand conditions. Although
interest rates and commodity prices are expected to grow slowly and will not impede the Thai
economy in 2018, it will likely to hinder household purchasing power and some of those businesses
who are sensitive to inflation rate and commodity prices in the next term. In addition, the risk that the
increasing interest rate could be faster than fundamental economic condition still needs to be
monitored. Particularly, under the condition of faster-than-expect increase of oil prices brought about
by geopolitical tensions, and trade protection that could raise the costs of production and inflation in
the US to higher than the base line scenario.
3) Fluctuation of the global economy, the capital movement, and the exchange rates between
major currencies which might be caused by: (i) the US’s trade policy directions including the trade
protection and the trade retaliations between the US and China, the outturn of NAFTA renegotiation,
and additional US trade measures on its trade partners; (ii) the volatilities of international capital
movement, security prices, and major currencies’ exchange rate which come from changing
investors’ expectation during the global economic transition including an expectation on economic
growth, monetary policy direction, inflation rate, fiscal stance, and bond supply in major countries;
(iii) the political conditions in major countries, including the US midterm election, the Italian
government formation, and the UK’s political conditions which may result in uncertainties
surrounding Brexit negotiations; and (iv) the geopolitical uncertainties, particularly in the Middle
East, which may dampen confidence and overall economic recovery as well as affect oil prices to
become more volatile and may rise faster than anticipation.
Limitation and Risk Factors:

Macroeconomic Strategy and Planning Office
NESDB Economic Outlook
May 21, 2018 25
The US Trade Representative (USTR) announced tariff measure on Chinese imports worth 46.4 billion US dollars; the list covered 1,333
products (8-digit harmonize code: HS code) of 19 group (2-digit HS code), on April, 3 2018. This measure would levy 25 percent tariff,
approximately worth 5 billion US dollars or a 9.2-percent of import value from China, due to violation of property right under the Section 301 of the
Trade Act of 1947.
According to preliminary analysis on the weights of import values, the product groups (2-digit HS code) that would be affected the most by the
tariff measure are (i) machinery and parts (HS 84); (ii) electric appliances and parts (HS 85); and (iii) optical, photographic and cinematographic
instrument and parts (HS 90), respectively,
This measure, when it becomes effective, would impact on international trade and economic growth in many countries. The implication on Thai
economy can be mixed: on the one hand, Thailand is part on the Chinese trade supply chain which could be affected directly by the measure; on the
other, Thai economy could benefit in the scenarios that (i) the US would import these products directly from Thailand, or (ii) China would
reallocate their investment to other countries for seeking new export gateway to the US in which Thailand could benefit from Chinese FDI.
To analyze the impact on Thailand, the International Input-Output table is employed with 2 assumptions. First, China could diversify only their
exports of 27.8 billion dollar (60 percent of 46.4 billion USD total export values to the US) to new markets; whereas it ceases production for the rest
of export of 18.5 billion US dollar. Secondly, the US imports from other countries instead in the short-term, assuming that the US domestic
production could not fill the production gap. The findings, suggests that the US tariff measures on China could result in shrinking GDP of both the
US and China by 0.237 and 0.032 percent, respectively; while Thai economy would gain net benefit of a 0.057-percent GDP growth, as
demonstrated in Table 2. In detail, the implication of tariff measures help boost the growth of industries that produce final products including
machinery and equipment, electronic equipment, and motor vehicle and parts; whereas industries which mainly engage in intermediate product
production including chemical products, rubber and rubber products and agricultural products, would encounter negative impacts.
The finding results suggest that the negative impact of this measure tends to limit within the US and China. However, the implications to other
countries including Thailand are still depended on: (i) the impact of tariff on the US-China trade dynamic; (ii) strategy to diversify the market of
China; (iii) import substitute production capacity of the US; and (v) market expectation on the global economy and trade volumes.
Implication of the US-China tariff measure to Thailand
Table: 1 List of key products the US announced tariffs against imports from China (2017 Data) HS Code
(2 digits) Product Description
Import Value (in million USD)
Share of Imports from China
Share of US Imports
84 Machinery and mechanical appliances 20,041 3.96 0.86 85 Electrical machinery and equipment 14,460 2.86 0.62 90 Optical and precision equipment 6,445 1.27 0.28
87 Vehicles other than railway or tramway rolling-stock 1,983 0.39 0.08
76 Aluminum and articles thereof 1,280 0.25 0.05 30 Pharmaceutical products 606 0.12 0.03
Other products 1,596 0.32 0.07 Total (19 products in 2-digit HS Code) 46,411 9.18 1.98 Source: Global Trade Atlas
Table 2 Impacts of US-CH Trade War on Global Value-Added Impacts US CH TH
1. China does not import products to US accounted 46,411 Million USD) as US measure -0.244 -0.007 0.012
1.1 China distributes products US listed to other trade partners (60% of 46,411 Million USD) -0.236 - 0.045
1.2 China reduces productions (40% of 46,411 Million USD) -0.008 -0.007 -0.033
2. US imports products from other trade partners 0.007 -0.313 0.045
Total impact -0.237 -0.320 0.057 Source: Estimated by NESDB
0% 20% 40% 60% 80% 100%
Total exportsMotors vehicle and parts
Machinery and equipmentsElectric appliances
Electronic equipmentsMetal and Steel products
Chemical productsRubber and rubber products
Agricuture products
Share of export values from Thailand to China
Intermediate products Final Products

Macroeconomic Strategy and Planning Office
NESDB Economic Outlook
May 21, 2018 26
1) The world economy and the world trade volumes in 2018 are expected to grow by 4.1 and 4.3
percent, respectively, remained unchanged from the assumption in the previous forecast. The
growth is led by the accelerating US economic expansion, with supports from fiscal stimulus
packages under the Tax Cuts and Jobs Act. The growth of China are expected to be at the same pace
as last year while the growth of Eurozone and Japan are remaining favorable albeit slightly slow
down. Key major and emerging market economies, especially Australia, India, Russia, Brazil, and
Middle Eastern countries, tend to accelerate further following the improvement of world trade
volumes and increases in prices of primary commodities especially crude oil prices in the world
market.
2) The average value of Thai baht in 2018 is expected to be in the range of 31.0 - 32.0 baht per US
dollar, revised downward from the range of 31.5 - 32.5 baht per US dollar in the previous
projection assumption. This is in line with the strong-than-expect Thai baht value in the first quarter
of 2018, which was at 31.54 baht per US dollar, appreciated by 4.3 percent from the end of 2017 and
by 10.2 percent from the same period last year. The Thai baht is expected to fluctuate around this
level throughout the year of 2018. The Baht depreciation pressures would be attributed by the Fed
rate hikes, reduction of its balance sheet, and rising Treasury yields. On the other hand, the ongoing
surplus of Thai current account, favorably domestic economic conditions and expectation on the BOT
raising interest rates will provide an appreciation pressure on Thai baht against the US dollar.
3) The average Dubai crude oil price in 2018 is expected to be in the range of 60.0 - 70.0 US dollar
per barrel, a gradual rise from 53.0 US dollar per barrel in 2017. It is revised upward from the
previous forecast of 55.0 - 65.0 US dollar per barrel. Supporting factors are (i) increasing oil demand
as a result of a more pronounced recovery of the key major economies including the US, the EU,
China, and India; (ii) an extension of oil production reduction between OPEC and non-OPEC
countries possibly until the end of 2019; and (iii) the persistent geopolitical tensions in oil production
countries which could affect production including the withdrawal of the US from the Iran Nuclear
deal (Iran is the sixth largest oil exporter) and the deepening economic and political crisis in
Venezuela (the 12th largest oil exporter). However, the accelerating oil price rise could be mitigated
by an expansion of oil production of non-OPEC countries especially from the US and Canadian shale
oil production, and appreciation of the USD due to the Fed rate hikes.
4) The export and import price in US dollar term are expected to increase by 3.5 - 4.5 and 5.5 - 6.5
percent, respectively, accelerated from a 3.6-percent and 5.5-percent growth in 2017, respectively.
The export and import price assumptions are adjusted upward from the previous projection
assumption of 1.5 - 2.5 and 2.5 - 3.5 percent respectively due to higher-than-expect accelerating
export and import prices in the first quarter this year of 4.7 and 6.6 percent respectively, and an
upward revision of crude oil price assumption.
5) Tourism revenues from foreign tourists in 2018 are expected to reach 2.23 trillion baht,
increasing by 14.6 percent from 1.95 trillion baht in 2017. It is an upward revision from the
previous projection assumption of 2.18 trillion baht due to the fact that the number of tourist in the
Key assumptions for 2018 economic projection:
World Economic Projection
Actual Data Projection 2016 2017 Feb 19, 2018 May 21, 2018
World Economic Growth (%)1 3.5 4.1 4.1 4.1 USA 1.5 2.3 2.5 2.7 EU 1.8 2.5 2.4 2.4 Japan 0.9 1.7 1.2 1.2 China 6.7 6.9 6.7 6.7
World Trade Volume (%) 2.6 4.5 4.3 4.3 Exchange Rate (Baht/US dollar) 35.29 33.93 31.5 - 32.5 31.0 - 32.0 Dubai Crude Oil (US Dollar/Barrel) 41.4 53.0 55.0 – 65.0 60.0 - 70.0 Export Price (US Dollar) (%) -0.4 3.6 1.5 – 2.5 3.5 - 4.5 Import Price (US Dollar) (%) -2.7 5.5 2.5 – 3.5 5.5 - 6.5 Income from Tourism (Trillion baht) 1.72 1.95 2.18 2.23 Source: NESDB 1 World economic calculated by trade weight of key economic partners in 2017 (15 economics)

Macroeconomic Strategy and Planning Office
NESDB Economic Outlook
May 21, 2018 27
first quarter of 2018 was 10.6 million persons, an increase by 15.4. The contribution to the higher-than-
expect growths came from increases in numbers of tourists from China (29.9 percent of total foreign
tourists), ASEAN (21.1 percent), East Asia, excluding China and ASEAN (12.6 percent), and South
Asia (4.3 percent) by 30.2, 8.0, 12.9 and 16.1 percent respectively. The tourist figures tend to expand
well during the remaining of the year. Key supporting factors are: (i) favorable economic conditions
of key tourist origins including China, North America, Russia, and Middle East, which will support a
continuous positive growth of short haul and long-distance tourists; (ii) Thailand is regarded as one
of the world’s important tourism destination; (iii) ongoing government’s measures to stimulate the
tourism sector and stable domestic political condition; (iv) the expansion of international travel routes
including the expansion of Thai Airway connectivity with the secondary destinations in China and
short haul international flights by low cost airlines; and (v) capacity improvements of major airports
to accommodate increasing number of aircrafts and tourists.
6) The budget disbursement assumptions are as follows: (i) the FY2018 annual budget disbursement
rate of 92.0 percent of overall budget: the current and capital budget are assumed to be disbursed at
98.6 and 67.7 percent respectively; (ii) the FY2018 supplementary budget disbursement rate of 64.8
percent; (iii) the state-owned enterprise’s capital budget disbursement of 77.0 percent; (iv) the carry-over
budget disbursement of 68.2 percent; (v) the off-budget loans including water resources management
and road transport system projects of approximately 2,944.3 million baht, reduced from 9,398.4
million baht in FY2017, and (vi) the annual budget disbursement in the first quarter of FY2019
(October - December 2018) of 30.0 percent of overall budget.

Macroeconomic Strategy and Planning Office
NESDB Economic Outlook
May 21, 2018 28
The Thai economy in 2018 is projected to expand in the range of 4.2 - 4.7 percent (with the
midpoint of 4.5 percent), improving from 3.9 percent and 3.3 percent in 2017 and 2016,
respectively. Headline inflation is estimated to be in the range of 0.7 - 1.7 percent and the current
account balance is forecasted to register a surplus of 8.4 percent of GDP.
In the press release dated on May 21st, 2018, NESDB forecasts that the Thai economy will expand
within the range of 4.2 - 4.7 percent (with the midpoint of 4.5 percent). This was an upward revision
compared with the forecast of 3.6 - 4.6 percent (with the midpoint of 4.1 percent) in the press
release dated on February 19th, 2018. The range was adjusted to be narrower and there were also
some revisions on the growth components to be consistent with actual data of the first quarter of
2018 and the key assumptions revision. Major revisions are as follows:
1) In the press release dated on February 19th, 2018, NESDB announced that the Thai economy in 2018
will expand within the range of 3.6 - 4.6 percent, with 4.1 percent midpoint. However, the growth
reached 4.8 percent in the first quarter of 2018, accelerating from 4.0 percent in the previous quarter.
The growth was the highest during the past 20 quarters and higher than the forecasted midpoint, all in
line with the expansion of goods and services exports, private consumption expenditure, as well as the
stronger-than-expect growth of agricultural and manufacturing sectors. Under the base case it is
expected that the economic growth for the rest of 2018 tends to continue expanding. Therefore, the
lower bound of the predicted range became less likely while the midpoint of estimation increased from
4.1 percent to 4.5 percent which became closer to the upper bound of the 3.6 - 4.6 percent interval of the
forecast released on February 19th 2018.
2) The adjustment in the growth components corresponded to actual data on the first quarter of 2018 and
the main assumption revision. These include: (i) the upward revision of export and import prices to be
in line with the upward revision of oil prices assumption, together with revision of key trading partners’
economic growth which thus resulted in an upward revision of the export values, (ii) the adjusted
assumption on the structure of the FY2018 supplementary budget corresponding a significant higher
proportion of transfer expenditure relative to current expenditure compared with the previous
assumption which thus partly became key supporting reason for upwardly revising the forecast of
private consumption expenditure while downwardly revising the forecast of government consumption
expenditure, (iii) the downward revision on government’s capital budget disbursement rate and state-
owned enterprises’ capital expenditure budget framework to be consistent with the latest data in the first
quarter, as well as the increased anticipation on capacity utilization rate in the manufacturing sector; all
of which contribute to the downward adjustment to the forecast of public investment in contrast to the
increased forecast of private investment, and (iv) the upward adjustment on the number of and receipts
from foreign tourists; to be 39.0 million people (10.2 percent growth) with 2.23 trillion baht in term of
receipts (14.6 percent growth) in this forecast, up from 38.0 million people (7.4 percent growth) with
2.18 trillion baht in term of receipts (11.6 percent growth) in the previous forecast; all of which
contribute to the upward adjustment to the forecast of export of services.
Economic Projection for 2018:
Key components of the economic growth :
1) Consumption: Private consumption expenditure is estimated to grow by 3.7 percent, accelerated
from 2017, and is revised upwardly from 3.2 percent in the previous projection. The upward revision
is owing to the higher-than-expected growth of 3.6 percent in the first quarter and the positive
outlook for the rest of the year, supporting by: (i) the improvement of overall income conditions with
a more broad-based expansion, especially the increase in key agricultural product prices, as well as
the continued income growth in exports, manufacturing, tourism and related services sectors, (ii) the
implementation of the government measures to assist low income people and local economies under
the FY2018 supplementary budget, and (iii) the end of five-year continuous single-ownership
condition of first-car buyer scheme and the new cars launches. Government consumption
expenditure is anticipated to expand by 3.0 percent, a faster pace than 0.5 percent of 2017. It is a
slight downward revision from 3.2 percent as in the preceding projection, following the assumption
adjustments on share of current expenditures and transfers within the FY 2018 supplementary budget
framework.

Macroeconomic Strategy and Planning Office
NESDB Economic Outlook
May 21, 2018 29
2) Investment: gross fixed capital formation is projected to expand by 4.7 percent, accelerating from 0.9
percent in 2017. Public investment is expected to grow by 8.6 percent, recovering from a contraction of
1.2 percent in 2017. The growth is mainly supported by high growth of capital budget framework under
the annual budget and the state-owned enterprise’s capital budget of 17.5 and 33.7 percent, compared with
8 . 9 percent and a decrease of 2.1 percent in 2017, respectively. In addition, further progresses of key
infrastructure projects have become more apparent. However, there is a slight downward revision in the
growth of public investment from 10.0 percent in the previous projection. This is in line with the
downward adjustment of state-owned enterprises’ capital budget framework assumption complying with
the actual data as well as the expected decline of the capital expenditure disbursement rate assumption
under the annual budget framework from 71.7 percent to 66.7 percent which is to be corresponding with
the capital budget disbursement rate of 28.4 percent in the first half of FY2018. Nevertheless, it is expected
that the capital budget disbursement rate will speed up during the latter half of FY2018 indicated by the
purchasing order (PO) outstanding of 54.8 percent of total capital budget, higher than 44.0 percent of the
same period in the previous fiscal year. Private investment is forecasted to grow by 3.9 percent, stronger
than a 1.7 percent growth in 2017 and upwardly revised from 3.7 percent in the previous forecast. This
revision is in line with the increase in capacity utilization rate to 72.4 percent in the first quarter of 2018,
the highest first quarter capacity utilization rate in 5 years, together with high growth rates of the total
value of application for investment promotion under the Board of Investment (BOI) which were 22.4
percent in 2017 and 228.5 percent in the first quarter of 2018 (165.4 billion bath of which was for Eastern
Economic Corridor (EEC), an increase from 12.3 billion baht in the same period last year), the
improvement of business sentiment, and the progress of the government’s key infrastructure projects.
3) Export value of goods in US dollar term is expected to grow by 8.9 percent, compared to a 9.7 percent
growth in 2017, and revised positively from 6.8 percent in the previous projection in both export quantity
and export value. Export price and volume are projected to grow by 3.5 - 4.5 percent and 4.9 percent,
respectively, revised from 1.5 - 2.5 percent in prices and 4.8 percent in quantity, respectively. In addition,
the assumption of tourist receipts is also revised upwardly, from 2.18 trillion baht (an 11.6 percent growth)
in the previous projection, to 2.23 trillion baht (a 14.6 percent growth). This is in line with the high growth
in number of tourists during the first quarter and continued strong growth prospects over the rest of the
year (the figures in April 2018 showed that the number of foreign tourists increased by 9.4 percent).
Therefore, together with the preceding assumption adjustment, the export volume of goods and services is
projected to grow by 6.3 percent, compared with 6.0 percent in the previous estimation.
4) Import value of goods in US dollar term is anticipated to grow by 12.7 percent, compared to 14.4
percent in 2017, upwardly adjusted from a 9.5-percent growth in the previous forecast. The revision is
resulted from the improved estimates on import price from a growth range of 2.5 - 3.5 percent to a range of
5.5 - 6.5 percent growth in line with the upward revision of oil price assumption which would cause prices
of imported products to increase. Moreover, the quantity of imported goods was adjusted higher, from 6.5
percent in the previous projection to 6.7 percent, corresponding to the revision of private consumption and
investment growth projection. Combining with import of services, it is expected that the import volumes
of goods and services will grow by 6.7 percent, an increase from 6.5 percent in the previous forecast.
5) Trade balance is estimated to register a surplus of 27.0 billion US dollars, lower than a surplus of 31.9
billion US dollars in 2017, and a downward revision from the previous projection of 28.5 billion US
dollars. The smaller surplus is due to the upward revision of import value to grow faster than export value.
After combining with the upwardly revised projection on service account surplus, the current account is
projected to register a surplus of approximately 43.7 billion US dollars, equivalent to 8.4 percent of GDP –
an increase from 7.8 percent in the previous projection.
6) Economic stability will remain sound. The headline inflation rate in 2018 is expected to be in the range
of 0.7 - 1.7 percent, compared with 0.7 percent in 2017. This was a small downward adjustment from the
0.9 - 1.9 percent range in the previous forecast. The revision is due to (i) the lower-than-expected inflation
rate during the first quarter of 2018 at 0.6 percent, owing to lower-than-expected inflation rate on fresh
food (15.7 percent share) with a contraction of 1.0 percent in the first quarter, and (ii) the assumption on
the more appreciation trend of the Thai Baht. However, inflation rate is anticipated to pick up in the latter
half following the rise in energy prices (11.8 percent share) and the improved household spending.

Macroeconomic Strategy and Planning Office
NESDB Economic Outlook
May 21, 2018 30
The apparent recovery of the global economy and the government measures have been supporting factors
for the accelerated improvement of Thai economy in both 2017 and the first quarter of 2018, both in terms
of economic growth, fundamentals, and stability. In the remainder of the year 2018, the Thai economy
tends to continually improve given the current accelerating pace of global economic recovery and the
increased world price of commodities, government measures to support further economic expansion
through government and private consumption expenditure, improvements in investment conditions of
both private and public sectors, and the revitalized income condition. Nevertheless, the year-on-year
growth pace in the rest of the year 2018 tends to slow down, due to the higher base in the latter half of
2017 while global commodity price and interest rate have continued their upward trend, whereas world
economy and global financial system would experience uncertain situations from the trade protection
policies imposed by major advanced economies against their trade partners, changes in monetary stances
globally, and foreign policies from those world leading countries. Given these conditions, the
macroeconomic policy management should emphasize on:
1) Promoting key economic sectors, especially by: (i) fostering export sector to continually expand to
reach full potential, which thereafter enhance capacity utilization in particular in the manufacturing
sector to operate closer to full capacity. In turn, this could encourage new investments to expand
production capacity, which consequently support further economic expansion in the rest of the year
2018 and drive the potential growth in the longer run. Therefore, key measures should be bolstering
export to grow by not less than 8.0 percent, coupled with monitoring and preparing preemptive
measures against possible trade protectionism policies imposed by major advanced economies, both
in terms of reducing adverse impacts and gaining potential opportunities; (ii) promoting private
investment in both the approval of the project applied for BOI investment promotion, of which the
numbers of new projects applications significantly rose in 2017 and in the first quarter of 2018,
together with facilitating and encouraging new approved projects to be materialized, building up
confidence and ensuring public infrastructure projects to be implemented as planned, encouraging
investors to invest in target industries and areas, facilitating the investors to progress on their
projects, and ensuring the continuity of the government’s key policies, measures, and projects during
transition period after the general election; and (iii) promoting the expansion of service sectors,
especially tourism sector by ensuring safety in major tourist destinations, promoting tourism package
targeted both at high-income and long-distance tourists, reducing congestion in the airports and major
tourist attractions together with improving transportation system to connect secondary tourist
attractions to distribute tourist revenue to the local community.
2) Expediting the public investment to continue its expansion and reach the target in order to
strengthen investors’ confidence, maintain economic momentum, distribute economic activities, and,
ultimately, ensure sufficient investment expansion to achieve the long-term economic growth target
as stipulated in the 20-year National Strategy by following measures: (i) expediting procurement
processes and speeding up the capital budget disbursement for the rest of the year to improve the
efficacy of the government’s and state-owned enterprises’ capital budget disbursement to reach the
disbursement rate of no lower than 66.7 and 77.0 percent of total capital budget, respectively in order
to foster the overall economic expansion, especially in the latter half of 2018 where greater growth
bases are expected to be a constraint; (ii) driving key infrastructure projects including those under the
2016 - 2017 Transportation Action Plan and the Eastern Economic Corridor (EEC) Development
Plan to continuously enter the construction phase, coordinated with pushing measures to continually
attract investments in those Special Economic Zones (SEZs); and (iii) formulating master plan and
expediting transportation and logistics infrastructure projects as well as urban and special economic
zone areas development at both regional and provincial levels in order to bolster economic
expansions and economic activities distribution.
6. Economic Management for the year 2018

Macroeconomic Strategy and Planning Office
NESDB Economic Outlook
May 21, 2018 31
3) Supporting small farmers, low income groups, and strengthening the SMEs, local enterprises,
and local economies: (i) agricultural production and farm income, the emphases shall be on:
agricultural products whose prices slowly improve, preparing preemptive measures to accommodate
the rising supply following the adequate water and favorable weather conditions, coupled with
monitoring and preparing measures for mitigating possible impacts from climate changes, and
promoting exports of agricultural products to further expand from 2017 onward, as well as supporting
a large-scale farming and enhancing farmers’ income share in retail prices (ii) supporting the low
income and local economies as well as SMEs, through the ongoing social welfare smart card
project, together with more utilization of special loans provided to enhance financial inclusion for
small farmers, low income groups, local enterprises, and SMEs, particularly those vulnerable to the
uptrend in commodity prices, oil prices, and interest rates; and (iii) assisting and developing SMEs
affected by changes in business patterns, disruptive technologies, consumer preferences, and
demography, as well as foreign exchange volatility by encouraging SMEs to participate in
government’s measures on financial credit provisioning and currency appreciation impact mitigation
and SMEs promotion and development, particularly production, managerial, and marketing
development towards more advance technology, production, and service development to serve
market demand and establish linkages with larger-scale businesses and manufacturers, encourage
deployment of tax privileges and foreign workers in special economic areas, and support business
sector to participate in the dual education system.
4) Preparing adequate labor force, both in terms of quantity and quality, to support further
economic expansion and investment, especially for those industries with rising capacity utilization.
This should cover high-skilled and semi-skilled labors development. The measures should aim at:
(i) equipping fresh graduates who recently started, or are going to, enter job market with appropriate
skills and experiences; (ii) developing skillsets for adaptation to disruptive technology; (iii) promoting
the use of electronic media to assist in job searching; (iv) integrating the job market to facilitate a
platform bringing together job seekers, academic institutes, and employers which could minimize
transaction costs of job searching and matching; and (v) developing specialized labor training institutes
to prepare for future target industries development.

Macroeconomic Strategy and Planning Office
NESDB Economic Outlook
May 21, 2018 32
Projection for 2018 1
Actual Data Projection
2016 2017 Feb 19, 2018 May 21, 2018
GDP (at current prices: Bil. Bht) 14,533.5 15,452.9 16,469.8 16,457.3
GDP per capita (Baht per year) 215,454.6 228,412.0 242,806.3 242,622.1
GDP (at current prices: Bil. USD) 411.8 455.3 514.7 522.5
GDP per capita (USD per year) 6,103.9 6,730.2 7,587.7 7,702.3
GDP Growth (CVM, %) 3.3 3.9 3.6 - 4.6 4.2 - 4.7
Gross Fixed Capital Formation (CVM, %) 2.8 0.9 4.9 4.7
Private (CVM, %) 0.5 1.7 3.7 3.9
Public (CVM, %) 9.5 -1.2 10.0 8.6
Private Consumption (CVM, %) 3.0 3.2 3.2 3.7
Government Consumption (CVM, %) 2.2 0.5 3.2 3.0
Export volume of goods & services (%) 2.8 5.5 6.0 6.3
Export value of goods (Bil. USD) 214.3 235.1 251.1 256.0
Growth rate (%)2/ 0.1 9.7 6.8 8.9
Growth rate (Volume, %)2/ 0.5 5.9 4.8 4.9
Import volume of goods & services (%) -1.0 6.8 6.5 6.7
Import value of goods (Bil. USD) 177.7 203.2 222.5 229.1
Growth rate (%)2/ -5.1 14.4 9.5 12.7
Growth rate (Volume, %)2/ -2.5 8.4 6.5 6.7
Trade balance (Bil. USD) 36.5 31.9 28.5 27.0
Current account balance (Bil. USD) 48.2 48.1 40.0 43.7
Current account to GDP (%) 11.7 10.6 7.8 8.4
Inflation (%)
CPI 0.2 0.7 0.9 - 1.9 0.7 - 1.7
GDP Deflator 2.4 2.3 2.0 - 3.0 1.5 - 2.5
Source: Office of the National Economic and Social Development Board, 21st May 2018
Note: 1/ Data was calculated based on new National Accounts Office’s Series, published on www.nesdb.go.th
2/ Export and import base on the Bank of Thailand’s data.