nesa-india.orgnesa-india.org/upload/ijas_2nd issue-2014.pdf · International Journal on...
194
Volume 5, Issue 2, 2014 ISSN : 0976-450X NAAS Impact Factor 3.29
Transcript of nesa-india.orgnesa-india.org/upload/ijas_2nd issue-2014.pdf · International Journal on...
Volume 5, Issue 2, 2014 ISSN : 0976-450X
NAAS Impact Factor
3.29


ISSN NO. 0976-450XInternational Journal on Agricultural Sciences
Volume - V Issue : 2 2014
Members of the Board
Dr. Elsayed Elsayed Hafez City of Scientific Research and Technology Applications,
Arid Lands Cultivation Research Institute (ALCRI),PlantProtection and Biomolecular diagnosis Department,
New Borg El Arab City, 21934, Alexandria, Egypt.
Dr. Muhammad AsifAgricultural, Food and Nutritional Science
4-10 Agriculture/Forestry Centre, Univ. of AlbertaEdmonton, AB T6G 2P5
Dr. Gunjan Mukherjee, Ph.D.Scientist, Biotechnology, Agharkar Research Institute (ARI)
(Autonomous Research institute of Department of Science & Technology, Government of India), Pune, MS
Dr. Ratnabali Sengupta Department of Zoology
West Bengal State University , Barasat, WB India
Dr. Sudip Datta BanikSomatology Laboratory of
Human Ecology in Cinvestav-IPN, Merida, Mexico.
Dr. R. S. FougatProfessor & Head & Unit OfficerDepartment of Ag. Biotechnology
Anand Agricultural University, ANAND, Gujarat
Dr. William Cetzal-IxResearch fellow, Herbarium CICY,
Centro de Investigación Científica de Yucatán, México.
Dr. Peiman ZandiDepartment of Agronomy
Takestan Branch, Islamic Azad University, Iran
Dr. Xianping Li, Ph.D.Director of Potato Research CenterIndustrial Crops Research Institute,
Yunnan Academy of Agricultural Sciences KunmingYunnan Province, China
Dr. Lucindo José Quintans JúniorThe University of Iowa, Roy J. and Lucille A. Carver College of Medicine, Neurobiology of Pain Laboratory
375 Newton Road, Iowa City, IA, US
Dr. Xiuhua WuInner Mongolia Academy of Forestry, 288, Xinjian East Street,
Saihan District Hohhot, Inner Mongolia, P.R. China
Dr. Sonam TashiCollege of Natural Resources
Royal University of Bhutan, Lobesa, Punakha
Dr. M.O. AremuDepartment of Chemical Sciences,
Federal University Wukari, PMB 1020, Taraba State, Nigeria
Dr. D. Prantik ChakrabortyAE-248 Sector-I, Salt Lake, Kolkata
Dr. Smita MazumderDept of Economics, Surendranaah College for Women
M G Road, Kolkata-700009 WB India
Dr. Onosemuode ChristopherDept. of Environmental Science, College of Science
Federal University of Petroleum ResourcesEffurun-Delta State, Nigeria
Dr. Akbar MasoodHOD, Biochemistry
University of Kashmir, Sri Nagar, J&K
Dr. Valentin Bartra Abensur Profesor de Legislación Ambiental
Univesidad Nacional Mayor de San Marcos, Lima, Peru
Dr. A.K. GuptaDepartment of Biotechnology, Maharishi Markandeshwar University,
Mullana, Ambala-133207 (Haryana) India
Dr. Saikat Kumar BasuDepartment of Biological Sciences, University of Lethbridge
Lethbridge AB Canada T1K 3M4
Dr. R.A. BalikaiProfessor & Head, University of Agricultural Sciences, Dharwad
College of Agri. & Regional Agril. Research Station, Bijapur
Dr. K. Sivakumar Department of Soil Science and Agricultural Chemistry,
Faculty of Agriculture, Annamalai University, Annamalainagar-608002
Dr. Pallav Mukhopadhyay,Assistant Professor
Department of Journalism & Mass Communication,West Bengal State University, West Bengal, India
Dr. Onosemuode ChristopherDepartment of Environmental Science
College of Science, Federal University of Petroleum ResourcesEffurun-Delta State, Nigeria
Dr. I. Gerarh Umaru, PhDDepartment of Economics, Faculty of Social Sciences,
Nasarawa State University, Keffi-NigeriaP.O.Box 8414, Wuse-Abuja, Nigeria
ANNUAL SUBSCRIPTION INDIA, BANGLADESH & NEPAL OTHER COUNTRIES
Members Rs. 1000.00 Members $ 35.00
Individual Rs. 1200.00 Individual $ 65.00
Institutional Rs. 2200.00 Institutional $ 120.00
Incharge-Publication SectionGian C. [email protected]
Editor:Dr. A. Arunachalam
Principal ScientistIndian Council of Agricultural Research, New Delhi
Editor in Chief:Padma Bhushan Dr. S.Z. Qasim
206 Raj Tower-1Alaknanda Comm. Centre, New Delhi - 110 019

ISSN NO. 0976-450X

ISSN NO. 0976-450X
International Journal on Agricultural Sciences
1. EFFECT OF DIFFERENT ORGANIC SOURCES OF NUTRIENTS ON, 121-126PHYSICAL, CHEMICAL AND BIOLOGICAL PROPERTIES OF SOIL AFTER THE HARVEST OF GROUNDNUT (ARACHIS HYPOGAEA L.) Manjunath Bhanuvally, Rajanaika, MudalagiriyappaRamesha, Y.M. and Yogeeshappa, H.
2. EFFECT OF DIFFERENT ORGANIC SOURCES OF NUTRIENTS 127-132ON, GROWTH, YIELD, QUALITY AND ECONOMICS OF GROUNDNUT (Arachis hypogaea L.) Manjunath Bhanuvally, Rajanaika, Mudalagiriyappa, Ramesha, Y.M. and Yogeeshappa, H.
3. IMPACT OF INSECTICIDE (DELTAMETHRIN) ON BEHAVIOURAL 133-136CHANGES OF FRESH WATER LABEO ROHITAArunika Gumasta, Shashi Bala Shrivastava and H. Maini
4. QUALITY PARAMETERS, HARVEST INDEX OF HYBRID RICE 137-144(Oryza sativa L.) AND ECONOMICS OF VARIOUS TREATMENTS UNDER VARIOUS LEVELS OF ZINC SULPHATE AND INTEGRATED NUTRIENT MANAGEMENTAnil Kumar Singh, Alok Kumar Singh and Arvind Kumar
5. BIOCHEMICAL PARAMETERS IN RELATION TO POWDERY 145-149MILDEW RESISTANCE, IN BLACK GRAMChannaveeresh, T.S. and Shripad Kulkarni
6. FAMILY AND GENDER BIASES REGARDING PARTICIPATORY 151-158ACTIVITIES OF CHILDREN IN RURAL HARYANA
Jatesh Kathpalia, Rashmi Tyagi and Savita Vermani
7. SPATIAL VARIATION IN SOIL NUTRIENTS 159-165UNDER DIFFERENT LAND USE SYSTEMSH. Mohamed Saqeebulla, K. T. Gurumurthy and P. Veeranagappa
8. MEGA DIETARY FACTS FOR WEIGHT LOSS 167-172Bandana Singh and Pragati
9. SPIRULINA: A POTENT FOOD SOURCE 173-178Pragati, Bandana Singh, and Prem Shankar
10. FRUIT-ROT OF RAMPHAL (ANNONA RETICULATA L.) 179-184AND THEIR CONTROLAjeet Kumar Sharma and R.B. Sharma
11. EXTENSION & DEVELOPMENT ACTIVITIES FOR ENHANCING 185-195THE ADOPTION OF INTEGRATED PEST MANAGEMENT (IPM) TECHNOLOGIES AMONG CHILLI GROWERS IN KARNATAKAKumara N., Jnanesh A.C., Sachidananda S.N., Hanumanthe Gowda B. and Manoj R.
12. FLOWER MIDGE AND ASSOCIATED PARASITOID 197-201ON COTTON IN RAICHUR DISTRICTBheemanna, M., Geetha, S and Vanitha, B. K.
13. PESTICIDAL ACTIVITES OF COMMERCIAL 203-210BLEACHING POWDER IN PISCICULTUREMamata Kumari, Rashmi Prabha and Navin Kumar
CONTENTS
Volume - V Issue : 2 2014
ISSN NO. 0976-450X
14. EFFECT OF NEWER MOLECULE INSECTICIDES 211-214AGAINST SEED PROPERTIES OF CHICKPEAVidyashree, A. S., Thirumalaraju, G. T., Kavya M. K. and Prabhavathi, M.K
15. BIOLOGICAL CONTROL: AN ECOFRIENDLY APPROACH FOR 215-217ROOT-KNOT NEMATODE MANAGEMENT IN TOMATOHemlata Pant and Gopal Pandey
16. ROLE OF SOIL ORGANIC MATTER IN 219-227SOIL HEALTH SUSTAINABILITYA. K. Singh, R. K. Chauhan and J. S. Bisen
17. VARIABILITY AMONG THE Sclerotiumrolfsii Sacc. 229-236ISOLATES FROM SOUTHERN KARNATAKAJabbar Sab, A. Nagaraja and Mallikarjunandmanu T. G.
18. SCOPE, POTENTIAL AND IMPORTANCE OF CARBON 237-243SEQUESTRATION THROUGH AGRO-FORESTRYParamesh, V., Arun Kumar, P., Akhilesh, K.S., Suresha C.N. and Parameshwar Naik.
19. MANAGEMENT OF DODDER (CUSCUTA SP.) 245-252IN TRANSPLANTED ONION
20. STATISTICAL METHODS IN THE POPULATION 253-259DYNAMIC STUDY OF INSECT
M.K. Nagamani and Jayalaxmi Narayan Hegde
21. INTEGRATED WEED MANAGEMENT 261-267IN RAINFED PEARL MILLETA.K. Guggari and M.B. Patil
22. EFFECT OF ORGANICS AND INORGANICS ON NUTRIENT 269-279UPTAKE, YIELD AND RESIDUAL NUTRIENT STATUS OF SOIL IN ONION (ALLIUM CEPA L.) CV. TELAGI REDA. N. Bagali, H. B. Patil, V. P. Chimmad, P. L. Patil and R. V. Patil
M B Patil, S S Nooli, A K Guggari and S Y Wali
23. IN VITRO EVALUATION OF FUNGICIDES AND BIOAGENTS 281-285AGAINST ALTERNARIA RICINI (YOSHII) HANSF. CAUSING LEAF SPOT OF CASTORNeelakanth, S. Hiremani and S. G. Mantur
24. ECONOMIC ANALYSIS OF TECHNOLOGIES 287-296FOR SORGHUM PRODUCTION: PRINCIPLE COMP0NENT ANALYSIS APPROACH
Devyanee K. Nemade V. A. Tiwari and S. S. Bhoyar
25. EFFICACY OF BOTANICALS 297-303AGAINST SOYBEAN DEFOLIATORSS. V. Nagrale, M. J. Deshmukh, V. A. Tiwari
M. S. Joshi and Debashree Bhattacharjee
International Journal on Agricultural Sciences
CONTENTS
Volume - V Issue : 2 2014

ISSN NO. 0976-450X
EFFECT OF DIFFERENT ORGANIC SOURCES OF NUTRIENTS ON, PHYSICAL, CHEMICAL AND BIOLOGICAL
PROPERTIES OF SOIL AFTER THE HARVEST OF GROUNDNUT (ARACHIS HYPOGAEA L.)
Manjunath Bhanuvally, Rajanaika, Mudalagiriyappa, Ramesha, Y.M. and Yogeeshappa, H.
Department of applied Botany, Kuvempu University, Jnana Sahyadri, Shankaragatta, Shimogga-577 451, Karnataka, India
INTRODUCTIONGroundnut (Arachis hypogaea L.) is king of oilseeds belongs to the family Leguminoceae and commonly called as poor man's almond. It is the world's fourth important source of edible oil and third most important source of vegetable protein. The groundnut is used for different purposes viz., food, animal feed and industrial raw materials. Seed is valued both for its oil and protein content
as the seeds contain about 40-45 per cent oil, 25 per cent protein and 18 per cent carbohydrates in addition to minerals and vitamins. Groundnut oil contains a higher proportion of unsaturated fatty acids, including essential fatty acids like linolenic and linoleic acids (Desai et al., 1999). It is also fairly rich in calcium, iron and vitamin B complex like thiamine, riboflavin, niacin and vitamin A. It has multifarious usages; it is not
ABSTRACT
A field experiment was conducted during kharif 2011 at Alur, Hiriyur Taluk Chitradurga
district, Karnataka to know the “Effect of different organic sources of nutrients on physical,
chemical and biological properties of soil after the harvest of groundnut” (Arachis hypogaea
L.) under rainfed condition. Results revealed that, application of vermicompost (3 t/ha) + -1
Panchagvaya spray (3 % @ 30, 60 and 75 DAS) + Liquid manure (2000 L ha ) + Jeevamruta -1
(2000 L ha ) recorded significantly higher available nitrogen (269.9 kg/ha), phosphorus (45.9
kg/ha), potassium (389.1 kg/ha), iron (6.22 ppm), zinc (1.77 ppm), copper (0.68 ppm),
manganese (9.87 ppm), maximum water holding capacity (55.3 %) and water stable aggregates
(78.2 %) as compared to other treatments. Whereas, significantly lower available nitrogen,
phosphorus and potassium (256, 37.1 and 374.6 kg/ha, respectively) recorded in the treatment
with the zero application of NPK as compared to other treatments.
No. of Pages: 6 No. of Tables: 4 References: 6
Keywords: Organic manures, Panchagavya, Jeevamruta, available iron, Nitrogen.
International Journal on Agricultural Sciences Vol. V (Issue 2), pp.121-126, 2014
Corresponding author: [email protected]
Research Paper
Received on: 03.03.2014 Revised on: 05.04.2014 Accepted on: 10.05.2014

ISSN NO. 0976-450X
only used as a major cooking medium for various food items but also utilized for manufacture of soap, cosmetics, shaving cream, lubricants, etc. In fact, it plays a pivotal role in oilseed economy of India.
Now, the agriculture research is focused on evolving ecologically sound, biologically sustainable and socio economically viable technologies and there is need for a fresh look to exploit the organic farming approaches using the local manurial sources for growing groundnut without using chemical fertilizers and pesticides, which minimize environmental pollution and maintain long term fertility of soil by maintaining soil organic matter and providing crop nutrients. Many such nature friendly farming practices were evolved and developed by the farmers of the ancient period and the same become available to the successive generations. In the plight of material welfare, the traditional knowledge, which has been subjected to a process of refinement through generations of experience, were given negligible importance and are now receiving recognition. However, the scientific basis for such indigenous technologies needs to be evaluated and perfected before large-scale dissemination. Keeping these points in view, a field experiment was conducted to know the effect of various organic manures which is enriched with bio fertilizers and top dressing with different liquid organic manures on growth and productivity of groundnut in order to explore the possibilities of developing a sustainable input package for organic production of groundnut.
Organic manures, including animal manures, crop residues, green manures and composts were traditionally and preferentially used in developing countries until 1960's before the inorganic chemical fertilizers began to gain popularity. Chemical fertilizers became easily available and unlike organic manures, they were less bulky and thus, easier to transport, handle and store. They produced greater crop response than many organic manures. This was
particularly true during the 'Green Revolution', when high yielding crop varieties were introduced that responded to heavy doses of chemical fertilizers.
MATERIAL AND METHODSA field experiment was conducted during kharif 2011 at Alur, Hiriyur Taluk Chitradurga district, Karnataka to know the “Effect of different organic sources of nutrients on physical, chemical and biological properties of soil after the harvest of groundnut” (Arachis hypogaea L.). The texture of soil was red sandy loam having neutral pH with organic carbon (0.52 %),
-1available nitrogen (256.14 kg ha ), phosphorous
-1 -1(37.45 kg ha ), and potassium (381.6 kg ha ). The variety used was TMV-2. The experiment was laid out in a randomized complete block design with three replications involving 11 treatments T : FYM (7.5 t/ha)+Jeevamruta(2000 1
-1L ha ) T : FYM (7.5 t/ha)+Panchagvaya spray 2
(3%@30,60 and 75 DAS) T : FYM (7.5 3
-1t/ha)+Liquid manure (2000 L ha ) T : 4
-1Vermicompost (3t/ha)+Jeevamruta(2000 L ha ) T : Vermicompost (3t/ha)+ Panchagvaya spray 5
(3%@30,60 and 75 DAS) T : Vermicompost 6
-1(3t/ha)+ Liquid manure (2000 L ha ) T : Neem 7
cake (500 kg/ha)+ Pongamia cake (500 kg/ha) T : 8
FYM (7.5 T/ha)+ Panchagvaya spray (3% @ -30,60 and 75 DAS)+ Liquid manure (2000 L ha
1 -1)+ Jeevamruta(2000 L ha ) T : Vermicompost (3 9
t/ha)+ Panchagvaya spray (3%@30,60 and 75 -1DAS)+ Liquid manure (2000 L ha )+
-1Jeevamruta(2000 L ha ) T10: Recommended NPK T : Zero NPK. The biofertilizers are 11
enriched with bulky organic manures and oil cakes. Liquid organic manures like 3% Panchagavya was sprayed @ 30, 60 and 75 DAS and Jeevamruta & Bio-digester were analyzed for its nitrogen content before application. Panchagavya stock solution was prepared by using following ingredients and method. 7 kg cow dung and 1 kg cow ghee were mixed well and kept for 2 days; 2 L cow urine and 10 L water were added to the mixture and left for 15 days; Then 3 L of sugarcane juice + 2L of cow milk + 2
IJAS 2014 • 122
International Journal on Agricultural Sciences Vol. V (Issue 2), pp.121-126, 2014
ISSN NO. 0976-450X
L of curd + 2 L tender coconut water + 250 g jaggary + 1 kg ripened banana were added to accelerate the fermentation. All the materials were added to a wide mouthed pot and kept under shade. The mixture was left for 14 days and stirred twice a day for about 20 minutes both in morning and evening and then filtered. Enumeration of soil microorganisms: Bacteria : By serial dilution plate count technique and by plating on Soil Extract Agar (SEA). Fungi: By serial dilution plate count technique and by plating on Martins Rose Bengal Agar (MRBA). Actinomycetes : By serial dilution plate count technique and by plating on Kusters Agar (KA). Chemical analysis of soil: Soil samples after harvest of the crop were collected from 0-20 cm soil depth from each treatment in all the three replications, dried under shade, powdered and passed through 2 mm sieve. The soil samples were analyzed for available nitrogen, phosphorus and potassium content. The
-1available nitrogen (kg ha ) of soil was d e t e r m i n e d b y a l ka l i n e p o t a s s i u m permanganate method as outlined by Subbaiah and Asija (1959). The available phosphorus (kg
-1ha ) of soil was determined by chlorostannous
reduced molybdophosphoric blue colour method in hydrochloric acid system by using Olsen's extractant. The available potassium (kg
-1ha ) of soil was determined by using neutral normal ammonium acetate extractant using a flame photometer (Jackson, 1973).
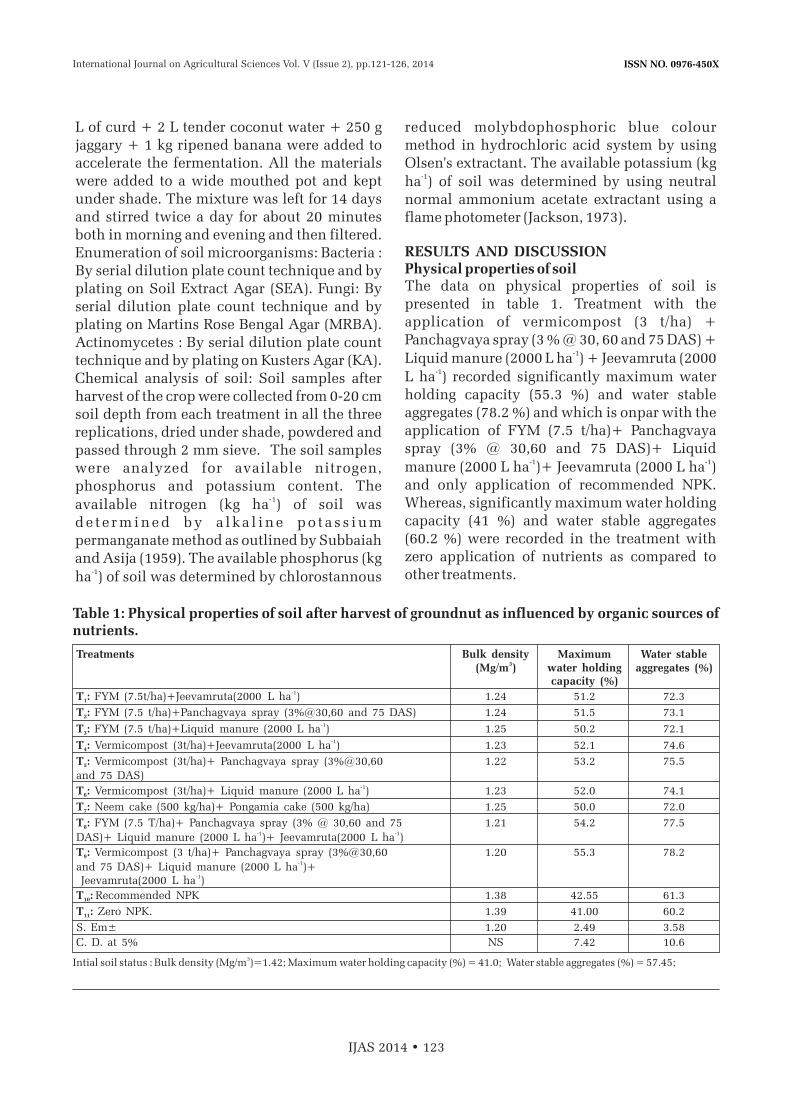
RESULTS AND DISCUSSIONPhysical properties of soilThe data on physical properties of soil is presented in table 1. Treatment with the application of vermicompost (3 t/ha) + Panchagvaya spray (3 % @ 30, 60 and 75 DAS) +
-1Liquid manure (2000 L ha ) + Jeevamruta (2000 -1
L ha ) recorded significantly maximum water holding capacity (55.3 %) and water stable aggregates (78.2 %) and which is onpar with the application of FYM (7.5 t/ha)+ Panchagvaya spray (3% @ 30,60 and 75 DAS)+ Liquid
-1 -1manure (2000 L ha )+ Jeevamruta (2000 L ha ) and only application of recommended NPK. Whereas, significantly maximum water holding capacity (41 %) and water stable aggregates (60.2 %) were recorded in the treatment with zero application of nutrients as compared to other treatments.
IJAS 2014 • 123
Table 1: Physical properties of soil after harvest of groundnut as influenced by organic sources of nutrients.
Treatments Bulk density3(Mg/m ) water holding aggregates (%)
capacity (%) -1T : FYM (7.5t/ha)+Jeevamruta(2000 L ha ) 1.24 51.2 72.31
T : FYM (7.5 t/ha)+Panchagvaya spray (3%@30,60 and 75 DAS) 1.24 51.5 73.12
-1T : FYM (7.5 t/ha)+Liquid manure (2000 L ha ) 1.25 50.2 72.13
-1T : Vermicompost (3t/ha)+Jeevamruta(2000 L ha ) 1.23 52.1 74.64
T : Vermicompost (3t/ha)+ Panchagvaya spray (3%@30,60 1.22 53.2 75.55
and 75 DAS)-1T : Vermicompost (3t/ha)+ Liquid manure (2000 L ha ) 1.23 52.0 74.16
T : Neem cake (500 kg/ha)+ Pongamia cake (500 kg/ha) 1.25 50.0 72.07
T : FYM (7.5 T/ha)+ Panchagvaya spray (3% @ 30,60 and 75 1.21 54.2 77.58-1 -1DAS)+ Liquid manure (2000 L ha )+ Jeevamruta(2000 L ha )
T : Vermicompost (3 t/ha)+ Panchagvaya spray (3%@30,60 1.20 55.3 78.29-1and 75 DAS)+ Liquid manure (2000 L ha )+
-1 Jeevamruta(2000 L ha )
T : Recommended NPK 1.38 42.55 61.310
T : Zero NPK. 1.39 41.00 60.211
S. Em± 1.20 2.49 3.58
C. D. at 5% NS 7.42 10.6
Maximum Water stable
3Intial soil status : Bulk density (Mg/m )=1.42; Maximum water holding capacity (%) = 41.0; Water stable aggregates (%) = 57.45;
International Journal on Agricultural Sciences Vol. V (Issue 2), pp.121-126, 2014
ISSN NO. 0976-450X
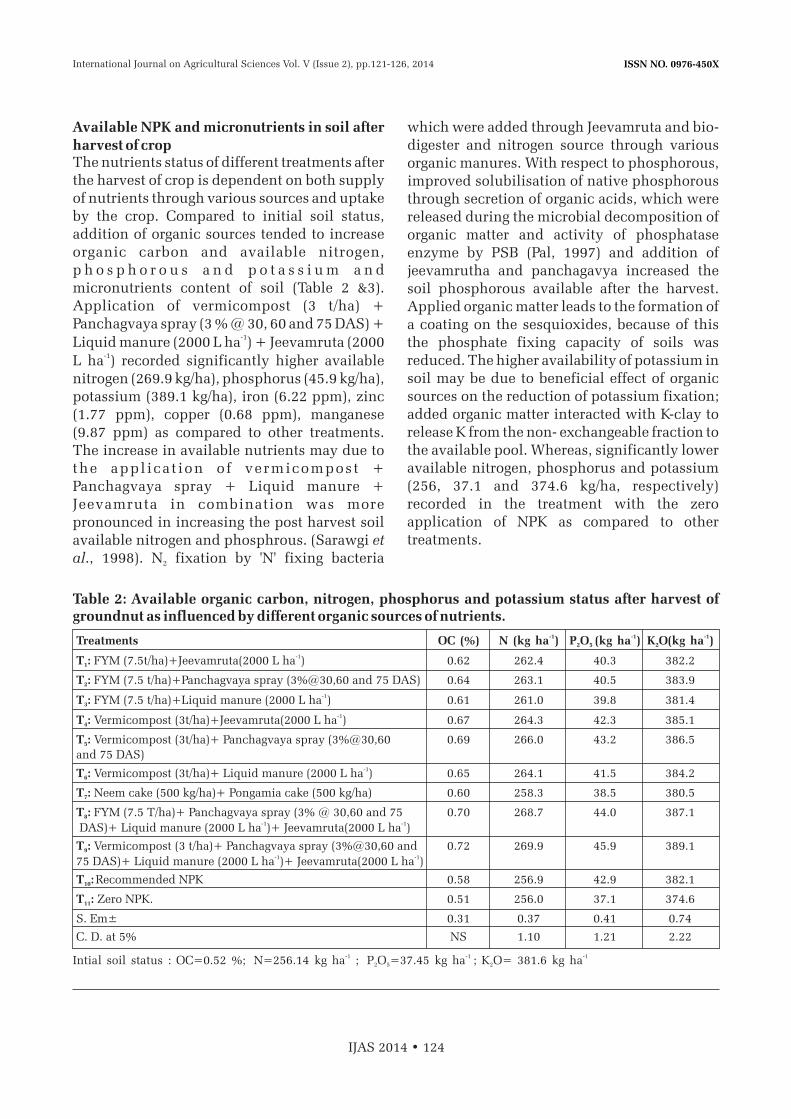
Available NPK and micronutrients in soil after harvest of cropThe nutrients status of different treatments after the harvest of crop is dependent on both supply of nutrients through various sources and uptake by the crop. Compared to initial soil status, addition of organic sources tended to increase organic carbon and available nitrogen, p h o s p h o r o u s a n d p o t a s s i u m a n d micronutrients content of soil (Table 2 &3). Application of vermicompost (3 t/ha) + Panchagvaya spray (3 % @ 30, 60 and 75 DAS) +
-1Liquid manure (2000 L ha ) + Jeevamruta (2000
-1L ha ) recorded significantly higher available nitrogen (269.9 kg/ha), phosphorus (45.9 kg/ha), potassium (389.1 kg/ha), iron (6.22 ppm), zinc (1.77 ppm), copper (0.68 ppm), manganese (9.87 ppm) as compared to other treatments. The increase in available nutrients may due to the appl ica t ion o f vermicompost + Panchagvaya spray + Liquid manure + Jeevamruta in combination was more pronounced in increasing the post harvest soil available nitrogen and phosphrous. (Sarawgi et al., 1998). N fixation by 'N' fixing bacteria 2
which were added through Jeevamruta and bio-digester and nitrogen source through various organic manures. With respect to phosphorous, improved solubilisation of native phosphorous through secretion of organic acids, which were released during the microbial decomposition of organic matter and activity of phosphatase enzyme by PSB (Pal, 1997) and addition of jeevamrutha and panchagavya increased the soil phosphorous available after the harvest. Applied organic matter leads to the formation of a coating on the sesquioxides, because of this the phosphate fixing capacity of soils was reduced. The higher availability of potassium in soil may be due to beneficial effect of organic sources on the reduction of potassium fixation; added organic matter interacted with K-clay to release K from the non- exchangeable fraction to the available pool. Whereas, significantly lower available nitrogen, phosphorus and potassium (256, 37.1 and 374.6 kg/ha, respectively) recorded in the treatment with the zero application of NPK as compared to other treatments.
IJAS 2014 • 124
Table 2: Available organic carbon, nitrogen, phosphorus and potassium status after harvest of groundnut as influenced by different organic sources of nutrients.
-1 -1 -1Treatments OC (%) N (kg ha ) P O (kg ha ) K O(kg ha )2 5 2
-1T : FYM (7.5t/ha)+Jeevamruta(2000 L ha ) 0.62 262.4 40.3 382.21
T : FYM (7.5 t/ha)+Panchagvaya spray (3%@30,60 and 75 DAS) 0.64 263.1 40.5 383.92
-1T : FYM (7.5 t/ha)+Liquid manure (2000 L ha ) 0.61 261.0 39.8 381.43
-1T : Vermicompost (3t/ha)+Jeevamruta(2000 L ha ) 0.67 264.3 42.3 385.14
T : Vermicompost (3t/ha)+ Panchagvaya spray (3%@30,60 0.69 266.0 43.2 386.55
and 75 DAS)-1T : Vermicompost (3t/ha)+ Liquid manure (2000 L ha ) 0.65 264.1 41.5 384.26
T : Neem cake (500 kg/ha)+ Pongamia cake (500 kg/ha) 0.60 258.3 38.5 380.57
T : FYM (7.5 T/ha)+ Panchagvaya spray (3% @ 30,60 and 75 0.70 268.7 44.0 387.18-1 -1 DAS)+ Liquid manure (2000 L ha )+ Jeevamruta(2000 L ha )
T : Vermicompost (3 t/ha)+ Panchagvaya spray (3%@30,60 and 0.72 269.9 45.9 389.19-1 -175 DAS)+ Liquid manure (2000 L ha )+ Jeevamruta(2000 L ha )
T :Recommended NPK 0.58 256.9 42.9 382.110
T : Zero NPK. 0.51 256.0 37.1 374.611
S. Em± 0.31 0.37 0.41 0.74
C. D. at 5% NS 1.10 1.21 2.22
-1 -1 -1Intial soil status : OC=0.52 %; N=256.14 kg ha ; P O =37.45 kg ha ; K O= 381.6 kg ha2 5 2
International Journal on Agricultural Sciences Vol. V (Issue 2), pp.121-126, 2014

ISSN NO. 0976-450X
Microbial propertiesSignificantly higher microbial population such
6as bacteria, fungi and actinomycetes (26.5 x 10 -1 3 -1 3
cfu g soil, 17.5x10 cfu g soil, and 10.5x10 cfu
IJAS 2014 • 125
Table 3: Micronutrients status after harvest of groundnut as influenced by organic sources of nutrients.
Table 4: Microbial population in soil after harvest of groundnut as influenced by different organic sorces nutrients
Treatments Iron Zinc Copper Manganese (ppm) (ppm) (ppm) (ppm)
-1T : FYM (7.5t/ha)+Jeevamruta(2000 L ha ) 5.83 1.63 0.58 9.711
T : FYM (7.5 t/ha)+Panchagvaya spray (3%@30,60 and 5.86 1.65 0.59 9.722
75 DAS)-1T : FYM (7.5 t/ha)+Liquid manure (2000 L ha ) 5.81 1.60 0.56 9.703
-1T : Vermicompost (3t/ha)+Jeevamruta(2000 L ha ) 5.90 1.70 0.61 9.804
T : Vermicompost (3t/ha)+ Panchagvaya spray 5.97 1.71 0.62 9.825
(3%@30,60 and 75 DAS)-1T : Vermicompost (3t/ha)+ Liquid manure (2000 L ha ) 5.89 1.68 0.60 9.776
T : Neem cake (500 kg/ha)+ Pongamia cake (500 kg/ha) 5.80 1.58 0.54 9.657
T : FYM (7.5 T/ha)+ Panchagvaya spray (3% @ 30,60 6.09 1.75 0.65 9.858
-1and 75 DAS)+ Liquid manure (2000 L ha )+ -1Jeevamruta(2000 L ha )
T : Vermicompost (3 t/ha)+ Panchagvaya spray 6.22 1.77 0.68 9.879
(3%@30,60 and 75 DAS)+ Liquid manure -1 -1(2000 L ha )+ Jeevamruta(2000 L ha )
T :Recommended NPK 5.20 1.55 0.52 8.5510
T : Zero NPK. 5.00 1.45 0.50 8.1211
S. Em± 0.04 0.02 0.02 0.02
C. D. at 5% 0.12 0.07 0.08 0.06
Treatments Bacteria Fungi Actinomycetes 6 -1 3 -1 3 -1 (10 cfu g soil) (10 cfu g soil) (10 cfu g soil)
-1T : FYM (7.5t/ha)+Jeevamruta(2000 L ha ) 17.3 12.2 6.51
T : FYM (7.5 t/ha)+Panchagvaya spray (3%@30,60 and 75 DAS) 18.0 12.5 7.02
-1T : FYM (7.5 t/ha)+Liquid manure (2000 L ha ) 16.0 12.0 6.13
-1T : Vermicompost (3t/ha)+Jeevamruta(2000 L ha ) 21.5 14.0 8.64
T : Vermicompost (3t/ha)+ Panchagvaya spray (3%@30,60 22.1 15.0 9.55
and 75 DAS)-1T : Vermicompost (3t/ha)+ Liquid manure (2000 L ha ) 20.0 13.6 8.56
T : Neem cake (500 kg/ha)+ Pongamia cake (500 kg/ha) 15.5 11.0 6.07
T : FYM (7.5 T/ha)+ Panchagvaya spray (3% @ 30,60 and 75 24.5 16.5 9.88
-1 -1DAS)+ Liquid manure (2000 L ha )+ Jeevamruta(2000 L ha )
T : Vermicompost (3 t/ha)+ Panchagvaya spray (3%@30,60 and 26.5 17.5 10.59
-1 -175 DAS)+ Liquid manure (2000 L ha )+ Jeevamruta(2000 L ha )
T :Recommended NPK 12.5 10.0 5.410
T : Zero NPK. 9.0 5.0 3.311
S. Em± 1.73 0.31 0.41
C. D. at 5% 5.21 0.98 1.23
Intial soil status : Iron (ppm)=5.02 %; Zinc (ppm) = 1.4; Copper (ppm) = 0.5; Manganese (ppm) = 8.16.
6 -1 3 -1 3 -1Note: Initial soil status: Bacteria: (9.0 x 10 cfu g ); Fungi: (5.0 x 10 cfu g ); Actinomycetes: (3.0 x 10 cfu g )
International Journal on Agricultural Sciences Vol. V (Issue 2), pp.121-126, 2014
ISSN NO. 0976-450X
-1g soil, respectively), were recorded in the treatment with the application of vermicompost (3 t/ha) + Panchagvaya spray (3 % @ 30, 60 and
-175 DAS) + Liquid manure (2000 L ha ) + -1
Jeevamruta (2000 L ha ) and which is onpar with the application of FYM (7.5 t/ha)+ Panchagvaya spray (3% @ 30,60 and 75 DAS)+
-1Liquid manure (2000 L ha )+ Jeevamruta (2000 -1
L ha ) and only application of recommended NPK. Whereas, significantly lower microbial population such as bacteria, fungi and
6 -1 6actinomycetes (9.0 x10 cfu g soil, 5.0 x 10 cfu -1 6 -1g soil, and 3.3 x 10 cfu g soil, respectively)
(Table 4). Addition of Jeevamruta and bio-digester was highly beneficial in improving bacteria, fungi and actinomycetes population in the soil. Similarly, Majumdar et al. (2006) inferred that application of urine to the soil resulted in increased microflora in soil. Not only Jeevamruta and bio-digester but FYM, vermicompost and biofertilizers were also helpful in improving the soil micro flora population. These observations indicate that use of integrated organic sources of nutrients helped in the enhanced microbial activity and ultimately improved the soil fertility.
CONCLUSIONApplication of vermicompost + Panchagvaya spray + Liquid manure + Jeevamruta (2000 L
-1ha ) in combination was improved the physical, chemical and biological properties of soil as compared to only application of NPK and zero application of NPK treatments.
REFERENCES
1. Desai, B.B., Kotecha, P.M. and Salunkhe,
D.K., 1999, Science and technology of
groundnut, Biology, Production, Processing
and Utilization, pp, 8-15.
2. Subbaiah, B.Y. and Asija, G.L., 1959, A
rapid procedure for the estimation of
available nitrogen in soils. Curr. Sci., 25:
259-260.
3. Jackson, M.L., 1973, Soil Chemical
Analysis, Prentice Hall of India Pvt. Ltd.
New Delhi, pp. 1-492
4. Sarawgi, S.K., Tiwari, S.K and Tripathi,
R. S., 1998, Nitrogen fixation, balance
sheet and yield of winter soyabean as
affected by divergent nutrients. Annals of
Agril. Res. 19 (4): 379-385.
5. Pal, S.S., 1997, Acid tolerant strains of
phosphate solubilizing bacteria and their
interactions in soyabean-wheat crop
sequence. J. of Indian Soc. of Soil Sci., 45
(4):742-746.
6. Majumdar, D., Patel, M., Darbar, R. and
Vyas, M., 2006, Short-term emissions of
ammonia and carbon dioxide from cattle
urine contaminated tropical grassland
microcosm. Environmental Monitoring
Assessment, 122: 9-25.
IJAS 2014 • 126
International Journal on Agricultural Sciences Vol. V (Issue 2), pp.121-126, 2014
ISSN NO. 0976-450X
EFFECT OF DIFFERENT ORGANIC SOURCES OF NUTRIENTS ON, GROWTH, YIELD, QUALITY AND ECONOMICS OF
GROUNDNUT (Arachis hypogaea L.)
Manjunath Bhanuvally, Rajanaika, Mudalagiriyappa, Ramesha, Y.M. and Yogeeshappa, H.
Department of Applied Botany, Kuvempu University, Jnana Sahyadri, Shankaragatta, Shimoga-577451, Karnataka
INTRODUCTIONGroundnut (Arachis hypogaea L.) is king of
oilseeds belongs to the family Leguminoceae
and commonly called as poor man's almond. It
is the world's fourth important source of edible
oil and third most important source of vegetable
protein. The groundnut is used for different
purposes viz., food, animal feed and industrial
raw materials. Seed is valued both for its oil and
protein content as the seeds contain about 40-45
per cent oil, 25 per cent protein and 18 per cent
carbohydrates in addition to minerals and
vitamins. Groundnut oil contains a higher
proportion of unsaturated fatty acids, including
essential fatty acids like linolenic and linoleic
acids (Desai et al., 1999). It is also fairly rich in
calcium, iron and vitamin B complex like
thiamine, riboflavin, niacin and vitamin A. It
ABSTRACT
A field experiment was conducted during kharif 2011 at Alur, Hiriyur Taluk Chitradurga
district, Karnataka to know the “Effect of different organic sources of nutrients on growth,
yield, quality and economics of groundnut” (Arachis hypogaea L.) under rainfed condition.
Results revealed that, application of vermicompost (3 t/ha) + Panchagvaya spray (3 % @ 30, -1 -1
60 and 75 DAS) + Liquid manure (2000 L ha ) + Jeevamruta (2000 L ha ) recorded
significantly higher plant height (26.8 cm), number of pods per plant (42.4), oil yield (690.4
kg/ha), protien yield (386.6 kg/ha), pod yield (2312 kg/ha) and gross returns (Rs 71,829/ha)
and which is onpar with the application of FYM (7.5 T/ha)+ Panchagvaya spray (3% @ -1 -1
30,60 and 75 DAS) + Liquid manure (2000 L ha )+ Jeevamruta(2000 L ha ) and only
application of recommended NPK. Whereas, significantly lower plant height (16.3 cm),
number of pods per plant (19.0), oil yield (204.6 kg/ha), protien yield (107.9 kg/ha), pod
yield (802 kg/ha) and gross returns (Rs 25,612/ha) compared to other treatments.
No. of Pages: 6 No. of Tables: 4 References: 5
Keywords: Organic manures, Panchagavya, Jeevamruta, pod yield and quality.
International Journal on Agricultural Sciences Vol. V (Issue 2), pp. 127-132, 2014
Corresponding author: [email protected]
Research Paper
Received on: 03.03.2014 Revised on: 07.04.2014 Accepted on: 15.05.2014
ISSN NO. 0976-450X
has multifarious usages; it is not only used as a
major cooking medium for various food items
but also utilized for manufacture of soap,
cosmetics, shaving cream, lubricants, etc. In
fact, it plays a pivotal role in oilseed economy of
India.
there is need for a fresh look to
exploit the organic farming approaches using
the local manurial sources for growing
groundnut without using chemical fertilizers
and pesticides, which minimize environmental
pollution and maintain long term fertility of soil
by maintaining soil organic matter and
providing crop nutrients.
Keeping these points in view field experiment
was conducted to know the
Now, the agriculture research is focused on
evolving ecologically sound, biologically
sustainable and socio economically viable
technologies and
Many such nature
friendly farming practices were evolved and
developed by the farmers of the ancient period
and the same become available to the successive
generations. In the plight of material welfare,
the traditional knowledge, which has been
subjected to a process of refinement through
generations of experience, were given negligible
importance and are now receiving recognition.
However, the scientific basis for such
indigenous technologies needs to be evaluated
and perfected before large-scale dissemination.
, a
effect of various
organic manures which is enriched with bio
fertilizers and top dressing with different liquid
organic manures on growth and productivity of
groundnut in order to explore the possibilities
of developing a sustainable input package for
organic production of groundnut.
Organic manures, including animal manures,
crop residues, green manures and composts
were traditionally and preferentially used in
developing countries until 1960's before the
inorganic chemical fertilizers began to gain
popularity. Chemical fertilizers became easily
available and unlike organic manures, they
were less bulky and thus, easier to transport,
handle and store. They produced greater crop
response than many organic manures. This was
particularly true during the 'Green Revolution',
when high yielding crop varieties were
introduced that responded to heavy doses of
chemical fertilizers.
MATERIAL AND METHODSA field experiment was conducted during kharif 2011 at Alur, Hiriyur Taluk Chitradurga district, Karnataka to know the “Effect of different organic sources of nutrients on growth, yield, quality and economics of groundnut” (Arachis hypogaea L.) The texture of soil was red sandy loam having neutral pH with organic carbon
-1(0.66%), available nitrogen (256.14 kg ha ),
-1phosphorous (37.45 kg ha ), and potassium -1(381.6 kg ha ). The variety used was TMV-2. The
experiment was laid out in a randomized complete block design with three replications involving 11 treatments T : FYM (7.5 1
-1t/ha)+Jeevamruta(2000 L ha ) T : FYM (7.5 2
t/ha)+Panchagvaya spray (3%@30,60 and 75 DAS) T : FYM (7.5 t/ha)+Liquid manure (2000 L 3
- 1h a ) T : Ve r m i c o m p o s t ( 3 t / h a ) + 4
-1Jeevamruta(2000 L ha ) T : Vermicompost 5
(3t/ha)+ Panchagvaya spray (3%@30,60 and 75 DAS) T : Vermicompost (3t/ha)+ Liquid manure 6
-1(2000 L ha ) T : Neem cake (500 kg/ha)+ 7
Pongamia cake (500 kg/ha) T : FYM (7.5 T/ha)+ 8
Panchagvaya spray (3% @ 30,60 and 75 DAS)+ -1
Liquid manure (2000 L ha )+ Jeevamruta(2000 -1L ha ) T : Vermicompost (3 t/ha)+ Panchagvaya 9
spray (3%@30,60 and 75 DAS)+ Liquid manure -1 -1(2000 L ha )+ Jeevamruta(2000 L ha ) T10:
Recommended NPK T : Zero NPK. The 11
biofertilizers are enriched with bulky organic manures and oil cakes. Liquid organic manures like 3% Panchagavya was sprayed @ 30, 60 and 75 DAS and Jeevamruta & Bio-digester were analyzed for its nitrogen content before application. Panchagavya stock solution was prepared by using following ingredients and method. 7 kg cow dung and 1 kg cow ghee were mixed well and kept for 2 days; 2 L cow urine
IJAS 2014 • 128
International Journal on Agricultural Sciences Vol. V (Issue 2), pp. 127-132, 2014
ISSN NO. 0976-450X
and 10 L water were added to the mixture and left for 15 days; Then 3 L of sugarcane juice + 2L of cow milk + 2 L of curd + 2 L tender coconut water + 250 g jaggary + 1 kg ripened banana were added to accelerate the fermentation. All the materials were added to a wide mouthed pot and kept under shade. The mixture was left for 14 days and stirred twice a day for about 20 minutes both in morning and evening and then filtered. Growth, yield and yield parameters were recorded as per the procedure. RESULTS AND DISCUSSION
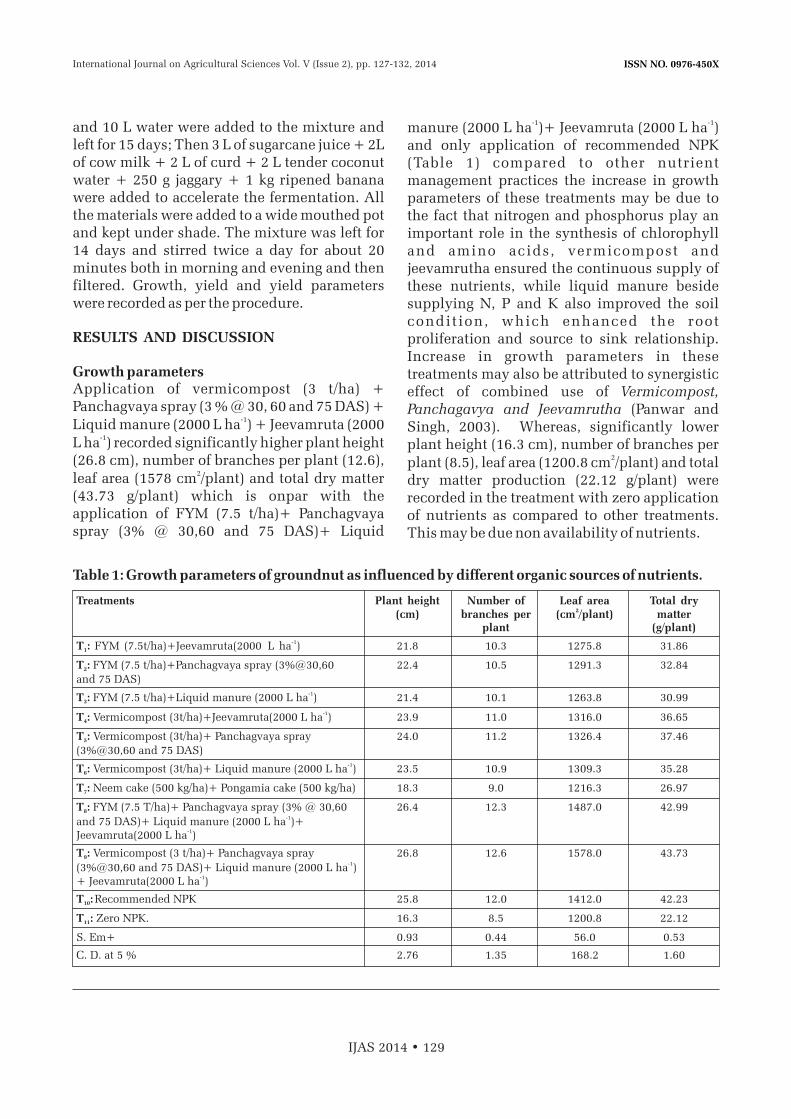
Growth parameters Application of vermicompost (3 t/ha) + Panchagvaya spray (3 % @ 30, 60 and 75 DAS) +
-1Liquid manure (2000 L ha ) + Jeevamruta (2000
-1L ha ) recorded significantly higher plant height (26.8 cm), number of branches per plant (12.6),
2leaf area (1578 cm /plant) and total dry matter (43.73 g/plant) which is onpar with the application of FYM (7.5 t/ha)+ Panchagvaya spray (3% @ 30,60 and 75 DAS)+ Liquid
-1 -1manure (2000 L ha )+ Jeevamruta (2000 L ha ) and only application of recommended NPK (Table 1) compared to other nutrient management practices the increase in growth parameters of these treatments may be due to the fact that nitrogen and phosphorus play an important role in the synthesis of chlorophyll and amino acids, vermicompost and jeevamrutha ensured the continuous supply of these nutrients, while liquid manure beside supplying N, P and K also improved the soil condition, which enhanced the root proliferation and source to sink relationship. Increase in growth parameters in these treatments may also be attributed to synergistic effect of combined use of Vermicompost, Panchagavya and Jeevamrutha (Panwar and Singh, 2003). Whereas, significantly lower plant height (16.3 cm), number of branches per
2plant (8.5), leaf area (1200.8 cm /plant) and total dry matter production (22.12 g/plant) were recorded in the treatment with zero application of nutrients as compared to other treatments. This may be due non availability of nutrients.
IJAS 2014 • 129
Table 1: Growth parameters of groundnut as influenced by different organic sources of nutrients.
Treatments Plant height Number of Leaf area Total dry2(cm) branches per (cm /plant) matter
plant (g/plant)-1T : FYM (7.5t/ha)+Jeevamruta(2000 L ha ) 21.8 10.3 1275.8 31.861
T : FYM (7.5 t/ha)+Panchagvaya spray (3%@30,60 22.4 10.5 1291.3 32.842
and 75 DAS)-1T : FYM (7.5 t/ha)+Liquid manure (2000 L ha ) 21.4 10.1 1263.8 30.993
-1T : Vermicompost (3t/ha)+Jeevamruta(2000 L ha ) 23.9 11.0 1316.0 36.654
T : Vermicompost (3t/ha)+ Panchagvaya spray 24.0 11.2 1326.4 37.465
(3%@30,60 and 75 DAS)-1T : Vermicompost (3t/ha)+ Liquid manure (2000 L ha ) 23.5 10.9 1309.3 35.286
T : Neem cake (500 kg/ha)+ Pongamia cake (500 kg/ha) 18.3 9.0 1216.3 26.977
T : FYM (7.5 T/ha)+ Panchagvaya spray (3% @ 30,60 26.4 12.3 1487.0 42.998-1and 75 DAS)+ Liquid manure (2000 L ha )+
-1Jeevamruta(2000 L ha )
T : Vermicompost (3 t/ha)+ Panchagvaya spray 26.8 12.6 1578.0 43.739-1(3%@30,60 and 75 DAS)+ Liquid manure (2000 L ha )
-1+ Jeevamruta(2000 L ha )
T :Recommended NPK 25.8 12.0 1412.0 42.2310
T : Zero NPK. 16.3 8.5 1200.8 22.1211
S. Em+ 0.93 0.44 56.0 0.53
C. D. at 5 % 2.76 1.35 168.2 1.60
International Journal on Agricultural Sciences Vol. V (Issue 2), pp. 127-132, 2014

ISSN NO. 0976-450X
Yield and yield parameters Tr e a t m e n t w i t h t h e a p p l i c a t i o n o f
vermicompost (3 t/ha) + Panchagvaya spray (3
% @ 30, 60 and 75 DAS) + Liquid manure (2000 -1 -1
L ha ) + Jeevamruta (2000 L ha ) recorded
significantly more pods per plant (42.4), pod
yield (2312 kg/ha) and haulm yield (2469 kg/ha)
which is onpar with the application of FYM (7.5
t/ha)+ Panchagvaya spray (3% @ 30,60 and 75 -1
DAS)+ Liquid manure (2000 L ha )+ -1
Jeevamruta (2000 L ha ) and only application of
recommended NPK (Table 2). In case of
Panchagavya spray, the easy transfer of
nutrients to plant through foliar spray and the
Quality parameters Significantly higher oil and protein yield (690.4
and 386.6 kg/ha, respectively) were recorded in
the treatment with the application of
vermicompost (3 t/ha) + Panchagvaya spray (3
% @ 30, 60 and 75 DAS) + Liquid manure (2000
quantities of IAA and GA present in
Panchagavya (Somasundaram, 2003), could
have created the stimuli in the plant system and
which in turn increased the production of
growth regulators in cell system. Hence,
stimulated the necessary growth and
development in plants, leading to better yield.
These results are in agreement with the Mamaril
and Lopez (1997). Whereas, significantly lower
pod and haulm yield (802 and 1552 kg/ha,
respectively) were recorded in the treatment
with zero application of nutrients as compared
to other treatments.
-1 -1L ha ) + Jeevamruta (2000 L ha ) and which is
onpar with the application of FYM (7.5 t/ha)+
IJAS 2014 • 130
Table 2: Yield and yield parameters of groundnut as influenced by different organic sources of nutrients.
Treatments Plant height Number of Leaf area Total dry2(cm) branches (cm /plant) matter
per plant (g/plant)
-1T : FYM (7.5t/ha)+Jeevamruta(2000 L ha ) 21.8 10.3 1275.8 31.861
-1T : FYM (7.5t/ha)+Jeevamruta(2000 L ha ) 32.0 37.5 1413 19011
T : FYM (7.5 t/ha)+Panchagvaya spray (3%@30, 32.9 37.7 1632 19082
60 and 75 DAS)
-1T : FYM (7.5 t/ha)+Liquid manure (2000 L ha ) 31.2 36.8 1338 18593
-1T : Vermicompost (3t/ha)+Jeevamruta(2000 L ha ) 35.5 38.9 1852 21234
T : Vermicompost (3t/ha)+ Panchagvaya spray 36.0 39.3 1925 21635
(3%@30,60 and 75 DAS)
-1T : Vermicompost (3t/ha)+ Liquid manure (2000 L ha ) 33.2 38.7 1849 21206
T : Neem cake (500 kg/ha)+ Pongamia cake (500 kg/ha) 28.5 35.1 1304 17957
T : FYM (7.5 T/ha)+ Panchagvaya spray (3% @ 30, 60 and 42.3 41.5 2230 23358
-175 DAS)+ Liquid manure (2000 L ha )+-1Jeevamruta(2000 L ha )
T : Vermicompost (3 t/ha)+ Panchagvaya spray (3%@30,60 42.4 42.8 2312 24699
-1and 75 DAS)+ Liquid manure (2000 L ha )+ Jeevamruta -1(2000 L ha )
T :Recommended NPK 41.3 41.1 2175 220610
T : Zero NPK. 19.0 34.5 802.0 155211
S. Em± 0.37 8.25 46.1 88.5
C. D. at 5 % 1.12 NS 138.5 265.1
International Journal on Agricultural Sciences Vol. V (Issue 2), pp. 127-132, 2014

ISSN NO. 0976-450X
Panchagavya spray, the easy transfer of
nutrients to plant through foliar spray and the
quantities of IAA and GA present in
Panchagavya, could have created the stimuli in
the plant system and which in turn increased
the production of growth regulators in cell
system. Hence, stimulated the necessary growth
and development in plants, leading to better oil
and protien yield. Whereas, significantly lower
oil and protein yield (204.6 and 107.9 kg/ha,
the application of FYM (7.5 t/ha)+ Panchagvaya spray (3% @ 30,60 and 75 DAS)+ Liquid
-1 -1manure (2000 L ha )+ Jeevamruta (2000 L ha ) and only application of recommended NPK . But, application of FYM (7.5 t/ha)+ Panchagvaya spray (3% @ 30,60 and 75 DAS)+
-1Liquid manure (2000 L ha )+ Jeevamruta (2000 -1L ha ) recorded significantly maximum net
returns (Rs 53485/ha) compared to other treatments (Table 4). This is may be due to higher pod yield. Only application of recommended NPK recorded significantly
respectively), were recorded in the treatment
with zero application of nutrients as compared
to other treatments. This may be due lower pod
yield.EconomicsApplication of vermicompost (3 t/ha) + Panchagvaya spray (3 % @ 30, 60 and 75 DAS) +
-1Liquid manure (2000 L ha ) + Jeevamruta (2000 -1
L ha ) recorded significantly higher gross returns ( Rs71,829/ha) and which is onpar with
higher B:C ratio (3.82). Whereas, significantly lower net returns (Rs13612/ha) and B:C ratio
IJAS 2014 • 131
Table 3: Oil per cent, oil yield, protein per cent and protein yield of groundnut as influenced by different organic sources of nutrients.
Treatments Per cent (%) Yield (Kg ha-1)
Oil Protein Oil Protein
-1T : FYM (7.5t/ha)+Jeevamruta(2000 L ha ) 38.4 20.6 369.4 198.21
T : FYM (7.5 t/ha)+Panchagvaya spray (3%@30, 39.0 20.9 438.0 234.72
60 and 75 DAS)
-1T : FYM (7.5 t/ha)+Liquid manure (2000 L ha ) 38.2 20.4 344.9 184.23
-1T : Vermicompost (3t/ha)+Jeevamruta(2000 L ha ) 39.4 21.4 513.8 279.14
T : Vermicompost (3t/ha)+ Panchagvaya spray 40.0 21.9 543.6 297.65
(3%@30,60 and 75 DAS)
-1T : Vermicompost (3t/ha)+ Liquid manure (2000 L ha ) 39.2 21.1 508.0 273.56
T : Neem cake (500 kg/ha)+ Pongamia cake (500 kg/ha) 38.1 20.3 333.4 177.67
T : FYM (7.5 T/ha)+ Panchagvaya spray (3% @ 30,60 40.5 22.6 655.7 365.98
-1and 75 DAS)+ Liquid manure (2000 L ha )+ -1Jeevamruta (2000 L ha )
T : Vermicompost (3 t/ha)+ Panchagvaya spray 40.9 22.9 690.4 386.69
(3%@30,60 and 75 DAS)+ Liquid manure -1 -1(2000 L ha )+J eevamruta(2000 L ha )
T :Recommended NPK 40.3 22.2 625.9 344.810
T : Zero NPK. 38.1 20.1 204.6 107.911
S. Em± 5.23 0.27 21.7 14.2
C. D. at 5% NS 0.81 65.2 42.8
International Journal on Agricultural Sciences Vol. V (Issue 2), pp. 127-132, 2014

ISSN NO. 0976-450X
2. Desai, B.B., Kotecha, P.M. and Salunkhe,
D.K., 1999, Science and technology of
groundnut, Biology, Production, Processing
and Utilization, pp, 8-15.
3. Mamaril, J.C and Lopez, A.M., 1997, The
effect of coconut water growth hormones
(CWGH) on the growth, development and
yield of sweet pepper (Caspicum annum
L.). The Philliphines Journal of coconut
studies, 221(1): 18-24.
4. Panwar, A. S. and Singh, N. P., 2003,
Effects of Conjunctive use of phosphorus
and bio-organics on growth and yield of
Groundnut (Arachis hypogaea).Indian J. of
Agron., 48(3): 214-216.
5. Somasundaram, E., 2003, Evaluation of
organic sources of nutrients and
Panchagavya spray on the growth and
productivity of maize sunflower-
greengram system. Ph. D Thesis, Tamil
Nadu Agric. University. Coimbatore.
IJAS 2014 • 132
Table 4: Economics of groundnut as influenced by different organic sources of nutrients.
Treatments Cost of Gross Returns Net Returns B:C-1Cultivation (Rs. ha )
-1T : FYM (7.5t/ha)+Jeevamruta(2000 L ha ) 16250 44291 28041 1.731
T : FYM (7.5 t/ha)+Panchagvaya spray (3%@30, 15750 50868 35118 2.232
60 and 75 DAS)
-1T : FYM (7.5 t/ha)+Liquid manure (2000 L ha ) 16250 41999 25749 1.583
-1T : Vermicompost (3t/ha)+Jeevamruta(2000 L ha ) 20000 57683 37683 1.884
T : Vermicompost (3t/ha)+ Panchagvaya spray 19500 59913 40413 2.075
(3%@30,60 and 75 DAS)
-1T : Vermicompost (3t/ha)+ Liquid manure (2000 L ha ) 20000 57590 37590 1.886
T : Neem cake (500 kg/ha)+ Pongamia cake (500 kg/ha) 17000 40915 23915 1.417
T : FYM (7.5 T/ha)+ Panchagvaya spray (3% @ 30, 15750 69235 53485 3.408
-160 and 75 DAS)+ Liquid manure (2000 L ha )+ -1Jeevamruta(2000 L ha )
T : Vermicompost (3 t/ha)+ Panchagvaya spray 19500 71829 52329 2.689
-1(3%@30,60 and 75 DAS)+ Liquid manure (2000 L ha ) -1+ Jeevamruta(2000 L ha )
T :Recommended NPK 14000 67456 53456 3.8210
T : Zero NPK. 12000 25612 13612 1.1311
S. Em± 165.1 - 388.3 0.38
C. D. at 5% 495.0 NA 1165 1.15
-1(Rs. ha ) Ratio
NA: Not Analyzed
International Journal on Agricultural Sciences Vol. V (Issue 2), pp. 127-132, 2014
ISSN NO. 0976-450X
IMPACT OF INSECTICIDE (DELTAMETHRIN) ON BEHAVIOURAL CHANGES OF FRESH
WATER LABEO ROHITA
1 2*Arunika Gumasta Shashi Bala Shrivastava and H. Maini
*Shri Gurunanak Women's College, Jabalpur. (M. P.)1&2Govt. M. H. College of H. Sc. & Sc. (Auto) Jabalpur, Madhya Pradesh
INTRODUCTIONIn all 84 species of fish belonging to 45 genera,
20 families and 6 orders were recorded, Anon
(1992). Various studies have been made to
record the changes in the different animals,
particularly the fishes exposed to different
concentrations of organochlorine and
organophosphorous pesticides, metals, salts
and detergents. According to an article
published in (2008) deltamethrin is a Pyrethroid
insecticide used extensively to control
invertebrate pests on cotton and other crops. It
is acutely toxic to non target aquatic
organisms.The fresh water teleost Labeo rohita
belongs the family Cyprinideae. This graceful
Indo-Gangtic reveries species is the natural
inhabitant of the revering system of northern
and central India, and the rivers of Pakistan,
Bangladesh and Myanmar. It occasionally
browses the shallow bottoms having preference
to plank tonic algae; bottom sand, vegetable
debris, decaying leaves of aquatic plants is most
suitable culture. A pair of small maxillary
barbells concealed in lateral groove, no teeth on
jaws, color bluish on back, silvery on flank and
belly. Fish was identified with the help of
Jhingran (2007) and Days Fauna (1968).
ABSTRACT
The pollution of water where by the quality of the water deteriorates aquatic ecosystem.
Fresh water teleost Labeo rohita, most delicious table fish is now being affected with the
toxicant Deltamethrin (insecticide) shows extremely lethargic behavioural changes in
preliminary hours of exposure at different concentration. Selection of 5 concentrations is
based on the series in progressive bisection of intervals on the logarithmic scale such as
0.075, 0.15, 0.3, 0.6, and 1.2 ml.
No. of Pages: 4 No. of Tables: 2 References: 7
Keywords: Deltamethrin, Labeo rohita.
International Journal on Agricultural Sciences Vol. V (Issue 2), pp. 133-136, 2014
Corresponding author: [email protected]
Research Paper
Received on: 11.03.2014 Revised on: 28.03.2014 Accepted on: 28.06.2014
ISSN NO. 0976-450X
Deltamethrin is very active synthetic
Pyrethroid insecticide with specific gravity –
0.89 and molecular formula C H Br No . An 22 19 2 3
Alphacyano class of Pyrethroid insecticide is
used to insect pest control and anti malaria
programs in several countries including India.
This insecticide used extensively to control
invertebrate pest on cotton and other crops. It
is acute toxic to non target aquatic organisms.
Sharma and Prakash (2005) analyzed the
presence of pesticide residues using solid
phase extraction and gas chromatographic
techniques.
Deltamethrin is extremely lipophilic, it easily
penetrates the cuticle of insects and ocarinas,
which rapidly paralyze the nervous system.
Reinke (1972) and Bevanue and Hylin (1972)
reported the massive quantities of pesticides
occasionally in aquatic environment.
MATERIAL AND METHODThe specimen of Labeo for the present study
have collected from different ponds
(Hanumantal, Mahanadda, and Fish farm of
agriculture) located in the city Jabalpur in
Madhya Pradesh (India). Living and healthy
specimens of Labeo rohita were kept in glass
aquaria for acclimatized to stored tap water for
15 days. Fishes were treated with 0.01 % of
KMno solution to obviate dermal infection. 4
Fishes were daily fed with chopped and
powdered prawns at the rate of 0.80
mg/fish/day.
Two groups were prepared for experiments, at
least 10 fishes in each group. In first group
fishes were kept in water without insecticide
throughout the experiments to detect mortality
rate in normal condition. Fishes of second
g r o u p w e r e e x p o s e d b y d i f f e r e n t
concentrations of toxicant deltamethrin (i,e.
0.075, 0.15, 0.3, 0.6, 1.2 ml/l). and observation
were noted.
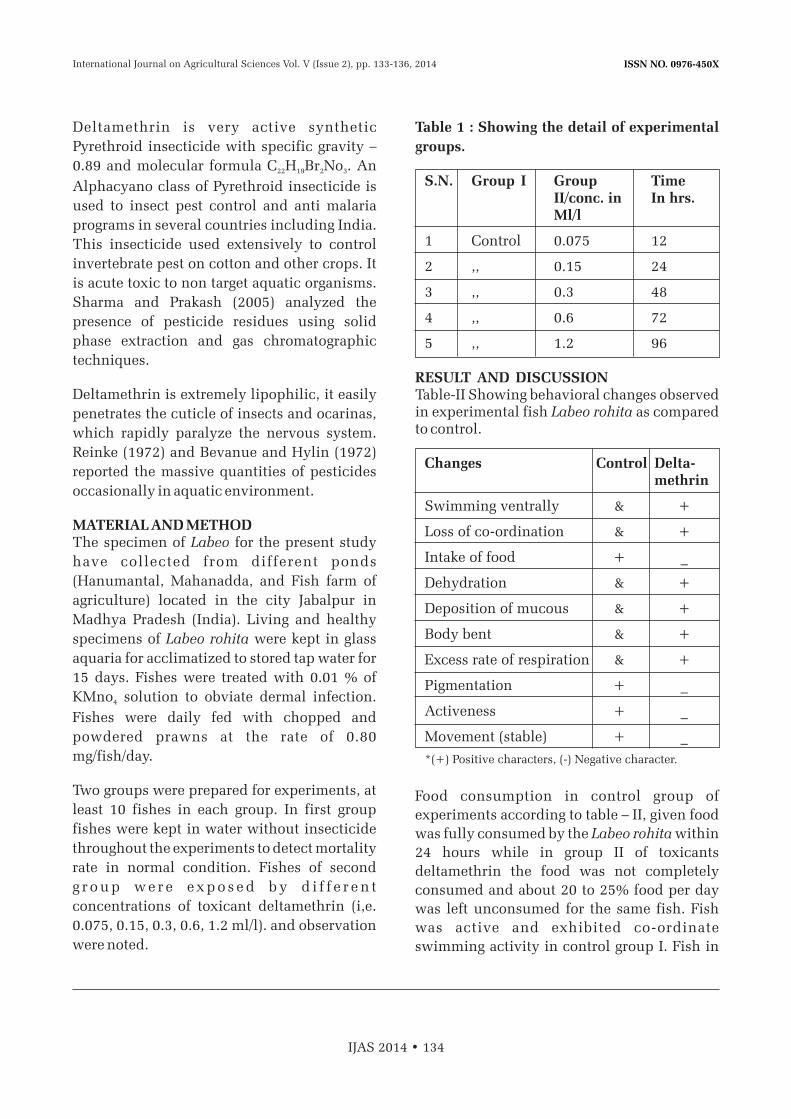
Table 1 : Showing the detail of experimental
groups.
S.N. Group I Group Time II/conc. in In hrs.
Ml/l
1 Control 0.075 12
2 ,, 0.15 24
3 ,, 0.3 48
4 ,, 0.6 72
5 ,, 1.2 96
RESULT AND DISCUSSIONTable-II Showing behavioral changes observed in experimental fish Labeo rohita as compared to control.
Changes Control Delta-methrin
Swimming ventrally & +
Loss of co-ordination & +
Intake of food + _
Dehydration & +
Deposition of mucous & +
Body bent & +
Excess rate of respiration & +
Pigmentation + _
Activeness + _
Movement (stable) + _
*(+) Positive characters, (-) Negative character.
Food consumption in control group of
experiments according to table – II, given food
was fully consumed by the Labeo rohita within
24 hours while in group II of toxicants
deltamethrin the food was not completely
consumed and about 20 to 25% food per day
was left unconsumed for the same fish. Fish
was active and exhibited co-ordinate
swimming activity in control group I. Fish in
IJAS 2014 • 134
International Journal on Agricultural Sciences Vol. V (Issue 2), pp. 133-136, 2014
ISSN NO. 0976-450X
group II with toxicants deltamethrin showed
high gulping rate as against group I of animals.
Sayed and Saad (2007) reported effects of sub
acute concentration (1.46 µg/l) of a Pyrethroid
insecticide, Deltamethrin against the monosex
Nile tilapia Oreochromis niloticus. Except
control fishes, excessive secretion and
deposition of mucous was found on the body of
fishes of experimental group belonging to
group II of toxicant, color of aquaria water
changed to milky white.
After introducing the fish into test solution
copious secretion of the mucous was observed
over the body which might be in response to
irritation caused to the body surface by the
toxicants deltamethrin. Shedding of scales,
dull and faded skin color were also observed.
Relatively increased respiratory activity in the
beginning and reduced later as revealed by
increased and decreased opercular movement
was observed during the early hours of
exposure of the fishes to the toxicant
deltamethrin. Behavioural response of the fish
to a large number of pesticides and pollutants
has been reported by various workers like
Cairns and Scheier (1962), Spraque (1971).
Frequently, definite system of restlessness
were shown by the fishes making frequent
visits to the surface of water to gulp
atmospheric air directly and tried to jump out
of container. Some fishes frequently dashed
against the walls of the container and showed
highly agitated movements, suggesting
impairment of the sense of balance.
Subsequently, fish's activity become
progressively lethargic and they lost their
balance. Ultimately, the fishes sank down to
the bottom of the container and died. Slight
hemorrhage in skin was noted. Remarkable
changes observed were the fast opercular
movements. At the time of death body became
slightly curved showing imbalance in nervous
system. Hyper sensitivity was indicated by
extreme irritability at slightest mechanical
disturbances. Slight damage in pelvic and
caudal fins was noticed. Fins became
transparent and stiff as compared to control
group of fishes, group II of toxicant
deltamethrin , shows swimming ventrally, loss
of co-ordination, no intake of food,
dehydration, lot of secretion of mucous, bent
position of body, excess rate of respiration,
dispigmentation and dullness of scales,
damaging of fins margins etc.
ACKNOWLEDGEMENT I would like to my gratitude to Dr. (Smt.) Pankaj
Shukla, Principal, Govt. M. H. College of HSc.
& Sc. Jabalpur, & Dr. Suneeta Shrivastava,
Head of the Zoology Deptt. of same college to
gave opportunity to do this work. I am
(Arunika Gumasta) also thankful to my Guide
Dr. Shashi Bala Shrivastava to give me
valuable guidence.
REFERENCES1. Bevenue, A. J. N. ogato, and Hylin, J. H.
(1972). Organochlorine pesticides in rain
water oahu Hawaii. Bull. Environ.
Contam.Toxicol.,8: 238 - 241.
2. Cairns, J. and Scheier, A., 1962. The acute
and chronic effects of standard sodium
alkyl benzene sulphonate upon the
pumpkin seed sunfish, Lepomis gibbosus
(Lin) and the blue gills sunfish, L.
macrochirus. Raf. Proc. 17th Ind. Waste
conf. purdue Univ. Engng. Extn. Ser., 112.
:14-28.
3. Effects on river water and salinity of the
toxicity of deltamethrin to fresh water
shrimp, Cladoceran and fish. Research
article Summary (Published 16 Mar 2008).
4. Jhingeran V.G., 1983 Fish and fisheries of
India (New Delhi: Hindustan Publishing
Corporation)pp 1-666.
IJAS 2014 • 135
International Journal on Agricultural Sciences Vol. V (Issue 2), pp. 133-136, 2014
ISSN NO. 0976-450X
5. Sprague, J.B., 1971. Measurement of
pollutant toxicity to fish III Sublethal
effects and safe concentrations. Water
research pergamon press., 5:245-266.
6. Sharma, Niti and Prakash Alka,
Environmental Biotechnology Laboratory,
Department of Zoology Dayalbagh
Educational Institute, Agra, 282005, India
7. Sayed, Y.S. and Saad, T.T. 2007.
Department of Veterinary Forensic
Medicine and Toxicology. Poultry and
Fish disease. Alexandria University,
Egypt.
IJAS 2014 • 136
International Journal on Agricultural Sciences Vol. V (Issue 2), pp. 133-136, 2014

ISSN NO. 0976-450X
QUALITY PARAMETERS, HARVEST INDEX OF HYBRID RICE (Oryza sativa L.) AND ECONOMICS OF VARIOUS TREATMENTS
UNDER VARIOUS LEVELS OF ZINC SULPHATE AND INTEGRATED NUTRIENT MANAGEMENT
Anil Kumar Singh*, Alok Kumar Singh** and Arvind Kumar***
*Tea Board, DTR & DC, A.B. Path, Kurseong-734 203, Darjeeling, West Bengal, India
**Department of Crop Physiology and ***Department of Agricultural Meteorology,Narendra Deva University of Agriculture & Technology,
(Narendra Nagar) Kumarganj-224 229 Faizabad (U.P.), India
INTRODUCTIONTo meet the demands of increasing population
and maintain this self-sufficiency, the present
production level of around 90 million tonnes,
needs to be increased up to 120 million tonnes
by the year 2020. This increase in production
has to be achieved in the backdrop of declining
and deteriorating resource base such as land,
water, labour and other inputs without
adversely affecting the environment. This
indeed appears to be a herculean task, with the
available technological options (Ahmed et al.,
ABSTRACT
The present experiment was conducted during kharif season of 2005-06 and 2006-07 at
Student Instructional Farm of Narendra Deva University of Agriculture and Technology,
Narendra Nagar (Kumarganj), Faizabad, Uttar Pradesh, India. In this study, the quality
parameters, harvest index of hybrid rice (Oryza sativa L.) and economics of various
treatments under various levels of zinc sulphate and integrated nutrient management have
been performed. The quality, harvest index of hybrid rice was higher in the integrated
application of organic (green manuring) and inorganic sources of nutrients as compared to
sole application. The result showed that the maximum protein content, hulling and milling
per cent was observed with 75% of recommended dose of fertilizer + green manure along
with 40 kg zinc sulphate per hectare. Similar trend was observed for net return. Finding of
this study revealed that integrated application of organic with inorganic fertilizers helps in
increasing the quality, harvest index of hybrid rice and increase the net return too.
No. of Pages: 8 No. of Tables: 3 References: 14
Keywords: Hybrid rice, INM, net return, harvest index and protein content.
International Journal on Agricultural Sciences Vol. V (Issue 2), pp. 137-144, 2014
Corresponding author: [email protected]
Research Paper
Received on: 17.02.2014 Revised on: 12.03.2014 Accepted on: 20.04.2014

ISSN NO. 0976-450X
2003). Rice (Oryza sativa L.) is among the most
important staple food crops in the world.
Among the various approaches contemplated
to break the existing yield barriers in rice to
feed the rising population with quality food
stuffs, hybrid rice technology is considered as
one of the promising sustainable and
ecofriendly technologies. To targets and
demands can be well meet and hybrid rice
holds great promise to increase the rice
production.It contributes significantly in
sustaining not only our rice demand but also
global demand. Hybrid rice possess 10 to 15
per cent yield advantage over inbred varieties
due to more vigorous and extensive root
system (Young et al. 1999). Consequences
upon which in hybrid rice, increased growth
rate during vegetative stage (Yamauchi, 1994),
more efficient sink formation, faster rate of
translocation of photosynthates and greater
sink size (Kabaki, 1993) was occurred. The
chemical fertilizer use is not only inadequate
but highly imbalanced also because the use of
fertilizers by the Indian farmers often depends
on its availability and is rarely decided by
recommendation based on soil test values. As
results, the NPK consumption ratio has
become 6.5: 2.5:1 as against accepted optimum
ratio 4:2:1. This erratic fertilizer consumption
ratio hindrance the native soil fertility as well
as other physical, chemical properties of soil.
Integrated nutrient supply involving
conjunctive use of fertilizers, organic sources
of nutrients and bio-fertilizer assumes greater
significance in India mainly due to two
reasons. Firstly, the need for continuous
increase in yield in rice-wheat system requires
the application of still higher amount of
nutrients than used at present. The present
level of fertilizer availability and economic
conditions of large number of farmers do not
permit applying them in quantities adequate
enough to meet the total plant nutrients needs
at the desired level of productivity. Secondly,
the results of several long-term experiments in
different cropping systems revealed that long-
term sustainability of productivity in intensive
cropping system could be achieved only
through integration of inorganic and organic
sources of nutrients.It improves the soil
physical conditions in terms of soil structure,
aggregate stability, soil moisture retention and
hydraulic conductivity as well as chemical
properties of soil such as decreasing soil pH,
ESP increase CEC etc. Such improvements in
soil physical and chemical conditions
contribute to soil fertility and productivity
(Hegde, 1998). Taking these views into
consideration,the present investigation was,
therefore, undertaken to assess the quality
parameters, harvest index of hybrid rice
(Oryza sativa L.) and economics of various
treatments under various levels of zinc
sulphate and integrated nutrient management.
MATERIALS AND METHODSThe present investigation was conducted at
the Student Instructional Farm of Narendra
Deva University of Agriculture and
Technology, Narendra Nagar (Kumarganj),
Faizabad, Uttar Pradesh, India during kharif
(wet) seasons of 2005-06 and 2006-07. The
experimental site falls under subtropical zone
in Indo-Gangetic plains having alluvial soil.
The experimental site lies between 24.4to 0 0
26.56 N latitude and 82.12 to 83.98 E
longitudes with an elevation of about 113 m
from mean sea level. The soil of the
experimental site was sandy loam in texture.
The experimental sites receive, on an average,
about 1200 mm rain annually. About 85% of
the total rainfall is concentrated from mid June
to end of September. The integration of
inorganic fertilizer was done with green
manure. Dhaincha (Sesbani aculeata) crop
was used as green manuring (GM). The
experiment comprising of twenty treatment
combination presented in Table 1. The rice
hybrid variety NDRH-2 was taken as test crop.
IJAS 2014 • 138
International Journal on Agricultural Sciences Vol. V (Issue 2), pp. 137-144, 2014

ISSN NO. 0976-450X
The experiment was laid out in spilt plot
design (SPD) with three replications. Nitrogen,
phosphorus and potash @ 150, 60 and 60 -1
kg ha , respectively were considered as
recommended dose of fertilizers (RDF). One
third of nitrogen and full dose of phosphorus,
potassium and zinc sulphate was applied
through urea, single super phosphate, muriate
of potash and zinc sulphate, respectively, as
per treatment as basal at the time of
transplanting. Remaining two third part of
nitrogen was top dressed into two equal splits;
one at active tillering stage and other at panicle
initiation stage. The samples of rice grain at
harvest stage were analyzed for total N content.
Samples were air dried followed to facilitate
fine grinding. The finally ground material,
passed through 0.4 mm sieve was analyzed.
Modified Kjeldahl's method was followed for
determination of nitrogen content in grains as
described by (Jackson, 1973). The nitrogen
percentage was then multiplied by 6.25
(A.O.A.C., 1970) to obtain crude protein in
hybrid rice grains. Two hundred grams of grain
after threshing, winnowing, cleaning and
drying was taken for de-husking (manually)
IJAS 2014 • 139
Table 1: Treatments
Symbol Treatments
-1T Green manuring + 0 kg zinc sulphate ha1
-1T Green manuring + 10 kg zinc sulphate ha2
-1T Green manuring + 20 kg zinc sulphate ha3
-1T Green manuring + 30 kg zinc sulphate ha4
-1T Green manuring + 40 kg zinc sulphate ha5
-1T 50% RDF + Green manuring + 0 kg zinc sulphate ha6
-1T 50% RDF + Green manuring + 10 kg zinc sulphate ha7
-1T 50% RDF + Green manuring + 20 kg zinc sulphate ha8
-1T 50% RDF + Green manuring + 30 kg zinc sulphate ha9
-1T 50% RDF + Green manuring + 40 kg zinc sulphate ha10
-1T 75% RDF + Green manuring + 0 kg zinc sulphate ha11
-1T 75% RDF + Green manuring + 10 kg zinc sulphate ha12
-1T 75% RDF + Green manuring + 20 kg zinc sulphate ha13
-1T 75% RDF + Green manuring + 30 kg zinc sulphate ha14
-1T 75% RDF + Green manuring + 40 kg zinc sulphate ha15
-1T 100% RDF + 0 kg zinc sulphate ha16
-1T 100% RDF + 10 kg zinc sulphate ha17
-1T 100% RDF + 20 kg zinc sulphate ha18
-1T 100% RDF + 30 kg zinc sulphate ha19
-1T 100% RDF + 40 kg zinc sulphate ha20
International Journal on Agricultural Sciences Vol. V (Issue 2), pp. 137-144, 2014
ISSN NO. 0976-450X
and brown rice thus obtained was weighed and
then hulling percentage was calculated. One
hundred grams of brown rice obtained after
hulling was taken and put to polishing by
removing rice bran, embryo and aleurone layer
manually by sand paper and polished white
kernels thus obtained was weighed and then
milling percentage calculated. Data were
analyzed statistically applying spilt plot
design (SPD) by the method of “Analysis of
Variance” as described by (Gomez and Gomez
1984).
RESULTS AND DISCUSSION
Quality parametersData regarding protein content in grain
presented in Table 2 clearly revealed that
protein content of rice was significantly
affected by various treatment combinations.
The maximum protein content (8.33 and
8.53%) were found under treatment having
75% RDF + GM which was at par with
treatment having 100% RDF and significantly
superior over treatment consisting 50% RDF +
GM and GM alone in 2005 and 2006,
respectively. Zinc levels also affected the
protein content in rice grain. The maximum
protein content (8.21 and 8.36%) was observed -1
with 40 kg zinc sulphate ha which was at par -1with 30 kg zinc sulphate ha and significantly
-1superior over 0, 10 and 20 kg zinc sulphate ha
in 2005 and 2006, respectively. It was noticed
from data that protein content in grain
increased significantly with the treatments
consisting various doses of NPK along with
green manure and zinc sulphate. Protein
content increased because of higher N
utilization by the crop, which enhances the
protein synthesis in plants. It ultimately
increased the protein content in rice grain by
increasing the osmophyllic bodies and
formation of amino acids. The increase in
protein content due to enhancement of N
uptake in these treatments may be due to the
adequate N availability in soil. These results
were in accordance with the findings of
Krishna and Ram (2006). Similarly, Gupta et
al., (2000) also reported that conjunctive use of
chemical fertilizer along with Sesbani
aculeata improve the N content and uptake of
rice crop. Increasing levels of zinc sulphate
significantly improved the protein content in
rice grain. This is due to fact that zinc
enhances the utilization of nitrogen, resulting
increase in N content. Application of zinc
appreciably improved seed quality by
improving protein content in the seed.
Improved N content with increase in levels of
zinc in rice was also reported by Mali and
Shaikh (1994). Data regarding hulling and
milling percent have been presented in table
4 and 5 indicate that hulling percentage
significantly influenced by various treatment
combination. Maximum hulling percent
(76.28 and 76.39%) was recorded with
treatment 75% RDF + GM which was at par
with treatments having 100 % RDF and 50%
RDF + GM and significantly superior over GM
alone in both the years. Result further
indicates that zinc levels had also affected the
hulling percent of rice. Maximum hulling
percent (77.10 and 77.21%) was found with 40 -1
kg zinc sulphate ha which was at par with 30 -1kg zinc sulphate ha and significantly superior
-1over 0, 10 and 20 kg zinc sulphate ha . Similar
trend was observed for milling percentage.The
hulling and milling percent have been
influenced considerably by combined use of
fertilizer, green manure and zinc than
inorganic alone. The maximum hulling and
milling percent were observed with 75% RDF -1
+ GM along with 40 kg zinc sulphate ha ,
while minimum hulling and milling percent
were recorded with green manuring alone. It
is due to the balanced application of nutrients
which improved grain quality of rice. These
IJAS 2014 • 140
International Journal on Agricultural Sciences Vol. V (Issue 2), pp. 137-144, 2014
ISSN NO. 0976-450X
results corroborate with the findings of Krishna
and Ram (2006).
Harvest IndexData regarding harvest index presented in the
table 2 showed positive effect of different
treatments combinations. Critical examination
of data revealed that maximum harvest index
(44.29) was recorded with 75% RDF + GM
which was at par 100% RDF and statistically
better than 50% RDF + GM and GM alone in
2005, while in the year 2006 maximum harvest
index (44.24) was recorded with treatment
having 75% RDF + GM which was at par with
100% RDF and 50% RDF + GM and
significantly better than treatment GM alone.
Non-significant variations in the harvest index
due to levels of zinc had been recorded in both
the years of experiment. It is obvious that
harvest index of crop was affected by the
various treatment combinations. The maximum
harvest index was noticed under treatment
consisting 75% RDF + GM 40 kg zinc sulphate -1
ha . Highest harvest index in green manure plot
along with chemical fertilizer was mainly due to
higher grain yield. This may be due to
translocation of photosynthates from vegetative
parts to grain which increases the proportion of
grain yield in total biological yield, ultimately
increase the harvest index of the crop. Due to
better physical and chemical properties of soil
and availability of nutrient in soil increased
IJAS 2014 • 141
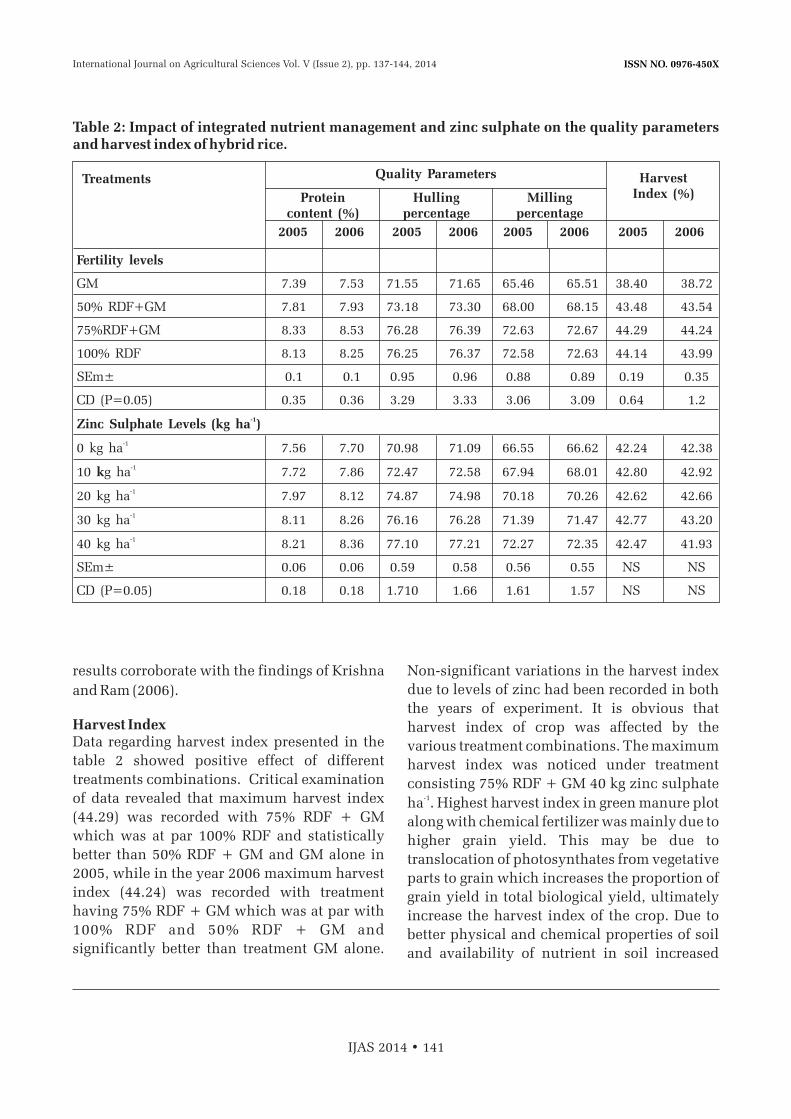
Table 2: Impact of integrated nutrient management and zinc sulphate on the quality parameters and harvest index of hybrid rice.
Fertility levels
GM 7.39 7.53 71.55 71.65 65.46 65.51 38.40 38.72
50% RDF+GM 7.81 7.93 73.18 73.30 68.00 68.15 43.48 43.54
75%RDF+GM 8.33 8.53 76.28 76.39 72.63 72.67 44.29 44.24
100% RDF 8.13 8.25 76.25 76.37 72.58 72.63 44.14 43.99
SEm± 0.1 0.1 0.95 0.96 0.88 0.89 0.19 0.35
CD (P=0.05) 0.35 0.36 3.29 3.33 3.06 3.09 0.64 1.2
-1Zinc Sulphate Levels (kg ha )
-10 kg ha 7.56 7.70 70.98 71.09 66.55 66.62 42.24 42.38
-110 kg ha 7.72 7.86 72.47 72.58 67.94 68.01 42.80 42.92
-120 kg ha 7.97 8.12 74.87 74.98 70.18 70.26 42.62 42.66
-130 kg ha 8.11 8.26 76.16 76.28 71.39 71.47 42.77 43.20
-140 kg ha 8.21 8.36 77.10 77.21 72.27 72.35 42.47 41.93
SEm± 0.06 0.06 0.59 0.58 0.56 0.55 NS NS
CD (P=0.05) 0.18 0.18 1.710 1.66 1.61 1.57 NS NS
Treatments Quality Parameters
Protein content (%)
2005 2005 2005 20052006 2006 2006 2006
Hullingpercentage
Milling percentage
Harvest Index (%)
International Journal on Agricultural Sciences Vol. V (Issue 2), pp. 137-144, 2014

ISSN NO. 0976-450X
ultimately increase the nutrient absorption by
plant results more grain yield. These results
corroborates with the findings of Senger et al.
(2000).
Economics of the treatmentsThe economics of different treatment
combinations have been presented in table 3. It
was worked out on the basis of input and output
analysis. Result obviously showed that the cost
of cultivation varied mainly due to wide
difference in the recommended dose of
fertilizer, green manure and levels of zinc
sulphate. Maximum total cost of cultivation -1(Rs. 16818 ha ) was computed under the
treatment having 75 % RDF + GM with 40 kg
-1zinc sulphate ha . Minimum cost of cultivation -1(Rs. 13330 ha ) was recorded with GM without
zinc sulphate. However, maximum gross -1income (Rs. 41909 and 43101 ha ) were
recorded under the treatment having 75 % RDF -1
+ GM with 40 kg zinc sulphate ha , while
minimum gross income (Rs 19575 and 20345 -1
ha ) were recorded in treatment receiving green
manure without zinc sulphate in the year 2005
and 2006, respectively. Whereas highest net -1
return (Rs 25091 and 26283ha ) was recorded
under plots having 75% RDF + GM with 40 kg -1
zinc sulphateha followed by treatment having -175 % RDF + GM with 30 kg zinc sulphate ha in
which Rs 24968 and 26146 were computed in
Table 3: Impact of INM on Cost of cultivation, Gross income, Net income and B: C ratio of various treatment combinations
T 13330 19575 20345 6245 7015 0.47 0.531
T 13580 22455 23338 8875 9758 0.65 0.722
T 13830 24870 25855 11040 12025 0.80 0.873
T 14080 26804 27877 12724 13797 0.90 0.984
T 14330 27049 28128 12719 13798 0.89 0.965
T 15024 27668 28314 12645 13291 0.84 0.886
T 15274 31197 31936 15923 16663 1.04 1.097
T 15524 34739 35562 19215 20038 1.24 1.298
T 15774 37439 38324 21666 22551 1.37 1.439
T 16024 37619 38512 21596 22488 1.35 1.4010
T 15818 30558 31424 14740 15606 0.93 0.9911
T 16068 34276 35247 18207 19179 1.13 1.1912
T 16318 38001 39074 21683 22756 1.13 1.3913
T 16568 41536 42714 24968 26146 1.51 1.5814
T 16818 41909 43101 25091 26283 1.49 1.5615
T 15028 28198 28893 13170 13866 0.88 0.9216
T 15278 32351 33146 17074 17868 1.12 1.1717
T 15528 35330 36204 19803 20676 1.28 1.3318
T 15778 38968 39864 23190 24086 1.47 1.5319
T 16028 39166 40199 23139 24172 1.44 1.5120
Treatment Cost of cultivation
Gross income
2005 2005 20052006 2006 2006
Net income B:C ratio
IJAS 2014 • 142
International Journal on Agricultural Sciences Vol. V (Issue 2), pp. 137-144, 2014

ISSN NO. 0976-450X
2005 and 2006, respectively. Maximum
benefit: cost ratio (1.51 and 1.58) was
computed with treatment receiving 75 % RDF -1+ GM with 30 kg zinc sulphate ha , followed
by treatment having 75% RDF + GM with 40 kg -1zinc sulphate ha in both the years,
respectively. In respect to economic feasibility -
the highest net return (Rs. 25091 and 26283 ha1) was computed under the treatment receiving
-175% RDF+GM with 40 kg zinc sulphate ha in
respective years. However, highest benefit cost
ratio (1.51 and 1.58) was found in treatment -175% RDF + GM with 30 kg zinc sulphate ha .
The net return and benefit cost ratio increased
due to low cost of cultivation and higher yield
of rice crop under treatment having combined
application of organic and inorganic fertilizer.
Similar result was also reported by Verma and
Acharya (2004).
CONCLUSIONThe findings presented in this study reveal
some distinct benefit of integrated use of
organic and inorganic fertilizer. This is not
only increased the net return but also improve
the quality and harvest index of the crop. It is
possible that by supplying nutrients to the
plant in an integrated way, the use of fossil fuel
based inorganic fertilizer can be reduced
which in turn, can reduce the risk of fertilizer
related environmental consequences (Anon,
1997). The best part is that the practice will
suit the cash poor small and marginal farmers
of the state (Modgal, 2000).
REFERENCE1. A.O.A.C.,1970. Association of official
analytical chemists.Official method of
analysis, P.O. Box. 540. Benjamin Franklin
station, Washington- 4 DC.
2. Ahmed, M. I.; Viraktamath, B.C.;
Ramesha, M.S.;Vijayakumar, C.N.M. and
Mishra, B., 2003. Hybrid rice in India.
Directorate of Rice Research, Hyderabad,
India, p3-4.
3. Anon . , 1997 . A gu ide to f i e ld
implementation of integrated plant
nutrition system.IFFCO, New Delhi,
India, p.106.
4. Gomez, KA, Gomez AA. 1984. Statistical
procedures for Agricultural Research, Ed.
J. John Wiley and Sons. Inc. USA.
5. Gupta, C., Lal, P., Bisht, P.S. and Pandey,
P.C., 2000. Integrated organic and organic
N management in lowland rice.Oryza, 37
(2): 20-30.
6. Hegde , D .M. , 1998 . Long t e rm
sustainability of productivity in rice
(Oryza sativa) wheat (Triticum aestivum)
system in sub humid ecosystem through
integrated nutrient supply. Indian J. of
Agron. 43 (2): 189-198.
7. Jackson M.L., 1973. Soil chemical
analysis, Prentice Hall of India, Pvt. Ltd.
New Delhi.
8. Kabaki, N., 1993. Growth and yield of
Japonica-indica hybrid rice.Japan Agril.
Res. 27: 87-94.
9. Krishna, D. and Ram, S., 2006. Long term
impact of organic and inorganic
fertilization on grain yield and quality of
rice (Oryza sativa L.) in mollisol of tarai.
Intl. J. Agric. Sci., 02 (1): 61-63.
10. Modgal, S.C., 2000. Balance nutrition for
sustainable high crop yield in Uttar
Pradesh. Proceeding of workshop held on
May 10, at Krishi Bhawan, Lucknow, Uttar
Pradesh, India.
11. Sengar, S.S.; Wade, L.J.; Baghel, S.S.;
Singh, R.K. and Singh, G., 2000. Effect of
nutrient management on rice in rainfed
lowland o f sou th eas t Madhya
Pradesh.Indian J. Agron., 45 (2): 315-322.
IJAS 2014 • 143
International Journal on Agricultural Sciences Vol. V (Issue 2), pp. 137-144, 2014

ISSN NO. 0976-450X
12. Verma, M.L. and Acharya, C.L., 2004. Soil
moisture conservation, hydrothermal
requires nitrogen uptake and field of
rainfed wheat as affected by soil
management practices and nitrogen level.
J. Indian Soc. Soil Sci. 52 (1): 69-73.
13. Yamauchi, M., 1994. Physiological bases
of higher yield potential in F-1 hybrid.
JRRN: 71-80.
14. Young, Zian Chang; Su, Bao Lin; Wang,
Zhi Qin; Long, You Zhong; Zhu, Qing,
Sen; Yang, J.C., Su, B.L.; Wang, Z.Q.l
Long, Y.Z.; Zhu, A.S. and Lu, FelJia., 1999.
Characteristics and physiology of grain
filling in inter sub specific hybrid rice,
Chinese Agril. Sci., 61-70.
IJAS 2014 • 144
International Journal on Agricultural Sciences Vol. V (Issue 2), pp. 137-144, 2014

ISSN NO. 0976-450X
BIOCHEMICAL PARAMETERS IN RELATION TO POWDERY MILDEW RESISTANCE IN BLACK GRAM
1 2Channaveeresh, T.S . and Shripad Kulkarni
1Department of Plant Pathology,
University of Agricultural Sciences, Dharwad-580 005, India2Department of Plant Pathology,
Institute of Organic Farming, University of Agricultural Sciences, Dharwad
INTRODUCTIONBlack gram (Vigna mungo (L.) Hepper) is one of
the most important pulse crops of Fabaceae. The
lower productivity of black gram is mainly
attributed to low genetic yield potentiality,
indeterminate growth habi t , canopy
architecture, low partitioning efficiency,
cultivation in marginal land and due to biotic
and abiotic stresses. Among biotic stresses
powdery mildew, cercospora leaf spot,
anthracnose and mungbean yellow mosaic
virus (MYMV) are the major diseases of black
gram. The reduction in photosynthetic activity
and physiological changes are considerable,
which lead to potential decrease in yield (40-
90%) due to powdery mildew infection.
ABSTRACT
Powdery mildew caused by Erysiphe polygoni DC is one of the major constraints in the
production of black gram. In order to know the biochemical compositions such as
cholorophyll, sugars and phenol content of both healthy and diseased leaf carried out in
resistant(LBG-17) and susceptible(TAU-1) cultivars. A healthy leaf of resistant cultivar LBG-
17 had more amount of total chlorophyll (3.2 mg/g) than diseased leaf (2.57 mg/g). Whereas,
it was drastically reduced in susceptible variety TAU-1 from 2.46 mg/g to 1.83 mg/g. The
amount of total sugars in healthy leaves of susceptible variety TAU-1 (15.68 mg/g) was less
compared to diseased leaves (23.74 mg/g). In resistant cultivar LBG-17, the amount of total
sugars in healthy leaves (7.96 mg/g) was less than diseased leaves (11.36 mg/g). Initially
healthy leaves of susceptible variety (TAU-1) had 5.70 mg/g of total phenols and it was
increased to 7.63 mg/g after infection by E. polygoni. Whereas, healthy leaves of resistant
cultivar LBG-17 had 8.34 mg/g of total phenols and it was increased to 16.78 mg/g in
diseased leaves.
No. of Pages: 5 No. of Tables: 1 References: 13
Keywords: Powdery mildew, Erysiphe polygoni, Biochemical and resistance.
International Journal on Agricultural Sciences Vol. V (Issue 2), pp. 145-149, 2014
Corresponding author: [email protected]
Research Article
Received on: 18.03.2014 Revised on: 25.03.2014 Accepted on: 28.04.2014
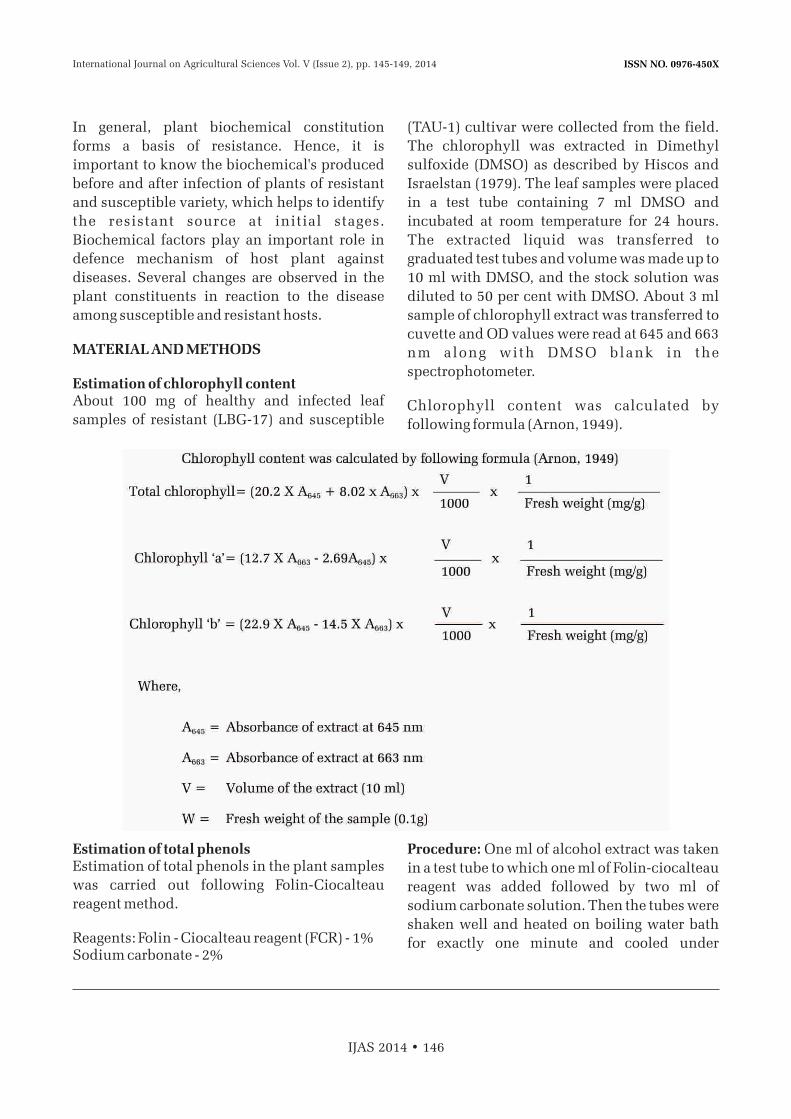
ISSN NO. 0976-450X
In general, plant biochemical constitution
forms a basis of resistance. Hence, it is
important to know the biochemical's produced
before and after infection of plants of resistant
and susceptible variety, which helps to identify
the resistant source at initial stages.
Biochemical factors play an important role in
defence mechanism of host plant against
diseases. Several changes are observed in the
plant constituents in reaction to the disease
among susceptible and resistant hosts.
MATERIAL AND METHODS
Estimation of chlorophyll contentAbout 100 mg of healthy and infected leaf
samples of resistant (LBG-17) and susceptible
(TAU-1) cultivar were collected from the field.
The chlorophyll was extracted in Dimethyl
sulfoxide (DMSO) as described by Hiscos and
Israelstan (1979). The leaf samples were placed
in a test tube containing 7 ml DMSO and
incubated at room temperature for 24 hours.
The extracted liquid was transferred to
graduated test tubes and volume was made up to
10 ml with DMSO, and the stock solution was
diluted to 50 per cent with DMSO. About 3 ml
sample of chlorophyll extract was transferred to
cuvette and OD values were read at 645 and 663
nm along with DMSO blank in the
spectrophotometer.
Chlorophyll content was calculated by
following formula (Arnon, 1949).
IJAS 2014 • 146
Estimation of total phenols Estimation of total phenols in the plant samples
was carried out following Folin-Ciocalteau
reagent method.
Reagents: Folin - Ciocalteau reagent (FCR) - 1%Sodium carbonate - 2%
Procedure: One ml of alcohol extract was taken
in a test tube to which one ml of Folin-ciocalteau
reagent was added followed by two ml of
sodium carbonate solution. Then the tubes were
shaken well and heated on boiling water bath
for exactly one minute and cooled under
International Journal on Agricultural Sciences Vol. V (Issue 2), pp. 145-149, 2014
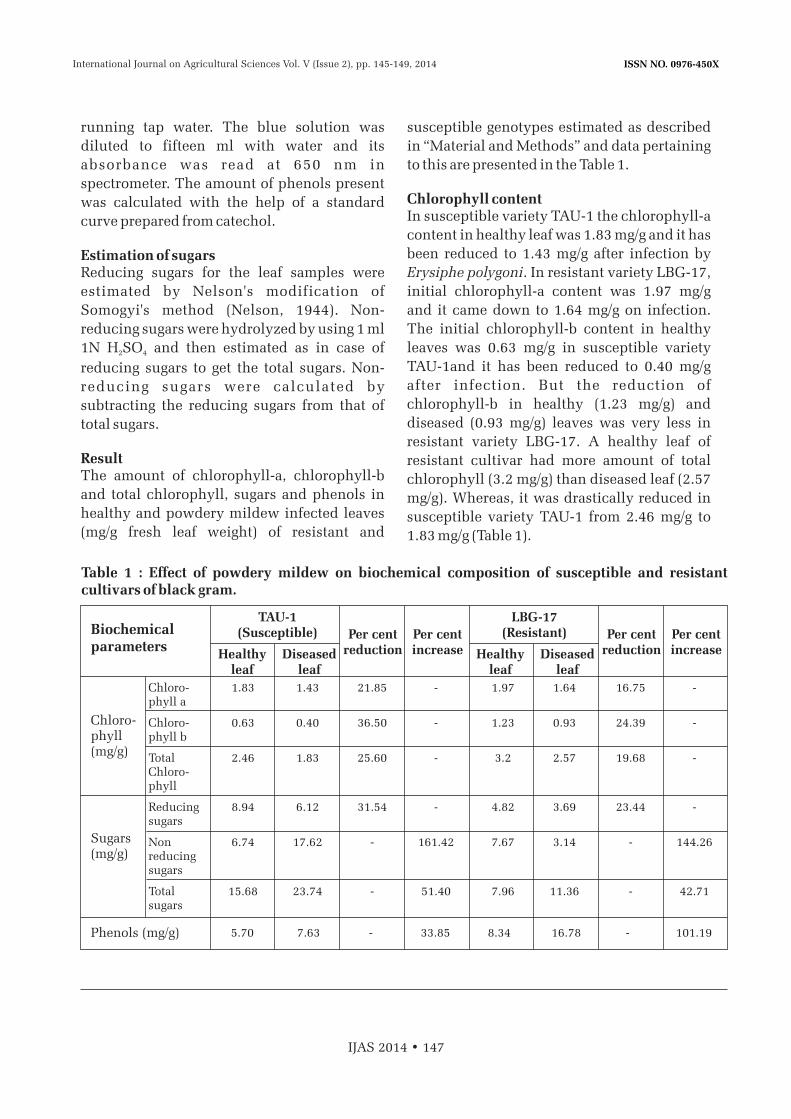
ISSN NO. 0976-450X
running tap water. The blue solution was
diluted to fifteen ml with water and its
absorbance was read at 650 nm in
spectrometer. The amount of phenols present
was calculated with the help of a standard
curve prepared from catechol.
Estimation of sugars Reducing sugars for the leaf samples were
estimated by Nelson's modification of
Somogyi's method (Nelson, 1944). Non-
reducing sugars were hydrolyzed by using 1 ml
1N H SO and then estimated as in case of 2 4
reducing sugars to get the total sugars. Non-
reducing sugars were calculated by
subtracting the reducing sugars from that of
total sugars.
ResultThe amount of chlorophyll-a, chlorophyll-b
and total chlorophyll, sugars and phenols in
healthy and powdery mildew infected leaves
(mg/g fresh leaf weight) of resistant and
susceptible genotypes estimated as described
in “Material and Methods” and data pertaining
to this are presented in the Table 1.
Chlorophyll contentIn susceptible variety TAU-1 the chlorophyll-a
content in healthy leaf was 1.83 mg/g and it has
been reduced to 1.43 mg/g after infection by
Erysiphe polygoni. In resistant variety LBG-17,
initial chlorophyll-a content was 1.97 mg/g
and it came down to 1.64 mg/g on infection.
The initial chlorophyll-b content in healthy
leaves was 0.63 mg/g in susceptible variety
TAU-1and it has been reduced to 0.40 mg/g
after infection. But the reduction of
chlorophyll-b in healthy (1.23 mg/g) and
diseased (0.93 mg/g) leaves was very less in
resistant variety LBG-17. A healthy leaf of
resistant cultivar had more amount of total
chlorophyll (3.2 mg/g) than diseased leaf (2.57
mg/g). Whereas, it was drastically reduced in
susceptible variety TAU-1 from 2.46 mg/g to
1.83 mg/g (Table 1).
IJAS 2014 • 147
Table 1 : Effect of powdery mildew on biochemical composition of susceptible and resistant cultivars of black gram.
Chloro- 1.83 1.43 21.85 - 1.97 1.64 16.75 -phyll a
Chloro- 0.63 0.40 36.50 - 1.23 0.93 24.39 -phyll b
Total 2.46 1.83 25.60 - 3.2 2.57 19.68 -Chloro-phyll
Reducing 8.94 6.12 31.54 - 4.82 3.69 23.44 -sugars
Non 6.74 17.62 - 161.42 7.67 3.14 - 144.26reducing sugars
Total 15.68 23.74 - 51.40 7.96 11.36 - 42.71sugars
Biochemical parameters
Chloro-phyll(mg/g)
Sugars(mg/g)
Phenols (mg/g)
TAU-1(Susceptible)
Healthyleaf
Healthyleaf
Per centreduction
Per centreductionDiseased
leafDiseased
leaf
Per centincrease
Per centincrease
LBG-17(Resistant)
5.70 7.63 - 33.85 8.34 16.78 - 101.19
International Journal on Agricultural Sciences Vol. V (Issue 2), pp. 145-149, 2014
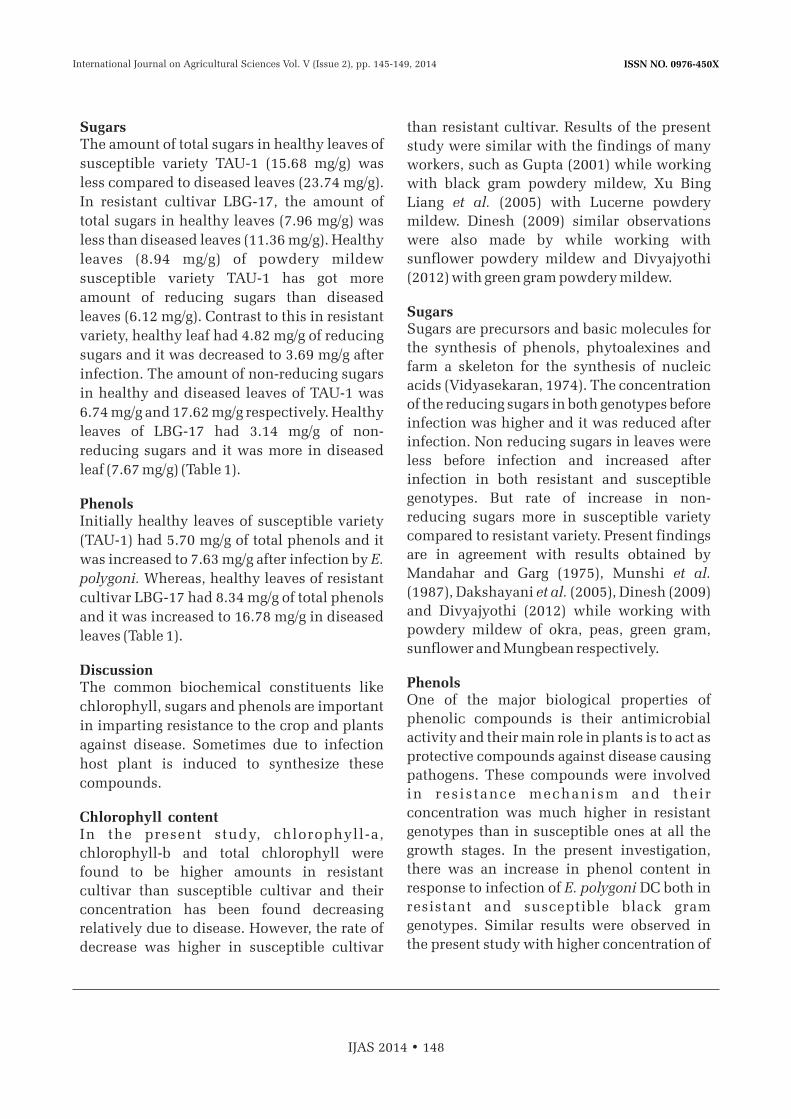
ISSN NO. 0976-450X
SugarsThe amount of total sugars in healthy leaves of
susceptible variety TAU-1 (15.68 mg/g) was
less compared to diseased leaves (23.74 mg/g).
In resistant cultivar LBG-17, the amount of
total sugars in healthy leaves (7.96 mg/g) was
less than diseased leaves (11.36 mg/g). Healthy
leaves (8.94 mg/g) of powdery mildew
susceptible variety TAU-1 has got more
amount of reducing sugars than diseased
leaves (6.12 mg/g). Contrast to this in resistant
variety, healthy leaf had 4.82 mg/g of reducing
sugars and it was decreased to 3.69 mg/g after
infection. The amount of non-reducing sugars
in healthy and diseased leaves of TAU-1 was
6.74 mg/g and 17.62 mg/g respectively. Healthy
leaves of LBG-17 had 3.14 mg/g of non-
reducing sugars and it was more in diseased
leaf (7.67 mg/g) (Table 1).
PhenolsInitially healthy leaves of susceptible variety
(TAU-1) had 5.70 mg/g of total phenols and it
was increased to 7.63 mg/g after infection by E.
polygoni. Whereas, healthy leaves of resistant
cultivar LBG-17 had 8.34 mg/g of total phenols
and it was increased to 16.78 mg/g in diseased
leaves (Table 1).
DiscussionThe common biochemical constituents like
chlorophyll, sugars and phenols are important
in imparting resistance to the crop and plants
against disease. Sometimes due to infection
host plant is induced to synthesize these
compounds.
Chlorophyll contentIn the present study, chlorophyll-a,
chlorophyll-b and total chlorophyll were
found to be higher amounts in resistant
cultivar than susceptible cultivar and their
concentration has been found decreasing
relatively due to disease. However, the rate of
decrease was higher in susceptible cultivar
than resistant cultivar. Results of the present
study were similar with the findings of many
workers, such as Gupta (2001) while working
with black gram powdery mildew, Xu Bing
Liang et al. (2005) with Lucerne powdery
mildew. Dinesh (2009) similar observations
were also made by while working with
sunflower powdery mildew and Divyajyothi
(2012) with green gram powdery mildew.
SugarsSugars are precursors and basic molecules for
the synthesis of phenols, phytoalexines and
farm a skeleton for the synthesis of nucleic
acids (Vidyasekaran, 1974). The concentration
of the reducing sugars in both genotypes before
infection was higher and it was reduced after
infection. Non reducing sugars in leaves were
less before infection and increased after
infection in both resistant and susceptible
genotypes. But rate of increase in non-
reducing sugars more in susceptible variety
compared to resistant variety. Present findings
are in agreement with results obtained by
Mandahar and Garg (1975), Munshi et al.
(1987), Dakshayani et al. (2005), Dinesh (2009)
and Divyajyothi (2012) while working with
powdery mildew of okra, peas, green gram,
sunflower and Mungbean respectively.
PhenolsOne of the major biological properties of
phenolic compounds is their antimicrobial
activity and their main role in plants is to act as
protective compounds against disease causing
pathogens. These compounds were involved
in resistance mechanism and their
concentration was much higher in resistant
genotypes than in susceptible ones at all the
growth stages. In the present investigation,
there was an increase in phenol content in
response to infection of E. polygoni DC both in
resistant and susceptible black gram
genotypes. Similar results were observed in
the present study with higher concentration of
IJAS 2014 • 148
International Journal on Agricultural Sciences Vol. V (Issue 2), pp. 145-149, 2014

ISSN NO. 0976-450X
phenolic compounds in resistant cultivars
than susceptible cultivars of black gram plants
(Saini et al., 1988) and also agreement with
results obtained by Avtar et al. (2003), Dinesh
(2009) and Divyajyothi (2012) while working
with powdery mildew of fenugreek, sunflower
and Mungbean respectively.
CONCLUSIONThe chlorophyll content was found to decrease
due to infection of E. polygoni and the rate of
decrease was more in susceptible (25.60%)
variety than resistant cultivar (19.80%).
Increase in phenol content in leaves of
resistant genotype was more (8.34 mg/g to
16.78 mg/g) after infection than the susceptible
genotype (5.70 mg/g to 7.63 mg/g). The total
sugar content was more in highly susceptible
genotype than resistant genotype both before
and after infection. Reduction in reducing
sugar was observed in both the genotypes after
infection whereas content of non-reducing
sugar increased after infection.
REFERENCES1. Arnon, D. I., 1949, Copper enzyme
isolated chloroplasts, polyphenol oxidase
in Beta vulgaris. Physiol., 24 : 1-15.
2. Avtar, R., Rathi, A. S., Jatasra, D. S. and
Joshi, U. N., 2003, Changes in phenolics
and some oxidative enzymes in fenugreek
leaves due to powdery mildew infection.
Acta Phytopathologica et Entomologica
Hungarica, 38(3/4) : 237-244.
3. Dakshayani, R., Mummigatti, U. V.,
Srikant Kulkarni and Ravikumar, R. L.,
2005, Screening green gram genotypes for
powdery mildew using biochemical
parameters. Karnataka J. Agric. Sci., 18(2) :
500-502.
4. Dinesh, B, M., 2009, Studies on powdery
mildew of sunflower caused by Erysiphe
cichorocearum DC., M. Sc (Agri) Thesis,
Univ. Agri. Sci., Dharwad (India).
5. Divyjyothi, U., 2012, Epidemiology and
management of powdery mildew of
greengram caused by Erysiphe polygoni
DC., M. Sc (Agri) Thesis, Univ. Agri. Sci.,
Dharwad (India).
6. Gupta, V, R., 2001, Studies on powdery mildew of green gram, black gram and pea caused by Erysiphe polygoni DC. Ph. D., Thesis, Dr. P. D. K. V. Akola (India).
7. Hiscos, J. D. and Israelstan, G. F., 1979, A method for extraction of chlorophyll from leaf tissue without maceration. Candian J. Bot., 57 : 1330-1334.
8. Mandahar, C. L. and Garg, I. D., 1975, Carbohydrates and movement of photosynthate in powdery mildew infected okra leaves. Indian J. Mycol. Pl. Pathol., 5(1) : 3-4.
9. Munshi, G. D., Jhooty, J. S. and Bajaj, K. L., 1987, Basis of resistance in peas to powdery mildew caused by Erysiphe polygoni. Indian J. Mycol. Pl. Pathol., 17 : 280-283.
10. Nelson, N., 1944, A photometric adaptation of Somogyi method for determination of glucose. J. Biolog. Chem., 153 : 375-378.
11. Saini, R. S., Arira. Y. K., Chawla, H. K. L. and Wagle, D. S., 1988, Total phenols and sugars content in wheat cultivars resistant and susceptible to Ustilago nuda (Jens.) Rostrep. Biochemic and Physiologie Der Pflazen, 183 : 89-93.
12. Vidaysekaran. P., 1974, Possible role of suga r s in r e s t r i c t ion o f l e s ion development in finger millet leaves infected by Helminthosporium tetromera. Physiological Plant Pathol., 04 : 457.
13. Xu Bing Liang, Li Min Quan, Yu Ji Hua and
Xing Hui Qin, 2005, Correlation between
chlorophyll content and resistance to
powdery mildew (E. polygoni) in lucerne.
Pratacultural Sci., 22(4) : 72-74.
IJAS 2014 • 149
International Journal on Agricultural Sciences Vol. V (Issue 2), pp. 145-149, 2014

ISSN NO. 0976-450X
IJAS 2014 • 150

ISSN NO. 0976-450X
FAMILY AND GENDER BIASES REGARDING PARTICIPATORY ACTIVITIES OF CHILDREN IN RURAL HARYANA
Jatesh Kathpalia, Rashmi Tyagi and Savita Vermani
Department of Sociology, College of Basic Sciences & HumanitiesCCS Haryana Agricultural University, Hisar-125 004, Haryana, India
INTRODUCTIONIn India, discriminatory attitude towards men
and women have existed for generations and
affect the lives of both genders. Although the
Constitution of India has granted men and
women equal rights, gender disparity still
remains. From childhood, girls are encouraged
to take the traditional female roles. Women have
no say in money matters and in most of the
families, women even did not know the source
ABSTRACT
In India, the female is facing biases right from the beginning. Gender biases do not stop in
family of orientation, where the female grows up but also continue in the family of
procreation where she gets married or establishes a long-term partnership. The attainment
of higher literacy rate and performance of different roles depends not only on the existence
of facilities and opportunities but also on attitude and efforts of their families. The
preference for boy in society is so strong that many women choose to abort rather than give
birth to a girl. The United Nations World Population Fund indicated that India has one of
the highest sex imbalances in the world. According to Census 2011, child sex ratio is just
930 girls per 1000 boys and in Haryana it is 877 females per thousand males. So a study
was undertaken among 100 rural women of Haryana to know the role of family and gender
biasness regarding participatory activities of children and its associated factors influencing
the participation.
Results revealed that in majority of the respondents, gender bias was there regarding
participation in different activities of their children. They provided better educational facilities
to their sons and simultaneously limiting the occupational choice for daughters. This gender
biasness would be an obstacle to the progress and improvement of status of women. Therefore,
family is the foundation stone for overall development of personality of the children.
No. of Pages: 8 No. of Tables: 3 References: 12
Keywords: Education, family, gender-bias, participation.
International Journal on Agricultural Sciences Vol. V (Issue 2), pp. 151-158, 2014
Corresponding author: [email protected]
Research Paper
Received on: 19.03.2014 Revised on: 31.03.2014 Accepted on: 30.04.2014

ISSN NO. 0976-450X
of income and the expenditure of the family.
Another important social value leading to
discrimination is that daughters are
considered “Paraya Dhan”and investment in
their studies as they are not to benefit the
fami ly. They become v ic t ims o f a
discrimination socialization process. When a
girl grows up a bit, she has to take care of
younger siblings, collect fuel, fetch water and
even to cook food. In other words, the girl's
child labour begins at home itself and her
family is the first to exploit her. Whenever,
there is any talk of women in development at
the national or international level, a very
important statistics which is often quoted to
show the fact that economic development does
not guarantee improvement in the status of
women in sex-ratio of India's economically
highly developed states viz. Haryana and
Punjab. Sex ratio (number of females per
thousand males in population) is an important
indicator which is taken as a measure of the
extent of gender equity prevailing in any
society at any given time. In India, sex ratio has
remained unfavourable to women throughout
the last centuries. Demographers warn that
there will be a shortage of brides in the next 20
years, due to female foeticide, one of the major
consequences of gender biasness and
surprisingly by the family members.
The 2011 Census data presented very gloomy
scene for the child sex ratio. The sex ratio crisis
was comparatively higher in rural areas than
urban areas. While the child sex ratio in rural
India declined from 934 per 1000 in 2001 to
923 per 1000 in 2011, urban area reported a
decline from 906 per 1000 in 2001 to 905 per
1000 in 2011. Such skewed distribution of the
child sex ratio in India has been largely
attributed to the acute son preference
prevailing in the country. Across several parts
of India, sons add to the family's upward social
mobility by being potential 'Dowry earners'
and also are endowed with certain
cultural/religious rights (Samiyar, 2008). The
socio-cultural practices of women vulnerable
in the family of marriage and this lower her
access to resources both within the household
and at the societal level (Kaur, 2004).
The extreme form of devaluation of women
had been the practice of female infanticide.
Nearly 10 million female foetuses have been
aborted in the country over the past two
decades. Arnold et al. (2001) reported the use
of amniocentesis for sex selection of children
in Gujarat, Haryana and Punjab. They reported
that there are 1.30 million induced abortions
in India every year of which over one lakh are
sex selective abortions following an
ultrasound/amniocentesis test. In Haryana,
sex ratio of lowest of all the states (Census of
India, 2011). Though the practice of female
infanticide has become a thing of the past; after
coming into force, the Pre-natal Diagnostic
Technique Act (PNDT) 1996, yet the neglect of
the female child and limited access to female
child to health, nutrition, education and
medical care still continue.
Family is the most important social institution
of any society which plays an important role
regarding participation of their children in
different activities like in education, decision-
making, occupational choices, economic
matters etc. Family is the key force in gender
socialization and primary children for later
social roles including the choices they make
for their children, while gender is determined
by the conception of activities, tasks, functions
and roles attributed to women and society and
in public and private life. In rural areas,
educating a girl would mean an indirect loss of
earnings, non-availability of girl child for
household work . Haryana, be ing a
predominantly peasant society, preferences for
sons for doing agriculture especially
ploughing is clearly evident for gender
discrimination in traditional society.
IJAS 2014 • 152
International Journal on Agricultural Sciences Vol. V (Issue 2), pp. 151-158, 2014

ISSN NO. 0976-450X
With this background, the present study was
conducted in the year 2012-13 to know the role
of family members and gender bias regarding
participatory activities of children in rural
Haryana.
MATERIALS AND METHODSThe study was conducted in Hisar district of
Haryana state during the year 2012-13. From
Hisar district, block-I was selected randomly.
From this block, two villages were selected viz.
Kaimri and Mangali. From each of the selected
villages, 50 mothers were taken purposively
having both male and female school/college
going children. Thus sample size for the
present study was 100 mother respondents.
Primary as well as secondary data was
collected for the study. Data was collected on
the basis of structured interview schedule,
along with interview schedule, observations
regarding biased behaviour during the
discussion with the respondents were also
recorded and were incorporated while writing
the results and discussion. Collected data was
subjected to simple statistical analysis in terms
of two way frequency tables and percentages
for making interpretations.
RESULTS AND DISCUSSIONA study of socio-economic profile of the
respondents is very important as within each
class, there is constellation of specific life style
factors and that tend to distinguish members of
each family/class from the members of all
other families/classes. Data on socio-economic
profile of the respondents revealed that
maximum number of the respondents (55%)
were from young age group (20-30 years)
followed by 34 per cent from middle age group
i.e. between 31-40 years of age and remaining
11 per cent were from above 40 years of age.
Half of the respondents were educated upto
primary and remaining 34 per cent and 16 per
cent were illiterate and educated upto matric
and above, respectively. Regarding caste, data
shows that 30 per cent of the respondents
hailed from scheduled castes and special
backward castes, rest 24 per cent and 16 per
cent were from backward castes and high
castes, respectively. Majority of the
respondents hailed (60%) from joint family
groups and 40 per cent from nuclear family
group. About 46 per cent of the respondents
were from small family (upto 4 members)
while about one third (34%) and remaining 20
per cent were from medium family i.e. 5-8
members and large family group. Per capita
annual income index shows that 45 per cent
respondents were belonging to middle income
group (60,000-120,000) followed by 35% and
20% low income group (<60,000) and high
income group i.e. Rs. >1,20,000.
Providing costlier education and sending
children to hostels for studiesThe gender discrimination in schools is an
extension of what we think in the family, in
society and in the community in which we
live. Unless there is camaraderie, dignity and
partnership among the members of and within
the family, it is difficult to expect the school to
create it artificially in the school environment,
and to pursue it without reference to what is
happening in society. There has to be a
democratic environment in the home for the
child to be democratic in his/her lifestyle.
Moreover, today the social barriers standing in
the way of girls attending school – poverty,
compulsions of older girls in families having to
look after the home and siblings, the
conception or misconception that girls do not
need education and/or that what is taught in
schools is irrelevant to them, parents seeing
limited (economic) benefits in educating
daughters, lack of women teachers and
separate schools for girls, supportive facilities
to travel to school and back, all these inhibit
parents from getting their girls enrolled. Girls
have to stay at home once they attain puberty
and must be protected till they are married.
IJAS 2014 • 153
International Journal on Agricultural Sciences Vol. V (Issue 2), pp. 151-158, 2014
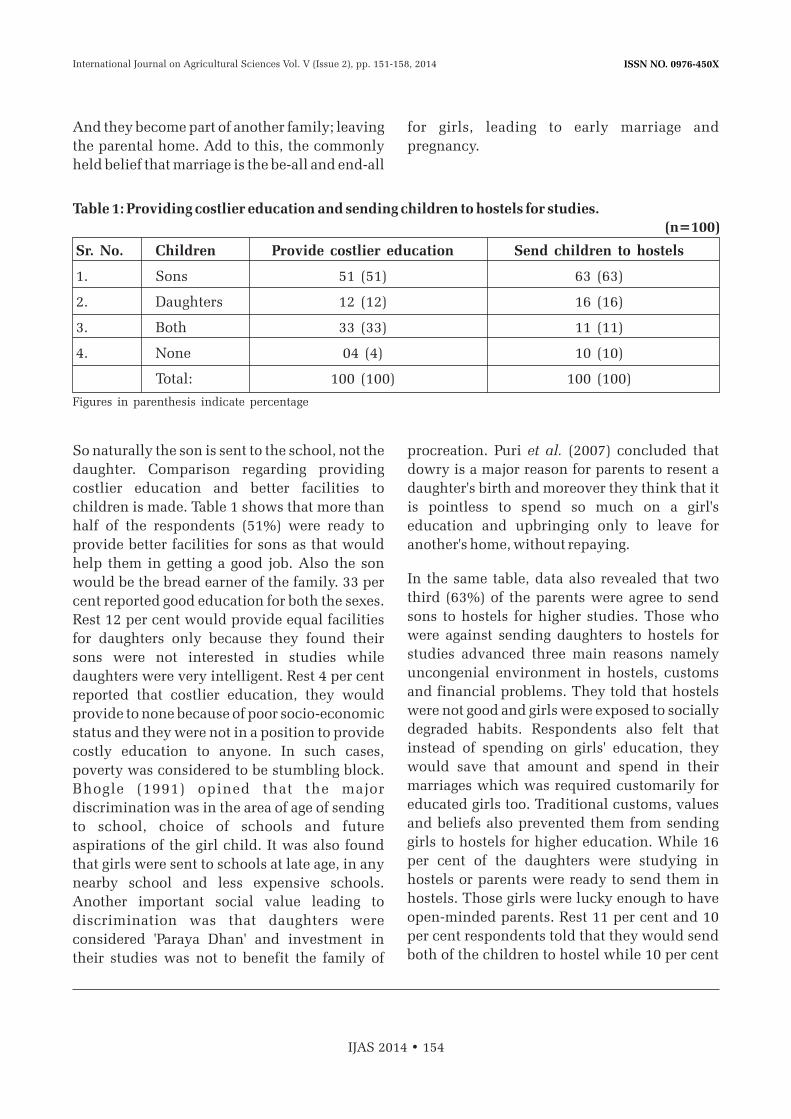
ISSN NO. 0976-450X
And they become part of another family; leaving
the parental home. Add to this, the commonly
held belief that marriage is the be-all and end-all
for girls, leading to early marriage and
pregnancy.
So naturally the son is sent to the school, not the
daughter. Comparison regarding providing
costlier education and better facilities to
children is made. Table 1 shows that more than
half of the respondents (51%) were ready to
provide better facilities for sons as that would
help them in getting a good job. Also the son
would be the bread earner of the family. 33 per
cent reported good education for both the sexes.
Rest 12 per cent would provide equal facilities
for daughters only because they found their
sons were not interested in studies while
daughters were very intelligent. Rest 4 per cent
reported that costlier education, they would
provide to none because of poor socio-economic
status and they were not in a position to provide
costly education to anyone. In such cases,
poverty was considered to be stumbling block.
Bhogle (1991) opined that the major
discrimination was in the area of age of sending
to school, choice of schools and future
aspirations of the girl child. It was also found
that girls were sent to schools at late age, in any
nearby school and less expensive schools.
Another important social value leading to
discrimination was that daughters were
considered 'Paraya Dhan' and investment in
their studies was not to benefit the family of
procreation. Puri et al. (2007) concluded that
dowry is a major reason for parents to resent a
daughter's birth and moreover they think that it
is pointless to spend so much on a girl's
education and upbringing only to leave for
another's home, without repaying.
In the same table, data also revealed that two
third (63%) of the parents were agree to send
sons to hostels for higher studies. Those who
were against sending daughters to hostels for
studies advanced three main reasons namely
uncongenial environment in hostels, customs
and financial problems. They told that hostels
were not good and girls were exposed to socially
degraded habits. Respondents also felt that
instead of spending on girls' education, they
would save that amount and spend in their
marriages which was required customarily for
educated girls too. Traditional customs, values
and beliefs also prevented them from sending
girls to hostels for higher education. While 16
per cent of the daughters were studying in
hostels or parents were ready to send them in
hostels. Those girls were lucky enough to have
open-minded parents. Rest 11 per cent and 10
per cent respondents told that they would send
both of the children to hostel while 10 per cent
IJAS 2014 • 154
Table 1: Providing costlier education and sending children to hostels for studies.
Sr. No. Children Provide costlier education Send children to hostels
1. Sons 51 (51) 63 (63)
2. Daughters 12 (12) 16 (16)
3. Both 33 (33) 11 (11)
4. None 04 (4) 10 (10)
Total: 100 (100) 100 (100)
(n=100)
Figures in parenthesis indicate percentage
International Journal on Agricultural Sciences Vol. V (Issue 2), pp. 151-158, 2014

ISSN NO. 0976-450X
refused to send any child to hostel, The Hindu
(2001). According to the Report of the
Committee on the Status of Women in India
(1974) found that girls constitute a higher
proportion of the unpaid family workers
throughout the country and that is a major
reason for their exclusion from school; fear of
alienation of girls from their environment is
another inhibiting factor for not sending girls to
hostels or even in schools.
Demand from Children on arrival of GuestsThe arrival of guests in the home is very
common and when someone comes, it becomes
the duty of host to attend him. The mothers were
asked that when some guest came, what you
On contrary, when question of continuing the
studies comes, the results were just in contrast
i.e. it was male children (42%) who got benefit
from our social system to continue their studies
on the arrival of guests while one-fourth
respondents told they never asked their
children to leave their studies as the parents
themselves attended the guests while 17 per
cent and 16 per cent respondents reported to
continue studies by both the sexes and from
daughters, respectively. Even it was also found
that some families were more bounded by their
customs and females were not allowed to attend
the guests or serve the tea. Whenever elder male
members were not in the home, it becomes the
duty of son to attend the guest. Mishra et al.
demanded from children – whether to leave the
studies or to continue their studies. Here the
process of socialization played an important
role as from the beginning; girls are taught to do
the domestic chores. Table 2 shows that more
than 50 per cent of the parents (54%) demanded
from their daughters to leave the studies and to
attend the guest by preparing tea, food etc. while
about one-fourth of the respondents demand
from the sons also. Further 15 per cent and 5 per
cent of the parents were expecting it from both
the children and none of the children,
respectively. The respondents told that it
depends upon situation who is free at that time.
(2012) reported that there are some traditional
boundaries for girls, they are subjected to
various rules and regulations both inside and
outside home. It is expected that the girls should
take all the traditional female roles within the
home perfectly. Thus, the socialization process
installs orthodoxy and stereotypes in the minds
of children. Families are responsible for
preparing the girls suppressed and they are
made to forget their own identities. The
domestic activities of the girls are women's
work i.e. done by women only. This segregation
of tasks by gender leads children to think that
some tasks are for males and some are for
females.
IJAS 2014 • 155
Table 2: Demand from children on arrival of guest.
Sr. No. Children Demand to leave the studies Demand to continue the studies
1. Sons 26 (26) 42 (42)
2. Daughters 54 (54) 16 (16)
3. Both 15 (15) 17 (17)
4. None 05 (5) 25 (25)
Total: 100 (100) 100 (100)
(n=100)
Figures in parenthesis indicate percentage
International Journal on Agricultural Sciences Vol. V (Issue 2), pp. 151-158, 2014

ISSN NO. 0976-450X
Caste and Family Members against Girls
Higher Education and other Participatory
activitiesAll of us have multiple identifies. For example,
in addition to being a woman, a persona may
be Hindu, middle class; upper or lower caste
etc. gender interacts with the other identities,
impacts and is impacted by social and
economic factors. Generally speaking “upper”
castes are much more male dominated or
patriarchal because they are concerned about
caste purity as well as controlling property.
In our society, especially in rural areas, women
had no say in decision making and in other
participatory activities like money matters,
education of the children, property matters
etc. So to know the caste distribution and
family members against higher education and
other participatory activities (like decision
making, property rights etc.), the respondents
were probed through an interview technique
to name the family members who were against
girls' education and response in this regard are
summarized in Table 3, which shows that in
scheduled castes, one-third of mothers
themselves were against the girls higher
education while in equal percentage (33%)
none was against in the family. Saraceno
(1988) stated that the family is the social and
symbolic place in which differences, in
particular, sexual differences, is believed to be
fundamental and at the same time constructed.
From childhood, a girl sees her mother's
contribution to the families, when she
becomes mothers; she always keeps her head
down in the family decision-making process.
Females observe the modesty submissiveness
of their mothers in the family environment.
Thus, she understands the socialization
process and trains herself accordingly. This
view is also supported by Marinova (2003)
who stated that the first lessons children
receive from their mothers are usually heavily
influenced by the same stereotypical thinking.
It was found in special backward classes i.e.
Jats, Bishnoi and Tyagis, one third of the
fathers were against higher education of the
girls or sending them to hostels or having
interferences of females in decision making
aspects o f the households . Dur ing
interviewing the respondents , male
dominance was reflecting. In the same way, 50
per cent of the fathers were against for
participatory activities and higher education
in backward caste families. In general caste
families about half (47%), none of the parents
or any family member was found against
higher education and other participatory
activities. Mukesh (2013) in a study conducted
among 100 households of Hisar district of
Haryana State found necessity of son to carry
on the family name, to earn for family and to
perform last rites of the parents. The main
reason given by general castes respondents for
necessity of a son are to inherit property for
cultivation, to earn for family and to carry
family name. Parents are the primary influence
on gender role development in the early years
of one's life (Miller and Cynthia, 1987; Kaplan,
1991; Santrock, 1994). This view is supported
by Saraceno (1988), who stated that the family
is the social and symbolic place in which
differences, in particular sexual difference, is
believed to be fundamental and at the same
time constructed. Thus, gender-based
prejudices and economic hardship both
operate on girls' depriving them of enjoying
their childhood.
IJAS 2014 • 156
International Journal on Agricultural Sciences Vol. V (Issue 2), pp. 151-158, 2014

ISSN NO. 0976-450X
like teaching, anganwadi supervisor and
other female related jobs.
SUGGESTIONSOn the basis of the findings of the studies, the
following suggestions are submitted:
1. Awareness mission for families should
focus on women and girl child in rural
areas.
2. Parents should be convinced about the
utility and importance of girl's education
through community development
programme and other folk media.
3. Age of marriage of a girl is a main hurdle in
higher education, so age of girl's marriage
should be raised to 21 years. For that strict
implementation of laws should be there
and violators should be strictly punished
irrespective of the status, they hold.
4. Another important barrier is the lack of
girls senior secondary schools and
colleges within the village. Therefore,
every village must have senior secondary
schools at a walkable distance.
CONCLUSIONS
1. Gender biases were found among boys and
girls by family members in education,
occupational choices and other activities.
2. Rural women are ignorant about the
nature of education in general. However,
for sons, science and technical subjects
are preferred because of the economic
motive but for the girls, it was not so.
3. Elderly male family members are not
convinced about the need of the girls to
higher education nor want to send girls for
studies outside the village/hostels. Even
mothers are not willing to send daughters
in hostels as the adolescent girls need
close supervision.
4. Regarding participatory activities, on
arrival of guests, daughters are expected to
leave studies and prepare tea etc. although
tea/food is served by males only.
5. Paid job/service and higher education
enhances the status of women but it is not
a necessity for them. Girls are not allowed
to go for jobs of their choice and are
socialized to join only limited professions
IJAS 2014 • 157
Table 3: Caste and family members against girls higher education and other participatory activities.
Sr. No. Caste Family Members
Father Mother Grand- None Totalparents
1. Scheduled caste 05 10 05 10 30(16.66) (33.33) (16.66) (33.33) (30.00)
2. Backward caste 12 03 07 02 24(50.00) (12.50) (29.16) (8.33) (24.00)
3. Special backward 10 6 08 6 30 class (33.33) (20.00) (26.66) (20.00) (30.00)
4. General caste 03 2 03 8 16 (18.75) (11.76) (18.75) (47.05) (16.00)
(n=100)
Figures in parenthesis indicate percentage
International Journal on Agricultural Sciences Vol. V (Issue 2), pp. 151-158, 2014

ISSN NO. 0976-450X
5. Security measures should be increased
for safe work places.
6. Strict punishment to the sex offenders
and eve-teasers.
7. Social and cultural barriers must be
relaxed, man-folk must change their
outlook towards female efficiency and
her stamina also.
BIBLIOGRAPHY
1. Bhogle S., 1991. Child rearing practices
a n d b e h a v i o u r a n d b e h a v i o u r
development of a girl child. The Indian J.
of Social work, 52 (1), 61-69.
2. Kaplan P S., 1991. A child's odyssey. St.
Paul: West Publishing Company.
3. Kaur M., 2004. Socio-economic
correlates of low sex ratio in Punjab.
Project reports submitted to Department
of Sociology and Social Anthropology,
Punjabi University, Patiala.
4. Miller, Cynthia, L., 1987. Qualitative
differences among gender-stereotyped
toys: Implications for cognitive and
social development in girls and boys. Sex
Roles, 16(9-10), 473-487.
5. Mishra S, Behera D K, Babu B V., 2012.
Socialization and gender bias at the
household level among school attending
in a tribal community of the Kalahandi
district of Eastern India. Anthropological
Notebooks, 18(2), 45-53.
6. Mukesh, 2013. A study of social and
economic factors affecting gender
preferences among rural people. M.Sc.
Thesis, Department of Sociology, CCS
HAU, Hisar.
7. Puri S, Bhatia V, Swami, H.M., 2007.
Gender preference and awareness
regarding sex determination among
married women in slums of Chandigarh.
Indian Journal of Community Medicine,
32(1), 66-67.
8. Samiyar P., 2008. Intensifying son
preference and declining sex ratio in
India. The Indian J. of Social Work, 69(1),
73-82.
9. Santrock J W., 1994. Child development.
Madison: Brown and Benchmark.
10. Saraceno C., 1988. Sociologia della.
Famiglia.Bologna:II Mulino.
11. Marinova J., 2003. Gender stereotypes
and socialization process. Expert Group
Meeting on the role of men and boys in
achieving gender equality. Document No.
E G M / M e n _ B o y s - G E / 2 0 0 3 / E P. 3 ,
Brasilia.Brazil:United Nations.
12. T h e H i n d u . , 2 0 0 1 . G e n d e r
discrimination in school system. 2001,
D e c . 1 8 ( S o u r c e :
h t t p : / / w w w . h i n d u . c o m / t h e
h i n d u / e d u / 2 0 0 1 / 1 2 / 1 8 s t o r i e s /
2001121800030200.htm
IJAS 2014 • 158
International Journal on Agricultural Sciences Vol. V (Issue 2), pp. 151-158, 2014

ISSN NO. 0976-450X
SPATIAL VARIATION IN SOIL NUTRIENTSUNDER DIFFERENT LAND USE SYSTEMS
H. Mohamed Saqeebulla, K. T. Gurumurthy and P. Veeranagappa
Department of Soil Science and Agricultural ChemistryUniversity of Agricultural Sciences (GKVK), Bangalore–560 065, Karnataka, India
INTRODUCTIONLand use deals essentially on land and in the
way in which the land surface is adopted or
could be adopted to some human needs. Land
use is the expression of human management of
ecosystem in order to produce some of his basic
needs. "Land is used differently in different
places or geographical regions according to the
necessity of local people. In rural area, land is
used or agriculture, pasture, settlement,
forestlands etc whereas in urban area it is
mainly used for residential, industrial and
business purposes. Land use pattern are
determined basically by ecological condition,
altitude geological structure and slope. Apart
from the above sectors technological and
ABSTRACT
Five soil profiles were studied under different land use systems (LUS) in acid soils of
Karnataka. Spatial distribution of soil physical properties and nutrients in soil profiles
revealed that these soils ranged from loam to clay loam in their texture. The soils were
found to be acidic in reaction, electrical conductivity was normal for crops which
decreased depth wise, whereas organic carbon gradually decreased along the depth.
Irregular distribution of CEC was observed. Calcium content increased with depth.
Available forms of nitrogen, phosphorus, potassium and sulphur to crops decreased depth
wise. Among different land use systems micronutrients content decreased with depth
which could be due close association with organic matter content of soil. The results
further reported that sapota and paddy land use systems exhibited low magnitude of soil
fertility parameters and were less productive. Soil samples were also collected from profiles
of forest and arecanut LUS and exhibited higher levels of soil fertility. Higher levels of soil
fertility parameters in profiles were associated with higher content of finer fraction and
organic matter. The magnitude of soil fertility parameters generally decreased with depth in
profiles under different land use systems.
No. of Pages: 7 No. of Tables: 3 References: 16
Keywords: Land use system, spatial distribution, soil fertility, nutrients.
International Journal on Agricultural Sciences Vol. V (Issue 2), pp. 159-165, 2014
Corresponding author: [email protected]
Research Paper
Received on: 02.04.2014 Revised on: 07.05.2014 Accepted on: 18.06.2014
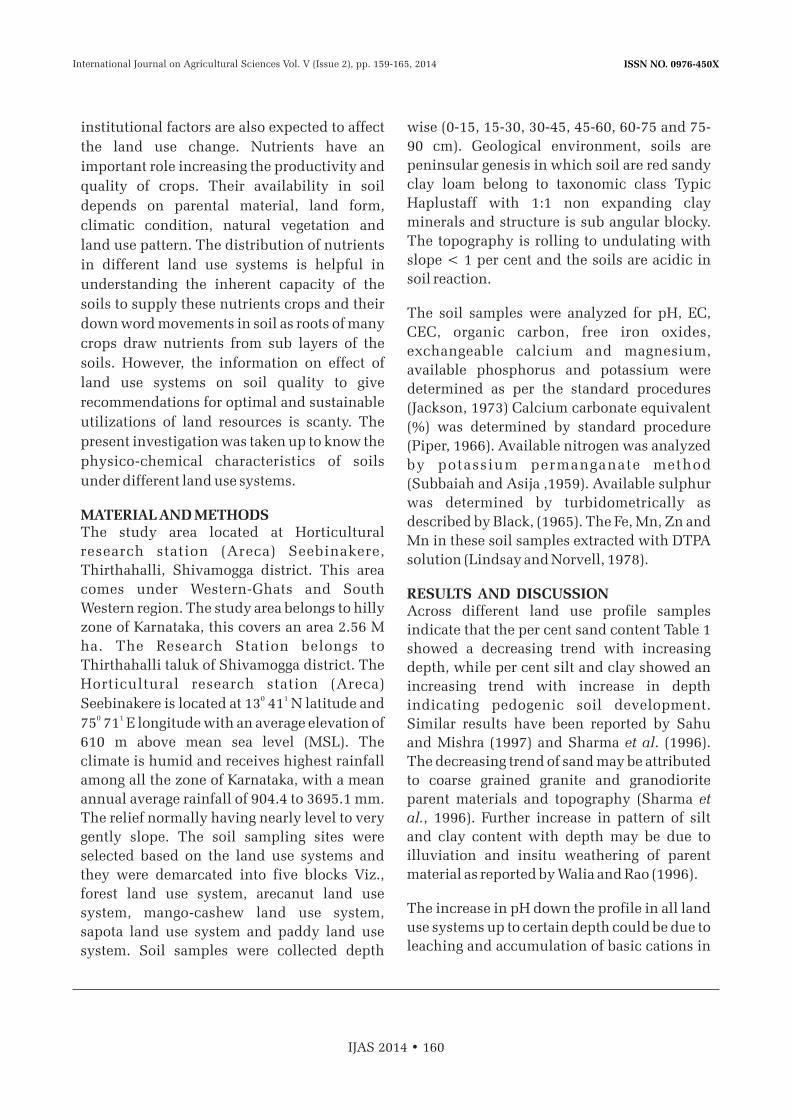
ISSN NO. 0976-450X
institutional factors are also expected to affect
the land use change. Nutrients have an
important role increasing the productivity and
quality of crops. Their availability in soil
depends on parental material, land form,
climatic condition, natural vegetation and
land use pattern. The distribution of nutrients
in different land use systems is helpful in
understanding the inherent capacity of the
soils to supply these nutrients crops and their
down word movements in soil as roots of many
crops draw nutrients from sub layers of the
soils. However, the information on effect of
land use systems on soil quality to give
recommendations for optimal and sustainable
utilizations of land resources is scanty. The
present investigation was taken up to know the
physico-chemical characteristics of soils
under different land use systems.
MATERIAL AND METHODSThe study area located at Horticultural
research station (Areca) Seebinakere,
Thirthahalli, Shivamogga district. This area
comes under Western-Ghats and South
Western region. The study area belongs to hilly
zone of Karnataka, this covers an area 2.56 M
ha. The Research Station belongs to
Thirthahalli taluk of Shivamogga district. The
Horticultural research station (Areca) 0 1Seebinakere is located at 13 41 N latitude and
0 175 71 E longitude with an average elevation of
610 m above mean sea level (MSL). The
climate is humid and receives highest rainfall
among all the zone of Karnataka, with a mean
annual average rainfall of 904.4 to 3695.1 mm.
The relief normally having nearly level to very
gently slope. The soil sampling sites were
selected based on the land use systems and
they were demarcated into five blocks Viz.,
forest land use system, arecanut land use
system, mango-cashew land use system,
sapota land use system and paddy land use
system. Soil samples were collected depth
wise (0-15, 15-30, 30-45, 45-60, 60-75 and 75-
90 cm). Geological environment, soils are
peninsular genesis in which soil are red sandy
clay loam belong to taxonomic class Typic
Haplustaff with 1:1 non expanding clay
minerals and structure is sub angular blocky.
The topography is rolling to undulating with
slope < 1 per cent and the soils are acidic in
soil reaction.
The soil samples were analyzed for pH, EC,
CEC, organic carbon, free iron oxides,
exchangeable calcium and magnesium,
available phosphorus and potassium were
determined as per the standard procedures
(Jackson, 1973) Calcium carbonate equivalent
(%) was determined by standard procedure
(Piper, 1966). Available nitrogen was analyzed
by potassium permanganate method
(Subbaiah and Asija ,1959). Available sulphur
was determined by turbidometrically as
described by Black, (1965). The Fe, Mn, Zn and
Mn in these soil samples extracted with DTPA
solution (Lindsay and Norvell, 1978).
RESULTS AND DISCUSSIONAcross different land use profile samples
indicate that the per cent sand content Table 1
showed a decreasing trend with increasing
depth, while per cent silt and clay showed an
increasing trend with increase in depth
indicating pedogenic soil development.
Similar results have been reported by Sahu
and Mishra (1997) and Sharma et al. (1996).
The decreasing trend of sand may be attributed
to coarse grained granite and granodiorite
parent materials and topography (Sharma et
al., 1996). Further increase in pattern of silt
and clay content with depth may be due to
illuviation and insitu weathering of parent
material as reported by Walia and Rao (1996).
The increase in pH down the profile in all land
use systems up to certain depth could be due to
leaching and accumulation of basic cations in
IJAS 2014 • 160
International Journal on Agricultural Sciences Vol. V (Issue 2), pp. 159-165, 2014
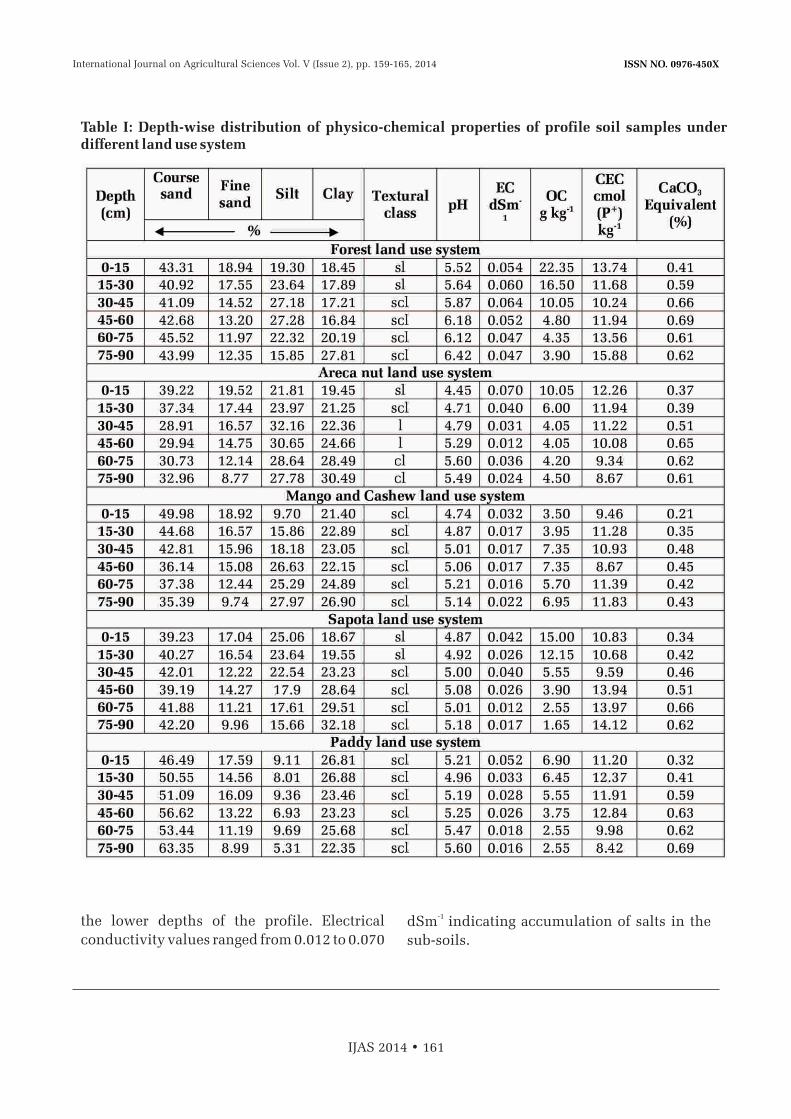
ISSN NO. 0976-450X
the lower depths of the profile. Electrical
conductivity values ranged from 0.012 to 0.070
-1 dSm indicating accumulation of salts in the
sub-soils.
IJAS 2014 • 161
Table I: Depth-wise distribution of physico-chemical properties of profile soil samples under different land use system
International Journal on Agricultural Sciences Vol. V (Issue 2), pp. 159-165, 2014
ISSN NO. 0976-450X
-1The highest (22.35 g kg ) organic carbon in the
surface layer compared to subsurface layers of
the soil (Table I), organic carbon was higher in
soils under forest cover and was lowest in
mango-cashew land use system whereas, it
was intermediate in other systems, due to the
accumulation of organic matter in surface
horizon and recycling of organic matter,
addition of organic manures and also because
of crop residues remaining in the surface
(Singh and Ganeshmurthy, 1991; Ashok,
1998). The decrease in CEC of soils with depth + -
and its values ranges 8.42 to 15.88 cmol (P ) kg1 in all the land use systems CEC decreased
uniformly with depth is due to high proportion
of clay minerals and increased with increasing
clay content. Among the exchangeable cations 2+ 2+Ca is the dominant cation followed by Mg , + +
Na and K , (Walia and chamuah, 1992). This
is due to low values of cation exchange
capacity in sub surface were attributed to the
presence of pH dependendent exchange sites
occupied by either hydrogen or hydroxy
aluminium ions at low pH. The organic matter
seems to be the determining factor of the CEC
within the profile. Since functional groups of
soil humus contributes to CEC. Such
difference in CEC with surface and subsurface
soils reflects the electrochemical behaviors of
these soils were influenced by potential + 3+ -determining ions namely H O (or Al and OH3
) (Sen et al., 2003). Per cent calcium carbonate
equivalent increased from 0.21 to 0.69 under
different land use systems.
It was observed that available nitrogen
decreased significantly with depth under
forest, arecanut, mango-cashew, sapota and
paddy systems. It decreases from 426.50 to
225.79, 275.97 to 175.62, 301.06 to 186.14,
225.79 to 175.62 and 225.79 to 165.12
respectively (Table II). This could be due to
decrease in organic carbon content and
microbial population in lower depths (Ashok,
1998). The phosphorous content in surface soil
was higher than sub surface soil it decreased
from 21.61 to 10.53 under different land use
systems. This could be due to fixation of
phosphorus by iron and aluminium
containing minerals in lower depths. Available
potassium in profile soil samples markedly
decreased with increasing in depth in all the
land use systems. The decreasing trend with
depth may be due to higher organic carbon
content in surface soils then the sub surface
soil and presence of higher potassium bearing
minerals (Hirekurubar et al., 1991).
The exchangeable calcium and magnesium +
content were higher (8.50 and 4.70 cmol (P ) -1
kg ) in lower depths of profile as compared to + -1
surface layer (5.00 and 3.40 cmol (P ) kg )
(Table II) this can be attributed to leaching of
cations by higher content of clay in the sub
surface. Similar results were observed by
Ashok, (1998). In general, the available
sulphur content under forest, arecanut,
mango-cashew, sapota and paddy systems it
decreases from 28.56 to 15.17, 16.64 to 12.50,
26.07 to 14.28, 24.10 to 16.96 and 22.31 to -112.50 mg kg . Decrease in available sulphur
was due to low organic carbon and reducing
microbial population are the possible reasons
for such a decreasing trend.
The DTPA extractable iron content decreased
with depth in all the systems (Table II). This
may be due to decrease in organic carbon
content as reported by Kannan and Mathan,
(1994). Comparatively less amount of DTPA
extractable manganese in lower horizons
studied under different land use system which
might be due to reduced mobility in lower
horizons, specific adsorption of manganese
and iron oxides, clay minerals, humic acid and
fulvic acid (Rajkumar, 1994). The zinc content
decreased in all the profiles under
investigation. Comparatively less amount of
DTPA extractable copper in lower horizons
studied under different land use system it
IJAS 2014 • 162
International Journal on Agricultural Sciences Vol. V (Issue 2), pp. 159-165, 2014
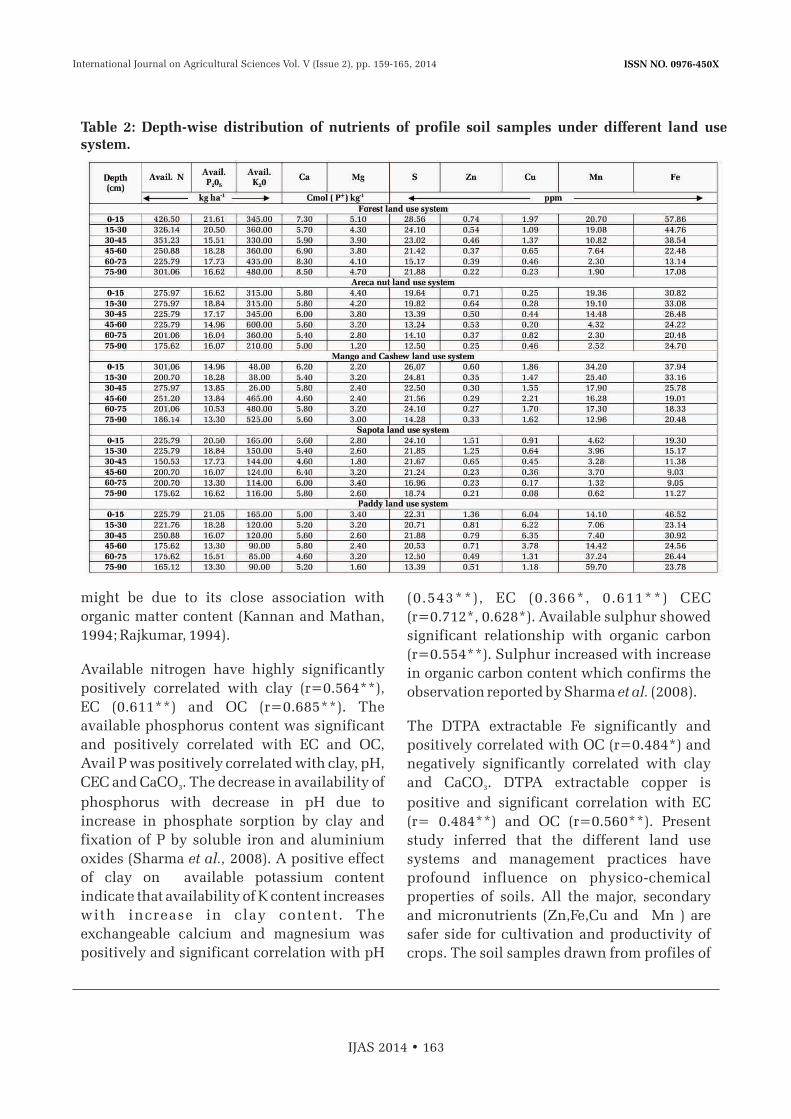
ISSN NO. 0976-450X
might be due to its close association with
organic matter content (Kannan and Mathan,
1994; Rajkumar, 1994).
Available nitrogen have highly significantly
positively correlated with clay (r=0.564**),
EC (0.611**) and OC (r=0.685**). The
available phosphorus content was significant
and positively correlated with EC and OC,
Avail P was positively correlated with clay, pH,
CEC and CaCO . The decrease in availability of 3
phosphorus with decrease in pH due to
increase in phosphate sorption by clay and
fixation of P by soluble iron and aluminium
oxides (Sharma et al., 2008). A positive effect
of clay on available potassium content
indicate that availability of K content increases
with increase in clay content. The
exchangeable calcium and magnesium was
positively and significant correlation with pH
(0.543**), EC (0.366*, 0.611**) CEC
(r=0.712*, 0.628*). Available sulphur showed
significant relationship with organic carbon
(r=0.554**). Sulphur increased with increase
in organic carbon content which confirms the
observation reported by Sharma et al. (2008).
The DTPA extractable Fe significantly and
positively correlated with OC (r=0.484*) and
negatively significantly correlated with clay
and CaCO . DTPA extractable copper is 3
positive and significant correlation with EC
(r= 0.484**) and OC (r=0.560**). Present
study inferred that the different land use
systems and management practices have
profound influence on physico-chemical
properties of soils. All the major, secondary
and micronutrients (Zn,Fe,Cu and Mn ) are
safer side for cultivation and productivity of
crops. The soil samples drawn from profiles of
IJAS 2014 • 163
Table 2: Depth-wise distribution of nutrients of profile soil samples under different land use system.
International Journal on Agricultural Sciences Vol. V (Issue 2), pp. 159-165, 2014

ISSN NO. 0976-450X
forest and arecanut LUS have higher levels of
soil fertility. Higher levels of soil fertility
parameters in profiles were associated with
higher content of finer fraction and organic
matter. The magnitude of soil fertility
parameters generally decreased with depth in
profiles.
REFERENCES1. Ashoka, K., 1998, Studies on the properties
of an Alfisols under selected forest
plantations, M. Sc (Agri) Thesis, Univ.
Agric. Sci., Bangalore (India).
2. Black, C. A., 1965, Methods of Soil
Analys is Par t – I . Physical and
mineralogical properties. Agronomy
Monograph No. 9. American Society of
Agronomy, Inc. Madison, Wisconsin, USA,
pp. 18-25.
3. Hirekurubar, B. M., Doddamani, V. S. &
Satyanarayana, T., 1991, Some physical
properties of vertisols derived from
different parent materials. J. Indian Soc.
Soil Sci., 39:242-245.
4. Jackson, M. L., 1973, Soil Chemical
Analysis. Prentice Hall of India Private
Limited, New Delhi.
5. Kannan, N. & Mathan, K. K., 1994, Iron,
manganese, zinc and copper content of
selected watershed in a hilly region of
Tamil Nadu, Madras Agric. J., 21(1):37-42.
6. Lindsay, W. L. & Norvell, W. A., 1978,
development of DTPA soil test for zinc,
iron, manganese and copper. Soil Sci. Soc.
Am. J. 42:421-428.
7. Piper, C. S., 1966, Soil and Plant Analysis.
Univ. Adelaide, Australia, p.362.
8. Rajkumar, G. R., 1994, Stidies on forms and
distribution of micronutrients in paddy
soils of Tungabhadra project- Karnataka.
IJAS 2014 • 164
Table 3: Correlation co-efficient (r) between physico-chemical properties and nutrients of soil and some of surface soil samples under different land use systems.
** Correlation is significant at 0.01 * Correlation is significant at 0.05
International Journal on Agricultural Sciences Vol. V (Issue 2), pp. 159-165, 2014

ISSN NO. 0976-450X
M.Sc., (Agri) Thesis, Univ. Agric. Sci.,
Bangalore (India).
9. Sahu, G. C & Mishra, K. N., 1997,
Morphology, character is t ics and
classification of soils of an irrigated river
flood plain in the eastern coastal region. J.
Indian Soc. Soil Sci., 45(1): 152-156.
10. Sen, T. K., Nayak, D. C. & Chaterji, 2003,
Rationale for use effective cation
exchange capacity in characterizing
exchange properties of acid soils. J. Indian
Soc. Soil Sci., 51(4): 557-560.
11. Sharma, P. K., Anil Sood, Setia, R. K., Tur,
N. S., Deepak Mehara & Harpinder
Singh, 2008, Mapping of macronutrient in
soils of Amritsar district (Punjab) – A GIS
approach. J. Indian Soc. Soil Sci., 56 (1):
34-41.
12. Sharma, S. S., Totawat, K. L. &
Shyampura, R. L., 1996, Characterization
and classif ication of soils in a
toposequence over Basaltic terrain. J.
Indian Soc. Soil Sci., 44 (3): 470-475.
13. Singh, G. & Ganeshmurthy, A. N., 1991,
Influence of changing land use on the
micronut r ient s ta tus o f middle
Andaman's. J. Indian Soc. Soil Sci., 39:
363-364.
14. Subbaiah, B.V. & Asija, G., 1959, A rapid
procedure for the estimation of available
nitrogen in soils. Curr. Sci., 25: 259-260.
15. Walia, C. S. & Chamuah, G. S., 1992,
Influence of topography on catenary soils
in old flood plains of Assam. J. Indian Soc.
Soil Sci., 36: 825 – 827.
16. Walia, C. S. & Rao, Y. S., 1996, Genesis,
C h a r a c t e r i s t i c s a n d Ta xo n o m i c
classification of some red soils in
Bundlekhand region of Uttar Pradesh. J.
Indian Soc. Soil Sci. 44(3): 470-481.
IJAS 2014 • 165
International Journal on Agricultural Sciences Vol. V (Issue 2), pp. 159-165, 2014

ISSN NO. 0976-450X
IJAS 2014 • 166

ISSN NO. 0976-450X
MEGA DIETARY FACTS FOR WEIGHT LOSS
Bandana Singh and Pragati
P.G. Department of Home Science, B.R.A.B.U. Muzaffarpur, BiharP.G. Department of Home Science, Patna University, Patna, Bihar
INTRODUCTIONDon't you wish you can just switch places with
those fabulously fit celebrities so you can have
that perfect body? It appears so unfair that lots
of Hollywood personalities have more beautiful
with age however when you look at yourself
within the mirror, all you see are the flaws
hanging around your tummy, your arms, and
your thighs. You cannot wish away body fat and
the excess weight; however with a weight loss
diet program that's perfect for you, you could
have that trim body you've always wanted, even
in the age of 40.
A very common notion about any diet program is
the fact that there are too many do and don't with
regards to eating the right food. You cannot eat too
much white bread, and you best skip on those
fatty meats and head directly on to the lean but
bland chicken. You cannot even have one measly
scoop of the favorite chocolate chip mint frozen
treats for desert. The list just continues and on,
and it just ends along with you giving up the diet
since you need to have nerves of steel to follow
along with every single rule. However, you aren't
that person, and a number of other people feel the
same manner, too.
ABSTRACT
Each and every person wants to look smart, and then diet plays an important role for
achieving this innocent goal. The key to an effective diet program is healthy eating, and
which means healthy portions and proportions. Vegetable juices are highly recommended
as part of our health promoting weight loss programme. You may add spices like ginger,
black salt, chat masala as per your requirements. Clear soups and salads can be consumed
in unlimited amounts as desired so that you are 3/4 full at the end of the meal. Recent
research now shows that including more dairy in your diet may make it easier to lose those
extra pounds and burn fat without cutting back too much on calories. One of the most
exciting findings of this new research is diets that are dairy-rich will help you almost
double the rate of weight loss as compared to dairy-poor diets. There are so many different
diets are in practice for weight loss, but it completely depends upon your's choices.
No. of Pages: 6 No. of Tables: 2 No. of Figs.: 3 References: 5
Keywords: Diet, Mega, Health, Facts, Weight loss, Dieting etc.
International Journal on Agricultural Sciences Vol. V (Issue 2), pp. 167-172, 2014
Corresponding author: [email protected]; [email protected]
Research Paper
Received on: 20.12.2013 Revised on: 02.04.2014 Accepted on: 05.05.2014

ISSN NO. 0976-450X
The key to an effective diet program is healthy
eating. And which means healthy portions and
proportions. Restricting yourself from eating
certain foods just will not work because you
end up binging in it later on. And once you
start consuming more nutritious food, you
won't need to put your refrigerator under lock
and key since your body won't have a craving
for “junk” foods anymore.
Weight Loss DietI t ' s o k a y t o
consume r ea l
foods – proteins,
carbohydrates,
and fats – but
make sure to
know the right
kinds and comes
down to put in
your body. Dieting is really a term that shot to
popularity around the time that women
decided that thin was “in”. For probably the
most part it was heralded through the Twiggy
craze but much more likely had been a
significant concern since dresses started to rise
above the ankles. But dieting is not always
equated with weight loss, nor if it is. Dieting is a
term that invokes images of men and women
(but mostly women) who're denying
themselves the pleasures of chocolate, bread,
butter, dessert, soda, alcohol and any food that
remotely carries a lot more than 10 calories.
Dieting DietDieting can be a lifestyle choice. It's a time
when people feel they must be denied
something of enjoyment in exchange for fitting
in to the next dress size down. But it's not a
long term option for either weight loss or
overall health. It might appear like splitting
hairs but as humans all of us respond best to
what we should interpret as “best”. Due to the
connotation that 'dieting' is promoting over the
past several decades it's much better for those
who desire to lose several pounds to think
about a nutritional change that leads to
healthier eating habits[2].
For example, the South Beach diet advocates
eating plenty of protein and fat but no
carbohydrates. The proponents agree it isn't a
diet that should be followed actually -term
because of the abnormal metabolism it makes
in the body, altered pH and increased work on
the kidneys. So, when the individual has
dropped a few pounds they are supposed to
transition to a nutritionally balanced diet that's
lower in calories than their previous diet plan.
But, nowhere within the program have they
learned to consume a nutritionally balanced
diet.
Individuals now transition from the 'diet' to a
balanced diet that they're required to maintain
for the rest of their lives. Instead, just how
much better is it to carefully and easily
transition from poor nutritional habits to get
affordable ones that will help you slim down
and gain better overall health?
Using the South Beach diet because the
example again, our prime protein meals they
advocate in many cases are also high in
saturated animal fats. These nutrients are very
well known for the negative effects they've on
the cardiovascular system and long-term
problems with heart disease, peripheral
vascular disease and stroke. However, by
IJAS 2014 • 168
International Journal on Agricultural Sciences Vol. V (Issue 2), pp. 167-172, 2014

ISSN NO. 0976-450X
easing right into a nutritionally balanced diet
plan which includes a variety of fruits and
vegetables, little bit of animal fat/protein and
high levels of water an individual can create a
plan that works for their lifestyle while
slimming down and improving their health.
Those people who are addicted to diets are
enticed through the promise of quick weight
loss however it can also lead to unhealthy diet
plan and usually only temporary success.
Using a diet that's too low in calories may cause
the metabolism to slow to some snail's pace
and will often even damage the system beyond
being able to repair itself to its former glory.
Eating a nutritionally balanced meal means
taking charge over what is put in our mouths.
This means learning that we must eat to reside
and not live to consume, and it means
recognizing the pitfalls within our everyday
lives like the extra sugar within the coffee, cake
with dinner and soda and donuts we snarf
down throughout the day at work.
By taking charge of our meals and the food we
eat, monitoring the foods that pass within the
lips and taking advantage of multiple little
weight loss secrets (such as the power of water)
we could move from a dieter to someone who
enjoys the foods they eat and the body they
wear.
Without starving by selecting some intelligent
diet like express diet which loses 3 kilos (6–7
pounds) very fast. These are as follows:
(I)Express DietThe Express Diet is ideal if you want to lose
quickly the extra kilos gained because of the fat
and sweets excess. If you have to lose 3–4
kilograms, the express formula is the ideal one.
It was conceived to help you lose weight
quickly but without starving. This diet's
principles are simple: three meals a day, no fats
or sweets, no alcohol, fat dairy products or
snacks.[1] In order to get the results you want,
you should respect rigorously the game's rule:
only three meals a day with a fix time for
breakfast and dinner. Entree made up of
vegetables salad with lemon and yogurt in
your diet.
(II) Zero DietI discovered the weight loss formula that I am
going to describe to you, by despair. I have
gained 14 kilos in a single year and although I
tried all known hypo-caloric diets, I didn't
manage to lose at least 5 grams. At that
moment, I imposed myself two days of total
fast and- guess what? - It worked!
So, I didn't eat anything for 2 days per week
(not consecutive, for example Monday and
Friday) but I took care to drink daily minimum
two liters of water or herbal tea (unsweetened,
of course). In the other 5 days I ate normally,
without restrictions or excesses. I only gave up
sweets, replaced sugar with honey and I
reduced (not eliminated) the quantity of
pastries and fats and I had dinner earlier,
around six o'clock. The mechanism is the
following: you lose in the first day of fast one
kilogram, in the second only half kilogram and
in the next five days of normal alimentation
you gain one kilogram. Thus, it result a half
kilogram difference. This is the weekly rhythm
of the weight loss program which should repeat
every time.
IJAS 2014 • 169
International Journal on Agricultural Sciences Vol. V (Issue 2), pp. 167-172, 2014
ISSN NO. 0976-450X
The call the diet zero because it is based on total
fast, has some important advantages: the two
starving days helps us eliminate toxins and the
slow weight loss, beside the fact it has, as we
well know, long-lasting effects, it also helps us
avoid the ugly esthetic consequences as it gives
skin enough time to adapt to the new
dimensions. I lost nine kilograms in four months
and I am decided to get rid of another five
kilograms. If at the beginning of the summer I
was fastening the belt at the first hole, now I am
proud that I can fasten it at the seventh. I wish
the readers with the same problems to be as
successful as I was!
A diet plan for a human to quickly burn fatsDo not take in calorie-rich drinks. This means
that you simply must avoid drinks that has
calorie in it. Diet sodas, smoothies, fruit juices,
and anything that has artificial sweeteners and
sugars in it are the drinks not allowed for you.
You must only drink lots of cold water, coffee,
and brewed unsweetened green tea. Eat green
vegetables and it burn fats fast, you should take
in carbohydrates from a bulk of green vegetables
and some tips are given below:
IJAS 2014 • 170
l Do not take calorie rich diet.
l Eat green vegetables
l No white carbohydrates
l Prepare a protein rich breakfast
l Eat more regularly
lstored in your body.Drink water lowers the amount of fat
l Drink milk for loss more weight
This means that you simply must avoid drinks that have calories in it. Sodas, Smoothies, Fruit juices and anything that has artificial sweeteners and sugars in it are the drinks not allowed for you. You must only drink lots of cold water, coffee and brewed unsweetened green tea.[4]
To burn fats fast, you should take in carbohydrates from a bulk of green vegetables like collard green, Brussels sprouts, broccoli, spinach, kale, French bean etc.[3]
Avoid foods like breads, pasta, rice, tortilla, potatoes etc. This can radically decrease your fat burning rate.
If you are not used to eating early in the morning, then you might want to try drinking protein shake instead of breakfast.
It is much healthier and more beneficial to your diet if you eat healthy meals within three to four hours apart. This is to keep the blood sugar stable and regulating your metabolism.
Drink water lowers the amount of fat stored in your body. Your kidneys get lazy on the job and give most of the unfinished work to your liver. By not drinking water you put your liver in risk.
Including more dairy in your diet may make it easier to lose those extra pounds and burn fat without cutting back too much on calories.
Recent research now shows that including
more dairy in your in your diet may make it
easier to lose those extra pounds and burn fat
without cutting back too much on calories [5].
One of the most exciting findings of this new
research is diets that are dairy-rich will help
International Journal on Agricultural Sciences Vol. V (Issue 2), pp. 167-172, 2014

ISSN NO. 0976-450X
you almost double the rate of weight loss as
compared to dairy-poor diets. Researchers also
found that most of the body fat lost from these
diets was around the midsection. Some of the
minerals found in dairy products may enhance
calcium's beneficial effects on fat breakdown
CONCLUSIONSo lastly for weight losses eat till you are ½ or ¾
full. Do not overeat. Vegetable juices are highly
recommended as part of our health promoting
weight loss programme. You may add apices like
ginger, black salt, chaat masala as per your
requirements. Clear soups and salads can be
consumed in unlimited amounts as desired so
that you are 3/4th full at the end of the meal. You
can eat roasted channa when you feel hungry
within the cells and dairy products also contain
enough protein in them to help preserve muscle
and increase your metabolism. 3–4 servings of
dairy products each day like Milk, yogurt, and
cheese will do.
before meals or you can have these snacks at bed
time. In this way if one can follow above all
instructions of this paper then definitely one
can lose his/her weight within very short
period.
REFERENCES1. "Soybeans, mature seeds, raw and other
proteinous diet". NutritionData.com.
Retrieved August 28, 2012.
IJAS 2014 • 171
Table : Avoid List (To be avoided during the weight loss).
Cereals & Fruits & Milk & Fats & Sugar OthersPulses Products Vegetables Milk Products
Rice & Beetroot Chocolates Honey Tinned foodsRice products
Upma Chiku Cheese Butter Ketchup
Chole Coconut Sugar canned foods
Corn Yam cakes Mayonnaise Deep fried Food
Idli Mango Sweets Jaggery Fast Food
Maida and Grapes Pastries Ghee Junk FoodMaida products
Dosa Fruit juices Full cream milk Candy High Calorie Food
Rajmah Green peas Full Cream Curd Carbonated Drinks
Potato Unhealthy fatty foods
Arbi
Banana
Custard apple
International Journal on Agricultural Sciences Vol. V (Issue 2), pp. 167-172, 2014

ISSN NO. 0976-450X
2. " A m a r a n t h , u n c o o k e d f o o d " .
NutritionData.com. Retrieved August 28,
2012.
3. VR Young and PL Pellett (1994). "Plant
proteins in relation to human protein and
amino acid nutrition". Am. J. Clinical
Nutrition 59 (5 Suppl): 1203S–1212S.
PMID 8172124.
4. Iron by The Vegetarian Society of the
United Kingdom Limited.
5. "// Health Issues // Optimal Nutrition".
Goveg.com. Retrieved August 9, 2009.
IJAS 2014 • 172
International Journal on Agricultural Sciences Vol. V (Issue 2), pp. 167-172, 2014

ISSN NO. 0976-450X
SPIRULINA: A POTENT FOOD SOURCE
1 2 3Pragati , Bandana Singh , and Prem Shankar
1P.G. Deptt. of Home Science, Patna Uuniversity, Patna, Bihar
2P.G. Deptt. of Home Science, B.R.A. Bihar University, Muzaffarpur, Bihar
3Deptt. of Botany, L.S. College, MuzaffarpurB.R.A. Bihar University, Muzaffarpur, Bihar
INTRODUCTIONMalnutrition is a global problem and much
bigger than hunger and imposes enormous costs
on societies in terms of ill health, lives lost,
reduced economic productivity and poor
quality of life. Therefore for overcoming
ABSTRACT
Spirulina- a cyanobacteria has been used from centuries by different populations and only
rediscovered in recent years. Once classified as the blue green algae, it does not strictly
speaking belong to the algae, even through for convenience it continues to be referred too
in that way. It grows naturally in the alkaline waters of lakes in warm regions. Its
impressive protein content and its rapid growth in entirely mineral environments have
attracted the attention of both researcher and industrialists' alike. Spirulina may be called a
super food because it contains remarkable concentration of nutrient known in any food,
plant, grain or herb. It is composed of 60 percent highly digestible vegetable protein, has
extremely high concentrations of beta carotene, vitamin B12, iron and trace minerals. It has
a balanced spectrum of amino acids; several recent studies have demonstrated the immune
enhancing and cancer preventive properties of spirulina. So study was conducted in
Muzaffarpur district on supplementation. The effect of cereal supplementation with
spirulina has been estimated in rat because our human body never be an experimental
body, so for lab testing we were utilizing animals for that rat is much more suitable.
Ultimately by study it may be concluded that spirulina based algal supplement is beneficial
for our malnourished population because before supplementation Protein Efficiency Ratio
(PER) of Maize, Rice & Wheat are 1.23, 2.20 and1.15 but after algal supplementation PER is
going to be increased like 1.72, 2.40 and 1.90 respectively. So by incorporating innovation
in approaches and application, to generate a better value through enrichment of traditional
diet. An optimum mix of tradition with modernity through food fortification by Spirulina
would be the key to achieve food security and bridge the health divide.This is the reason
that in real sense discovery of spirulina is a potent food source for the future.
No. of Pages: 6 No. of Tables: 3 References: 7
Keywords: Spirulina, Supplementation, Biofortification, Nutritional Security.
International Journal on Agricultural Sciences Vol. V (Issue 2), pp. 173-178, 2014
Corresponding author: [email protected]
Research Paper
Received on: 02.04.2014 Revised on: 16.04.2014 Accepted on: 18.05.2014

ISSN NO. 0976-450X
malnutrition Spirulina is the best future food
supplement. Spirulina is one of the foods that
environmentalists say could show mankind
the way out of the global food crisis. It can grow
in brackish water and poor soil. Also it
provides more nutrients per acre area than
most conventional crops. In the future,
biofortification hold promise as a sustainable
approach to improve micronutrient adequacy
in the diets of entire households in developing
countries.
Some research summarizes new developments
in food –based approaches, their advantages
and limitations and examines some of the
efficacy studies and programmes utilizing
f o o d – b a s e d s t r a t e g i e s t o a l l e v i a t e
micronutrient deficiencies (Rosalind S Gibson
2008). The poor quality of the habitual diet and
the lack of dietary diversity in much of the
developing world contribute to deficiencies of
micro & macronutrients (Shetty Prakash 2009).
The aim of this paper is to give an overall view
of the nutritional properties and health
benefits of spirulina. By these properties it
helps in eradication of hunger and
malnutrition from our state or nation. This
research definitely gives a different path for
nutritional security by using Spirulina as
future food supplements.
THE POTENTIAL OF SPIRULINAReferring here a review on spirulina (2011),
stated that “it appears today that spirulina
shows a significant potential for fighting
chronic malnutrition and for development. In
a report on spirulina, the FAO (2008) made two
recommendations in that regard, and which
are fully referenced in the review:
“International organization(s) working with
spirulina should consider preparing a
practical guide to small-scale spirulina
production. This small-scale production
should be orientated towards: (i) providing
nutritional supplements for widespread use in
rural and urban communities where the staple
diet is poor or inadequate; (ii) allowing
diversification from traditional crops in cases
where land or water resources are limited.”
“There is a role for both national governments
– as well as intergovernmental organizations –
to re-evaluate the potential of spirulina to fulfil
both their own food security needs as well as a
tool for their overseas development” The first
recommendation is widely followed today,
since the international organizations working
with spirulina continue their efforts for
development and humanitarian promotion. In
recent years, considerable progress has been
achieved in this domain in many countries and
on different aspects (technique, organization,
education, operation, studies).
The Uni ted Na t ions Wor ld Hea l th
Organisation (WHO) found Spirulina to be an
interesting food for multiple reasons, rich in
protein, iron and essential nutrients; and able
to be administered to children without any
risk. Scientific studies have explored its uses
to counter a wide array of pathologies
successfully that range from night blindness to
cancer; and the micro-algae has exhibited a
significant potential to be a panacea in many
cases such as in the victims of radiation
sickness in Belarus or patients or Bitot's spot in
Chennai.
Present forms of food aid by various agencies
focus on fighting hunger rather than treating
malnutrition especially in the context of the
needs of young children that are most at risk.
The access to food aid by people that suffer
because of malnutrition is also limited because
of the limited reach of the programmes. How
shall the international bodies and national
governments meet with their obligation
IJAS 2014 • 174
International Journal on Agricultural Sciences Vol. V (Issue 2), pp. 173-178, 2014

ISSN NO. 0976-450X
towards the peoples of the world in the mis-
match of processes and efficiency? The answer
is, by incorporating innovation in approaches
and application, to generate a better value
through enrichment of traditional diet. An
optimum mix of tradition with modernity
through food fortification by Spirulina would
be the key to achieve food security and bridge
the health divide.
It is now absolutely imperative that these
international organizations take a clear stance
on the use of spirulina in the fight against
malnutrition. Finally, there are many different
ways to incorporate spirulina into food
nowadays. In India, for instance, spirulina
biscuits and sweets have been locally
developed by Antenna Technologies and are
particularly enjoyed by thousands of children
(Heierli, 2007). The creation of new food
products that incorporate spirulina certainly
represents the best solution.
Nutritional attributes and health benefits of
Spirulina-In many ways, spirulina may be called a super
food. It contains the remarkable concentration
of nutrients known in any food, plant, grain, or
herb. It's composed of 60 percent highly
digestible vegetable protein and has extremely
high concentrations of beta carotene - Vitamin
B-12, iron and trace minerals. It has a balanced
spectrum of amino acids.
Several recent studies have demonstrated the
immune enhancing and cancer preventive
properties of spirulina. Scientists around the
world have been confirming spirulina's
cholesterol lowering benefits and its ability to
lower blood pressure. Studies with men in
Japan and India showed that several grams of
spirulina daily can reduce serum Low Density
Lipoprotein (LDL) and raise High Density
Lipoprotein (HDL). Spirulina has a high
protein concentration (60%-70% of it's a dry
weight). It is useful in human nutrition, due to
the high quality and quantity of its protein.
Quality of protein is judged by a) NPU (Net
Protein Utilization) and b) PER (Protein
Efficiency Ratio).
a) NPU (Net Protein Utilization)-The utilization of ingested protein is
determined by its digestibility, i.e. the
proportion of protein nitrogen absorbed and by
the amino acid composition (together with
other factors, such as age, sex and the
physiological status). The NPU value is
determined experimentally by calculating the
percentage of nitrogen retained (WHO 1973).
b) PER (Protein Efficiency Ration)-This is the weight gain of an individual,
divided by the weight of protein ingested.
Measurements are usually made on growing
rats. The PER value for spirulina determined in
growing rats is estimated between 1.80 and 2.6.
The sectrum of amino acids shows that the
biological value of proteins in spirulina is very
high, and that an optimum product could be
achieved by supplementation with a good
source of sulphur-containing amino acids and
possibly also lysine and or histidine. For
example cereals such as rice, wheat and millet
or certain oilseeds such as sesame should be
excellent supplements (Leonard- J & Compere-
P (1967).
Vitamins, minerals & trace elements: - It has
more than sufficient amount of vitamins,
minerals and trace elements which are as
shown by following Table 1and 2:-
The minerals of particular interest in spirulina
IJAS 2014 • 175
International Journal on Agricultural Sciences Vol. V (Issue 2), pp. 173-178, 2014
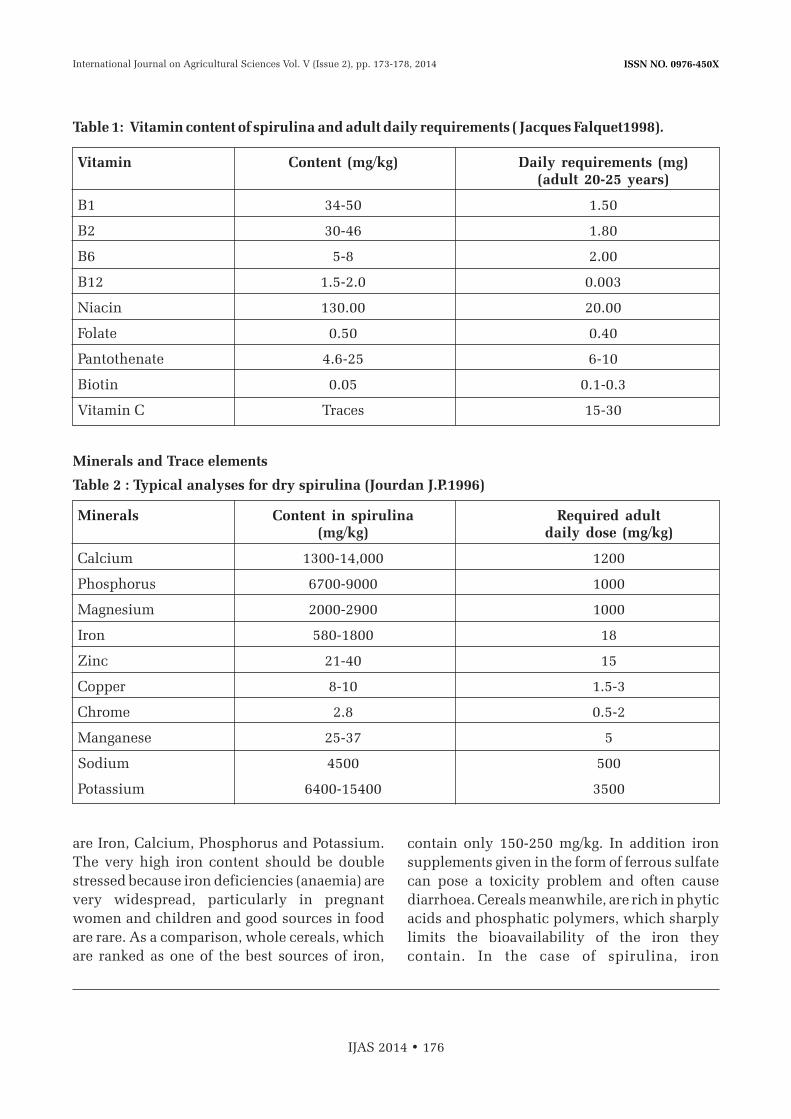
ISSN NO. 0976-450X
are Iron, Calcium, Phosphorus and Potassium.
The very high iron content should be double
stressed because iron deficiencies (anaemia) are
very widespread, particularly in pregnant
women and children and good sources in food
are rare. As a comparison, whole cereals, which
are ranked as one of the best sources of iron,
contain only 150-250 mg/kg. In addition iron
supplements given in the form of ferrous sulfate
can pose a toxicity problem and often cause
diarrhoea. Cereals meanwhile, are rich in phytic
acids and phosphatic polymers, which sharply
limits the bioavailability of the iron they
contain. In the case of spirulina, iron
IJAS 2014 • 176
Table 1: Vitamin content of spirulina and adult daily requirements ( Jacques Falquet1998).
Minerals and Trace elements
Table 2 : Typical analyses for dry spirulina (Jourdan J.P.1996)
Vitamin Content (mg/kg) Daily requirements (mg) (adult 20-25 years)
B1 34-50 1.50
B2 30-46 1.80
B6 5-8 2.00
B12 1.5-2.0 0.003
Niacin 130.00 20.00
Folate 0.50 0.40
Pantothenate 4.6-25 6-10
Biotin 0.05 0.1-0.3
Vitamin C Traces 15-30
Minerals Content in spirulina Required adult (mg/kg) daily dose (mg/kg)
Calcium 1300-14,000 1200
Phosphorus 6700-9000 1000
Magnesium 2000-2900 1000
Iron 580-1800 18
Zinc 21-40 15
Copper 8-10 1.5-3
Chrome 2.8 0.5-2
Manganese 25-37 5
Sodium 4500 500
Potassium 6400-15400 3500
International Journal on Agricultural Sciences Vol. V (Issue 2), pp. 173-178, 2014
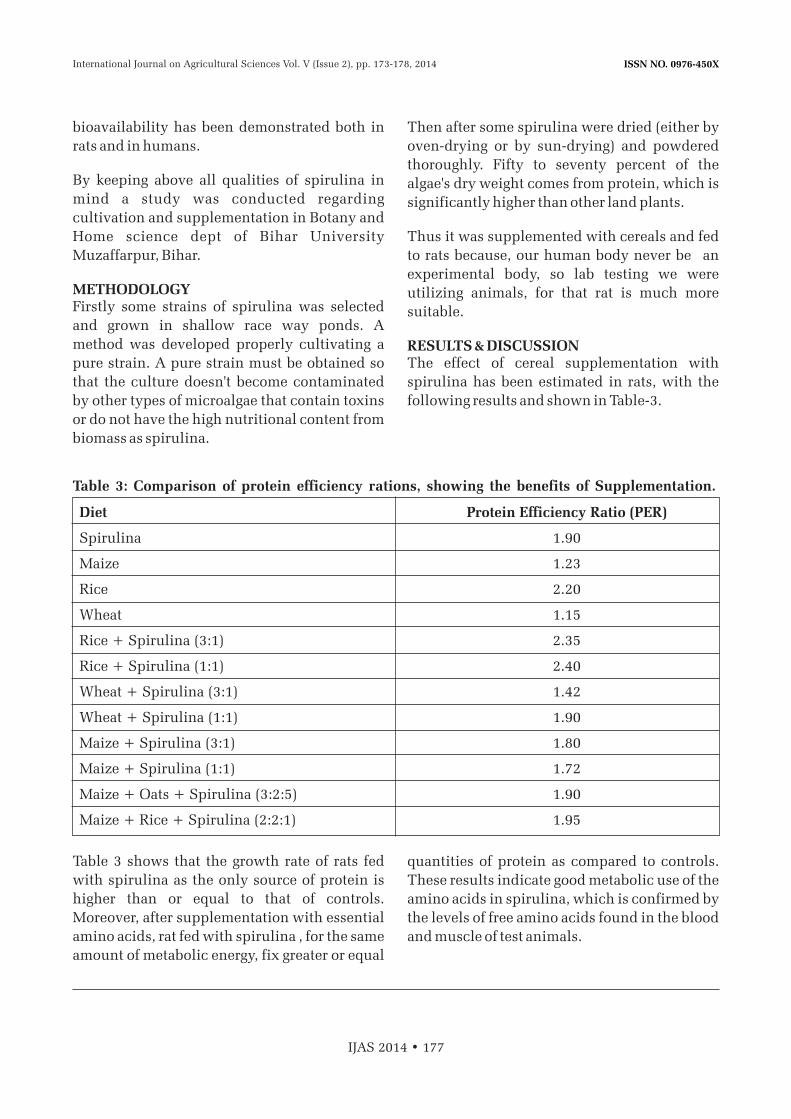
ISSN NO. 0976-450X
bioavailability has been demonstrated both in
rats and in humans.
By keeping above all qualities of spirulina in
mind a study was conducted regarding
cultivation and supplementation in Botany and
Home science dept of Bihar University
Muzaffarpur, Bihar.
METHODOLOGYFirstly some strains of spirulina was selected
and grown in shallow race way ponds. A
method was developed properly cultivating a
pure strain. A pure strain must be obtained so
that the culture doesn't become contaminated
by other types of microalgae that contain toxins
or do not have the high nutritional content from
biomass as spirulina.
Table 3 shows that the growth rate of rats fed
with spirulina as the only source of protein is
higher than or equal to that of controls.
Moreover, after supplementation with essential
amino acids, rat fed with spirulina , for the same
amount of metabolic energy, fix greater or equal
Then after some spirulina were dried (either by
oven-drying or by sun-drying) and powdered
thoroughly. Fifty to seventy percent of the
algae's dry weight comes from protein, which is
significantly higher than other land plants.
Thus it was supplemented with cereals and fed
to rats because, our human body never be an
experimental body, so lab testing we were
utilizing animals, for that rat is much more
suitable.
RESULTS & DISCUSSIONThe effect of cereal supplementation with
spirulina has been estimated in rats, with the
following results and shown in Table-3.
quantities of protein as compared to controls.
These results indicate good metabolic use of the
amino acids in spirulina, which is confirmed by
the levels of free amino acids found in the blood
and muscle of test animals.
IJAS 2014 • 177
Table 3: Comparison of protein efficiency rations, showing the benefits of Supplementation.
Diet Protein Efficiency Ratio (PER)
Spirulina 1.90
Maize 1.23
Rice 2.20
Wheat 1.15
Rice + Spirulina (3:1) 2.35
Rice + Spirulina (1:1) 2.40
Wheat + Spirulina (3:1) 1.42
Wheat + Spirulina (1:1) 1.90
Maize + Spirulina (3:1) 1.80
Maize + Spirulina (1:1) 1.72
Maize + Oats + Spirulina (3:2:5) 1.90
Maize + Rice + Spirulina (2:2:1) 1.95
International Journal on Agricultural Sciences Vol. V (Issue 2), pp. 173-178, 2014
ISSN NO. 0976-450X
CONCLUSIONMicro algae Spirulina (Spirulina platensis) has
been a traditional food in many countries. A
small quantity of Spirulina, when mixed with
traditional foods, tremendously increases its
inherent nutritional value besides making the
food easily digestible that can be readily
assimilated by the human body. Spirulina is
being produced in over 22 countries and
consumed in over 77 countries across the world.
From above mentioned study it may be
concluded that if mildly and significantly
malnourished children were fed algal
supplements then definitely their condition
will improve, problem associated with
malnutrition will overcome and ultimately
nutritional security will come. Of course the
nutritional value of spirulina is said to be a
recent discovery to the modern world, but in
reality it a rediscovery of a future food
resource.
REFERENCES
1. Jacues Faluet., 1998. The Nutritional
Aspects of spirulina.
2. Jourdan J.P., 1996.' Cultives votre
spiruline” Antenna Technology (to be
published).
3. Leonard J. & Compere P. 1967. Spirulina
Platensis (Gom.) Geitler, algue bleue de
grande valeur alimentaire par sa richesse
en proteins,” Bull. Nat. Plantentuin Belg.
37 (1), Suppl. 23p.
4. Rosalind S Gibson. 2008. University of
Otago, Dunedin, Newzealand.
5. Shetty Prakash. 2009. University of
Southampton School of Medicine,
Southampton,UK.
6. World Health Organization. 1973. Energy
and Protein Requirement.” World Health
Org. technical. Report Serial, No. 522
Geneva.
7. Heierli. 2007. A review on culture,
production and use of spirulina as food for
humans and feeds for domestic animals
and fish.
IJAS 2014 • 178
International Journal on Agricultural Sciences Vol. V (Issue 2), pp. 173-178, 2014
ISSN NO. 0976-450X
FRUIT-ROT OF RAMPHAL (ANNONA RETICULATA L.) AND THEIR CONTROL
*Ajeet Kumar Sharma and **R.B. Sharma
*Department of Botany, S.S.Jain Subodh Girls College, Sanganer, Jaipur, Rajasthan, India**Department of Botany, Saraswati (P.G.) College Hathras, Uttar Pradesh
INTRODUCTIONThe Little injury to the fruit invites the rot of
fruits is very common. The Ramphal (Annona
reticulata L.) are widely cultivated in western
part of uttarpradesh. Annoma reticulate L.
common commercial fruit in Uttarpradesh
which to used in Vegetables. A Survey to fruit
and Vegetable Market of Hatras, Kasganj, Etah
and Aligarh during 2012 to 13 about 18-24% of
Ramphal (Annoma reteculata L.) carred the rot
symptoms in fruit market. The infected fruit
patches were white, brown and black. The
severly infected ones showed Irrigular and
depression and excedation of the slimy
substance that emitted repulsive fermented
odour. The desease fruit were collected
separately in sterilized in Polythin bags and
brought to laboratory for carrying out the
preaent investigations. The pathogenic nature
isolates obtained was than tested on surface
sterilized healthy fruits by knife injury method
(Tondon & Mishra 1969). The amount of rot
(thind et. Al. 1976) differential symptoms
produced by pathogen in laboratory were
recorded. The Pathogen penic i l l ium
citrinum.thom was isolated from diseased part
ABSTRACT
Fruit rot of Annoma reticulate L. is found to the extent of 7-10% in the field and 18-24% in
market at Hathras, Kasganj, Etah and Aligarh during 2012 to 2013. Fruit of Ramphal
(Annona reteculata L.) infected patehes were white, brown and black. The severely infected
ones showed irregular and deperession and exudation of a smily substance that emitted
repulsive fermented odour penicillium cetrinum. Thom was isolated from diseased part of
lamphal (Annona reteculata L.)
The stuclies under taken present by show that the post harvest rot of fruit as caused by pencillium
citrinium them can be successfully prevented with 100 ppm concentration of bavistin and be
nomlyl. Which is an economically feasible proposition
No. of Pages: 6 No. of Tables: 4 References: 18
Keywords: Penicillium citrinum, Thom, Ramphal fruit, black scurf, Pathogenicity tests.
International Journal on Agricultural Sciences Vol. V (Issue 2), pp. 179-184, 2014
Corresponding author: [email protected]
Research Paper
Received on: 02.03.2014 Revised on: 05.05.2014 Accepted on: 07.06.2014
ISSN NO. 0976-450X
of Ramphal fruit (Annona reteculata L.). Latest
work on fruit rot given here pre-harvest
vegetable and fruit ( singh and surbhi 2001)
occurance of vegetable in market. (Sharma
R.B. and kumar 2007). Vegetable rots in market
(Sharma et. Al. 2003). New market disease of
Ramphal. (Sharma. Ajeet K. and R.B. Sharma
2013). Pre Harvest rots of fruit and vegetables.
(Sharma Ajeet K. et. al 2013). A soft Rot of
zizipus Lamark caused by Chaetomium
globosoum. (RamKrishan, T.S. and C.K.
Sowamini 1954). Rhizame and Root rot of
turmeric caused by phythium aphani-
dermatum. Sub (Reddy, G.S. and P.G. Rao
1973). Storage rot in seed rhizome of turmeric
in andhra Pradesh. (Rao et. al. 1982) New
Market disease of Barhal fruit, (Saugadi Y. G.
simbli 1998) pre harvest lycobial population
on Indian Ziziphus maratiana and their
application in post-harvest Pathogenasis.
(Sharma R.B. et. al. 2013).
MARERIALS AND METHODSThe pathogenicity of the fungus was
established on surface sterilized healthy
Ramphal fruit followings the knife injury
method of Tandon & Mishra (1969). Intensity
of the fruit rotting was evaluated at 15,20,25,30
and 35º C temperature and 30,60 and 90
percent relative humidity. Thirty replicates
were used for experimentation, The formula
was applied on individual Fruit described by
Thind et al. (1976). W-wPercent rot= ------------------x100 WWhere,
W= the weight of Ramphal fruit before
inoculations.w= the weight of Ramphal fruit tuber after
removal of rotted portion.Fifteen chemicals were tested by the poisoned
food techniqre (Schmitz 1930) for their in vitro
efficacy against the fungus. The required
amount of each chemical was mixed thoroughly
in Czapek's medium before pouring in the
plates. Four concentrations viz., 100, 500, 1000
and 2000 ppm were employed in the present
experiment. Ten days old uniform culture of the
fungus raised on Czapek's medium was
transferred in the adulterated and control plates.
The radial growth of the fungus over them was
measured after 3, 5 and 7 days of incubation at
30±1ºC temperature.
The chemicals found most effective in invitro
tests were used for in-vivo control of the
present rot disease. Pre inoculation dip of the
healthy fruits in each chemical solution was
made for 10, 20 and 30 minutes. These tubes
were inoculated by the fungus after 24 hours of
the chemical treatment. The development of
rot was measured after 7, 14 and 21 days of
inoculation period in each case. Inoculated
tubers were earlier incubated under optimum
conditions (30±1ºC Temperature and 90%
relative humidity). The effective chemicals
were also tried in post inoculation tests. The
Chemical concentrations, mode of their
treatments and evaluation of the treatment
effect on rots remained the same as for the pre-
inoculation ones.
RESULTS AND DISCUSSION
Effect of temperatureThe fungus Penicillium citrinum. Thom.
induced maximum amount of rotting at 30ºC
temperature (Table 1). With the decrease in
the incubation temperature, the extent of
rotting was progressively decreased. So much
so that no rotting was evident at 15-24ºC even
when stored for 21 days. Higher incubation
temperature (35ºC) also had retarding effect
but lesser than at 28ºC.Effect of relative humidity
IJAS 2014 • 180
International Journal on Agricultural Sciences Vol. V (Issue 2), pp. 179-184, 2014
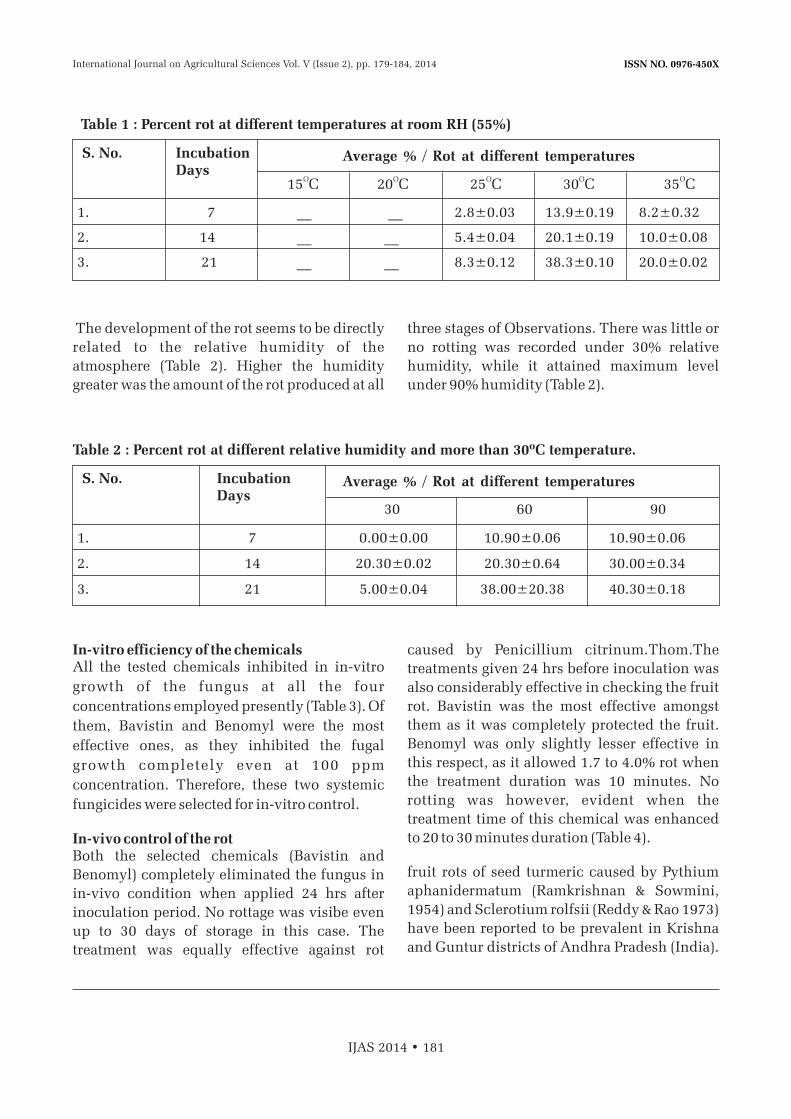
ISSN NO. 0976-450X
The development of the rot seems to be directly
related to the relative humidity of the
atmosphere (Table 2). Higher the humidity
greater was the amount of the rot produced at all
In-vitro efficiency of the chemicalsAll the tested chemicals inhibited in in-vitro
growth of the fungus at all the four
concentrations employed presently (Table 3). Of
them, Bavistin and Benomyl were the most
effective ones, as they inhibited the fugal
growth completely even at 100 ppm
concentration. Therefore, these two systemic
fungicides were selected for in-vitro control.
In-vivo control of the rot Both the selected chemicals (Bavistin and
Benomyl) completely eliminated the fungus in
in-vivo condition when applied 24 hrs after
inoculation period. No rottage was visibe even
up to 30 days of storage in this case. The
treatment was equally effective against rot
three stages of Observations. There was little or
no rotting was recorded under 30% relative
humidity, while it attained maximum level
under 90% humidity (Table 2).
caused by Penicillium citrinum.Thom.The
treatments given 24 hrs before inoculation was
also considerably effective in checking the fruit
rot. Bavistin was the most effective amongst
them as it was completely protected the fruit.
Benomyl was only slightly lesser effective in
this respect, as it allowed 1.7 to 4.0% rot when
the treatment duration was 10 minutes. No
rotting was however, evident when the
treatment time of this chemical was enhanced
to 20 to 30 minutes duration (Table 4).
fruit rots of seed turmeric caused by Pythium
aphanidermatum (Ramkrishnan & Sowmini,
1954) and Sclerotium rolfsii (Reddy & Rao 1973)
have been reported to be prevalent in Krishna
and Guntur districts of Andhra Pradesh (India).
IJAS 2014 • 181
Table 1 : Percent rot at different temperatures at room RH (55%)
Table 2 : Percent rot at different relative humidity and more than 30ºC temperature.
S. No.
S. No.
IncubationDays
IncubationDays
Average % / Rot at different temperatures
Average % / Rot at different temperatures
O15 C O O O O
20 C 25 C 30 C 35 C
30 60 90
1. 7 __ __ 2.8±0.03 13.9±0.19 8.2±0.32
2. 14 __ __ 5.4±0.04 20.1±0.19 10.0±0.08
3. 21 __ __ 8.3±0.12 38.3±0.10 20.0±0.02
1. 7 0.00±0.00 10.90±0.06 10.90±0.06
2. 14 20.30±0.02 20.30±0.64 30.00±0.34
3. 21 5.00±0.04 38.00±20.38 40.30±0.18
International Journal on Agricultural Sciences Vol. V (Issue 2), pp. 179-184, 2014
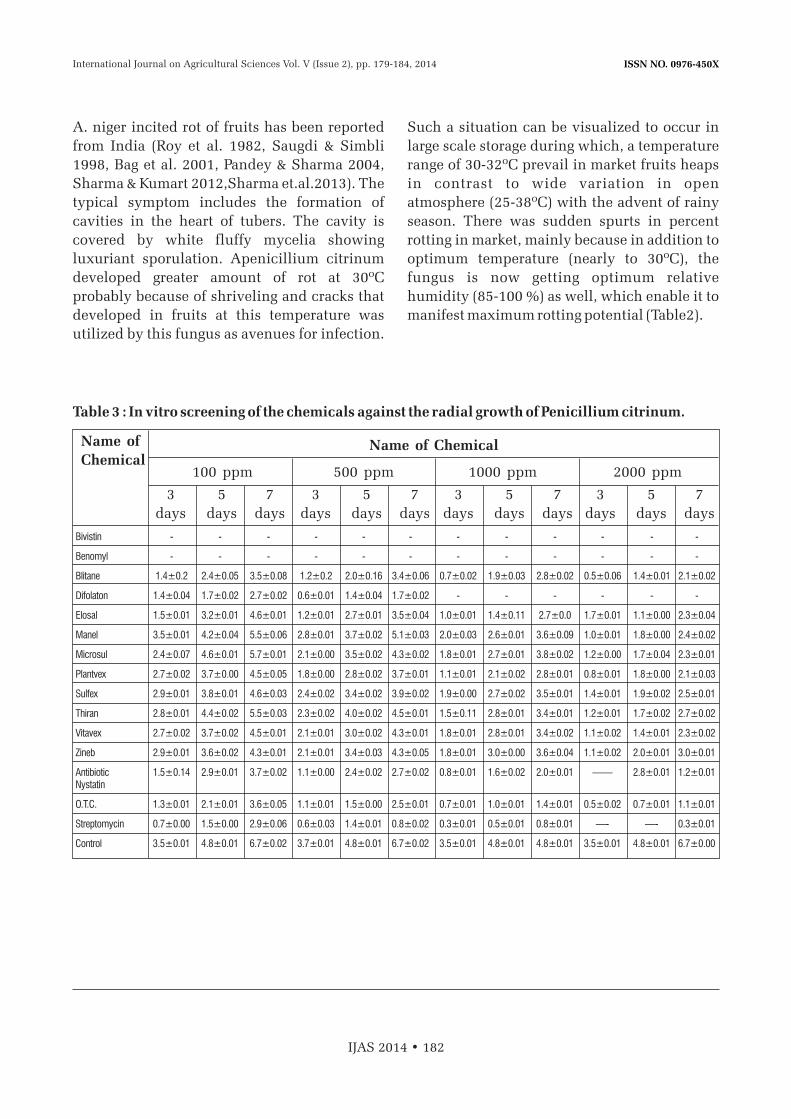
ISSN NO. 0976-450X
A. niger incited rot of fruits has been reported
from India (Roy et al. 1982, Saugdi & Simbli
1998, Bag et al. 2001, Pandey & Sharma 2004,
Sharma & Kumart 2012,Sharma et.al.2013). The
typical symptom includes the formation of
cavities in the heart of tubers. The cavity is
covered by white fluffy mycelia showing
luxuriant sporulation. Apenicillium citrinum
developed greater amount of rot at 30ºC
probably because of shriveling and cracks that
developed in fruits at this temperature was
utilized by this fungus as avenues for infection.
Such a situation can be visualized to occur in
large scale storage during which, a temperature
range of 30-32ºC prevail in market fruits heaps
in contrast to wide variation in open
atmosphere (25-38ºC) with the advent of rainy
season. There was sudden spurts in percent
rotting in market, mainly because in addition to
optimum temperature (nearly to 30ºC), the
fungus is now getting optimum relative
humidity (85-100 %) as well, which enable it to
manifest maximum rotting potential (Table2).
IJAS 2014 • 182
Table 3 : In vitro screening of the chemicals against the radial growth of Penicillium citrinum.
Bivistin - - - - - - - - - - - -
Benomyl - - - - - - - - - - - -
Blitane 1.4±0.2 2.4±0.05 3.5±0.08 1.2±0.2 2.0±0.16 3.4±0.06 0.7±0.02 1.9±0.03 2.8±0.02 0.5±0.06 1.4±0.01 2.1±0.02
Difolaton 1.4±0.04 1.7±0.02 2.7±0.02 0.6±0.01 1.4±0.04 1.7±0.02 - - - - - -
Elosal 1.5±0.01 3.2±0.01 4.6±0.01 1.2±0.01 2.7±0.01 3.5±0.04 1.0±0.01 1.4±0.11 2.7±0.0 1.7±0.01 1.1±0.00 2.3±0.04
Manel 3.5±0.01 4.2±0.04 5.5±0.06 2.8±0.01 3.7±0.02 5.1±0.03 2.0±0.03 2.6±0.01 3.6±0.09 1.0±0.01 1.8±0.00 2.4±0.02
Microsul 2.4±0.07 4.6±0.01 5.7±0.01 2.1±0.00 3.5±0.02 4.3±0.02 1.8±0.01 2.7±0.01 3.8±0.02 1.2±0.00 1.7±0.04 2.3±0.01
Plantvex 2.7±0.02 3.7±0.00 4.5±0.05 1.8±0.00 2.8±0.02 3.7±0.01 1.1±0.01 2.1±0.02 2.8±0.01 0.8±0.01 1.8±0.00 2.1±0.03
Sulfex 2.9±0.01 3.8±0.01 4.6±0.03 2.4±0.02 3.4±0.02 3.9±0.02 1.9±0.00 2.7±0.02 3.5±0.01 1.4±0.01 1.9±0.02 2.5±0.01
Thiran 2.8±0.01 4.4±0.02 5.5±0.03 2.3±0.02 4.0±0.02 4.5±0.01 1.5±0.11 2.8±0.01 3.4±0.01 1.2±0.01 1.7±0.02 2.7±0.02
Vitavex 2.7±0.02 3.7±0.02 4.5±0.01 2.1±0.01 3.0±0.02 4.3±0.01 1.8±0.01 2.8±0.01 3.4±0.02 1.1±0.02 1.4±0.01 2.3±0.02
Zineb 2.9±0.01 3.6±0.02 4.3±0.01 2.1±0.01 3.4±0.03 4.3±0.05 1.8±0.01 3.0±0.00 3.6±0.04 1.1±0.02 2.0±0.01 3.0±0.01
Antibiotic 1.5±0.14 2.9±0.01 3.7±0.02 1.1±0.00 2.4±0.02 2.7±0.02 0.8±0.01 1.6±0.02 2.0±0.01 —— 2.8±0.01 1.2±0.01Nystatin
O.T.C. 1.3±0.01 2.1±0.01 3.6±0.05 1.1±0.01 1.5±0.00 2.5±0.01 0.7±0.01 1.0±0.01 1.4±0.01 0.5±0.02 0.7±0.01 1.1±0.01
Streptomycin 0.7±0.00 1.5±0.00 2.9±0.06 0.6±0.03 1.4±0.01 0.8±0.02 0.3±0.01 0.5±0.01 0.8±0.01 —- —- 0.3±0.01
Control 3.5±0.01 4.8±0.01 6.7±0.02 3.7±0.01 4.8±0.01 6.7±0.02 3.5±0.01 4.8±0.01 4.8±0.01 3.5±0.01 4.8±0.01 6.7±0.00
Name of
ChemicalName of Chemical
100 ppm 500 ppm 1000 ppm 2000 ppm
3
days
3
days
3
days
3
days
5
days
5
days
5
days
5
days
7
days
7
days
7
days
7
days
International Journal on Agricultural Sciences Vol. V (Issue 2), pp. 179-184, 2014

ISSN NO. 0976-450X
The studies undertaken presently show that the
post harvest rot of Ramphal (annona reteculata
L.) fruits as caused by Penicillium citrinum.
Thom can be successfully prevented and
controlled by pre-inoculation treatment with
100 ppm concentration of Bavistin and
Benomly 1, which is an economically feasible
proposition
ACKNOWLEDGEMENT The authors are grateful to Dr. A. N. Roy, Head,
Department of Botany, Agra Collage, Agra, for
providing laboratory facilities and University
Grant Commission (UGC) for financial
assistance.
REFERENCESth
1. Agrios, G.N. 1997. Plant Pathology, 4 Ed.
Academic Press, San Diego, CA,USA.
2. Bag, M.K.,S. Pan & D.K. Agrawal. 2001.
Etiology and management of storage rot of
gingew in Himachal Pradesh. Indian
Phytopath.,54(1):49-54.
3. Grosch, R.,F. Faltin, J. Lottmann, A. Kofoet
& G. Berg 2005. Effectiveness of 3
antagonistic bacterial isolates to control
Rhizoctonia solani Kuhn on lettuce and
potato. Canadian J. Microbial.,51:345-353.
4. Han, J. S., Cheng, T.M. Yoon, J. Song, A.
Rajkarnikar, W.G. Kim, I. D. Yoo, Y.Y.
Yang & J.W. Suh. 2005. Biological control
agent of common scab disease by
antagonistic strain Bacillus sp. Sunjua. J.
Appl. Microbiol., 99: 213-221.
5. Pandey, R.K. & R.B. Sharma. 2004. Fruit
rot of barhal and their control. Current
Bioscience, 2(2): 1-5.
6. Ramkrishan, T.S. & C.K. Sowamini. 1954.
Rhizome and root rot of turmeric caused
by Phythium aphanidermatum Sub.
Indian Phytopath, 7: 152-158.
7. Reddy, G.S. & P.G. Rao 1973. Storage rot in
seed rhizomes of turmeric in Andhra
Pradesh. Indian Phytopath., XXVI, 24.
8. Roy, A. N., R. B. Sharma & B.P. Sinha.
1982. New market disease of Barhal fruit.
Cur, Sci., 51(3): 143.
9. Saugdi, Y. & G. Simbli. 1998. Pre-harvest
lycobial population on Indian Ziziphus
maritiana and their application in post-
IJAS 2014 • 183
Table 4 : Pre-inoculation treatment (RH-90%,Temp.30±1°C) with 100 ppm concentration
1. Bavistin 10 - - -
20 - - -
30 - - -
2. Benomy1 10 1.7±0.03 2.6±0.03 4.0±0.02
20 - - -
30 - - -
3. Control 30 17.1±0.23 33.9±0.24 39.3±0.14
Sl. No. Chemical Treatment
Time
(in Minutes) 7 14 21
Incubation
International Journal on Agricultural Sciences Vol. V (Issue 2), pp. 179-184, 2014
ISSN NO. 0976-450X
harvest pathogenesis. Mycopathologia
142:77-80.
10. Schmitz, H. 1930. Poisoned food
technique. Indust. Engin, Chem. Analyst.
Ed. 2 Pp. 361-363.
11. Sharma , R. B. & S. Kumar 2012. Post
harvest diseases of Ashgourd. Bioscience
Guardian, 2 (11): 181-182.
12. Sharma, R.B.,Pooja Sharma and Afsha
Khan. 2013, Rot of Potato and thuir
control. Journal of the Kalash Science,
1(1) 43-48.
13. Tondon, R.N. & A.N. Mishra. 1969.
Pathogencity by knife injury method.
Indian Phytopath.,22:334.
14. Thind, T.S., S.B. Saxena and S. C.
Agarwal. 1979. Effect of temperature in
control of soft rot of apple fruits caused
by Clathoridium corticola. Indian
Phytopath., 29(3): 250-258.
15. Sharma. Ajeet. K. , R.B. Sharma and A.K.
Sharma. 2013. A soft rot of Zizipus
Jumba Lamk caused by ctiaeromium
globosoum. International Journal of
Research in plant Science XX: YY.
A v a i l a b l e o n l i n e a t
http/www.urpjournals.com.
16. Sharma. Ajeet.K. and Sharma. 2013. pre
Harvest Rot of fruit and vegetables.
International Journal of Research in
Botany. XXX: YYY. Available on line at
http\\www.urp Journals.com
17. Wharton, P. & W. Kirk. 2007. Fusarium
Dry Rot. http://www.potatodiseases.
Org.contact. html.
18. Yao, M.K., R.J. Tweddell & H. Desilets 2002.
Effect of two vesicular- arbuscualr
mycorrhizal fungi on the growth of
micropropagated potato plantlests and on
the extent of disease caused by Rhizoctonia
solani. Mycorrhiza, 12:235-342.
IJAS 2014 • 184
International Journal on Agricultural Sciences Vol. V (Issue 2), pp. 179-184, 2014

ISSN NO. 0976-450X
EXTENSION & DEVELOPMENT ACTIVITIES FOR ENHANCING THE ADOPTION OF INTEGRATED PEST MANAGEMENT (IPM) TECHNOLOGIES AMONG CHILLI GROWERS IN KARNATAKA
Kumara N., Jnanesh A.C., Sachidananda S.N., Hanumanthe Gowda B. and Manoj R.
Devarahally, Lakshmisagara Post, SiraTaluk, Tumkur District-572139, Karnataka
INTRODUCTIONVegetables constitute about 55 per cent of
horticultural crop production in the country
with a total production of 85 million tonnes
which is estimated to cross 100 million tonnes
in near future. Successful cultivation of
vegetables is hampered due to the incidence of
several insect pests. Cultivation of hybrids,
improved varieties, intensive agronomic
practices, off season cultivation and
indiscriminate use of insecticides has changed
the pest complex in these crops.
Chilli is considered as one of the commercial
spice crops. It is the most widely used universal
spice, named as wonder spice. Different varieties
are cultivated for varied uses like vegetable,
pickles, spice and condiments. In daily life,
chilies are integral and the most important
ingredient in many different cuisines around the
world as it adds pungency, taste, flavor and color
to the dishes. Indian chilli is considered to be the
world famous for two important commercial
qualities its colour and pungency level.
The largest producer of chillies in the world is
India accounting for 11 lakh tons of production
annually followed by China with a production
ABSTRACT
The study was conducted in Chickmagalore and Kadur taluks of Chickmagalore District of
Karnataka state. Integrated Pest Management Practices in Chilli during 2013 and 2014.Study
reveals that use of drip irrigation, fertigation technology, and management of pests &
Diseases, Drying & grading for marketing and use of foliar nutrition in Chilli brought the
benefit cost ratio for Chilli IPM farmers compared to farmers' of traditional practice, from
1.47 to 1.83. Whereas increasing yield in farmers who were under Extention & Development
Activities Team was 810 Kg of Red Chilli per acre compared to 750 Kg of red Chilli in non-
IPM farmers. Adoption of IPM technologies was increased to 65.42 percent among the
farmers who were under Extention & Development Activities.
No. of Pages: 11 No. of Tables: 3 References: 5
Keywords: Pest, Chilli, Development, Extension.
International Journal on Agricultural Sciences Vol. V (Issue 2), pp. 185-195, 2014
Corresponding author: [email protected]
Research Paper
Received on: 12.05.2014 Revised on: 25.05.2014 Accepted on: 28.06.2014

ISSN NO. 0976-450X
of around 4 lakh tons. Mexico and Pakistan
produces 3 lakhs tonnes each of chili every
year.In India, Chilli was grown on an area of
8.82 Lakh ha and annual production of 11.0 lakh
tones and with an average productivity of 1200
kg/ha (Anon., 2002). Among Chilli producing
states in the country Andhra Pradesh stands
first in the list of leading chilli-producing states
in India and also constitutes the maximum
acreage for chilli cultivation in the country. It
occupies 49% share in the Indian total
production and produces around 2.7 lakh tons
of chillies followed by Orissa (18%), Karnataka
(15%), Maharashtra (6%), West Bengal (5%),
Rajasthan (4%) and Tamil Nadu (3%)
(www.ikisan.com).
Karnataka state stands 3rd in contribution of
Chilli production to country. We have different
chilli varieties such as Byadagikaddi,
Byadagidabbi, Guntur (G-4), Pusa jwala, KDSC-
1, etc. are cultivated by farmers, however
Byadagi & Guntur varieties has been
recommended for cultivation. These varieties
gaining the popularity among the farmers of the
state also, because of chillies are famous for red
colour because of the pigment 'capsanthin,'
others are known for biting pungency attributed
to 'capsaicin.
IJAS 2014 • 186
Per acre cost of cultivation of chilli (Units/Acre) (Rajur, B.C., B.L. Patil and Basavraj, 2008.
Economics of chilli production in Karnataka, Karnataka J. Agric. Sci., 21(2): 237-240).
Sr. Particulars Units Quantity Total cost % of No. Total cost
1 Hired human labour 1 Male Days 10.40 1040.00 2.572 female Days 108.37 7585.90 18.71
2 Bullock labour Pair Days 3.46 1038.00 3.40
3 Seeds / Seedlings Kg /No 0.60/6000 1380.00 3.40
4 Manure Quintal 4.37 437.50 1.08
5 Fertilizers
N Kg 81.92 996.97 2.46
P Kg 72.64 1725.20 4.25
K Kg 38.17 330.55 0.81
6 Irrigation No 16 5600.00 13.81
7 Plant Protection chemicals No 8 2544.58 6.28
8 Machineries & implements - - 833.33 2.05
9 Land revenue and other cesses - - 42.52 0.11
10 Depreciation - - 558.53 1.38
11 Interest on working capital - - 1410.72 3.48@12% for 6 m
Cost ‘A’ 25523.80 62.95
International Journal on Agricultural Sciences Vol. V (Issue 2), pp. 185-195, 2014
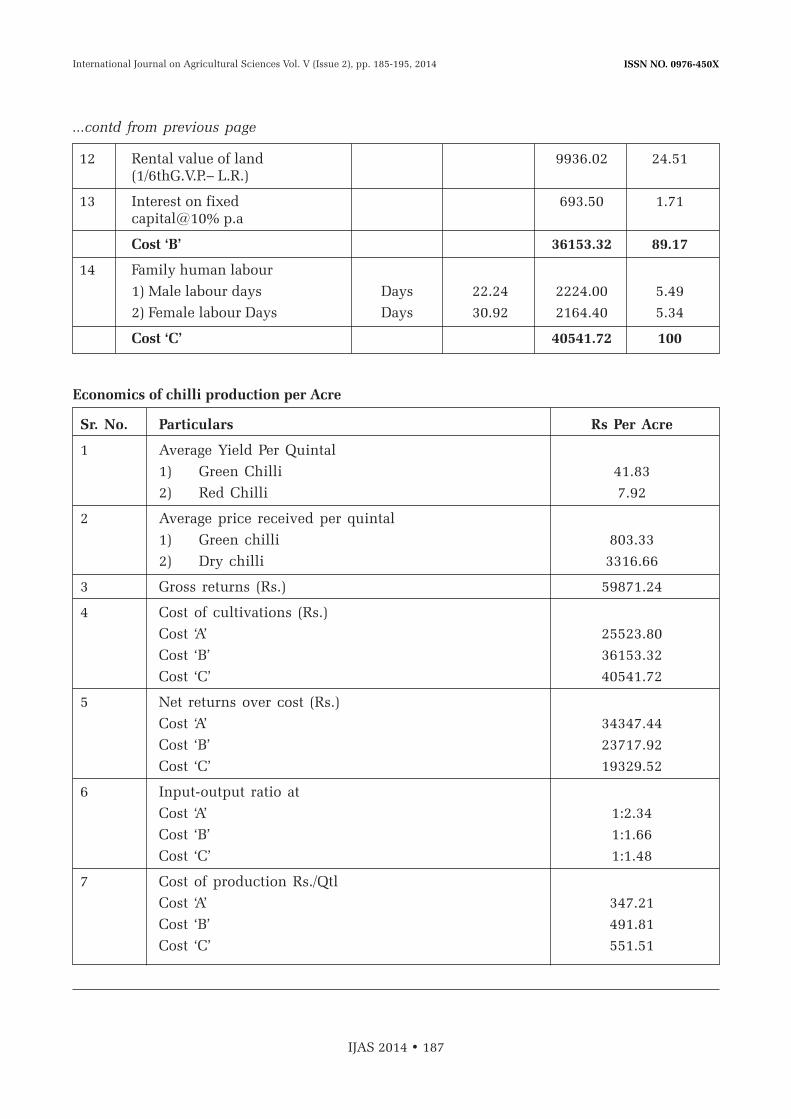
ISSN NO. 0976-450X
IJAS 2014 • 187
...contd from previous page
12 Rental value of land 9936.02 24.51(1/6thG.V.P.– L.R.)
13 Interest on fixed 693.50 1.71capital@10% p.a
Cost ‘B’ 36153.32 89.17
14 Family human labour
1) Male labour days Days 22.24 2224.00 5.49
2) Female labour Days Days 30.92 2164.40 5.34
Cost ‘C’ 40541.72 100
Economics of chilli production per Acre
Sr. No. Particulars Rs Per Acre
1 Average Yield Per Quintal
1) Green Chilli 41.83
2) Red Chilli 7.92
2 Average price received per quintal
1) Green chilli 803.33
2) Dry chilli 3316.66
3 Gross returns (Rs.) 59871.24
4 Cost of cultivations (Rs.)
Cost ‘A’ 25523.80
Cost ‘B’ 36153.32
Cost ‘C’ 40541.72
5 Net returns over cost (Rs.)
Cost ‘A’ 34347.44
Cost ‘B’ 23717.92
Cost ‘C’ 19329.52
6 Input-output ratio at
Cost ‘A’ 1:2.34
Cost ‘B’ 1:1.66
Cost ‘C’ 1:1.48
7 Cost of production Rs./Qtl
Cost ‘A’ 347.21
Cost ‘B’ 491.81
Cost ‘C’ 551.51
International Journal on Agricultural Sciences Vol. V (Issue 2), pp. 185-195, 2014

ISSN NO. 0976-450X
The viral diseases as well as ravages caused by insect pests are significant ones in the chilli crop(Gundannavaret al2007). The pest spectrum in chilli is complex with more than 293 insects and mite species debilitating the crop in the field as well as in storage (Anon, 1987).. A total of 39 and 57 insect pests were recorded in chillies in Karnataka on nursery and field crops, respectively (Reddy and Puttaswamy, 1983 and 1984). During the last two decades insecticidal control of chilli pests in general and especially in irrigated crop characterised by high pesticides usage, has posed problems of residues in the fruits (Nandihalli 1979 and Joiaet al 2001). Besides pest resurgence, insecticide resistance and destruction of natural enemies (Mallikarjuna Rao and Ahmed, 1986), both domestic consumption and export of chilli necessitate production of quality chillies devoid of contamination of pesticides, industrial chemicals and aflatoxins. The pesticide consumption is in down trend in cotton with the introduction of Bt cotton but not the case of chilli. Many instances the dry chilli exports from Indian market were rejected because of pesticide residue problem. Hence, the need of the popularization of IPM technology in Chilli is felt. The project was started with the special objective of educating chilli farmers of nine selected villages in Chickmagalore & Kadur Taluks of Chickmagalore district of Karnataka
on rational use of crop protection chemicals in an integrated pest management approach and thereby reduces the problem of pesticide residues in the harvested produce.
Research MethodologyA study on enhancing IPM technology in Chilli was conducted in Chickmagalore and Kadur taluks of chickmagalore District in Karnataka where Byadagikaddi chilli variety grown predominantly. The Training programmes and field advisory visits on IPM in Chilli was conducted in 9 villages of the two Taluks with help of 50 Chilli farmers. The selected farmers were briefed about, the IPM technology and its importance in initial group meetings with the selected farmers. Continuous field visits was done by the Extention team. Regular feedback on progress of the crop, pest and disease incidence was collected from the field. Regular interaction meetings were conducted with farmers to integrate appropriate IPM technologies into their existing cultivation practices.
Details of Training programmes & Field Advisory done by Extention Team.On 06-11-2013 training programme conducted at Chikkangla village kadur Taluk around 25 Farmers attended. Mr Lingaraju AHO Kadur, Mr Muhammad Shafi, Scintific Officer, ICRISAT and Extention team were present.
IJAS 2014 • 188
International Journal on Agricultural Sciences Vol. V (Issue 2), pp. 185-195, 2014

ISSN NO. 0976-450X
On 25th Nov., 2013, 2nd training programme was organised at Uddeboranhalli Chick-magalore. The programme was chaired by AHO Mr. Kumar, & Mr. N. Kumar, ICRISAT's Mr. Muhammad Shafi and Mr. Jaysingh representative of the chilli processing company (Paprica Oleos India Pvt. Ltd.) were present.
IJAS 2014 • 189
Field Advisory on IPM in Chilli BY N Kumara & Extention Team
Field Visits BY N Kumara & Extention Team
International Journal on Agricultural Sciences Vol. V (Issue 2), pp. 185-195, 2014
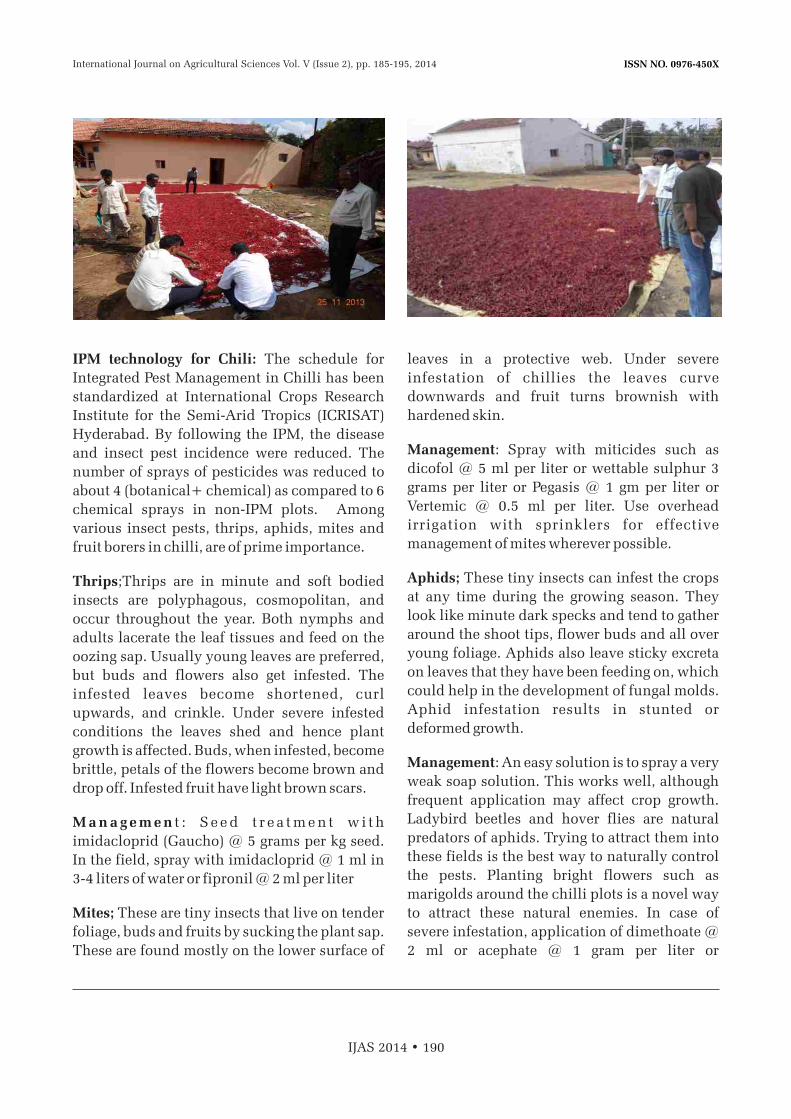
ISSN NO. 0976-450X
IJAS 2014 • 190
IPM technology for Chili: The schedule for
Integrated Pest Management in Chilli has been
standardized at International Crops Research
Institute for the Semi-Arid Tropics (ICRISAT)
Hyderabad. By following the IPM, the disease
and insect pest incidence were reduced. The
number of sprays of pesticides was reduced to
about 4 (botanical+ chemical) as compared to 6
chemical sprays in non-IPM plots. Among
various insect pests, thrips, aphids, mites and
fruit borers in chilli, are of prime importance.
Thrips;Thrips are in minute and soft bodied
insects are polyphagous, cosmopolitan, and
occur throughout the year. Both nymphs and
adults lacerate the leaf tissues and feed on the
oozing sap. Usually young leaves are preferred,
but buds and flowers also get infested. The
infested leaves become shortened, curl
upwards, and crinkle. Under severe infested
conditions the leaves shed and hence plant
growth is affected. Buds, when infested, become
brittle, petals of the flowers become brown and
drop off. Infested fruit have light brown scars.
M a n a g e m e n t : S e e d t r e a t m e n t w i t h
imidacloprid (Gaucho) @ 5 grams per kg seed.
In the field, spray with imidacloprid @ 1 ml in
3-4 liters of water or fipronil @ 2 ml per liter
Mites; These are tiny insects that live on tender
foliage, buds and fruits by sucking the plant sap.
These are found mostly on the lower surface of
leaves in a protective web. Under severe
infestation of chillies the leaves curve
downwards and fruit turns brownish with
hardened skin.
Management: Spray with miticides such as
dicofol @ 5 ml per liter or wettable sulphur 3
grams per liter or Pegasis @ 1 gm per liter or
Vertemic @ 0.5 ml per liter. Use overhead
irrigation with sprinklers for effective
management of mites wherever possible.
Aphids; These tiny insects can infest the crops
at any time during the growing season. They
look like minute dark specks and tend to gather
around the shoot tips, flower buds and all over
young foliage. Aphids also leave sticky excreta
on leaves that they have been feeding on, which
could help in the development of fungal molds.
Aphid infestation results in stunted or
deformed growth.
Management: An easy solution is to spray a very
weak soap solution. This works well, although
frequent application may affect crop growth.
Ladybird beetles and hover flies are natural
predators of aphids. Trying to attract them into
these fields is the best way to naturally control
the pests. Planting bright flowers such as
marigolds around the chilli plots is a novel way
to attract these natural enemies. In case of
severe infestation, application of dimethoate @
2 ml or acephate @ 1 gram per liter or
International Journal on Agricultural Sciences Vol. V (Issue 2), pp. 185-195, 2014

ISSN NO. 0976-450X
IJAS 2014 • 191
imidacloprid @ 1 ml in 3-4 liters can effectively
manage aphids.
Fruit borers: Fruit borers are highly
polyphagous and cosmopolitan in distribution.
These normally start infesting chilli crop
around flowering time. Young larvae feed on
leaves by scraping chlorophyll, while grown- up
larvae feed on leaves and fruits resulting in
holes. Well grown Spodoptera larvae are
nocturnal in habit and hide in the soil during
the day time.
Management: Installation of pheromone traps
for Spodoptera litura and Helicoverpa armigera
are of immense value in monitoring this pest.
Planting sunflower along the borders can attract
ovipositing moths, thereby saving the main crop
from infestation. Use of poison baits (8:1:1 bran,
jaggery and chloripyriphos) and placing them
close to the plants proved effective in
cont ro l l ing immigra t ing Spodopte ra
caterpillars (25 kg bait is sufficient for one ha).
Foliar spray with Bacillus thuringiensis (Bt) at
recommended. application of indoxacarb @ 1
ml per liter or spinosad @ 0.3 ml per liter will be
effective. Also, for Spodoptera and Helicoverpa,
application of nuclear polyhedrosis virus (NPV)
@ 500 LE per ha at the early stage of the pest
infestation proved to be an effective control.
ICRISAT, Hyderabad -IPM module
Activity
Seed treatment
Management of sucking pests
Sowing trap crops
Installation of pheromone traps and bird perches
Management of thrips in main crop
Management of mites
Management of fruit borers
Stage of crop
Sowing time
Nursery
At the time of transplanting
At the time of transplanting
Transplanting to one month before harvest
In the nursery and main crop
Flowering stage
Management option
Imidacloprid (Gaucho) @ 5 grams per kg seed
Imidacloprid @ 1 ml in 3-4 liters of water or fipronil @2 ml per liter.
Sunflower and marigold as border crop .
Two traps per location for each species About 25 perches/ha
Overhead irrigation with sprinklers wherever possible .Imidacloprid @ 1 ml in 3-4 liters of water or fipronil @ per Ltr of Water
Overhead irrigation with sprinklers wherever possible. Spray one of these chemicals once in the nursery and second time in the main crop - dicofol @ 5 ml per liter or wettable sulphur 3 grams per liter or Pegasis @ 1 gm per liter or Vertemic @ 0.5 ml per liter
Application of neem fruit powder extract @ 25 kg ha-1 NPV @ 500 LE/ha, Bt 4 ml per liter.
International Journal on Agricultural Sciences Vol. V (Issue 2), pp. 185-195, 2014
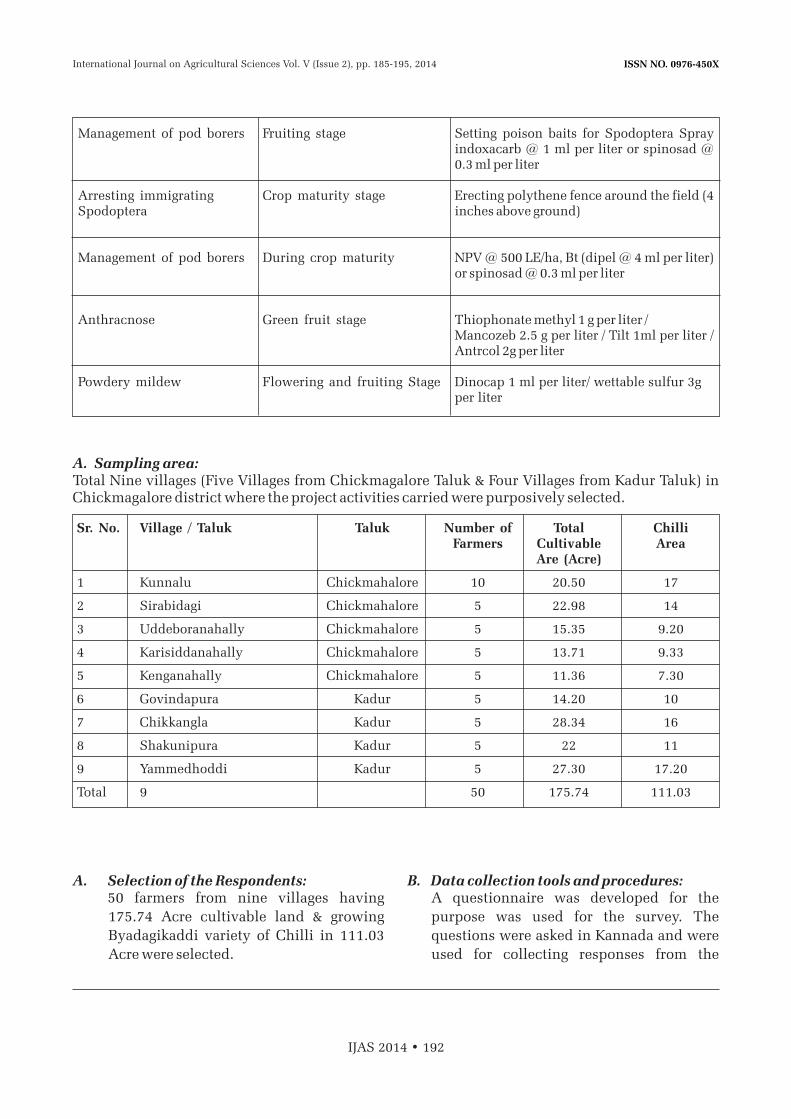
ISSN NO. 0976-450X
A. Selection of the Respondents:50 farmers from nine villages having
175.74 Acre cultivable land & growing
Byadagikaddi variety of Chilli in 111.03
Acre were selected.
B. Data collection tools and procedures:A questionnaire was developed for the
purpose was used for the survey. The
questions were asked in Kannada and were
used for collecting responses from the
IJAS 2014 • 192
Management of pod borers
Arresting immigrating Spodoptera
Management of pod borers
Anthracnose
Powdery mildew
Fruiting stage
Crop maturity stage
During crop maturity
Green fruit stage
Flowering and fruiting Stage
Setting poison baits for Spodoptera Spray indoxacarb @ 1 ml per liter or spinosad @ 0.3 ml per liter
Erecting polythene fence around the field (4 inches above ground)
NPV @ 500 LE/ha, Bt (dipel @ 4 ml per liter) or spinosad @ 0.3 ml per liter
Thiophonate methyl 1 g per liter /Mancozeb 2.5 g per liter / Tilt 1ml per liter / Antrcol 2g per liter
Dinocap 1 ml per liter/ wettable sulfur 3g per liter
A. Sampling area: Total Nine villages (Five Villages from Chickmagalore Taluk & Four Villages from Kadur Taluk) in Chickmagalore district where the project activities carried were purposively selected.
Sr. No. Village / Taluk Taluk Number of Total ChilliFarmers Cultivable Area
Are (Acre)
1 Kunnalu Chickmahalore 10 20.50 17
2 Sirabidagi Chickmahalore 5 22.98 14
3 Uddeboranahally Chickmahalore 5 15.35 9.20
4 Karisiddanahally Chickmahalore 5 13.71 9.33
5 Kenganahally Chickmahalore 5 11.36 7.30
6 Govindapura Kadur 5 14.20 10
7 Chikkangla Kadur 5 28.34 16
8 Shakunipura Kadur 5 22 11
9 Yammedhoddi Kadur 5 27.30 17.20
Total 9 50 175.74 111.03
International Journal on Agricultural Sciences Vol. V (Issue 2), pp. 185-195, 2014
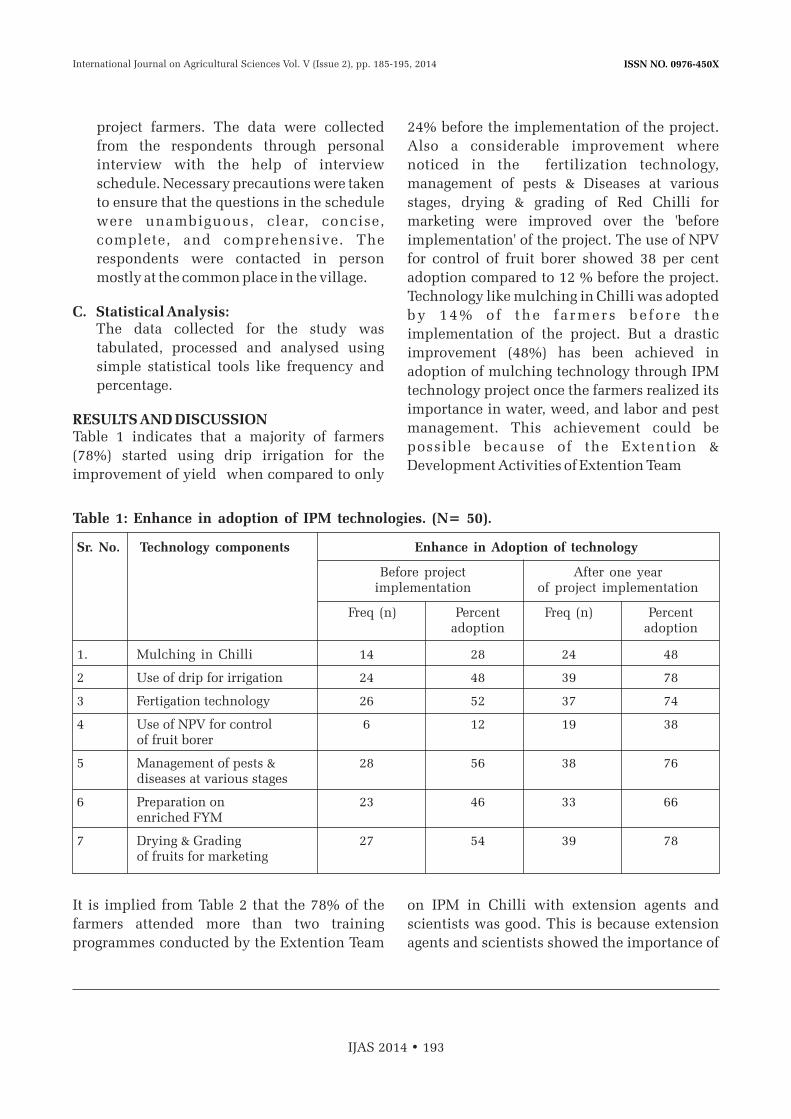
ISSN NO. 0976-450X
IJAS 2014 • 193
project farmers. The data were collected
from the respondents through personal
interview with the help of interview
schedule. Necessary precautions were taken
to ensure that the questions in the schedule
were unambiguous, clear, concise,
complete, and comprehensive. The
respondents were contacted in person
mostly at the common place in the village.
C. Statistical Analysis:The data collected for the study was
tabulated, processed and analysed using
simple statistical tools like frequency and
percentage.
RESULTS AND DISCUSSIONTable 1 indicates that a majority of farmers
(78%) started using drip irrigation for the
improvement of yield when compared to only
24% before the implementation of the project.
Also a considerable improvement where
noticed in the fertilization technology,
management of pests & Diseases at various
stages, drying & grading of Red Chilli for
marketing were improved over the 'before
implementation' of the project. The use of NPV
for control of fruit borer showed 38 per cent
adoption compared to 12 % before the project.
Technology like mulching in Chilli was adopted
by 14% o f the f a rmers be fo re the
implementation of the project. But a drastic
improvement (48%) has been achieved in
adoption of mulching technology through IPM
technology project once the farmers realized its
importance in water, weed, and labor and pest
management. This achievement could be
possible because of the Extention &
Development Activities of Extention Team
Table 1: Enhance in adoption of IPM technologies. (N= 50).
Sr. No. Technology components Enhance in Adoption of technology
Before project After one year implementation of project implementation
Freq (n) Percent Freq (n) Percentadoption adoption
1. Mulching in Chilli 14 28 24 48
2 Use of drip for irrigation 24 48 39 78
3 Fertigation technology 26 52 37 74
4 Use of NPV for control 6 12 19 38of fruit borer
5 Management of pests & 28 56 38 76diseases at various stages
6 Preparation on 23 46 33 66enriched FYM
7 Drying & Grading 27 54 39 78of fruits for marketing
It is implied from Table 2 that the 78% of the
farmers attended more than two training
programmes conducted by the Extention Team
on IPM in Chilli with extension agents and
scientists was good. This is because extension
agents and scientists showed the importance of
International Journal on Agricultural Sciences Vol. V (Issue 2), pp. 185-195, 2014
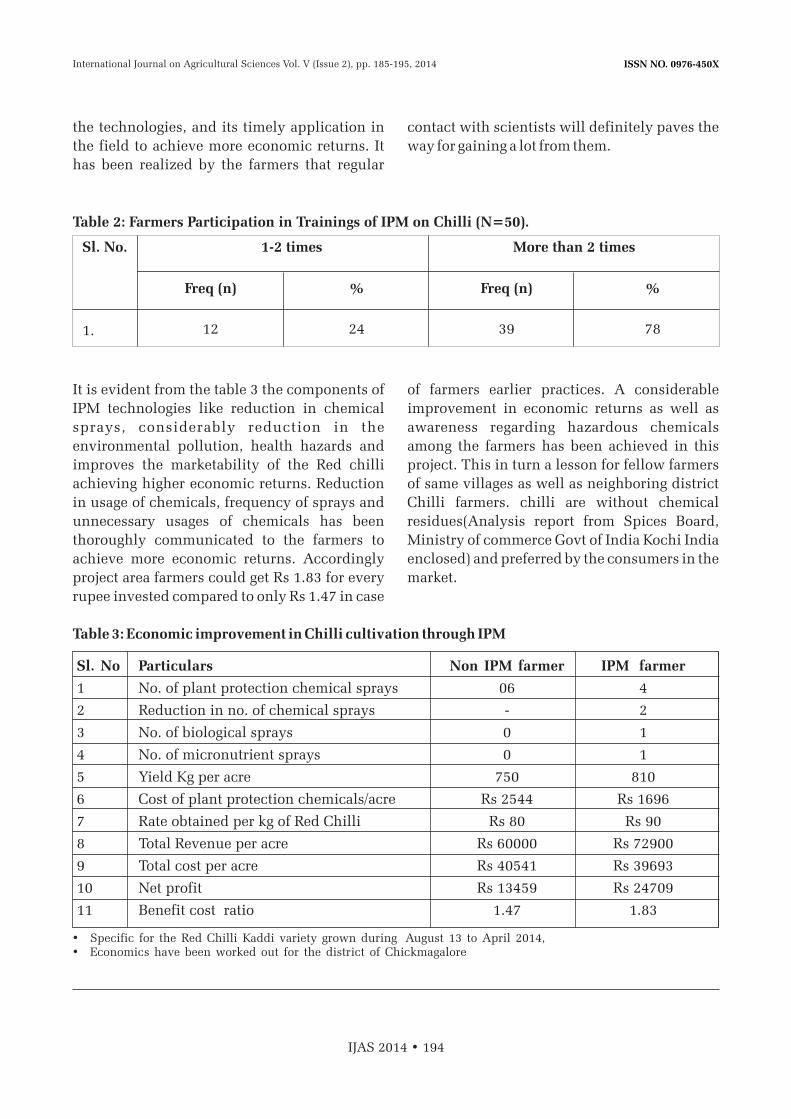
ISSN NO. 0976-450X
IJAS 2014 • 194
the technologies, and its timely application in
the field to achieve more economic returns. It
has been realized by the farmers that regular
contact with scientists will definitely paves the
way for gaining a lot from them.
Table 2: Farmers Participation in Trainings of IPM on Chilli (N=50).
Sl. No.
1.
1-2 times
Freq (n)
12
Freq (n)
39
%
24
%
78
More than 2 times
It is evident from the table 3 the components of
IPM technologies like reduction in chemical
sprays, considerably reduction in the
environmental pollution, health hazards and
improves the marketability of the Red chilli
achieving higher economic returns. Reduction
in usage of chemicals, frequency of sprays and
unnecessary usages of chemicals has been
thoroughly communicated to the farmers to
achieve more economic returns. Accordingly
project area farmers could get Rs 1.83 for every
rupee invested compared to only Rs 1.47 in case
of farmers earlier practices. A considerable
improvement in economic returns as well as
awareness regarding hazardous chemicals
among the farmers has been achieved in this
project. This in turn a lesson for fellow farmers
of same villages as well as neighboring district
Chilli farmers. chilli are without chemical
residues(Analysis report from Spices Board,
Ministry of commerce Govt of India Kochi India
enclosed) and preferred by the consumers in the
market.
Table 3: Economic improvement in Chilli cultivation through IPM
Sl. No Particulars Non IPM farmer IPM farmer
1 No. of plant protection chemical sprays 06 4
2 Reduction in no. of chemical sprays - 2
3 No. of biological sprays 0 1
4 No. of micronutrient sprays 0 1
5 Yield Kg per acre 750 810
6 Cost of plant protection chemicals/acre Rs 2544 Rs 1696
7 Rate obtained per kg of Red Chilli Rs 80 Rs 90
8 Total Revenue per acre Rs 60000 Rs 72900
9 Total cost per acre Rs 40541 Rs 39693
10 Net profit Rs 13459 Rs 24709
11 Benefit cost ratio 1.47 1.83
• Specific for the Red Chilli Kaddi variety grown during August 13 to April 2014,• Economics have been worked out for the district of Chickmagalore
International Journal on Agricultural Sciences Vol. V (Issue 2), pp. 185-195, 2014

ISSN NO. 0976-450X
IJAS 2014 • 195
CONCLUSIONFrom the findings it can be concluded that an
Extention & Development activities are must for
enhancement of adoption of IPM technologies
among the farmers. The important components
like management of pests & Diseases in various
stages, fertigation and irrigation technologies,
mulching, Drying & grading for marketing etc
were effectively passed on to farmers by the
Extention Team in convincing manner and in
turn 65.42 % of the farmers were adopted IPM
technologies in chilli Crop.
REFERENCES
1. Bentley, J.W.. 2009. Impact of IPM Extension for small holder farmers in the tropics. In “Integrated Pest Management: dissemination and impact”. Pub. Springer, Chapter 8, pp 333-346.
2. George, S., Hegde, M.R. and Doijode, S.D. 2012. Adoption of integrated Pest management practices in vegetable crops in Karnataka. Pest management in horticultural ecosystems, Vol. 18 (1):118-119.
3. Rajur, B.C., B.L. Patil and Basavraj, 2008. Economics of chilli production in Karnataka, Karnataka J. Agric. Sci., 21(2): 237-240.
4. Singh, A and Singh, L. 2004. Yield gap assessment of Lentil under front line demonstration Uttar Pradesh. Indian J. of Extn. Education. 4 (1&2): 58-59.
5. Tiwary, K.B and Saxena, A. 2001. Economic analysis of FLD of oilseeds in C h i n d w a r a . B h a r a t h i y a K r i s h i Anusandhan Patrika, 16 (36/4): 185-188.
International Journal on Agricultural Sciences Vol. V (Issue 2), pp. 185-195, 2014

ISSN NO. 0976-450X
IJAS 2014 • 196

ISSN NO. 0976-450X
FLOWER MIDGE AND ASSOCIATED PARASITOID ON COTTON IN RAICHUR DISTRICTS
*Bheemanna, M ., Geetha, S and Vanitha, B. K.
Department of Agricultural EntomologyUniversity of Agricultural Sciences, Raichur-584104, Karnataka
INTRODUCTIONIn recent days the flower midge or gall midge
becoming a major pest in Raichur, Bellary,
Belgaum, Haveri, Gulburga and Dharwad
district and several districts of north Karnataka.
The pest has been recorded during survey.
Damage starts from initiation of flower bud and
continue up to the presence of the flower
buds.In a single plant so many infested flower
buds can see and in a single bud about 5 to 30
maggots are present. The maggots remain inside
the flower and multiplies faster. This pest
causes more damage to flower buds and
eventually the net returns of the yield get
reduced about 60% loss in yield can be noticed.
It was difficult to manage this pest by the
farmers even with 3-4 sprays. About this pest
there was no study conducted but Dr.Udikeri
and his colleagues reported the presence of this
pest.
History of the pest /previous reportsD a s i n e u r a g o s s y p i i Fe l t ( D i p t e r a :
Cecidomyiidae) has been reported on Bt Cotton
by Dr Udikeri and his colleagues and wrongly
mentioned as Dasineuragossypii "Fletcher".
This species was first collected from
Coimbatore on cotton and reported as
Contarinia sp. by Fletcher in Some south Indian
insects (pages 363-364, fig. 223) along with
diagrams of male and female. Felt (1916)
described the species as Dasineuragossypii.
ABSTRACT
Flower midge Dasineuragossypii Felt (Diptera: Cecidomyiidae) is a new emerging pest on
cotton and it is now becoming major pest in Bellary and Raichur districts and its associated
parasitoidEcrizotomorpha sp.(Hymenoptera: Pteromalidae) is also noticed and identifiedon
cotton flower midge for the first time.Minimum 18% to 60% damage is recorded with the
average of 33% of damage is recorded in Raichur district and in bellary more than 60%
damage is recorded in this year.In case of number of parasitoids present in single infested
flower varies from 3 to 13 with the average of 8.05.
No. of Pages: 5 No. of Tables: 2 No. of Plates: 1 References: 1
Keywords: Cotton flower midge, Parasitoid, Damaging symptoms.
International Journal on Agricultural Sciences Vol. V (Issue 2), pp. 197-201, 2014
Corresponding author: [email protected]
Research Paper
Received on: 21.05.2014 Revised on: 25.05.2014 Accepted on: 28.06.2014

ISSN NO. 0976-450X
IJAS 2014 • 198
This species should not be confused with
another species described by Felt earlier from
t h e P h i l i i p p i n e s u n d e r t h e n a m e
Contariniagossypii. In 2009 Udikeriet al.,
reported Dasineuragossypiihas seen as a major
pest in India.
IdentificationThe flower midge lays eggs inside the tip of the
flower buds,the eggs are cylindrical in shape
and pale white in colour. There are 5 to 30 eggs
are layed on single flower bud. First instar
larvae pale white in colour; after each moult the
colour of the maggot changes to orange colour. If
we pluck the infested flower and if we disturb
the maggots all maggots will come out from the
flower bud.The pupation takes place inside
dried flowers by making a silken cocoon.Adults
are small having orange colour body with all the
three pairs of legs longer and fast flyer and it is
having a pair of moniliform antennae and
protruded ovipositor.
Nature of damageThe maggots are damaging stages. They feed on
anthers and staminal column, degradation /
decaying of anthers and staminal column. The
infested flower buds fail to grow properly.
Flowers will not open as the petals as well as
tissue inside dries.Flower drying through organ
degradation and death.In general square formed
will not turn into a boll, due to death at
flowering stage. Tissue drying and/or death
unevenly lead twisted or contorted stamenal
column/ anthers. In some cases, where
fertilization is not affected, the boll formation is
affected. The size remains smaller. The tissue
degradation is prominent on boll rind also. The
bolls will not reach normal size and No proper
filling with fibre.
Damage estimationMinimum 18% to 60% damage is recorded with
the average of 33% of damage is recorded in
Raichur district and in Bellary more than 60%
damage is recordedin this year.
Parasitoid associatedWhere the flower midge infested buds are
available there we can also get the parasitoid
E c r i z o t o m o r p h a s p . ( H y m e n o p t e r a :
Pteromalidae). We can say this is another
symptom of identification of flower midge
infestation. Minimum 3 to 15 parasitoidscould
be seen on that flower midge infested bud.
Identification ofEcrizotomorpha sp.: small black
coloured flies with round head which can be
visible by bare eyes only.
MATERIALS AND METHODThe observations were taken at University of
Agricultural Sciences, Main Agricultural
Research Station, Raichur in cotton field. For
the observation randomly 20 plants were
selected and counted total number of flower
bud present in single plant. Then the number of
flower midge infested flower bud in that total
flower bud were observed and recoded the
observation. then randomly 20 flower bud were
collected from that field and brought to
laboratory and counted for the total number of
flower midge maggots present in single flower
bud along with the number of parasitoid present
Ecrizotomorpha sp. (Hymenoptera: Pteromalidae)
International Journal on Agricultural Sciences Vol. V (Issue 2), pp. 197-201, 2014

ISSN NO. 0976-450X
IJAS 2014 • 199
Table 1: Percent infestation along with the number of parasitoids present in single flower
SI.No Total no. of flower buds/plant flowers buds
1 38 12 34.29
2 35 6 17.14
3 27 8 29.63
4 50 16 32.00
5 55 13 23.64
6 63 20 31.75
7 48 22 44.00
8 30 10 33.33
9 33 9 27.27
10 20 6 30.00
11 45 13 28.89
12 39 15 38.46
13 50 22 44.00
14 53 20 37.74
15 39 15 38.46
16 43 11 25.58
17 50 20 40.00
18 35 12 34.29
19 29 10 34.48
20 15 9 60.00
average 34.20
Number of infested % infestation
in single flower bud along with the flower midge
maggot.
RESULT AND DISCUSSIONThere was no earlier reportson the number of
flower buds present in single plant and infested
flower buds and the parasitoid associated with
flower midge maggot. Minimum per cent of
infestation is 17.14% and maximum 60% with
the average of 34.20% (Table 1) whereas in case
of number of flower midge present in single
flower bud varies from 5 to 30 numbers with
average of 17.85 and in case of number of
parasitoids present in single infested flower
varies from 3 to 13 with the average of 8.05
(Table 2).
International Journal on Agricultural Sciences Vol. V (Issue 2), pp. 197-201, 2014

ISSN NO. 0976-450X
IJAS 2014 • 200
Table 2: Number of flower midges per flower bud and number of parasitoids present in single flower bud
SI.No No. of flower No. of parasitoids/infested midge/flower bud flower bud
1 17 5
2 5 3
3 12 8
4 14 12
5 8 7
6 17 10
7 19 8
8 23 12
9 26 10
10 12 6
11 11 4
12 15 7
13 13 5
14 20 10
15 25 9
16 29 4
17 19 11
18 22 9
19 20 8
20 30 13
average 17.85 8.05
International Journal on Agricultural Sciences Vol. V (Issue 2), pp. 197-201, 2014
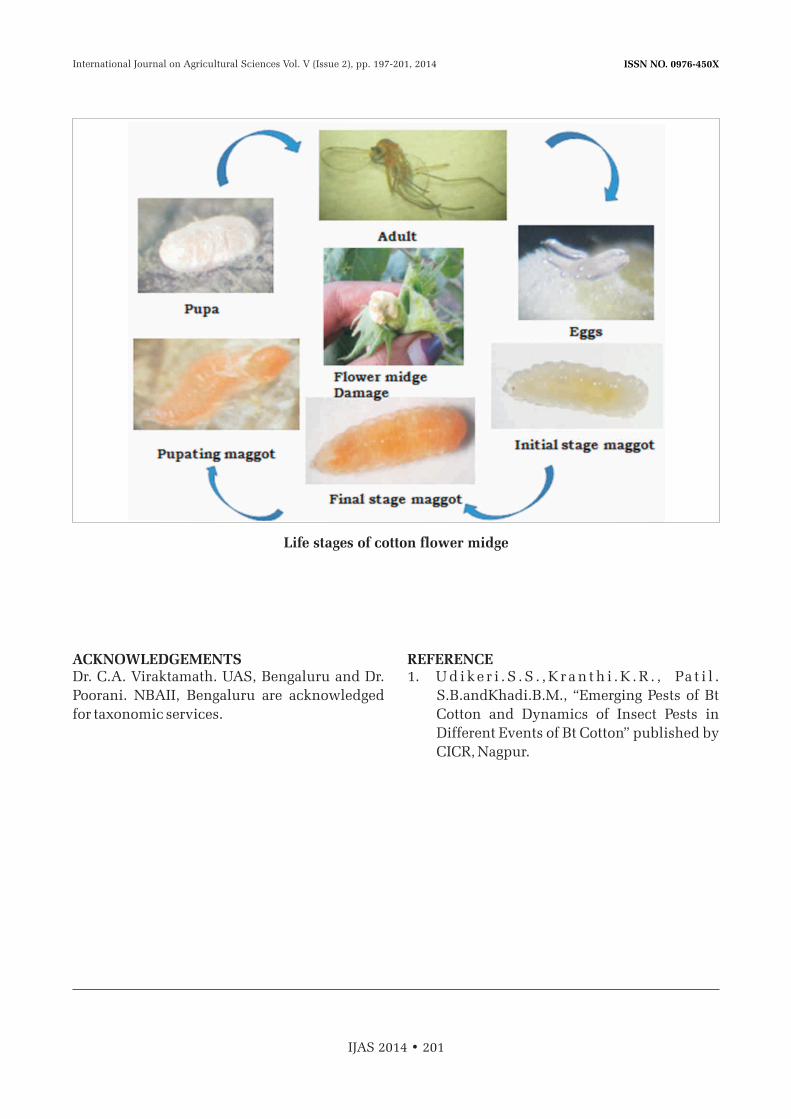
ISSN NO. 0976-450X
IJAS 2014 • 201
ACKNOWLEDGEMENTSDr. C.A. Viraktamath. UAS, Bengaluru and Dr.
Poorani. NBAII, Bengaluru are acknowledged
for taxonomic services.
REFERENCE 1. U d i ke r i . S . S . , K r a n t h i . K . R . , Pa t i l .
S.B.andKhadi.B.M., “Emerging Pests of Bt
Cotton and Dynamics of Insect Pests in
Different Events of Bt Cotton” published by
CICR, Nagpur.
Life stages of cotton flower midge
International Journal on Agricultural Sciences Vol. V (Issue 2), pp. 197-201, 2014

ISSN NO. 0976-450X
IJAS 2014 • 202

ISSN NO. 0976-450X
PESTICIDAL ACTIVITES OF COMMERCIAL BLEACHING POWDER IN PISCICULTURE
1 2 3Mamata Kumari , Rashmi Prabha and Navin Kumar
1Ram Dayalu Singh College, Muzaffarpur, Bihar
2Krishi Vigyan Kendra, Angul, Odisha
3Fisheries Extension Officer, Muzaffarpur, Bihar
INTRODUCTIONThe presence of predatory and weed fishes in culture pond is a serious threat for culturing commercially important fishes. These fishes adversely affect the cultured fish population in culture pond by sharing food and habitat of major cultivated fishes. The predatory fishes engulf the fingerlings of cultured fishes at several stages of their rearing (Jhingran, 1975) and thus adversely affect the aquaculture production which put a great loss to the fish farmers. Unwanted fishes enter aquaculture farms through water supplies or along with seed brought into the fish farm.
In this experiment Authors evaluated the
efficacy of Bleaching powder (both synthetic and plant origin) as piscicides which may solve the problems facing by the farmers for sustainable aquaculture management. Therefore, the main objective of the present work is to study on specific piscicide for sustainable aquaculture management.
MATERIALS AND METHODFingerlings of catfish, Pangassius sutchi, (Fowler, 1937) was selected as the test organism in this study as it is an exotic fish unofficially introduced in some areas of the country. This causes lot of negative impact on present aquaculture system. It is omnivorous and occasionally feeds at the surface. It possess an accessory respiratory organ,
ABSTRACT
The piscicidal activities of commercial Bleaching Powder (30% chlorine) to the fingerlings
of Pangassius sutchi and their impacts on some hydrological parameter of test water were
carried out in controlled laboratory conditions following the standard methods (APHA,
2002). Residual toxicity of all the toxicants were also tested using the most sensitive
fingerlings of rohu (Labeo rohita) in same laboratory conditions. Bleaching powder
[Ca(OCl)Cl] may also be used as piscicide as an alternative to MOC. But some residual
chlorine may retain for several days. It might be non-lethal to fish but may lethal to other
fish food organisms.
No. of Pages: 8 No. of Tables: 4 No. of Figs.: 4 References: 16
Keywords: Mortality, Pangassius sutchi, Physiochemical characteristics, Toxicity.
International Journal on Agricultural Sciences Vol. V (Issue 1), pp. 203-210, 2014
Corresponding author: [email protected]
Research Paper
Received on: 01.03.2014 Revised on: 25.03.2014 Accepted on: 28.06.2014

ISSN NO. 0976-450X
IJAS 2014 • 204
which is highly vascularised absorb oxygen directly from the atmosphere. Since the air chamber communicates directly with the pharynx and the gill-chamber, this accessory air breathing organ enables them to tolerate adverse aquatic conditions where other cultured fish species can not survive.
Experiments were conducted on fingerlings, based on the fact that fingerlings are more sensitive to environmental changes, easy to maintain and cost effective.
Bleaching Powder (BP)Commercially available bleaching powder [Ca(OCl)Cl] of Diviaiz Chemioil Pvt. Ltd, (30% Chlorine) was used in the present studies. It is generally applied in pond water to oxidize organic matter for reducing biological oxygen demand (BOD) of water and to destroy the pathogenic organisms.
Fishes were maintained in the laboratory for a minimum period of two weeks during which they were fed with commercial pelleted feed (size 2 mm). The 20% of the water was replaced daily. Mortality during the period of acclimatization was less than 2%. The toxicity bioassays of MOC, TLD alone and TLD with QL (1:1), BP and PP were conducted in controlled laboratory conditions. The toxicity bioassays of MOC, BP and PP were conducted separately for
2h, 3h, and 4 h of exposures to the fingerlings of Pangassius sutchi .
The toxicity bioassays of TLD alone and TLD with QL (1:1) were conducted for 1h only as it is very effective within 1h of exposure. The mortality percentage of the test organisms were recorded after every one hour of exposure. The impact of these toxicants on the different physiochemical characteristics of water were also recorded after every 1h of interval.
The range finding bioassays of each toxicant were carried out in the controlled laboratory conditions in 5 liters of rectangular glass aquaria in triplicate filled with 3 liters of pond water as stated above. Three numbers of test fish were kept in each aquarium to observe their lethal response during different time of intervals following the Complete Randomized Design (CRD) for laboratory (Gomez and Gomez, 1984). A control (without toxicant) was also maintained through out the experiment. All the organisms were acclimatized in the test condition for 48 hrs before experiment. The fish were not feed 24 hours prior to and during the experimental period.
The different concentrations used for the lethal toxicity bioassays of each toxicant at different time intervals are tabulated below (Tables 1-3).
Table 1 : Concentrations of MOC, PP and BP used for 2 h lethal toxicity bioassays.
Mohua Oil Cake Potassium Permanganate Bleaching Powder (MOC) (PP) (BP)
175 25 48178 28 50180 30 52185 42 55200 45 58
50 60556065
Concentrations (mg/l)
International Journal on Agricultural Sciences Vol. V (Issue 1), pp. 203-210, 2014

ISSN NO. 0976-450X
IJAS 2014 • 205
Residual toxicity bioassays of each selected
toxicant were conducted following the method
of APHA (2002). The experimental set up was
alike with the lethal toxicity bioassay. Here,
fingerlings of rohu were introduced regularly in
the pre-treated (LC 95 concentration of each
toxicant) aquarium after different time intervals
to observe the persistence of each toxicant and
stopped when 100% survival of the fingerlings
was achieved. The different concentrations of
toxicant used for the residual toxicity bioassays
are presented in Table 4.
Table 2: Concentrations of MOC, PP and BP used for 3 h lethal toxicity bioassays.
Table 3: Concentrations of MOC, PP and BP used for 4 h lethal toxicity bioassays.
Mohua Oil Cake Potassium Permanganate Bleaching Powder (MOC) (PP) (BP)
175 25 48
145 16 45
148 18 48
150 20 50
155 22 52
175 25 54
28
30
42
45
50
Mohua Oil Cake Potassium Permanganate Bleaching Powder (MOC) (PP) (BP)
140 16 42
142 18 45
145 20 48
148 22 50
150 25 52
155 28 54
30
Concentrations (mg/l)
Concentrations (mg/l)
International Journal on Agricultural Sciences Vol. V (Issue 1), pp. 203-210, 2014

ISSN NO. 0976-450X
IJAS 2014 • 206
Experimental protocol was designed following
standard methods of APHA (2002) with some
medications as per the objective of the
experiment. Lethal concentrations of each
toxicants at which the test organisms died (LC 5
to LC ) was calculated by the method of Probit 95
Analysis (Finney, 1971) using EPA Probit
Analysis Program (Version 1.5). The residual
toxicity bioassays were also designed following
the method of APHA (2002).
RESULTSPiscicidal Activity of Bleaching Powder (BP)The toxicity of bleaching powder [Ca(OCl)Cl)]
to Pangassius sutchi significantly (P<0.05)
increased from 2 h to 4 h exposure periods. The
mortality of the tested fish also increased
significantly (P<0.05) with the increase in the
concentration of bleaching powder. The 5%
(LC5), 50% (LC50) and 95% (LC95) mortality
were recorded at 45 mg/l (41-47 mg/l), 52 mg/l
(51-54 mg/l) and 61 mg/l (59-66 mg/l) of
bleaching powder after 2 h of exposure.
Similarly the lethal concentrations of bleaching
powder significantly increased the percentage
of the mortality of the test fish at 3h and 4h of
exposures (fig 1).
Table 4 : Comparative Concentrations of MOC, TLD, TLD with QL, BP and PP used for residual
toxicity bioassays.
Fig. 1: Lethal concentrations of bleaching powder to the fingerlings of Pangassius sutchi at 2h, 3h and 4h of exposures.
LC95 (1h)(mg/l) LC95 (2h)(mg/l) LC95 (3h)(mg/l) LC95 (4h)(mg/l)
MOC - 204 182 160
TLD 92 - - -
TLD+QL 57 - - -
BP - 61 57 55
PP - 113 47 33
International Journal on Agricultural Sciences Vol. V (Issue 1), pp. 203-210, 2014

ISSN NO. 0976-450X
IJAS 2014 • 207
Impacts of Bleaching Powder (BP) on Hydrological ParametersThe pH increased significantly (P<0.05) from control in all the lethal concentrations. After 2h, 3h and 4h of exposures (Fig. 2). But no significant variations (P>0.05) were recorded in between LC50 and LC95 concentrations of bleaching powder at 2h of exposure. Bleaching powder also influenced the conductivity of the water (Fig. 3). Initially the conductivity decreased significantly (P<0.05) from control in LC5 and LC50 concentrations during 2h and 3h of exposures. But it increased gradually and significantly from control to LC5, LC50 and LC95 concentrations of BP after 4h of exposure.
But it was not found during 2h and 3h of exposures. After 2h, bleaching powder treatment significantly influenced DO concentration of water which significantly increased (P<0.05) with the increase in the concentrations of BP. But it was comparable (P>0.05) in between the concentrations (LC5, LC50 and LC95) after 3h and 4 h of exposure p e r i o d s ( Fi g . 4 ) . D i s s o l v e d ox y g e n concentration of test water significantly increased (P<0.05) from control in all the treatments at all the exposure periods. During the experment, the temperature did not vary significantlly.
Fig. 2 : Impacts of different concentrations of bleaching powder on pH of the test water at different exposure periods.
Fig. 3 : Impacts of different concentrations of bleaching powder on conductivity of the test water at different exposure periods.
International Journal on Agricultural Sciences Vol. V (Issue 1), pp. 203-210, 2014
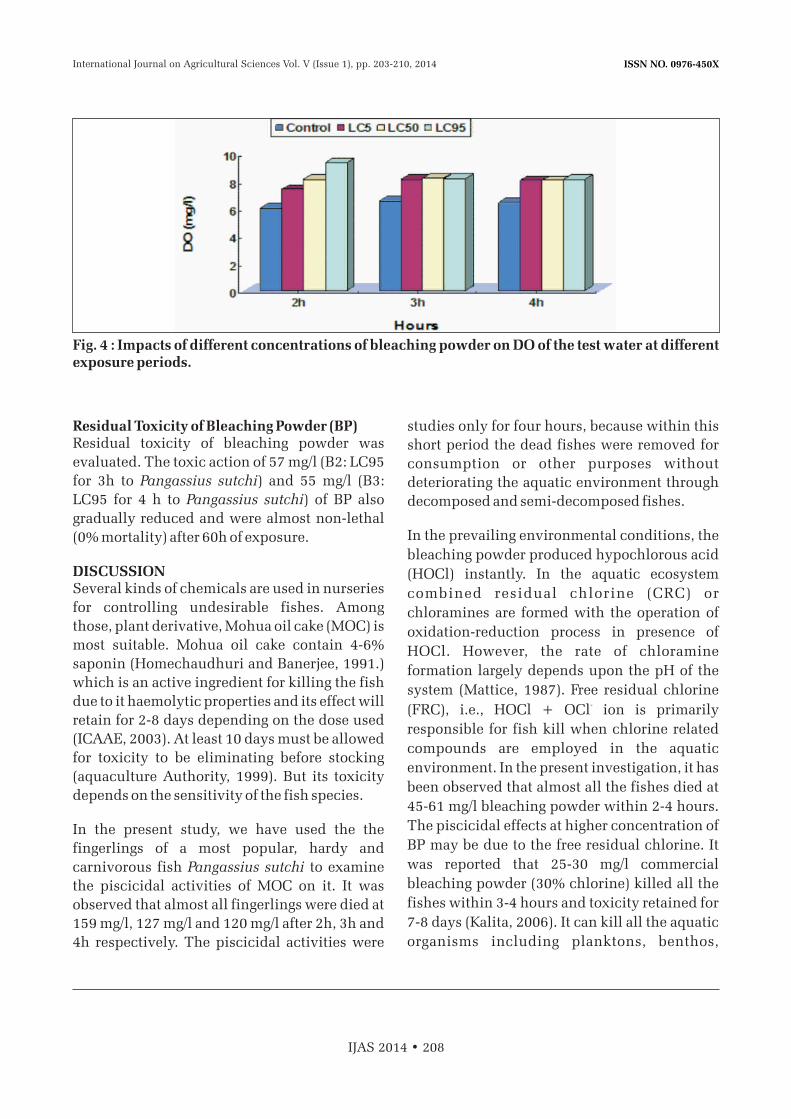
ISSN NO. 0976-450X
IJAS 2014 • 208
Residual Toxicity of Bleaching Powder (BP)Residual toxicity of bleaching powder was
evaluated. The toxic action of 57 mg/l (B2: LC95
for 3h to Pangassius sutchi) and 55 mg/l (B3:
LC95 for 4 h to Pangassius sutchi) of BP also
gradually reduced and were almost non-lethal
(0% mortality) after 60h of exposure.
DISCUSSIONSeveral kinds of chemicals are used in nurseries
for controlling undesirable fishes. Among
those, plant derivative, Mohua oil cake (MOC) is
most suitable. Mohua oil cake contain 4-6%
saponin (Homechaudhuri and Banerjee, 1991.)
which is an active ingredient for killing the fish
due to it haemolytic properties and its effect will
retain for 2-8 days depending on the dose used
(ICAAE, 2003). At least 10 days must be allowed
for toxicity to be eliminating before stocking
(aquaculture Authority, 1999). But its toxicity
depends on the sensitivity of the fish species.
In the present study, we have used the the
fingerlings of a most popular, hardy and
carnivorous fish Pangassius sutchi to examine
the piscicidal activities of MOC on it. It was
observed that almost all fingerlings were died at
159 mg/l, 127 mg/l and 120 mg/l after 2h, 3h and
4h respectively. The piscicidal activities were
studies only for four hours, because within this
short period the dead fishes were removed for
consumption or other purposes without
deteriorating the aquatic environment through
decomposed and semi-decomposed fishes.
In the prevailing environmental conditions, the
bleaching powder produced hypochlorous acid
(HOCl) instantly. In the aquatic ecosystem
combined residual chlorine (CRC) or
chloramines are formed with the operation of
oxidation-reduction process in presence of
HOCl. However, the rate of chloramine
formation largely depends upon the pH of the
system (Mattice, 1987). Free residual chlorine -(FRC), i.e., HOCl + OCl ion is primarily
responsible for fish kill when chlorine related
compounds are employed in the aquatic
environment. In the present investigation, it has
been observed that almost all the fishes died at
45-61 mg/l bleaching powder within 2-4 hours.
The piscicidal effects at higher concentration of
BP may be due to the free residual chlorine. It
was reported that 25-30 mg/l commercial
bleaching powder (30% chlorine) killed all the
fishes within 3-4 hours and toxicity retained for
7-8 days (Kalita, 2006). It can kill all the aquatic
organisms including planktons, benthos,
Fig. 4 : Impacts of different concentrations of bleaching powder on DO of the test water at different exposure periods.
International Journal on Agricultural Sciences Vol. V (Issue 1), pp. 203-210, 2014

ISSN NO. 0976-450X
IJAS 2014 • 209
molluscs, crabs and weed and predatory fishes
at 50 ppm (Tripathy et al., 1980). The present
result is strongly supported by the previous
works carried out in different places in spite of
some deviations of the concentration of BP. This
might be due to hardly nature of experimental
fish P. sutchi as well as quality of commerical
bleaching poweder used.
The pH of test water increased after bleaching
powder treatment due to its strong oxidizing
capacity. This is also supported by various
researchers (Ram et al., 1988; Mohanty et al.,
1993). Bleaching power influence the
conductivity of water due its neutralizing
capacity of ions available in water. The potency of
BP slowly decreased with the increaseing
exposure periods because of its decreasing
capacity of oxidation. In addition, its disinfecting
capacity killed the micro-organisms of the
aquatic environment decresed. The biological
decomposition processes and the major oxygen
consuming process in the aquatic environment. It
also accelerates chemical oxidation process with
the help of chlorine of bleaching powder.
In our present investigation the residual toxicity
of bleaching powder to the fingerlings of Labeo
rohita retained up to 2-3 days which is not
comparable with the previous data (Kalita, 2006).
It may be due to the condition of the aquatic
environment and the quality of the organisms.
The safe period for stocking of fry and fingerlings
for aquaculture after BP application is 7-8 days.
The slight increase in residual chlorine
concentration may harm to the early stages of fish
and different planktonic and benthic live food
organisms of the fish, which in turn may
seriously hampere the aquaculture production.
The main beneficial role of BP is its disinfectant
property against pathogens in addition to
piscicidal activity. So, the health of the cultured
fishes will be safe after application of BP as
piscicide during short culture period. However,
the main constraint of its application is its ability
to penetrate cells and react with cell enzyme.
Many freshwater and estuarine phytoplankton
species are sensitive to chlorine, with an adverse
effect to TRC concentrations as low as 0.05 mg/l
(Ho and Robert, 1986). Again its toxicity largely
depends upon pH and temperature. If the pH of
water decreases, the toxicity of bleaching powder
increases appreciably. However, the application
of commercial bleaching powder for eradication
of unwanted fishes may be encouraged for
commercial aquaculture because of its dual
action like piscicide and disinfectant. In addition,
it is very cheap and easily available in the door
steps of farmers. But, precaution may be taken by
adopting frequent assessment of the water quality
parameters. Reduction of its toxicity also very
simple as the residual chlorine may be removed
from water through vigorous aeration.
CONCLUSIONBleaching Powder [Ca(OCl)Cl]About 55-61 mg/l of commercial bleaching
powder (30% chlorine) killed almost 95% of the
fingerlings of Pangassius sutchi within 2-4
hours.
The pH, DO and conductivity of the water
increased after the application of bleaching
powder (30% chlorine).
The toxicity of bleaching powder retained
maximum up to 60-72 hours to the fingerlings of
rohu.
The minimum safe period for stocking of fry and
fingerlings of fishes would be 8-10 days after its
application.
REFERENCES
1. APHA, AWWA, WPCF, 2002. Standard
Methods for Examination of Water and
Waste Water. American Public Health
Association, Inc., Washington D.C., USA.
International Journal on Agricultural Sciences Vol. V (Issue 1), pp. 203-210, 2014
ISSN NO. 0976-450X
IJAS 2014 • 210
2. Bhatia, H.L., 1970. Use of mahua oil cake in
fishery management. Indian Farming.
20(4), 39-40.
3. Bhuyan, B.R., 1967. Eradication of
unwanted fish from ponds by using
indigenous plant fish poisons. Sci. Cul.
33(2), 82-83.
4. Chakraborty, P.S., Das, A., Banerjee, S.,
1987. Evaluation of efficiency of mahua oil
cake as fish poison in relation to hardness
of water. Environ. Ecol. 5(1), 165-167.
5. CIFRI, 1968. Annual Report. Central Inland
Fisheries Research Institute, Barrackpore,
India, pp.93.
6. Gomez, K.A., and Gomez, A.A. 1984.
Statistical procedure for agricultural
research. 2nd edn. Wiley Inter Science,
New York.
7. Finney, D.J., 1971. Statistical methods in
biological assay, 2nd Ed. Hafner Publishing
Company, New York; N. Y. Cambridge
University Press, London, England, pp. 68.
8. Hinton, M.J., Eversole, A.G., 1978. Toxicity
of ten commonly used chemicals to
American eel. Proc. Annu. Conf. Southeast
Assoc. Fish Wildl. Agencies. 32, 599-604.
9. Istvan, U., 2000. Semi-natural products
and related substances as alleged botanical
pesticides. Pest Management Sci. 56(8),
703-705.
10. Jhingran, V.G., 1975. Fish and Fisheries of
India. Hindustan Publishing Corporation,
Delhi, India. pp.954.
11. K u m a r i , M . , 2 0 1 2 . E f f e c t o f
organophosphate Pesticide Abate on the
ovary of the Cat Fish, Heteropneustes
Fossilis (Bloch). Bangladesh J. Zool.
40(2):pp 207-212.
12. Kumar, N., Prabha, R., Kumari, M., 2013.
Role of Mahua Oil Cake (MOC) in fish
Production. International journal of
Biological Science (Issue1 ). pp 95-100
13. Kalita, K., 2006. A Training Manual on
Polyculture and Integrated Fish Farming.
Assam Agricultural Competitiveness
Project (AACP), Govt. of Assam and College
of Fisher ies , Assam Agricul tural
University, Raha, Assam, India.pp.27.
14. Mohanty, A.N., Chatterjee, D.K., Giri, B.S.,
1993. Effective combination of urea and
bleaching powder as a piscicide in
aquaculture operations. J. Aquacul. Tropics
8(2), 249–254.
15. Ram, K.J., Rao, G.R.M., Ayyappan, S.,
Purushothaman, C.S., Saha, P.K., Pani, K.C.,
Muduli, H.K., 1988. A combination of
commercial bleaching powder and urea as a
potential piscicide. Aquaculture 72, 287-
293.
16. Tripathy, N.K., Radheyshyam, Satpathy,
B.B., Khan, H.A., 1980. Preliminary
observations on the use of bleaching
powder as fish toxicant for preparation of
nursery ponds. Proc. Symp. On Utilization
of Animal Resources of Orissa, Zool. Soc. of
Orissa, Utkal University, Bhubaneswar,
pp.13.
International Journal on Agricultural Sciences Vol. V (Issue 1), pp. 203-210, 2014

ISSN NO. 0976-450X
EFFECT OF NEWER MOLECULE INSECTICIDES AGAINST CHICKPEA SEED PROPERTIES
Vidyashree, A. S., Thirumalaraju, G. T., Kavya M. K. and Adarsha S.K.*
Department of Entomology, UAS, GKVK, Bangalore, Karnataka*Department of Entomology, UAHS, Shimoga, Karnataka
INTRODUCTIONPulses are an important group among staple
crops, next only to cereals for human diet,
especially for the vegetarian population across
the world. It is a well established fact that
various legumes such as chickpeas vary quite
significantly in their inherent resistance or
susceptibility to field infestation and post-
harvest insect attack in storage by the common
grain storage insects. Chickpea is grown in more
than 70 per cent area of the country as rainfed
crop and is highly sensitive to change in
weather conditions.
Pulse beetle (Callosobruchus maculatus
Coleoptera: Bruchidae) is a major pest of
leguminous stored seeds. The beetle exhibits a
high degree of specificity for its growth and
development towards various legumes. As a result,
full yield potential of the chickpea crop is seldom
realized due to the interaction of many factors of
which post harvest insect infestation and
consequent damage is one of the most important.
MATERIAL AND METHODSA laboratory experiment was carried out to know
the efficacy of newer insecticide molecules at All
India Co-ordinated Research Project on Seed
Technology, National Seed Project, University of
Agricultural Sciences, Gandhi Krishi Vignan
Kendra, Bangalore during 2012-13. One kg of
freshly harvested certified seeds with initial
germination of 98 per cent and 9 per cent of
moisture content were taken. The experiment
was conducted in completely randomized design
(CRD) with nine treatments and three
ABSTRACT
Pulse beetle (Callosobruchus maculatus Fab. Coleoptera: Bruchidae) is a major pest of
leguminous stored seeds. The beetle exhibits a high degree of specificity for its growth and
development towards various legumes. New insecticide molecules were tested against C.
maculatus on chickpea. Spinosad 45 SC @ 2 ppm and emamectin benzoate 5 SG @ 2 ppm
were found effective in controlling the pulse beetle without affecting the germination,
moisture content and vigour of the seeds.
No. of Pages: 4 No. of Tables: 2 References: 5
Keywords: C. maculatus, Spinosad, Emamectin benzoate, Vigour, Germination.
International Journal on Agricultural Sciences Vol. V (Issue 2), pp. 211-214, 2014
Corresponding author: [email protected]
Research Paper
Received on: 05.05.2014 Revised on: 16.05.2014 Accepted on: 28.06.2014
ISSN NO. 0976-450X
IJAS 2014 • 212
replications. Different quantities of insecticides
were diluted in 5 ml water to treat one kg of seed
for proper coating. After treatment, seeds were
dried under shade and packed in 2 kg capacity
gunny bag and kept for storage under ambient
condition. Similarly, control was maintained
without any treatment for comparison. The
observations on the parameters viz.,
germination, moisture content and vigour index-I
and vigour index-II were recorded at tri-monthly
interval up to nine months and then data were
subjected to statistical analysis.
The germination test was conducted with 100
seeds from each treatment in four replications
following between paper (BP) method as
prescribed by ISTA Rules (Anon., 2010).
Moisture content of seed was done by oven
drying method. Five grams of chickpea seeds
were taken from each replication and treatment.
The seeds were grinded and kept in oven for 17
hours and final weight was recorded. The
moisture content of the seed was calculated by
using following formula.
W -W2 3
Moisture content (%) = ----------------- X 100 W -W2 1
Where:
W = Weight of empty cup with lid (g)1
W = weight of cup with seed samples before 2
drying
W = weight of cup with seed sample after 3
drying
The root length and shoot length often normal
seedlings was measured and average is
expressed in centimetres. Seedling vigour index
(SVI) was calculated by adopting the method
suggested by Abdul-Baki and Anderson (1973)
and expressed as an index number.
SVI=Germination X Mean seedling length (cm)
EXPERIMENTAL RESULTSResults on germination revealed significant
differences among treatments at three, six and
nine months after treatment imposition (Table
1). At nine months after treatment imposition,
the highest germination (86.67 ± 1.15 %) was
recorded in spinosad 45 SC @ 2 ppm, which
was on par with emamectin benzoate 5 SG @ 2
ppm (85.33±2.31 %), rynaxypyr 20 SC @ 2 ppm
(84.00 ± 2.00 %) and indoxacarb 14.5 SC @ 2
ppm (83.67 ± 2.31 %).
Significant differences were not observed
among the treatments with respect to moisture
content at three months after treatment
imposition (Table 1). At nine months after
treatment imposition, the least moisture
content (10.33±0.16 %) was in spinosad 45 SC
@ 2 ppm treated seeds, which differed
significantly with all other treatments. The next
treatment was deltamethrin 2.8 EC @ 1 ppm
(10.65±0.14 %), which also differed
significantly with other treatments. The highest
moisture content (13.31±0.32 %) was observed
in untreated control and was significantly
inferior to remaining treatments.
With respect to vigour index-I the results
revealed, significant differences among
treatments at three, six and nine months after
treatment imposition (Table 2). At nine months
after treatment imposition, the highest vigour
index-I was recorded in spinosad 45 SC @ 2
ppm (2008±22) treated seeds, which differed
significantly with all other treatments. Among
the insecticides least vigour index (1065±13)
was in novaluron 10 EC @ 2 ppm, however,
untreated control (418±55) was significantly
inferior to all the treatments.
Observations on vigour index-II revealed, at
nine months after treatment imposition, the
highest vigour index II was recorded in
spinosad 45 SC @ 2 ppm (30±1) which was on
par with emamectin benzoate (27±2) 5 SG @ 2
International Journal on Agricultural Sciences Vol. V (Issue 2), pp. 211-214, 2014
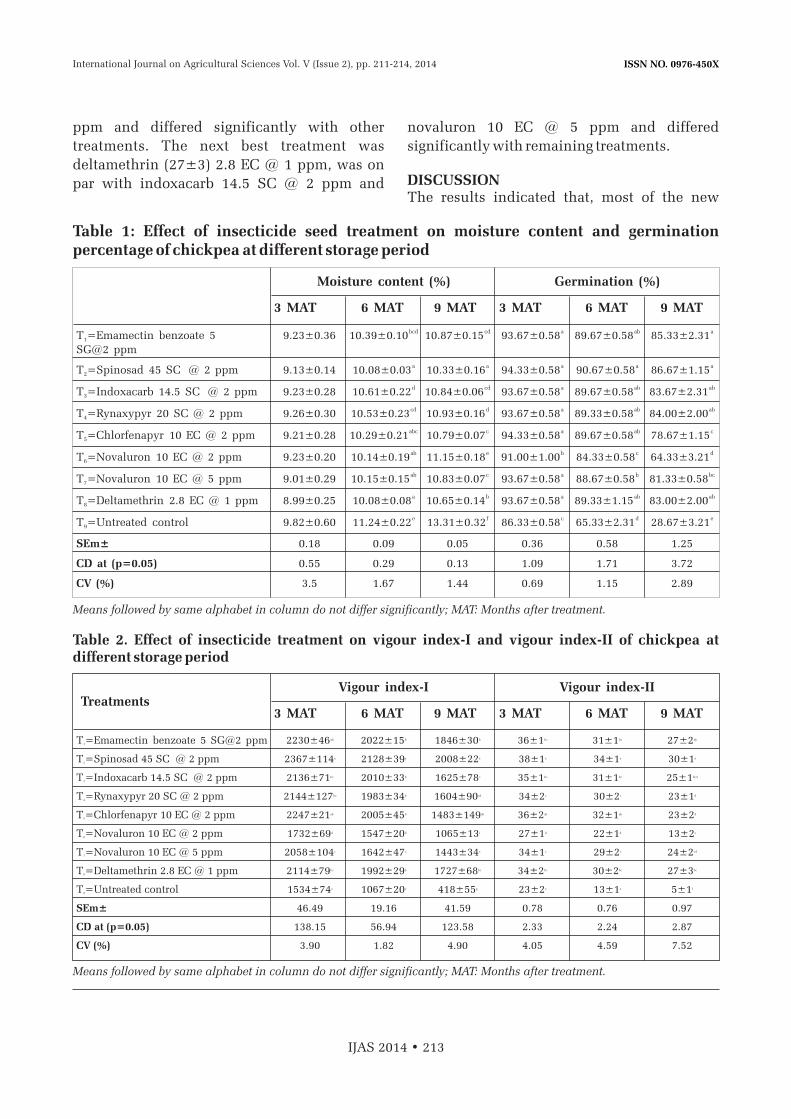
ISSN NO. 0976-450X
3 MAT 6 MAT 9 MAT 3 MAT 6 MAT 9 MAT
ppm and differed significantly with other
treatments. The next best treatment was
deltamethrin (27±3) 2.8 EC @ 1 ppm, was on
par with indoxacarb 14.5 SC @ 2 ppm and
novaluron 10 EC @ 5 ppm and differed
significantly with remaining treatments.
DISCUSSIONThe results indicated that, most of the new
Table 1: Effect of insecticide seed treatment on moisture content and germination percentage of chickpea at different storage period
bcd cd a ab aT =Emamectin benzoate 5 9.23±0.36 10.39±0.10 10.87±0.15 93.67±0.58 89.67±0.58 85.33±2.311
SG@2 ppm
a a a a aT =Spinosad 45 SC @ 2 ppm 9.13±0.14 10.08±0.03 10.33±0.16 94.33±0.58 90.67±0.58 86.67±1.152
d cd a ab abT =Indoxacarb 14.5 SC @ 2 ppm 9.23±0.28 10.61±0.22 10.84±0.06 93.67±0.58 89.67±0.58 83.67±2.313
cd d a ab abT =Rynaxypyr 20 SC @ 2 ppm 9.26±0.30 10.53±0.23 10.93±0.16 93.67±0.58 89.33±0.58 84.00±2.004
abc c a ab cT =Chlorfenapyr 10 EC @ 2 ppm 9.21±0.28 10.29±0.21 10.79±0.07 94.33±0.58 89.67±0.58 78.67±1.155
ab e b c dT =Novaluron 10 EC @ 2 ppm 9.23±0.20 10.14±0.19 11.15±0.18 91.00±1.00 84.33±0.58 64.33±3.216
ab c a b bcT =Novaluron 10 EC @ 5 ppm 9.01±0.29 10.15±0.15 10.83±0.07 93.67±0.58 88.67±0.58 81.33±0.587
a b a ab abT =Deltamethrin 2.8 EC @ 1 ppm 8.99±0.25 10.08±0.08 10.65±0.14 93.67±0.58 89.33±1.15 83.00±2.008
e f c d eT =Untreated control 9.82±0.60 11.24±0.22 13.31±0.32 86.33±0.58 65.33±2.31 28.67±3.219
SEm± 0.18 0.09 0.05 0.36 0.58 1.25
CD at (p=0.05) 0.55 0.29 0.13 1.09 1.71 3.72
CV (%) 3.5 1.67 1.44 0.69 1.15 2.89
Means followed by same alphabet in column do not differ significantly; MAT: Months after treatment.
Moisture content (%) Germination (%)
3 MAT 6 MAT 9 MAT 3 MAT 6 MAT 9 MAT
Table 2. Effect of insecticide treatment on vigour index-I and vigour index-II of chickpea at different storage period
ab b b bc bc abT =Emamectin benzoate 5 SG@2 ppm 2230±46 2022±15 1846±30 36±1 31±1 27±21
a a a a a aT =Spinosad 45 SC @ 2 ppm 2367±114 2128±39 2008±22 38±1 34±1 30±12
bc b c bc bc bcdT =Indoxacarb 14.5 SC @ 2 ppm 2136±71 2010±33 1625±78 35±1 31±1 25±13
bc b cd c c dT =Rynaxypyr 20 SC @ 2 ppm 2144±127 1983±34 1604±90 34±2 30±2 23±14
ab b de ab ab dT =Chlorfenapyr 10 EC @ 2 ppm 2247±21 2005±45 1483±149 36±2 32±1 23±25
d d f d d eT =Novaluron 10 EC @ 2 ppm 1732±69 1547±20 1065±13 27±1 22±1 13±26
c c e c c cdT =Novaluron 10 EC @ 5 ppm 2058±104 1642±47 1443±34 34±1 29±2 24±27
bc b bc bc bc bcT =Deltamethrin 2.8 EC @ 1 ppm 2114±79 1992±29 1727±68 34±2 30±2 27±38
e e g e e fT =Untreated control 1534±74 1067±20 418±55 23±2 13±1 5±19
SEm± 46.49 19.16 41.59 0.78 0.76 0.97
CD at (p=0.05) 138.15 56.94 123.58 2.33 2.24 2.87
CV (%) 3.90 1.82 4.90 4.05 4.59 7.52
Means followed by same alphabet in column do not differ significantly; MAT: Months after treatment.
Vigour index-I Vigour index-IITreatments
IJAS 2014 • 213
International Journal on Agricultural Sciences Vol. V (Issue 2), pp. 211-214, 2014

ISSN NO. 0976-450X
IJAS 2014 • 214
insecticide molecules did not affect the
germination at different storage periods, clearly
indicating the effectiveness of these molecules
except novaluron 10 EC @ 2 ppm in managing
the C. maculatus. The reduction in germination
was observed only in untreated control. The
present results were in confirmation with the
results obtained by Bareth and Guptha (1989);
Sinha (1993), they revealed the germination of
seed was not affected up to 15 months of storage.No significant differences were observed
between the treatments with respect to moisture
content up to 3 months but significant
differences were observed at six and nine
months after treatment imposition. Least
moisture content was recorded in spinosad 45
SC @ 2 ppm (10.33 %) and highest in untreated
control (12.77±0.5 %) at nine months after
treatment imposition. These observations were
supported by Patil et al. (1994) reported that
pigeon pea seeds treated with deltamethrin 2.8
EC @ 2 ppm (12.5 ppm) was the most effective
treatment against C. maculatus by recording
greater adult mortality and no loss in seed
weight up to 12 weeks.
Both vigour indexes I and II affected at three, six
and nine months after treatment imposition.
Spinosad 45 SC @ 2 ppm recorded highest
mean vigour index-I (2367, 2128 and 2008) and
least in untreated control (1534, 1067 and 418),
similarly with respect to vigour index-II highest
(38, 34 and 30) was recorded in spinosad 45 SC
@ 2 ppm and least (23, 13 and 5) in untreated
control. No reviews were available regarding
these aspects. This clearly indicating that
spinosad 45 SC @ 2 ppm does not affect the
vigour index of the seed and helps to get
vigorous seedlings. Finally the insect damage
causes reduction in germination as well as
increase in moisture content which again not
beneficial for seed growers as well as seed
industries. Green insecticides are safer in the
management of C. maculatus on chickpea
without affecting the germination, moisture
content and vigour index of the seeds.
REFERENCES
1. BARETH, S. S. AND GUPTHA, H. C., 1989,
Efficacy of gunny bag and seed treatment
on the natural infestation on Rhyzopertha
dominica (Fab.) on stored wheat. Seed Res.,
17(2): 178-181.
2. ISTA, 2010, International rules for seed
testing, Zurich, Switzerland.
3. PATIL, R. K., NAWALE, R. N. AND MOTE,
U. N., 1994, Efficacy of synthetic
pyrethroids as seed protectants of
p igeonpea against pulse beet le ,
Callosobruchus maculatus Fab. Indian J.
Entomol., 56(1): 51-57.
4. SINHA, S. N., 1993, Seed health test:
detection of insects and nematodes and
plant parasites In: Hand Book of Seed
Testing, P.K. Agarwal (ed.). India. pp. 131-
137.
5. ABDUL-BAKI, A. A. AND ANDERSON, J.
D., 1973, Vigour determination in soybean
seed by multiple criteria. Crop Sci. 13: 630-
633.
International Journal on Agricultural Sciences Vol. V (Issue 2), pp. 211-214, 2014
ISSN NO. 0976-450X
BIOLOGICAL CONTROL: AN ECOFRIENDLY APPROACH FOR ROOT-KNOT NEMATODE MANAGEMENT IN TOMATO
Hemlata Pant and Gopal Pandey
Society of Biological Sciences and Rural Development10/96, Gola Bazar, New Jhusi, Allahabad-211019, U.P.
INTRODUCTIONTomato (Lycopersicon esculentum), is an
important vegetable crop is seriously affected
by root-knot nematode. (Sasser and Carter,
1985). Bio-control agents particularly nematode
destroying fungi are common and abundant in
both natural and agricultural soil (Jatata, 1986
and Pandey, et al., 2003). Bio-control agents
have got some inherent advantages of being
safe, host specific efficacious, environmental
friendly and long lasting. Despite the significant
advantages of biopesticide there are some other
factors which have reduced their practical
effectiveness and commercial exploitation
(Ganguli et al., 1994). A number of bio-control
agents have been found effective against
nematodes. Mankau (1990), Alam (1990),
Pandey (2002). The present investigation were
carried out with the objective to explore the
possibilities of using Trichoderma viride,
Beauveria bassiana and spent compost of oyster
mushroom as a bio-control for the management
of root-knot nematode.
MATERIALS AND METHODSExperiment was conducted in National
Academy of Biological Sciences and Rural
Development (Research wing of SBSRD), Jhusi,
Allahabad, (U.P.) during 2013-14. Sixteen pots
were taken for experimental purpose. The six
inch earthen pots were sterilized with formlin
and filled with sterilized soil. Seven days old
seedlings of tomato variety 'Kanchan' were
planted and after seven days 1000 newly
ABSTRACT
Two biocontrol agents viz. Trichoderma viride and Beauveria bassiana and one organic
matter viz. spent compost of oyster mushroom were taken for the management of root-knot
nematode (Meloidogyne incognita). The result revealed that Trichoderma viride was very
effective for management of root-knot nematode followed by spent compost of oyster
mushroom (Pleurotus sajor caju) and Beauveria bassiana respectively. Better growth
parameters and number of fruits were noted in T. Viride, followed by B. bassiana and spent
compost of oyster mushroom respectively.
No. of Pages: 3 No. of Tables: 1 References: 11
Keywords: Root-Knot nematode, tomato, management, bio-control.
International Journal on Agricultural Sciences Vol. V (Issue 2), pp. 215-217, 2014
Corresponding author: [email protected]
Research Paper
Received on: 28.05.2014 Revised on: 05.05.2014 Accepted on: 28.06.2014
ISSN NO. 0976-450X
IJAS 2014 • 216
hatched larva from egg masses of Meloidolyne
incognita (extracted from tomato plants) were
pipetted and inoculated into three inch deep
hole near the base of the plant in each pot and
5000 spores of T. viride and B. bassiana were
also inoculated with the help of pipet in plant
zone. Twenty gram spent compost was amended
in sterilized soil 15 days before inoculation of
M. incognita and bio-control agents in pots.
Plants were irrigated normally. At senescence
stage of the crop observation was taken viz.
shoot length, root length; fresh shoot weight,
fresh root weight, number of fruits and root-
knot.
T. viride and B. bassiana were isolated from the
local soil condition and maintained on potato
dextrose agar slant. T. viride and B. bassiana 0were multiplied in nutrient broth at 27±2 C for
15 days under stationary conditions. Fungal met
along with culture filtrate was sterilized and
500 ml sterile distilled water was added to make
Reduction of nematode galls and increase in
plant growth parameters may due to the
presence of high concentration of some toxic
chemicals such as 'viridin' in T. viride and
them suspension. The suspension was used
inoculation in tomato plant. pH and moiture
were observed by pH meter and moisture meter
respectively. Data of observation was computed
as per the analysis of variance test of completely
Randomized Block Design.
RESULTS AND DISCUSSIONObservations revealed that all treatments viz. T.
viride, B. bassiana, spent compost of oyster
mushroom increase plant growth characters of
tomato plant and reduce number of root-knot
galls. T. viride was found to be the most effective
among all the treatments. Maximum reduction
of root-knot was found in application of T.viride
followed by spent compost of oyster mushroom
and B. bassiana respectively. Higher plant
growth parameters were recorded in
application of T. viride followed by B. bassiana
and spent compost of oyster mushroom
respectively.
'Beauverin' in B.bassiana. Oyster mushroom
mycelium is carnivorous, it eats nematodes, it
Table 1: Effect of T. viride, B. bassiana and spent compost of oyster mushroom on the growth parameters, number of fruits, number of galls, pH and moisture on tomato plant.
Treatment Shoot Fresh Fresh No. of No. of pH Moisturelength length Root shoot fruits Root-(cm) (cm) weight weight galls
(g) (g)
Tricoderma viride 58.25 19.75 15.37 2.37 2.25 17.25 7.14 8.26
B. bassiana 53.00 13.00 11.75 2.12 1.75 24.50 7.30 8.20
Spent compost 49.75 8.75 9.25 1.25 1.50 18.50 7.30 7.34oyster mushroom
Control 38.50 11.00 11.12 0.87 1.00 55.00 8.33 5.08
C.D. (p=0.05) 7.78 7.27 — 1.072 - 16.64 - 1.569
F% (p=0.05) S S NS S NS S NS S
Root
International Journal on Agricultural Sciences Vol. V (Issue 2), pp. 215-217, 2014
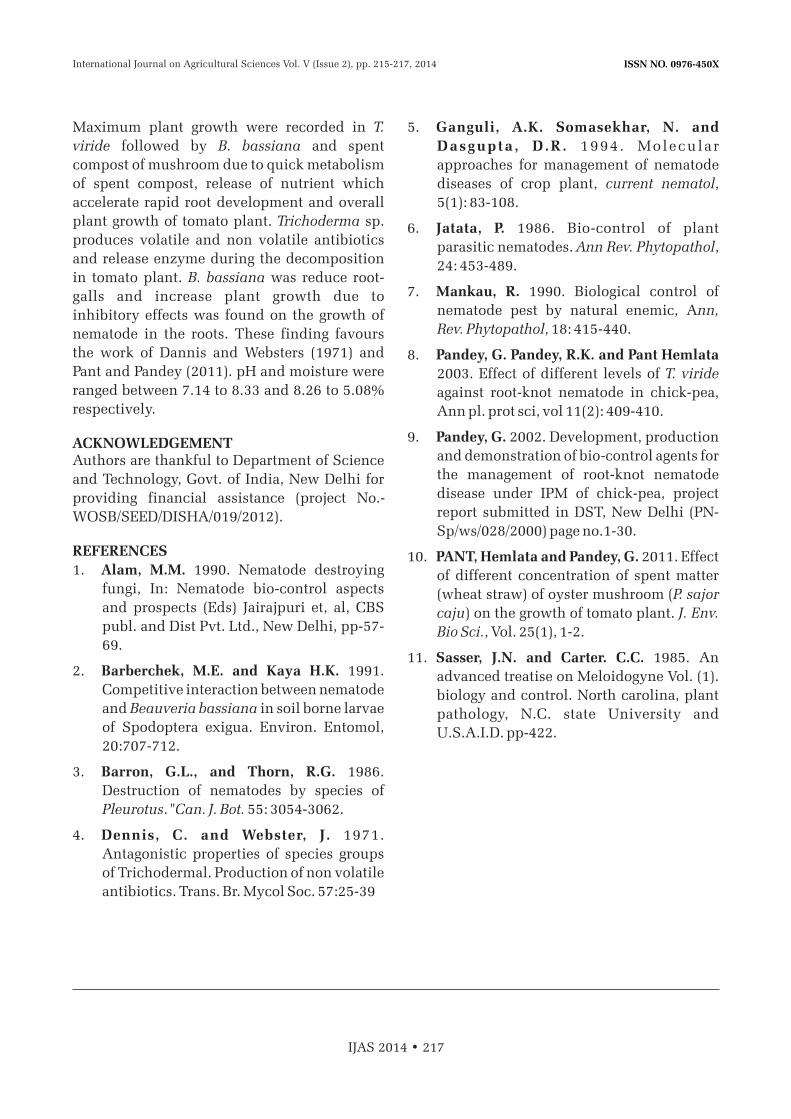
ISSN NO. 0976-450X
IJAS 2014 • 217
Maximum plant growth were recorded in T.
viride followed by B. bassiana and spent
compost of mushroom due to quick metabolism
of spent compost, release of nutrient which
accelerate rapid root development and overall
plant growth of tomato plant. Trichoderma sp.
produces volatile and non volatile antibiotics
and release enzyme during the decomposition
in tomato plant. B. bassiana was reduce root-
galls and increase plant growth due to
inhibitory effects was found on the growth of
nematode in the roots. These finding favours
the work of Dannis and Websters (1971) and
Pant and Pandey (2011). pH and moisture were
ranged between 7.14 to 8.33 and 8.26 to 5.08%
respectively.
ACKNOWLEDGEMENTAuthors are thankful to Department of Science
and Technology, Govt. of India, New Delhi for
providing financial assistance (project No.-
WOSB/SEED/DISHA/019/2012).
REFERENCES
1. Alam, M.M. 1990. Nematode destroying
fungi, In: Nematode bio-control aspects
and prospects (Eds) Jairajpuri et, al, CBS
publ. and Dist Pvt. Ltd., New Delhi, pp-57-
69.
2. Barberchek, M.E. and Kaya H.K. 1991.
Competitive interaction between nematode
and Beauveria bassiana in soil borne larvae
of Spodoptera exigua. Environ. Entomol,
20:707-712.
3. Barron, G.L., and Thorn, R.G. 1986.
Destruction of nematodes by species of
Pleurotus. "Can. J. Bot. 55: 3054-3062.
4. Dennis, C. and Webster, J. 1971.
Antagonistic properties of species groups
of Trichodermal. Production of non volatile
antibiotics. Trans. Br. Mycol Soc. 57:25-39
5. Ganguli, A.K. Somasekhar, N. and
Dasgupta , D .R . 1994 . Molecular
approaches for management of nematode
diseases of crop plant, current nematol,
5(1): 83-108.
6. Jatata, P. 1986. Bio-control of plant
parasitic nematodes. Ann Rev. Phytopathol,
24: 453-489.
7. Mankau, R. 1990. Biological control of
nematode pest by natural enemic, Ann,
Rev. Phytopathol, 18: 415-440.
8. Pandey, G. Pandey, R.K. and Pant Hemlata
2003. Effect of different levels of T. viride
against root-knot nematode in chick-pea,
Ann pl. prot sci, vol 11(2): 409-410.
9. Pandey, G. 2002. Development, production
and demonstration of bio-control agents for
the management of root-knot nematode
disease under IPM of chick-pea, project
report submitted in DST, New Delhi (PN-
Sp/ws/028/2000) page no.1-30.
10. PANT, Hemlata and Pandey, G. 2011. Effect
of different concentration of spent matter
(wheat straw) of oyster mushroom (P. sajor
caju) on the growth of tomato plant. J. Env.
Bio Sci., Vol. 25(1), 1-2.
11. Sasser, J.N. and Carter. C.C. 1985. An
advanced treatise on Meloidogyne Vol. (1).
biology and control. North carolina, plant
pathology, N.C. state University and
U.S.A.I.D. pp-422.
International Journal on Agricultural Sciences Vol. V (Issue 2), pp. 215-217, 2014

ISSN NO. 0976-450X
IJAS 2014 • 218
ISSN NO. 0976-450X
ROLE OF SOIL ORGANIC MATTER IN SOIL HEALTH SUSTAINABILITY
A. K. Singh, R. K. Chauhan and J. S. Bisen
Darjeeling Tea Research and Development CentreTea Board, Kurseong, Darjeeling 734203, West Bengal, India
INTRODUCTIONSoil (S- Soul, O- Of, I- Infinite, L- Life) is a living
and dynamic system which supports all kind of
life on this planet. Sustainability of the soil is the
need of today's agriculture. Sustainable farming
is the successful management of resources for
agricultural production to satisfy the human
needs while maintaining or enhancing the
quality of environment and conserving natural
ecosystem. A farming system can be considered
sustainable, if it ensures that “today's
development is not at the expense of tomorrow's
development prospects” (World commission on
environment and development 1987). In fact, soil
must not be assaulted by slapdash and greedy
agricultural methods. No system of farming will
be sustainable unless the soil which forms its
pivot being the most important natural resource
is managed scientifically to meet the present and
future needs, its productivity and quality are
maintained continuously and there is no
reduction of output with inputs (Kanwar, 2002).
There are some soil parameters which can be
used as indicators of soil sustainability like soil
ABSTRACT
Soil health deterioration is a big challenge for every stakeholders of agriculture. For this
menace loss of organic matter from soil is one of the important factors. The soil organic
matter (SOM) consists of whole series of products which range from unrecompensed plants
and animal tissues to fairly amorphous brown to black material bearing no trace of the
distinctive anatomical structure of the material that is normally defined as the soil humus.
SOM is an important component of soil and a tool to achieve soil sustainability because it
influences the chemical, physical and biological properties of soil and nutrient availability
to the plants. Maintaining optimum level of soil organic matter by applying appropriate
organic manures in the soil could ensure adequate supply of essential plant nutrients to the
plant and also to combat the global warming. Hence, sustainability in the soil health,
productivity and environmental safety could be achieved by improving the soil organic
matter content in the soils.
No. of Pages: 9 References: 34
Keywords: Soil, Soil Health, Sustainability, Organic Matter.
International Journal on Agricultural Sciences Vol. V (Issue 2), pp. 219-227, 2014
Corresponding author: Email: [email protected]
Research Paper
Received on: 08.05.2014 Revised on: 18.05.2014 Accepted on: 28.06.2014

ISSN NO. 0976-450X
IJAS 2014 • 220
chemical, physical, biological properties, soil
fertility and soil erosion status. Any system of
farming which creates adverse effect on these
parameters of soil is undesirable and thus
unsustainable. Soil organic matter is an
important component of soil and can be a tool to
achieve soil sustainability because it influences
the chemical, physical, biological properties and
nutrient availability to the plants (Reeves, 1997).
Soil health is defined as the continued capacity of
soil to function as a vital living system, by
recognizing that it contains biological elements
that are key to ecosystem function with in land-
use boundaries (Doran and Zeiss, 2000). Some
important roles of soil organic matter are
summarized here which enable us to understand
how long term sustainability could achieved
through soil organic matter management.
1. Role of soil organic matter in maintenance of
soil chemical properties:Soil buffering capacity may be defined as to
resistance to a change in pH. The power to resist a
change in pH is called “buffer action”. Buffer
solution contains reserve acidity and alkalinity
and does not change pH with small addition of
acids or alkalis. Among the various factors which
affect the buffering capacity of the soil, the
organic matter content is one of the important
factor. Soil containing large amounts of clay and
organic matter is said to be highly buffered
(Curtin et al., 1996). In this way, organic matter
content of soil helps to keep the pH within level
which affects nutrient availability (Vermeer,
1996). Owing to such buffering effects of organic
matter, plant root does not suffer from excessive
acids, alkali or salts.
Cation exchange capacity is defined as the sum
total of the exchangeable cations that a soil can
adsorbs (Lax et al., 1986). Next to the
photosynthesis, cation exchange capacity is the
most important phenomena in nature. In
general, cation exchange capacity increases
with organic matter content of soil (Kirchmann
et al., 2007). Humus micelle is negatively
charged and is capable of holding nutrient ions.
Soil containing high amount of organic colloids
have high ion exchange properties because of its
high surface charge density that affects ion
exchange phenomena. The contribution of soil
organic matter to CEC can vary between 25-90%
(Stevenson, 1994).
Soil organic matter acts as a chelate (Bocanegra
et al., 2006). The chelate is an organic
compound that can bind to a metal like Fe, Zn,
Cu, Mn etc. by more than one bond and form a
ring or a cyclic structure by such bonding. The
soluble chelates probably help to mobilize these
micro-nutrients by increasing their availability
to plants and mobility in soils.
2. Soil organic matter and physical properties
of soil:Bulk density may be defined as the mass of soil
per unit volume of dry soil (Brady and Weil,
2002). Bulk density affects plant root penetration,
water and air–filled pore space, biological
activity, hydraulic conductivity of water through
soil profile, drainage condition etc. Soil having
high organic matter content possessed lower bulk
density value. Low bulk density is desirable for
good soil physical condition.
Soil structure controls various physical
properties like porosity, temperature,
consistence and color. Granular and crumby
types of soil structure provide most suitable soil
physical properties. Soil organic matter
improves the formation of granular type
aggregates in soil. Decomposition of soil organic
matters produces different organic compounds
having sticky, cementing and binding
properties which bind the soil separates
together forming soil aggregates (Tisdall and
Oades, 1982).
Soils containing high amount of organic matter
possesses high porosity because of good
International Journal on Agricultural Sciences Vol. V (Issue 2), pp. 219-227, 2014

ISSN NO. 0976-450X
aggregate formation (Carter and Stewart, 1996).
High porosity facilitates good aeration in soil. In
the decomposition process of organic matter in
soil, CO is generated which consequently 2
increases the concentration of CO in soil. There 2
is a positive co-relation between CO 2
concentration in soil and microbial activity.
High microbial activity may increase the
availability of nutrients to plants. Soils having
high amount of organic matter show the colour
variation from black to dark brown (Peverill et
al., 1999). Soil color directly modifies the soil
temperature e.g. dark colored soils absorb more
heat than light colored soil (Baldock and
Nelson, 1999). In the hills, where temperature
is very low for mineralization of nutrient, the
black color could helps in mineralization
process by increasing the soil temperature.
Soil organic matter plays an important role in
the retention of capillary water in soil (Mapa
and de Silva, 1994). The capillary water is only
the available water for plant. The presence of
organic matter in soil increases the percentage
of pore spaces and consequently increases the
capillary water holding capacity of a soil
(Khaleel et al., 1981; Haynes and Naidu, 1998).
Organic matter influences the aggregation as
well as formation of soil structure which affects
the amount of capillary water. Humus, a
decomposed product of organic matter, has a
greater capacity for holding water especially
capillary water. Organic matter also helps to
maintain a high proportion of macropores in
soils which increases the saturated flow of
water. Soil water losses through percolation and
evaporation can also be minimized by using
mulch of organic matter.
Soil organic matter exhibits an interesting effect
upon soil plasticity. Organic matter has a high
adsorption capacity for water. Thus, the
addition of organic matter to soil may be
expected to extend the zone of friability to fairly
high moisture contents. Organic matter also
reduces cohesion, stickiness in soil containing
higher amounts of clay. Soil temperature is the
most important environmental factor
influencing the biological processes and
microbial activity. Those soils which contains
high amount of mineral matter get heated very
easily than those have higher amount of organic
matter. In a dark color soil where color is caused
by large amounts of humus, the larger amount of
water held by the humus, may affect the
increased heat absorption due to dark color.
3. Effect of soil organic matter on biological
properties of soil: The number of soil microbes like bacteria, fungi
and actinomycetes in soil may be a good
indicator of soil biological properties. Both
population and activity of soil microorganism
depend upon the source of energy rich materials
(Ingham, 2000). The soil organic matter is the
energy source for most of the soi l
microorganisms Baldock and Nelson (1999).
The absence of such material in soil not only
reduces the microbial activity but also reduces
their population. Unavailable form of nutrient
made available to the plants by soil
microorganism. The soil microorganisms are
agents in a number of biological transformations
in soil through various types of biochemical
reactions viz. hydrolysis, oxidation, reduction
etc (Brady, 2005). These reactions are catalyzed
by enzymes which are known as soil enzymes,
produced as a result of activities of
microorganism. Increasing the amount of
microorganism, microbial population and its
activity enhances the production of soil
enzymes which will ultimately increase the
biochemical reaction and also improve the
availability of nutrients to the plants. Soil
organic matter also supplies polysaccharides
(long chain sugar) which help in the genesis of
good soil structure (Elliot and Lynch, 1984).
IJAS 2014 • 221
International Journal on Agricultural Sciences Vol. V (Issue 2), pp. 219-227, 2014

ISSN NO. 0976-450X
4. Effect of soil organic matter on soil fertility:Macronutrient: Soil fertility is defined as the ability of soil to
supply nutrients for plant growth. The effect of
soil organic matter on availability of various
essential nutrients is described herein. Nitrogen
is stand alone nutrient for all plants which play
role in the formation of protein, enzyme, nucleic
acid, RNA and DNA. Organic matter is the main
source of soil nitrogen. A major portion of
nitrogen (more than 95-99 % of total) in soils
occurs in organic combination (Duxbury et al.,
1989; Baldock and Nelson, 1999). Soil organic
matter contains about 5% nitrogen and during a
single growing season 1-4% of organic nitrogen
is mineralized to inorganic nitrogen. Hence, soil
and crop management practices that conserve or
increase soil organic matter can make greater
contribution of mineralizable nitrogen and
nitrogen availability to crops. Nitrogen
mineralization is the conversion of organic
nitrogen (unavailable forms) to inorganic
ni t rogen (avai lable forms) . Nitrogen
mineralization is highly influenced by C/N ratio
of organic matter. A C/N ratio of organic matter of
approximately 20:1 is the dividing line between
immobilization and mineralization. Organic
matter which have C/N ratio >20:1, is
detrimental as high C/N ratio means less of
nitrogen availability to plants even if they are
present in organic matter conversely when C/N
ratio<20:1, mineralization will take place and
more N will be available for plant. Hence, use of
organic matter having lower C/N ratio for
quicker availability of nitrogen to plants, is
essential and in fact, understanding C/N ratio of
organic matter is important as it determines
quality of organic matter.
Phosphorus is the second most important
nutrient for proper plant growth and
development after N. A good supply of
phosphorus is associated with increased root
growth. A major proportion of P (20-75% of
total) in soils occurs in organic compounds
(Baldock and Nelson, 1999). The phosphorus
content of soil organic matter ranges from 1.0-
3.0%. The quantity of organic phosphorus in
soils generally increases with increasing organic
carbon. In general, phosphorus mineralization
and immobilization are similar to those of
nitrogen. The C/P ratio of the organic matter
regulates the predominance of phosphorus
mineralization over immobilization. C/P ratio
when <200:1, net mineralization of organic
phosphorus occurs but when it is >300:1, net
immobilization of inorganic phosphorus occurs.
No gain or loss of inorganic phosphorus at C/P
ratio 200-300. During decomposition of organic
matter, various organic acids are produced
which solubilize phosphates and other
phosphate bearing minerals and thereby lower
phosphate fixation. Organic compounds in soils
increase phosphorus availability by (1) the
formation of organophosphate complexes that
are easily assimilated by plants, (2) anion
replacement of H PO - on adsorption sites, (3) 2 4
the coating of Fe/Al oxides by humus to form a
protective cover and reduce adsorption and (4)
increasing the quantity of organic P mineralized
to inorganic phosphorus.
Potassium does not participate directly in
formation of organic compound present in plant
but it plays important role in photosynthesis,
respiration, chlorophyll development, water
balance in plant body and inorganic catalyst in
various processes. Potassium in organic waste
(manures and sewage sludge) occurs
predominantly as soluble inorganic K.
Therefore, waste material can supply sufficient
quantities of plant available K. Although organic
matter is not directly related with availability of
K to plants but it can improve the K availability
by conserving soil moisture, increasing soil
temperature, soil aeration and by optimizing soil
pH by buffering capacity of organic matter. 2+ 2+ +
Cations such as Ca , Mg and K are produced
during decomposition ((Brady and Weil, 2005)
IJAS 2014 • 222
International Journal on Agricultural Sciences Vol. V (Issue 2), pp. 219-227, 2014
ISSN NO. 0976-450X
Ca is essential for cell elongation & division and
calcium deficiency manifests itself in the failure
of terminal buds of shoots and apical tips of roots
to develop which inhibits plant growth. In
acidic soil, calcium is not readily available to
plant at low saturation. In this situation, animal
and municipal wastes can become an excellent
source of calcium. Magnesium plays an
important role in the synthesis of chlorophyll
molecules as it is core element of chlorophyll.
Increasing soil organic matter concentrations
increases the exchangeable cation capacity and
improves the magnesium supply available for
plant uptake (Mayland and Wilkinson,
1989).The organically complexed magnesium is
an important source of magnesium in some soils
(Mathan and Rao, 1982) Mg content in animal
and municipal wastes is similar to S content and
can therefore be used to supply sufficient
magnesium. Sulphur is the fourth most
important nutrient. It is essential for the
synthesis of the sulphur containing amino acids
cystine, cystiene, methionine which is essential
compounds of protein. The major source of
sulphur under natural condition is the organic
matter. In temperate region more than 95.0 % of
the total sulphur in soil is present in the organic
matter. Most animal and municipal wastes
contain sufficient quantities of plant available
sulphur. Similar to nitrogen and phosphorus,
sulphur mineralization is also affected by C/S
ratio. A C/S ratio at or below 200:1 is suitable for
S mineralization and above than this,
immobilization of sulphur takes place. Hence,
narrow C/S ratio is essential for rapid
mineralization of S otherwise temporary S
deficiency may occur.
MicronutrientsIron is essential component of all those enzymes
in which haem group is present. Addition of
organic matter to well drained soils can improve
Fe availability. Organic materials such as
manure, may supply chelation agents that add in
maintaining the solubility of micronutrients.
Improved structure of fine textured soil
resulting from applications of organic manures
should also increase Fe availability because of
better soil aeration. Zn is involved in the
production of auxins which are growth
regulating substances in plant. Organic matter is
the major source/reservoir of plant available
zinc. Application of organic manure could
provide sufficient plant available Zn. The
primary benefit of organic matter application is
increased natural chelation properties that
increase Zn concentration in soil solution and
plant availability. The amount of organic matter
found in soils affects the bioavailability of Zn
(Del Castilho et al., 1993).
Copper controls the water relation in plant.
Copper ion forms strong coordination
complexes with organic matter (Stevenson,
1991). Hence, Cu is often predominantly found
bound to the organic matter fraction in the soil
and soil organic matter can be the most
important soil factor in determining Cu
bioavailability.
Availability of Mn can be strongly influenced by
reaction with organic matter. Application of
natural organic materials such as peat moss,
compost and wheat clover straw has increased
the solution and available Mn. Manganese tends
to form weak coordination complexes with
organic matter (McBride, 1982).
Boron is considered as an essential element for
plant growth and development (Waqar et al.,
2009 and Marschner, 1995). Boron is one of the
most important micronutrient for tea plant
because its deficiency directly affects the
economic part (growing tip) of the tea. Boron is
required by plants for proper development and
differentiation of tissues, particularly the
growing tips. It also enhances cellular activity
such as cell division, differentiation and
maturation. The greater availability of B in
IJAS 2014 • 223
International Journal on Agricultural Sciences Vol. V (Issue 2), pp. 219-227, 2014
ISSN NO. 0976-450X
surface soils compared with subsurface soil is
related to the presence of greater quantities of
soil organic matter in surface soil. Boron added
to soils remains soluble and up to 85% could be
leached from sandy soils having low-organic
matter content. Such losses could be checked by
application of organic matter because
association of boron with organic matter
prevents its leaching and results in its
accumulation in the surface soils. Molybdenum
is an essential constituent of enzyme
nitrogenase. Molybdenum availability also
positively affected by organic matter
application. Average applications rates of
organic matter will provide sufficient plant
available molybdenum.
5. Effect of soil organic matter on soil erosion: Soil conservation is essential for long term
sustainability. Organic matter increases the
ability of soil to resist erosion. Soil erosion
simply refers to detachment and transportation
of soil particles from one place to another place.
There are various type of soil erosion namely
water erosion, wind erosion and wave erosion.
Among erosions, water erosion is a serious
problem in Darjeeling conditions. Soil erosion
may be called as “creeping death”. It causes loss
of soil, change of soil texture, loss of nutrients,
silting up of reservoirs, frequent flooding, loss of
crops and soil pollution. Soil erosion can be
controlled by using organic matter, covering of
soil during rainy season Debarba and Amado
(1997). Such organic mulches help to control
soil erosion by two ways, first is by prevention of
direct fall of raindrops on soil surface and
second by improving the physical properties of
soil after decomposition of organic matter (FAO,
1995). Crop residue mulches are economical,
effective and widely used. Other than organic
matter not a single material is available which
can nourish the soil in such broad way.
6. Soil and soil organic matter management
strategies for improving soil health
sustainability: l Soil samples should be collected and
analyzed as per recognized soil fertility
analytical procedures to have accurate soil
fertility information for each field
management unit.
l Estimate yield potential for each field based on
soil productivity and intended management
and then fixed up the yield target.
l Work out the plant nutrient needs to achieve
the pre-set yield target. Nutrient uptake and
removal data for common crops are
available from various sources. It is
important to distinguish between nutrient
removal/uptake by the target crop, or the
physical displacement of the nutrients from
the field through the crop harvest.
l Determine the amount of the nutrients to be
supplied through organics. The best method
is to sample the manures to be used in the
field. Determine accurately the nutrient
contents of the manure and the nutrient
release patterns.
l Decide the doses of the nutrients to be
supplied through fertilizers considering
indigenous nutrient supply. Keep record of
the nutrient sources, their rate, method and
time of application.
l Use plants residues as complimentary
source of plant nutrients.
l Grow suitable green manure crops like
Guatemala, Crotalaria and Stylosanthes etc.
in the vacant spaces of the tea field.
l Ensure retention of pruning litters and
shade tree droppings in the field which after
decomposition provides considerable
amount of essential nutrients to the plants.
l Use both bulky and concentrated organic
manure which help to maintain C: N ratio of
soil organic matter.
IJAS 2014 • 224
International Journal on Agricultural Sciences Vol. V (Issue 2), pp. 219-227, 2014

ISSN NO. 0976-450X
l Using suitable biofertilizers to improve
availability of the soil locked nutrients.
l Utilization of industrial wastes with proper
treatment to convert them into organic
manures.
l Use leguminous crops for green manuring
because it requires less amount of water and
also add nitrogen by symbiotic nitrogen
fixation and by biomass production as
compared to non-leguminous crops.
l Keep the soil always covered to avoid the
direct exposure of the soil to radiation
which induces the loss of soil moisture and
accelerate the decomposition of added as
well as native soil organic matter.
l Oil cakes should be well- powered before
application, so that they can be spread
evenly and are easily decomposed by
microorganism.
l Do not broadcast the organic manures, apply
through ring placement method.
l Fertilizer recommendations should be
followed, but always taking into account the
actual condition of the crop.
l Where inorganic fertilizer is required,
carefully placed compound fertilizer under
the tea canopy is likely to give the most
efficient utilization by the growing crop.
l Use leguminous species shade trees which
will help to improve biological Nitrogen
fixation and availability to the plant.
l Avoid application of fertilizer in heavy rainy
season.
l Since tea cultivation in Darjeeling is mostly
depending on rainfall, no irrigation facilities
are available hence; water harvesting and
conservation of soil moisture practices
should be followed.
l Maintain permanent soil covering
particularly in monsoon season to avoid soil
and nutrient losses.
l Minimize water loss by drainage.
l Avoid green manure or intercropping crops
with high water requirements in a low water
availability region like Darjeeling.
l Follow scientific recommendation for
drainage construction.
l Harvest water in situ by digging catch pits,
crescent bunds across the slope.
l Soil erosion is one of the major reasons for
decline in agricultural productivity
especially in high rainfall and high slope
areas like Darjeeling.
l High slope tea soil is particularly vulnerable
to soil and nutrient erosion at the time of
replanting and after pruning. Hence, special
care should be taken during replanting and
in pruning years.
l Use mulches of tea pruning and other
mulches, including litter from Guatemala
and crotalaria etc to avoid soil erosion.
l Soil for nursery should be taken from areas
to be planted so that soil is returned to the
field during planting.
l Construct drains to avoid rapid flows which
cause erosion, using stones at vulnerable
corners and planting grass along the sides to
hold the soil.
CONCLUSIONKeeping these immense roles of soil organic
matter in the improvement/nourishment of
chemical, physical and biological properties of
the soil and plant in view it is suggested to
maintain optimum level of soil organic matter
by applying appropriate organic manures in the
soil to ensure adequate supply of essential plant
nutrients to the tea plant and also to combat the
global warming. Hence, sustainability in the
soil health, productivity and environmental
safety could be achieved by maintaining the soil
organic matter content in the soils.
IJAS 2014 • 225
International Journal on Agricultural Sciences Vol. V (Issue 2), pp. 219-227, 2014
ISSN NO. 0976-450X
REFERENCES1. Annonymous. 2008. Field Management in
Tea. Tea Research Association, Tocklai
Experimental Station, Jorhat, India.
2. Baldock, J. A. and Nelson, P. N. 1999. Soil
Organic Matter. In: Handbook of Soil
Science. (Ed M. E. Sumner.) p. B25-B84.
(CRC Press: Boca Raton, USA.)
3. Bocanegra, M.P., Lobartini, J.C., and
Orioli, G.A. 2006. Plant uptake of iron
chelated by humic acids of different
molecular weights, Commun. Soil Sci.
Plant Anal. 37: 239–248.
4. Brady, N.C. and Weil R. R. 2005. The th
Nature and Properties of Soils. 13 Edition.
Macmillan Publishing Company, New York,
279- 313.
5. Brady, N.C., and Weil, R.R. 2002. The
Nature and Properties of Soils. New Jersey:
Prentice Hall, pp.960.
6. Carter, M.R., Stewart, B.A. (Eds.), 1996.
Structure and Organic Matter Storage in
Agricultural Soils. Advances in Soil
Science. Lewis Publishers, CRC Press,
Boca Raton, FL, USA, pp.477.
7. Curtin, D., Campbell, C. A. and Messer, D.
1996. Prediction of titratable acidity and
soil sensitivity to pH change. Journal of
Environmental Quality 25:280-284.
8. Debarba, L. and Amado, T.J.C. 1997.
Desenvolvimento de sistemas de produção
d e m i l h o n o s u l d o b r a s i l c o m
características de sustentabilidade. Rev.
Bras. Ciên. Solo, 21: 473–480.
9. Del Castilho, P., Chardon, W.J. and
Salomons, W. 1993. Influence of cattle-
manure slurry application on the
solubility of cadmium, copper, and zinc in
a manured acidic, loamy-sand soil. J. Envi.
Q. 22:689-697.
10. Doran, J.W. and Zeiss, M. R. 2000. Soil
health and sustainability: managing the
biotic
11. Duxbury, J. M., Smith, M. S., and Doran, J.
W. 1989. Soil organic matter as a source
and a sink of plant nutrients. In:Dynamics
of soil organic matter in tropical
ecosystems. (Eds D. C. Coleman, J. M.
Oades, and G. Uehara.) pp. 33-67.
(University of Hawaii Press: Honolulu.)
12. Elliot, L.F. and Lynch, J.M. 1984. The
effect of available carbon and nitrogen in
straw on soil and ash aggregation and
acetic acid production. Plant Soil, 78:
335–343.
13. FAO. 1995. Tillage systems in the tropics.
Management options and sustainability
implications. FAO Soils Bulletin No. 71.
Rome.
14. Havlin, J. L., Beaton, J.D., Tisdale, S.L.
and Nelson, W.L. 1999. Soil Fertility and
Fertilizers. Pearson Edu. New Delhi, India.
15. Haynes, R. J. and Naidu, R. 1998.
Influence of lime, fertilizer and manure
applications on soil organic matter content
and soil physical conditions: A review.
Nutri. Cycl. Agroeco. 51:123-137.
16. Ingham, E.R. 2000. The soil food web. In:
Soil biology primer. Rev. edition. Ankeny,
USA, Soil and Water Conservation Society.
17. Kanwar, J.S. 2002. Soil management for
sustainable agriculture. In: Fundamentals
of Soil Science (ed.) Indian Soc. Soil Sci.
India, New Delhi.
18. Khaleel, R., Reddy, K. R. and Overcash, M.
R. 1981. Changes in soil physical properties
due to organic waste applications: A review.
J. Envi. Q. 10:133-141.
19. Kirchmann, H., Bergström, L., Kätterer,
T., Mattsson, L., and Gesslein, S., 2007.
Comparison of long-term organic and
IJAS 2014 • 226
International Journal on Agricultural Sciences Vol. V (Issue 2), pp. 219-227, 2014
ISSN NO. 0976-450X
conventional crop-livestock systems on a
previously nutrient depleted soil in
Sweden, Agron. J. 99: 960-972.
20. Lax, A., Roig, A. and Costa, F. 1986. A
method for determining the cation
exchange capacity of organic materials.
Plant Soil. 94: 349-355.
21. Mapa, R. B. and De Silva, A. 1994. Effect
of organic matter on available water in
noncalcic brown soils. Sri Lan. J. Agric.
Sci., 31:82-93.
22. Marschner, H. 1995. Mineral nutrition of nd
higher plants. 2 ed. Acad. Press. London,
pp. 889.
23. Mathan, K. K. and Rao, K. C. 1982.
Interrelationships between forms of
magnesium in the Nilgiris soils. Madras
Agric. J. 69:667.
24. Mayland, H. F. and Wilkinson, S. R. 1989.
Soil factors affecting magnesium
availability in plant-animal system: A
review. J. Anim. Sci., 67: 3437-3444.
25. McBride, M.B. 1982. Electrons spin 2 +
resonance invest igat ion of Mn
complexation in natural and synthetic
organics. Soil Sci. Soci. Am. J., 46: 1137-
1143.
26. Peverill, K. I., Sparrow, L. A., and Reuter,
D . J . 1999 . ' So i l Ana lys i s . An
I n t e r p r e t a t i o n M a n u a l . ' ( CS I R O
Publishing: Collingwood.)
27. Reeves, D.W., 1997. The role of soil
organic matter in maintaining soil quality
in continuous cropping system. Soil
Tillage Res. 43:131-167.
28. Singh, I. D. 2005. The Planter's Guide to stTea Culture and Manufacture . 1 Edition,
NB Modern, Agencies, West Bengal, India.
29. Stevenson, F. J. 1994. 'Humus Chemistry:
Genesis, Composition, Reactions.' Wiley
and Sons: New York.
30. Stevenson, F.J. 1991. Organic matter-
micronutrient reactions in soil. In
'Micronutrients in Agriculture'. 2nd. edn.
(ed. Mortvedt, J.J., Cox, F.R., Shuman, L.M.
and Welch, R.M.). pp. 145-186. Soil Sci.
Soc. Am., Madison.
31. Tisdall, J. M. and Oades, J. M. 1982.
Organic matter and waters table aggregates
in soils. J. Soil Sci., 33:141-163.
32. Vermeer, A.W.P. 1996. Interactions between
humic acid and hematite and their effects on
metal ion speciat ion . Wageningen
University, The Netherlands. (Ph.D. thesis)
33. Waqar, A., Niaz, A., Kanwal,S.,
Rahmatullah and Rashid, M.K. 2009. Role
of Boron in plant Growth. A Review. J. Agri.
Res., 47(3) 329-338.
34. World Commission of Environment and
Development. 1987. Our Common Future.
Oxford Univesity Press, UK.
IJAS 2014 • 227
International Journal on Agricultural Sciences Vol. V (Issue 2), pp. 219-227, 2014

ISSN NO. 0976-450X
IJAS 2014 • 228

ISSN NO. 0976-450X
VARIABILITY AMONG THE Sclerotium rolfsii Sacc. ISOLATES FROM SOUTHERNKARNATAKA
Jabbar Sab, A. Nagaraja, Mallikarjun and Manu T. G.
Department of Plant Pathology, College of Agriculture, UAS, GKVK, Bangalore-560065
INTRODUCTIONSclerotium rolfsiiis a devastating soil-borne
plant pathogenic fungus with a wide host range
(Aycock 1966, Punja 1988). The fungus was
placed in the form genus Sclerotium by
Saccardo (Saccardo 1913), as it forms
differentiated sclerotia and sterile mycelia.
Although there are several other Sclerotium
producing fungi, the fungi characterized by
small tan to dark-brown or black spherical
sclerotia with internally differentiated rind,
cortex, and medulla were placed in the form
genus Sclerotium (Punja and Rahe 1992).
However, the teleomorphic state was
discovered later (Punja 1988), confirming that
the fungus was a basidiomycete. Sclerotium
rolfsiiusually causes collar rot, but spotted leaf
rot with a single tiny Sclerotium in the center
has also been reported (Singh and Pavgi 1965).
Geographical variability among S. rolfsii
populations was demonstrated by earlier
workers (Harltonet al. 1995, Nalimet al. 1995,
Okabe et al. 1998). Studies of variability within
the population in a geographical region are
important because these also document the
changes occurring in the population. The
purpose of the present study was to understand
the morphological variability of Sclerotium in
southern Karnataka.
ABSTRACT
Thirteen isolates of Sclerotium rolfsii were collected from different districts in southern
Karnataka. The morphological variability among the isolates varied colony diameter ranged
from 1.35 (SrMR) to 2.72 cm (SrHC and SrBSn) at 24 h, 4.42 (SrMR) to 6.77 cm (SrHC and
SrBSn) at 48 h and 8.83 (SrDF) to 9cm at 72 h.The colony colour varied from pure white to
dull white and the topography was fluffy to flat type. Concentric circles in colonies were thpresent in case of three isolates. Sclerotial initiation also varied significantly from 5 day
th13 day, the shape of sclerotia was round in shape except two isolates. Sclerotial number
among the isolates varied from 81(SrBSn) to 459 (SrBR), diameter of sclerotia varied from
1.05 mm (SrBR) to 2.11 mm (SrMW), test weight of sclerotia was more in SrBSn(136 mg).
Among the liquid media, carrot broth showed maximum dry mycelial weight (429 mg),
sclerotial production was more in oat meal extract broth (627).
No. of Pages: 8 No. of Tables : 4 No. of Plates: 1 References: 17
Keywords: Variability, Sclerotiumrolfsii, Morphology.
International Journal on Agricultural Sciences Vol. V (Issue 2), pp. 229-236, 2014
Corresponding author: Email: [email protected]
Research Paper
Received on: 14.05.2014 Revised on: 12.06.2014 Accepted on: 28.06.2014
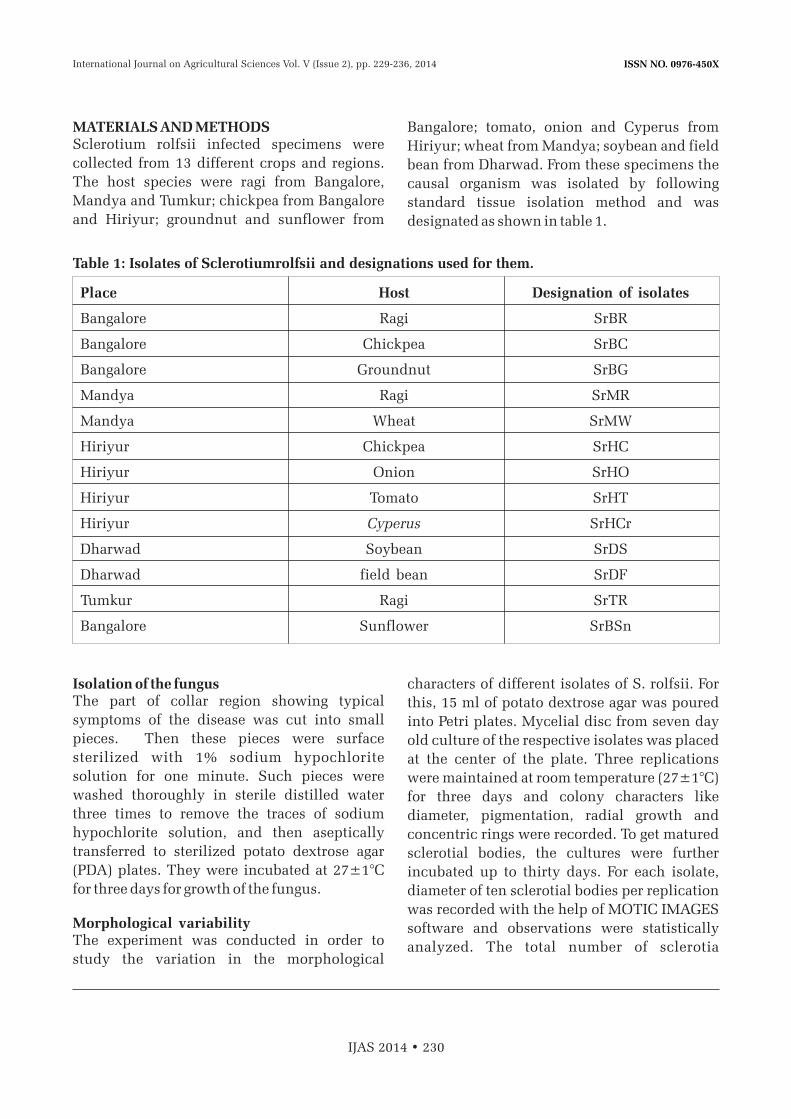
ISSN NO. 0976-450X
MATERIALS AND METHODS Sclerotium rolfsii infected specimens were
collected from 13 different crops and regions.
The host species were ragi from Bangalore,
Mandya and Tumkur; chickpea from Bangalore
and Hiriyur; groundnut and sunflower from
Bangalore; tomato, onion and Cyperus from
Hiriyur; wheat from Mandya; soybean and field
bean from Dharwad. From these specimens the
causal organism was isolated by following
standard tissue isolation method and was
designated as shown in table 1.
Isolation of the fungusThe part of collar region showing typical
symptoms of the disease was cut into small
pieces. Then these pieces were surface
sterilized with 1% sodium hypochlorite
solution for one minute. Such pieces were
washed thoroughly in sterile distilled water
three times to remove the traces of sodium
hypochlorite solution, and then aseptically
transferred to sterilized potato dextrose agar
(PDA) plates. They were incubated at 27±1°C
for three days for growth of the fungus.
Morphological variabilityThe experiment was conducted in order to
study the variation in the morphological
characters of different isolates of S. rolfsii. For
this, 15 ml of potato dextrose agar was poured
into Petri plates. Mycelial disc from seven day
old culture of the respective isolates was placed
at the center of the plate. Three replications
were maintained at room temperature (27±1°C)
for three days and colony characters like
diameter, pigmentation, radial growth and
concentric rings were recorded. To get matured
sclerotial bodies, the cultures were further
incubated up to thirty days. For each isolate,
diameter of ten sclerotial bodies per replication
was recorded with the help of MOTIC IMAGES
software and observations were statistically
analyzed. The total number of sclerotia
Table 1: Isolates of Sclerotiumrolfsii and designations used for them.
Place Host Designation of isolates
Bangalore Ragi SrBR
Bangalore Chickpea SrBC
Bangalore Groundnut SrBG
Mandya Ragi SrMR
Mandya Wheat SrMW
Hiriyur Chickpea SrHC
Hiriyur Onion SrHO
Hiriyur Tomato SrHT
Hiriyur Cyperus SrHCr
Dharwad Soybean SrDS
Dharwad field bean SrDF
Tumkur Ragi SrTR
Bangalore Sunflower SrBSn
IJAS 2014 • 230
International Journal on Agricultural Sciences Vol. V (Issue 2), pp. 229-236, 2014

ISSN NO. 0976-450X
produced per plate, test weight of 100 sclerotia
and shape of sclerotia of individual isolate were
also recorded and analyzed statistically.
Cultural variabilityThe growth characters of S. rolfsiiwere studied
on ten liquid media viz.,
1. Basal broth
2. Carrot broth
3. Corn meal broth
4. Host leaf extract broth
5. Malt extract broth
6. Oat meal extract broth
7. Potato dextrose broth
8. Rose Bengal broth
9. Sabouraud's broth
10. Yeast extract broth
Twenty ml of each of the medium was poured in
100 ml conical flasks. Such flasks were
inoculated with 5 mm disc cut from the
periphery of actively growing culture and
incubated at 27±1°C. Each treatment was
replicated thrice. Observations were taken 10
days after inoculation. The dry mycelial weight
was recorded by averaging the mycelial weight
of three replications.
RESULTS AND DISCUSSIONMorphological characters of 13 different
isolates of S. rolfsiiwere studied on potato
dextrose agar and observations were recorded.
The characters like radial growth, colony
colour, mycelial characteristics, shape and
number of sclerotial bodies per plate and test
weight of sclerotial bodies were recorded.
Variation in colony diameter was observed
(Table 3) that was significantly increased from
24 to 72 hours of incubation.
IJAS 2014 • 231
Table 2: Morphological characters of Sclerotiumrolfsii isolates on PDA.
Sl. Isolate Mycelia Growth Growth Distribution Days to ColonyNo. colour pattern rhythms of mycelia sclerotia diameter
growth initiation at 48 hover PDA
1 SrBR Pure white Fluffy Absent Irregular 5th day 5.50
2 SrBC Pure white Fluffy Present Thin 7th day 6.27
3 SrBG Pure white Fluffy Present Thick 13th day 5.47
4 SrMR Dull white Flat Absent Irregular 5th day 4.42
5 SrMW Dull white Fluffy Absent Thin 5th day 6.45
6 SrHC Pure white Fluffy Absent Thick 5th day 6.77
7 SrHO Cottony Cottony Absent Irregular 8th day 6.28white white
8 SrHT Pure white Fluffy Absent Irregular 7th day 5.98
9 SrHCr Pinkish white Fluffy Absent Thick 7th day 5.25
10 SrDS Dull white Fluffy Absent Irregular 5th day 6.53
11 SrDF Pure white Fluffy Present Thin 10th day 5.15
12 SrTR Pure white Fluffy Absent Thick 6th day 5.95
13 SrBSn Pure white Fluffy Absent Thin 9th day 6.77
International Journal on Agricultural Sciences Vol. V (Issue 2), pp. 229-236, 2014

ISSN NO. 0976-450X
IJAS 2014 • 232
At 48 h the maximum colony diameter was 6.77
cm in SrBSn and SrHC isolates followed SrDS
(6.53cm), SrMW (6.45cm), SrHO (6.28cm),
SrBC (6.27cm), SrHT (5.98cm) and SrTR
(5.95cm) that were on par with each other.
Minimum colony diameter was recorded in
SrMR (4.42 cm) followed by SrDF (5.15 cm) and
SrHCr (5.25cm) that were on par with each other
however, SrBR (5.50cm) and SrBG (5.47cm)
isolate fell in between others. Initially the
growth of S. rolfsii was slow but significantly
increased after 24 hours of incubation and
maximum colony diameter reached after 72
hours of incubation.
Variation was also found with respect to colour
of the mycelium, eight isolates viz.,SrBC, SrBR,
SrBG, SrHC, SrHT, SrDF, SrTR and SrBSn
showed pure white colour, but SrMR, SrMW
and SrDS appeared dull white. Isolate SrHO
showed cottony white colony, whereas SrHCr
appeared pinkish white in colour (Table 3).
Table 3: Sclerotial characters of Sclerotium rolfsii isolates.
Sl. Isolate Distribution Shape Colour No. per Test weight Diameter ofNo. over PDA plate of 100 sclerotia
sclerotia (mm) (mg)
1 SrBC All over Round Brown 342 45 1.05
2 SrHT Periphery Round Dark brown 205 66 1.85
3 SrBSn All over Irregular Light brown 81 136 1.12
4 SrHC Periphery Round Brown 238 90 1.10
5 SrBG All over Round Brown 173 108 2.11
6 SrTR All over Round Brown 313 44 1.11
7 SrDS Periphery Round Brown 319 47 1.91
8 SrDF All over Round Brown 255 74 1.22
9 SrBR All over Round Dark brown 459 67 1.44
10 SrHCr All over Round Brown 308 37 1.11
11 SrMR All over Round Brown 375 78 1.35
12 SrMW Periphery Round Dark brown 221 58 1.34
13 SrHO All over Irregular Light brown 282 80 1.73
SEm+ 0.02
CD(P 0.01) 0.07
CV (%) 2.00
Distribution of mycelium on Petri plates was
also varied. Isolates SrBC, SrMW, SrDF and
SrBSn had thin colony distribution, whereas
other four isolates viz., SrBG, SrHC, SrTR and
SrHCr had thick colony distribution. Isolates
SrBR, SrHT, SrDS, SrMR and SrHO showed
irregular colony distribution.
For characters like growth pattern, the isolates
SrBC, SrBR, SrBG, SrHT, SrHCr, SrDS, SrDF,
SrTR, SrBSn, SrMW and SrHC showed fluffy
colony, isolate SrMR appeared flat and SrHO
showed cottony white growth. With respect to
production of growth rhythms, SrBG and SrDF
showed presence of concentric circle and all
other isolates didn't exhibit concentric circles.
International Journal on Agricultural Sciences Vol. V (Issue 2), pp. 229-236, 2014

ISSN NO. 0976-450X
IJAS 2014 • 233
The period of sclerotial initiation was also
different. The isolates SrBR, SrMR, SrMW, SrDS thand SrHC initiated sclerotia on 5 day after
thincubation whereas SrTR started on 6 day.
Isolates SrHCr, SrBC and SrHT started forming thsclerotia on 7 day after incubation and the
isolate SrHO started forming sclerotial bodies a thday later (8 day after incubation). SrBSn isolate
thshowed initiation of sclerotial bodies on 9 day
whereas; SrDF and SrBG isolates started it on th th
10 and 13 day of incubation respectively.
With respect to colour of the sclerotia, the
isolates viz.,SrBC, SrBG, SrMR, SrHC, SrHCr,
SrDS, SrDF and SrTR produced brown colored
sclerotia whereas isolates SrBR, SrMW and
SrHT produced dark brown sclerotia. The
isolates SrBSn and SrHO produced light brown
colouredsclerotia.
Plate 1: Growth of Sclerotiumrolfsii isolates on PDALegend:SrMR: Mandyaragi SrDS: Dharwad soybeanSrBR: Bangalore ragi SrBSn: Bangalore sunflower SrDF: Dharwad field bean SrBG: Bangalore groundnutSrHO: Hiriyur onion SrHC: Hiriyur chickpeaSrMW: Mandya wheat SrBC: Bangalore chickpeaSrHCr: HiriyurCyperus SrTR: TumkurragiSrHT: Hiriyur tomato
International Journal on Agricultural Sciences Vol. V (Issue 2), pp. 229-236, 2014

ISSN NO. 0976-450X
IJAS 2014 • 234
Number of sclerotia produced per plate was also
varied. While the isolates SrBR produced the
highest number (459), the least number of
sclerotia were produced by SrBSn (81) isolate
on PDA. Other isolates SrMR (375), SrBC (342),
SrDS (319), SrTR (313), SrHCr (308), SrHO
(282), SrDF (255), SrHC (238), SrMW (221),
SrHT (205) and SrBG (173) fell in between.
As regards the distribution of sclerotia over the
plate, the isolates SrMW, SrHT and SrDS formed
the sclerotial bodies at the periphery of the Petri
plate and all the other isolates viz.,SrBR, SrBC,
SrBG, SrMR, SrHCSrHO, SrHCr, SrDF and SrTR
formed sclerotial bodies all over the plate.
With respect to shape of sclerotia, all the isolates
viz.,SrBR, SrBC, SrBG, SrHT, SrMR, SrHC,
SrHCrSrDF, SrTR and SrMW produced round
sclerotia, except SrHO and SrBSn which
produced sclerotia of irregular shape (Table 4). With respect to the diameter of sclerotia, the
isolate SrMW produced bigger sclerotia
(2.11mm) whereas smaller sized sclerotia were
produced by SrBR (1.05 mm) followed by
SrMR(1.10), SrDS (1.11mm) and SrHC
(1.11mm) which were on par with each other.
Isolates SrHO (1.91mm), SrBC (1.85mm),
SrBSn (1.73mm), SrHCr (1.44mm), SrDF
(1.35mm), SrTR (1.34mm), SrHT (1.22) and
SrBG (1.12mm) which fell in between(1.12-1.91
mm) were significantly different in their
sclerotial diameter.
Cultural variabilityThe experiment was conducted as explained in
'Material and Methods' in order to find out the
best liquid medium for mycelial growth of the
fungus (SrBC). The average mycelial weight of
the fungus after 10 days of incubation was taken.
Results in the table 8 indicate that the maximum
dry mycelial weight was found in carrot broth
(429 mg), followed by potato dextrose broth (365
mg) and oat meal extract broth (301mg) and they
were on par with one another and significantly
superior over the rest of the liquid media. While
basal and rose Bengal broth did not support the
pathogen growth, in host leaf extract broth (110
mg), followed by Sabouraud's broth (176 mg),
yeast extract broth (185 mg), malt extract broth
(230 mg) and corn meal broth (237 mg) the
growth was minimal and was on par each other.
With respect to number of sclerotia, oat meal extract broth was found to produce more number of sclerotial bodies (627) followed by malt extract broth (596), potato dextrose broth (573), host leaf extract broth (466) and yeast extract broth (241), which were on par with one other. While corn meal broth (223), carrot broth (151) and Sabouraud's broth (37) produced lesser number of sclerotia, basal broth and rose Bengal broth Sclerotiumrolfsii doesn't grow at all.
The colour of sclerotial bodies did not vary much in different media and it was uniformly dark brown in all the media excepting corn meal broth that produced light colouredsclerotial bodies.
Sulladmathet al. (1977), Manjappa (1979), Prabhu (2003), Jyothi (2006), Kulkarni (2007) and Manu (2012) have all reported variation among the isolates of Sclerotiumrolfsii, suggesting that, the variation among isolates depends on soil type, host crop and the environmental factors. However in the present study also as the isolates were collected from different crop hosts across diverse climatic regions of Karnataka the differences were obvious. Several other workers have also documented such variations among the isolates.
The variations among isolates were attributed mainly due to the nutritional status of culture medium (Heniset al., 1965). However as the present studies were carried out on single medium (PDA), the variations in their cultural characters states that, the isolates from different agro climatic regions and crop plants were acclimatized for their natural habitat (Epps et al., 1951; Heniset al., 1965).
International Journal on Agricultural Sciences Vol. V (Issue 2), pp. 229-236, 2014
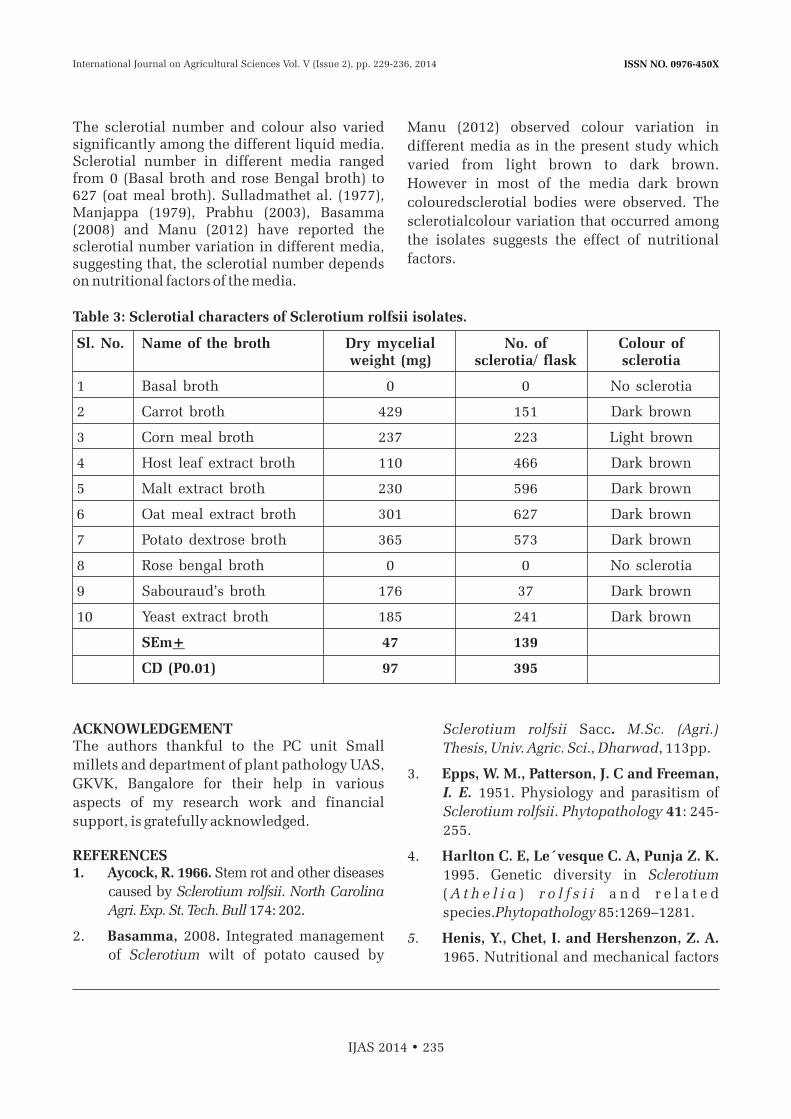
ISSN NO. 0976-450X
IJAS 2014 • 235
The sclerotial number and colour also varied significantly among the different liquid media. Sclerotial number in different media ranged from 0 (Basal broth and rose Bengal broth) to 627 (oat meal broth). Sulladmathet al. (1977), Manjappa (1979), Prabhu (2003), Basamma (2008) and Manu (2012) have reported the sclerotial number variation in different media, suggesting that, the sclerotial number depends on nutritional factors of the media.
Manu (2012) observed colour variation in
different media as in the present study which
varied from light brown to dark brown.
However in most of the media dark brown
colouredsclerotial bodies were observed. The
sclerotialcolour variation that occurred among
the isolates suggests the effect of nutritional
factors.
Table 3: Sclerotial characters of Sclerotium rolfsii isolates.
Sl. No. Name of the broth Dry mycelial No. of weight (mg) sclerotia/ flask sclerotia
1 Basal broth 0 0 No sclerotia
2 Carrot broth 429 151 Dark brown
3 Corn meal broth 237 223 Light brown
4 Host leaf extract broth 110 466 Dark brown
5 Malt extract broth 230 596 Dark brown
6 Oat meal extract broth 301 627 Dark brown
7 Potato dextrose broth 365 573 Dark brown
8 Rose bengal broth 0 0 No sclerotia
9 Sabouraud’s broth 176 37 Dark brown
10 Yeast extract broth 185 241 Dark brown
SEm+ 47 139
CD (P0.01) 97 395
Colour of
ACKNOWLEDGEMENTThe authors thankful to the PC unit Small
millets and department of plant pathology UAS,
GKVK, Bangalore for their help in various
aspects of my research work and financial
support, is gratefully acknowledged.
REFERENCES1. Aycock, R. 1966. Stem rot and other diseases
caused by Sclerotium rolfsii. North Carolina
Agri. Exp. St. Tech. Bull 174: 202.
2. Basamma, 2008. Integrated management
of Sclerotium wilt of potato caused by
Sclerotium rolfsii Sacc. M.Sc. (Agri.)
Thesis, Univ. Agric. Sci., Dharwad, 113pp.
3. Epps, W. M., Patterson, J. C and Freeman,
I. E. 1951. Physiology and parasitism of
Sclerotium rolfsii. Phytopathology 41: 245-
255.
4. Harlton C. E, Le´vesque C. A, Punja Z. K.
1995. Genetic diversity in Sclerotium
( A t h e l i a ) r o l f s i i a n d r e l a t e d
species.Phytopathology 85:1269–1281.
5. Henis, Y., Chet, I. and Hershenzon, Z. A.
1965. Nutritional and mechanical factors
International Journal on Agricultural Sciences Vol. V (Issue 2), pp. 229-236, 2014
ISSN NO. 0976-450X
IJAS 2014 • 236
involved in mycelial growth and
production of sclerotia by Sclerotium
rolfsii in artificial medium and amended
soil. Phytopathology 55: 87-91.
6. Jyothi, K. C. 2006. Morphological and
molecular variability among the isolates of
Sclerotium rolfsii Sacc. from different host
plants. M.Sc. (Agri.) Thesis, Univ. Agric.
Sci., Dharwad 77pp.
7. Kulkarni, V. R. 2007. Epidemiology and
integrated management of potato wilt
caused by Sclerotium rolfsii Sacc. Ph.D.
Thesis, Univ. Agric. Sci., Dharwad 191pp.
8. Manjappa, B. H. 1979. Studies on the
survival and variation in Sclerotium rolfsii
Sacc. M.Sc. (Agri.) Thesis, Univ. Agric. Sci.,
Bangalore 140 pp.
9. Manu, T. G . 2012 . S tud ies on
Sclerotiumrolfsii (Sacc.) causing foot rot
disease on finger millet M.Sc. (Agri) Thesis,
Univ. Agric. Sci., Bangalore 1-76 pp.
10. Nalim F. A, Starr JL, Woodard K. E, Segner,
S. , Keller N. P. 1995. Mycel ial
compatibility groups in Texas peanut field
populations of Sclerotium rolfsii .
Phytopathology 85:1507–1512.
11. Okabe I, Morikawa C, Matsumoto N,
Yokoyama K. 1998. Variation in
Sclerotium rolfsii isolates in Japan.
Mycoscience 39:399–407.
12. Prabhu, H. V. 2003. Studies on collar rot of
soybean caused Sclerotium rolfsii Sacc.
M.Sc. (Agri.) Thesis, Univ. Agric. Sci.,
Dharwad.
13. Punja, Z. K. 1988. Sclerotium (Athelia)
rolfsii, a pathogen of many plant species.
In: Sidhu GS, ed. Genetics of plant
pathogenic fungi. London:Academic Press
6:523–534.
14. Punja, Z. K. and Rahe, J. E. 1992.
Sclerotium. In: Singleton, LL, Mihail JD,
Rush CM, eds. Methods for research on
soil borne phytopathogenic fungi. St. Paul:
APS Press 166–170 pp.
15. Saccardo P. A. 1913. Sclerotium rolfsii.
Sylloge Fungorum XXII. Pavia, Italy
1500pp.
16. Singh, U. P. and Pavgi, M. S. 1965. Spotted
leaf rot of plants, a new sclerotial disease.
Plant Disease, Reptr 49:58-59.
17. Sulladmath, V. V., Hiremath, P. C. and
Anilkumar, T. B. 1977.Studies on
variation in Sclerotium rolfsii. Mysore J.
Agri. Sci11: 374-380.
International Journal on Agricultural Sciences Vol. V (Issue 2), pp. 229-236, 2014
ISSN NO. 0976-450X
SCOPE, POTENTIAL AND IMPORTANCE OF CARBON SEQUESTRATION THROUGH AGRO-FORESTRY
1 1 1Paramesh, V. , ArunKumar, P. , Akhilesh, K.S. ,
2 2Suresha C.N. and Parameshwar Naik.
1Division of Agronomy, IARI, PUSA, New Delhi
1Department of Dairy Extension, NDRI, Karnal, Haryana1Department of Agricultural Economics, Hisar, Haryana
1Department of Dairy Economics, NDRI, Karnal, Haryana1Department of Dairy Extension, NDRI, Karnal, Haryana
Concept of Carbon sequestration Increasing levels of atmospheric carbon dioxide
(CO ) and associated global warming have 2
moved to the center stage of climate change
discussion in the past two decades. While many
dispute the global warming hypothesis,
projected doubling of atmospheric CO by the 2
latter half of the Twenty-first century raises
concerns for everyone. Significant reductions in
the atmospheric CO concentrations can only be 2
achieved with substantial additional costs and
major changes in living standards. Therefore,
adoption of CO reduction strategies are widely 2
debated, not well received, and not agreed upon
ABSTRACT
Agroforestry, the purposeful growing of trees and crops in interacting combinations, began
to attain prominence in the late 1970s, According to the Intergovernmental Panel on
Climate Change, agroforestry system offer important opportunities of creating synergies
between both adaptation and mitigation actions with a technical mitigation potential of
1.1–2.2 Pg C in terrestrial ecosystems over the next 50 years. Additionally, 630 million ha of
unproductive croplands and grasslands could be converted to agroforestry representing a C
sequestration potential of 0.586 Tg C/yr by 2040 (1 Tg = 1 million tons). The total C storage
in the aboveground and belowground biomass in an AFS is generally much higher than that
in land use without trees (i.e. tree-less croplands) under comparable conditions. Various
agroforestry practices such as alley cropping, silvopasture, riparian buffers, parklands,
forest farming, homegardens, and woodlots, and other similar land use patterns have thus
raised considerable expectations as a C sequestration strategy in both industrialized and
developing countries.
No. of Pages: 7 No. of Tables : 2 References: 9
Keywords: Carbon sequestration, Agroforestry, soil organic carbon, global warming.
International Journal on Agricultural Sciences Vol. V (Issue 2), pp. 237-243, 2014
Corresponding author: Email: [email protected]
Research Paper
Received on: 24.04.2014 Revised on: 30.04.2014 Accepted on: 02.05.2014

ISSN NO. 0976-450X
IJAS 2014 • 238
by all nations. The world needs carbon (C)
sequestration techniques that provide social,
environmental, and economic benefits while
reducing atmospheric CO concentration. 2
Carbon sequestrations is the capture and secure
storage of carbon that would otherwise be
emmitted to or remain in the atmosphere. The
idea is to remove carbon in the atmosphere by
various means and storing it in the soil. Soil
Carbon sequestration is thus the process of
transfering carbon dioxide from the atmosphere
into the soil through crop residues and other
organic soilids, and in a form that is not
immedietly reemitted. This sequestring of
carbon helps off-set emmissions from fossil fuel
combustion and other carbon emmitting
activities while enhancing soil quality and long
term agronomic productivity.
Maintenance of agricultural systems to
sequester C has been accepted as a partial [4]
solution to climate change . Establishing and
maintaining perennial vegetation to enhance C
sequestration is less costly compared to most
other techniques, and these practices have
minimal environmental and health risks.
Perennial vegetation is more efficient than
annual vegetation as it allocates a higher
percentage of C to below-ground and often [4]
extends the growing season , therefore
enhancing C sequestration potential of
agricultural systems.
Globally, climate negotiations have highlighted
the importance of land use sectors in mitigating
the climate change. Agriculture alone accounts
for 10-12% of the total global anthropogenic
emissions of GHGs with an estimated non-
CO GHG emission of 5120-6116 MtCO eq/yr 2 2
in 2005. Since agricultural lands are often
intensively managed, they offer many
opportunities to improve agronomic
practices, nutrient and water management, land
use practices to fit the land managers
objectives of carbon sequestration. The total
carbon sequestration potential of global
croplands is about 0.75-1Pg/yr or about 50%
of the 1.6-1.8 Pg/yr lost due to deforestation [2]and other agricultural activities .
There is a growing interest in the role of
different types of land use systems in
stabilizing the atmospheric CO 2
concentration and reducing the CO emissions 2
or on increasing the carbon sink of forestry and
agroforestry systems. Forestry has been
recognized as a means to reduce CO emissions 2
as well as enhancing carbon sinks. The role of
forests (or trees) in carbon cycles is well
recognized and forests are a large sink of carbon.
There is considerable interest to increase the
carbon storage capacity of terrestrial vegetation
through land-use pract ices such as
afforestation, reforestation, and natural
regeneration of forests, silvicultural systems
and agroforestry. Agroforestry systems are very
important given the area currently under
agriculture, the number of people who depend
on land for their livelihoods, and the need for
i n t e g r a t i n g f o o d p r o d u c t i o n w i t h
environmental services.
Scope of Agroforestry in carbon sequestrationAgroforestry practices have the potential to
store carbon and remove atmospheric carbon
dioxide through enhanced growth of trees and
shrubs. It has been demonstrated to be a
promising mechanism of carbon sequestration
in India, Mexico, the former Soviet Union,
Canada and sub-Saharan Africa among others.
Carbon sequestration in Indian agroforests −1
varies from 19.56 t C ha per year in north
Indian state of UP to a carbon pool of −1 23.46–47.36 t C ha in tree-bearing arid
agroecosystems of Rajasthan. Average
sequestration potential in agroforestry has been −1estimated to be 25 t C ha over 96 million ha of
land in India. Estimates for global potential for
mit iga t ion act ion through improved
International Journal on Agricultural Sciences Vol. V (Issue 2), pp. 237-243, 2014

ISSN NO. 0976-450X
IJAS 2014 • 239
management have been projected to be between
400 Mha in agroforestry and 1300 Mha in crop
lands to a gross 1895 million ha in Asia, Africa
and Latin America. In general, agroforestry can
sequester carbon at time-averaged rates of –10.2–3.1 t C ha per year. In temperate areas, the
potential carbon storage with agroforestry −1
ranges from 15 to 198 t C ha , with a modal −1
value of 34 t C ha .
Agroforestry offers a cost-effective mitigation
option available in developing countries, such
as India and China, which have large potential
to sequester carbon and provide products and
services to the people. The estimated cost of
mitigation via agroforestry ranges from US$ 1.6 −1 −1
(t C) in India to US$ 16.3 (t C) in China. It
must be noted that these estimates do not
include the opportunity costs of the land, costs
of continuous management of a complex
system, rising wage rates in the tropics, etc.
Taking into consideration all these factors the
private cost of carbon sequestration may be as −1high US$ 100 (t C) . However, compared to
energy alternative (renewable energy, energy
saving and effi ciency, and fuel switch) tree-
growing is still a cost-effective option because of
the secondary social and environmental
benefi ts. Costs vary within the forestry sector for
different region—costliest in developed
countries and least costly in developing [7]countries .
Carbon sequestration potential of agroforestry
systemsAgroforestry, the practice of introducing trees
in farming has played a significant role in
enhancing land productivity and improving
livelihoods in both developed and
developing countries. Although carbon
sequestration through afforestation and
reforestation of degraded natural forests has
long been considered useful in climate
change mitigation, agroforestry offers some
distinct advantages. The planting of trees
along with crops improves soil fertility, controls
and prevents soil erosion; controls water
l o g g i n g , c h e c k s a c i d i f i c a t i o n a n d
eutrophication of streams and rivers, increases
local biodiversity, decreases pressure on natural
forests for fuel and provides fodder for
livestock. It also has the ability to enhance
the resilience of the system for coping with the
adverse impacts of climate change. The
effectiveness of agroforestry systems in storing
carbon depends on both environmental and
socio-economic factors; in humid tropics,
agroforestry systems have the potential to
sequester over 70 Mg/ha in the top 20 cm of
the soil. The carbon storage capacity in
agroforestry varies across species and
geography. Further, the amount of carbon in any
agroforestry system depends on the structure
and function of different components within
the systems put into practice.
The fact that agroforestry systems can function
as both source and sink of carbon and the type of
agroforestry system greatly influences the
source or sink role of the trees. For example,
agrisilvicultural systems where trees and crops
are grown together are net sinks. Practices like
tillage, controlled burning, manuring,
application of chemical fertilizers and frequent
soil disturbance can lead to significant
emissions of GHGs. According to the IPCC
agroforestry systems offer important
opportunities of creating synergies between
both adaptation and mitigation actions with
a technical mitigation potential of 1.1-2.2 PgC
in terrestrial ecosystems over the next 50 years.
Additionally, 630 Mha of unproductive
croplands and grasslands could be converted
to agroforestry representing a carbon
sequestration potential of 391,000 MgC/yr by
2010 and 586,000 MgC/yr by 2040 . The
carbon in the aboveground and belowground
biomass in an agroforestry system is generally
much higher than the equivalent land use
without trees (i.e. crop land without any trees).
International Journal on Agricultural Sciences Vol. V (Issue 2), pp. 237-243, 2014

ISSN NO. 0976-450X
IJAS 2014 • 240
The estimates of potential for carbon storage
in different kinds of agroforestry systems are [5]
provided in Table 1 . In Southeast Asia,
agrisilvicultural systems have the capacity to
store 12-228 MgC/ha in humid tropical lands
and 68-81 MgC/ha in dry lowlands. Highest
potential for carbon storage can be observed
for North American silvipastoral systems with
a range of 90-198 MgC/ha. The potential to
sequester carbon in aboveground components
in agroforestry systems is estimated to be 9 -1 9 2.1×10 MgCyear in tropical and 1.9×10
-1 MgCyear in temperate biomes. Agroforestry
systems can have indirect effects on carbon
sequestration as it helps decrease pressure on
natural forests that are the largest sinks of
terrestrial carbon; they also conserve soils and
thus enhance carbon storage in trees and soils.
Effects of agroforestry practices on the soil carbon
pool indicated a rate of increase by 2-3 MgC/ha/yr.
Estimations of carbon sequestration potential in
various studies report an estimated potential of
6.3GtC and 0.7-1.6 GtC.
Table 1: Carbon storage potential of agroforestry systems in different eco-regions of the world.
Continent Eco region System Potential-1(Mg Cha )
Africa Humid tropical high Agrisilvicultural 29-53
S. America Humid tropical low dry lowlands 39-102, 39-195
S. Asia Humid tropical dry lowlands 12-228, 68-81
Australia Humid tropical low Silvipastoral 28-51
N.America Humid tropical high humid 133-154, 104-198, tropical low dry lowlands 90-175
N. Asia Humid tropical low 15-18
Carbon Stocks in Agroforestry
Systems in IndiaCarbon sequestration in different
agroforestry systems occurs both
belowground, in the form of enhancement
of soil carbon plus root biomass and
aboveground as carbon stored in standing
biomass. Some of the earliest studies of
potential carbon storage in agroforestry systems
and alternative land use systems for India
had estimated a sequestration potential of
68-228 MgC/ha, 25tC/ha over 96 Mha of land.
But this value varies in different regions
depending on the biomass production. Studies
showed that agroforestry could store nearly 83.6
t C/ha up to 30 cm soil depth, 26% more carbon
compared to cultivation in Haryana plains.
However, the magn i tude o f ca rbon
sequestration from forestry activities would
depend on the scale of operation and the final [1]use of wood .
Agrisilvicultural systemsCarbon sequestration in tree biomass: The
estimated species wise annual carbon
sequestration potential of planted tree species
on abandoned agricultural land (3.9 t/ha/yr) and [3]
degraded forest land (1.79 t/ha/yr) . The
highest carbon sequestration was found for
Alnus nepaliensis 0.256 t C/ha/yr and Dalbergia
sissoo0.141 tC/ha/yr intercropped with wheat
and paddy. In a 6 year old Gmelina arborea
based agri-silvicultural system 31.37 t C/ha was
sequestered. In another study the carbon
sequestration in monocropping of trees and
food crops were 40% and 84% less than agri-
International Journal on Agricultural Sciences Vol. V (Issue 2), pp. 237-243, 2014

ISSN NO. 0976-450X
IJAS 2014 • 241
silviculture indicating that agroforestry systems
have more potential to sequester carbon. In an
agri-silvicultural system, Dalbergia sissoo at age
11 years was able to accumulate 48-52 t/ha of
biomass. Carbon dynamics involving different
pruning treatments were studied in an agri-
silvicultural system where tree biomass was
23.61 to 34.49 t C/ha with black gram-mustard.
In a study on poplar based agri-silvicultural
system, total biomass in the system was 25.2
t/ha, 113.6 % higher than sole wheat cultivation,
where net carbon storage was 34.61 t C/ha
compared to 18.74 t C/ha in sole wheat
cultivation. In a system comprising Albizia and
mixed tree species like Mandarin accumulated
1.3 t biomass/ha storing 6939 kg/ha in tree and
crop biomass was reported.
Soil organic carbon enhancement: In a
study conducted on intercropping of trees
with crops, showed an enhancement in SOC
by 33.3 to 83.3% for Populus deltoides and
Eucalyptus hybrid with Cymbopogon sp., with
a greater increase in SOC under Populus
deltoids plantation. Soil organic carbon has
been reported to have improved for agroforestry
plantations ranging in age from 6 years to 20
years. In a Poplar based agroforestry system,
trees could sequester higher soil organic
carbon up to 30cm depth during the first
year of plantation (6.07 t/ha/yr) than in
subsequent years (1.95-2.63 t/ha/yr) with
greater soil carbon storage in sandy clays than
loamy sand. Traditional Prosopis cineraria
based systems lead to a 50% increase in SOC
largely due to leaf litter. An increase in soil
organic carbon status of surface soil by 0.39 to
0.52% under Acacia nilotica+Sacchram munja
a n d 0 . 4 4 t o 0 . 5 5 % u n d e r A c a c i a
nilotica+Eulaliopsis binata after 5 years.
Silvipastoral systemsCarbon sequestration in tree biomass:
Comparative studies shows that biomass
production from natural grassland and
silvipastoral system comprising Albizia
amara, Dichrostachys cinerea and Leucaena
leucocephala as woody perennials with
Chrysopogan fulvus as grass and Stylosanthes
hamata and S. scabra as legume revealed that
in 8 years, rate of biomass carbon stored in
silvipastoral system was 6.72 tC/ha/yr, two
times more than 3.14 tC/ha/yr from natural [6]
grassland . The estimated the total carbon
sequestered in farm forestry with species
such as Eucalyptus sp., Populus deltoides,
Tectona grandis, Anthocephalus chinensis trees [9]to be around 16,400 t/yr . The study shows the
effect of introducing a silvipastoral system in a
natural grassland in semi arid Uttar Pradesh,
where introduced species of Albizia procera,
Eucalyptus tereticornis, Albizia lebbeck,
Embilica officinalis and Dalbergia sissoo
accumulated 8.6, 6.92, 6.52, 6.25 and 5.41
t/ha/yr of biomass. Here, the carbon storage in
the system was 1.89-3.45 tC/ha in
silvipasture and 3.94 tC/ha in pure pasture.
An increase in organic carbon of 1.7 to 2.3 times
in a silvipastoral system involving Leucaenea
l eucocephala , Cenchrus c i l iar i s and
Stylosanthes hamata compared to a control.
Similar studies have reported higher organic
carbon levels in dry sub-humid and arid
ecosystems when grass species are intercropped
with annual crops in a silvipastoral system with
no increase in organic carbon with grasses in an
arid ecosystem. In a silvipastoral system,
carbon flux in net primary productivity
increased due to the integration of Prosopis [8]
juliflora and Dalbergia sissoo with grasses .
CONCLUSIONAgroforestry systems show significant carbon
accumulation in living biomass, as well as soil
carbon, demonstrating the potential to offer the
environmental service of carbon sequestration.
Furthermore, agroforestry systems can
contribute to reducing CO emissions by 2
avoiding burning of forest-based fuel wood and
conserving soil. Besides the potential of
International Journal on Agricultural Sciences Vol. V (Issue 2), pp. 237-243, 2014
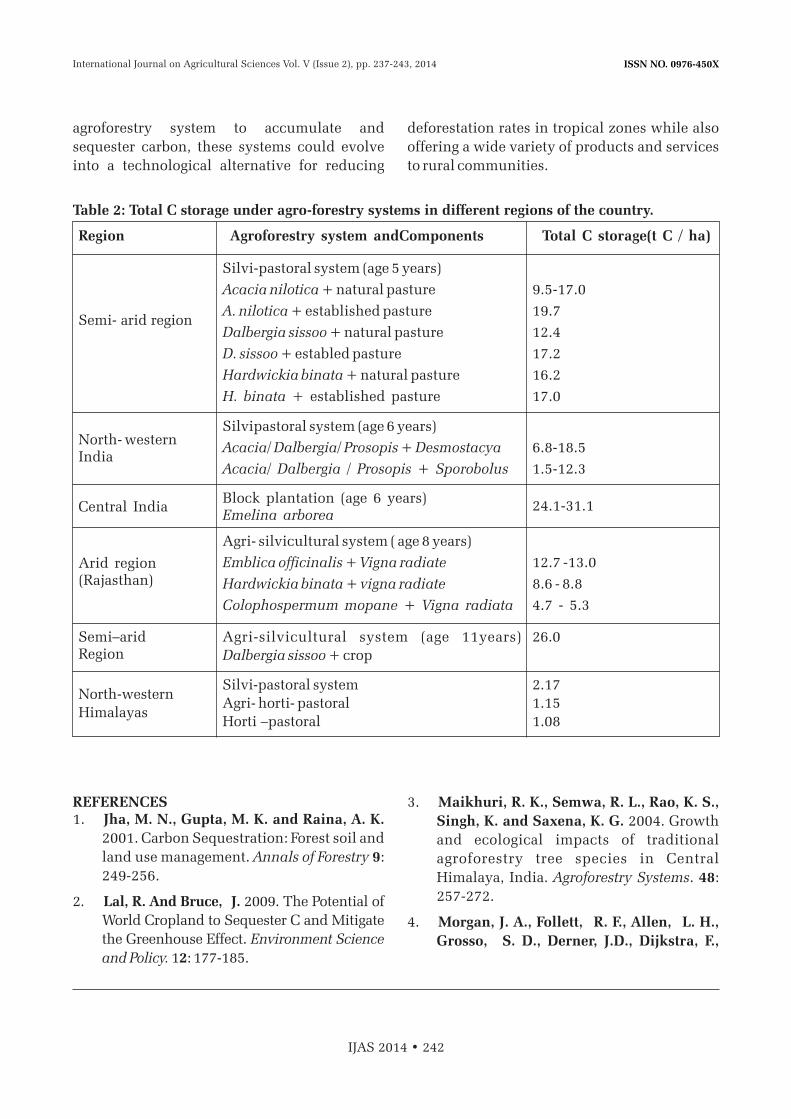
ISSN NO. 0976-450X
IJAS 2014 • 242
agroforestry system to accumulate and
sequester carbon, these systems could evolve
into a technological alternative for reducing
deforestation rates in tropical zones while also
offering a wide variety of products and services
to rural communities.
Table 2: Total C storage under agro-forestry systems in different regions of the country.
Region Agroforestry system andComponents Total C storage(t C / ha)
Silvi-pastoral system (age 5 years)
Acacia nilotica + natural pasture
A. nilotica + established pasture
Dalbergia sissoo + natural pasture
D. sissoo + establed pasture
Hardwickia binata + natural pasture
H. binata + established pasture
Silvipastoral system (age 6 years)
Acacia/ Dalbergia/ Prosopis + Desmostacya
Acacia/ Dalbergia / Prosopis + Sporobolus
Block plantation (age 6 years) Emelina arborea
Agri- silvicultural system ( age 8 years)
Emblica officinalis + Vigna radiate
Hardwickia binata + vigna radiate
Colophospermum mopane + Vigna radiata
Agri-silvicultural system (age 11years)
Dalbergia sissoo + crop
Silvi-pastoral system
Agri- horti- pastoral
Horti –pastoral
9.5-17.0
19.7
12.4
17.2
16.2
17.0
6.8-18.5
1.5-12.3
24.1-31.1
12.7 -13.0
8.6 - 8.8
4.7 - 5.3
26.0
2.17
1.15
1.08
Semi- arid region
North- westernIndia
Central India
Arid region(Rajasthan)
Semi–aridRegion
North-western
Himalayas
REFERENCES 1. Jha, M. N., Gupta, M. K. and Raina, A. K.
2001. Carbon Sequestration: Forest soil and
land use management. Annals of Forestry 9:
249-256.
2. Lal, R. And Bruce, J. 2009. The Potential of
World Cropland to Sequester C and Mitigate
the Greenhouse Effect. Environment Science
and Policy. 12: 177-185.
3. Maikhuri, R. K., Semwa, R. L., Rao, K. S.,
Singh, K. and Saxena, K. G. 2004. Growth
and ecological impacts of traditional
agroforestry tree species in Central
Himalaya, India. Agroforestry Systems. 48:
257-272.
4. Morgan, J. A., Follett, R. F., Allen, L. H.,
Grosso, S. D., Derner, J.D., Dijkstra, F.,
International Journal on Agricultural Sciences Vol. V (Issue 2), pp. 237-243, 2014
ISSN NO. 0976-450X
IJAS 2014 • 243
Franzluebbers, A., Fry, R., Paustian, K. and
Schoeneberger, M. M. 2010. Carbon
sequestration in agricultural land of the
United States. Journal of Soil Water
Conservation 65:6–13.
5. Murthy, I. K., Gupta, M., Tomar, S., Munsi,
M., Tiwari, R. 2013. Carbon Sequestration
Potential of Agroforestry Systems in India.
Journal of Earth Science and Climate
Change 4 (1):131-138.
6. NRCAF. 2007. Perspective Plan Vision
2025 National Research Centre for
Agroforestry, Jhansi, Uttar Pradesh.
7. Pandey, D.N. 2004. Carbon sequestration
in agroforestry systems, Climate Policy,
4(4): 367-377.
8. Rai, P., Ajit, Chaturvedi, P. O., Singh, R.,
Singh, U. P. 2009. Biomass production in
multipurpose tree species in natural
grasslands under semi arid conditions.
Journal of Tropical forestry. 25: 11-16.
9. Singh, T. P. 2003. Potential of Farm Forestry
in Carbon Sequestration. Indian Forester.
129: 839-843.
International Journal on Agricultural Sciences Vol. V (Issue 2), pp. 237-243, 2014

ISSN NO. 0976-450X
IJAS 2014 • 244
ISSN NO. 0976-450X
MANAGEMENT OF DODDER (CUSCUTA SP.) IN TRANSPLANTED ONION
M B Patil, S S Nooli, A K Guggari and S Y Wali
College of Agriculture, UAS, Dharwad, Bijapur campus, Karnataka
INTRODUCTIONOnion (Allium cepa) is one of the major bulb
crops of India. It is the single most important
vegetable in the world after tomatoes and is
considered as top most export commodity
among vegetables. It is consumed in raw form
and salads regularly in small quantities
comparable with that of hot pepper. The good
ABSTRACT
An experiment was conducted on farmer's field at Muttagi village of Bagewadi Taluka, Bijapur district during rabi 2012-13 and 2013-14 to evaluate the efficacy of pendimethalin and oxadiargyl as a pre-emergence herbicides followed by oxyfluorfen as a post emergence to control the dodder, a parasitic weed in transplanted onion. There were nine treatments consisting of six treatments with pre and post emergence herbicides and were compared with the recommended practice, weedy check and weed free check. The experiment was laid out in a randomized block design with three replications. Herbicidal treatments had significant effect on dodder population dynamics and onion bulb yield. Mean results of two years (2012-13 and 2013-14) revealed that, application of pendimethalin 30% EC at 1.0 kg ai/ha followed by sequential application of oxyfluorfen @ 0.25kg ai/ha at 5, 7 and 8 weeks after transplanting has given significantly higher onion bulb weight, bulb yield, weed (dodder) control efficiency (WCE), weed (dodder) control efficiency (WCE), and lower
2dodder population per m , lower % infestation and weed index compared to other treatments except pendimethalin 30% EC at 1.0 kg ai/ha followed by sequential application of oxyfluorfen @ 0.25kg ai/ha at 5 and 7 weeks after transplanting of onion. Application of pendimethalin at 1.0 kg ai/ha followed by sequential application of oxyfluorfen at 0.25 kg ai/ha at 5,7, 8 and 5 & 7 weeks after transplanting were on par with weed free check with regard to WCE and onion bulb yield. Percent area covered by cuscuta at the time of onion harvest was higher in weedy check (52% of the plot) followed by pendimethalin 30EC @ 1 kg a.i./ha as pre-emergence (PE) + one hand weeding at 40 days after transplanting (14.2 %). The least area coverage by cuscuta infestation was in the plots where application of pendimethalin at 1.0 kg ai/ha followed by sequential application of oxyfluorfen at 0.25 kg ai/ha at 5,7, 8 and 5 & 7 weeks after transplanting was accomplished.
No. of Pages: 8 No. of Tables : 3 References: 11
Keywords: Dodder, Herbicides, Oxyfluorfen, Sequential, Transplanted onion, Weed Management.
International Journal on Agricultural Sciences Vol. V (Issue 2), pp. 245-252, 2014
Corresponding author: Email: [email protected]
Research Paper
Received on: 24.04.2014 Revised on: 15.05.2014 Accepted on: 26.06.2014

ISSN NO. 0976-450X
storage of dry onion has facilitated the world
wide trade and is always in demand even in the
smallest local markets. Among many causes of
low productivity, onion exhibits greater
susceptibility to weed competition as compared
to other crops due to its inherent characteristics
such as slow growth in the initial stages, short
stature, non-branching habit, sparse foliage and
shallow root system. This favours quick and fast
growth of weeds in the initial stages and
competition thus tends to be severe. Moreover,
use of liberal dose of FYM, fertilizers and
frequent irrigations creates favorable
conditions for weed growth (Rajendra Singh et
al., 1986). Cuscuta chinensis commonly known
as dodder is an obnoxious parasitic weed that
attaches itself to stems and leaves of varieties of
host plant species. After emergence, the
seedlings twine around the leaf or stem of
suitable host plant and through haustoria draw
nutrients from host plants causing drastic
reduction in growth and yield. In recent years,
farmers of northern dry zone of Karnataka who
are growing onion are reporting the incidence of
dodder and difficulty in managing the same.
Hence, to address the problem encountered by
the farmers, an experiment was conducted in
the farmer's field where the incidence was
severe, to evaluate the efficiency of
pendimethalin and oxadiargyl as a pre-
emergence herbicides followed by oxyfluorfen
as a post emergence to control the dodder in
transplanted onion at Muttagi village of
Bagewadi Taluka, Bijapur district during rabi
2012-13 and 2013-14.
MATERIALS AND METHODSAn experiment was conducted on farmer's field
of Muttagi village of Basavan Bagewadi taluka,
Bijapur district during rabi 2012-13 and 2013-
14. The experiment consisted of nine
treatments laid out in a randomized complete
block design (RCBD) with three replications.
The gross plot size was 10.0 m x 5.6 m. Onion
variety - Telgi red was used for experimentation
and 45 days old seedlings were transplanted in
the main experimental field at spacing of 15 cm
x 5 cm the usual practice adopted by the farmers
on raised beds with drip irrigation. Basal dose
of nitrogen, phosphorous and potassium were
applied at the rate of 62.5:50:120 kg/ha and top
dressing with urea @ 62.5 kg was done at 6
weeks after transplanting. Pre-emergence
herbicides viz., pendimethalin and oxadiargyl
were sprayed uniformly to each treatment plot
area one day after transplanting of onion. The
post emergence herbicide viz., oxyfluorfen was
applied uniformly after transplanting of onion
as per the treatments. Common cultural and
plant protection measures were taken
uniformly for all the treatments as and when
required. Observations were recorded in each
plot in respect of bulb yield, bulb weight, weed 2index, number of dodder plants / m and %
dodder infestat ion (area covered by 2
dodder/plot). The quadrate of 0.5 m was used to
count the weeds. The data were transformed
and expressed in per square meter. The weed
control efficiency (WCE) was estimated by the
formula given by Mani et al. (1973).
RESULTS AND DISCUSSIONWeed (dodder) densityAll the weed control treatments significantly
reduced the density of dodder during both the
years compared to weedy check. Significantly
lower weed density was recorded with weed
free check compared to all the treatments.
Among the herbicidal treatments, lower dodder
density was recorded with the application of of
pendimethalin 30% EC at 1.0 kg a.i./ha followed
by sequential application of oxyfluorfen @
0.25kg ai/ha at 5, 7 and 8 or 5 and 7 weeks after
transplanting (WAT) of onion. Sequential
application of oxyfluorfen disturbed the
mitosis, cytokinensis and production of
microtubules on shoot tips and effectively
controlled the dodder (Cuscuta) in onion. 2Significantly higher dodder density 16.7 per m
2 and 169.9 per m was recorded with weedy
IJAS 2014 • 246
International Journal on Agricultural Sciences Vol. V (Issue 2), pp. 245-252, 2014
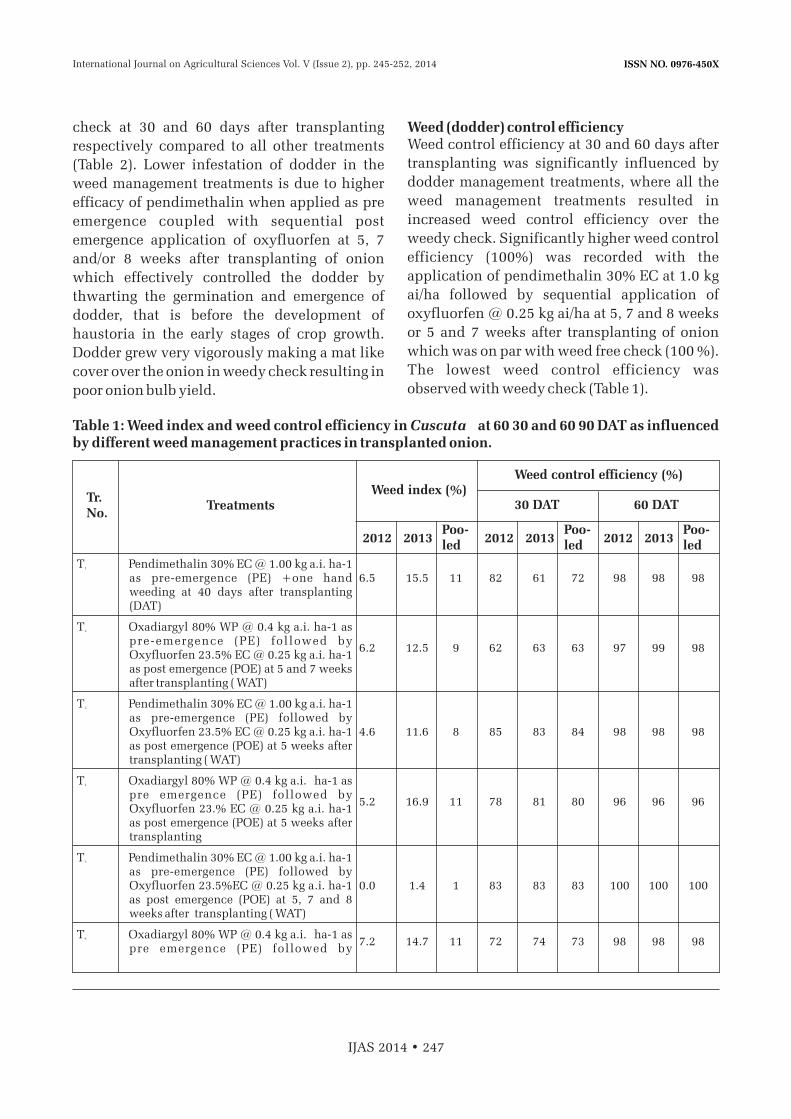
ISSN NO. 0976-450X
check at 30 and 60 days after transplanting
respectively compared to all other treatments
(Table 2). Lower infestation of dodder in the
weed management treatments is due to higher
efficacy of pendimethalin when applied as pre
emergence coupled with sequential post
emergence application of oxyfluorfen at 5, 7
and/or 8 weeks after transplanting of onion
which effectively controlled the dodder by
thwarting the germination and emergence of
dodder, that is before the development of
haustoria in the early stages of crop growth.
Dodder grew very vigorously making a mat like
cover over the onion in weedy check resulting in
poor onion bulb yield.
Weed (dodder) control efficiency Weed control efficiency at 30 and 60 days after
transplanting was significantly influenced by
dodder management treatments, where all the
weed management treatments resulted in
increased weed control efficiency over the
weedy check. Significantly higher weed control
efficiency (100%) was recorded with the
application of pendimethalin 30% EC at 1.0 kg
ai/ha followed by sequential application of
oxyfluorfen @ 0.25 kg ai/ha at 5, 7 and 8 weeks
or 5 and 7 weeks after transplanting of onion
which was on par with weed free check (100 %).
The lowest weed control efficiency was
observed with weedy check (Table 1).
IJAS 2014 • 247
Table 1: Weed index and weed control efficiency in Cuscuta at 60 30 and 60 90 DAT as influenced by different weed management practices in transplanted onion.
T Pendimethalin 30% EC @ 1.00 kg a.i. ha-1 1
as pre-emergence (PE) +one hand weeding at 40 days after transplanting (DAT)
T Oxadiargyl 80% WP @ 0.4 kg a.i. ha-1 as 2
pre-emergence (PE) fol lowed by Oxyfluorfen 23.5% EC @ 0.25 kg a.i. ha-1 as post emergence (POE) at 5 and 7 weeks after transplanting ( WAT)
T Pendimethalin 30% EC @ 1.00 kg a.i. ha-1 3
as pre-emergence (PE) followed by Oxyfluorfen 23.5% EC @ 0.25 kg a.i. ha-1 as post emergence (POE) at 5 weeks after transplanting ( WAT)
T Oxadiargyl 80% WP @ 0.4 kg a.i. ha-1 as 4
pre emergence (PE) followed by Oxyfluorfen 23.% EC @ 0.25 kg a.i. ha-1 as post emergence (POE) at 5 weeks after transplanting
T Pendimethalin 30% EC @ 1.00 kg a.i. ha-1 5
as pre-emergence (PE) followed by Oxyfluorfen 23.5%EC @ 0.25 kg a.i. ha-1 as post emergence (POE) at 5, 7 and 8 weeks after transplanting ( WAT)
T Oxadiargyl 80% WP @ 0.4 kg a.i. ha-1 as 6
pre emergence (PE) followed by
6.5 15.5 11 82 61 72 98 98 98
6.2 12.5 9 62 63 63 97 99 98
4.6 11.6 8 85 83 84 98 98 98
5.2 16.9 11 78 81 80 96 96 96
0.0 1.4 1 83 83 83 100 100 100
7.2 14.7 11 72 74 73 98 98 98
Weed control efficiency (%)
TreatmentsTr. No.
30 DAT
2012 2012 20122013 2013 2013Poo-led
Poo-led
Poo-led
60 DAT
International Journal on Agricultural Sciences Vol. V (Issue 2), pp. 245-252, 2014
Weed index (%)

ISSN NO. 0976-450X
Weed indexWeed index differed significantly due to
different weed management practices.
Significantly lower weed index was recorded in
weed free check compared to all other weed
management treatments (Table-1). Among the
herbicidal treatments, pendimethalin at 1.0 kg
ai/ha followed by sequential application of
oxyfluorfen at 0.25 kg ai/ha at 5,7 and 8 weeks
after transplanting of onion recorded
significantly lower weed index (1.0%) than
weedy check, and it was comparable with
pendimethalin at 1.0 kg ai/ha followed by
sequential application of oxyfluorfen at 0.25 kg
ai/ha at 5 & 7 weeks after transplanting. Weedy
check recorded significantly higher weed index
(29.0%) compared to all other treatments.
Onion bulb yield and weight The bulb yield of onion was significantly higher
(35.83 t/ha) in weed free check over other
treatments (Table 3). The weedy check recorded
significantly lower bulb yield (25.78 t/ha). The
reduction in bulb yield is due to the presence of
weeds throughout the crop growth period & it
was to the tune of 28.0%. Similarly, Khurana et
al. (1985) noticed 54 per cent yield reduction
and Singh et al. (1985) noticed 40.2 to 74.9 per
cent reduction in bulb yield due to uncontrolled
weed growth. Among the different herbicidal
weed management practices, significantly
higher onion bulb yield (35.74 t/ha) was
recorded in pendimethalin @ 1.0 kg a.i./ha (PE)
fb oxyfluorfen @0.25 kg a.i./ha (POE) at 5,7 and
8 WAT compared to other treatments and
weedy check, however, it was on par with
pendimethalin @ 1.0 kg a.i./ha (PE) fb
oxyfluorfen @0.25 kg a.i./ha (POE) at 5 and 7
WAT (33.77 t/ha). The increase in bulb yield in
pendimethalin @ 1.0 kg a.i. /ha (PE) fb
oxyfluorfen @ 0.25 kg a.i/ha (POE) at 5, 7 and 8
WAT over weedy check and other treatments
was to an extent of 3.6 to 28.0 per cent. However,
pendimethalin @ 1.0 kg a.i./ha (PE) fb
oxyfluorfen @ 0.25 kg a.i./ha (POE) at 5 and 7
WAT was on par and recorded significantly
higher bulb yield over other treatments. Similar
results were obtained by Kathiresan et al.
(2004). The higher bulb yield in weed free check
was attributed to weed free environment
provided by regular weeding throughout the
crop growth period and no competition by
weeds for growth resources. Among the
herbicidal treatments, significantly higher bulb
yield in pendimethalin @ 1.0 kg a.i./ ha (PE) fb oxyfluorfen @ 0.25 kg a.i/ha (POE) at 5 ,7 ,8 and
5 and 7 WAT was attributed to the higher
efficacy of the repeated application of post
emergence herbicide for effective control of
dodder during the critical period of the crop
growth resulting in the better availability of
IJAS 2014 • 248
Oxyfluorfen 23.5% EC @ 0.25 kg a.i. ha-1 as post emergence (POE) at 5, 7, 8 weeks after transplanting
T Pendimethalin 30% EC @ 1.00 kg a.i. ha-7
1 as pre-emergence (PE) followed by Oxyfluorfen 23.5% EC @ 0.25 kg a.i. ha-1 as post emergence (POE) at 5 and 7weeks after transplanting
T Weedy check8
T Weed free check9
S.Em.±
C.D. (0.05)
0.7 5.8 3 82 80 81 100 100 100
24.4 33.1 29 0 0 0 0 0 0
0.0 0.0 0 100 100 100 100 100 100
2.23 2.73 1.8 8.4 4.9 5.4 0.18 0.21 0.19
4.73 5.80 3.9 17.7 10.3 11.5 0.39 0.45 0.40
DAT – Days after transplanting PE – Pre-emergent POE – Post-emergent
International Journal on Agricultural Sciences Vol. V (Issue 2), pp. 245-252, 2014

ISSN NO. 0976-450X
moisture and nutrients for crop growth and bulb
development. These results are in agreement
with the findings of Channappagoudar et al.
(2001).
IJAS 2014 • 249
Table 2: Cuscuta weed population per m2 area and infestation per plot at different growth stages as influenced by different weed management practices in transplanted onion.
T Pendimethalin 30% EC @ 1.00 kg a.i. ha-1 1
as pre-emergence (PE) +one hand weeding at 40 days after transplanting (DAT)
T Oxadiargyl 80% WP @ 0.4 kg a.i. ha-1 as 2
pre-emergence (PE) fo l lowed by Oxyfluorfen 23.5% EC @ 0.25 kg a.i. ha-1 as post emergence (POE) at 5 and 7 weeks after transplanting ( WAT)
T Pendimethalin 30% EC @ 1.00 kg a.i. ha-1 3
as pre-emergence (PE) followed by Oxyfluorfen 23.5% EC @ 0.25 kg a.i. ha-1 as post emergence (POE) at 5 weeks after transplanting ( WAT)
T Oxadiargyl 80% WP @ 0.4 kg a.i. ha-1 as 4
pre emergence (PE) followed by Oxyfluorfen 23.% EC @ 0.25 kg a.i. ha-1 as post emergence (POE) at 5 weeks after transplanting
T Pendimethalin 30% EC @ 1.00 kg a.i. ha-1 5
as pre-emergence (PE) followed by Oxyfluorfen 23.5%EC @ 0.25 kg a.i. ha-1 as post emergence (POE) at 5, 7 and 8 weeks after transplanting ( WAT)
T Oxadiargyl 80% WP @ 0.4 kg a.i. ha-1 as 6
pre emergence (PE) followed by Oxyfluorfen 23.5% EC @ 0.25 kg a.i. ha-1 as post emergence (POE) at 5, 7, 8 weeks after transplanting
T Pendimethalin 30% EC @ 1.00 kg a.i. ha-1 7
as pre-emergence (PE) followed by Oxyfluorfen 23.5% EC @ 0.25 kg a.i. ha-1 as post emergence (POE) at 5 and 7weeks after transplanting
T Weedy check8
T Weed free check9
S. Em±
CD (0.05)
1.81 2.54 2.18 2.00 2.01 2.01 14.2(3.4) (6.01) (4.70) (3.6) (3.6) (3.6)
2.47 2.45 2.46 2.26 1.68 1.97 7.5(5.6) (5.49) (5.6) (4.6) (2.3) (3.5)
1.65 1.70 1.68 2.00 2.08 2.04 4.5(2.2) (2.43) (2.30) (3.5) (3.8) (3.7)
1.81 1.791.80 2.55 2.56 2.56 3(2.9) (2.73) (2.8) (6.10) (6.1) (6.10)
1.72 1.79 1.79 0.90 1.17 1.04 1.0(2.7) (2.69) (2.7) (0.3) (0.9) (0.6)
2.13 2.17 2.15 1.94 1.92 1.95 7.5(4.1) (4.21) (4.2) (3.30) (3.30) (3.30)
1.82 1.87 1.85 1.10 1.21 1.16 1.0(2.8) (3.01) (2.9) (0.7) (1.0) (0.8)
4.51 4.11 4.11 14.01 13.51 13.05 52.5(17.7) (16.73) (16.7) (172.9) (168.2) (169.9)
0.71 0.71 0.71 0.71 0.71 0.71 0.0(0.0) (0.0) (0.0) (0.0) (0.0) (0.0)
0.33 0.20 0.24 0.29 0.30 0.29 —
0.70 0.43 0.50 0.61 0.63 0.61 —-
Cuscuta wed population/m2 Cuscuta Infest ation/plot (%)
(Mean of two years)
TreatmentsTr. No.
30 DAT
2012 20122013 2013Poo-led
Poo-led
60 DAT
* Figures in parenthesis indicate original values, DAT - Days after transplanting PE – Pre-emergent POE - Post-emergent.
International Journal on Agricultural Sciences Vol. V (Issue 2), pp. 245-252, 2014

ISSN NO. 0976-450X
Table 3: Bulb yield, bulb weight and economics as influenced by different weed management practices in transplanted onion.
T Pendimethalin 30% EC @ 1.00 1
kg a.i. ha-1 as pre-emergence (PE) +one hand weeding at 40 days after transplanting (DAT)
T Oxadiargyl 80% WP @ 0.4 kg 2
a.i. ha-1 as pre-emergence (PE) followed by Oxyfluorfen 23.5% EC @ 0.25 kg a.i. ha-1 as post emergence (POE) at 5 and 7 weeks after transplanting (WAT)
T Pendimethalin 30% EC @ 1.00 3
kg a.i. ha-1 as pre-emergence (PE) followed by Oxyfluorfen 23.5% EC @ 0.25 kg a.i. ha-1 as post emergence (POE) at 5 weeks after transplanting ( WAT)
T Oxadiargyl 80% WP @ 0.4 kg 4
a.i. ha-1 as pre emergence (PE) followed by Oxyfluorfen 23.% EC @ 0.25 kg a.i. ha-1 as post emergence (POE) at 5 weeks after transplanting
T Pendimethalin 30% EC @ 1.00 5
kg a.i. ha-1 as pre-emergence (PE) followed by Oxyfluorfen 23.5%EC @ 0.25 kg a.i. ha-1 as post emergence (POE) at 5, 7 a n d 8 w e e k s a f t e r transplanting ( WAT)
T Oxadiargyl 80% WP @ 0.4 kg 6
a.i. ha-1 as pre emergence (PE) followed by Oxyfluorfen 23.5% EC @ 0.25 kg a.i. ha-1 as post emergence (POE) at 5, 7, 8 weeks after transplanting
T Pendimethalin 30% EC @ 1.00 7
kg a.i. ha-1 as pre-emergence (PE) followed by Oxyfluorfen 23.5% EC @ 0.25 kg a.i. ha-1 as post emergence (POE) at 5 and 7weeks after transplanting
T Weedy check8
T Weed free check9
S. Em±
33.58 30.42 32.00 51 54 52 61000 205635 145515 3.37
33.70 31.47 32.58 50 53 52 62900 210121 144037 3.34
34.27 31.76 33.02 51 56 54 61300 212723 147566 3.46
34.05 29.90 31.98 50 55 52 61900 204733 148166 3.30
35.96 35.32 35.64 56 64 60 63300 231162 167175 3.65
33.32 30.71 32.01 51 52 51 63900 206116 139843 3.22
35.65 33.77 34.71 55 62 58 62300 224189 156267 3.59
27.16 24.41 25.78 37 46 42 57350 165532 110500 2.88
35.91 35.75 35.83 54 61 58 75300 232790 156808 3.09
0.80 0.95 0.60 1.9 2.1 1.5 —- 4193 4012 0.07
-1Bulb yield (t ha ) Bulb yield (g) Mean of two years
TreatmentsTr. No. 2012 20122013 2013
Poo-led
Poo-led
Cost of culti-vation (Rs/ha)
Gross returns(Rs/ha)
Net returns(Rs/ha)
Benefit costratio
DAT – Days after transplanting PE – Pre-emergent POE – Post-emergent
IJAS 2014 • 250
International Journal on Agricultural Sciences Vol. V (Issue 2), pp. 245-252, 2014

ISSN NO. 0976-450X
The individual bulb weight of onion was
significantly higher in pendimethalin @ 1 kg
a.i/ha (PE) fb oxyflurofen @ 0.25 kg a.i/ha (POE)
at 5,7 and 8 WAT (60 g) over pendimethalin @ 1
kg a.i/ha (PE) fb oxyflurofen @ 0.25 kg a.i/ha
(POE) at 5WAT (54 g), pendimethalin @ 1 kg
a.i/ha (PE) + one hand weeding at 40 DAT (50 g),
Oxadiargyl @ 0.4 kg a.i./ha (PE) fb oxyflurofen
@ 0.25 kg a.i/ha (POE) at 5 and 7 WAT (52 g), 5 7
and 8 WAT ( 51g) and weedy check (42 g),
however it was on par with other treatments
(Table 3).
EconomicsNet returns were significantly higher in
pendimethalin @ 1.0 kg a.i./ha (PE) fb
oxyfluorfen @ 0.25 kg a.i./ha (POE) at 5,7 and 8
WAT (Rs.1,67,175/ha) or 5 and 7 DAT
(1,56,267/ha) and weed free check
(Rs.1,56,808/ha) compared to other treatments.
While, weedy check recorded significantly
lower net returns (Rs.1,10,500/ha) than other
treatments (Table 3). This is attributed to better
control of weeds in these treatments resulting in
increased bulb yield and thereby increased the
net returns.
The benefit cost (BC) ratio was significantly
higher with pendimethalin @ 1.0 kg a.i./ha (PE)
fb oxyfluorfen @ 0.25 kg a.i./ha (POE) at 5 and 7
WAT (4.82) than all other treatments except
pendimethalin @ 1.0 kg a.i./h (PE) fb
oxyfluorfen @ 0.25 kg a.i./ha (POE) at 5 ,7 and 8
WAT (3.65). This was attributed to lower cost of
cultivation and reasonably higher bulb yield of
onion in these treatments compared to other
treatments. Though weed free check recorded
significantly higher bulb yield and gross
returns, but the B: C ratio was lower (3.09). This
was mainly attributed to increased cost of
cultivation due to more number of hand
weedings during crop growth period over other
treatments. Whereas, weedy check recorded
significantly lower B: C ratio over rest of the
treatments and this was mainly attributed to
significantly lower bulb yield. Similar, findings
were also reported by Ved Prakash et al. (2000)
and Ankur Vermani et al. (2001).
REFERENCES1. Ankur Vermani, Nandal, T. R. and
Ravindar Singh, 2001, Nutrient uptake and
economic weed management in garlic
(Allium sativum L.). Indian Journal Weed
Science, 33 (3-4) : 225-226.
2. Bhalla, P.L., 1978, Weed competition, crop
losses and chemical weed control in onion-
A Review. Pestology, 11 (2): 35-39.
3. Bhan, V.M., Singh, S.D. and Tripathi, S.S.,
1976, Influence of weed on onion yield and
their methods of control using herbicides.
Indian Journal Weed Science, 8:140-144.
4. Channappagoudar, B. B., Agasimani, C. A.
And Biradar, N. R., 2001, Physiological
studies on weed control efficiency of
different herbicides in direct onion. First
Biennial Conf. in the New Millennium on
Eco-friendly Weed Management Options for
Sustainable Agriculture, ISWS, May 23-24,
2001, Bangalore, Karnataka (India), p. 70.
5. Gill, G. S. and Vijaykumar, 1969, Weed
index: A new method for reporting weed
control trials. Indian Journal of Agronomy,
14 : 96-98.
6. Kathiresan, R. M., Gnanavel, I . ,
Jayakanth, U. V., Arulchezlian, M. P.,
Anbhazhagon, R. and Pandmapriya, S. P.,
2004, Bioefficiency and phytotoxicity of
oxadiargyl in onion (Allium cepa var.
aggregatum). Indian Journal Weed Science,
36(3&4) : 236-238.
7. Khurana, S. C., Yadav, A. C. and Pandita,
M. I., 1985, Weed control in onion. Annual
Conference of Indian Society of Weed
Science, p. 19.
8. Patil, S. N., 1999, Physiological studies on
weed control efficiency in onion. M. Sc.
IJAS 2014 • 251
International Journal on Agricultural Sciences Vol. V (Issue 2), pp. 245-252, 2014

ISSN NO. 0976-450X
(Agri.). Thesis, University Agricultural
Sciences, Dharwad, Karnataka (India).
9. Singh, G. P., Thakral, K. K. and Pandita, M.
L., 1985, Efficacy of various herbicides and
hand weeding for weed control and fruit
yield of chillies (Capsicum annuum L.).
Abstract of Papers, Annual Conference of
Indian Society of Weed Science, HAU,
Hissar.
10. Singh, S.J., Sinha, K.K., Mishra, S.S.,
Thakur, S.S. and Choudary, N.K., 1992,
studies on weed management in onion.
Indian Journal Weed Science, 24: 6-10.
11. Ved Prakash, A. K., Pandey, R. D., Singh,
and Mani, V. P., 2000, Integrated weed
management in winter onion (Allium cepa
L.) under mid hill condition of North-
Western Himalayas. Indian Journal of
Agronomy, 45 (4) : 816-825.
IJAS 2014 • 252
International Journal on Agricultural Sciences Vol. V (Issue 2), pp. 245-252, 2014

ISSN NO. 0976-450X
STATISTICAL METHODS IN THE POPULATION DYNAMIC STUDY OF INSECT
M.K. Nagamani and *Jayalaxmi Narayan Hegde
University of Agricultural Sciences, GKVK, Bangalore, Karnataka *Krishi Vigyan Kendra, Brahmavar, Udupi, Karnataka
INTRODUCTIONThe universal indiscriminate use of insecticides
and the complications which have followed have
directed attention to the need of radical change
towards ecology in tackling pest control problems
to the study of environmental conditions under
which pests could either be abundant or scarce so
as to evaluate the factor or factors responsible for
such variations in population.
Insect ecology is primarily concerned with (1)
variation in the number of insects of the same
sort and (2) variation of insects of different sort
in the same community.
There are two major type of studies in insect
ecology where statistical methods are applied (a)
Extensive: These studies are carried out over a
large area and are normally concerned with the
relation of different insect species with relation of
insect pest population to crop damage or with
prediction of damage and the application of
control methods (b) Intensive: These studies
involve continual observation of the population
of an insect in the same area. Usually information
is required on the basis of the population, (of
successive developmental stages) so that their life
history can be studied with a view to find out the
weakest part of the insect's life.
Measurement of insect populationThe population of insects can be measured in
the following terms.
Absolute estimateHere the actual number of insects in a particular
ABSTRACT
The population dynamics of an insect can ultimately help in designing 'Integrated Pest
Management Programmes. There are two major type of studies viz.,Extensive and Intensive
in insect ecology where statistical methods are applied.
Usually information is required on the basis of the population (of successive developmental
stages) so that their life history can be studied with a view to find out the weakest part of
the insect's life. Brief mention about the diverse methods of statistics applicable in both
situations are outlined in the present paper.
No. of Pages: 7 References: 7
Keywords: Population indices, Spatial distribution, Aggregation of insects, Poisson, Negative binomial, Dispersion, Sequential sampling, Life Table, Key factor analysis, Mortality survivor ratio.
International Journal on Agricultural Sciences Vol. V (Issue 2), pp. 253-259, 2014
Corresponding author: Email: [email protected]
Review Paper
Received on: 27.04.2014 Revised on: 25.05.2014 Accepted on: 28.06.2014
ISSN NO. 0976-450X
environment is counted. Usually sample survey
methods are applied to get absolute estimates.
Relative estimateWhen absolute counting is not possible due to
some reason or other relative estimates are used.
These give values which indicate the largeness
of the population. (for instance the number of
insects falling in a light trap in 8 hours or the
visual scoring based on some criteria by an
experienced entomologies). Relative estimates
are only useful for space /time comparison.
Population indicesHere instead of counting the insects, their
products e.g., webs, nests, excuvia or effects
(especially plant damage) are recorded.
Whatever may be the measure that we use,
necessarily sample survey methods have to be
used. The estimates from sample surveys are
subject to error. Within the allowed budget of
the study, the most efficient sampling method
will normally be worked out.
Spatial distribution of insectsInsects normally do not settle in a field at random.
If they settle at random, due to the very small ratio
of the insects to the size of the field, it has been
established that the distribution can be
adequately explained by a Poisson distribution.
The frequency distribution of Poisson is given by
-kx
f(x) = e kxl
It can further be established that both the mean
and variance of a Poisson distribution are k. So if
in any insect population data, the mean is
nearly equal to the variance, we have to suspect
the random nature of settling of the insects.
But this is rarely the case. Due to elementary
facts like sexual pairing and complicated social
relationship, the inspects tend to aggregate in
certain spots. There are a series of distributions
available to describe this situation. Some of
them are (1) Negative binomial distribution (2)
Log normal distribution (3) Log distribution (4)
Neyman type A distribution, (5) PolyaAleppi
distribution etc.
If the variance is more than the mean (which is
the normal pattern of in sects) the negative
binomial distribution may fit the data. The
distribution is described by the parameters, the
mean and exponent k, which is the measure of
the amount of clumping and is often referred to 2 2 –as dispersion parameter. K is given by x /(S -x )
2 where x is the mean and s is the variance.
Generally k values are in the region of 2. As they
become larger the distribution approaches
Poisson distribution. Fractional values of k lead
to the logarithmic distribution. There are
various methods of fitting the negative binomial
distribution to the data. Reference may be made
to Anscombe (1949). The fitness of the negative
binomial to the observed frequency data can
also be tested by different methods depending
on the method used in fitting the data. If
negative binomial distribution fits the data,
then the parameter 'k' can be taken as a measure
of aggregation.
If the Poisson distribution fits the data the
proper sampling technique would be a simple
random sampling. On the other hand if negative
binomial fits the data the proper sampling
technique would be stratified random sampling
i.e., the field should be divided into uniform
plots first and then a few plants from each of
these portions should be selected for the
observation of insect population.
Measures of aggregation of insects The tendency of insect populations in nature is
to aggregate but in studying the population of
insects, especially in different environments
and of different stages if becomes necessary to
IJAS 2014 • 254
International Journal on Agricultural Sciences Vol. V (Issue 2), pp. 253-259, 2014
ISSN NO. 0976-450X
arrive at a measure of this dispersion in the
field. Various measures have been proposed.
Some of them are given below:
2x - Departure from PoissonAs has been mentioned before it there is no
aggregation the Poisson distribution may for the
insect population data So w h i c h
measures the departure of the population from
the Poisson model can be taken as one of the
measures of dispersion. Higher the value of this,
more the aggregation among the insects.
'k' of the negative binomialThe parameter 'k' of negative binomial can also
be taken as a measure of aggregation of the
insects. Less the value of k, more is the
aggregation of insects. This aggregation can be
due to either the inherent nature of the insects or
due to environmental causes.
as suggested by Arbous and Karrich 2(1961) where v is a function with X distribution
with 2k degrees of freedom at 0.5 per cent
probability level has been used to find out the
nature of aggregation of insects. If this value is
less than two the aggregation is ascribed to
environmental causes. If it is more than two
aggregation may be due to either factors.
Morista’s indices of dispersionTwo indices which are relatively independent of
the type of distribution, the number of samples
and size of the mean have been suggested by
Morista (1962). The first index is given by the
formula.
Where N is the total number of samples and x the
sum of the numbers of individuals found in all
the samples.
When the distribution is at random i.e the
aggregation is not present this index will take the
value of one and when it is contagious it will
have value more than one and when the
distribution is uniform it will give fractional
values.
The second index of Morista is use full for
comparing the aggregation of the same insect in
different subareas or places (eg. Mites in
different parts of the tree). It is given by
Where G is the number of
subareas of places or environments. It can be
interpreted using the same method as for I1.
x Iwao’s and Kuno’s m-m method of studying
aggregation of insectsThe aggregation of insects has obviously two
components. The first is whether the basic
component of the distribution is single
individual or a group of individuals (say a
colony or clump), and the second is how such
basic components distribute themselves in the
habitat units. This aspect cannot be studied
using any of the measures suggested above. A
group of Japanese workers have been
concentrating their efforts in finding out
methods to distinguish between these two
aspects.
The mean crowding is defined as the number of
other individuals per individual per quadrat
(sub division) and is expressed by
Where xi is the number of insects in the ith
quadrat and m is defined as the mean density
given by the mean number of insects per
quadrat. The technique of Iwao consists in x
fitting linear regression equation between m
derived from sets of data collected for the xpurpose. If m =a+bm, it has then been
established that (1) ‘a’ measures the largeness of
the basic component and a >o when the
individuals are distributed in colonies. (2) b
measures the variation of such units in the
quadrats. If b=l the distribution is Poisson (ie.
IJAS 2014 • 255
International Journal on Agricultural Sciences Vol. V (Issue 2), pp. 253-259, 2014

ISSN NO. 0976-450X
No aggregation) and for b>1 more and more
aggregation is present. If b<1 the distributions
are “under – dispersed”.
Due to these considerations ‘a’ is termed as the
index of basic contagion and ‘b’ as the density-
contagiousness coefficient.
Sequential Sampling The modern economic entomologist tries to
economise on the number of sprays of the potent
insecticides. One of the obvious methods of
doing this is to undertake spray only when we
must. From crop loss studies, the insect
population which will cause a significant loss to
the cultivator (economic threshold) is
determined. It will then become entomologist to
see whether this pest population has attained
threshold limit using sampling methods. Using a
new sample every time and determining the
population size becomes cumbersome. So a
sequential sampling technique has been
developed for this purpose. This technique was
originally developed in quality control by
Abraham Wald. It is a procedure whereby
samples are drawn in a sequence with decisions
being made on the information obtained from
each observation. If no decision can be made on
the basis of information from a given sample, the
data are added to those obtained for the next and
the process repeated till a decision is made. With
insect sampling, the efficiency of the method
lies in the absence of a fixed sample size; least
work is required when either populations are
low or high and extensive sampling is needed
only at intermediate densities. The first step in
the development of a sequential plan is to
establish the distribution of the concerned
insect to nature. Based on this distribution and
the economic threshold the two limiting lines
are drawn. Then, from a sample of plants the
insect population is counted. If this value falls
above both lines, spray is undertaken and if it
falls below both lines then no control measure is
undertaken. If it falls in between the lines an
additional sample is taken and the process
repeated. Obviously this process will end when
a decision is reached. The formulae for drawing
these lines in case of negative binomial
distribution is given in South Wood (1968) and
in case of Poisson and normal distribution in
Nishida and Torii (1970).
The economic threshold In the modern pest management programmes
the economic threshold plays a very important
rate. It has been defined as the level at which
damage can no longer be tolerated and therefore
the level at or before which it is desirable to
initiate deliberate control activities. It could also
be defined more critically as the level of pest
population where the loss caused by pest equals
in value to the cost of available control
measures. Economic injury level equals in value
the cost of control measures.
Headlly (1973) “Defining the economic
threshold” Systems approach in pest control,
gives detailed methodology for calculating the
economic threshold. His approach takes into
consideration the growth of pest population and
the other economic aspects involved in the
control measures. A more simpler method
which does not take into consideration the
growth pattern of insects and which is
applicable to the pests which cause un direct
damage to the crop is grven by Stone and Pedigo
(1972). The following methods is suggested.
1. Calculate: Gain threshold (q/Ha)
2. % yield loss necessary
3. Workout the linear regression between
percent defoliation or any other indirect
damage & yield loss due to defoliation. From
this equation find out the % defoliation
necessary to cause % yield lose /necessary
(Step 2 )
4. Absolute defoliation necessary = (percent
defoliation necessary)x (total foliate)
IJAS 2014 • 256
International Journal on Agricultural Sciences Vol. V (Issue 2), pp. 253-259, 2014

ISSN NO. 0976-450X
5. Calculate: Plant Economic injury level =
6. Economic injury level = (plant EIL) x (No. of
plants /row. Mtr).
The Life Table construction Economical Life Tables are one of the tools
which are most useful in the study of insect
population dynamics. Such tables record a
series of sequential measurements that reveal
population change throughout the life cycle of a
species in its natural environment. Life Table is
a general term given to a series of population
estimates of insects that show the fall off in
numbers occurring between various life stages
such as egg larvae, instar etc. when the mortality
at each stage is traced back to the several
mortality factors operating on the population,
these tables form a budget of successive
processes that are operative in a given
population.
The first and most important point in the
construction of Life Table is to get a reliable
absolute estimate of the different stages of the
population in a unit area. This involves the
application of sampling method. Harcourt
(1969) lists the following criteria, which a
sampling method should satisfy.
a. All units must have an equal chance of
selection.
b. The sample unit must be stable that is the
number of insects available in the sampling
unit should not be affected by growth habit
of plants.
c. The proportion of insect population using
the sample unit as a habitat must remain
constant.
d. The sample unit should be reasonably small
so that enough units can be examined on a
given plot and data to provide adequate
estimate of sampling variance.
e. The sample unit should lend itself to
estimates of absolute population.
f. The sample unit should lend itself to
estimates of absolute population.
g. The method of sampling and observation
should not be cumbersome.
h. The sampling time should be determined by
a pilot sampling study.
i. Depending on the spectral pattern of the
insects a proper sampling plan should be
drawn up.
The columns of the age specific Life Table
undergoes many changes with the need of many
research workers. The most accepted of these is
the one given by, Morris et al (1954). This table
has the following headings.
x- Age group or stage of development of the
insect.
Ix – The number alive at the beginning of stage x
dx- Factor causing mortality at stage x with the
proportion of mortality due to a particular factor.
100qx- Mortality rate during stage x-
This can be got as 100
Sx- Survival rate within period x.
It is to be noted that one or two Life Tables would
reveal only that high mortality may occur at
certain age intervals. But a sequence of Life
Tables suitably replicated in time and space
would increase the understanding of the of the
dynamics of the pest and at the same time reveal
the most opportune time for management so as
to influence survival rates.
Key factor analysisThe ultimate aim of the life table analysis is to
find the stage which contributed most to the
mortality of the insect. There are several
approaches to do this. Some of them are given
below.
IJAS 2014 • 257

ISSN NO. 0976-450X
Williams method ‘I’ the index of population trend is defined as
population one year divided by population in
the preceding year and multiplied by 100.
Through ‘I’ can refer to any stage of the insects
life which directly contributes to the increase of
insect population, normally adult stage is
generality considered. This can be denoted by
lA.lA = SE x SL x Sp x SA (simplified model)
where SE, SL, Sp and SA are survival rates of
eggs, larvae, pupae and adults. Williams method
consists in working out correlations between lA
and the different S’s. That particular stage which
gives the maximum coefficient of determination
(square of coefficient of correlation) will be
identified as the stage with maximum effect on
the population trend i.e. the key factor.
Morris methodSince the number of insects are expected to
follow a negative binomial distribution, and the
assumption of normal distribution is generally
made, Morris advocates transformation into log
before the analysis of data. Then the following
steps are adopted.
a. Work out correlation of log population of
one generation with the next and suppose 2we get R as low. This means that only the
log population size is not influencing the
population of next generation.
b. Search for density dependent factors like
weather, population of predators,
luxuriant growth of crop etc.
thc. One by one multiply the population at 9
state by these and work out relation
between log (population) n x D and log 2
(population) n+1 till we get an R which is
satisfactory.
d. That factor which contributes most to the
population of next generation is identified
as the key factor.
Varley and Gradewell’s methodBoth methods detailed above assume the liner
relation. Avoiding this, a simple graphical
method is given by Varley and Gradewell (1960)
Here the mortality at different stages as well as
the total mortality of the insect over generations
is drawn in a graph. Changes like parasite
population. Weather conditions etc. can also be
drawn in a similar graph. The graph which
resembles the total mortality most is taken as the
key factor.
Beso’s method of mortality survivor ratioM/S ratio for each stage of the insect is calculated
as % mortality and % survival in a particular
stage. By multiplying the M/S ratio for each stage
of the insect with total number of adults that
ultimately survived in a generation, the
numerical reduction in adult population from
the values so obtained the mortality factor
which contributed most to the total mortality is
determined.
Survivorship curves The graphical representation of the fall-off of
number of insects (1X) with time plotted against
age is called the survivorship curve.
There are four basic types of survivorship curves
according to Slobodkin (1962).
According Slobodkin in Type I mortality acts
most heavily on the old individuals, in type ii, a
constant number die at unit time, in type III, the
mortality rate is constant and in type IV mortality
acts most heavily on the younger stages.
SummaryThe population dynamics of an insect help in
designing ‘Integrated Pest Management
Programmes. The information is required on the
basis of the population of insect. Still further
research and detail study is needed on the
population dynamics of an insect.
IJAS 2014 • 258
ISSN NO. 0976-450X
REFERENCES
1. Anscombe, F.J., 1949. The statistical
analysis of insect counts based on the
negative binomial distribution. Biometrics.
5: 166-73.
2. Morista, M., 1962. I Index:- a measure of
dispersion of individuals. Res. Popul. Ecol.,
4:1-7.
3. Morris, R.F. and Miller, C.A., 1954. The
development of life tables for spruce
budworm. Can. J. Zool., 32: 283-301.
4. Nishida, T. and Tori, T., 1970. Hand book
field methods for Research on rice stem
borer and their natural enemies. Blackwell
Scientific Publications.
5. Oakland G.B., 1950, An application of
sequential analysis to whitefish sampling.
Biornetrics. 6: 59-67.
6. Varley G.C. and Gradwell, G.R., 1960. Key
factors in population studies. J. Animal
Ecol., 29: 399-401.
7. Wald, A, 1947. Sequential analysis. John
Wiley and Sons, New York.
IJAS 2014 • 259

ISSN NO. 0976-450X
IJAS 2014 • 260

ISSN NO. 0976-450X
INTEGRATED WEED MANAGEMENT IN RAINFED PEARL MILLET
1 2A.K. Guggari and M.B. Patil
1AICRP on Pearl Millet, Regional Agricultural Research Station, Bijapur-586101, Karnataka
2Agricultural Research Station, Almel, Bijapur District, Karnataka
INTRODUCTIONPearl millet is one of the important and
predominant coarse cereals grown in arid and
semi-arid regions of the country. Its cultivation
is mostly confined to poor and impoverished
soils and cultivated by resource poor farmers.
ABSTRACT
A field experiment was conducted for two rainy seasons (2012 and 2013) at Regional Agricultural Research Station, Bijapur, Karnataka. There were eight treatments consisting of post emergence application of atrazine at different doses (0.1 to 0.4 kg a.i./ha) in addition to recommended practice of application of atrazine as pre-emergence @ 0.5 kg a.i./ha and were compared with weed free check, weedy check and farmers practice of two hand weedings/intercultivations at 20 and 40 DAS. Mean data of two years (2012 and 2013) indicated that, grain yield of pearl millet differed significantly due to various weed management practices during both the years. Significantly higher grain yield was obtained with weed free check (2542 kg/ha) compared to application of atrazine @ 0.1 to 0.3 kg a.i./ha as pre-emergence and weedy check, however, it was on par with application of atrazine @ 0.5 kg a.i./ha as pre-emergence followed by one hand weeding at 35 DAS (2389 kg/ha), hand weeding / hoeing twice at 20 and 40 DAS (2386 kg/ha) and atrazine @ 0.4 kg ai/ha as post-emergence followed by one hand weeding at 35 DAS (2303 kg/ha). Weedy check recorded significantlylower grain yield (1289 kg/ha) among the treatments. Application of atrazine @ 0.5 kg a.i/ha as pre emergence + one hand weeding at 35 DAS recorded lower weed index (5.56%) followed by hand weeding/hoeing at 20 and 40 DAS (5.98%) and application of atrazine @ 0.4 kg a.i./ha as post emergence + one hand weeding at 35 DAS (8.58%). Weed index was significantly higher with weedy check (47.76%) compared to other treatments. Weed control efficiency due to different weed management treatments observed at 60 DAS was higher in weed free check (100%) followed by hand weeding / hoeing twice at 20 and 40 DAS (87.8%) and atrazine @ 0.4 kg a.i./ha as post emergence + one hand weeding at 35 DAS (78.9%). Significantly higher net returns (Rs.18077/ha) and benefit cost ratio was recorded with the application of atrazine @ 0.5 kg a.i/ha as pre emergence + one hand weeding at 35 DAS compared to other treatments. However, it was on par with weed free check (Rs.16793/ha), atrazine @ 0.4 kg ai/ha as post emergence followed by one hand weeding at 35 DAS (Rs 17177/ha) and hand weeding/hoeing at 20 and 40 DAS (Rs.16137/ha).
No. of Pages: 7 No. of Tables : 6 References: 5
Keywords: Atrazine, Pearl millet, Post emergence, Weed management.
International Journal on Agricultural Sciences Vol. V (Issue 2), pp. 261-267, 2014
Corresponding author: Email: [email protected]
Research Paper
Received on: 26.04.2014 Revised on: 20.05.2014 Accepted on: 29.06.2014

ISSN NO. 0976-450X
In northern dry zone of Karnataka, which is
frequently hit by the drought, pearl millet is an
important food crop of kharif season, grown in
shallow to medium black soils. It is the most
assured crop amongst the other kharif crops
even under low rainfall situations. Decline in
the availability of laborers coupled with
increase in the wages, resulted in untimely field
operations (weeding/intercultivations), which
consequently reflects on the yield. Many times
farmers fail to apply pre-emergent herbicides
and seek the remedy after the weeds emerge.
Hence, to address such problems encountered
by the farmers an experiment was planned with
post emergence application of atrazine at
different doses (0.1 to 0.4 kg a.i./ha) in addition
to recommended practice of application of
atrazine as pre-emergence @ 0.5 kg a.i./ha and
were compared with weed free check, weedy
check and farmers practice of two hand
weeding / intercultivations at 20 and 40 DAS.
MATERIALS AND METHODSA field experiment was conducted for two rainy
seasons (2012 and 2013) at Regional Agricultural
Research Station, Bijapur, Karnataka. There were
eight treatments consisting of post emergence
application of atrazine at different doses (0.1 to
0.4 kg a.i./ha) in addition to recommended
practice of application of atrazine as pre-
emergence @ 0.5 kg a.i./ha followed by one hand
weeding/intercultivation at 35 DAS, weed free
check, weedy check and farmers practice of two
hand weeding / intercultivations at 20 and 40
DAS. The post emergence application of atrazine
was done at 2-3 leaf stage of weeds. The
experiment was laid out in randomized block
design with three replications. The gross and net
plot sizes were 5.0 m x 3.6 m and 4.0 m x 2.70 m,
respectively. The soil of the experimental site
was medium black with low in available nitrogen -1 -1
(160 kg ha ) and P O (16 kg ha ), medium in 2 5
-1available K O (308 kg ha ) with 0.24 per cent 2
organic carbon and having alkaline pH (8.1). The pearl millet crop was raised by following
recommended cultivation practices of the
region. Pearl millet was fertilized with 50 kg N
and 25 kg P O /ha at the time of sowing. Total 2 5
rainfall of 525.5 and 771.6 mm was received in
28 and 41 rainy days from January to December
during 2012 and 2013, respectively as against
the normal rainfall of 594.3 mm (average of 100
years) received in 38 rainy days (Table 1). While
the rainfall received during the cropping period
from July to September was 219.8 and 473.4 mm
received in 13 and 23 rainy days during 2012
and 2013, respectively as against the normal
rainfall of 301.9 mm received in 18 rainy days.
The rainfall received was low (-82.1%) during
2012, while it was higher (171.5%) during 2013
compared to normal rainfall.
RESULTS AND DISCUSSION Grain yield of pearl millet differed significantly
due to various weed management practices
during both the years. Mean data of two years
(2012 and 2013) indicated that, grain yield of
pearl millet was significantly higher with weed
free check (2542 kg/ha) compared to application
of atrazine @ 0.1 to 0.3 kg a.i./ha as pre-
emergence and weedy check, however, it was on
par with application of atrazine @ 0.5 kg a.i./ha
as pre-emergence followed by one hand
weeding at 35 DAS (2389 kg/ha), hand weeding
or hoeing at 20 and 40 DAS (2386 kg/ha) and
atrazine @ 0.4 kg ai/ha as post-emergence
followed by one hand weeding at 35 DAS (2303
kg/ha). Similarly, significantly higher pearl
millet seed yield and stover yield were obtained
with two hand weedings and from weed free
treatments (Kiroriwal et al., 2012). The
favourable influence of weed control on
account of reduced weed-crop competition led
to increased growth and yield parameters viz.,
number of effective tillers, ear length, ear girth
and test weight (Table 2). Further contribution
of weed control measures towards the
important yield attributes could be owing to
their effect in increasing the weed control
efficiency and hence, better utilization of inputs
IJAS 2014 • 262
International Journal on Agricultural Sciences Vol. V (Issue 2), pp. 261-267, 2014

ISSN NO. 0976-450X
by crop plants. Ram et al, (2005) also reported
improvement in yield components due to
elimination of severe crop – weed competition.
Weedy check recorded significantly lower grain
yield (1289 kg/ha) among the treatments. The
stover yield differed significantly due to various
treatments only during 2013 but not during
2012, however, the mean data of two years
IJAS 2014 • 263
Table 1: Mean monthly rainfall of RARS, Bijapur during the cropping period of 2012 and 2013 and average of 100 years (1901-2000).
Month 2012 2013 Normal* 2012 2013 Normal*
July 72.4 206.6 72.2 4 7 5
August 60.0 72.0 78.1 4 4 5
September 87.4 194.8 151.6 5 12 8
Total 219.8 473.4 301.9 13 23 18
(-82.1) (+171.5)
Rainfall (mm) Rainy days
* Average of 100 years (1901-2000)
Table 2: Growth and yield parameter of pearl millet as influenced by various weed management treatments (Pooled mean of 2012 and 2013).
Treatments Grain Plant Ear Ear Total Effectivewt/ear (g) ht (cm) length girth (cm) tillers/ tillers
(cm) plant /plant
1. Control (Weedy check) 15.98 140.0 20.40 2.82 1.82 1.29
2. Weed free check 26.30 163.1 22.95 3.09 2.32 1.58
3. Atrazine @ 0.5 kg ai/ha (PE)+1 25.28 155.1 22.08 3.09 2.18 1.50HW at 35 DAS
4. Atrazine @ 0.1 kg ai/ha 19.70 147.3 21.02 2.88 2.22 1.45(PoE) + 1 HW at 35 DAS
5. Atrazine @ 0.2 kg ai/ha 21.55 150.6 21.45 2.92 1.95 1.48(PoE) + 1 HW at 35 DAS
6. Atrazine @ 0.3 kg ai/ha 22.70 154.7 21.87 3.00 2.28 1.38(PE) + 1 HW at 35 DAS
7. Atrazine @ 0.4 kg ai/ha 26.52 158.4 22.70 3.13 2.25 1.55(PoE) + 1 HW at 35 DAS
8. Hand weeding and hoeing 26.80 158.2 23.19 3.27 2.38 1.68at 20 and 40 DAS
S.Em.± 0.80 10.4 0.41 0.08 0.10 0.08
C.D.(0.05) 2.27 13.9 1.17 0.22 0.30 0.22
CV(%) 9.75 6.73 5.29 7.36 13.54 14.82
PE= Pre-emergence PoE= Post emergence HW= Hand weeding
International Journal on Agricultural Sciences Vol. V (Issue 2), pp. 261-267, 2014

ISSN NO. 0976-450X
Table 3: Grain and stover yield of pearl millet as influenced by various weed management practices.
Treatments Grain yield (kg/ha) Stover yield (t/ha)
2012 2013 Mean 2012 2013 Mean
1. Control (Weedy check) 1342 1237 1289 1.64 2.28 1.96
2. Weed free check 2267 2817 2542 2.10 3.96 3.03
3. Atrazine @ 0.5 kg ai/ha (PE) 2173 2606 2389 1.98 3.54 2.76+ 1 HW at 35 DAS
4. Atrazine @ 0.1 kg ai/ha (PoE) 1727 1994 1861 1.84 3.19 2.51+ 1 HW at 35 DAS
5. Atrazine @ 0.2 kg ai/ha 1857 2166 2012 1.96 3.41 2.68(PoE) + 1 HW at 35 DAS
6. Atrazine @ 0.3 kg ai/ha 2042 2009 2025 1.98 3.48 2.73(PE) + 1 HW at 35 DAS
7. Atrazine @ 0.4 kg ai/ha 2105 2500 2303 1.98 3.58 2.78(PoE) + 1 HW at 35 DAS
8. Hand weeding and hoeing 2107 2666 2386 1.95 3.95 2.95at 20 and 40 DAS
S. Em. ± 114 146 92 0.12 0.18 0.11
C.D. (0.05) 335 428 264 NS 0.52 0.31
C.V. (%) 11.8 12.94 12.44 12.56 10.43 11.39
PE= Pre-emergence PoE= Post emergence HW= Hand weeding
Table 4: Number and dry weight of weeds per m2 at 60 DAS as influenced by various weed management practices.
Treatments
2012 2013 Mean 2012 2013 Mean
1. Control (Weedy check) 7.06 6.72* 6.89 5.13 14.68 9.91(54.5) (45.3) (49.9) (26.00) (225.0) (125.5)
2. Weed free check 0.71 0.71 0.71 0.71 0.71 0.71(0.0) (0.0) (0.0) (0.00) (0.00) (0.0)
3. Atrazine @ 0.5 kg ai/ha 3.52 2.92 3.22 2.16 7.03 4.59(PE)+1 HW at 35 DAS (14.2) (8.1) (11.2) (4.86) (53.3) (29.1)
4. Atrazine @ 0.1 kg ai/ha 6.58 4.98 5.78 3.80 11.90 7.85(PoE)+1 HW at 35 DAS (48.2) (24.9) (36.6) (14.01) (156.7) (85.4)
5. Atrazine @ 0.2 kg ai/ha 6.47 4.02 5.25 3.42 9.21 6.32(PoE)+1 HW at 35 DAS (41.8) (15.6) (28.7) (11.85) (85.8) (48.8)
6. Atrazine @ 0.3 kg ai/ha 3.82 3.92 3.87 2.52 9.32 5.92(PE)+1 HW at 35 DAS (20.0) (15.3) (17.6) (6.10) (92.8) (49.4)
7. Atrazine @ 0.4 kg ai/ha 4.42 3.28 3.84 1.62 7.90 4.76(PoE)+1 HW at 35 DAS (20.5) (10.1) (15.3) (2.32) (61.9) (32.1)
8. Hand weeding and hoeing 0.71 3.07 1.89 0.71 6.17 3.44at 20 and 40 DAS (0.0) (8.8) (4.4) (0.00) (40.3) (20.2)
S.Em.± 0.83 0.28 0.44 0.28 1.25 0.64
C.D.(0.05) 2.45 0.84 1.26 0.83 3.66 1.82
CV(%) 39.97 15.52 31.66 22.48 29.81 33.24
No.of weeds/m2 at 60DAS Dry wt of weeds/m2 at 60DAS
PE= Pre-emergence; PoE= Post emergence; HW= Hand weeding *Square root transformed values; Figures in the parenthesis indicate the original values
IJAS 2014 • 264
International Journal on Agricultural Sciences Vol. V (Issue 2), pp. 261-267, 2014
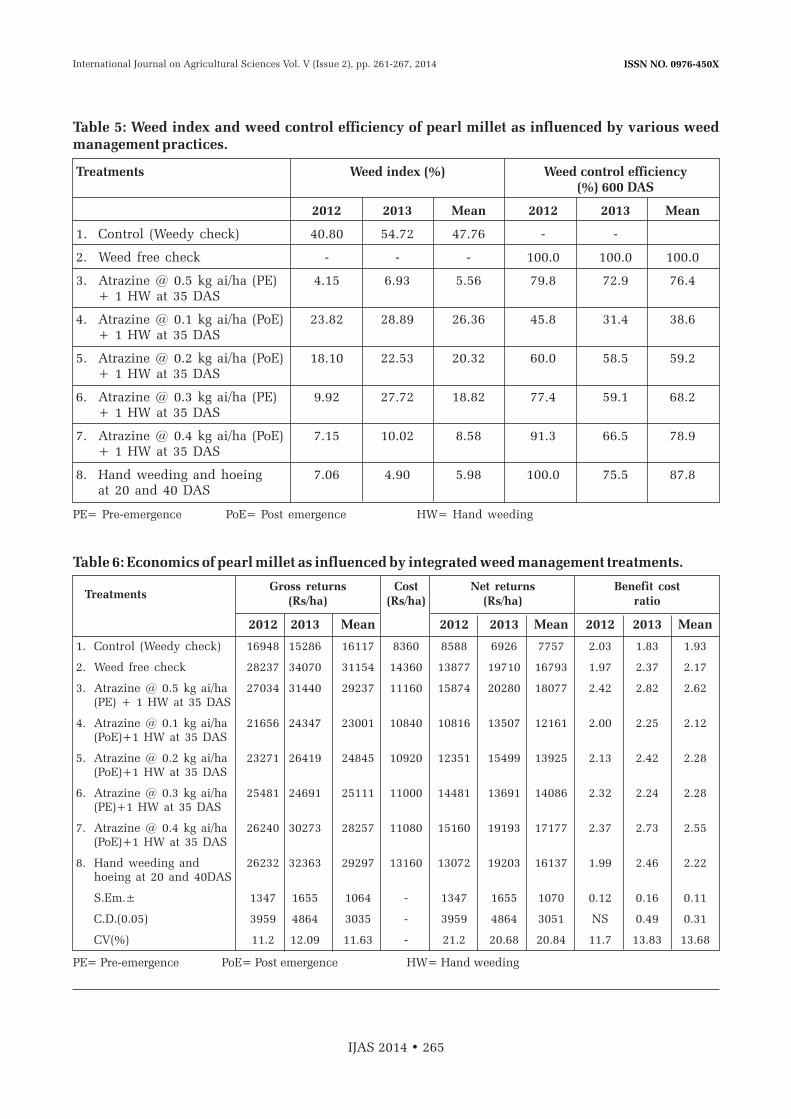
ISSN NO. 0976-450X
IJAS 2014 • 265
Table 5: Weed index and weed control efficiency of pearl millet as influenced by various weed management practices.
Table 6: Economics of pearl millet as influenced by integrated weed management treatments.
Treatments Weed index (%) Weed control efficiency(%) 600 DAS
2012 2013 Mean 2012 2013 Mean
1. Control (Weedy check) 40.80 54.72 47.76 - -
2. Weed free check - - - 100.0 100.0 100.0
3. Atrazine @ 0.5 kg ai/ha (PE) 4.15 6.93 5.56 79.8 72.9 76.4+ 1 HW at 35 DAS
4. Atrazine @ 0.1 kg ai/ha (PoE) 23.82 28.89 26.36 45.8 31.4 38.6+ 1 HW at 35 DAS
5. Atrazine @ 0.2 kg ai/ha (PoE) 18.10 22.53 20.32 60.0 58.5 59.2+ 1 HW at 35 DAS
6. Atrazine @ 0.3 kg ai/ha (PE) 9.92 27.72 18.82 77.4 59.1 68.2+ 1 HW at 35 DAS
7. Atrazine @ 0.4 kg ai/ha (PoE) 7.15 10.02 8.58 91.3 66.5 78.9+ 1 HW at 35 DAS
8. Hand weeding and hoeing 7.06 4.90 5.98 100.0 75.5 87.8at 20 and 40 DAS
2012 2013 Mean
1. Control (Weedy check) 16948 15286 16117 8360 8588 6926 7757 2.03 1.83 1.93
2. Weed free check 28237 34070 31154 14360 13877 19710 16793 1.97 2.37 2.17
3. Atrazine @ 0.5 kg ai/ha 27034 31440 29237 11160 15874 20280 18077 2.42 2.82 2.62(PE) + 1 HW at 35 DAS
4. Atrazine @ 0.1 kg ai/ha 21656 24347 23001 10840 10816 13507 12161 2.00 2.25 2.12(PoE)+1 HW at 35 DAS
5. Atrazine @ 0.2 kg ai/ha 23271 26419 24845 10920 12351 15499 13925 2.13 2.42 2.28(PoE)+1 HW at 35 DAS
6. Atrazine @ 0.3 kg ai/ha 25481 24691 25111 11000 14481 13691 14086 2.32 2.24 2.28(PE)+1 HW at 35 DAS
7. Atrazine @ 0.4 kg ai/ha 26240 30273 28257 11080 15160 19193 17177 2.37 2.73 2.55(PoE)+1 HW at 35 DAS
8. Hand weeding and 26232 32363 29297 13160 13072 19203 16137 1.99 2.46 2.22hoeing at 20 and 40DAS
S.Em.± 1347 1655 1064 - 1347 1655 1070 0.12 0.16 0.11
C.D.(0.05) 3959 4864 3035 - 3959 4864 3051 NS 0.49 0.31
CV(%) 11.2 12.09 11.63 - 21.2 20.68 20.84 11.7 13.83 13.68
2012 2013 Mean 2012 2013 Mean
PE= Pre-emergence PoE= Post emergence HW= Hand weeding
PE= Pre-emergence PoE= Post emergence HW= Hand weeding
TreatmentsGross returns
(Rs/ha)Net returns
(Rs/ha)Benefit cost
ratioCost
(Rs/ha)
International Journal on Agricultural Sciences Vol. V (Issue 2), pp. 261-267, 2014

ISSN NO. 0976-450X
showed that, stover yield followed similar trend
as that of grain yield (Table 3).
Application of atrazine @ 0.5 kg a.i/ha as pre
emergence + one hand weeding at 35 DAS
recorded lower weed index (5.56%) followed by
hand weeding/hoeing at 20 and 40 DAS (5.98%)
and application of atrazine @ 0.4 kg a.i./ha as
post emergence + one hand weeding at 35 DAS
(8.58%). Weed index was significantly higher
with weedy check (47.76%) compared to other
treatments (Table ).
Weed control efficiency due to different weed
management treatments observed at 60 DAS
was higher in weed free check (100%) followed
by hand weeding/hoeing at 20 and 40 DAS
(87.8%), atrazine @ 0.4 kg a.i./ha as post
emergence + one hand weeding at 35 DAS
(78.9%) and atrazine @ 0.5 kg ai/ha as pre
emergence + one hand weeding at 35 DAS
(76.4%). Weed control efficiency was the lowest
with atrazine @ 0.1 kg a.i/ha + hand weeding at
35 DAS (38.6%) and atrazine @ 0.2 kg a.i./ha +
hand weeding at 35 DAS (58.2%). Higher WCE
is attributed to better weed control by both pre
and post emergence herbicides.
Atrazine @ 0.5 kg a.i./ha as pre emergence + one
hand weeding at 35 DAS recorded significantly
higher net returns (Rs.18077/ha) compared to
weedy check (Rs.7757/ha) and application of
atrazine @ 0.1 to 0.3 kg a.i./ha as post
emergence + one hand weeding at 35 DAS
(Rs.12161 to 14086 /ha), however, it was on par
with weed free check (Rs.16793/ha), atrazine @
0.4 kg ai/ha as post emergence followed by one
hand weeding at 35 DAS (Rs 17177/ha) and hand
weeding/hoeing at 20 and 40 DAS (
Rs.16137/ha). Similarly, benefit cost ratio was
significantly higher with atrazine @ 0.5 kg
a.i./ha as pre-emergence and it was on par with
one hand weeding at 35 DAS (2.62) followed by
atrazine @ 0.4 kg a.i./ha as post-emergence
followed by one hand weed at 35 DAS (2.55), but
significantly superior than other weed
management treatments. Weedy check recorded
significantly lower benefit cost ratio (1.93)
among the treatment, mainly due to lower crop
yield from weedy plots.
CONCLUSIONSAtrazine can also be applied as post emergence
@ 0.4 kg a.i./ha when the weeds are at 2-3 leaf
stage followed by one intercultivations / hand
weeding at 35 DAS for effective management of
weeds. This could be very well adopted by the
farmers in situations where they fail to apply
atrazine as a pre emergence herbicide@ 0.5
a.i./ha. Similar effective control of weeds by
early post emergence application of atrazine in
maize were reported by Sandhu et al., (1991);
Dixit and Gautam (1996); Girma and Chinawong
(2005).
ACKNOWLEDGEMENTS The authors are grateful to the Project
Coordinating unit, AICRP on pearl millet
(ICAR), ARS, Mandor, for having provided the
financial assistance and the Regional
Agricultural Research Station, Bijapur,
University of Agricultural Sciences, Dharwad
for extending the physical facilities to carry out
the study.
REFERENCES
1. Ashish Kiroriwal, R.S.Yadav and Amit
Kumawat, 2012.Weed management in
pearlmillet based intercropping system.
Indian Journal of Weed Science 44(3):200-
203.
2. Dixit, A. and Gautam, K.C. 1996. Studies on
the effects of atrazine on weeds in winter
maize. Indian Journal of Weed Science
28(3&4):137-139.
3. Girma, W. and Chinawong, S, 2005.
Growth, yield attributes, yields and weed
characteristics as influenced by integrated
weed control measures of maize (Zea mays
L.) in central Rift Valley of Ethiopia.
IJAS 2014 • 266
International Journal on Agricultural Sciences Vol. V (Issue 2), pp. 261-267, 2014

ISSN NO. 0976-450X
Kasetart Journal of Natural Sciences, 39(3):
338-349.
4. Ram, B.,Chaudhary, G.R., Jat, A.S. and Jat,
M.L. 2005.Effect of integrated weed
management and intercropping systems on
growth and yie ld of pear lmil le t
(Pennisetum glaucum), Indian Journal of
Agronomy. 50(2): 210-213.
5. Sandhu,K.S. and Bhatia, R.K. 1991.
Chemical weed control in transplant winter
maize. Indian Journal of Weed Science 23
(3&4):53-55.
IJAS 2014 • 267
International Journal on Agricultural Sciences Vol. V (Issue 2), pp. 261-267, 2014

ISSN NO. 0976-450X
IJAS 2014 • 268
ISSN NO. 0976-450X
EFFECT OF ORGANICS AND INORGANICS ON NUTRIENT UPTAKE, YIELD AND RESIDUAL NUTRIENT STATUS OF SOIL
IN ONION (ALLIUM CEPA L.) CV. TELAGI RED
1 2 3 3 3*A. N. Bagali , H. B. Patil , V. P. Chimmad , P. L. Patil and R. V. Patil
1Horticulture, College of Agriculture, Bijapur-586101
2Horticulture, HRS (UHSB), Bijapur-586101
3Dept. of Horticulture, College of Agriculture, Dharwad-580005
INTRODUCTION Onion (Allium cepa L.) is one of the most
important commercial vegetable crops
cultivated extensively in India and it belongs to
Alliaceae family. Onion is an indispensable
item in every kitchen as vegetable and
ABSTRACT
The experiment was conducted for two seasons during rabi and summer in Northern dry zone (Zone-3) of Karnataka, at Regional Agricultural Research Station Bijapur, University of Agricultural Sciences, Dharwad, on medium deep black soil to study the effect of integrated nutrient management on nutrient uptake and yield of onion (cv. Telagi Red), and residual nutrient status of soil. The inorganic level of 162:32:148 kg NPK per ha recorded
-1significantly higher dry matter (14.98%) and bulb yield (41.09 t ha ). The higher organic levels viz., FYM @ 30 t per ha, vermicompost @ 6 t per ha and poultry manure @ 3 t per ha were significantly superior with respect to dry matter (14.78, 15.17 and 14.89%,
-1respectively) and bulb yield (40.56, 41.65 and 40.88 t ha respectively). Higher uptake of ,
NPK was recorded with higher level of inorganics 162:32:148 kg NPK per ha (230.95, 14.30 -1 -1
and 37.22 kg ha ), organics; FYM @ 30 t per ha, (210.76, 12.58 and 37.06 kg ha ), -1vermicompost @ 6 t per ha (208.03, 13.11 and 35.46 kg ha ) and poultry manure @ 3 t per
-1ha (199.42, 12.97 and 34.87 kg ha ) and their interaction, i.e., inorganics 162:32:148 kg -1NPK per ha + vermicompost @ 6 t per ha (273.36, 15.30 and 42.64 kg ha ). Similarly,
-1higher inorganic level 162:32:148 kg NPK per ha (219.91, 42.20 and 491.60 kg ha ) and -1organics level; FYM @ 30 t per ha, (163.30, 33.16, and 466.53 kg ha ), vermicompost @ 6 t
-1per ha (164.60, 35.21 and 469.31 kg ha ) and poultry manure @ 3 t per ha (172.78, 39.19 -1and 468.31 kg ha ) registered higher residual soil nitrogen, phosphorus and potassium.
-1 -1Residual nitrogen (243.55 kg ha ) and phosphorus (46.51 Kg ha ) in the soil was significantly higher in a combination of 162:32:148 kg NPK and poultry manure @ 3 t per
-1ha compared to other interactions. While, higher level of potassium (497.98 kg ha ) was recorded with the treatment 162:32:148 kg NPK and vermicompost @ 6 t per ha over rest of the treatments but was on par with the treatment 162:32:148 kg NPK + poultry manure @ 3 t per ha and 162:32:148 kg + FYM @ 30 t per ha.
No. of Pages: 11 No. of Tables : 3 References: 36
Keywords: Onion, Nutrient uptake, Residues, Organics, Inorganics, INM.
Corresponding author: Email: [email protected]
Research Paper
Received on: 26.04.2014 Revised on: 20.05.2014 Accepted on: 29.06.2014
International Journal on Agricultural Sciences Vol. V (Issue 2), pp. 269-279, 2014

ISSN NO. 0976-450X
condiment, therefore commands, an extensive
internal market. Onion is liked for its flavour
and pungency which is due to the presence of a
volatile oil 'allyl propyl disulphide'- organic
compound rich in sulphur.
India the second largest producer of vegetables
and onion in particular, next to China, Onion is
cultivated on an area of 1.05 million ha
producing 16.81 million t (Tiwari, 2014).
Maharashtra is the leading onion growing state
and other important states include Madhya
Pradesh, Karnataka, Andhra Pradesh, Bihar,
Gujarat, Rajasthan, Haryana, Uttar Pradesh,
Tamil Nadu and Orissa. In Karnataka, onion is
grown on an area of 0.16 m. ha with a
production of 2.40 m. t. The state's average
productivity (15.00 t/ ha) is however, lower
compared to country's average (16.00 t/ ha) and
world's average (19.40 t/ ha). India exported
about 0.77 m. MT of fresh onion worth Lakh
Rupees besides meeting the demand for internal
consumption (Tiwari, 2014).
Among the many constraints for low
productivity in onion, imbalanced nutrition
and water are main limiting factors. The
continuous and imbalanced use of fertilizers is
adversely affecting the sustainability of
agricultural production besides causing
environmental pollution. Greenland (1975)
suggested that for a sustainable crop production
system, chemical nutrients removed by the crop
must be replenished and physical conditions of
the soil maintained. Integrated nutrient
management (INM) provides excellent
opportunities to overcome all the imbalances
besides sustaining soil health and enhancing
crop production. This optimizes the benefit
from all possible sources of plant nutrients in an
integrated manner. The importance of nutrient
uptake to crop productivity is assessed from
economic returns and environmental pollution.
The induced deficiencies as a result of low
levels of an element affect the interaction
among different nutrients. The nutrient
recommendations made for onion in the
package are based on ad-hoc basis rather than
experimental results. Thus, in order to improve
the soil fertility for sustainable crop
productivity on long term basis and also for
reduction in fertilizer input cost, INM has
become inevitable. Hence, an experiment was to
ascertain the uptake of nutrients and its
influence on yield of onion and soil nutrient
status after the harvest and observations
presented in this paper.
MATERIAL AND METHODSThe experiment was conducted at Regional
Agricultural Research Station, Bijapur in the
Northern dry zone of Karnataka (Zone-3), which 'is located at 16˚ 49' North latitude, 75˚ 43 East
longitude and at an altitude of 593.8 m above the
mean sea level, for two seasons during rabi, and
summer 2004-05.
In order to plan the nutrient levels for the
experiment on integrated nutrient management
(INM), a preliminary investigation was carried
out during kharif 2004 to study the nutrient
uptake by the crop. The physical and chemical
properties of soil were characterized for various
parameters like soil type, texture, depth, field
capacity, wilting point, bulk density, pH, EC,
organic carbon, available N, available P O and 2 5
available K 0 before initiation of the 2
experiment. The crop was raised by adopting
the recommended package of practices
(Anonymous, 2002). The nutrient uptake by the -1 -1 crop was 81 kg N ha , 16 kg P O ha and 74 kg 2 5
-1K 0 ha . Based on this information on nutrient 2
uptake, the nutrient levels were planned and
allotted to treatments.
The experiment was laid out in split plot design
with three main treatments (inorganics); viz., M 1
- No NPK, M - One time the crop nutrient uptake 2
-1(81: 16: 74 kg NPK ha )and M - Two times the 3
-1crop nutrient uptake (162:32:148 kg NPK ha )
IJAS 2014 • 270
International Journal on Agricultural Sciences Vol. V (Issue 2), pp. 269-279, 2014

ISSN NO. 0976-450X
and six sub treatments (organics); S - Farm Yard 1
-1 -1Manure (FYM) @ 15 t ha , S - FYM @ 30 t ha , 2
-1S – Vermi-compost (VC) @ 3 t ha , S - VC @ 6 t 3 4
-1 -1ha , S - Poultry Manure (PM) @ 1.5 t ha and S - 5 6
-1 PM @ 3.0 t ha along with two controls; Control-
1 (recommended package of practices) and
control -2 (absolute i.e., no inorganics and
organics) with three replications.
The cultivar used was a local type - Telagi Red. It
is a buff or light red skinned variety having
round bulbs with medium size. This variety has
got excellent keeping quality and suitable for
rabi and summer cultivation. Seedlings were
raised on the raised nursery beds. Six weeks old,
uniform and healthy seedlings were
transplanted on flat beds of plot size 2.25m x
1.5m following a spacing of 15 cm x 7.5 cm. The
well decomposed farm yard manure, vermi-
compost, and poultry manure were applied at
the time of land preparation as per the
treatments. Inorganic nutrients were applied as
per the treatments in the form of urea, single
super phosphate, and muriate of potash. Fifty
per cent of nitrogen and full dose of phosphorus
and potash were applied at the time of
transplanting and remaining 50 per cent of
nitrogen was applied six weeks after
transplanting. Irrigation was given as and when
required depending upon the climatic
conditions. Three hand weeding were carried
out to keep the plots free from weeds. The crop
was harvested fifteen days after 50 per cent neck
fall of the crop. The plants were pulled out along
with foliage and windrowed for five days for
field curing for rabi crop and one to two days for
summer crop. Then the foliage was cut leaving
2.5 cm top above the bulb. These bulbs were
cured under the partial shade for 12-14 days for
rabi and for 10-12 days for summer crop.
Ten plants from each plot were selected
randomly and tagged for recording bulb dry
matter and bulb yield. The bulb samples
collected at harvest were cut into pieces, after
air drying, the samples were oven dried at 70˚C
and ground in a Wiley mill to pass through two
mm sieve. The sieved samples were used for the
estimation of nitrogen, phosphorus and potash
uptake by the bulbs. The total dry matter
production was worked out after the estimation
of dry matter percentage. Then the total dry
matter production was multiplied with per cent
of nutrients to obtain the total uptake of
different nutrients. Soil samples were collected
from a depth of 0-15 cm before initiation of the
experiment and also after the harvest of the crop
to analyze the nutrient status of the soil
following standard procedure (Table 1).
The statistical analysis and interpretation of
data were done using the Fisher's method of
analysis of variance technique as described by
Gomez and Gomez (1984). The level of
significance used in “F” and “t” test was P=0.05.
Critical difference values were calculated
wherever the 'F' test was significant. The data
was analyzed using Dry soft Computer
Programme.
RESULTS AND DISCUSSIONThe production of economic yield of a crop is a
complex phenomenon and is an outcome of
interactions among factors like the crop, soil,
climate and agronomic manipulations. Higher
yields are obtained when the congenial
conditions are provided for a crop growth. The
object of development of technology is to
provide the optimum or near optimum
conditions to achieve higher yield of crops. In
view of this, formulation of suitable agronomic
practices like nutrient levels under given set of
agro-climatic conditions needs to be worked
out. The results of the experiment conducted on
integrated nutrient management on uptake of
nutrients, its influence on yield of onion bulbs,
residue accumulation and soil nutrient status
are discussed here under.
The experiment was conducted on medium
IJAS 2014 • 271
International Journal on Agricultural Sciences Vol. V (Issue 2), pp. 269-279, 2014

ISSN NO. 0976-450X
deep black soil (Vertisol). Surface soil samples
(0-15 cm) were drawn before transplanting and
were analyzed for physical and chemical
properties (Table 1). The soil of the
experimental field was clayey in texture, with
coarse sand 16.2, fine sand 6.30, silt 13.20 and
clay content was 54.30. The depth of the soil
was 45-60 cm with field capacity of 17.6, 3wilting point 15 and bulk density 1.25 Mgm
(0-15 cm). The soil pH was 8.9 and EC 0.29. The
soil organic carbon was 0.4%, available N 150
kg/ha, available P O 17.8 kg/ha and the 2 5
available K O was 640 kg/ha.2
Table 1: Initial analysis of soil characteristics
Parameter Description Method employed Reference
I. Soil type Medium deepblack —
A. Physical properties
1. Texture Clay International Piper (1966)
Coarse sand (%) 16.20 Pipette method
Fine sand (%) 6.30
Silt (%) 13.20
Clay (%) 54.30
2. Depth(cm) 45-60
3. Field capacity (%) 17.60
4. Wilting Point (%) 15.00
35. Bulk density(Mgm )
0-15 cm 1.25 Core sampler method Dastane (1967)
15-30 cm 1.43
B. Chemical properties
1. pH (1:2.5 soil: 8.9 pH meter (Systronics Jackson water solution) model 331) (1973)
-12. EC (dS m ) 0.29 Conductivity bridge Jackson (1973)(Systronics model 304)
3. Organic carbon (%) 0.40 Walkley and Black’s Jackson (1973)Wet oxidation method
-14. Available N (kg ha ) 150 Alkaline potassium Subbiah and permanganate method Asija (1956)
-15. Available P O (kg ha ) 17.8 Olsen’s method Jackson (1973)2 5
-1-6. Available K O (kg ha ) 640 Flame photometer method Jackson (1973)2
using neutral normal ammonium acetate as extractant
IJAS 2014 • 272
International Journal on Agricultural Sciences Vol. V (Issue 2), pp. 269-279, 2014
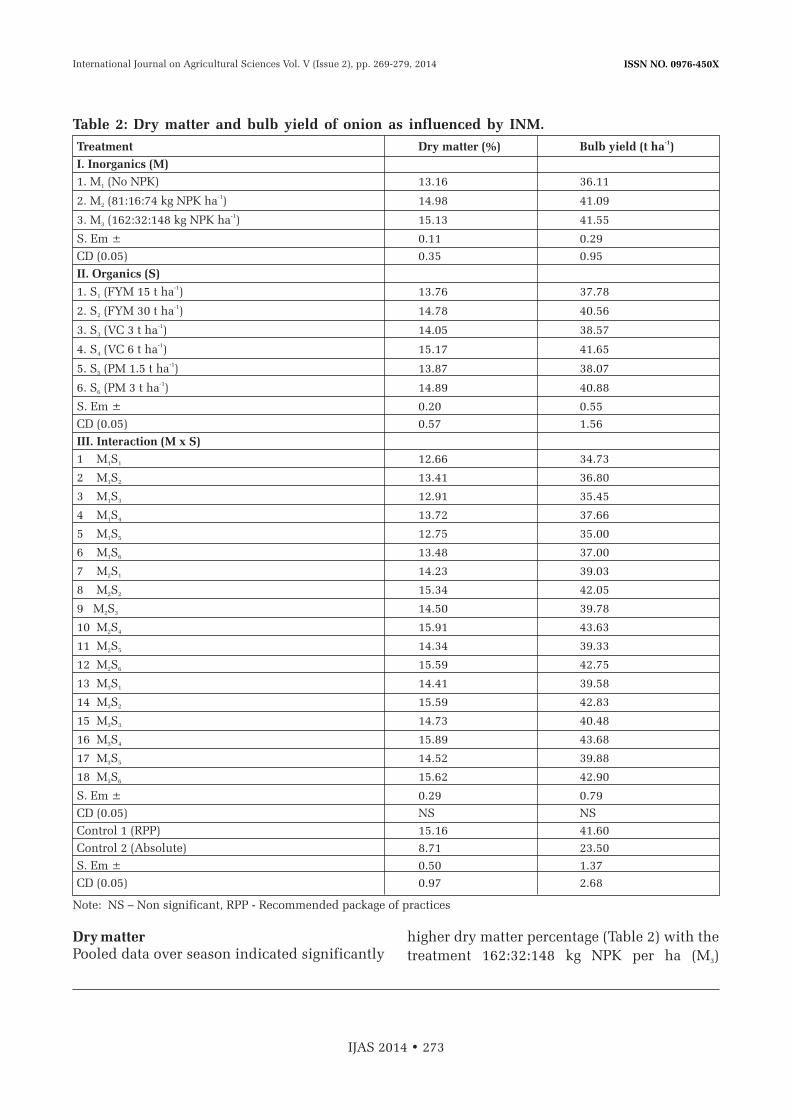
ISSN NO. 0976-450X
Dry matter Pooled data over season indicated significantly
higher dry matter percentage (Table 2) with the
treatment 162:32:148 kg NPK per ha (M ) 3
Table 2: Dry matter and bulb yield of onion as influenced by INM.-1Treatment Dry matter (%) Bulb yield (t ha )
I. Inorganics (M)
1. M (No NPK) 13.16 36.111
-12. M (81:16:74 kg NPK ha ) 14.98 41.092
-13. M (162:32:148 kg NPK ha ) 15.13 41.553
S. Em ± 0.11 0.29
CD (0.05) 0.35 0.95
II. Organics (S)-11. S (FYM 15 t ha ) 13.76 37.781
-12. S (FYM 30 t ha ) 14.78 40.562
-13. S (VC 3 t ha ) 14.05 38.573
-14. S (VC 6 t ha ) 15.17 41.654
-15. S (PM 1.5 t ha ) 13.87 38.075
-16. S (PM 3 t ha ) 14.89 40.886
S. Em ± 0.20 0.55
CD (0.05) 0.57 1.56
III. Interaction (M x S)
1 M S 12.66 34.731 1
2 M S 13.41 36.801 2
3 M S 12.91 35.451 3
4 M S 13.72 37.661 4
5 M S 12.75 35.001 5
6 M S 13.48 37.001 6
7 M S 14.23 39.032 1
8 M S 15.34 42.052 2
9 M S 14.50 39.782 3
10 M S 15.91 43.632 4
11 M S 14.34 39.332 5
12 M S 15.59 42.752 6
13 M S 14.41 39.583 1
14 M S 15.59 42.833 2
15 M S 14.73 40.483 3
16 M S 15.89 43.683 4
17 M S 14.52 39.883 5
18 M S 15.62 42.903 6
S. Em ± 0.29 0.79
CD (0.05) NS NS
Control 1 (RPP) 15.16 41.60
Control 2 (Absolute) 8.71 23.50
S. Em ± 0.50 1.37
CD (0.05) 0.97 2.68
Note: NS – Non significant, RPP - Recommended package of practices
IJAS 2014 • 273
International Journal on Agricultural Sciences Vol. V (Issue 2), pp. 269-279, 2014
ISSN NO. 0976-450X
(15.13%) which was at par with 81:16:74 kg
NPK per ha (M ) (14.98%) and they were 2
significantly superior to no NPK application
(M ). The findings of Singh and Dhankar (1989) 1
and Mallangouda et al. (1995) in onion,
Shanmugasundarum and Savitri (2000) in
potato are in line with the present findings. The
dry matter percentage recorded was
significantly higher with higher levels of
organics (S , S and S ) over the lower levels (S , 2 4 6 1
S and S ). Mallangouda et al. (1995) recorded 3 5
significantly higher dry matter accumulation in
plant when FYM alone was applied @ 30 t per
ha. In brinjal, similar results were also reported
by Rao and Sankar (2001).
Though the interaction effects were non-
significant the combination M S recorded 3 4
numerically higher dry matter content (15.89%)
marginally. On the contrary, Mallangouda et al.
(1995) recorded significantly higher dry matter -accumulation in onion with RDF+ FYM (30 t ha
1). The dry matter recorded with recommended
package of practice (RPP) was at par with M , M , 2 3
S S and S in all the situations. The treatment 2, 4 6
combinations M S , M S , M S , M S , M S and 2 2 2 4 2 6 3 2 3 4
M S were significantly superior over RPP and 3 6
on par with each other with respect to dry
matter per cent.
Bulb yieldThe bulb yield of onion increased with
increasing levels of applied inorganics (Table 2).
Application of 162:32:148 kg NPK per ha (M ) 3
and 81:16:74 kg NPK per ha (M ) were at par and 2
-1recorded higher bulb yield (41.55 t ha and -1
41.09 t ha , respectively) compared to
application of no fertilizer (M ) over the seasons. 1
This increased bulb yield may be attributed to
significant increase in bulb weight. Increased
bulb weight with increased inorganic levels was
also reported by Varu et al. (1997). Similar
results of higher yield were also obtained by
Anonymous (2001), Tumbare and Pawar, (2003),
Sharma et al. (2008) and Mandloi et al. (2008)
with the application of increased levels of
inorganics.
There was a significant increase in bulb yield
with increase in levels of organics. Application
of FYM @ 30 t per ha, vermicompost @ 6 t per ha
and poultry manure @ 3 t per ha recorded
significantly higher bulb yield (40.56, 41.65 and -140.88 t ha , respectively), which recorded 6.85,
7.39 and 6.87 per cent increased yield compared
to their respective lower levels of organics over
the seasons. At higher level of organics,
improved soil physical conditions might have
resulted in better root growth, nutrient
absorption and better bulb development.
Increased bulb yield were noticed by several
workers viz; Lal et al. (2002), Patil et al. (2007)
and Ethel et al. (2009) with increased FYM
levels, Chee et al. (1998) and with increased
vermi-compost levels and Mandloi et al. (2008)
with higher level of poultry manure.
The interaction effects between inorganics and
organics were found non-significant for bulb
yield. Similar observations were reported by
Anonymous (2002) wherein interaction effects
of organic manures and fertilizers were non-
significant in onion. However, the combination
of higher levels of inorganic (M ) and 3
vermicompost (S ) recorded marginally higher 4
-1bulb yield (43.68 t ha ) followed by M S (43.63 t 2 4
-1 -1ha ) and M S (42.9 t ha ). On the contrary, 3 6
significantly higher bulb yield due to integrated
application of inorganics and organics (INM)
were reported by Yadav and Yadav, (2001),
Abbey and Kanton (2003), Mondal et al. (2004),
Chadha et al. (2006), Patel et al. (2008) and Hari
et al. (2009).
With respect to bulb yield, in comparison with -1
RPP (41.60 t ha ), none of the inorganic levels,
organic levels and their combinations were
IJAS 2014 • 274
International Journal on Agricultural Sciences Vol. V (Issue 2), pp. 269-279, 2014

ISSN NO. 0976-450X
significantly superior while, M , M , S , S , S 2 3 2 4 6
and combinations of M and M with organics at 2 3
different levels recorded on par yields.
Nitrogen uptakeThe treatment 162:32:148 kg NPK per ha (M ) 3
-1(230.95 kg ha ) recorded significantly higher
uptake of nitrogen compared to M (202.95 kg 2
-1 -1ha ) and M (141.71kg ha ) for pooled data over 1
seasons (Table 3). At higher level of inorganics,
the nitrogen available in the soil might have
resulted in higher uptake. Similar results were
reported by Cizauskas and Viskelis (2002) in
onion, as well as Shanmugasundaram and
Savitri (2000) in potato. Among the organics,
application of FYM @ 30 t per ha (S ) recorded 2
Table 3: Effect of INM on nutrient uptake by onion bulbs and residual soil nutrient status.
I. Inorganics (M)
1. M (No NPK) 141.71 8.99 27.52 79.12 28.42 423.831
-12. M (81:16:74 kg NPK ha ) 202.95 12.50 35.19 163.10 35.07 472.962
-13. M (162:32:148 kg NPK ha ) 230.95 14.30 37.22 219.91 42.20 491.603
S. Em ± 3.49 0.35 0.44 0.04 0.25 0.37
CD (0.05) 11.37 1.16 1.44 0.15 0.81 1.22
II. Organics (S)-11. S (FYM 15 t ha ) 176.31 11.75 30.37 131.37 32.60 456.321
-12. S (FYM 30 t ha ) 210.76 12.58 37.06 163.30 33.16 466.532
-13. S (VC 3 t ha ) 177.12 11.42 30.95 141.79 34.17 458.533
-14. S (VC 6 t ha ) 208.03 13.11 35.46 164.60 35.21 469.314
-15. S (PM 1.5 t ha ) 179.57 9.73 31.16 150.40 37.06 457.775
-16. S (PM 3 t ha ) 199.42 12.97 34.87 172.78 39.19 468.316
S. Em ± 4.82 0.42 0.64 0.71 0.15 0.48
CD (0.05) 13.64 1.18 1.80 0.48 0.41 1.37
III. Interaction (M x S)
1 M S 149.38 9.21 25.54 63.96 25.25 417.901 1
2 M S 162.36 9.24 31.34 85.97 25.98 426.381 2
3 M S 129.30 7.71 28.09 71.66 27.66 420.271 3
4 M S 137.16 8.78 29.46 85.83 29.41 429.881 4
5 M S 132.05 9.19 23.50 73.12 30.23 419.671 5
6 M S 139.99 9.81 27.19 94.20 32.03 428.881 6
7 M S 171.14 11.45 29.79 139.97 32.63 465.722 1
8 M S 226.37 12.79 37.92 176.67 33.04 477.752 2
9 M S 200.43 12.21 29.62 146.65 33.38 468.052 3
10 M S 213.58 15.26 34.27 178.43 34.24 480.082 4
11 M S 182.16 8.96 37.51 156.28 38.08 467.072 5
12 M S 224.03 14.33 42.03 180.59 39.04 479.112 6
13 M S 208.41 14.60 35.78 190.19 39.92 485.353 1
14 M S 243.55 15.71 41.91 227.27 40.45 495.463 2
15 M S 201.63 14.36 35.14 207.06 41.49 487.293 3
16 M S 273.36 15.30 42.64 229.56 41.98 497.983 4
17 M S 224.50 11.05 32.49 221.82 42.87 486.573 5
18 M S 234.23 14.78 35.38 243.55 46.51 496.313 6
S. Em ± 7.28 0.57 0.87 0.27 0.43 0.68
CD (0.05) 26.95 1.81 2.79 0.77 1.45 NS
Control 1 (RPP) 239.47 17.68 41.14 230.46 45.46 489.06
Control 2 (Absolute) 70.64 5.56 11.79 54.66 22.04 329.21
S. Em ± 11.93 1.04 1.57 0.58 0.36 1.19
CD (0.05) 23.38 2.03 3.08 1.66 0.71 2.34
Note. NS – Non significant, RPP – Recommended package of practices
Nutrient uptakeTreatment Resideual soil nutrient status-1N (kg ha ) -1N (kg ha )-1P (kg ha ) -1P (kg ha )-1K (kg ha ) -1K (kg ha )
IJAS 2014 • 275
International Journal on Agricultural Sciences Vol. V (Issue 2), pp. 269-279, 2014
ISSN NO. 0976-450X
significantly higher nitrogen uptake (210.76 kg -1ha ) and was at par with vermicompost @ 6 t per
-1ha (S ) (208.03 kg ha ) and poultry manure @ 3 t 4
-1per ha (S ) (199.42 kg ha ) in pooled over the 6
seasons. Similar observations were made by
Prasanna Kumar et al. (2007) in maize with
application of vermicompost @ 2.5 t per ha and
Singh and Pandey (2006) in onion with FYM,
fertilzers and Azotobactor. Interaction effect
showed that, nitrogen uptake was significantly -1
higher with M S (273.36 kg ha ) compared to all 3 4
other combination of treatments in pooled over
the seasons. Similar results were reported by
Mallanagouda et al. (1995) with RDF+FYM.
Recommended package of practices (RPP)
recorded significantly higher nitrogen (239.47 -1
kg ha ) uptake compared to M and M but was at 2 1
par with M in pooled over the seasons. The 3
treatment RPP was significantly superior for
nitrogen uptake over all organic treatment
levels in pooled over the seasons.
Phosphorus uptakeThe uptake of phosphorus increased
significantly with increased level of inorganics.
Significantly higher uptake of P was recorded
with application of 162:32:148 kg NPK per ha -1
(M ) (14.30 kg ha ) over 81:16:74 kg NPK per ha 3
-1(M ) (12.50 kg ha ) and no fertilizer (M ) (8.99 kg 2 1
-1ha ) in pooled over the seasons. Similar
observations were made by Thimmiah (1989) in
onion and Roy and Seth (1971) in radish.
Among organics, significantly higher P uptake
was recorded with application of vermicompost -1
@ 6.0 t per ha (S ) (13.11 kg ha ), which was on 4
par with poultry manure @ 3 t per ha (S ) (12.97 6
-1 -kg ha ) and FYM @ 30 t per ha (S ) (11.75 kg ha2
1). Similar results were reported by Prasanna
Kumar et al. (2007) with vermicompost @ 2.5 t
per ha in maize. Among the inorganic fertilizers
and organic manure interaction treatments,
significantly higher P uptake was recorded by -1
M S (15.71 kg ha ) and it was on par with M S , 3 2 3 4
M S , M S , M S , M S and M S interaction 2 4 3 6 3 1 2 6 3 3
effects. Compared to RPP, none of the inorganic
fertilizers or organic manures or combinations
was significant except the treatment
combination M S which was on par.3 2
Potassium uptakeAmong the inorganics significantly higher
uptake of K was recorded with application of -1
162:32:148 kg NPK per ha (M ) (37.22 kg ha ) 3
compared to 81:16:74 kg NPK per ha (M ) (35.19 2
-1 -1kg ha ) and no fertilizer (M ) (27.50 kg ha ). 1
Similar results were reported by Thimmaiah
(1989) and Hariappa (2003) in onion. Among
the organics, significantly higher uptake was
recorded by FYM @ 30 t per ha (S ) (37.06 kg 2
-1ha ) compared to other organics, however it was
on par with vermicompost @ 6 t per ha (S ) 4
-1(35.46 kg ha ) and poultry manure @ 3 t per ha
-1(S ) (34.87 kg ha ). Among the interactions, 6
significantly higher uptake of K was recorded -1with M S (42.64 kg ha ) and was on par with 3 4
-1 -1M S (42.03 kg ha ) and M S (41.91 kg ha ). In 2 6 3 2
comparison with RPP, none of the inorganic and
organic treatment or their interaction was found
significant but the interactions, M S , M S and 3 4 2 6
M S were on par.3 2
Residual soil nutrient statusNitrogenHigher inorganic level viz., 162:32:148 kg NPK
per ha (M ) recorded significantly higher 3
-1residual N (219.91 kg ha ) compared to 81:16: -174 kg NPK per ha (M ) (163.10 kg ha ) and no 2
-1fertilizer application (M ) (79.12 kg ha ). 1
Similarly, increased residual N with increase in
the rate of N application was recorded by Singh
and Singh (1995). Among the organic manures,
poultry manure @ 3 t per ha (S ) recorded 6
significantly higher soil residual N (172.78 kg -1ha ) compared to other organics and their
levels. The only interaction, M S recorded 3 6
significantly higher soil residual N (243.55 kg -1
ha ) compared to other interactions. Higher
residual N with the application of INM was
IJAS 2014 • 276
International Journal on Agricultural Sciences Vol. V (Issue 2), pp. 269-279, 2014
ISSN NO. 0976-450X
observed by Singh and Singh (1995) and Meena
(2007). Decreased N after five years was noticed
by Madhu et al. (1997), higher fertility status by
Singh and Pande (2006) and significantly higher
amount of organic carbon by Basavaraj et al.
(2007) which are in agreement with the present -1findings. In comparison to RPP (230.46 kg ha ),
none of the inorganic fertilizers or organic
manures or their interactions except M S 3 6
recorded significantly higher soil residual N.
PhosphorusSimilar trend was also observed with available
phosphorus to that of available nitrogen. -1Inorganic fertilizer level M (42.20 kg ha ) 3
recorded significantly higher soil residual P O 2 5
compared to other levels. Among the organic -1
levels, only S (39.19 kg ha ) recorded 6
significantly higher soil residual P O compared 2 5
to other organic manures. The interaction M S 3 6
-1(46.51 kg ha ) recorded significantly higher
residual P O over other interactions. Higher 2 5
residual P with the application of INM was
observed by Singh and Singh (1995), increased
P after five years was noted by Madhu et al.
(1997), higher fertility status by Singh and
Pande (2006) and significantly higher amount of
available phosphorus by Basavaraj et al. (2007)
which are in agreement with the present -1findings. Compared to RPP (45.46 kg ha ), none
of the inorganic fertilizers or organic manures or
their interactions except M S recorded 3 6
significantly higher soil residual P O .2 5
PotassiumThe inorganic fertilizer level M recorded 3
significantly higher soil residual K O (491.60 kg 2
-1ha ) compared to other levels. Higher level of K
application significantly influenced the residual
K content of soil. Similar observations were made
by Hariappa (2003). Among the organics,
vermicompost @ 6 t per ha (S ) recorded 4
significantly higher soil residual K O (469.31 kg 2
-1ha ) over other organic manures. The interaction
effect between inorganic fertilizers and organic
manures was found non-significant. Compared -1
with RPP (489.06 kg ha ), only M and the 3
interactions of M S , M S and M S recorded 3 2 3 4 3 6
significantly higher soil residual K O. Higher 2
residual K after five years with the application of
INM was noted by Madhu et al. (1997), higher
fertility status by Singh and Pande (2006) and
significantly higher amount of available potash
by Basavaraj et al. (2007) which are in agreement
with the present findings.
It can be concluded that the inorganic levels of -181:16:74 (41.55 t ha ) and 162:32:148 kg NPK
-1 -1ha per ha (41.09t ha ) recorded significantly higher bulb yield of onion. The higher organic levels viz., FYM @ 30 t per ha, vermicompost @ 6 t per ha and poultry manure @ 3 t per ha were significantly superior with respect to dry matter and bulb yield. Higher uptake of NPK was recorded in higher level of inorganics (M ), 3
organics (S , S and S ) and in the interaction 2 4 6
M S . Compared to RPP none of the inorganics or 3 4
organic levels or their combinations was found significant for higher NPK uptake except M S 3 4
which recorded higher uptake of N. Residual nitrogen and phosphorus in the soil was significantly higher with M S compared to all 3 6
other interactions during both the seasons. Application of RPP resulted in significantly lower residual nitrogen in the soil compared to M S during both the seasons and for pooled. 3 6
Higher level of potassium was recorded with the treatment M S over rest of the treatments but 3 4
which was on par with M S and M S . 3 6 3 2
REFERENCES
1. Abbey, L. and Kanton, R. A. L., 2003,
Fertilizer type, but not time of cessation of
irrigation, affect onion development and
yield in a semi-arid region. J. Veg. Crop
Prod., 9(2):41-48.
2. Anonymous, 2001, Annu. Rep. (2000-01),
NRCOG, Rajagurunagar, Maharashtra,
India p. 60.
IJAS 2014 • 277
International Journal on Agricultural Sciences Vol. V (Issue 2), pp. 269-279, 2014
ISSN NO. 0976-450X
3. Anonymous, 2002, Package of Practices for
Horticultural, Univ. Agric., Sci. Dharwad,
Karnataka (India).
4. Basavaraj, P. K., Sridhara, S., Sushma, A. R.
and Hareesh, G. R., 2007, Effect of integrated
nutrient management on onion yield and soil
properties under Chronic Haplusterts of
Karnataka. J. Hort. Sci., 2 (1): 34-37.
5. Chadha, S., Rana. S. S. and Chaudhary, D.
R., 2006, Nutrient management in summer
onion (Allium cepa L.) under cold desert
conditions of North Western, Indian J.
Agric. Sci., 76 (10) : 629-631.
6. Chee, L. C., Garcia Carmona, R. and Ferrera
Cerrato, R., 1998, Onion biofertilization
with vermicompost and arbuscular
mycorrhizae. ASAE Annu. Int. Meet.,
Orlando, Florida, USA, 12-16 July, 1998.
7. Cizauskas, A. and Viskelis, P., 2002,
Influence of nitrogenous fertilizers on
onion yield, quality, and storability. In :
Plant Nutrition (Growth and Diagnosis), Ed.
Ramdane Dris, Farouk Hasan Abdelaziz
and Shri Mohan Jain. Oxford & IBH
publishing Co. Pvt. Ltd., New Delhi and
Kolkata, pp. 129-135.
8. Dastane, N. G., 1967, A Practical Manual for
Water Use Research, Navabharat Prakashan
Publication, Poona.
9. Ethel, Ngullie, Singh, A. K. and Singh, V. B.,
2009, Effect of organic manures and
biofertilizers on growth, yield and quality
of onion. Environ. Biol., 27(1A) : 313-315.
10. Gomez, K. A. and Gomez, A. A., 1984,
Statistical Procedures for Agricultural nd
Research, 2 Edition, A Wiley Interscience
Publication, New York (USA). pp. 28-36.
11. Greenland, D. J, 1975, The magnitude and
importance of the problem, pp. 3-7. In : D. J.
Greenland and R. Lal (eds). Soil Conservation
and Management in the Humid Tropics, John
Wiley & Sons, NY, USA.
12. Hari, G. S., Kumar A. K., and Reddy, A. V.,
2009, Effect of organic manures in
combination with 'N' fertilizers on growth
and yield of onion (Allium cepa L.) under
irrigated conditions of Central Telangana
Zone of Andhra Pradesh. Reaearch on
Crops, 10(1): 103-104.
13. Hariappa, N., 2003, Effect of potassium
and sulphur on growth, yield and quality
parameters of onion (Alium cepa L.). M. Sc.
(Agri.) Thesis, Univ. Agric. Sci., Dharwad,
Karnataka (India).
14. Jackson, M. L., 1973, Soil Chemical
Analysis, Prentice Hall of India, Pvt. Ltd.,
New Delhi (India), pp. 38-82.
15. Lal, S., Yadav, A. C., Mangal, J. L., Avtar
Singh and Batra, V. K., 2002, Effects of FYM
and irrigation levels on growth and yield of
onion cv. Hisar-2. Haryana J. Hort. Sci.,
31(3-4): 256-258.
16. M a d h u , M . , S e s h a c h a l a m , N . ,
Nalatwadmath, S. K. and Nimje, P. M.,
1997, Effect of organic and inorganic
fertilizers on yield of crops and physico-
chemical properties of soil in high hills of
Nilgiris (India). Indian J. Soil Conser., 25(3)
: 241-245.
17. Mallanagouda, B., Sulikeri, G. S.,
Hulamani, N. C., Murthy, B. G. and
Madalageri, B. B., 1995, Effect of NPK and
FYM on growth parameters of onion, garlic
and coriander. Curr. Res., 24(11): 212-213.
18. Mandloi, K. S., Bose, U. S. and Deshmukh,
K. S., 2008, Effect of organic manures and
inorganic fertilizers on growth and yield of
onion (Allium cepa L.). Asian J. Hortic., 3(2):
238-240.
19. Meena, S., 2007, Integrated use of organic
manures and fertilizer nitrogen on
sustaining productivity of cotton- maize
ecosystem. J. Ecobiol., 20(3) : 259-262.
IJAS 2014 • 278
International Journal on Agricultural Sciences Vol. V (Issue 2), pp. 269-279, 2014

ISSN NO. 0976-450X
IJAS 2014 • 279
20. Mondal, S. S., Debabrata Acharya., Anup
Ghosh and Thapa U., 2004, Integrated
management of organic and inorganic
sources of nutrient to improve productivity
and qualitative characters of rice and onion
in rice onion cropping sequence. Environ.
Biol., 22(1): 125-128.
21. Patel, K. M., Patel, H. C. and Gedia, K. M.,
2008, Effect of nitrogen, organic manures
and bio-fertilizers on bulb yield and quality
of onion (Allium cepa L.) varieties.
Research on Crops, 9 (3): 636-639.
22. Patil, H. M., Shete, B. and Kolekar, P. T.,
2007, Effect of integrated nutrient
management on growth and yield of onion
(Allium cepa L.) seed production. Int. J.
Agric. Sci., 3 (2): 83-86.
23. Piper, C. S., 1996, Soil and Plant Analysis,
Academic Press, New York, pp. 47-77.
24. Prasanna Kumar, Halepyati, A. S., Pujari,
B. T. and Desai, B. K., 2007, Effect of
integrated nutrient management on
productivity, nutrient uptake and
economics of maize (Zea mays L.) under
rain fed condition. Karnataka J. Agric. Sci.,
20 (3): 462-465.
25. Rao, T. S. S. S. and Sankar, C. R., 2001,
Effect of organic manures on growth and
yield of brinjal. South Indian Hortic., 49
(Special) : 288-291.
26. Roy, R. N. and Seth, J., 1971, Nutrient
uptake and quality of radish (Raphanus
sativus L.) as influenced by levels of
nitrogen, phosphorus and potassium and
methods of their application. Indian J.
Hortic., 28: 144-149.
27. Shanmugasundaram, R. and Savithri, P.,
2000, Effect of various N levels with
organics and amendments on N content,
uptake and yield of potato in Western Ghats
of Tamil Nadu. J. Indian Potato Asso.,
27(3/4) : 127-131.
28. Singh, J. and Dhankar, B. S., 1989, Effect of
nitrogen,potash and zinc on growth,yield
and quality of onion. Veg. Sci., 16(2): 136-
144.
29. Singh, V. and Pandey, M., 2006, Effect of
integrated nutrient management on yield
and nutrient uptake by onion and on soil
fertility. J. Indian Soc. Soil Sci., 54(3): 365-
367.
30. Singh, V. and Singh R. K., 1995, Response of
onion (Allium cepa L.) to N, P, Zn and FYM.
Ann. Agric. Res. 16(1):79-81.
31. Subbaiah, B. V. and Asija, G., 1956, A rapid
procedure for the estimation of available
nitrogen in soils. Curr. Sci., 25: 259-260.
32. Tiwari, R., 2014, Indian Horticulture Data
Base 2013, National Horticulture Board,
Gurgaon, Ministry of Agriculture, Govt. of
India.
33. Thimmiah, D., 1989, Studies on effect of
nitrogen, phosphorus and potassium on
growth and yield of onion (Allium cepa L)
Bellary Red. M. Sc. (Agri). Thesis, Univ.
Agric. Sci., Dharwad, Karnataka (India).
34. Tumbare, A. D. and Pawar, V. S., 2003,
Effect of integrated nutrient management
system in soybean–onion cropping
sequence on yield and keeping quality of
winter onion. Indian J. Agric. Sci., 73(7):
373-375.
35. Varu, D. K., Vhora, P. H. and Kikani, K. P.,
1997, Effect of organic and inorganic
fertilizers on onion. Gujarat Agric. Univ. J.,
22(2): 116-118.
36. Yadav, V. S. and Yadav, B. D., 2001, Effect of
NICAST (organic manure) in comparison to
recommended doses of manure and
fertilizers in onion. South Indian Hortic., 49
(special): 160-161.
International Journal on Agricultural Sciences Vol. V (Issue 2), pp. 269-279, 2014

ISSN NO. 0976-450X
IJAS 2014 • 280
International Journal on Agricultural Sciences Vol. V (Issue 2), pp. 269-279, 2014
ISSN NO. 0976-450X
IN VITRO EVALUATION OF FUNGICIDES AND BIOAGENTSAGAINST ALTERNARIA RICINI (YOSHII) HANSF.
CAUSING LEAF SPOT OF CASTOR
1 2Neelakanth, S. Hiremani and S. G. Mantur
1Division of Plant Pathology, IARI, New Delhi-110012
2Department of Plant Pathology, College of Agriculture, UAS, Bangalore-560 065
INTRODUCTIONCastor (Ricinus communis L.) belonging to the
family Euphorbiaceae is one of the important
non-edible, export oriented industrial oil seed
crop grown in India which occupies an area of
7.87 lakh ha with an annual production of 10.54 -1
lakh tones and productivity of 1339 kg ha
(Anon 2007). Castor oil and its derivatives are
used in several industries like perfumery,
cosmetics, textile, paints, printing inks,
adhesives, plastics, rubber, lubricants, paper,
chemicals and pharmaceuticals etc. (Singhal,
1995). Castor plants are attacked by numerous
diseases under high relative humidity
conditions, but only a few occur in the high
plains. In recent years, leaf spot caused by
Alternaria ricini is assuming serious
proportions in major castor growing areas,
causing losses in yield and oil content.
Management of the disease is possible through
use of fungicides and biocontrol agents. Several
fungicides can be used to control this disease
but specific fungicides and concentrations are
needed to be evaluated in vitro and then they
can be used for spraying in fields. Similarly
some of the biocontrol agents are effective in
inhibiting the pathogen; hence, there is a need
to study the effect of different biocontrol agents
against this pathogen.
MATERIAL AND METHODSThe experiment was conducted in the
Department of Plant Pathology, College of
Agriculture, UAS, GKVK, Bangalore during
2009-10. The leaves of castor having typical
symptoms of leaf spot caused by Alternaria
ABSTRACT
An experiment involving in vitro evaluation of fungicides and bioagents against Alternaria ricini (Yoshii) Hansf. causing leaf spot of castor was conducted. Six fungicides were evaluated in vitro against A. ricini wherein propiconazole at 500 ppm concentration was most effective in inhibiting the growth of the pathogen. Carbendazim was least effective among all the treatments. Four biological control agents were evaluated in vitro against A. ricini among which Trichoderma viride was most effective in inhibiting the growth of the pathogen. Bacterial antagonists were least effective as compared to fungal antagonists.
No. of Pages: 5 No. of Tables : 3 No. of Figs.: 3 References: 4
Keywords: In vitro, Alternaria ricini, fungicide, bioagent.
Corresponding author: Email: [email protected]
Research Paper
Received on: 26.04.2014 Revised on: 20.05.2014 Accepted on: 29.06.2014
International Journal on Agricultural Sciences Vol. V (Issue 2), pp. 281-285, 2014
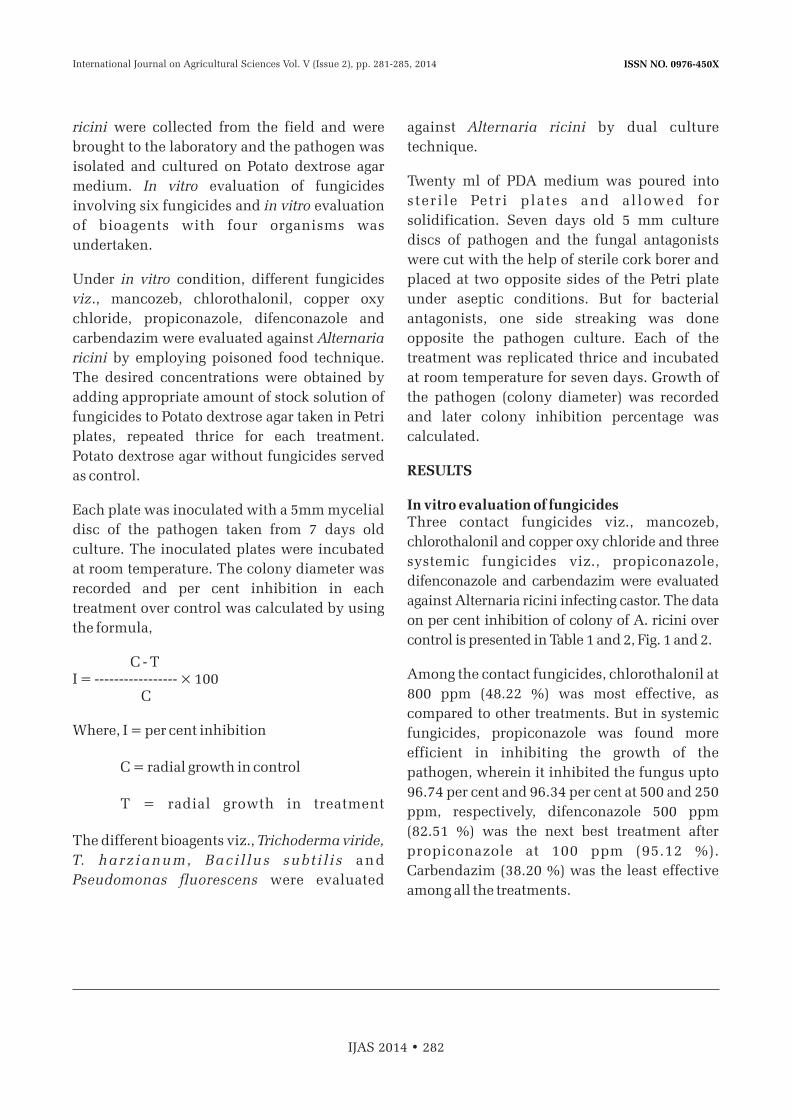
ISSN NO. 0976-450X
IJAS 2014 • 282
ricini were collected from the field and were
brought to the laboratory and the pathogen was
isolated and cultured on Potato dextrose agar
medium. In vitro evaluation of fungicides
involving six fungicides and in vitro evaluation
of bioagents with four organisms was
undertaken.
Under in vitro condition, different fungicides
viz., mancozeb, chlorothalonil, copper oxy
chloride, propiconazole, difenconazole and
carbendazim were evaluated against Alternaria
ricini by employing poisoned food technique.
The desired concentrations were obtained by
adding appropriate amount of stock solution of
fungicides to Potato dextrose agar taken in Petri
plates, repeated thrice for each treatment.
Potato dextrose agar without fungicides served
as control.
Each plate was inoculated with a 5mm mycelial
disc of the pathogen taken from 7 days old
culture. The inoculated plates were incubated
at room temperature. The colony diameter was
recorded and per cent inhibition in each
treatment over control was calculated by using
the formula,
C - TI = ----------------- × 100 C
Where, I = per cent inhibition
C = radial growth in control
T = radial growth in treatment
The different bioagents viz., Trichoderma viride,
T. harz ianum, Bac i l lus sub t i l i s and
Pseudomonas fluorescens were evaluated
against Alternaria ricini by dual culture
technique.
Twenty ml of PDA medium was poured into
ster i le Petr i plates and al lowed for
solidification. Seven days old 5 mm culture
discs of pathogen and the fungal antagonists
were cut with the help of sterile cork borer and
placed at two opposite sides of the Petri plate
under aseptic conditions. But for bacterial
antagonists, one side streaking was done
opposite the pathogen culture. Each of the
treatment was replicated thrice and incubated
at room temperature for seven days. Growth of
the pathogen (colony diameter) was recorded
and later colony inhibition percentage was
calculated.
RESULTS
In vitro evaluation of fungicidesThree contact fungicides viz., mancozeb,
chlorothalonil and copper oxy chloride and three
systemic fungicides viz., propiconazole,
difenconazole and carbendazim were evaluated
against Alternaria ricini infecting castor. The data
on per cent inhibition of colony of A. ricini over
control is presented in Table 1 and 2, Fig. 1 and 2.
Among the contact fungicides, chlorothalonil at
800 ppm (48.22 %) was most effective, as
compared to other treatments. But in systemic
fungicides, propiconazole was found more
efficient in inhibiting the growth of the
pathogen, wherein it inhibited the fungus upto
96.74 per cent and 96.34 per cent at 500 and 250
ppm, respectively, difenconazole 500 ppm
(82.51 %) was the next best treatment after
propiconazole at 100 ppm (95.12 %).
Carbendazim (38.20 %) was the least effective
among all the treatments.
International Journal on Agricultural Sciences Vol. V (Issue 2), pp. 281-285, 2014

ISSN NO. 0976-450X
IJAS 2014 • 283
Table 1: In vitro evaluation of contact fungicides against A. ricini
Table 2: In vitro evaluation of systemic fungicides against A. ricini
Table 1: In vitro evaluation of contact fungicides against A. ricini
Sl. No.
Sl. No.
Fungicide
Fungicide
Contact
Systemic
100 ppm
50 ppm
200 ppm
100 ppm
400 ppm
250 ppm
800 ppm
500 ppm
Colony inhibition percentage (mean)
Colony inhibition percentage (mean)
1 Mancozeb 32.51 37.8 40.24 45.12
2 Chlorothalonil 24.73 34.75 37.8 48.22
3 Copper oxy chloride 16.46 28.85 37.39 44.71
4 Control 0 0 0 0
Fungicides (F) Concentration (C) F×C
SEm± 0.9 0.78 1.57
CD 2.64 2.29 4.58
5 Propiconazole 82.51 95.12 96.34 96.74
6 Difenconazole 71.54 71.70 81.70 82.51
7 Carbendazim 8.93 23.16 24.77 38.20
8 Control 0.00 0.00 0.00 0.00
Fungicides (F) Concentration (C) F×C
SEm± 0.93 0.80 1.58
CD 2.68 2.30 4.66
International Journal on Agricultural Sciences Vol. V (Issue 2), pp. 281-285, 2014
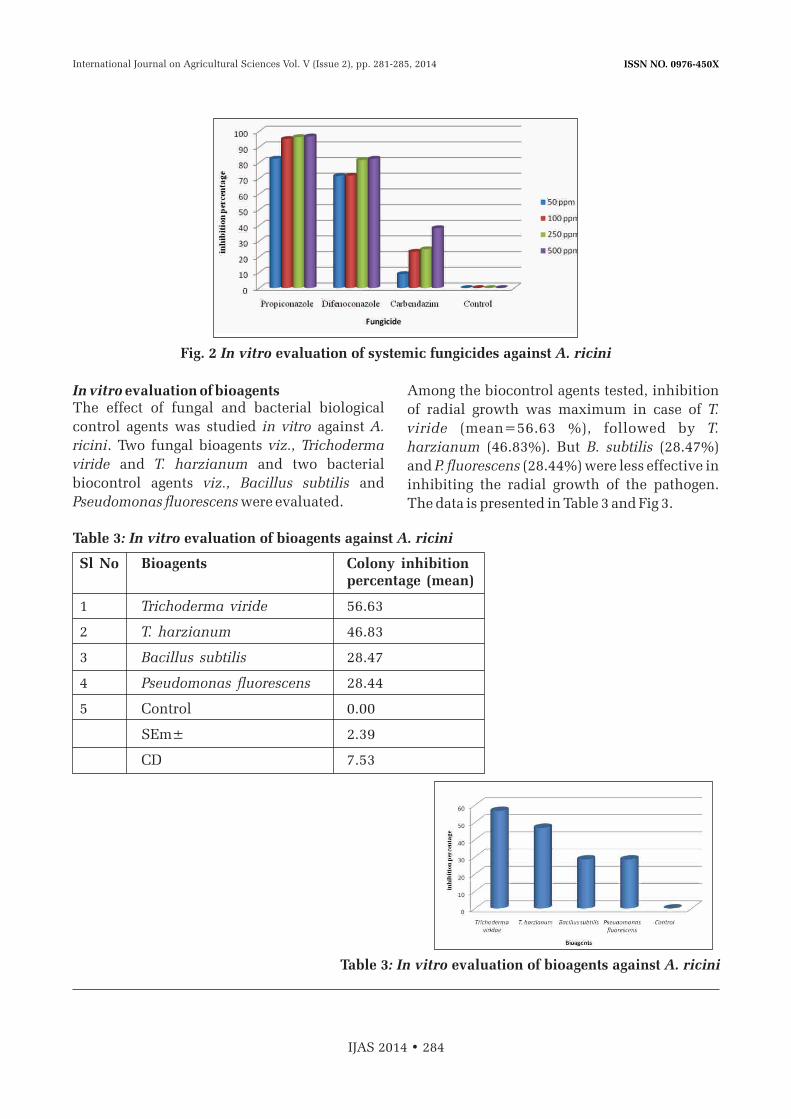
ISSN NO. 0976-450X
IJAS 2014 • 284
In vitro evaluation of bioagentsThe effect of fungal and bacterial biological
control agents was studied in vitro against A.
ricini. Two fungal bioagents viz., Trichoderma
viride and T. harzianum and two bacterial
biocontrol agents viz., Bacillus subtilis and
Pseudomonas fluorescens were evaluated.
Among the biocontrol agents tested, inhibition
of radial growth was maximum in case of T.
viride (mean=56.63 %), followed by T.
harzianum (46.83%). But B. subtilis (28.47%)
and P. fluorescens (28.44%) were less effective in
inhibiting the radial growth of the pathogen.
The data is presented in Table 3 and Fig 3.
Fig. 2 In vitro evaluation of systemic fungicides against A. ricini
Table 3: In vitro evaluation of bioagents against A. ricini
Sl No Bioagents Colony inhibitionpercentage (mean)
1 Trichoderma viride 56.63
2 T. harzianum 46.83
3 Bacillus subtilis 28.47
4 Pseudomonas fluorescens 28.44
5 Control 0.00
SEm± 2.39
CD 7.53
Table 3: In vitro evaluation of bioagents against A. ricini
International Journal on Agricultural Sciences Vol. V (Issue 2), pp. 281-285, 2014

ISSN NO. 0976-450X
IJAS 2014 • 285
DISCUSSIONIn vitro evaluation of fungicides and bioagents
was carried out for the management of A. ricini.
Three contact fungicides viz., mancozeb,
chlorothalonil and copper oxy chloride and
three systemic fungicides viz., propiconazole,
difenconazole and carbendazim were evaluated
against A. ricini. Propiconazole inhibited the
pathogen growth by 96.74 per cent and 96.34
per cent at 500 and 250 ppm concentrations
respectively; difenconazole 500 ppm (82.51 %)
w a s t h e n ex t b e s t t r e a t m e n t a f t e r
propiconazoloe at 100 ppm (95.12 %).
Similar results were obtained by many authors.
Propiconazole (0.05%) showed maximum
inhibition of fungal growth, followed by
difenconzole (0.05%) in case of A. alternata
(Suryawanshi et al., 2010).
Hence, in the present study also propiconazole
and difenconazole were found best chemical
fungicides for the in vitro management of A.
ricini which supports the results obtained in the
earlier studies by other authors.
The effect of fungal and bacterial biological
control agents was studied in vitro against A.
ricini. Among the biocontrol agents tested,
inhibition of radial growth was maximum in
case of T. viride (mean=56.63 %) followed by T.
harzianum (46.83 %), however, Bacillus subtilis
(28.47%) and Pseudomonas fluorescens
(28.44%) were less effective in inhibiting the
radial growth of the pathogen.
Martinez and Salano (1995) studied the
antagonism of 10 Trichoderma strains against A.
solani on tomato, strains L12 and L17 showed 3
types of antagonism and gave 45.7 and 38.77 per
cent control of A. solani respectively.
Similarly, in the present study also T. viride was
found more effective in inhibiting mycelial
growth of A. ricini followed by T. harzianum and
there was significant difference between these
two treatments, however bacterial antagonists
were found less effective in inhibiting the
growth of A. ricini.
SUMMARYIn vitro evaluation of fungicides against
Alternaria ricini revealed that propiconazole
was most effective in inhibiting the pathogen at
250 and 500 ppm. The next best chemical was
difenconazole at 500 ppm. Remaining
fungicides were least effective in inhibiting the
radial growth of the fungus. Propiconazole was
effective and inhibited up to 96.74 per cent of
the radial growth of the pathogen over control.
In vitro evaluation of the biological control
agents revealed that fungal biocontrol agents
were more effective in inhibiting the radial
growth of the pathogen as compared to bacterial
biocontrol agents. Trichoderma viride inhibited
56.63 per cent of radial growth of the pathogen
over control in dual culture technique. Least
inhibition was observed with Pseudomonas
fluorescens (28.44 %).
REFERENCES
1. Anonymous, 2007, Quarterly Bulletin of
S t a t i s t i c , Fo o d a n d A g r i c u l t u r e
Organization, 32pp.
2. Martinez, B. and Salano, T., 1995,
Antagonism of Trichoderma spp. to
Alternaria solani. Revista-de-protection
vegetal, 3; 221-225.
3. Singhal, V., 1995, Hand book of Indian
Agriculture. Vikas publishing house Pvt.
Ltd. Jangpura, New Delhi. pp. 235-250.
4. Suryawanshi, K. T., Sawant, D. M.,
Navale, A. M. and Deokar, C. D., 2010,
Studies on the pathogen associated with
fruit of pomegranate (Punica granatum L.).
Bioinfolet, 7 (2): 158-160.
International Journal on Agricultural Sciences Vol. V (Issue 2), pp. 281-285, 2014

ISSN NO. 0976-450X
IJAS 2014 • 286
ISSN NO. 0976-450X
ECONOMIC ANALYSIS OF TECHNOLOGIES FOR SORGHUM PRODUCTION: PRINCIPLE
COMP0NENT ANALYSIS APPROACH
1 2 3Devyanee K. Nemade V. A. Tiwari and S. S. Bhoyar
1Department of Agricultural Economics and Statistics2Agricultural Prices and Costs Scheme
3Junior Research Assistant, Department of Agricultural Economics and StatisticsDr. Panjabrao Deshmukh Krishi Vidyapeeth, Akola, Maharahstra
INTRODUCTIONIn India, sorghum ranks third in area and production
after rice and wheat, with 10.39 Million ha area, and
accounts 24.40 per cent of the world sorghum area.
However, the yield per hectare of sorghum in India is
only 852 kilogram/ha as compared to world average
yield of 1391 kg per ha. Maharashtra, Karnataka,
Madhya Pradesh, Andhra Pradesh and Tamilnadu
are the top five sorghum growing states of India.
These five states together account for about 91 per
cent of the country's total sorghum production.
Agricultural production has increased manifold due
to the introduction of high yield varieties along with
the use of improved production technologies. For
kharif sorghum various technologies were evolved
by the University. It is important to know the impact
of these technologies on production and economics
of production.
So as to what extent these technologies have been
adopted by the farmers and what constraints they are
facing in adoption of the technologies. Effect of the
adoption of technologies investigated. The new
agricultural strategy involved the adoption of the
various recommended improved practices for
optimizing the yield level. In view of this study has
been undertaken with following objectives.
1. To study the extent of adoption of technologies.
ABSTRACT
Agricultural production has increased manifold due to the introduction of high yield varieties along with the use of improved production technologies. In kharif sorghum crop many technologies were evolved by the University. It is important to know that at what extent these technologies have been adopted by the farmers on their field and what constraints they are facing in adopting the technologies. Effect of the adoption of these technologies on production and economics of production also needs to be investigated.
The study pertains to Akola district there in Akola and Murtizapur tahasil were selected. In all 120
farmers were selected. The primary data were collected by survey method for the year 2009-10.
At high adoption level (above 70 per cent), the gross returns and net returns at Cost 'A' and cost 'C'
were the highest. The benefit cost ratio was highest in high level of adoption groups at cost 'C' i.e.
1.61.
No. of Pages: 5 No. of Tables : 3 No. of Figs.: 3 References: 4
Keywords: Technology Adoption.
Corresponding author: [email protected]:
Research Paper
Received on: 05.05.2014 Revised on: 20.05.2014 Accepted on: 29.06.2014
International Journal on Agricultural Sciences Vol. V (Issue 2), pp. 287-295, 2014

ISSN NO. 0976-450X
IJAS 2014 • 288
2. To study the economics of production at
different levels of technologies.
METHODOLOGYThe study has been undertaken in the selected area
of Akola district. Two tahasil viz., Akola and
Murtizapur were selected for the study.
The farmers were categorized on the basis of land
holding. In all 120 farmers were selected comprising
48 farmers were selected from Small and medium
group and 24 farmers from large group. From each
tahsil six villages were selected i.e. Ugwa, Chandur,
Gusar, Agar, Ghusarwadi and Sanguldi in Akola
tahasil and Murtizapur tahasil Kanzara, Khindhed,
Agar, Shirso, Mana and Dhotara and in each villages
10 farmers sample were selected.
The study was based on primary data. The data were
collected by survey method through personal
interview.
Analytical Techniques Technologies of State Agricultural Universitites:The technologies developed by SAUs for kharif
sorghum were considered. These technologies are
given below.
1. Seed Rate 2. Nitrogen (Basal Dose) 3. Phosphorus
4. Potassium 5. Nitrogen (Top Dose) 6. Hoeing 7.
Weeding 8. Plant Protection.
Extent of adoption of technology Actual level of adoption of each item of technology
on farmers field was identified. Using the
recommended technologies developed by SAUs,
efficiency of each technology were calculated. All
efficiency score were scaled down to zero to one and
all the groups of farmers were classified as zero
adoption, greater than zero to 0.4, 0.4 to 0.8 and 0.8 to
1. Actual Adoption
Extent of Adoption = ------------------------------Recommended Technology
Development of composite Index The components of technology recommended by the
University for sorghum crop expressed in terms of
adoption score (X1, X2 …….. X8) were utilized for
developing composite index of technology adopted.
A composite index is a single numerical value
representing the net adoption of all components of
technologies whose values lies in between 0 and 1.
The Principle component analysis (PCA) approach
was used for developing composite index. The
principle components based on 8 x 8 co-rrelation
matrix of 8 component of technology were computed.
A set of 8 principle component explaining 100 per cent
of total variation of all components of recommended
technologies were considered.
Consider 8 eigen vectors in the form of 8 x 8 matrix
where rows represent variables and columns
represent eigen vectors from which weight (wi)
coefficient of component of technology say was
determined as under.
Mi Wi = --------
SMi
Where,
Wi = WeightMi = Maximum element in with raw
SMi = Sum of maximum element in with raw.
The components of technologies recommended by
the University for kh. sorghum were identified and
then the level of adoption of each component of
recommended technology by the farmer is expressed
in terms of adoption scores and same is utilized for
developing composite score of technology adoption.
In this process, weights were properly scaled so that
the composite scores lie in between 0 and 1.
Composite scores were computed for all selected
farmers using the following function.
The estimated composite adoption score (Si) is;Si = W1X1 + W2X2 + -------------- + W8X8.
Where,1. X1 = Seed Rate, 2. X2 = Nitrogen (Basal
application), 3. X3 = Phosphorus,4. X4 = Potassium, 5. X5 = Nitrogen (Top
dressed), 6. X6 = Hoeing,7. X7 = Weeding, 8. X8 = Plant Protection.
Which provides adoption index (of all components
of technologies) for each cultivator. The composite
index obtained in the process lies in between 0 & 1.
The net adoption of recommended technologies
expressed in terms of composite score of the total 120
was followed, tabulated and classified into three
International Journal on Agricultural Sciences Vol. V (Issue 2), pp. 287-295, 2014
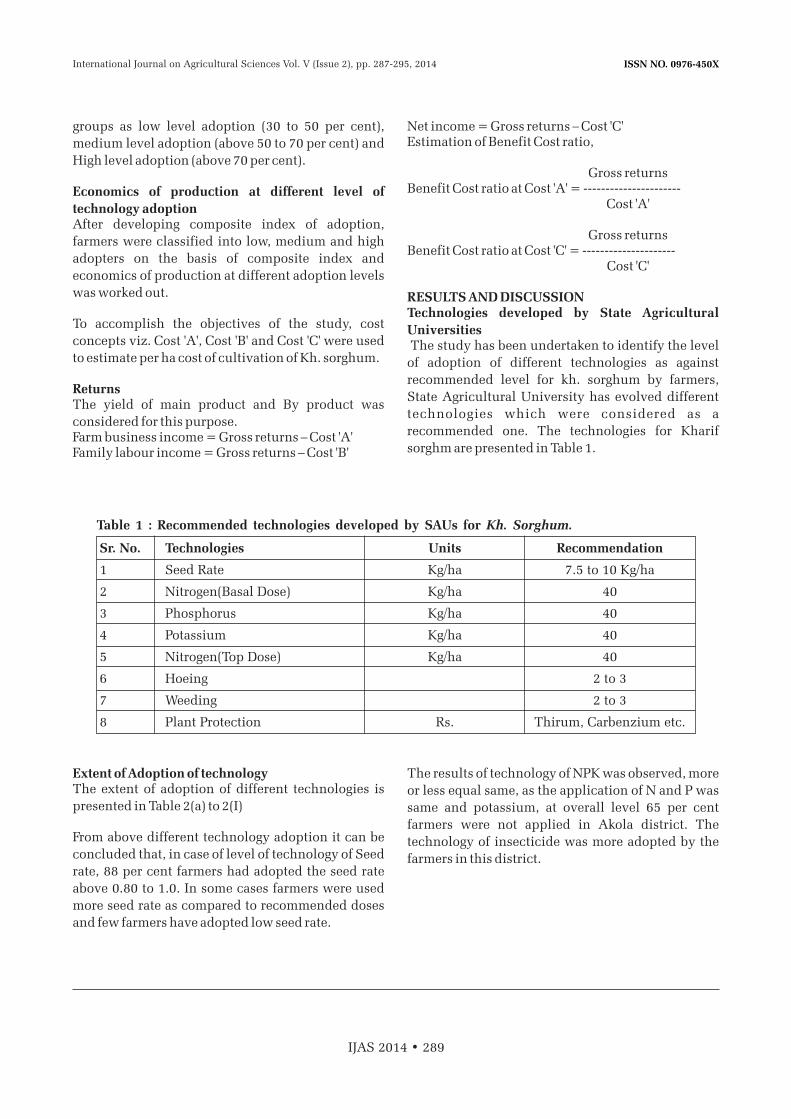
ISSN NO. 0976-450X
IJAS 2014 • 289
groups as low level adoption (30 to 50 per cent),
medium level adoption (above 50 to 70 per cent) and
High level adoption (above 70 per cent).
Economics of production at different level of
technology adoption After developing composite index of adoption,
farmers were classified into low, medium and high
adopters on the basis of composite index and
economics of production at different adoption levels
was worked out.
To accomplish the objectives of the study, cost
concepts viz. Cost 'A', Cost 'B' and Cost 'C' were used
to estimate per ha cost of cultivation of Kh. sorghum.
ReturnsThe yield of main product and By product was
considered for this purpose. Farm business income = Gross returns – Cost 'A' Family labour income = Gross returns – Cost 'B'
Net income = Gross returns – Cost 'C'Estimation of Benefit Cost ratio,
Gross returnsBenefit Cost ratio at Cost 'A' = ----------------------
Cost 'A'
Gross returnsBenefit Cost ratio at Cost 'C' = ---------------------
Cost 'C'
RESULTS AND DISCUSSIONTechnologies developed by State Agricultural
Universities The study has been undertaken to identify the level
of adoption of different technologies as against
recommended level for kh. sorghum by farmers,
State Agricultural University has evolved different
technologies which were considered as a
recommended one. The technologies for Kharif
sorghm are presented in Table 1.
Table 1 : Recommended technologies developed by SAUs for Kh. Sorghum.
Sr. No. Technologies Units Recommendation
1 Seed Rate Kg/ha 7.5 to 10 Kg/ha
2 Nitrogen(Basal Dose) Kg/ha 40
3 Phosphorus Kg/ha 40
4 Potassium Kg/ha 40
5 Nitrogen(Top Dose) Kg/ha 40
6 Hoeing 2 to 3
7 Weeding 2 to 3
8 Plant Protection Rs. Thirum, Carbenzium etc.
Extent of Adoption of technologyThe extent of adoption of different technologies is
presented in Table 2(a) to 2(I)
From above different technology adoption it can be
concluded that, in case of level of technology of Seed
rate, 88 per cent farmers had adopted the seed rate
above 0.80 to 1.0. In some cases farmers were used
more seed rate as compared to recommended doses
and few farmers have adopted low seed rate.
The results of technology of NPK was observed, more
or less equal same, as the application of N and P was
same and potassium, at overall level 65 per cent
farmers were not applied in Akola district. The
technology of insecticide was more adopted by the
farmers in this district.
International Journal on Agricultural Sciences Vol. V (Issue 2), pp. 287-295, 2014
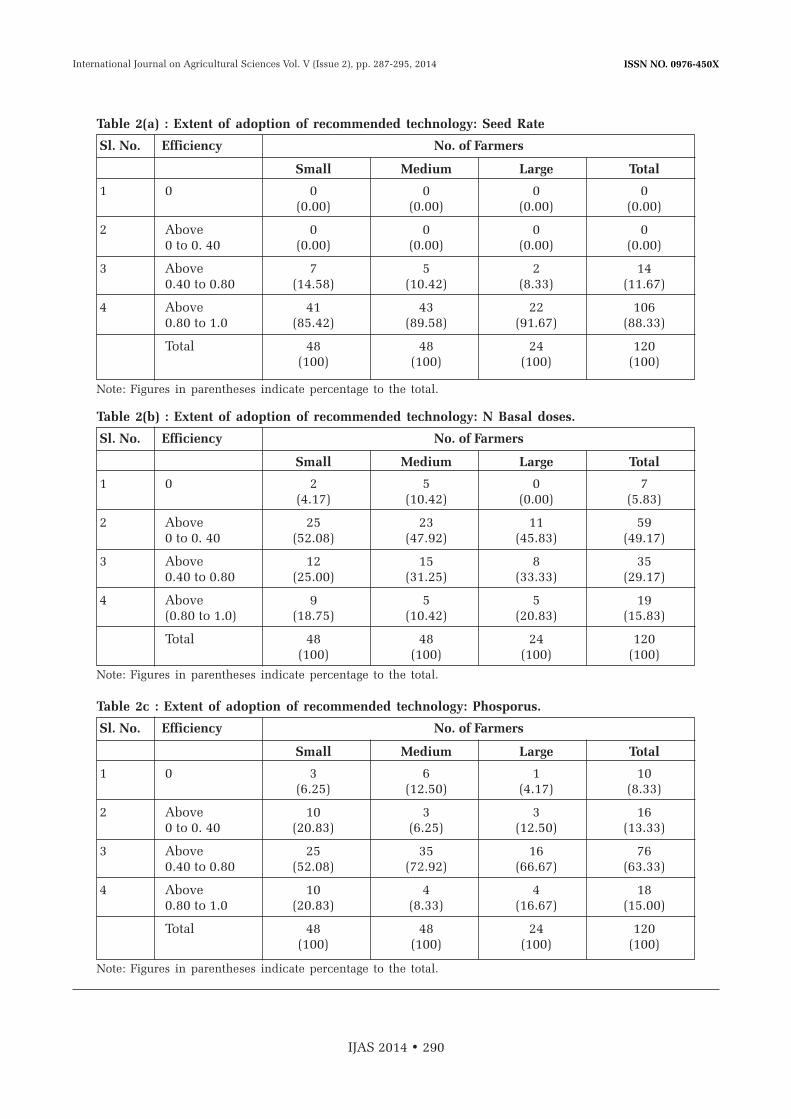
ISSN NO. 0976-450X
Table 2c : Extent of adoption of recommended technology: Phosporus.
Small Medium Large Total
1 0 3 6 1 10(6.25) (12.50) (4.17) (8.33)
2 Above 10 3 3 160 to 0. 40 (20.83) (6.25) (12.50) (13.33)
3 Above 25 35 16 760.40 to 0.80 (52.08) (72.92) (66.67) (63.33)
4 Above 10 4 4 180.80 to 1.0 (20.83) (8.33) (16.67) (15.00)
Total 48 48 24 120(100) (100) (100) (100)
Sl. No. Efficiency No. of Farmers
Note: Figures in parentheses indicate percentage to the total.
Table 2(a) : Extent of adoption of recommended technology: Seed Rate
Table 2(b) : Extent of adoption of recommended technology: N Basal doses.
Small Medium Large Total
1 0 0 0 0 0(0.00) (0.00) (0.00) (0.00)
2 Above 0 0 0 00 to 0. 40 (0.00) (0.00) (0.00) (0.00)
3 Above 7 5 2 140.40 to 0.80 (14.58) (10.42) (8.33) (11.67)
4 Above 41 43 22 1060.80 to 1.0 (85.42) (89.58) (91.67) (88.33)
Total 48 48 24 120(100) (100) (100) (100)
Small Medium Large Total
1 0 2 5 0 7(4.17) (10.42) (0.00) (5.83)
2 Above 25 23 11 590 to 0. 40 (52.08) (47.92) (45.83) (49.17)
3 Above 12 15 8 350.40 to 0.80 (25.00) (31.25) (33.33) (29.17)
4 Above 9 5 5 19(0.80 to 1.0) (18.75) (10.42) (20.83) (15.83)
Total 48 48 24 120(100) (100) (100) (100)
Sl. No.
Sl. No.
Efficiency
Efficiency
No. of Farmers
No. of Farmers
Note: Figures in parentheses indicate percentage to the total.
Note: Figures in parentheses indicate percentage to the total.
IJAS 2014 • 290
International Journal on Agricultural Sciences Vol. V (Issue 2), pp. 287-295, 2014
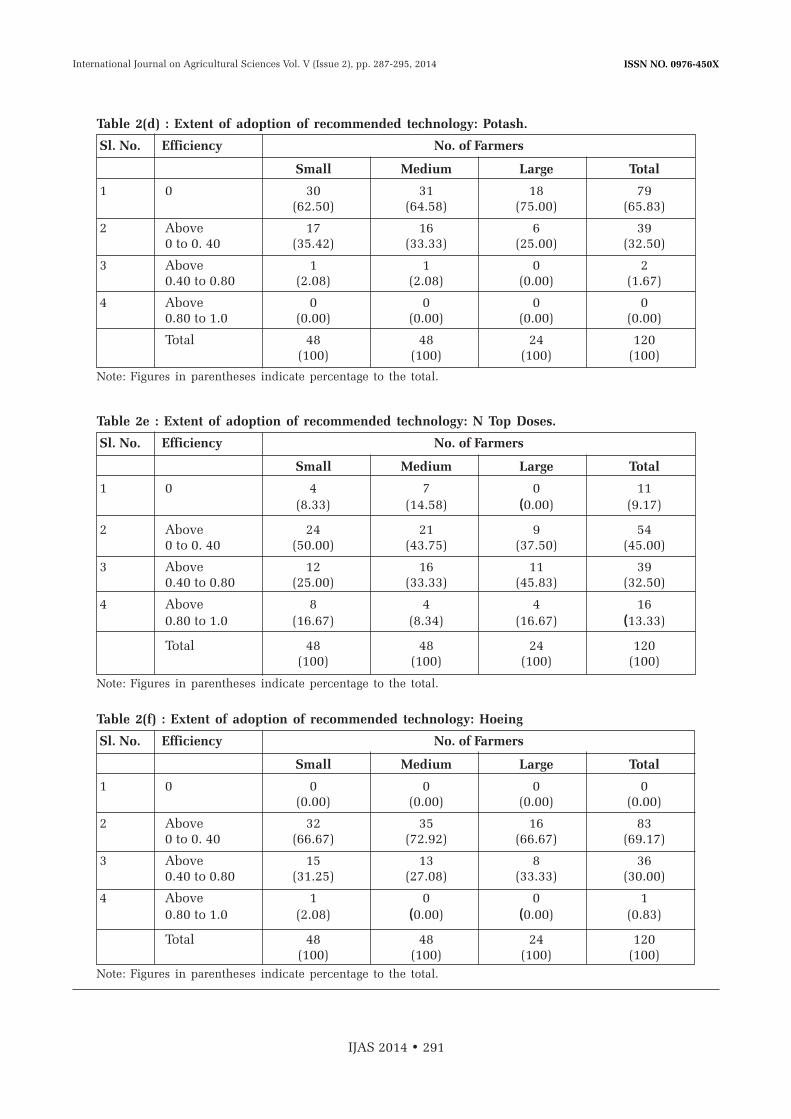
ISSN NO. 0976-450X
Table 2(f) : Extent of adoption of recommended technology: Hoeing
Small Medium Large Total
1 0 0 0 0 0(0.00) (0.00) (0.00) (0.00)
2 Above 32 35 16 830 to 0. 40 (66.67) (72.92) (66.67) (69.17)
3 Above 15 13 8 360.40 to 0.80 (31.25) (27.08) (33.33) (30.00)
4 Above 1 0 0 10.80 to 1.0 (2.08) (0.00) (0.00) (0.83)
Total 48 48 24 120(100) (100) (100) (100)
Sl. No. Efficiency No. of Farmers
Note: Figures in parentheses indicate percentage to the total.
Table 2(d) : Extent of adoption of recommended technology: Potash.
Small Medium Large Total
1 0 30 31 18 79(62.50) (64.58) (75.00) (65.83)
2 Above 17 16 6 390 to 0. 40 (35.42) (33.33) (25.00) (32.50)
3 Above 1 1 0 20.40 to 0.80 (2.08) (2.08) (0.00) (1.67)
4 Above 0 0 0 00.80 to 1.0 (0.00) (0.00) (0.00) (0.00)
Total 48 48 24 120(100) (100) (100) (100)
Sl. No. Efficiency No. of Farmers
Note: Figures in parentheses indicate percentage to the total.
Table 2e : Extent of adoption of recommended technology: N Top Doses.
Small Medium Large Total
1 0 4 7 0 11(8.33) (14.58) (0.00) (9.17)
2 Above 24 21 9 540 to 0. 40 (50.00) (43.75) (37.50) (45.00)
3 Above 12 16 11 390.40 to 0.80 (25.00) (33.33) (45.83) (32.50)
4 Above 8 4 4 160.80 to 1.0 (16.67) (8.34) (16.67) (13.33)
Total 48 48 24 120(100) (100) (100) (100)
Sl. No. Efficiency No. of Farmers
Note: Figures in parentheses indicate percentage to the total.
IJAS 2014 • 291
International Journal on Agricultural Sciences Vol. V (Issue 2), pp. 287-295, 2014
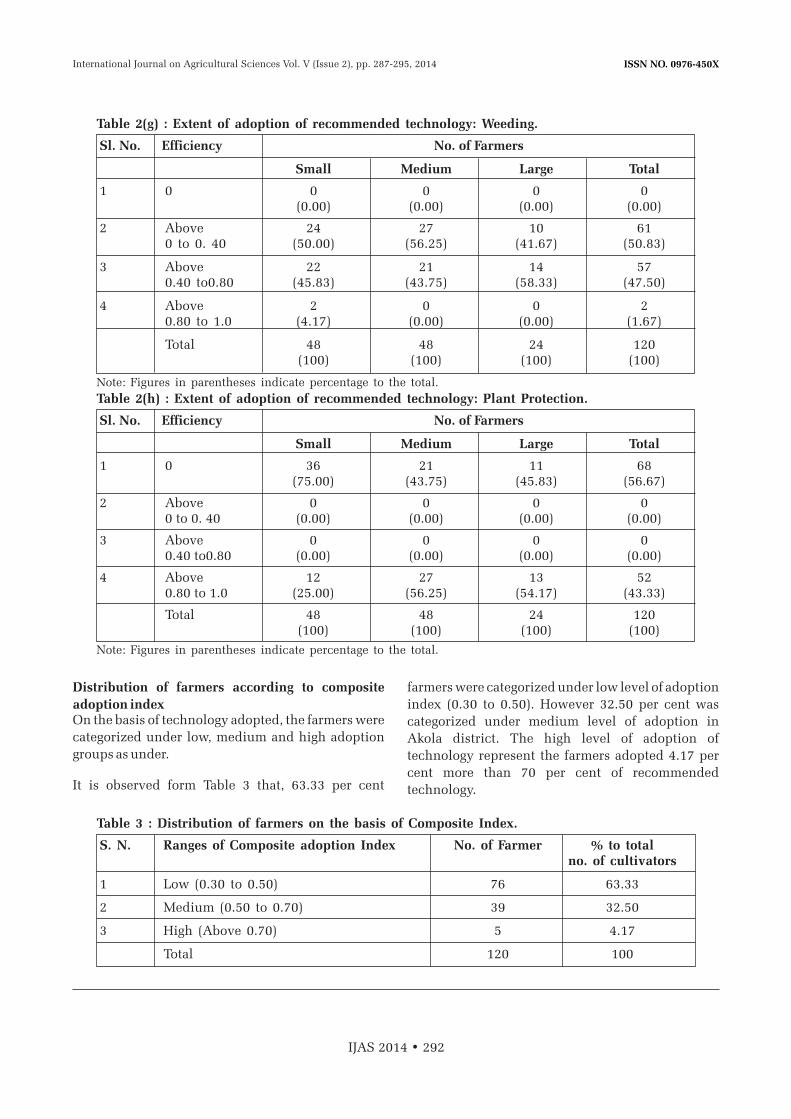
ISSN NO. 0976-450X
Note: Figures in parentheses indicate percentage to the total.
Note: Figures in parentheses indicate percentage to the total.
Table 2(g) : Extent of adoption of recommended technology: Weeding.
Table 2(h) : Extent of adoption of recommended technology: Plant Protection.
Small Medium Large Total
1 0 0 0 0 0(0.00) (0.00) (0.00) (0.00)
2 Above 24 27 10 610 to 0. 40 (50.00) (56.25) (41.67) (50.83)
3 Above 22 21 14 570.40 to0.80 (45.83) (43.75) (58.33) (47.50)
4 Above 2 0 0 20.80 to 1.0 (4.17) (0.00) (0.00) (1.67)
Total 48 48 24 120(100) (100) (100) (100)
Small Medium Large Total
1 0 36 21 11 68(75.00) (43.75) (45.83) (56.67)
2 Above 0 0 0 00 to 0. 40 (0.00) (0.00) (0.00) (0.00)
3 Above 0 0 0 00.40 to0.80 (0.00) (0.00) (0.00) (0.00)
4 Above 12 27 13 520.80 to 1.0 (25.00) (56.25) (54.17) (43.33)
Total 48 48 24 120(100) (100) (100) (100)
Sl. No.
Sl. No.
Efficiency
Efficiency
No. of Farmers
No. of Farmers
Distribution of farmers according to composite
adoption indexOn the basis of technology adopted, the farmers were
categorized under low, medium and high adoption
groups as under.
It is observed form Table 3 that, 63.33 per cent
farmers were categorized under low level of adoption
index (0.30 to 0.50). However 32.50 per cent was
categorized under medium level of adoption in
Akola district. The high level of adoption of
technology represent the farmers adopted 4.17 per
cent more than 70 per cent of recommended
technology.
IJAS 2014 • 292
Table 3 : Distribution of farmers on the basis of Composite Index.
S. N. Ranges of Composite adoption Index No. of Farmer % to total no. of cultivators
1 Low (0.30 to 0.50) 76 63.33
2 Medium (0.50 to 0.70) 39 32.50
3 High (Above 0.70) 5 4.17
Total 120 100
International Journal on Agricultural Sciences Vol. V (Issue 2), pp. 287-295, 2014

ISSN NO. 0976-450X
Per hectare input utilization The pattern of utilization of resources by farmers indicate the degree of management of resources, their choice and decision making. Besides this, it indicates the local level of technology adopted by the farmer. Human labour, bullock labour, seed, manures and fertilizers for Kh. sorghum are the basic types of resources used in Akola district.
An attempt was made to measure the extent of labour use, according, labour utilization for a crop depends on the intensity of preparatory and cultural operations done for raising crop. At overall level, per ha 84.93 human labour days are employed for Kh. sorghum. Among the total human labour employed, proportion of the female labour was more.
Total bullock labour employed per hectare worked out to 13.23 days, 12.54 days and 13.80 days for low medium and high adoption group respectively. The requirement of bullock labour is more or less equal.
Seed is the important input in crop production. Per hectare recommended seed rate is 7.5 to 10 kg/ha. It is observed from the table that utilization of seed by growers was close to recommended level in all the studied size groups.
Utilization of FYM and fertilizers are important components of modern technology. Recommended dose per hectare for FYM and fertilizer in the form of Nitrogen, phosphorous and potassium is 30 qt/ha and 80:40:40 kg per hectare respectively.
In respect of manure as against recommended dose of 30 qt per hectare the actual level of use for low, medium and high adoption groups were 10.55, 13.40 and 20.20 qt/ha, respectively. In case of FYM, it was applied maximum by the farmers. In respect of fertilizer application it is observed that the utilization of NPK was lower as compared to recomanded dose.
IJAS 2014 • 293
Table 4 : Per hectare Physical Inputs used for Kharif Sorghum.
S. N. Particular Unit Low Medium High Overall
1 Total Human Labour Days 85.47 79.36 89.95 84.93
Male Days 38.85 39.19 43.3 40.45
Female Days 46.62 40.17 46.65 44.48
2 Bullock Labour Days 13.23 12.54 13.8 13.19
3 Machine Labour Hrs. 8.66 7 8.8 8.15
4 Seed Kgs. 8.22 8.59 10.46 9.09
5 Manuring Qtls. 10.55 13.4 20.2 14.72
6 Fertilizer N Kg 24.2 55.28 64.4 47.96
P Kg 22.41 21.46 29.9 24.59
K Kg 2.72 4.26 6.22 4.4
Table 5 : Cost of Cultivation of Kharif Sorghum
S. N. Particular Low Medium High Overall
1 Hired Human Labour 2652.12 2239.05 2004.85 2298.67(19.08) (15.69) (12.57) (15.63)
2 Bullock Labour 1624.07 1531.47 1562.42 1572.6(11.69) (10.73) (9.80) (10.69)
3 Machine Labour 1167.71 1045.05 1090.19 1100.98(8.40) (7.32) (6.84) (7.49)
4 Seed 532.68 575.28 588.79 565.58(3.83) (4.03) (3.69) (3.85)
International Journal on Agricultural Sciences Vol. V (Issue 2), pp. 287-295, 2014

ISSN NO. 0976-450X
IJAS 2014 • 294
as a whole was Rs. 14705.12, the Cost 'A' which
corresponds, to the direct production expenses was
Rs. 8800.38. In terms of percentage cost 'A' accounts
to 59.85 per cent of the total cost. Hired human
labour was the major item of cost which accounts to
15.63 per cent of the total cost. Fertilizer was also an
important cost item in Kh. sorghum cultivation
which accounts to 7.86 per cent of the total cost.
Another important cost were interest on fixed capital
4.67 per cent, bullock labour 10.69 per cent, Seed
3.85 per cent, manures 7.51 per cent, and
depreciation cost 1.40 per cent, interest on working
capital 3.28 per cent. Family labour cost was 9.97 per
cent of the total cost.
Utilization of machine labour was more (8.15 days) in
all groups. From the foregoing discussion, it can be
concluded that, the large group of adopters used the
highest input or resources as compared to other groups.
Per hectare cost of cultivation The cost of cultivation has been worked out by using
standard cost concepts i.e. cost 'A', cost 'B' and cost
'C'. The purpose of calculating these costs is to
workout profitability of Kh. sorghum on the basis of
direct costs and imputed cost.
It is revealed from Table 5 that per hectare total cost
of cultivation of Kh. sorghum (cost 'C') for the sample
5 FYM 751.14 1139.98 1420.00 1103.71(5.40) (7.99) (8.90) (7.51)
6 Fertilizer N 354.67 673.61 934.30 654.19(2.55) (4.72) (5.86) (4.45)
P 400.71 375.14 595.76 457.20(2.88) (2.63) (3.74) (3.11)
K 32.62 44.76 54.94 44.11(0.23) (0.31) (0.34) (0.30)
7 Plant Protection 60.11 111.79 191.74 121.21(0.43) (0.78) (1.20) (0.82)
8 Repairing Charges 119.06 123.56 125.17 122.59(0.86) (0.87) (0.78) (0.83)
9 Interest on Working 461.69 471.58 514.09 482.45Capital (3.32) (3.31) (3.22) (3.28)
10 Depreciation 193.30 183.64 239.40 205.45(1.39) (1.29) (1.50) (1.40)
11 Land Revenue 62.98 67.86 83.87 71.57(0.45) (0.48) (0.53) (0.49)
12 Cost ‘A’ 8412.85 8582.78 9405.52 8800.38(60.53) (60.15) (58.97) (59.85)
13 Interest on Fixed l 231.47 553.15 1273.59 686.07Capital (1.67) (3.88) (7.99) (4.67)
14 Rental value of land 3358.34 3706.26 4195.13 3675.46(24.16) (25.98) (26.30) (24.99)
15 Cost ‘B’ 12002.66 12842.19 14874.24 13239.69(86.36) (90.00) (93.26) (90.03)
16 Family Human labour 1894.97 1426.30 1075.00 1465.42(13.64) (10.00) (6.74) (9.97)
17 Cost ‘C’ 13897.62 14268.49 15949.24 14705.12(100) (100) (100) (100)
(Figures in parentheses indicate percentage to the total cost)
International Journal on Agricultural Sciences Vol. V (Issue 2), pp. 287-295, 2014
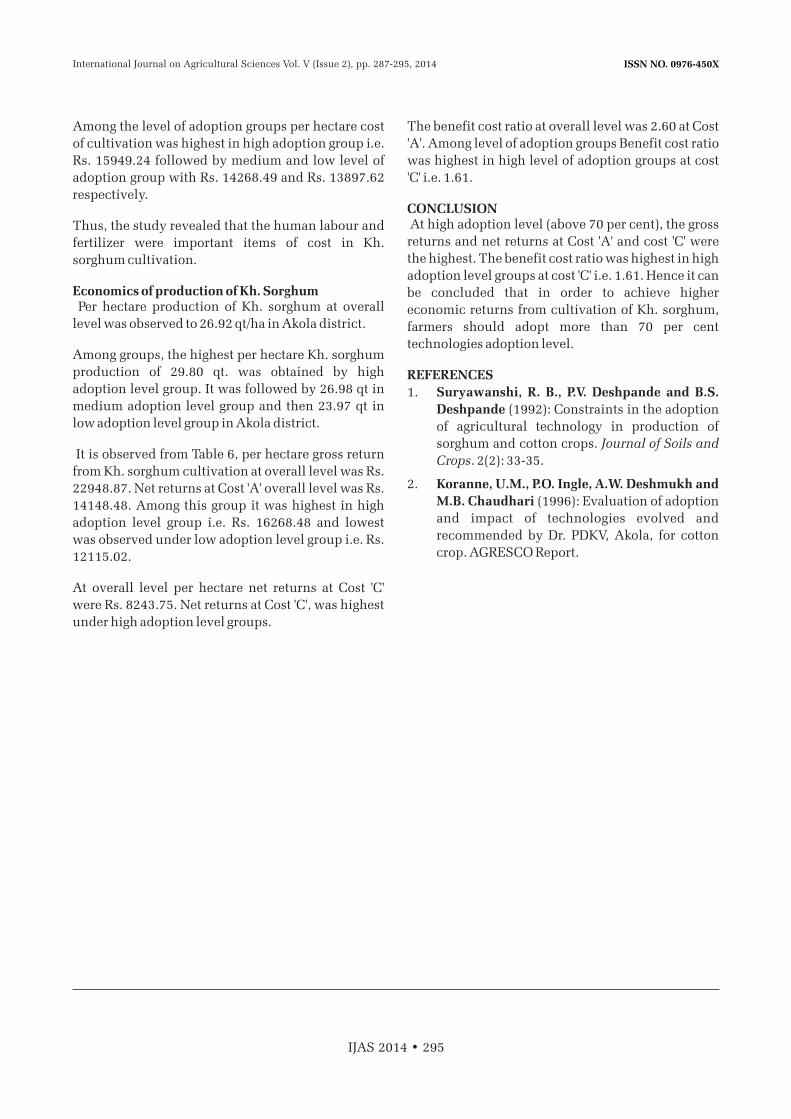
ISSN NO. 0976-450X
IJAS 2014 • 295
Among the level of adoption groups per hectare cost
of cultivation was highest in high adoption group i.e.
Rs. 15949.24 followed by medium and low level of
adoption group with Rs. 14268.49 and Rs. 13897.62
respectively.
Thus, the study revealed that the human labour and
fertilizer were important items of cost in Kh.
sorghum cultivation.
Economics of production of Kh. Sorghum Per hectare production of Kh. sorghum at overall
level was observed to 26.92 qt/ha in Akola district.
Among groups, the highest per hectare Kh. sorghum
production of 29.80 qt. was obtained by high
adoption level group. It was followed by 26.98 qt in
medium adoption level group and then 23.97 qt in
low adoption level group in Akola district.
It is observed from Table 6, per hectare gross return
from Kh. sorghum cultivation at overall level was Rs.
22948.87. Net returns at Cost 'A' overall level was Rs.
14148.48. Among this group it was highest in high
adoption level group i.e. Rs. 16268.48 and lowest
was observed under low adoption level group i.e. Rs.
12115.02.
At overall level per hectare net returns at Cost 'C'
were Rs. 8243.75. Net returns at Cost 'C', was highest
under high adoption level groups.
The benefit cost ratio at overall level was 2.60 at Cost
'A'. Among level of adoption groups Benefit cost ratio
was highest in high level of adoption groups at cost
'C' i.e. 1.61.
CONCLUSION At high adoption level (above 70 per cent), the gross
returns and net returns at Cost 'A' and cost 'C' were
the highest. The benefit cost ratio was highest in high
adoption level groups at cost 'C' i.e. 1.61. Hence it can
be concluded that in order to achieve higher
economic returns from cultivation of Kh. sorghum,
farmers should adopt more than 70 per cent
technologies adoption level.
REFERENCES
1. Suryawanshi, R. B., P.V. Deshpande and B.S.
Deshpande (1992): Constraints in the adoption
of agricultural technology in production of
sorghum and cotton crops. Journal of Soils and
Crops. 2(2): 33-35.
2. Koranne, U.M., P.O. Ingle, A.W. Deshmukh and
M.B. Chaudhari (1996): Evaluation of adoption
and impact of technologies evolved and
recommended by Dr. PDKV, Akola, for cotton
crop. AGRESCO Report.
International Journal on Agricultural Sciences Vol. V (Issue 2), pp. 287-295, 2014

ISSN NO. 0976-450X
IJAS 2014 • 296

ISSN NO. 0976-450X
EFFICACY OF BOTANICALS AGAINST SOYBEAN DEFOLIATORS
1 2 3S. V. Nagrale , M. J. Deshmukh , V. A. Tiwari 4 5M. S. Joshi and Debashree Bhattacharjee
1&2Department of Agriculture Entomology,3 4Agricultural Prices and Costs Scheme, Department of Plant Pathology
Department of Plant Pathology,5
Dr. Panjabrao Deshmukh Krishi Vidyapeeth, Akola, Maharashtra
INTRODUCTIONSoybean (Glycine max L.) is one of the miracle 'Golden
th bean' of the 20 century, originated in China. Soybean
as specific remedy for the proper functioning of the
heart, liver, kidneys and stomach, as well as the value
of soybean sauce, milk, curd, paste and sprouts, not
only for food but also to treat various diseases and
body ailments. The principal early use of soybean was
as a forage crop (Probst and Judd, 1973).
Soybean possess a very high nutritional value, on an
average it contains 20 per cent oil, 40 per cent protein,
Vit A, B, C,D, E and K along with 0.69 per cent
phosphorus, 0.112 per cent iron and 0.024 per cent
calcium. (Bishnoi, 2005).
During kharif 2009 area sown under soybean in Maharashtra was 30.320 lakh ha. The estimated yield per hectare and total production of soybean would be around 982 kg and 29.774 lakh MT. And during kharif 2009 area sown under soybean in Vidarbbha region was 18.951Lakh ha and the estimated yield per hectare was 996.5 kg and total production of soybean would be around 18.976 lakh MT (Anonymous, 2009).
Plant products are one of the eco-safe tools of the
IPM, botanical pesticides have less side effects and
more insect control properties. In view of many
environmental problems caused by chemical
pesticides, farmers should use these ecofriendly pest
management tactics.
ABSTRACT
Experiment was carried out at field of Department of Agricultural Entomology, Dr. PDKV, Akola in kharif 2009 for efficacy of some plant extracts against soybean defoliators viz. tobaco leaf eating caterpillar, semilooper and hairy caterpillar. Eight treatments were used, consisting of botanicals and insecticide viz. Karanj leaves extract 5%, Neem leaves extract 5%, Rui leaves extract 5%, Ghaneri leaves extract 5%, Karanj seed extract 5%, Neem seed extract 5% and Quinalphos 25 EC 0.05% and untreated control. The observations on defoliators was recorded on randomly selected one meter row
th thlength at five places from each plot, before 24 hours and after 7 and 14 days after application of treatment. The obtained data were statistically analyzed with proper transformation. Quinalphos 25 EC 0.05% was highly effective treatment followed by Neem seed extract 5%, Neem leaves extract 5% and Karanj seed extract 5%and reccorded against soybean defoliators. The plots treated with Quinalphos 25 EC 0.05% recorded maximum yield (2013 kg/ha) of soybean followed by Neem seed extract 5% and Neem leaves extract 5% recording 1666 kg/ha and 1458 kg/ha and they were significantly superior over rest of the treatments. As well as they were recording highest incremental cost benefit ratio.
No. of Pages: 7 No. of Tables : 5 References: 16
Keywords: Botanicals, Soybean Defoliators.
Corresponding author: [email protected]:
Research Paper
Received on: 05.05.2014 Revised on: 20.05.2014 Accepted on: 29.06.2014
International Journal on Agricultural Sciences Vol. V (Issue 2), pp. 297-303, 2014

ISSN NO. 0976-450X
IJAS 2014 • 298
Farmers are facing severe problem of Lepidopteran
defoliators on soybean. They generally use chemical
pesticides to control the pest problem, however, it
gives a hazardous effect on natural ecosystem.
Therefore the promotion and development of
microbial control agents and botanicals are the
ecofriendly and economical method of pest
management which helps to minimize the use of
synthetic pesticides.
MATERIAL AND METHODS The present investigation entitled “Evaluation of
some plant extracts against major pests of soybean”
was planned to carry out the studies on the effect of
different plant extracts against major pests on
soybean under field condition at Department of
Agricultural Entomology, Dr. Panjabrao Deshmukh
Krishi Vidyapeeth, Akola, Maharashtra, India during
kharif season 2009.
Details of materials used and the methods followed
during the course of studies are described herewith.
Details of experiment
1. Design : Randomized Block
Design (RBD)
2. Date of sowing : 01.07.2009
3. Season : Kharif 2009
4. Number of
treatments : Eight ( 8)
5. Number of
replications : Three (3)
6. Total number
of plots : 24
7. Variety : JS-335
8. Fertilizer dose : 30:75:00 kg NPK/ha
9. Plot size : Gross=3 m x 2.4 m
Net=2.40m x 2.24 m
10. Total experimental : 22.7 m x 12 m
area
11. Spacing : Row to Row = 30 cm
Plant to plant = 8 cm
12. Marginal spacing : Between replication
= 1.5 m
Between treatments
= 0.5 m
Table 1: Treatment details
Details of materials used and the methods followed during the course of studies are described herewith.
Treatment No. Treatments Dosage
T Pongamia pinnata (Karanj) leaves extract + dispersing agent 5%1
T Azadirachta indica (Neem) leaves extract + dispersing agent 5%2
T Calotropis procera (Rui) leaves extract + dispersing agent 5%3
T Lantana camera (Ghaneri) leaves extract + dispersing agent 5%4
T Karanj seed extract + dispersing agent 5%5
T Neem seed extract + dispersing agent 5%6
T Quinalphos 25 EC (for std. check) 0.05%7
T Untreated control 8
RESULTS AND DISCUSSIONIn the present study, eight treatments consisting of
Karanj leaves extract 5%, Neem leaves extract 5%,
Rui leaves extracts 5%, Ghaneri leaves extract 5%,
Karanj seed extract 5%, Neem seed extract 5%,
Quinalphos 25 EC 0.05% and untreated control were
evaluated for their efficacy against soybean
defoliator i.e. tobacco leaf eating caterpillar, green
semilooper and hairy caterpillar. The per cent larval
reduction of soybean defoliators was recorded at 7
and 14 days after each application and the data were
presented in table 2, 3 and 4.
International Journal on Agricultural Sciences Vol. V (Issue 2), pp. 297-303, 2014
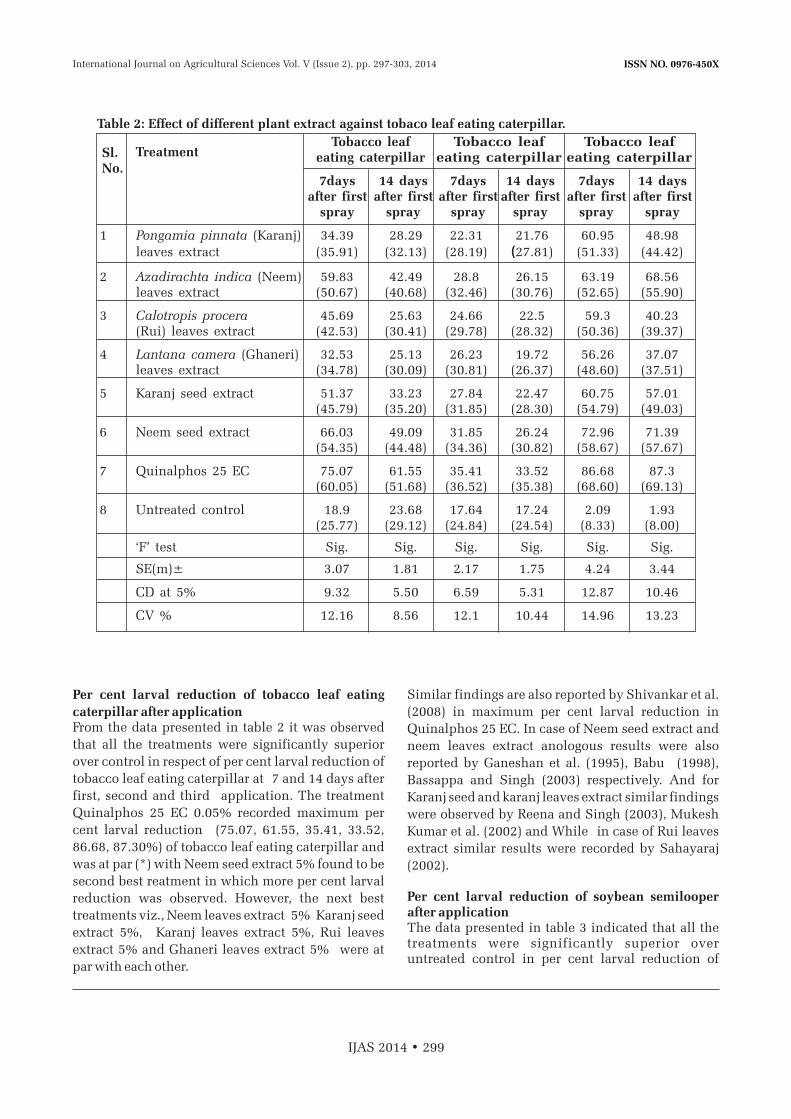
ISSN NO. 0976-450X
IJAS 2014 • 299
Per cent larval reduction of tobacco leaf eating
caterpillar after applicationFrom the data presented in table 2 it was observed
that all the treatments were significantly superior
over control in respect of per cent larval reduction of
tobacco leaf eating caterpillar at 7 and 14 days after
first, second and third application. The treatment
Quinalphos 25 EC 0.05% recorded maximum per
cent larval reduction (75.07, 61.55, 35.41, 33.52,
86.68, 87.30%) of tobacco leaf eating caterpillar and
was at par (*) with Neem seed extract 5% found to be
second best reatment in which more per cent larval
reduction was observed. However, the next best
treatments viz., Neem leaves extract 5% Karanj seed
extract 5%, Karanj leaves extract 5%, Rui leaves
extract 5% and Ghaneri leaves extract 5% were at
par with each other.
Similar findings are also reported by Shivankar et al.
(2008) in maximum per cent larval reduction in
Quinalphos 25 EC. In case of Neem seed extract and
neem leaves extract anologous results were also
reported by Ganeshan et al. (1995), Babu (1998),
Bassappa and Singh (2003) respectively. And for
Karanj seed and karanj leaves extract similar findings
were observed by Reena and Singh (2003), Mukesh
Kumar et al. (2002) and While in case of Rui leaves
extract similar results were recorded by Sahayaraj
(2002).
Per cent larval reduction of soybean semilooper after applicationThe data presented in table 3 indicated that all the treatments were significantly superior over untreated control in per cent larval reduction of
Table 2: Effect of different plant extract against tobaco leaf eating caterpillar.
1 Pongamia pinnata (Karanj) 34.39 28.29 22.31 21.76 60.95 48.98leaves extract (35.91) (32.13) (28.19) (27.81) (51.33) (44.42)
2 Azadirachta indica (Neem) 59.83 42.49 28.8 26.15 63.19 68.56leaves extract (50.67) (40.68) (32.46) (30.76) (52.65) (55.90)
3 Calotropis procera 45.69 25.63 24.66 22.5 59.3 40.23(Rui) leaves extract (42.53) (30.41) (29.78) (28.32) (50.36) (39.37)
4 Lantana camera (Ghaneri) 32.53 25.13 26.23 19.72 56.26 37.07leaves extract (34.78) (30.09) (30.81) (26.37) (48.60) (37.51)
5 Karanj seed extract 51.37 33.23 27.84 22.47 60.75 57.01(45.79) (35.20) (31.85) (28.30) (54.79) (49.03)
6 Neem seed extract 66.03 49.09 31.85 26.24 72.96 71.39(54.35) (44.48) (34.36) (30.82) (58.67) (57.67)
7 Quinalphos 25 EC 75.07 61.55 35.41 33.52 86.68 87.3(60.05) (51.68) (36.52) (35.38) (68.60) (69.13)
8 Untreated control 18.9 23.68 17.64 17.24 2.09 1.93(25.77) (29.12) (24.84) (24.54) (8.33) (8.00)
‘F’ test Sig. Sig. Sig. Sig. Sig. Sig.
SE(m)± 3.07 1.81 2.17 1.75 4.24 3.44
CD at 5% 9.32 5.50 6.59 5.31 12.87 10.46
CV % 12.16 8.56 12.1 10.44 14.96 13.23
TreatmentSl. No.
Tobacco leaf eating caterpillar
7daysafter first
spray
7daysafter first
spray
7daysafter first
spray
14 daysafter first
spray
14 daysafter first
spray
14 daysafter first
spray
Tobacco leaf eating caterpillar
Tobacco leaf eating caterpillar
International Journal on Agricultural Sciences Vol. V (Issue 2), pp. 297-303, 2014
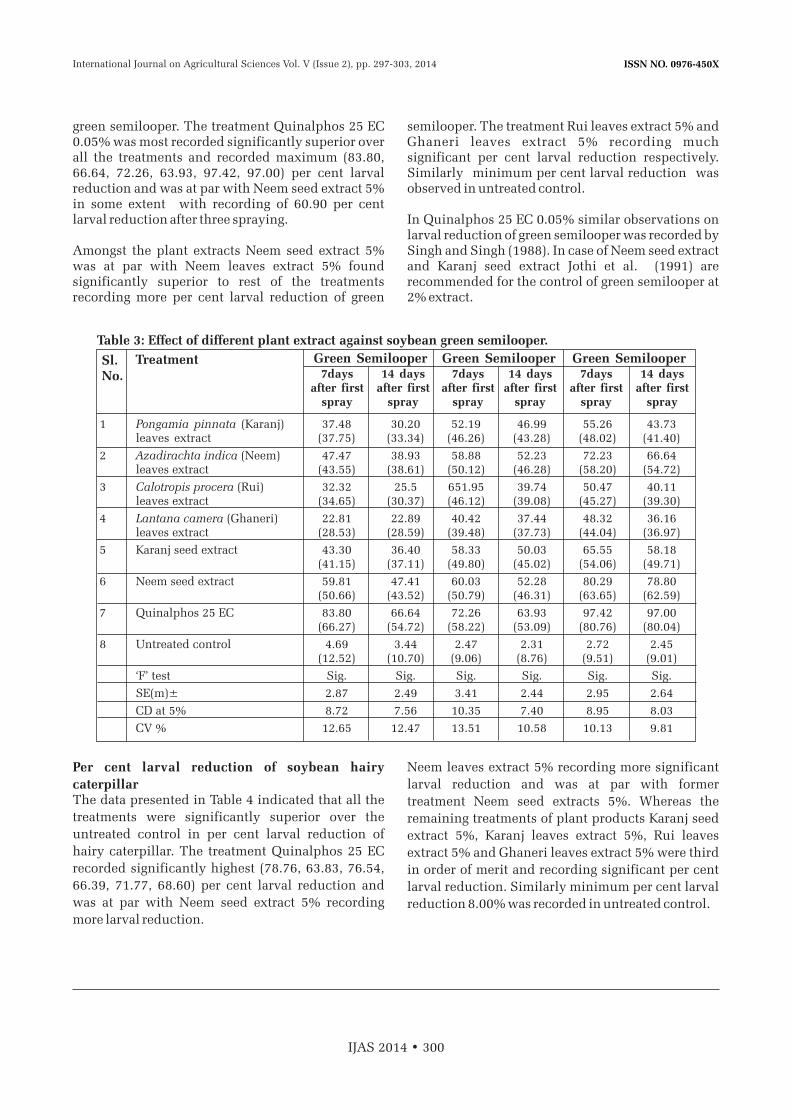
ISSN NO. 0976-450X
IJAS 2014 • 300
green semilooper. The treatment Quinalphos 25 EC 0.05% was most recorded significantly superior over all the treatments and recorded maximum (83.80, 66.64, 72.26, 63.93, 97.42, 97.00) per cent larval reduction and was at par with Neem seed extract 5% in some extent with recording of 60.90 per cent larval reduction after three spraying.
Amongst the plant extracts Neem seed extract 5% was at par with Neem leaves extract 5% found significantly superior to rest of the treatments recording more per cent larval reduction of green
semilooper. The treatment Rui leaves extract 5% and Ghaneri leaves extract 5% recording much significant per cent larval reduction respectively. Similarly minimum per cent larval reduction was observed in untreated control.
In Quinalphos 25 EC 0.05% similar observations on larval reduction of green semilooper was recorded by Singh and Singh (1988). In case of Neem seed extract and Karanj seed extract Jothi et al. (1991) are recommended for the control of green semilooper at 2% extract.
Table 3: Effect of different plant extract against soybean green semilooper.
1 Pongamia pinnata (Karanj) 37.48 30.20 52.19 46.99 55.26 43.73leaves extract (37.75) (33.34) (46.26) (43.28) (48.02) (41.40)
2 Azadirachta indica (Neem) 47.47 38.93 58.88 52.23 72.23 66.64leaves extract (43.55) (38.61) (50.12) (46.28) (58.20) (54.72)
3 Calotropis procera (Rui) 32.32 25.5 651.95 39.74 50.47 40.11leaves extract (34.65) (30.37) (46.12) (39.08) (45.27) (39.30)
4 Lantana camera (Ghaneri) 22.81 22.89 40.42 37.44 48.32 36.16leaves extract (28.53) (28.59) (39.48) (37.73) (44.04) (36.97)
5 Karanj seed extract 43.30 36.40 58.33 50.03 65.55 58.18(41.15) (37.11) (49.80) (45.02) (54.06) (49.71)
6 Neem seed extract 59.81 47.41 60.03 52.28 80.29 78.80(50.66) (43.52) (50.79) (46.31) (63.65) (62.59)
7 Quinalphos 25 EC 83.80 66.64 72.26 63.93 97.42 97.00(66.27) (54.72) (58.22) (53.09) (80.76) (80.04)
8 Untreated control 4.69 3.44 2.47 2.31 2.72 2.45(12.52) (10.70) (9.06) (8.76) (9.51) (9.01)
‘F’ test Sig. Sig. Sig. Sig. Sig. Sig.
SE(m)± 2.87 2.49 3.41 2.44 2.95 2.64
CD at 5% 8.72 7.56 10.35 7.40 8.95 8.03
CV % 12.65 12.47 13.51 10.58 10.13 9.81
TreatmentSl. No.
Green Semilooper7days
after firstspray
7daysafter first
spray
7daysafter first
spray
14 daysafter first
spray
14 daysafter first
spray
14 daysafter first
spray
Green Semilooper Green Semilooper
Per cent larval reduction of soybean hairy
caterpillarThe data presented in Table 4 indicated that all the
treatments were significantly superior over the
untreated control in per cent larval reduction of
hairy caterpillar. The treatment Quinalphos 25 EC
recorded significantly highest (78.76, 63.83, 76.54,
66.39, 71.77, 68.60) per cent larval reduction and
was at par with Neem seed extract 5% recording
more larval reduction.
Neem leaves extract 5% recording more significant
larval reduction and was at par with former
treatment Neem seed extracts 5%. Whereas the
remaining treatments of plant products Karanj seed
extract 5%, Karanj leaves extract 5%, Rui leaves
extract 5% and Ghaneri leaves extract 5% were third
in order of merit and recording significant per cent
larval reduction. Similarly minimum per cent larval
reduction 8.00% was recorded in untreated control.
International Journal on Agricultural Sciences Vol. V (Issue 2), pp. 297-303, 2014
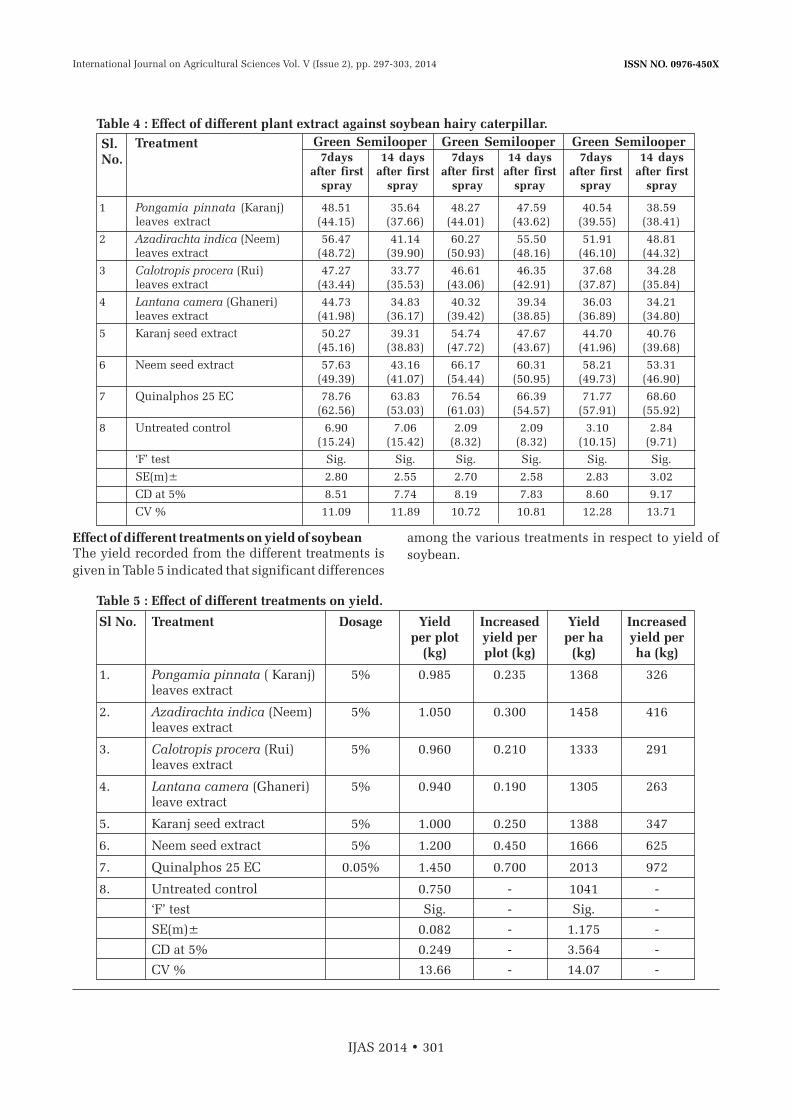
ISSN NO. 0976-450X
IJAS 2014 • 301
Effect of different treatments on yield of soybean The yield recorded from the different treatments is
given in Table 5 indicated that significant differences
among the various treatments in respect to yield of
soybean.
Table 4 : Effect of different plant extract against soybean hairy caterpillar.
1 Pongamia pinnata (Karanj) 48.51 35.64 48.27 47.59 40.54 38.59leaves extract (44.15) (37.66) (44.01) (43.62) (39.55) (38.41)
2 Azadirachta indica (Neem) 56.47 41.14 60.27 55.50 51.91 48.81leaves extract (48.72) (39.90) (50.93) (48.16) (46.10) (44.32)
3 Calotropis procera (Rui) 47.27 33.77 46.61 46.35 37.68 34.28leaves extract (43.44) (35.53) (43.06) (42.91) (37.87) (35.84)
4 Lantana camera (Ghaneri) 44.73 34.83 40.32 39.34 36.03 34.21leaves extract (41.98) (36.17) (39.42) (38.85) (36.89) (34.80)
5 Karanj seed extract 50.27 39.31 54.74 47.67 44.70 40.76(45.16) (38.83) (47.72) (43.67) (41.96) (39.68)
6 Neem seed extract 57.63 43.16 66.17 60.31 58.21 53.31(49.39) (41.07) (54.44) (50.95) (49.73) (46.90)
7 Quinalphos 25 EC 78.76 63.83 76.54 66.39 71.77 68.60(62.56) (53.03) (61.03) (54.57) (57.91) (55.92)
8 Untreated control 6.90 7.06 2.09 2.09 3.10 2.84(15.24) (15.42) (8.32) (8.32) (10.15) (9.71)
‘F’ test Sig. Sig. Sig. Sig. Sig. Sig.
SE(m)± 2.80 2.55 2.70 2.58 2.83 3.02
CD at 5% 8.51 7.74 8.19 7.83 8.60 9.17
CV % 11.09 11.89 10.72 10.81 12.28 13.71
TreatmentSl. No.
Green Semilooper7days
after firstspray
7daysafter first
spray
7daysafter first
spray
14 daysafter first
spray
14 daysafter first
spray
14 daysafter first
spray
Green Semilooper Green Semilooper
Table 5 : Effect of different treatments on yield.
Sl No. Treatment Dosage Yield Increased Yield Increased per plot yield per per ha yield per
(kg) plot (kg) (kg) ha (kg)
1. Pongamia pinnata ( Karanj) 5% 0.985 0.235 1368 326leaves extract
2. Azadirachta indica (Neem) 5% 1.050 0.300 1458 416leaves extract
3. Calotropis procera (Rui) 5% 0.960 0.210 1333 291leaves extract
4. Lantana camera (Ghaneri) 5% 0.940 0.190 1305 263leave extract
5. Karanj seed extract 5% 1.000 0.250 1388 347
6. Neem seed extract 5% 1.200 0.450 1666 625
7. Quinalphos 25 EC 0.05% 1.450 0.700 2013 972
8. Untreated control 0.750 - 1041 -
‘F’ test Sig. - Sig. -
SE(m)± 0.082 - 1.175 -
CD at 5% 0.249 - 3.564 -
CV % 13.66 - 14.07 -
International Journal on Agricultural Sciences Vol. V (Issue 2), pp. 297-303, 2014

ISSN NO. 0976-450X
IJAS 2014 • 302
The significantly highest yield (2013 kg/ha) was
obtained due to application of Quinalphos 25 EC at
0.05% and it followed by Neem seed extract 5% and
Neem leaves extract 5% in which 1666 and 1458
kg/ha yield of soybean was recorded and these
treatments were found significantly superior to
Karanj seed extract 5%, Karanj leaves extract 5%, Rui
leaves extract 5% and Ghaneri leaves extract 5% in
which 1388, 1368, 1333 and 1305 kg/ha yield of
soybean were recorded respectively. Amongst these
treatments Karanj seed extract and Karanj leaves
extract were at par with each other. Significantly the
lowest (1061kg/ha) yield was recorded in untreated
control and it was least significant over all the
treatments.
Singh and Singh (1988) studied the field efficacy of
11 insecticides against grey semilooper and found
that Fenvalerate and Quinalphos were highly toxic
against grey semilooper and the crop was remained
free from larval population of grey semilooper and
also yielded highest quantity of grain yield (1700
kg/ha). Hence these findings are analogous to the
present investigation and gave support to the data.
Incremental cost benefit ratio of different
treatmentsConsidering the costs of inputs for different
treatments and corresponding yield obtained from
the different plots treatment, the incremental cost
benefit ratio (ICBR) of all treatments were worked
out at prevailing market rates and presenting the data
revealed that the Quinalphos 25 EC 0.05% was the
most economic and recording highest ICBR of 1:7.69
and it followed by Neem seed extract 5% and Neem
leaves extract 5% recording 1: 5.41 and 1:3.63 ICBR
respectively. The next better economic treatments
were Karanj leaves extract 5% and Rui leaves extract
5% recording ICBR 1:2.00 and 1:1.68 respectively.
In present study the various treatments Quinalphos
25 EC 0.05 was found to be most economic recording
highest ICBR 1:7.69 and it followed by Neem seed
extract 5% and Neem leaves extract 5% recording
ICBR of 1:5.41 and 1:3.63 respectively. Therefore
these findings are in conformity with the findings of
Das et al. (1998) they evaluated Neem derivatives on
soybean and found that ICBR was higher for
chemical insecticides followed by Neem seed kernel
extract 5%.
LITERATURE CITED1. Babu, R. 1998. Combined activity of Neem and
chinaberry extracts on feeding and ovipsoition
of Spodoptera litura Fab. Neem Newsletter.
15(3):25-27.
2. Basappa, H. and H. Singh, 2003. Effect of
sequential application of biopesticides and
endosulfan on Spodoptera litura. Proc. of the
National Symposium on Frontier Areas of
Entomological Research, IARI, New Delhi,
November, 5-7,pp.362-363.
3. Behara, U.K. and C.R. Satpathy, 1996. Action
of Calatropis procera against Spodoptera litura.
Insect Environment, 2:43.
4. Bhalkare, S.K. 1995. Management of soybean
pest complex with some chemical and plant
origin insecticides. M.Sc. (Agri.) Thesis
(unpub.), Dr. PDKV, Akola.
5. Bishnoi, V. 2005. Soybean: As Food Sopa Digest.
2(3):10-12.
6. Das, S.B., V.S. Kandalkar and O.P. Verma, 1998.
U s e o f N e e m d e r i v a t i v e s a g a i n s t
Melanagromyza obtusa (Maloch) and
Helicoverpa armigera (Hub.) infesting medium
maturing pigeonpea. Neem Newsletter.
15(2):18.
7. Ganeshan, S., K. Raman and B.N. Vyas, 1995.
Effect of certain plant extracts on growth and
development of three important noctuid pests.
Pestology. 12(10):18-23.
8. Gomez, K.A. and A.A. Gomez. 1984. Statistical ndprocedure for Agricultural Research, 2 Edn,
New York, John Willey and Sons, pp.643-645.
9. Jothi, B.D., A. Verghese and P.L. Tandon, 1991. Evaluation of different plant oils and extracts against citrus aphids Toxoptera citridus (Kirkedly). Indian J. Pl. Prot. 18(2):251-254.
10. More, G.D., N.R. Kadu and S.P. Sakhare, 1989. Evaluation of insecticides properties of indigenous plant products against S. litura. Nag. Agril. Coll. Mag. 50:1-3.
11. Probst, A.H. and R.W. Judd, 1973. Origin and Early History. In Soybeans : Improvement Production and Uses. Caldwell, B.E. (Eds.) American Society of Agronomy, Inc., Publisher, Wisconsin, USA, pp.1-3.
International Journal on Agricultural Sciences Vol. V (Issue 2), pp. 297-303, 2014

ISSN NO. 0976-450X
IJAS 2014 • 303
12. Reena S.K. and R. Singh, 2003. National Symposium on Frontier areas on Entomological Research, 5-7 November at New Delhi, pp. 330-331.
13. Sahayaraj, K. and M.G. Paulraj, 1998. Screening the relative toxicity of some plant extracts to Spodoptera litura (Fab.) of groundnut Fresenius Environmental Bulletin. 7(9-10):557-560.
14. Sahayraj, K. 2002.Toxicity of C.gigantea combine with biocontrol agents against S.litura. Indian J. Ent. 64(3):292-300.
15. Shivankar, S.B., S.B. Magar, V.D. Shinde, R.G. Yadav and A.S. Patil, 2008. Field bioefficacy of chemical, botanical and bio-pesticides against Spodoptera litura Fab. in Sugarbeet. Indian J. of Agril. Sci. 27 (3)333-335
16. Singh, O.P. and K.J. Singh, 1988. Effectiveness
of some insecticides against the larval
population of grey semilooper Riveula sp. a new
pest of soybean in Madhya Pradesh. Pesticide.
22(6):29-31.
International Journal on Agricultural Sciences Vol. V (Issue 2), pp. 297-303, 2014

ISSN NO. 0976-450X
IJAS 2014 • 304

ISSN NO. 0976-450X
NOTES FOR AUTHORS
GENERALPapers are considered from or about any region of the world and are published in English. High quality printing is used to encourage good standard of illustrations with both line drawing and photograph printed in the body of the text. Hence authors are invited to submit suitable manuscripts. The MSS are sent to the referees for their recommendation and comment before it is incorporated for publication. The Mss which are sent to the Chief Editor through any of the members of the Editorial Board or Scientist of the rank of Professor or of equivalent rank are not sent to the referres for their comments. Authors of the rank of Professor may submit their Mss directly to the Chief Editor for publication.
1. Manuscript Formation : The Manuscripts (s) must be typed in double space on thesis size papers, having margin of 3 Cms on the left side, the duplicate may be typed on thin paper using silk ribbon and without any spelling mistake, as the proof may or may not be sent to the authors for correction. Hence the manuscript(s) must be ready for press. The manuscript(s) should be in 4 parts as mentioned below :
1ST PART : First part of the manuscript should contain (i) the title of the paper (ii) the name and address of the authors (iii) the name of the organizations where the work was carried out (iv) the name of the authors with whom correspondence is to be made (v) date of submission (vi) No. of Tables (vi) No. of photographs (vii) No. of Graphs and (viii) Mobile no. (xi) Telephone No. (x) E-mail ID (xi) No. of reference. Name and addresses of atleast three referres.
2ND PART : The second part of the manuscripts should contain the text with the following sub-headings : - (i) Title of the Articles (ii) Abstract of not more than 300 words (iii) No. of Tables (iv) No. of photographs (v) No. of Graphs (vi) No. of references (vii) Key-words minimum - 3 (viii) Introduction (viv) Materials and Methods (vx) Observation and Results (xii) Discussion.
3RD PART : The 3rd part should contain Acknowledgment only.
4TH PART : References and legends, N.B. For italic words, please underline by single line and for bold words, by double lines.
2. TABLE ILLUSTRATIONS / PHOTOGRAPHS :Tables must be typed on a separate sheet giving the number and short title of the tables. Line diagrams and graphs should, be drawn in India ink on stout white paper. Photographs should be recent and on good glossy art paper. Original print labelling should be large enough to be legible after 25% reduction. Coloured photographs are also accepted.
3. ABBREVIATION : Standards symbols, abbreviations, nomenclature and standard units should be used.
4. REFERENCES : Reference should be cited in the following manners : -
(A) FOR FULL LENGTH COMMUNICATIONS : (i) Journals to be cited :
1. Lorber, Peter & Muller Walter, H. (1980). Volatile growth inhibitor produced by Sulvia lucophylla : Effect on metabiotic activity in mitochondrial suspensions : Com, Physiol. Ecol., 5(2), 68-75
(ii) Books to be cited : 1. Meggineryer, M.U. (Ed) (1963) methods of Enzymatic Analysis,
Academic Press, New York, 485 pp.
(B) FOR SHORT COMMUNICATION : Short communications of wide interest not exceeding three double space typed on thesis size papers are accepted in running and references at the end to be given as follows : -
1. Singh R. and Sinha T.B., Z. Ang. Enl., 90 (iv) pp. 141-146.

ISSN NO. 0976-450X
6. SUBMISSION OF MANUSCRIPT :Manuscript(s) in duplicate should be submitted to the Chief Editor directly or through any member of
the Editorial Board of the Bulletin or through a scientists of the rank of Professor or of equivalent rank.
The Manuscripts be completed in all respect and must BE ready for press.
7. TEST YOUR CONTRIBUTION PRIOR TO SUBMISSION OF THE MANUSCRIPT :1. Does the title or the article describe the content, and if not, does the abstract compensate for the
deficiency?2. Are article title and abstract content are in agreement?3. Have you indicated purpose, result, conclusion, in a coherent fashion and in proper sequence?4. Does interesting but superfluous discussion cloud main issues?5. Is direction of action, where applicable, clearly stated?6. Have you enumerated and identified completely by all organisms, chemicals, apparatus, method,
etc. pertinent to the outcome of the investigation?7. Is your presentation communicate with the scientific community at large or have you narrowed
your audience through unnecessary use of jargon?8. Have you included all primary information elements necessary for indexing?
8. REPRINTS :Reprints are not supplied in gratis. The Manuscripts are acceptable for publication along with a draft of
Rs. 600/- which will be adjusted against the processing charge. The cost of multicolourd photographs
will be quoted on request. All these are subjected to fluctuation. Hence final bills and Acceptance letter
will be submitted along with the proof copy. All payment are to be made in Advance on the receipt of the
‘Demand LETTER’ The reprints will be dispatched with in 45 days of the receipt. The Academy does not
take any responsibility of loss of any document during transit. However the reprints are dispatched
under “Registered Cover. SpeedPost”.
9. SUBMISSION OF MANUSCRIPTS IN ELECTRONIC FORM :Authors can send their manuscripts in electronic forms on floppy diskette (1.44 MB floppy IBM PC/AT
format & on CD only). The text and table of the manuscripts only should be supplied as a plain ASCII file
with no formatting other than link and paragraphs breaks. (Word Perfect 6.x, MS-World 97 and Adobe
PageMaker 6.5 are acceptable, but ASCII is preferred). A hard copy of the text, with all type setting
information (italics, bold, mathematical type, superscripts, subscripts, etc.) must accompany the
electronic copy. Figures must be supplied only as hard copies. The diskette must be labelled clearly with
the followings : manuscript number, file name, file information (ASCII, WP, WORD or PageMaker 6.5 OR
7.0 VERSION NUMBER ETC.). This will enable this office to move fast in processing for publication and
shall save time in sending the proves to the authors for corrections. MSS can be sent by e-mail also, the
e-mail ID is [email protected] and [email protected]
10. ACCEPTANCE LETTERS :ACCEPTANCE LETTERS are sent within 15 days of the receipt of the Manuscripts. All articles are
published within 30 days after the receipt of the PROCESSING FEE & OK REPORT FROM THE
AUTHOR.Text may also be transmitted as ASCII only by e-mail to : [email protected];
11. REQUEST :Authors are requested to keep one copy of their manuscripts along with all the charts, photographs,
tables etc. till they are published.
12. REMITTANCES : All remittances are to be sent by a crossed bank Draft on NATIONAL ENVIRONMENTAL SCIENCE
ACADEMY payable at New Delhi branch and should be sent to : PUBLICATION-IN-CHARGE,
NATIONAL ENVIRONMENTAL SCIENCE ACADEMY, 206, RAJ TOWER-1, ALAKNANDA
COMMUNITY CENTRE, NEW DELHI - 110 019. TEL.: 2602 3614