HenryFordners580/ners-bioe_481/lectures/...(VOI) Look up Table (LUT) transforms ‘For Processing’...
16
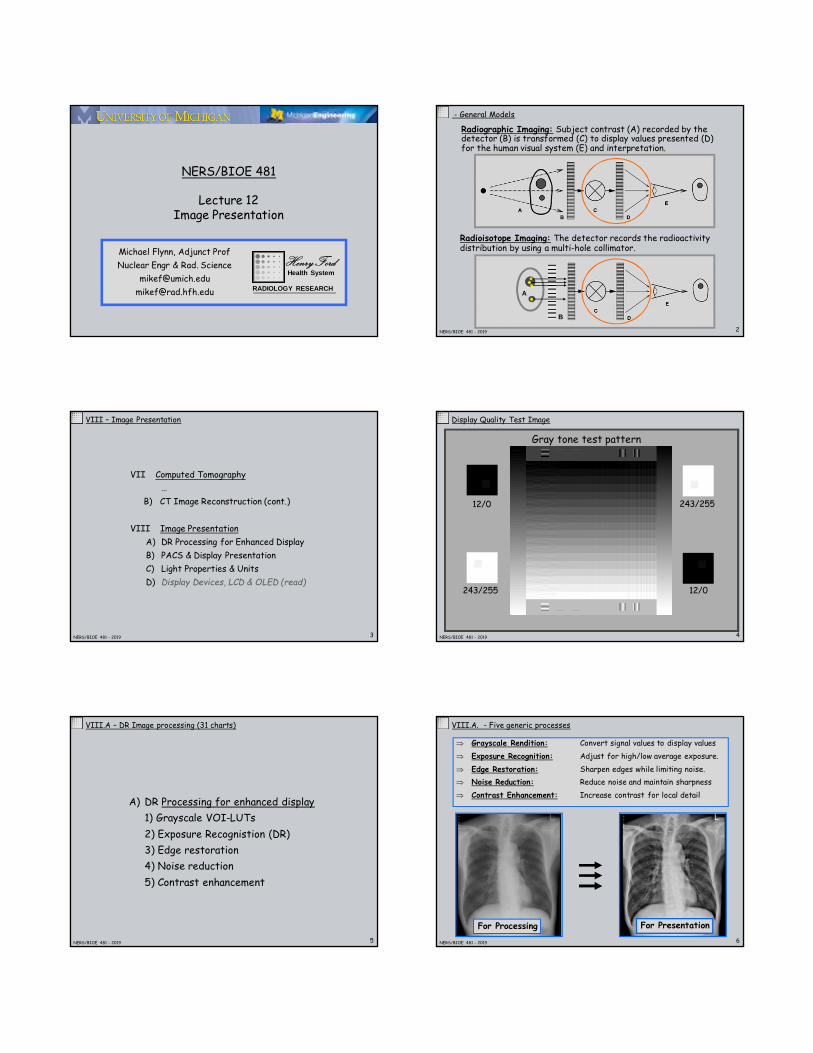
Health System RADIOLOGY RESEARCH Henry Ford NERS/BIOE 481 Lecture 12 Image Presentation Michael Flynn, Adjunct Prof Nuclear Engr & Rad. Science [email protected] [email protected] 2 NERS/BIOE 481 - 2019 - General Models Radiographic Imaging: Subject contrast (A) recorded by the detector (B) is transformed (C) to display values presented (D) for the human visual system (E) and interpretation. A B Radioisotope Imaging: The detector records the radioactivity distribution by using a multi-hole collimator. 3 NERS/BIOE 481 - 2019 VIII – Image Presentation VII Computed Tomography … B) CT Image Reconstruction (cont.) VIII Image Presentation A) DR Processing for Enhanced Display B) PACS & Display Presentation C) Light Properties & Units D) Display Devices, LCD & OLED (read) 4 NERS/BIOE 481 - 2019 Display Quality Test Image Gray tone test pattern 12/0 12/0 243/255 243/255 5 NERS/BIOE 481 - 2019 VIII.A – DR Image processing (31 charts) A) DR Processing for enhanced display 1) Grayscale VOI-LUTs 2) Exposure Recognistion (DR) 3) Edge restoration 4) Noise reduction 5) Contrast enhancement 6 NERS/BIOE 481 - 2019 VIII.A. - Five generic processes Grayscale Rendition: Convert signal values to display values Exposure Recognition: Adjust for high/low average exposure. Edge Restoration: Sharpen edges while limiting noise. Noise Reduction: Reduce noise and maintain sharpness Contrast Enhancement: Increase contrast for local detail For Processing For Presentation
Transcript of HenryFordners580/ners-bioe_481/lectures/...(VOI) Look up Table (LUT) transforms ‘For Processing’...
Health System
RADIOLOGY RESEARCH
Henry Ford
NERS/BIOE 481
Lecture 12Image Presentation
Michael Flynn, Adjunct Prof
Nuclear Engr & Rad. Science
2NERS/BIOE 481 - 2019
- General Models
Radiographic Imaging: Subject contrast (A) recorded by thedetector (B) is transformed (C) to display values presented (D)for the human visual system (E) and interpretation.
A
B
Radioisotope Imaging: The detector records the radioactivitydistribution by using a multi-hole collimator.
3NERS/BIOE 481 - 2019
VIII – Image Presentation
VII Computed Tomography
…
B) CT Image Reconstruction (cont.)
VIII Image Presentation
A) DR Processing for Enhanced Display
B) PACS & Display Presentation
C) Light Properties & Units
D) Display Devices, LCD & OLED (read)
4NERS/BIOE 481 - 2019
Display Quality Test Image
Gray tone test pattern
12/0
12/0
243/255
243/255
5NERS/BIOE 481 - 2019
VIII.A – DR Image processing (31 charts)
A) DR Processing for enhanced display
1) Grayscale VOI-LUTs
2) Exposure Recognistion (DR)
3) Edge restoration
4) Noise reduction
5) Contrast enhancement
6NERS/BIOE 481 - 2019
VIII.A. - Five generic processes
Grayscale Rendition: Convert signal values to display values
Exposure Recognition: Adjust for high/low average exposure.
Edge Restoration: Sharpen edges while limiting noise.
Noise Reduction: Reduce noise and maintain sharpness
Contrast Enhancement: Increase contrast for local detail
For Processing For Presentation

Grayscale Rendition: Convert signal values to display values
Exposure Recognition: Adjust for high/low average exposure.
Edge Restoration: Sharpen edges while limiting noise.
Noise Reduction: Reduce noise and maintain sharpness
Contrast Enhancement: Increase contrast for local detail
7NERS/BIOE 481 - 2019
VIII.A.1 - processing sequence
Spatial Processes•Edge Restoration•Noise Reduction•Contrast Enhance
ExposureRecognition
Grayscale(VOI-LUT)
8NERS/BIOE 481 - 2019
VIII.A.1 - Grayscale Rendition
5-5 8-8 11-11
Grayscale LUTs
‘For Processing’ datavalues are transformed topresentation values using agrayscale Look Up Table 0
1000
2000
3000
4000
0 500 1000 1500 2000 2500 3000 3500 4000
5 - HC-CR
8 - MID-VAL
11 - LIN
9NERS/BIOE 481 - 2019
VIII.A.1 - Presentation Values
The Grayscale Value of Interest(VOI) Look up Table (LUT)transforms ‘For Processing’ valuesto ‘For Presentation Values.
Monitors and printers are DICOMcalibrated to display presentationvalues with equivalent contrast.
Images appearthe same on allmonitors
The VOI-LUT optimizes thedisplay for radiographs ofspecific body parts.
Grayscale VOI-LUT
Presentation Values
Log-luminance
For Processing Values
10NERS/BIOE 481 - 2019
VIII.A.1 - DICOM VOI LUT
DICOM PS 3.3 2007, Pg 88
When the transformation is linear, the VOI LUT is described by the WindowCenter (0028,1050) and Window Width (0028,1051). When the transformationis non-linear, the VOI LUT is described by VOI LUT Sequence (0028,3010).
VOI-LUT may be applied by the modality
Spatial Processes•Edge Restoration•Noise Reduction•Contrast Enhance
ExposureRecognition
Grayscale(VOI-LUT)
VOI-LUT applied by a viewing station
Spatial Processes•Edge Restoration•Noise Reduction•Contrast Enhance
ExposureRecognition
(VOI-LUT)
Grayscale Rendition: Convert signal values to display values
Exposure Recognition: Adjust for high/low average exposure.
Edge Restoration: Sharpen edges while limiting noise.
Noise Reduction: Reduce noise and maintain sharpness
Contrast Enhancement: Increase contrast for local detail
11NERS/BIOE 481 - 2019
VIII.A.2 – Exposure Recognition
Spatial Processes•Edge Restoration•Noise Reduction•Contrast Enhance
ExposureRecognition
Grayscale(VOI-LUT)
12NERS/BIOE 481 - 2019
VIII.A.2 – Exposure recognition - signal
Signal Range:A signal range of up to 104 can be recorded by digitalradiography systems. Unusually high or low exposurescan thus be recorded. However, display of the full rangeof data presents the information with very poorcontrast. It is necessary to determine the values ofinterest for the acquired signal data.
2000 40000
100
log(S
)pro
bab
ility
log(S) value

13NERS/BIOE 481 - 2019
VIII.A.2 – Exposure recognition: regions
Exposure Recognition:
All digital radiographic systems have an exposure recognitionprocess to determine the range and the average exposure to thedetector in anatomic regions. A combination of edge detection,noise pattern analysis, and histogram analysis may be used toidentify Values of Interest (VOI).
2000 40000
100
log(S
)pro
bab
ility
log(S) value
A
BC
D
DA
B
C
14NERS/BIOE 481 - 2019
VIII.A.2 – Exposure recognition: VOI LUT
VOI LUT Level and Width:
• The values of interest obtained from exposure recognitionprocesses are used to set the level and width of the VOI LUT.
• Areas outside of the collimated field may be masked to preventbright light from adversely effecting visual adaptation.
2000 40000
100
log(S
)p
rob
ab
ility
log(S) value
BC
Grayscale Rendition: Convert signal values to display values
Exposure Recognition: Adjust for high/low average exposure.
Edge Restoration: Sharpen edges while limiting noise.
Noise Reduction: Reduce noise and maintain sharpness
Contrast Enhancement: Increase contrast for local detail
15NERS/BIOE 481 - 2019
VIII.A.3 – Edge Restoration
Spatial Processes•Edge Restoration•Noise Reduction•Contrast Enhance
ExposureRecognition
Grayscale(VOI-LUT)
16NERS/BIOE 481 - 2019
VIII.A.3 – Edge Restoration
MTF
Frequency
Noise Power
Frequency
Signal Power
Frequency
• Radiographs with high contrastdetails input high spatialfrequencies to the detector.
• For many systems the detectorwill blur this detail as indicatedby the MTF.
• Enhancing these frequencies canhelp restore image detail.
• However, at sufficiently highfrequencies there is little signalleft and the quantum mottle(noise) is amplified.
• The frequency where noiseexceeds signal is different fordifferent body parts/views
17NERS/BIOE 481 - 2019
Without Edge Restoration
VIII.A.3 – With / Without
18NERS/BIOE 481 - 2019
With Edge Restoration
VIII.A.3 – With / Without

19NERS/BIOE 481 - 2019
0 6 7cycles/mm
1 2 3 4 50
.2
.4
.6
.8
1.0
MTF
CRGP
DR-CsI
DR-Se
dXTL
VIII.A.3 – MTF – CR, iDR and dDR
CR and iDR need more edgerestoration than dDR and thuscan have more noise for thesame DQE(0) and exposure.
Grayscale Rendition: Convert signal values to display values
Exposure Recognition: Adjust for high/low average exposure.
Edge Restoration: Sharpen edges while limiting noise.
Noise Reduction: Reduce noise and maintain sharpness
Contrast Enhancement: Increase contrast for local detail
20NERS/BIOE 481 - 2019
VIII.A.4 – Noise Reduction
Spatial Processes•Edge Restoration•Noise Reduction•Contrast Enhance
ExposureRecognition
Grayscale(VOI-LUT)
21NERS/BIOE 481 - 2019
VIII.A.4 – noise reduction: with/wo
Comparison with and withoutadaptive noise reduction
0
200
400
600
800
1000
1200
1400
100 150 200 250 300 350 400
Position
Sig
na
l
Sharp edgesare preserved
22NERS/BIOE 481 - 2019
VIII.A.4 – adaptive non-linear coring
Couwenhoven, 2005,
SPIE MI vol 5749, pg318
• High frequency sub-band
• Coring function
P = P/(1+s/P2)
• Adaptation
• Signal amplitude
• Signal to noise
23NERS/BIOE 481 - 2019
VIII.A.4 – Post Processed CT images Segmented filteringfor noise reduction
Processed (F)
Kalra, Radiology, 2003
Original
24NERS/BIOE 481 - 2019
VIII.A.4 – Post Processed CT images
Images are segmented based on structure and separate filtersapplied to regions with and without structure. The effect variesfor a set of filters studied. In general, significant noise reductionis achieved with a slight reduction of high frequency MTF.
Kalra, Radiology, 2003
Segmented filteringfor noise reduction

Grayscale Rendition: Convert signal values to display values
Exposure Recognition: Adjust for high/low average exposure.
Edge Restoration: Sharpen edges while limiting noise.
Noise Reduction: Reduce noise and maintain sharpness
Contrast Enhancement: Increase contrast for local detail
25NERS/BIOE 481 - 2019
VIII.A.5 – Constrast Enhancement
Spatial Processes•Edge Restoration•Noise Reduction•Contrast Enhance
ExposureRecognition
Grayscale(VOI-LUT)
26NERS/BIOE 481 - 2019
VIII.A.5 – Contrast Enhancement
Contrast Enhancement:
Enhancement of localdetail with preservationof global latitude.
• A wide range oflog(S) values isdifficult to display inone view.
• Lung detail is shownhere with lowcontrast.
27NERS/BIOE 481 - 2019
VIII.A.5 – Unsharp Mask
• A highly blurredimage can be used toadjust image values.
• The Unsharp Maskcan be obtained bylarge kernelconvolution or lowpass filter.
• Note that thegrayscale has beenreversed.
28NERS/BIOE 481 - 2019
VIII.A.5 – Detail enhancement
The differencebetween the image andthe unsharp maskcontains detail.
This is added to theimage to enhance detailcontrast
The contrast enhancedimage has improved lungcontrast and goodpresentation ofstructures in themediastinum.
29NERS/BIOE 481 - 2019
2.0
Cycles/mm
1.0
3.0
VIII.A.5 – Selecting contrast enhancement
In practice, the amount of contrast enhancement canbe selected by first defining a grayscale rendition thatachieves the desired latitude, and then applying afilter that enhances detail contrast.
The enhancement gain is adjusted to amplifying thecontrast of local detailed tissue structures.
Early methods using largekernels of equal weighthad poor frequencyresponse characteristics.
30NERS/BIOE 481 - 2019
11-11
Gain = 0
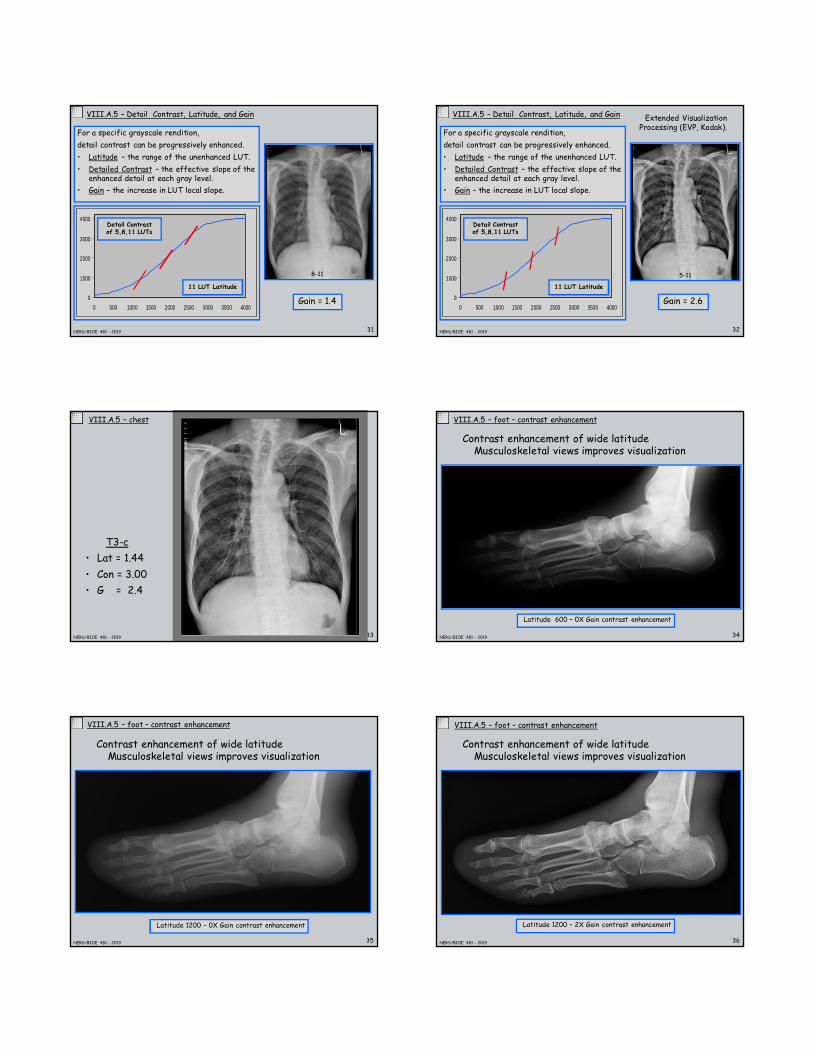
VIII.A.5 – Detail Contrast, Latitude, and Gain
For a specific grayscale rendition,
detail contrast can be progressively enhanced.
• Latitude – the range of the unenhanced LUT.
• Detailed Contrast – the effective slope of theenhanced detail at each gray level.
• Gain – the increase in LUT local slope.
0
1000
2000
3000
4000
0 500 1000 1500 2000 2500 3000 3500 4000
Detail Contrastof 5,8,11 LUTs
11 LUT Latitude
31NERS/BIOE 481 - 2019
VIII.A.5 – Detail Contrast, Latitude, and Gain
For a specific grayscale rendition,
detail contrast can be progressively enhanced.
• Latitude – the range of the unenhanced LUT.
• Detailed Contrast – the effective slope of theenhanced detail at each gray level.
• Gain – the increase in LUT local slope.
0
1000
2000
3000
4000
0 500 1000 1500 2000 2500 3000 3500 4000
Detail Contrastof 5,8,11 LUTs
11 LUT Latitude
Gain = 1.4
8-11
32NERS/BIOE 481 - 2019
VIII.A.5 – Detail Contrast, Latitude, and Gain
For a specific grayscale rendition,
detail contrast can be progressively enhanced.
• Latitude – the range of the unenhanced LUT.
• Detailed Contrast – the effective slope of theenhanced detail at each gray level.
• Gain – the increase in LUT local slope.
0
1000
2000
3000
4000
0 500 1000 1500 2000 2500 3000 3500 4000
Detail Contrastof 5,8,11 LUTs
11 LUT Latitude
Extended VisualizationProcessing (EVP, Kodak).
Gain = 2.6
5-11
33NERS/BIOE 481 - 2019
T3-c
• Lat = 1.44
• Con = 3.00
• G = 2.4
VIII.A.5 – chest
34NERS/BIOE 481 - 2019
Latitude 600 – 0X Gain contrast enhancement
VIII.A.5 – foot – contrast enhancement
Contrast enhancement of wide latitudeMusculoskeletal views improves visualization
35NERS/BIOE 481 - 2019
Latitude 1200 – 0X Gain contrast enhancement
VIII.A.5 – foot – contrast enhancement
Contrast enhancement of wide latitudeMusculoskeletal views improves visualization
36NERS/BIOE 481 - 2019
Latitude 1200 – 2X Gain contrast enhancement
VIII.A.5 – foot – contrast enhancement
Contrast enhancement of wide latitudeMusculoskeletal views improves visualization

37NERS/BIOE 481 - 2019
VIII.B – Display workstations (18 charts)
B) PACS & Display Presentation
1) Image management, PACS (5)
2) Display presentation (9)
Grayscale calibration
Pan/zoom & resampling
3) Tomographic display (4)
38NERS/BIOE 481 - 2019
VIII.B.1 – Image Management, PACS
Radiation images from all types of devices (DR, CT, NM, PET, ..) are• Stored in Vendor Neutral Archives (VNA),• Communicated using specialized network protocols (DICOM) and• Made available at workstations for interpretation or clinical care review.
Image Management usingPicture Archive andCommunication Systems (PACS)
39NERS/BIOE 481 - 2019
VIII.B.1 – The DICOM Standard
• Defines network communication protocols to transfer images• Defines object structures for DR, CT, NM, PET, and other studies that
groups images in series and studies. Coded metadata in included in eachimage that includes
• Patient information• Exam protocol information• Image presentation information
• Defines file formats and directory structures for media transfer.• In 2006, ISO approved DICOM as an ISO reference standard (#12052)• With ~60 members (Manufacturers, Societies, Organizations), the
Dicom Standards Committee (DSC) continuously updates the standard.
DICOM is a global standard for informations systems used to:
Produce, Store, Display, Process, Send, Retrieve, Query or Print
medical images in:
radiology, cardiology, dentistry, opthamology, pathology ...
http://dicom.nema.org/ 40NERS/BIOE 481 - 2019
VIII.B.1 – Xray Technologist work stations
Images are first checked bya Radiographer/Technologistas they are acquired.
Image display settingsmay be adjusted prior
to sending the study tothe PACS system
41NERS/BIOE 481 - 2019
VIII.B.1 – Diagnostic reading station
• Medical imaging studies areinterpreted at Radiologistsworkstations having multiple highperformance display monitors.
• The interpretation iselectronically dictated usingvoice recognition and attached tothe medical record.
The Radiology workspacetypically incorporates a varietyof ergonomic features;
• Modest ambient light
• Wide fore deck desks
• Ergonomic seating
• Ambient noise control.
42NERS/BIOE 481 - 2019
VIII.B.1 – HFHS Clinic stations
• Various clinical caregivers willreview medical imaging studiesas a part of a patientselectronic medical record.
• Both current and prior studiesare available from the PACSarchive
43NERS/BIOE 481 - 2019
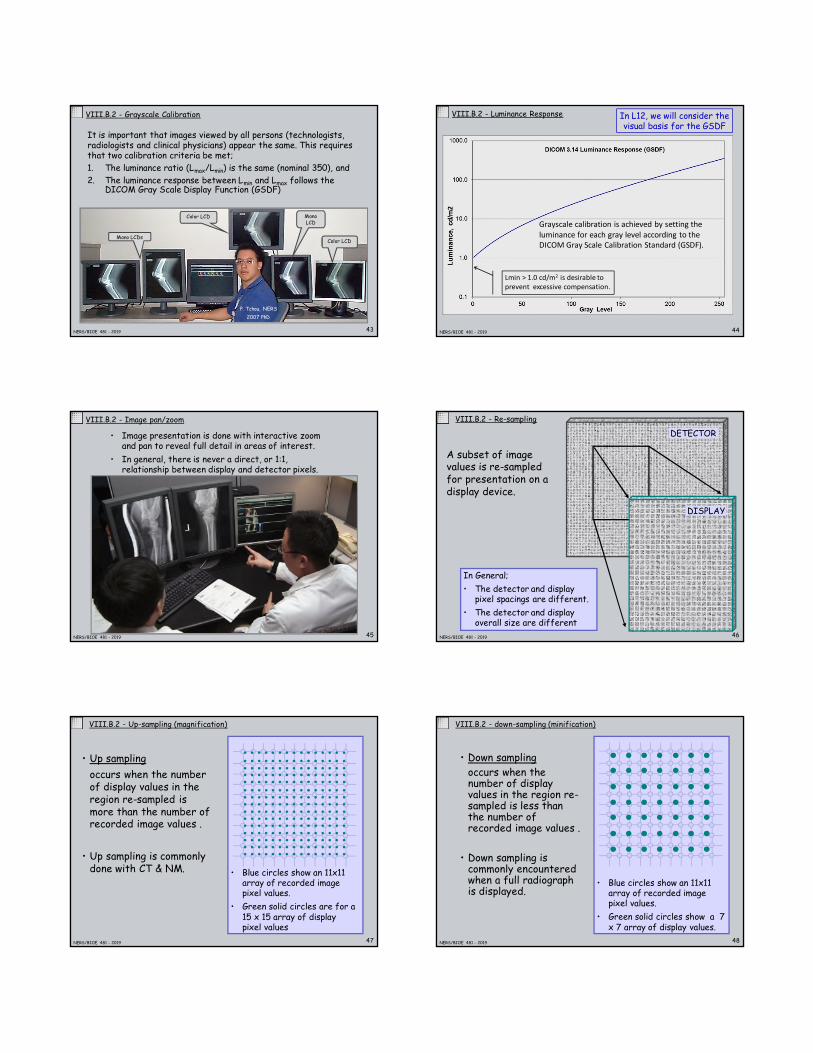
VIII.B.2 - Grayscale Calibration
It is important that images viewed by all persons (technologists,radiologists and clinical physicians) appear the same. This requiresthat two calibration criteria be met;
1. The luminance ratio (Lmax/Lmin) is the same (nominal 350), and
2. The luminance response between Lmin and Lmax follows theDICOM Gray Scale Display Function (GSDF)
Mono LCDs
Color LCD Mono
LCD
Color LCD
P. Tchou, NERS
2007 PhD
44NERS/BIOE 481 - 2019
VIII.B.2 - Luminance Response
Lmin > 1.0 cd/m2 is desirable toprevent excessive compensation.
Grayscale calibration is achieved by setting theluminance for each gray level according to theDICOM Gray Scale Calibration Standard (GSDF).
In L12, we will consider thevisual basis for the GSDF
45NERS/BIOE 481 - 2019
VIII.B.2 - Image pan/zoom
• Image presentation is done with interactive zoomand pan to reveal full detail in areas of interest.
• In general, there is never a direct, or 1:1,relationship between display and detector pixels.
46NERS/BIOE 481 - 2019
VIII.B.2 - Re-sampling
A subset of imagevalues is re-sampledfor presentation on adisplay device.
In General;
• The detector and displaypixel spacings are different.
• The detector and displayoverall size are different
DETECTOR
DISPLAY
47NERS/BIOE 481 - 2019
VIII.B.2 - Up-sampling (magnification)
• Up sampling
occurs when the numberof display values in theregion re-sampled ismore than the number ofrecorded image values .
• Up sampling is commonlydone with CT & NM. • Blue circles show an 11x11
array of recorded imagepixel values.
• Green solid circles are for a15 x 15 array of displaypixel values
48NERS/BIOE 481 - 2019
VIII.B.2 - down-sampling (minification)
• Down sampling
occurs when thenumber of displayvalues in the region re-sampled is less thanthe number ofrecorded image values .
• Down sampling iscommonly encounteredwhen a full radiographis displayed.
• Blue circles show an 11x11array of recorded imagepixel values.
• Green solid circles show a 7x 7 array of display values.

49NERS/BIOE 481 - 2019
VIII.B.2 - Approximate Interpolation
While fast, nearest neighbor and bi-linear interpolation do notresult in optimal image quality due to artifacts and blur.
Nearest Neighbor Interpolation
• Display value (green) is taken as theimage value (blue) at the nearest rowand column.
• Produces visible block artifacts forlarge magnification.
Bi-Linear Interpolation
• Image values pairs above & below thedisplay value are linearly interpolatedbased on the column position (black).
• These values are linearly interpolatedbased on the row position.
50NERS/BIOE 481 - 2019
VIII.B.2 - Improved Interpolation
Improved quality can beachieved by estimatingdisplay values from theclosest 16 image values(4 x 4).
•Spline interpolation
•cubic convolution
•Generalized
spline interpolationCubic Interpolation
• Display value (green) is computed fromthe closest 16 image values.
• The weighting functions for the 16image values are intended to estimatea continuous function within the spacebetween the sampled values.
51NERS/BIOE 481 - 2019
VIII.B.2 - Magnification
Magnification: Calcified duct, 4:1 re-sampling 5.25 x 5.25 mm region
Nearest Neighbor
A
Bi-Linear
B
Cubic
C
Minification.
• Advanced interpolation methods can also provide effectiveminification with noise reduction (low-pass filter).
• Alternatively, minification is often done using multi-scalerepresentations of the image with progressive presentation.
52NERS/BIOE 481 - 2019
VIII.B.3 – Tomographic Display (4 slides)
C.3 Tomographic (3D) display
1) Window-Level Adjustment
2) Interactive stack sequence
3) Sagittal / Coronal reformatting
4) Volumetric rendering
iSite viewer demonstration
53NERS/BIOE 481 - 2019
VIII.B.3 – Reformatting 3D Data
Axial Sagital Coronal
512 x 512 50 cm FOV, 7mm Slice thickness,.98 mm x .98mm pixel size
For tomographic data acquired with small sliceincrements, the data can be considered as a 3 dimensionalarray and presents in stacks of xy, xz, or yz planes.
54NERS/BIOE 481 - 2019
VIII.B.3 – Resampling 3D Data
AxialFor 512 512 50 cm FOV,7mm Slice thickness,
pixel size is
.98 mm .98 mm = .95 mm2
But the voxel size is.98 .98 7 mm = 6.7 mm3
For 512 512 50 cm FOV,7mm Slice thickness,
pixel size is
.98 mm 7 mm = 6.7 mm2
Sagittal
• When a stack ofCT images isreformatted, theZ spacing iscommonlydifferent thanthe x and yspacing.
• The sagittal andcoronal viewsneed to beresample so thatthe xz and yzpixels are square.
55NERS/BIOE 481 - 2019
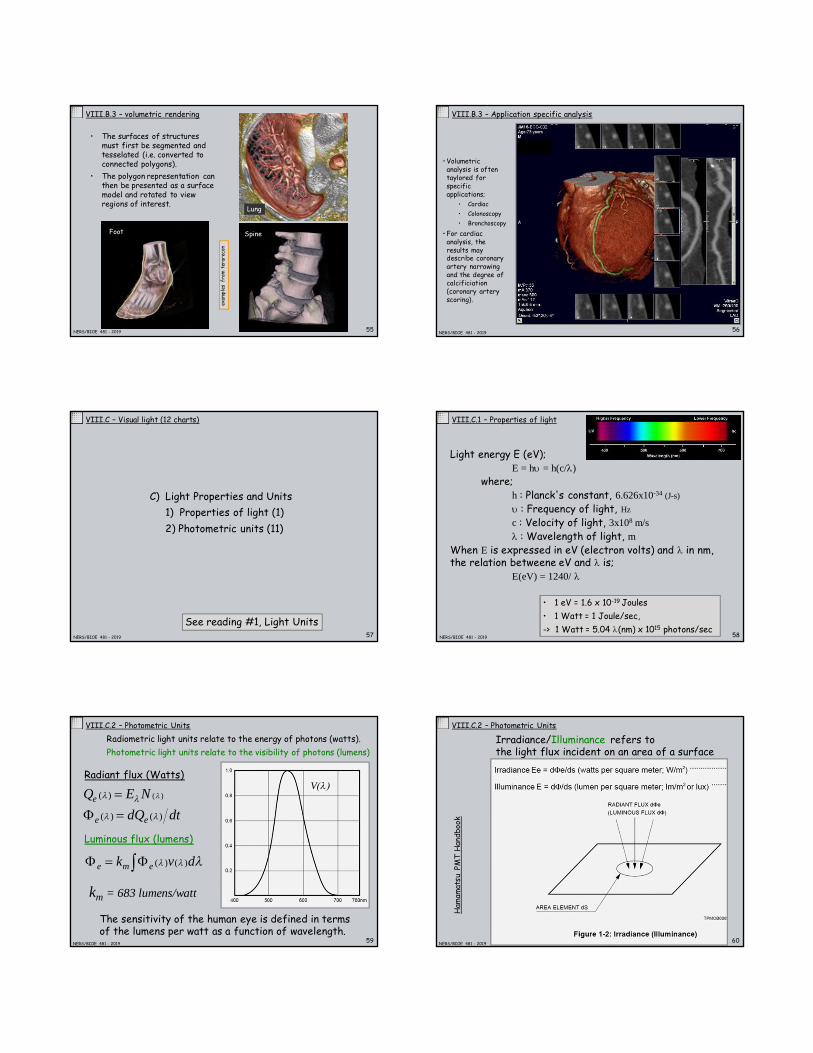
VIII.B.3 – volumetric rendering
exam
ple
sfrom
terarecon
Foot Spine
Lung
• The surfaces of structuresmust first be segmented andtesselated (i.e. converted toconnected polygons).
• The polygon representation canthen be presented as a surfacemodel and rotated to viewregions of interest.
56NERS/BIOE 481 - 2019
VIII.B.3 – Application specific analysis
• Volumetricanalysis is oftentaylored forspecificapplications;
• Cardiac
• Colonoscopy
• Bronchoscopy
• For cardiacanalysis, theresults maydescribe coronaryartery narrowingand the degree ofcalcificiation(coronary arteryscoring).
57NERS/BIOE 481 - 2019
VIII.C – Visual light (12 charts)
C) Light Properties and Units
1) Properties of light (1)
2) Photometric units (11)
See reading #1, Light Units58NERS/BIOE 481 - 2019
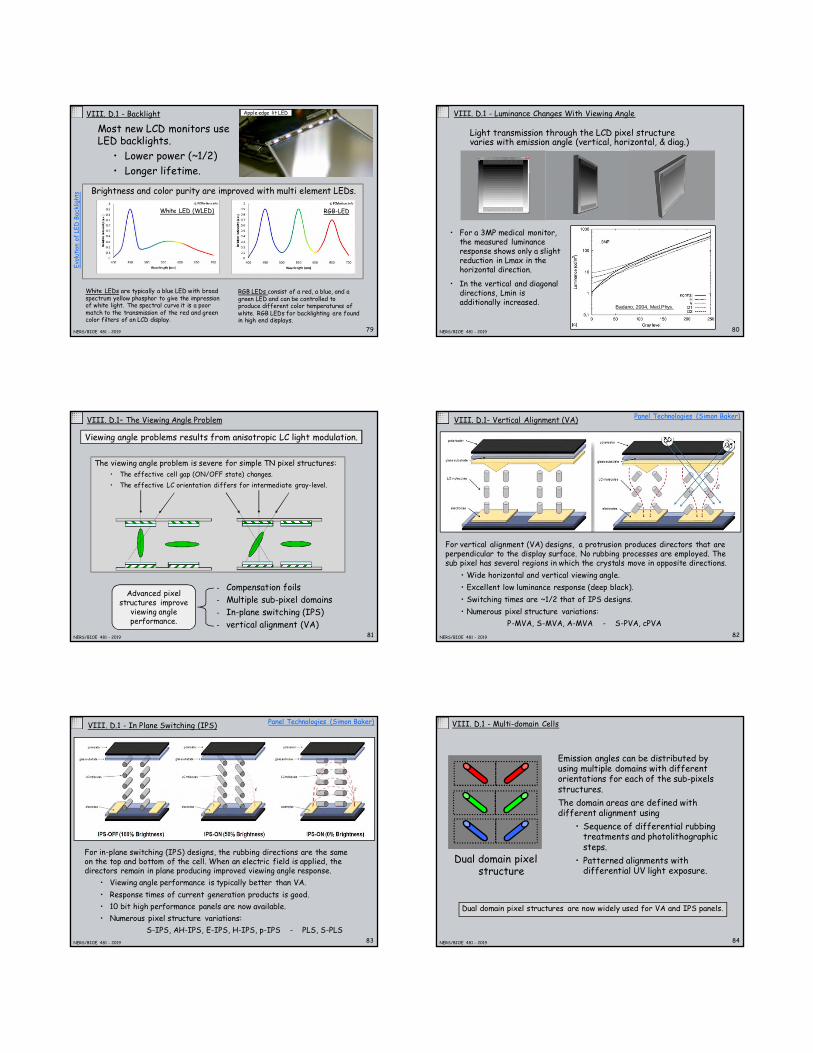
VIII.C.1 – Properties of light
Light energy E (eV);
E = hu = h(c/l)
where;
h : Planck's constant, 6.626x10⁻³⁴ (J-s)
u : Frequency of light, Hz
c : Velocity of light, 3x10⁸ m/s
l : Wavelength of light, m
When E is expressed in eV (electron volts) and l in nm,the relation betweene eV and l is;
E(eV) = 1240/ l
• 1 eV = 1.6 x 10⁻¹⁹ Joules
• 1 Watt = 1 Joule/sec,
-> 1 Watt = 5.04 l(nm) x 1015 photons/sec
59NERS/BIOE 481 - 2019
Radiant flux (Watts)
Luminous flux (lumens)
VIII.C.2 – Photometric Units
Radiometric light units relate to the energy of photons (watts).
Photometric light units relate to the visibility of photons (lumens)
dtdQ
NEQ
ee
e
)()(
)( )(
dvk eme )()(
V(l)
km = 683 lumens/watt
The sensitivity of the human eye is defined in termsof the lumens per watt as a function of wavelength.
60NERS/BIOE 481 - 2019
VIII.C.2 – Photometric Units
Irradiance/Illuminance refers tothe light flux incident on an area of a surface
Ham
amat
su
PM
TH
andbook

61NERS/BIOE 481 - 2019
VIII.C.2 – Photometric Units
Emittance refers to the light fluxemitted from an area on a surface
Ham
amat
su
PM
TH
andbook
62NERS/BIOE 481 - 2019
VIII.C.2 – Photometric Units
Radiant/luminous intensity refers to the light fluxemitted per steradian from a point source (candle).
Ham
amat
su
PM
TH
andbook
63NERS/BIOE 481 - 2019
VIII.C.2 – Photometric Units
Luminance refers to the light flux emitted from an areaon a surface per steradian.
(Note that it is adjusted by the 1/cosine of the viewing angle.)
Ham
amat
su
PM
TH
andbook
Luminance, L = (dl/ds)/cosq candelas/m2
64NERS/BIOE 481 - 2019
VIII.C.2 – Photometric Units
The luminance indicates how much luminous power will bedetected by an eye looking at the surface from a
particular angle of view.
The surface area seen by a receptorin the eye increases by 1/cos(q)
Apparent brightness is independent ofdistance to the viewing surface;
• The surface area seen by a receptor in the eyeincreases with the square of the distance.
• The solid angle subtended by the eye lensdecreases with the square of the distance.
65NERS/BIOE 481 - 2019
VIII.C.2 – Photometric Units
Surfaces for which theluminous intensity, dF/dw(cd/sr) per unit area, ds, isproportional to the cosine ofthe emission angle are knownas Lambertian emitters.
Inte
rnati
onal
Lig
ht
Handbook
• Lambertian emitters are significant in that the luminance, andtherefore the apparent brightness, is independent of viewing angle.
• Lambertian emission results from diffusive surfaces such asprojector screens, powdered phosphors, and opal glass.
)cos(
/)( k
dsdd
dsdI
kdsdIL )cos()(
)(
66NERS/BIOE 481 - 2019
VIII.C.2 – Photometric Units
Radiometric & Photometric Light Units
Quantity Unit Name Symbol
FRadiant flux Watts (J/S) W
Luminous flux Lumen lm
QRadiant energy Joules J
Quantity of light lumen*sec lm-s
dF/dsIrradiance Watts/m2 W/m2
Illuminance Lux (lm/m2) lx
dF/ds Radiant emittance Watts/m2 W/m2
Luminous emittance lumens/m2 lm/m2
dF/dw Radiant intensity Watts/sr W/sr
Luminous intensity Candelas (lm/sr) cd
dI/dscosq
Radiance Watts/sr/m2 W/sr/m2
Luminance Candelas/m2 cd/m2

67NERS/BIOE 481 - 2019
VIII.C.2 – Photometric Units
Consider a projectionscreen illuminated by 1lux. If all of theincident light isreflected back with aLambertian distribution,what is the luminance?
• The emittance after reflection, M in lumens/m2
is equal to the illuminance, E in lumens/m2 (lux).
• M can be obtained by integrating the luminousintensity per unit area over a half sphere.
dkds
dM
kdsdd
dsdI
)cos(
)cos(/)(
E = 1 lux
? L, cd/m2
M = 1 lux
68NERS/BIOE 481 - 2019
VIII.C.2 – Photometric Units
Consider a projectionscreen illuminated by 1lux. If all of theincident light isreflected back with aLambertian distribution,what is the luminance?
• Using the expression for dw from L03
we can show that k = M/p ;
• On the prior slide we showed thatL=k, and since E=M, we get:
kdk
ddkM
2
0
2
0
2
0
)sin()cos(2
)sin()cos(
EL
Note: in L03 dw was dW and f and q were reversed, the variables here are aligned with the reading.
E = 1 lux
? L, cd/m2
M = 1 lux
69NERS/BIOE 481 - 2019
VIII.C.2 – Photometric Units
For documentation, thesolution for the solidangle integral on theprior page is shown here.
2
1
)cos(2
1
')'sin(2
1
2',2'
)2sin(
)2sin(2
1)sin()cos(
0
0
0
2
0
2
0
d
d
d
dd
70NERS/BIOE 481 - 2019
VIII.D – Display devices (28 charts)
D) Display Devices
1) LCD monitors (14)
2) New technology, OLEDs (7)
3) Graphic controller interface (2)
71NERS/BIOE 481 - 2019
VIII.D.1 - LCD
Liquid Crystal Display (LCD) Technology
72NERS/BIOE 481 - 2019
VIII. D.1 - Liquid Crystal Materials
Intermediate state of matter:
crystal --------------> liquid -------------> vapor.
(liquid crystal).
De-localized charge in long organic molecules defines anisotropy:
CH30 - -CH=N- -C4H9.
TT
Alignment of liquidcrystal molecules(nematic phase)
• Molecules are arranged looselyalong main axis (or director).
• Their spatial configuration isdetermined by elasticity anddeformation constants.
• Oriented molecules are oftenreferred to as ‘directors’

73NERS/BIOE 481 - 2019
VIII. D.1 - Elements of a TN LC Cell
Alignmentlayers
Bottom substrate
90o twist
Top substrate
Backlight
Transparentelectrode
Polarizing Filter
Spacers
Polarizing Filter
Transparentelectrode
74NERS/BIOE 481 - 2019
VIII. D.1 - Electro-optical Effect
When LC moleculescontact a groovedsurface, they alignparallel to the grooves.
The director is altered byexternal electric field. Whenthe director is twisted, lightpolarization also twists.
Adapted from Sharp Co. brochure
Twisted Nematic (TN)LC cell
75NERS/BIOE 481 - 2019
VIII. D.1 - Light Modulation With Polarizer
With polarizer filters, the LC electro-optical effect defineslight transmission as a function of applied cell voltage.
For normally black (NB with aligned polarizers),there is no transmission when voltage is applied.
T
Applied voltage
1
0
NB
NW
Vth
76NERS/BIOE 481 - 2019
VIII. D.1 - Active Matrix Design
• a-Si TFTs:
• good switching performance.
• low leakage in OFF state.
• Aperture ratio:
• Typically 50%
• 80% increased luminance(Sharp)
• Challenges:
• low resistance scan lines (lag).
• photo-conductivity.
All pixels in a row are changed in sequence.
No flicker even at modest refresh rates.
77NERS/BIOE 481 - 2019
VIII. D.1 - Brightness and Light Transmission
Monitor brightness is determined by• backlight brightness and• LCD panel transmission. backlight
polarizer
color filters
electrode
liquid crystal
electrode
active matrix
polarizer
100 %
40 %
20 %
3 %
RGB color filters havelow transmission,particularly for highlysaturated color.
78NERS/BIOE 481 - 2019
CCFL : Cold Cathode Fluorescent Lamp
Used until ~2013 but subject to brightness loss and color shift.
VIII. D.1- Backlight
The LCD panel is placedon a backlight withuniform luminance
reflectorlamps
diffuserdisplay
display
Edge lit (thinner)Back lit (brighter)
niktec.com
RGB-LEDWhite LED (WLED)
79NERS/BIOE 481 - 2019
Brightness and color purity are improved with multi element LEDs.
VIII. D.1 - Backlight
Most new LCD monitors useLED backlights.
• Lower power (~1/2)
• Longer lifetime.
Apple edge lit LED
White LEDs are typically a blue LED with broadspectrum yellow phosphor to give the impressionof white light. The spectral curve it is a poormatch to the transmission of the red and greencolor filters of an LCD display.
RGB LEDs consist of a red, a blue, and agreen LED and can be controlled toproduce different color temperatures ofwhite. RGB LEDs for backlighting are foundin high end displays.
Evo
luti
on
of
LE
DB
acklig
hts
80NERS/BIOE 481 - 2019
VIII. D.1 - Luminance Changes With Viewing Angle
Light transmission through the LCD pixel structurevaries with emission angle (vertical, horizontal, & diag.)
• For a 3MP medical monitor,the measured luminanceresponse shows only a slightreduction in Lmax in thehorizontal direction.
• In the vertical and diagonaldirections, Lmin isadditionally increased.
Badano, 2004, Med.Phys.
Advanced pixelstructures improve
viewing angleperformance.
81NERS/BIOE 481 - 2019
VIII. D.1– The Viewing Angle Problem
The viewing angle problem is severe for simple TN pixel structures:
• The effective cell gap (ON/OFF state) changes.
• The effective LC orientation differs for intermediate gray-level.
– Compensation foils
– Multiple sub-pixel domains
– In-plane switching (IPS)
– vertical alignment (VA)
Viewing angle problems results from anisotropic LC light modulation.
82NERS/BIOE 481 - 2019
VIII. D.1- Vertical Alignment (VA)
For vertical alignment (VA) designs, a protrusion produces directors that areperpendicular to the display surface. No rubbing processes are employed. Thesub pixel has several regions in which the crystals move in opposite directions.
• Wide horizontal and vertical viewing angle.
• Excellent low luminance response (deep black).
• Switching times are ~1/2 that of IPS designs.
• Numerous pixel structure variations:
P-MVA, S-MVA, A-MVA - S-PVA, cPVA
Panel Technologies (Simon Baker)
83NERS/BIOE 481 - 2019
VIII. D.1 - In Plane Switching (IPS)
For in-plane switching (IPS) designs, the rubbing directions are the sameon the top and bottom of the cell. When an electric field is applied, thedirectors remain in plane producing improved viewing angle response.
• Viewing angle performance is typically better than VA.
• Response times of current generation products is good.
• 10 bit high performance panels are now available.
• Numerous pixel structure variations:
S-IPS, AH-IPS, E-IPS, H-IPS, p-IPS - PLS, S-PLS
Panel Technologies (Simon Baker)
84NERS/BIOE 481 - 2019
VIII. D.1 - Multi-domain Cells
Dual domain pixel structures are now widely used for VA and IPS panels.
Emission angles can be distributed byusing multiple domains with differentorientations for each of the sub-pixelsstructures.
The domain areas are defined withdifferent alignment using
• Sequence of differential rubbingtreatments and photolithographicsteps.
• Patterned alignments withdifferential UV light exposure.
Dual domain pixelstructure
NERS/BIOE 481 - 2019
VIII. D.1 - LCD pixel structure ID Leitz 24mm SummarNikon PV4 bellowsFuji S1 digital camera• Monitor manufacturers (i.e. Dell, HP,
NEC, …) do not specify the panel supplier(LG, Samsung, ..) or the pixel structure.
• Macro photographs or a high power loupecan be used to identify the structure.
85
FLY
NN
PVA (Samsung) S-IPS (LG) H-IPS (LG)
S.
BA
KE
R
?
B.
JO
NE
S Samsung Plane to Line structure(PLS) which is similar to IPS.
• Left: Apple iPad retinal display
• Right: Samsung Galaxy Tab 10.1
PanelTechnologies(S.Baker)
S.
BA
KE
R
LCDTech: Pixel Structures 86NERS/BIOE 481 - 2019
VIII. D.2 – Other Display Technologies
OLEDs
Organic Light Emitting Devices
87NERS/BIOE 481 - 2019
HTL
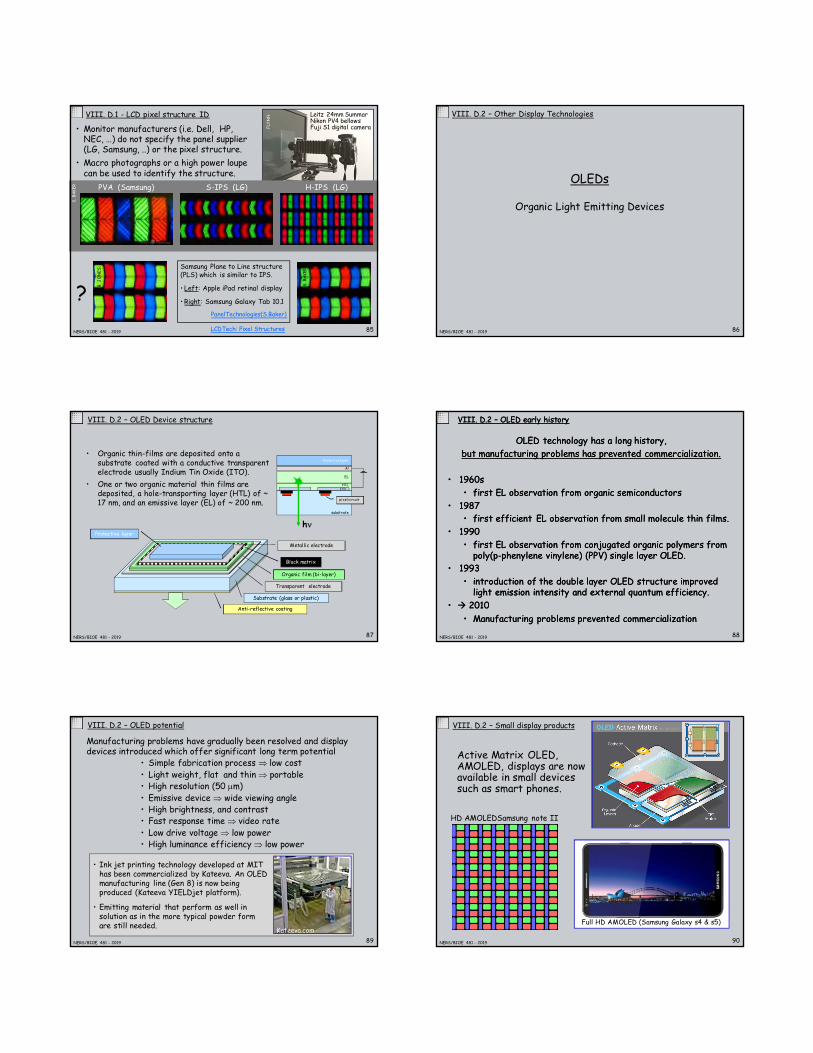
VIII. D.2 – OLED Device structure
• Organic thin-films are deposited onto asubstrate coated with a conductive transparentelectrode usually Indium Tin Oxide (ITO).
• One or two organic material thin films aredeposited, a hole-transporting layer (HTL) of ~17 nm, and an emissive layer (EL) of ~ 200 nm.
Substrate (glass or plastic)
Transparent electrode
Organic film (bi-layer)
Anti-reflective coating
Black matrix
Protective layer
Metallic electrode
substrate
ITO
Al
Protective layer
EL
pixel circuit
hn
88NERS/BIOE 481 - 2019
VIII. D.2 – OLED early historyVIII. D.2 – OLED early history
OLED technology has a long history,
but manufacturing problems has prevented commercialization.
• 1960s
• first EL observation from organic semiconductors
• 1987
• first efficient EL observation from small molecule thin films.
• 1990
• first EL observation from conjugated organic polymers frompoly(p-phenylene vinylene) (PPV) single layer OLED.
• 1993
• introduction of the double layer OLED structure improvedlight emission intensity and external quantum efficiency.
• 2010
• Manufacturing problems prevented commercialization
89NERS/BIOE 481 - 2019
VIII. D.2 – OLED potential
Manufacturing problems have gradually been resolved and displaydevices introduced which offer significant long term potential
• Simple fabrication process low cost
• Light weight, flat and thin portable
• High resolution (50 m)
• Emissive device wide viewing angle
• High brightness, and contrast
• Fast response time video rate
• Low drive voltage low power
• High luminance efficiency low power
• Ink jet printing technology developed at MIThas been commercialized by Kateeva. An OLEDmanufacturing line (Gen 8) is now beingproduced (Kateeva YIELDjet platform).
• Emitting material that perform as well insolution as in the more typical powder formare still needed.
Kateeva.com
90NERS/BIOE 481 - 2019
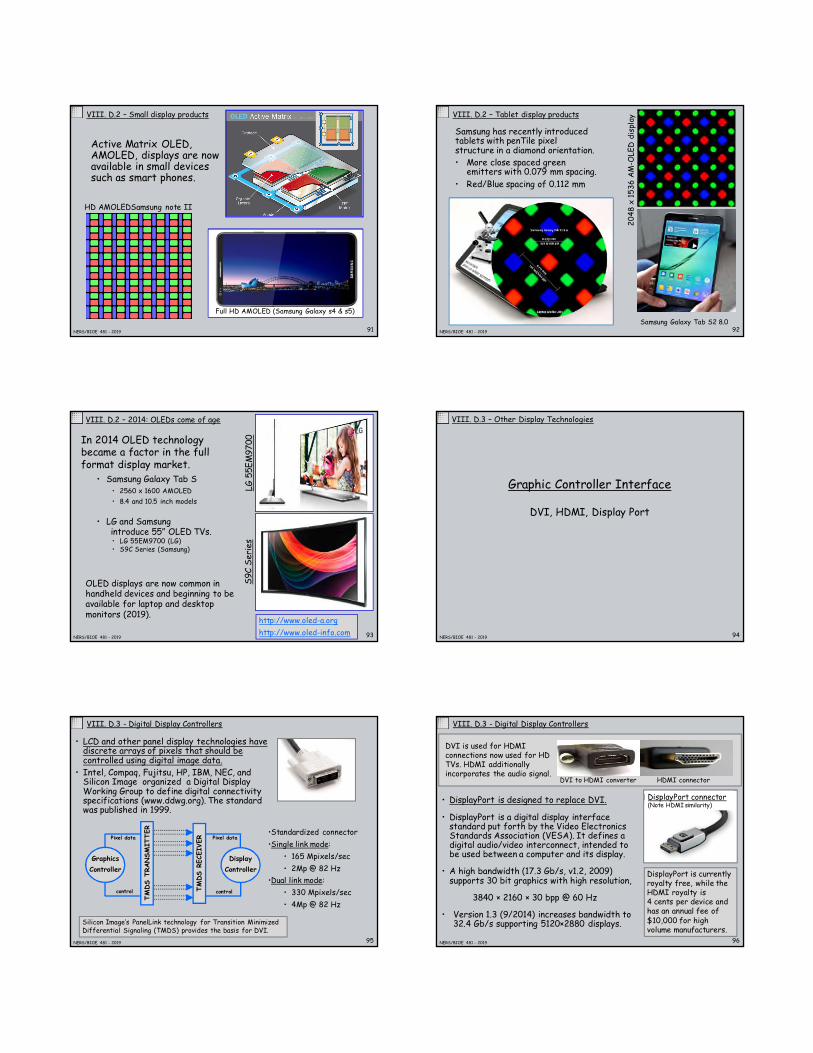
VIII. D.2 – Small display products
Active Matrix OLED,AMOLED, displays are nowavailable in small devicessuch as smart phones.
HD AMOLEDSamsung note II
Full HD AMOLED (Samsung Galaxy s4 & s5)
91NERS/BIOE 481 - 2019
VIII. D.2 – Small display products
Active Matrix OLED,AMOLED, displays are nowavailable in small devicessuch as smart phones.
HD AMOLEDSamsung note II
Full HD AMOLED (Samsung Galaxy s4 & s5)
92NERS/BIOE 481 - 2019
VIII. D.2 – Tablet display products
Samsung has recently introducedtablets with penTile pixelstructure in a diamond orientation.
• More close spaced greenemitters with 0.079 mm spacing.
• Red/Blue spacing of 0.112 mm
20
48
x15
36
AM
-OLE
Ddis
pla
y
Samsung Galaxy Tab S2 8.0
93NERS/BIOE 481 - 2019
VIII. D.2 – 2014: OLEDs come of age
In 2014 OLED technologybecame a factor in the fullformat display market.
• Samsung Galaxy Tab S
• 2560 x 1600 AMOLED
• 8.4 and 10.5 inch models
• LG and Samsungintroduce 55” OLED TVs.• LG 55EM9700 (LG)• S9C Series (Samsung)
http://www.oled-a.org
http://www.oled-info.com
LG
55E
M9700
S9C
Seri
es
OLED displays are now common inhandheld devices and beginning to beavailable for laptop and desktopmonitors (2019).
94NERS/BIOE 481 - 2019
VIII. D.3 – Other Display Technologies
Graphic Controller Interface
DVI, HDMI, Display Port
95NERS/BIOE 481 - 2019
• LCD and other panel display technologies havediscrete arrays of pixels that should becontrolled using digital image data.
• Intel, Compaq, Fujitsu, HP, IBM, NEC, andSilicon Image organized a Digital DisplayWorking Group to define digital connectivityspecifications (www.ddwg.org). The standardwas published in 1999.
VIII. D.3 - Digital Display Controllers
TM
DS
TRANSM
ITTER
TM
DS
RECEIVER
Graphics
Controller
Pixel data
control
Display
Controller
Pixel data
control
•Standardized connector
•Single link mode:
• 165 Mpixels/sec
• 2Mp @ 82 Hz
•Dual link mode:
• 330 Mpixels/sec
• 4Mp @ 82 Hz
Silicon Image’s PanelLink technology for Transition MinimizedDifferential Signaling (TMDS) provides the basis for DVI.
96NERS/BIOE 481 - 2019
• DisplayPort is designed to replace DVI.
• DisplayPort is a digital display interfacestandard put forth by the Video ElectronicsStandards Association (VESA). It defines adigital audio/video interconnect, intended tobe used between a computer and its display.
• A high bandwidth (17.3 Gb/s, v1.2, 2009)supports 30 bit graphics with high resolution,
3840 × 2160 × 30 bpp @ 60 Hz
• Version 1.3 (9/2014) increases bandwidth to32.4 Gb/s supporting 5120×2880 displays.
VIII. D.3 - Digital Display Controllers
DisplayPort is currentlyroyalty free, while theHDMI royalty is4 cents per device andhas an annual fee of
$10,000 for highvolume manufacturers.
HDMI connectorDVI to HDMI converter
DVI is used for HDMIconnections now used for HDTVs. HDMI additionallyincorporates the audio signal.
DisplayPort connector(Note HDMI similarity)


![[PPT]KURIKULUM PENDIDIKAN PROFESI NERS DI … · Web view* Sarana Penunjang Pendidikan KURIKULUM NERS - TORAJA 2011 * Sarana Penunjang Pendidikan KURIKULUM NERS - TORAJA 2011 Ruang2](https://static.fdocuments.us/doc/165x107/5ae1e0e77f8b9a5b348b9459/pptkurikulum-pendidikan-profesi-ners-di-view-sarana-penunjang-pendidikan.jpg)