NEREIS - Revistas de la Universidad Católica de Valencia
64
Transcript of NEREIS - Revistas de la Universidad Católica de Valencia


NEREIS Revista Iberoamericana Interdisciplinar de Métodos, Modelización y Simulación

Nereis. Revista Iberoamericana Interdisciplinar de Métodos, Modelización y SimulaciónNereis. Interdisciplinary Ibero-American Journal of Methods, Modelling and Simulation
Les presento la revista de la Universidad Católica de Valencia “San Vicente Mártir”: Nereis. Revista Iberoamericana Interdisciplinar de Métodos, Modelización y Simulación.
Tiene como objetivo promocionar y difundir la investigación interdisciplinar basada en nuevos métodos, modelización matemática, el análisis de datos y las simulaciones numérico-computacionales en dos áreas generales del conocimiento: ciencias de la vida y ciencias técnicas.
Pretendemos que los artículos en esta revista, escritos en inglés o en español, tengan rigor y precisión y lleguen a toda la comunidad científica y tecnológica, especialmente al ámbito iberoamericano. La revista tendrá una periodicidad anual.
Please allow me to introduce the journal of the Universidad Católica de Valencia “San Vicente Mártir”: Nereis. Interdisciplinary Ibero-American Journal of Methods, Modelling and Simulation.
The aim of the journal is to promote and disseminate interdisciplinary research based on new methods, mathematical modelling and data analysis and computational numeric simulations in two general areas of knowledge: Life Sciences and Technical Sciences.
We anticipate that the articles in this journal, written in English or Spanish, will be rigorous and accurate and will reach all the scientific and technological community, especially in the Ibero-American sphere. The journal will be published yearly.
Servicio de Venta:Universidad Católica de Valencia “San Vicente Mártir”. Servicio de Publicaciones
Calle Guillem de Castro, 65 bajo. 46008 Valencia. EspañaTeléfono: +34 963 637 412. Fax: +34 963 153 655
www.ucv.es/publicaciones_0.asp
Servicio de Intercambio: Biblioteca de la Universidad Católica de Valencia “San Vicente Mártir”
Calle Guillem de Castro, 175. 46008 Valencia. EspañaTeléfono: +34 96 363 74 12. Fax: + 34 96 391 98 27
EditaVicerrectorado de Investigación, Desarrollo e InnovaciónUniversidad Católica de Valencia “San Vicente Mártir”
Servicio de PublicacionesCalle Quevedo, 2. 46001 Valencia. España
Tel. +34 963 637 [email protected] www.ucv.es
Diseño de la portada: Vicente OrtuñoMaquetación: Communico, C.B.
Impresión: Gráficas Soler, S.L.
Depósito legal: V-2858-2008ISSN: 1888-8550
Periodicidad anual
Nereis. Revista Iberoamericana Interdisciplinar de Métodos, Modelización y Simulación
La revista Nereis se dirige y se coordina desde la Facultad de Ciencias Experimentales de la Universidad Católica de Valencia “San Vicente Mártir” (UCV)
Campus de Santa Úrsula. C/ Guillem de Castro, 94 Valencia 46001Teléfono: 963 637 412. Extensión: 20000
www.ucv.es/index.aspx
Responsable de la RevistaJosé Tena Medialdea
(Universidad Católica de Valencia “San Vicente Mártir”)
Directora de la RevistaGloria M.ª Castellano Estornell
(Universidad Católica de Valencia “San Vicente Mártir”)
SecretarioJuan Luis González Martínez
(Universidad Católica de Valencia “San Vicente Mártir”)
Comité CientíficoEduardo Alberto Castro (Universidad Nacional de La Plata)
Pedro José Fernández de Córdoba Castellá (Universidad Politécnica de Valencia)Gretel Geada López (Universidad de Pinar del Río)
José María Isidro San Juan (Universidad Politécnica de Valencia)Yovani Marrero Ponce (Universidad Central “Marta Abreu” de Las Villas)
Ramón Martínez Máñez (Universidad Politécnica de Valencia)Guillermo Ramis Ramos (Universidad de Valencia)
Francisco Torrens Zaragozá (Universidad de Valencia)Javier F. Urchueguía Schölzel (Universidad Politécnica de Valencia)
Comité EditorialJavier Alcántara Carrión (Universidad Católica de Valencia “San Vicente Mártir”)
Ysaias J. Alvarado (La Universidad del Zulia (LUZ)) M.ª José Aurell Piquer (Universidad de Valencia)
Rafael Castañeda Sánchez (Universidad Católica de Valencia “San Vicente Mártir”)Juan Carlos Castro Palacio (Universidad de Pinar del Río)Wilfredo Falcón Urquiaga (Universidad de Pinar del Río)
Albert Ferrando Cogollos (Universidad de Valencia)Humberto González-Díaz (Universidad de Santiago de Compostela)
Germán Martín González (Universidad Católica de Valencia “San Vicente Mártir”)Isabel Morera Bertomeu (Universidad Politécnica de Valencia)
Luz Hicela Mosquera Mosquera (Universidad Tecnológica del Chocó) Mario Zacarés González (Universidad Católica de Valencia “San Vicente Mártir”)


Yovani Marrero Ponce, Alma Huesca Guillén, Yunaymi Echevarría Díaz, Francisco Torrens Zaragozá and Froylán Ibarra VelardeNovel Ligand-Based Approach to Screening of Large Databases for Paramphistomicide Lead Generation ..........................9
Francisco Torrens Zaragozá Polymer Bisphenol-A, the Incorporation of Silica Nanospheres into Epoxy–Amine Materials and Polymer Nanocomposites .....................................................................................................................................17
Raymari Reyes Chirino, Jorge Garrido González, Ramón Alexander Jaime Infante, Vinelia Córdova Vázquez, Julián Triana Dopico, Lizzael Villar Garcia, Juan Carlos Castro Palacio, Pedro Fernández de Córdoba Castellá, Javier Fermín Urchueguía Schölzel, Emilio Navarro Peris, y Arnau Montagud AquinoDesarrollo de una plataforma computacional para el modelado metabólico de microorganismos .....................................25
Ana Martí García, Enric Massuti Sureda and Patricia González GonzálezPennella filosa (Linnaeus, 1758) (Copepoda, Siphonostomatoida, Pennellidae) from Coryphaena hippurus Linnaeus, 1758 (Pisces, Coryphaenidae) captured in western Mediterranean (Balearic Islands). Morphological and biological aspects ................................................................................................................................................33
Ricardo Cruz Nardo, Alfredo Cabrera Hernández, Bárbaro Moya González and Yarisbel García QuintanaNatural coastal risks and the Coastal Zone Integrated Management .............................................................................37
Luz Hicela Mosquera Mosquera, Gemma Moraga Ballesteros, Nuria Martínez Navarrete, y M.ª Amparo Chiralt Boix Isotermas de sorción y transición vítrea de la pulpa de borojó (Borojoa patinoi Cuatr.) .................................................45
Juan Luis González Santander y Germán Martín González Análisis de la fórmula para la calificación de pruebas tipo test multi-respuesta ..............................................................53
NORMAS DE ADMISIÓN Y PRESENTACIÓN DE LAS COLABORACIONES ..............................................61
ÍNDICEINDEX
NEREIS 3 [Marzo 2011], 1-62, ISSN: 1888-8550


NEREIS 3 [Marzo 2011], 9-15, ISSN: 1888-8550
Novel Ligand-Based Approach to Screening of Large Databases for Paramphistomicide Lead Generation
Fechas de recepción y aceptación: 2 de diciembre de 2010, 3 de enero de 2011 Y. Marrero-Ponce†‡ , A. Huesca Guillén∞, Y. Echevarría Diaz†, F. Torrens Zaragozᇠand F. Ibarra Velarde∞
† Unit of Computer-Aided Molecular ‘Biosilico’ Discovery and Bioinformatic Research (CAMD-BIR Unit). Central University of Las Villas, Santa Clara, 54830, Villa Clara, Cuba. ‡ Institut Universitari de Ciència Molecular, Universitat de València, Edifici d’Instituts de Paterna, P. O. Box 22085, 46071, Valencia, Spain. ∞ Departament of Parasitology, Faculty of Veterinarian Medicinal and Zootecnic. UNAM, México, D.F. 04510, México.
Nereis. Revista Iberoamericana Interdisciplinar de Métodos, Modelización y Simulación
3 9-15 Universidad Católica de Valencia “San Vicente Mártir”
Valencia (España) ISSN 1888-8550
ABSTrAcT
In this report, non-stochastic and stochastic 2D atom-based linear indices were used to the discrimination of paramphistomicide compounds from inactive ones. Two linear classification-based QSAR models were obtained. These equations, performed considering both non-stochastic and stochastic TOMOCOMD-CARDD descriptors, classify correctly 88.57% of chemicals in database, for a good Mathew’s correlation coefficient of 0.77. A few anthelmintics compounds and other drugs from the Merck Index, Negwer handbook, and Goodman & Gilman were selected/identified by the models as possible paramphistomicide, one of them was found in the recent literature as possessing this activity. The results demonstrate the usefulness of TOMOCOMD-CARDD method for drug discovery of new lead paramphistomicide compounds.
KEYworDS: linear discriminant analysis, TOMOCOMD-CARDD method, atom-based linear indices, QSAR, virtual screening, paramphistomicides.
rESUMEN
En este informe se emplearon índices lineales estocásticos y no estocásticos en 2D, basados en átomos, para discriminar los compuestos de acción paramfistomicida de los inactivos. Se obtuvieron dos modelos lineales QSAR basados en la clasificación. Estas ecuaciones, llevadas a cabo teniendo en cuenta descriptores TOMOCOMD-CARDD tanto estocásticos como no estocásticos, clasifican correctamente el 88,57% de los elementos químicos de la base de datos, arrojando un buen coeficiente de correlación de Mathews del 0,77. Los modelos seleccionaron/identificaron algunos compuestos antihelmínticos y otros fármacos del índice Merck, del manual Negwer y de Goodman & Gilman como posibles paramfistomicidas, y la literatura reciente incluye a uno de ellos como poseedor de esta actividad. Los resultados demuestran la utilidad del método TOMOCOMD-CARDD para el descubrimiento de fármacos y de nuevos compuestos líderes de acción paramfistomicida.
PALABrAS cLAVE: análisis discriminante lineal, método TOMOCOMD-CARDD, índices lineales basados en átomos, QSAR, cribado virtual, paramfistomicidas.
INTroDUcTIoN
“Models are to be used, not believed”.Menger, F.M J.Am.Chem.Soc. 107 (1985) 3105
Paramphistomiasis is one of the important groups of parasitic diseases in several continents.1-4 This illness caused by a number of species of paramphistomes is responsible for sporadic epizootics of acute parasitic enteritis accompanied with persistent fetid diarrhea in ruminants.4 Adult flukes in the rumen (first stomach or paunch) or reticulum (second stomach or honeycomb) for instance, are not known to cause clinical disease. However, heavy infections with immature flukes in the upper small intestine can cause serious ill-health and death. To control paramphistomiasis, regular use of anthelmintics is still the most practicable method.5 Chemotherapeutic trials have been conducted under both natural and experimental conditions with variable results.
There is a danger of being swept up in the hype and excitement surrounding the area of bioinformatic and it is clear that in silico predictive modeling does not represent a panacea for the industry. However, nowadays is accepted that the implementation and integration of the opportunity presented by in silico modeling needs to be carried out in a “rational” and systematic manner.6 The creation of new lead-paramphistomicide compounds by this experimental approach (probe and error method) is a long and complicated process which is based on several factors.6 An alternative to the “real” world of synthesis and screening of compounds in the laboratory is an in silico “virtual” world of data, analysis, hypothesis and design that reside inside a computer. By this means, “the expensive commitment to actual synthesis and bioassay is made only after exploring the initial concepts with computational models and screens”.7
Predictive in silico models could be used for structural subsystems identification (from large databases or libraries), accelerating the selection/identification of lead-paramphistomicide compounds.6

NEREIS 3 [Marzo 2011], 9-15, ISSN: 1888-8550
Y. Marrero Ponce et al.10
Therefore, predictive modeling has the potential to transform early-stage drug discovery. In connection, computer-aided drug design has emerged as a rational alternative in the search for novel drugs.7-8 and medicinal chemists are called to developing more efficient strategies for the search of novel candidates to be assayed as paramphistomicide drugs. In relation with it, TOMOCOMD-CARDD (acronym of the TOpological MOlecular COMputer Design-Computed-Aided Rational Drug.
Design) method has demonstrated to be a useful approach for discovery (identification/selection) of new lead or drug-like compounds with desirable activities.9-20
The main aims of this paper follow: 1) to develop quantitative models that discriminates paramphistomicide compounds from the inactive ones using TOMOCOMD-CARDD approach (2D atom-based linear indices) and Linear Discriminant Analysis (LDA), and 2) to perform a virtual (computational) screening for the search of new lead-paramphistomicide compounds.
In order to assure an adequate extrapolation power for the LDA models, a data set with a great molecular diversity was chosen. We have selected 35 organic chemicals for making up the data set, 20 with paramphistomicide activity, considering different modes of action, and the rest, 15, without this parasiticide activity (inactives).21-70 Table SD1 gives the names of all the drugs studied (see supplementary data).
It is remarkable to stand out that, the most critical aspect of the construction of the training (learning) sets is to warranty a great molecular and action modes diversity in this data set. Figure 1 depicts a representative sample of such drugs. Both active and inactive compounds are representatives of most of the different structural patterns and modes of action of anthelmintic drugs, such as: a) agonist at nicotinic acetylcholine receptors (levamisole and metyridine); b) cholinesterase antagonists (profenofos and trichlorfan); c) glutamate-gated chloride receptor potentiators (moxidectin); d) increased calcium permeability (praziquantel); e) Inhibition of microtubule formation (albendazole, netobimin and fenbendazole); f ) proton ionophores (bithionol, niclosamide, and rafoxanide); g) inhibition of phosphoglycerate kinase and mutase (clorsulon), and so on.71-72
Later, the molecular structure of each organic-chemical compounds in dataset was coded using non-stochastic and stochastic 2D atom-based linear indices.10-12,14,20 These MDs were calculated using the ‘in house’ TOMOCOMD-CARDD software.9 The total and local (atom, group, and atom-type) linear indices for small-to-medium sized organic compounds have been explained in some detail in the literature.10-
12,14,20 The atom-based TOMOCOMD-CARDD MDs computed in this study were the following: i) kth (k = 15) total (global) non-stochastic atom-based linear indices not considering and considering
H-atoms in the molecule [fk( x ) and fkH( x ), respectively], ii) kth (k
= 15) local (group = heteroatoms: S, N, O) atom-based linear indices
not considering and considering H atoms in the molecule, fkL( x E)
and fkLH( x E), correspondingly. These local descriptors are putative
molecular charge, dipole moment, and H-bonding acceptors, iii) kth (k = 15) local (atom-type = H atoms bonding to heteroatoms: S, N, O) atom-based linear indices considering H atoms in the molecule,
fkLH( x E-H),. These local descriptors are putative H-bonding donors
(hydrogen bonding capacity), lipophilicity, and so on, and iv) The kth
total [sfk( x ) and sfkH( x )] and group [sfk( x E),
sfkH( x E) and sfk
H( xE-H)] atom-based stochastic linear indices were also computed. Here, we
used the symbols fk( x ) and sfk( x ) for non-stochastic and stochastic atom-based linear indices, respectively.10-12,14,20
LDA, an heuristic algorithm capable of distinguishing among two or more categories of objects, is a useful technique to find discriminant functions with the ability to distinguish between two groups or populations.73 To derive discriminant functions that permit the classification of lead-like compounds as positive (presence of paramphistomicide activity) or negative (absence of paramphistomicide activity), we used LDA in which non-stochastic and stochastic atom-based linear indices were used as independent variables. For obtaining LDA-based QSAR models, we used the statistic package STATISTICA.74 Forward stepwise procedure was fixed as the strategy for variable selection and the principle of parsimony (Occam’s razor) was taken into account as strategy for model selection.75 The quality of the models was mainly determined by examining Wilk’s lambda (λ) parameter (U-statistic) and the Mahalanobis distance (D2). We also inspected the Fisher ratio (F), the p level (p), and the ratios between the cases and the variables in the equation and variables to be explored in order to avoid overfitting or chance correlation as well as the percentage of good classification in the training and test sets.74,75 Validation of the models was also corroborated by means of a leave-one-out (LOO) cross-validation procedure. We also developed the linear discriminant canonical analysis by checking the following statistic: Canonical regression coefficient (Rcan), Chi-squared and its p-level [p(χ2)].76
Discriminant ability was assessed in terms of the proportion of correct classifications in each set. The classification of cases was performed by means of the posterior classification probabilities. By using the models one compound can be then classified as active, if ∆P% > 0, being ∆P% = [P(Active) - P(Inactive)]x100 or as inactive otherwise. P(Active) and P(Inactive) are the probabilities that the equations classify a compound as active and inactive, respectively. The probability that a case belongs to a particular group is basically proportional to the Mahalanobis distance from that group centroid. In closing, the posterior probability is the probability, based on our knowledge of the values of others variables, that the respective case belongs to a particular group.
The classification obtained models are given below together with the LDA-statistical parameters:
Class = 3.34 +2.76x10⁻²f3( x ) -7.57x10⁻⁹f15( x ) -4.01f1( x ) -
7.16x10⁻⁵f11L( x Hal) +1.99x10⁻⁶f14L( x Hal) (1)N = 35 λ = 0.445 F(5.29) = 7.1266 Rcan = 0.74 x2 = 24.44 Mean (+) = -0.93 Mean (-) = 1.24 C = 0.77 Q = 88.57% p<0.0002
Class = 3.79 +1.39 f0H( x ) -2.98 f2
H( x ) +10.28 f11H( x )
+1.14 f14H( x ) -9.87 f15
H( x ) (2)
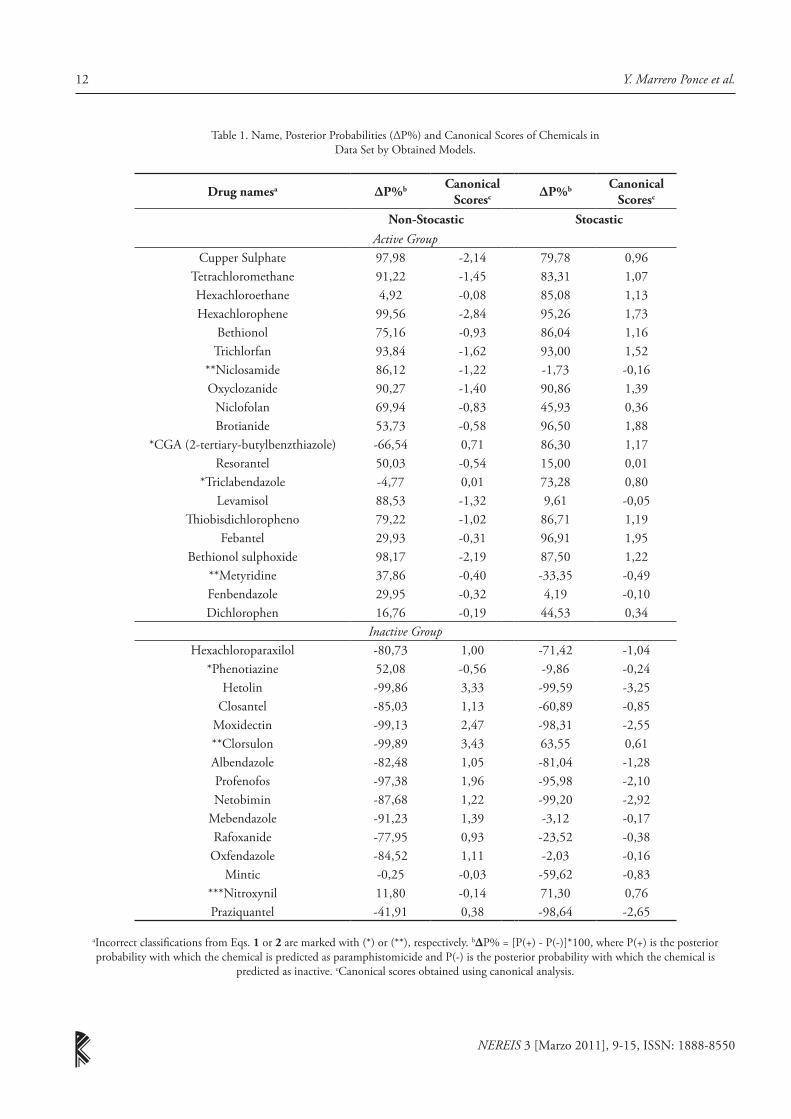
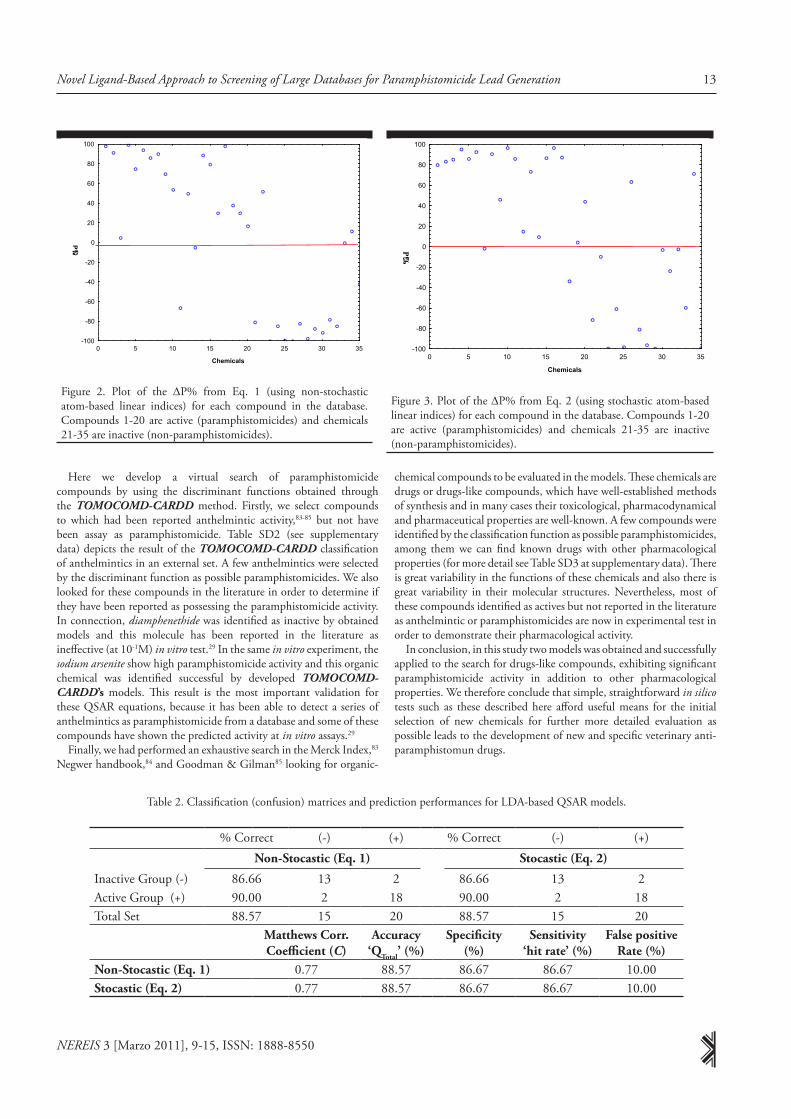
N = 35 λ = 0.49 F(5.29) = 5.9642 Rcan = 0.71 x2 = 21.57 Mean (+) = 0.85 Mean (-) = -1.13 C = 0.77 Q = 88.57% p<0.0007where N is the number of compounds. The classification results (including the canonical scores) for the database (active and inactive ones) with the models 1 and 2 is given as Table 1. In addition, we provide a plot with the ∆P% for the actives and inactives using the non-stochastic and stochastic atom-based linear indices (see Figures 2 and 3).

NEREIS 3 [Marzo 2011], 9-15, ISSN: 1888-8550
11Novel Ligand-Based Approach to Screening of Large Databases for Paramphistomicide Lead Generation
In Table 2 we illustrate the results obtained in the classification of compounds of the data set using both MDs. As it can be observed in Table 2 both fitted models exhibit good results. These two models correctly classified the 88.57% (accuracy) of the training set and showed high Matthews correlation coefficients (C) of 0.77. Table 2 also depicts the values of specificity, sensitivity and false positive rate (also known as ‘false alarm rate’), statistical parameters very used in QSAR studies.77
To assess the predictability of the discriminant models, a LOO cross-validation was carried out. This methodology systematically removed one data point at a time from the data set. A discriminant model was then constructed on the basis of this reduced data set and subsequently used to predict the removed data point. This procedure was repeated until a complete set of predicted classification was obtained. The global classification of the LOO cross-validation procedure was the same that for data set in both equations (accuracy of 88.57%).
On the other hand, the massive cost of developing new drugs, coupled with candidate attrition rates during the discovery and development processes, highlights the need for a ‘sea change’ in the drug discovery paradigm.6 In order to reduce costs, pharmaceutical companies have to find new technologies to replace the old ‘hand-crafted’ synthesis and testing new chemical entities (NCE) approaches.78 In this sense, cheminformatics can be used to analyze data from high-throughput screening (HTS) and other forms of chemistry, thereby aiding in the identification of optimal lead structures.79 In this sense, ligand-based in silico screening80 has emerged as an interesting alternative to HTS.81,82 By this means, computational techniques are used to select a reduced number of potentially active compounds from large available chemical or virtual combinatorial libraries. The main aim of this approach is to discriminate potent candidate molecules from inactive ones. This kind of in silico studies avoid the expensive commitment to actual synthesis and bioassays which are made only after exploring the initial concepts with computational model.8
Sample Active Group
Cl
Cl
ClCl
Cl
Cl
Hexachloroethane
S
Cl
ClOH OH
Cl
ClBithionol
H3CO P
O
H3CO
CCl3
OH
Trichlorfan
OHN
Cl
NO2HO
ClNiclosamide
N O
MetyridyneS N
HN
NHO
O
Fenbendazole
N
N
O
O
Praziquantel
HN
S
HN
NHNH
O
O
OO O
FebantelS
O
O
O
O
Cu
Cupper Sulphate
N
N SH
Levamisole
Sample Inctive Group
OHI NO2
CNNitroxynil
Cl
Cl
Cl
N
O
N
Hetolin
S
HN
Phenotiazine
SO
ONH2
NH2
SO
OH2N
ClCl
Cl
Clorsulon
S N
HN
NHO
O
Albendazole
S
NO2
N
HN
HN
OCH3
SO3H
O
Netobimin
Cl
O
Br
PS
O
O
Profenofos
OHN
IICl
O
Cl
Rafoxanide
Figure 1. Random, but not exhaustive, sample of the molecular families of compounds studied here.
NEREIS 3 [Marzo 2011], 9-15, ISSN: 1888-8550
Y. Marrero Ponce et al.12
Table 1. Name, Posterior Probabilities (∆P%) and Canonical Scores of Chemicals inData Set by Obtained Models.
Drug namesa ∆P%b canonical Scoresc ∆P%b canonical
Scoresc
Non-Stocastic StocasticActive Group
Cupper Sulphate 97,98 -2,14 79,78 0,96Tetrachloromethane 91,22 -1,45 83,31 1,07Hexachloroethane 4,92 -0,08 85,08 1,13Hexachlorophene 99,56 -2,84 95,26 1,73
Bethionol 75,16 -0,93 86,04 1,16Trichlorfan 93,84 -1,62 93,00 1,52
**Niclosamide 86,12 -1,22 -1,73 -0,16Oxyclozanide 90,27 -1,40 90,86 1,39
Niclofolan 69,94 -0,83 45,93 0,36Brotianide 53,73 -0,58 96,50 1,88
*CGA (2-tertiary-butylbenzthiazole) -66,54 0,71 86,30 1,17Resorantel 50,03 -0,54 15,00 0,01
*Triclabendazole -4,77 0,01 73,28 0,80Levamisol 88,53 -1,32 9,61 -0,05
Thiobisdichloropheno 79,22 -1,02 86,71 1,19Febantel 29,93 -0,31 96,91 1,95
Bethionol sulphoxide 98,17 -2,19 87,50 1,22**Metyridine 37,86 -0,40 -33,35 -0,49Fenbendazole 29,95 -0,32 4,19 -0,10Dichlorophen 16,76 -0,19 44,53 0,34
Inactive GroupHexachloroparaxilol -80,73 1,00 -71,42 -1,04
*Phenotiazine 52,08 -0,56 -9,86 -0,24Hetolin -99,86 3,33 -99,59 -3,25
Closantel -85,03 1,13 -60,89 -0,85Moxidectin -99,13 2,47 -98,31 -2,55**Clorsulon -99,89 3,43 63,55 0,61Albendazole -82,48 1,05 -81,04 -1,28Profenofos -97,38 1,96 -95,98 -2,10Netobimin -87,68 1,22 -99,20 -2,92
Mebendazole -91,23 1,39 -3,12 -0,17Rafoxanide -77,95 0,93 -23,52 -0,38
Oxfendazole -84,52 1,11 -2,03 -0,16Mintic -0,25 -0,03 -59,62 -0,83
***Nitroxynil 11,80 -0,14 71,30 0,76Praziquantel -41,91 0,38 -98,64 -2,65
aIncorrect classifications from Eqs. 1 or 2 are marked with (*) or (**), respectively. b∆P% = [P(+) - P(-)]*100, where P(+) is the posterior probability with which the chemical is predicted as paramphistomicide and P(-) is the posterior probability with which the chemical is
predicted as inactive. cCanonical scores obtained using canonical analysis.
NEREIS 3 [Marzo 2011], 9-15, ISSN: 1888-8550
13Novel Ligand-Based Approach to Screening of Large Databases for Paramphistomicide Lead Generation
Here we develop a virtual search of paramphistomicide compounds by using the discriminant functions obtained through the TOMOCOMD-CARDD method. Firstly, we select compounds to which had been reported anthelmintic activity,83-85 but not have been assay as paramphistomicide. Table SD2 (see supplementary data) depicts the result of the TOMOCOMD-CARDD classification of anthelmintics in an external set. A few anthelmintics were selected by the discriminant function as possible paramphistomicides. We also looked for these compounds in the literature in order to determine if they have been reported as possessing the paramphistomicide activity. In connection, diamphenethide was identified as inactive by obtained models and this molecule has been reported in the literature as ineffective (at 10-1M) in vitro test.29 In the same in vitro experiment, the sodium arsenite show high paramphistomicide activity and this organic chemical was identified successful by developed TOMOCOMD-CARDD’s models. This result is the most important validation for these QSAR equations, because it has been able to detect a series of anthelmintics as paramphistomicide from a database and some of these compounds have shown the predicted activity at in vitro assays.29
Finally, we had performed an exhaustive search in the Merck Index,83 Negwer handbook,84 and Goodman & Gilman85 looking for organic-
chemical compounds to be evaluated in the models. These chemicals are drugs or drugs-like compounds, which have well-established methods of synthesis and in many cases their toxicological, pharmacodynamical and pharmaceutical properties are well-known. A few compounds were identified by the classification function as possible paramphistomicides, among them we can find known drugs with other pharmacological properties (for more detail see Table SD3 at supplementary data). There is great variability in the functions of these chemicals and also there is great variability in their molecular structures. Nevertheless, most of these compounds identified as actives but not reported in the literature as anthelmintic or paramphistomicides are now in experimental test in order to demonstrate their pharmacological activity.
In conclusion, in this study two models was obtained and successfully applied to the search for drugs-like compounds, exhibiting significant paramphistomicide activity in addition to other pharmacological properties. We therefore conclude that simple, straightforward in silico tests such as these described here afford useful means for the initial selection of new chemicals for further more detailed evaluation as possible leads to the development of new and specific veterinary anti-paramphistomun drugs.
0 5 10 15 20 25 30 35
Chemicals
-100
-80
-60
-40
-20
0
20
40
60
80
100
DP%
Figure 2. Plot of the ∆P% from Eq. 1 (using non-stochastic atom-based linear indices) for each compound in the database. Compounds 1-20 are active (paramphistomicides) and chemicals 21-35 are inactive (non-paramphistomicides).
0 5 10 15 20 25 30 35
Chemicals
-100
-80
-60
-40
-20
0
20
40
60
80
100
DP%
Figure 3. Plot of the ∆P% from Eq. 2 (using stochastic atom-based linear indices) for each compound in the database. Compounds 1-20 are active (paramphistomicides) and chemicals 21-35 are inactive (non-paramphistomicides).
Table 2. Classification (confusion) matrices and prediction performances for LDA-based QSAR models.
% Correct (-) (+) % Correct (-) (+)Non-Stocastic (Eq. 1) Stocastic (Eq. 2)
Inactive Group (-) 86.66 13 2 86.66 13 2Active Group (+) 90.00 2 18 90.00 2 18Total Set 88.57 15 20 88.57 15 20
Matthews corr.coefficient (C)
Accuracy‘QTotal’ (%)
Specificity(%)
Sensitivity‘hit rate’ (%)
False positiverate (%)
Non-Stocastic (Eq. 1) 0.77 88.57 86.67 86.67 10.00Stocastic (Eq. 2) 0.77 88.57 86.67 86.67 10.00

NEREIS 3 [Marzo 2011], 9-15, ISSN: 1888-8550
Y. Marrero Ponce et al.14
LITErATUrE cITED
“A bibliography is provided not only as a guide to further reading, but also in acknowledgment of works I have consulted and used”
R. A. Close
1. ANANTARAMAN, M. Indian Vet. J. 1958, 35, 181.2. MANNA, A. K.; PRAMANIK, S.; MUKHERJEE, G. S. Indian J.
Anm. Hlth. 1994, 33, 25.3. FAIRWEATHER, I.; BORAY, J. C. Vet. J. 1999, 158, 81.4. MALVIYA, H. C.; PRASAD, A.; VARMA, T. K.; DWIVEDI, P.
Indian Vet. J. 1994, 71, 222.5. GILL, J. S.; BALI, H. S. Indian Vet. Med. J. 1987, 11, 231. 6. WATSON, C. Biosilico. 2003, I, 83.7. ESTRADA, E.; PEñA, A. Bioor. Med. Chem. 2000, 8, 2755.8. KUBINYI, H.; TAYLOR, J.; RAMDSEN, C. In Quantitative Drug
Design. Comprehensive Medicinal Chemistry; Hansch, C., Ed.; Pergamon: Oxford, 1990.
9. MARRERO-PONCE, Y.; ROMERO, V. TOMOCOMD soft-ware, Central University of Las Villas, 2002. TOMOCOMD (TOpological MOlecular COMputer Design) for Windows, version 1.0 is a preliminary experimental version; in future a professional version will be obtained upon request to Marrero: [email protected] or [email protected].
10. MARRERO-PONCE, Y. J. Chem. Inf. Comput. Sci. 2004, 44, 2010.
11. CASAñOLA-MARTíN, G. M.; KHAN, M. T. H.; MARRERO-PONCE, Y.; ATHER, A.; SULTANKHODZHAEV, M. N.; TORRENS, F. Bioorg. Med. Chem. Lett. 2006, 16, 324.
12. MENESES-MARCEL, A.; MARRERO-PONCE, Y.; MA-CHADO-TUGORES, Y.; MONTERO-TORRES, A.; MONTERO PEREIRA, D.; ESCARIO, J. A.; NOGAL-RUIZ, J. J.; OCHOA, C.; ARáN, V. J.; MARTíNEZ-FERNáNDEZ, A. R.; GARCíA SáNCHEZ, R. N. Bioorg. Med. Chem Lett. 2005, 17, 3838.
13. MARRERO-PONCE Y., MEDINA-MARRERO R., TORRENS F., MARTINEZ Y., ROMERO-ZALDIVAR V., CASTRO E.A. Bioorg. Med. Chem, 2005, 13, 2881.
14. MARRERO-PONCE Y., MEDINA-MARRERO R., MAR-TINEZ Y., TORRENS F., ROMERO-ZALDIVAR V., CASTRO E.A. J. Mol. Mod. 2006, 12, 255.
15. MARRERO-PONCE, Y.; IYARRETA-VEITíA, M.; MON-TERO-TORRES, A.; ROMERO-ZALDIVAR, C.; BRANDT, C. A.; áVILA, P. E.; KIRCHGATTER, K. J. Chem. Inf. Model. 2005, 45, 1082.
16. MARRERO-PONCE Y. Bioorg. Med. Chem. 2004, 12, 6351.17. MARRERO-PONCE Y., GONZáLEZ-DíAZ H., ROMERO-
ZALDIVAR V., TORRENS F., CASTRO E.A. Bioorg. Med. Chem. 2004, 12, 5331.
18. MARRERO-PONCE, Y.; CASTILLO-GARIT, J. A.; OLA-ZABAL, E.; SERRANO, H. S.; MORALES, A.; CASTAñEDO, N.; IBARRA-VELARDE, F.; HUESCA-GUILLEN, A.; JORGE, E.; DEL VALLE, A.; TORRENS, F.; CASTRO, E. A. J. Comput.-Aided Mol. Design. 2004, 18, 615.
19. MARRERO-PONCE, Y.; HUESCA-GUILLEN, A.; IBARRA-VELARDE, F. J. Theor. Chem. (THEOCHEM). 2005, 717, 67.
20. MARRERO-PONCE, Y.; MONTERO-TORRES, A.; RO-MERO-ZALDIVAR, C.; IYARRETA-VEITíA, I.; MAYÓN PERéZ, M.; GARCíA SáNCHEZ, R. Bioorg. Med. Chem. 2005, 13, 1293.
21. BORAY, J. C. Austr. Vet. J. 1959, 35, 282. 22. BAWA, H. S. Indian J. Vet. Sci. 1939, 9, 425.
23. ORLOVA, K.V. Veterinariya. 1953, 4, 20.24. DEUSOV, N. L. Veterinariya. 1955, 4, 36.25. FEDORCENKO, H. G. Veterinarija. 1965, 42, 65.26. GILL, J. S.; BALI, H. S. Indian J. Animal Res. 1987, 21, 45. 27. BOSMAN, C. J.; THOROLD, P. W.; PURCHARSE, H. S. J S
Afr Vet Ass. 1961, 32, 227. 28. ROLFE, P. F.; BORAY, J. C. Aust Vet. J. 1987, 64, 328.29. PROBERT, A. J.; SHARMA, R.K.; SINGH, K.; SAxENA, R. J
Helminthol. 1981, 55, 115.30. BINDUMADHAV, A. Cheiron. 1980, 9, 258. 31. FEDORCHENKO, N.G. Veterinarija, 1966, 43, 39.32. HORAK, I. G. J S Afr Vet Med Ass. 1965, 36, 561.33. MEREMINSKIJ, A.T.; GLUZMAN, I.Y.; ARTEMENKO, Y.G.
Veterinariya. 1968, 45, 51.34. NIKITIN, V. F.; PROSHIN, Y. G.; SOLONIMKIN, V. G.;
AGAFONOV, M. I.; ASMOLOV, T. A.; MESHCHERYAKOV, A. V. Bui. Vses. Inst. GELAN 1972, 8, 45.
35. CVETKOVIC, L. Veter. Glasnik. 1968, 22, 41.36. TRIFONOR, T.; DUSHEPEEVA, Y.; MESHEKOV, S.;
BELKOV. D. Veterinarna Sbirka. 1974. 71, 18.37. MEREMINSKIJ, A. I.; GLUZMAN, I. Veterinarija. 1966, 6, 24.38. BORAY, J. C.; HAPPICH, F. A.; ANDREWS, J. C. Vet. Res.
1967, 80, 218.39. BORAY, J C. Australian Vet. J. 1969, 45, 133.40. HARDER, A. Parasitol Res. 2002, 88, 477.41. ROLFE, P. F.; BORAY, J. C.; Aust. Vet. J. 1988, 65, 148.42. GEVREY, J.; BOURDOISEAU, G.; Le Point Veterinaire. 1998,
29, 807.43. SEY, O.; KASSAI, T. Rep. Hung. Acad. Sd. and Ministr. Food and
Agric. Budapest, 1984, 12.44. RAHMAN, A. Vet. Med. Rev. 1980, 1, 50. 45. ALZIEU, J. P. ; BERGEAUD, J. P.; DORCHIES, P. Revue de Méd
Vét. 1999, 150, 715. 46. SPENCE, S. A.; FRASER, G. C.; CHANG, S. Aust. Vet. J. 1996,
74, 456.47. GEORGIEV, B.; GRUEV, A. Abstract Vol l. Third Nat. Conf.
Parasit., Albena, Bul garia, 1977; pp. 238-239.48. GEORGIEV, B.; GRUEV, A. Veterinarnomeditsinski Nauki. 1979,
16, 45. 49. SAHAI, B. N.; ANSARI, M. Z.; SINGH, R. P.; PRASAD, K. D.
Indian J. Vet. Med. 1983, 3, 27. 50. CORBA, J.; PACENOVSKY, J.; KRUPICER, I. Vet. Med. Rev.
1976, 2, 181. 51. KOBULEJ, T.; UIJVARHELYT, J. Acta Vet. Hung. 1972, 22,
219.52. CHROUST, I. Acta Vet. Brno. 1973, 42, 281.53. WIKERHAUSER, T.; BRGLEZ, J.; KUTICIC, V. Acta Parasit.
Lug. 1975, 6, 25.54. LAMMLER, G.; SAHAT, B. N.; HERZOG, H. Acta Vet. Hung.
1969, 19, 447.55. MADHEKAR, D. R.; RAMANATHAN, S.; KHAN, M. A.;
ROY, R. M. Livestock Adviser. 1987, 12, 5.56. GUPTA, R. P.; MALIK, P. D.; GAUTAM, O. P. Trop. Anim.
Health Prod. 1981, 13, 35. 57. VEERAKUMARI, L.; MUNUSWAMY, N. Cytobios. 1999, 98, 39.58. CORBA, J. Vet. Med. Rev. 1981, 1, 15.59. PETKOV, A.; BANKOV, D.; RUSEV, I.; TOMOV, P. Veterinarna
Sbirka. 1986, 84, 28.60. CANKOVIC, M.; IMAMOVIC, V.; ROZMAN, M.; JAZIC, A.;
SAHMANOVIC, S. Veterinarski Glasnik. 1988, 42, 373. 61. VISNYAKOV, Y.; IVANOV, V. Bull. Centr. Helminth. Lab. 1963,
8, 147.

NEREIS 3 [Marzo 2011], 9-15, ISSN: 1888-8550
15Novel Ligand-Based Approach to Screening of Large Databases for Paramphistomicide Lead Generation
62. GUPTA, R. P.; MALIK, P. D.; GAUTUM, O. P. Indian Vet. J. 1981, 58, 246.
63. LEPOJEV, O.; CVETKOVIC, L.; TOMANOVIC, B.; GRUS, I. Vet. Glasnik. 1982, 36, 33.
64. CORBA, J.; STOFFA, P.; LEGNY, J.; KRUPICER, J.; LIETAVA, P. Veterinarstvl, 1981, 31, 118.
65. DEMIASZKIEWICZ, A. W.; DROZDZ, J.; LACHOWICZ, J.; KRASINSKI, Z. Magazyn Weterynaryjny. 1999, 8, 118.
66. TRIFONOV, T. Veter. Shirka. 1983, 81, 39. 67. ROLFE, P. F.; BORAy, J. C. Austr. Vet. J. 1993, 70, 265.68. SUKHAPESNA, V.; TUNTASUVAN, D.; SURIYAJANTRATONG, W. P. Thai J. Vet. Med. 1991, 21, 165.69. SCHRODER, J.; HONER, M. R.; LOUW, J. P.; J S Afr Vet.
Assoc. 1977, 48, 95.70. SUH, M. D. Korean J. Vet. Res. 1983, 23, 199.71. MARTIN, R. J.; ROBERTSON, A. P.; BJORN, H. Parasit.
1997, 114, 111.72. MARTIN, R. J. The Vet. J. 1997, 11.73. DUARTA, M. J.; GARCíA-DOMENECH, R.; ANTÓN-FOS,
G. M. GáLVEZ, J. J. Comput-Aided Mol Des. 2001, 15, 561.74. STATISTICA ver. 5.5, Statsoft, Inc. 1999.75. VAN WATERBEEMD, H. Discriminant Analysis for Activity
Prediction. In Chemometric Methods in Molecular Design; van Waterbeemd, H., Ed., Vol 2 VCH: Weinhiem,1995.
76. FORD, M. G.; SALT, D.W. The Use of Canonical Correlation Analysis. In Chemometric Methods in Molecular Design; van Waterbeemd, H., Ed., Vol 2 VCH: Weinhiem,1995.
77. BALDI, P.; BRUNAK, S.; CHAUVIN, Y.; ANDERSEN, C. A.; NIELSEN, H. Bioinformatics. 2000, 16, 412.
78. xU, J., HAGLER, A. Molecules. 2002, 7, 566.79. SEIFERT, H. J. M.; WOLF, K.; VITT, D. Biosilico. 2003, 1, 143.80. WALTERS, W. P.; STAHL, M. T.; MURCKO, M. A. Drug Discov.
Today. 1998, 3, 160.81. VENKATESH, S.; LIPPER, R. A. J. Pharm. Sci. 2000, 89, 145.82. HANN, M.; GREEN, R. Curr. Opin. Chem. Biol. 1999, 3, 379.83. CHAPMAN & HALL. The Merck Index. Twelfth Edition. 1996.84. NEGWER, M. Organic-chemical Drugs and their synonyms. Ed.
Akademie-verlag, 1987.85. GOODMAN, A. G.; GOODMAN, L. S.; GILMAN, A. Las
Bases Farmacológicas de la Terapéutica. McGraw-Hill interam. 9na Ed. Vol II, 1996.
AcKNoLEDGEMENT
“No person is an island; much is owed to many”H. P. Schultz
Y. Marrero-Ponce thanks the Valencia University for a contract as Young Researcher in Spain (program ‘Estades Temporals per a Investigadors Convidats’ for a fellowship to work at Valencia University; 2011). M-P Y. also acknowledges the Universidad Nacional Autónoma de México (UNAM) for kind hospitality during the second trimester of 2008. A. Huesca-Guillén thanks are given to the UNAM, México, for partial financial support.


NEREIS 3 [Marzo 2011], 17-23, ISSN: 1888-8550
Polymer Bisphenol-A, the Incorporation of Silica Nanospheres into Epoxy–Amine Materials and Polymer Nanocomposites
Fechas de recepción y aceptación: 3 de noviembre de 2010, 26 de noviembre de 2010
F. Torrens Zaragozá†
† Institut Universitari de Ciència Molecular, Universitat de València, Edifici d’Instituts de Paterna, P. O. Box 22085, E-46071, València, SpainEmail: [email protected].
Nereis. Revista Iberoamericana Interdisciplinar de Métodos, Modelización y Simulación
3 17-23 Universidad Católica de Valencia “San Vicente Mártir”
Valencia (España) ISSN 1888-8550
ABSTrAcT
It is presented the three principal reactions involved in the curing of a diamine with a diepoxide, the modelling of functional groups for crosslinked polymers, the formation of a DGEBA monomer, the polyaddition of bisphenol-A to DGEBA forming a polyether product, the reaction of DGEBA monomer with curing agent Jeffamine D-230 and the start of the crosslinking process to form DGEBA–Jeffamine D-230 resin. Composites of silica (SiO2) nanospheres, coated with cross-linked epoxy–amine, were synthesised and examined by29 Si-magic-angle-spinning nuclear magnetic resonance spectroscopy, thermogravimetric analysis, Fourier transform infrared spectroscopy and scanning electron microscopy. The most representative fact is that epoxy-modified nanospheres lost less weight at high temperatures. At temperatures greater than 300ºC the loss of weight for epoxy-modified nanospheres was lower than for unmodified nanospheres. This helped them to retain their structures as the loss of weight can have adverse effects on network defects, because of the loss of crosslinks by unit of volume. The mechanical properties of epoxy nanocomposites, strengthened with SiO2 spherical nanoparticles unfunctionalized or functionalized with amine or epoxy, increase up to reinforcement percentages of 3–5%.
KEYworDS: polycarbonate, bisphenol-A, polymer nanocomposites, silica nanospheres, epoxy–amine material.
rESUMEN
Se presentan las tres principales reacciones en el curado de una diamina con un diepóxido, el modelado de grupos funcionales para polímeros entrecruzados, la formación de un monómero de DGEBA, la poliadición de bisfenol-A a DGEBA formando un producto poliéter, la reacción de monómero de DGEBA con el agente de curado Jeffamine D-230 y el inicio del proceso de entrecruzamiento para formar la resina DGEBA–Jeffamine D-230. Composites de nanoesferas de sílice (SiO2), cubiertas con epoxi–amina entrecruzada, se sintetizaron y examinaron por espectroscopia de resonancia magnética nuclear de ángulo mágico, análisis termogravimétrico, espectroscopia infrarroja de transformada de Fourier y microscopia electrónica de barrido. El hecho más representativo es que las nanoesferas modificadas con epoxi pierden menos peso a altas temperaturas. A temperaturas mayores de 300 ºC la pérdida de peso para nanoesferas modificadas con epoxi fue menor que para las nanoesferas no modificadas. Esto les ayudó a retener sus estructuras, ya que la pérdida de peso puede tener efectos adversos sobre los defectos de la red, por la pérdida de entrecruzamientos por unidad de volumen. Las propiedades mecánicas de los nanocomposites epoxi, reforzados con nanopartículas esféricas de SiO2 no funcionarizadas o funcionarizadas con amina o epoxi aumentan hasta porcentajes de refuerzo de 3–5%.
PALABrAS cLAVE: policarbonato, bisfenol-A, nanocomposites de polímeros, nanoesferas de sílice, material epoxi–amina.
INTroDUcTIoN
Bisphenol-A (BPA) is a health risk although definitive proof in people is still not compelling; there is a lot of evidence [1]. It has oestrogenic activity and is a cell epigenetic modifier. Changes that BPA induces can be inherited and model is based on findings from diethylstilbestrol (DES), which is structurally similar to BPA. Both are biphenolic molecules originally synthesized as part of the same derivative series. The DES was used as a substitute for oestrogens in
women; one use was to administer DES to pregnant women who were thought to be close to a miscarriage. It was given to provide extra oestrogens to bolster and maintain pregnancy. It worked to uphold expectants, so it was used frequently in setting for the purpose of stabilizing a threatened miscarriage. However, 20–30 years later DES babies developed an increased risk for rare vaginal neoplasia, which one doctor recognized and went back and looked for common denominator. He found that the mothers of young women, who developed vaginal neoplasia, received DES during pregnancy, which

NEREIS 3 [Marzo 2011], 17-23, ISSN: 1888-8550
F. Torrens Zaragozá18
use was discontinued because of carcinogenic effects. Finding indicated that exposing mother to a molecule can affect offspring many years later and perhaps the next generation. Mother DES exposure affects offspring inheritance, increasing the risk of rare malignancy vaginal neoplasia, which is a big worry because DES and BPA are so similar that alike action possibility is strong. Research shows that BPA alters the epigenetic profile of exposed animals. Genetics is based on deoxyribonucleic acid (DNA) code and molecules do not change this, which is called epigenetics, which modifiers affect inheritance but they do not change DNA code, and there is concerning that BPA does that just like DES. However, one may not see BPA risks in diet for years. Exposure of pregnant women and young children to BPA may cause an increased risk of breast, vaginal, uterine or some oestrogen-driven neoplasia down line, which is only one potential risk.
The endocrine system is tightly regulated so that the mother, developing foetus or young child has not too much wrong hormones signalling at incorrect time [2]. When a girl goes via puberty oestrogens come out; they are not supposed to be there during development and infancy. If one puts something there that should not be present and that can cause changes, which should not be induced in the baby at that time, it is a risk factor. The risk of BPA accumulation, and combining with other endocrine disruptors to magnify its actions, is a possibility. However, DES and PBA are not just oestrogenic; both are structurally different from oestrogens and carry additional risks. There was no evidence that BPA increases neoplasia risk in people as DES, which did, but it was recognized in retrospect. It is not known if that is the case for BPA. However, enough parallels to DES does the principle of caution to ask for safe BPA alternatives.
Polymer diglycidyl ether of bisphenol-A (DGEBA), especially when crosslinked with a diamine, is a commercially important epoxy resin and a candidate for applications in nanocomposites. In earlier publications it was reported the treatment of poly(styrene-co-methacrylic acid)/poly(4-vinylpyridine) blends in solution under liquid–liquid phase-separation conditions, with a new method for phase-separation data attainment from viscosity measurements [3], the compatibility between polystyrene copolymers and polymers in solution via hydrogen bonding [4] and a study and comparison of interaction parameters and phase behaviour of epoxy/polystyrene and epoxies copolymer polystyrene–b–poly(methyl methacrylate) blends [5]. It was examined the modelling studies of the phase behaviour of monomer/polymer/disk composites [6], the experimental studies for modelling the phase behaviour of monomer/polymer/disc composites [7] and the modelling monomer/disc composites phase behaviour [8]. It was used DGEBA in polymer nanocomposites to carry out the study and comparison of the interaction parameters, and phase behaviour of epoxy/polystyrene and epoxies copolymer polystyrene–b–poly(methyl methacrylate) blends [9], the incorporation of silica (SiO2) nanospherical particles into epoxy–amine cross-linked materials [10], the dynamic mechanical measurements of epoxy matrix-SiO2 nanocomposites [11,12] and the incorporation of SiO2 nanospheres into epoxy–amine materials forming polymer nanocomposites [13,14]. The goal of the present report is to analyze the principal reactions involved in the curing of a diamine with a diepoxide and further progress of the reaction mixture.
EXPErIMENTAL ProcEDUrE
Epoxy resin
The thermosetting matrix considered in this work was obtained via the polycondensation of an epoxy–amine system. The used diepoxy prepolymer was a DGEBA (diglycidyl ether of bisphenol-A, DER332 from Dow Chemicals, cf. Figure 1).
H2C CH
O
CH2
R CH2
CH
CH2
OH
R CH2 CH
CH2
O
n=0,1,2,3…
O C O
CH3
CH3
R =
Figure 1. Diglycidyl ether of bisphenol-A (DGEBA).
The uniqueness of liquid epoxy resin, DER332, is reflected in its maximum epoxy equivalent weight of 176 grams·equivalent–1 (the chemically pure DGEBA has an epoxy equivalent weight of 170 g·eq–1, cf. Table 1). Because of its high purity and low polymer fractions content, epoxy resin DER332 assures uniform performance and exceptionally low viscosity coefficient, low chloride content and light colour. Under some cure conditions, this epoxy resin provides improved elevated-temperature properties over standard bisphenol-A-based epoxy resins, e.g., epoxy resin DER331. It is liquid at room temperature so that the fillers can be dispersed into this part of the reactive system. Its coefficient of viscosity is equal to ca. 5 Pa·s at 25ºC.
Table 1. Technical characteristics of the DER332 epoxy resin.
Property Value MethodEpoxide equivalent weight
(g·eq–1)171–175 ASTM
D-1652Epoxide percentage (%) 24.6–25.1 ASTM
D-1652Epoxide group content (mmol·kg–1) 5710–5850 ASTM
D-1652Colour (platinum cobalt) 75 max. ASTM
D-1209Viscosity coefficient at 25ºC (mPa·s) 4000–6000 ASTM
D-445Hydrolyzable chloride content (ppm) 300 max. ASTM
D-1726Water content (ppm) 700 max. ASTM
E-203Density at 25ºC (g·mL–1) 1.16 ASTM
D-4052Flash point (ºC) 252 ASTM D-93
Epichlorohydrin content (ppm) 5 max. DowM 101321
Shelf life (months) 24 –

NEREIS 3 [Marzo 2011], 17-23, ISSN: 1888-8550
19Polymer Bisphenol-A, the Incorporation of Silica Nanospheres into Epoxy-Amine Materials...
Epoxy resin DER332 is used mainly in filament winding, electrical laminates and encapsulation applications. A wide variety of curing agents is available to cure this liquid epoxy resin at ambient conditions. Most frequently used curing agents are cycloaliphatic polyamines, polyamides, amidoamines and modified versions of these. Curing may also be done at an elevated temperature to improve selected properties, e.g., chemical resistance and glass transition temperature. Elevated-temperature cures are necessary and long post-cures are required to develop full-end properties, if anhydride or catalytic curing agents are employed. The product above is suitable for use in applications, e.g., adhesives, casting and tooling, composites, photocure industrial coatings, as well as potting and encapsulation. The molar mass and polydispersity of resin DER332 were experimentally determined in our laboratory, via gel permeation chromatography (GPC) using an equipment from Waters. The obtained values (taking as Caínente the polystyrene calibration equation) follow.
Mw = 316 g ⋅mol -1
Mn = 310 g ⋅ mol-1
I =Mw
Mn
=1.02
curing Agent
The curing agent used in the study, Jeffamine D-230 [O,O’-bis(2-aminopropyl) poly(propylene glycol) from Huntsman, cf. Figure 2], is a polyetheramine characterized by repeating oxypropylene units in the backbone. As shown by the representative structure, Jeffamine D-230 is an aliphatic primary diamine presenting long and flexible chains. Its molar mass is equal to 230 g·mol–1. The primary amine groups are located on secondary carbon atoms at the end of the aliphatic polyether Caín.
The applications of the product above are: epoxy curing agent, it reacts with carboxylic acids to form hot-melt adhesives, it reacts quickly with isocyanates and salts may be formed readily for surfactant use. The benefits of the product above are: low viscosity coefficient, colour and vapour pressure, completely miscible with a wide variety of solvents, including water, it provides tough, clear, impact-resistant coatings, castings and adhesives, as well as coatings are free of surface blush prevalent with many amine curing agents (cf. Table 2).
The epoxy networks were synthesized from the reaction between difunctional epoxy prepolymer DGEBA and tetrafunctional primary diamine comonomer Jeffamine D-230. Three principal reactions take place in the curing of a diamine with a diepoxide, where epoxy groups react with primary amine H atoms to form secondary amines, which can in turn react with epoxy groups. Therefore a polymer network
HC
O
CH2
NH2+CH
OH
CH2 NH(1)
HC
O
CH2
+CH
OH
CH2 NH(2)
CH
OH
CH2 N
2
HC
O
CH2
+CH
OH
(3)
CH
O CH2 CH
OH
Figure 3. Three principal reactions involved in the curing of a diamine with a diepoxide.
NH2
HC C
H2
O CH2
n=2.5CH3
HC NH2
CH3
Figure 2. Curing agent (Jeffamine D–230).
emerges both chemically and physically. In high temperature or in the presence of catalysts homopolymerization of epoxy groups would also occur.
Table 2. Technical characteristics of the Jeffamine D-230 amine.
Property Specifications Test method
Appearance Colourless to light yellow with slight haze
ST-30.1
Colour, Pt-Co 25 max. ST-30.12Primary amine, % of total
amine97 min. ST-5.34
Total acetylatables, meq·g–1 8.3 min–9.1 max. ST-31.39Total amine, meq·g–1 8.1 min–8.7 max. ST-5.35
Water, weight % 0.20 max. ST-31.53, 6Shelf life, months 36 –Amine hydrogen equivalent weight (AHEW), g·eq–1
60 –
Viscosity coefficient at 25ºC (77ºF), cSt
9.5 –
Density at 25ºC, g·mL–1 (pnd·gal–1)
0.948 (7.90) –
pH, 5% aqueous solution 11.7 –
cALcULATIoN rESULTS AND DIScUSSIoN
curing reactions
The epoxy networks were synthesized from the reaction between difunctional epoxy prepolymer DGEBA and tetrafunctional primary diamine comonomer Jeffamine D-230. Three principal reactions taking place in the curing of a diamine with a diepoxide are illustrated in Figure 3, where epoxy groups react with primary amine H atoms to form secondary amines, which can in turn react with epoxy groups. Therefore a polymer network emerges both chemically and physically. In high temperature or in the presence of catalysts, homopolymerization of epoxy groups would also occur.

NEREIS 3 [Marzo 2011], 17-23, ISSN: 1888-8550
F. Torrens Zaragozá20
Molecular Structure in DGEBA–Jeffamine D-230
From the combination of DGEBA DER332 with Jeffamine D-230, a network having a low crosslink density is obtained and, at room temperature, this network is in the glassy state. The reactivity of aliphatic amines is generally higher than that of aromatic ones. However, because of its long chains and of the presence of methyl groups (–CH3) close to the amine functions, the kinetics of the reaction between DER332 and Jeffamine is rather slow. The presence of O atoms in the chain must be pointed out, because it induces a high polarity that influences the interactions with SiO2. Original, active and reactive functional groups for crosslinked polymers are schemed in Figure 4.
Before analysing the strengthening material, it is instructive to consider how DGEBA and its Jeffamine D-230-cured polymeric forms are synthesized. Figure 5 shows the synthesis of a DGEBA monomer from bisphenol-A and an epoxide; the R-group in the latter is typically a Cl atom. The reactant bisphenol-A and the product DGEBA monomer may be in one of three different structural forms: ortho–ortho, para–para or para–ortho; only the para–para form is shown in Figure 5.
H2C
O
CH H3C CH
H2N CH2 H2N CH2 N CH2
OH
CH2 CH
OH
original active reactive
Figure 4. Modelling of functional groups for crosslinked polymers.
O O
H3C CH3
O O
DGEBA
HO OH
H3C CH3
Bisphenol A
RO
Epoxide
+
Figure 5. Formation of a DGEBA monomer.
O O
H3C CH3
O O
DGEBA
HO OH
H3C CH3
Bisphenol A
+
O O
H3C CH3
OO
O
OH
n
Polyether Product
Figure 6. Polyaddition of bisphenol-A to DGEBA forming a polyether product.

NEREIS 3 [Marzo 2011], 17-23, ISSN: 1888-8550
21Polymer Bisphenol-A, the Incorporation of Silica Nanospheres into Epoxy-Amine Materials...
During the synthesis, a newly formed DGEBA monomer can also undergo a polyaddition reaction with bisphenol-A as seen in Figure 6, to form a polyether product; the reaction can be enhanced by temperature and an appropriate catalyst.
Next, it is considered the crosslinking of DGEBA monomer (or its extended polyether form) with Jeffamine D-230. Figure 7 shows the
reaction of an epoxide group at the end of the DGEBA monomer with an amine group on the Jeffamine D-230.
The resulting product may react with up to three more epoxide groups, since there are still three H atoms remaining between the two amine groups. Figure 8 shows the start of such further crosslinking, which ultimately leads to the formation of a networked polymer. When
O O
H3C CH3
O O
DGEBA
NH2
HC C
H2
O CH2
n=2.5CH3
HC NH2
CH3
Curing Agent Jeffamine D-230
+
NH
HC C
H2
O CH2
n=2.5CH3
HC NH2
CH3OH
OO
O
DGEBA with Curing Agent Jeffamine D-230
H3C CH3
Figure 7. Reaction of DGEBA monomer with curing agent Jeffamine D-230.
NHC C
H2
O CH2
n=2.5
CH3
HC NH2
CH3OH
OO
O
HO
O
Crosslinked DGEBA with Curing Agent Jeffamine D-230
NH
HC C
H2
O CH2
n=2.5CH3
HC NH2
CH3OH
OO
O DGEBA with Curing Agent Jeffamine D-230
O
O
O O
H3C CH3
O O
DGEBA
+H3C CH3
CH3
H3C
H3C CH3
Figure 8. Start of the crosslinking process to form DGEBA–Jeffamine D-230 resin.

NEREIS 3 [Marzo 2011], 17-23, ISSN: 1888-8550
F. Torrens Zaragozá22
examining the molecular structure of crosslinked DGEBA–Jeffamine D-230, there are considerations to be made regarding: 1) ortho/para structural conformation of DGEBA monomers, 2) fraction of polyether species present (Figure 6) and 3) degree of crosslinking and molecular topology. However, for high degrees of cure the molecular topology has remarkably little effect on properties, e.g., density.
SUMMArY
It was presented the molecular structures of diglycidyl ether of bisphenol-A (DGEBA) and curing agent (Jeffamine D–230), three principal reactions involved in the curing of a diamine with a diepoxide, the modelling of functional groups for crosslinked polymers, the formation of a DGEBA monomer, the polyaddition of bisphenol-A to DGEBA forming a polyether product, the reaction of DGEBA monomer with curing agent Jeffamine D-230 and the start of the crosslinking process to form DGEBA–Jeffamine D-230 resin.
coNcLUSIoNS
From the present results and discussion the following conclusions can be drawn.
1. Composites consisting of epoxy cross-linked with SiO2 nanospheres were synthesised, which show better thermal and may be expected to show better high temperature mechanical properties than the product cured in the absence of nanospheres.
2. As expected, the epoxy resin is chemically connected to the surface of nano-SiO2. As a result, the following effects can be inferred. (a) Hydrophobicity of the nanoparticles is increased, facilitating the filler/matrix compatibility. (b) Filler/matrix interaction is enhanced via the entanglement between the grafting polymer and the polymer matrix. (c) The nanoparticle agglomerates become stronger because they are now turned into a kind of nanocomposite microstructure consisting of nanoparticles and grafted polymer. (d) The interfacial characteristics between the grafted nanoparticles and matrix polymer can be tailored by changing the species of the grafting polymer and grafting conditions. Collectively, all these inferred effects facilitate a uniform dispersion of nanoparticles in the matrix, which might otherwise pose a critical problem.
3. The mechanical properties of the epoxy nanocomposites, strengthened with SiO2 spherical nanoparticles unfunctionalized (SiO2), with SiO2 nanospheres functionalized with amine groups (SiO2-amine), with SiO2 nanoballs functionalized with epoxy groups (SiO2-epoxy), or with both SiO2 nanoparticles functionalized with epoxy groups and SiO2 nanospheres functionalized with amine groups (SiO2-epoxy + SiO2-amine), increase up to reinforcement percentages of 3–5 wt.%, as reflected in the study of the storage modulus in shear carried out in dynamic mechanical analysis. The improvement is observed in both glassy and rubbery states, without affecting in an appreciable way the glass transition temperature of the material. From these strengthening percentages the mechanical properties begin to decrease but keeping, in all the studied reinforcement percentages (up to 10 wt.%), a mechanical behaviour (greater storage modulus in shear) higher than the one of the pristine epoxy resin.
4. On the other hand, a slightly erratic behaviour of the storage modulus in shear is observed when, for a given strengthening percentage, the samples with spherical nanoparticles functionalized and unfunctionalized are compared. However, in this behaviour more or less erratic two trends can be discerned: first it is observed that for low strengthening percentages (3 wt.%) the samples, reinforced with both
nanospheres functionalized with amine and nanoballs functionalized with epoxy, show a clearly higher mechanical behaviour; second as the strengthening percentage increases in the nanocomposite, the materials reinforced with SiO2 nanoparticles functionalized with epoxy groups show a mechanical behaviour higher than the ones of the rest. We think that to improve the mechanical properties in this type of systems, it is important to arrive to a compromise between the percentage of added strengthening (not much higher than 3–5 wt.%), as a function of the precise type of reinforcement.
5. The strong effect of SiO2 on the storage moduli in shear and loss factor is related to a reduction in the molecular mobility of the macromolecular chains around the filler, because of strong van der Waals interaction established between the SiO2 surface and the epoxy matrix, e.g., dispersion, and dipolar interaction and hydrogen bonds to SiO2 silanols. Additionally, these properties no longer increase when the SiO2 content is increased up to 3–5 wt.%. The corresponding interpretation is that an increase in SiO2 proportion causes an increase in viscosity, which produces a poorer dispersion.
6. The variation of the flow stress with temperature leads to the following additional conclusions: (a) The main physical parameter determining the flow stress of polymers is the cohesion of the solid state, resulting from intermolecular interactions. The storage modulus in shear gives a good representation of this cohesion, which depends on the chemical nature of the nanoparticles in the composite. (b) The loss of this cohesion, as the temperature increases, corresponds to the main mechanical relaxation associated with the glass transition, which depends on the chemical nature of the nanoparticles in the composite. Actually, some slight differences because of different strain-rate sensitivities are expected to be related to the secondary mechanical relaxation (conformational change-β at the level of hydroxy ether groups) or, even, the third relaxation [conformational change-α at the level of methylene (–CH2–) units]. In our case such differences are also observed, but they are not as important as the ones detected near the glass transition temperature, in the measured range of temperatures.
LITErATUrE cITED
[1] KRISHNAN A. V.,STATHIS P., PERMUTH S. F., TOKES L. AND FELDMAN D., 1993. Bisphenol-A: An estrogenic substance is released from polycarbonate flasks during autoclaving, Endocrinology 132, 2279-2286.
[2] DELIGIO V, 2010. The BPA debate from two perspectives, Mod. Plast. Worldwide 87(6) 12-18.
[3] TORRENS F., SORIA V., MONZÓ V I. S., ABAD C. and CAMPOS A., 2006. Treatment of poly(styrene-co-methacrylic acid)/poly(4-vinylpyridine) blends in solution under liquid–liquid phase-separation conditions. A new method for phase-separation data attainment from viscosity measurements, J. Appl. Polym. Sci. 102, 5039-5049.
[4] TORRENS F., SORIA V., CODOñER A., ABAD C. and CAMPOS A., 2006. Compatibility between polystyrene copolymers and polymers in solution via hydrogen bonding, Eur. Polym. J. 42, 2807-2823.
[5] TORRENS F., MONZÓ I. S., GÓMEZ-CLARí C. M., ABAD C. and CAMPOS A., 2008. Study and comparison of interaction parameters and phase behaviour of epoxy/polystyrene and epoxies copolymer polystyrene–b–poly(methyl methacrylate) blends, Polym. Compos. 29, 1337-1345.
[6] TORRENS F., GÓMEZ C. M., LEÓN L. M., ABAD C. and CAMPOS A., 2008. Modelling studies of the phase behaviour

NEREIS 3 [Marzo 2011], 17-23, ISSN: 1888-8550
23Polymer Bisphenol-A, the Incorporation of Silica Nanospheres into Epoxy-Amine Materials...
of monomer/polymer/disk composites, Macromol. Theory Simul. 17, 325-340.
[7] TORRENS F. and CASTELLANO G., 2010. Experimental studies for modelling the phase behaviour of monomer/polymer/disc composites, Macromol. Symp., 296, 557-565.
[8] TORRENS F., GÓMEZ C. M., MONZÓ I. S., ABAD C. and CAMPOS A., Modelling Monomer/Disc Composites Phase Behaviour, Macromol. Symp., in press.
[9] TORRENS F., MONZÓ I. S. ., GÓMEZ-CLARí C. M, ABAD C. and CAMPOS A., 2008. Study and comparison of interaction parameters and phase behaviour of epoxy/polystyrene and epoxies copolymer polystyrene–b–poly(methyl methacrylate) blends, Polym. Compos. 29, 1337-1345.
[10] TORRENS F., SOLAR L., PUCHOL V., LATORRE J., ABAD C. and CAMPOS A., 2008. Incorporation of silica nanospherical particles into epoxy-amine cross-linked materials, Polym. Polym. Compos. 16, 139-152.
[11] LEÓN L. M., LAZA M., TORRENS F., PUCHOL V., ABAD C. and CAMPOS A., 2009. Incorporation of silica nanospherical particles in epoxy–amine crosslinked materials II. Dynamic mechanical measurements of epoxy matrix-silica nanocomposites, Polym. Polym. Compos. 17, 457-465.
[12] LEÓN L. M., LAZA M., PUCHOL V., TORRENS F., ABAD C. and CAMPOS A., 2009. Dynamic mechanical measurements of epoxy matrix-silica nanocomposites II, Polym. Polym. Compos. 17, 313-324.
[13] TORRENS F. and CASTELLANO G., 2010, Incorporation of silica nanospheres into epoxy–amine materials: Polymer nanocomposites, in: Encyclopedia of Polymer Composites: Properties, Performance and Applications, M. Lechkov and S. Prandzheva, Eds., Polymer Science and Technology No. 5, Nova, New York (NY), chap. 25, pp. 823-844.
[14] TORRENS F. and CASTELLANO G., 2010. Apoptosis, oxidative stress, nanocomposites, bisphenol-A, polyphenols, flavonoids and antioxidants, in: Synthetic Organic Chemistry, J. A. Seijas and M. P. Vázquez Tato, Eds., MDPI, Basel (Switzerland), Vol. 14, pp. 1-19.
AcKNoLEDGEMENT
The author wants to dedicate this report to Prof. Dr. Agustín Campos, who was greatly interested in this research and would have loved to see its conclusion.


NEREIS 3 [Marzo 2011], 15-31, ISSN: 1888-8550
Desarrollo de una plataforma computacional para el modelado metabólico de microorganismos
Fecha de recepción y aceptación: 09 de noviembre de 2010, 30 de noviembre de 2010
r. reyes†, J. Garrido†, r. A. Jaime†, V. córdova†, J. Triana†, L. Villar†, J. c. castro†, P. Fernández de córdoba‡, J. F. Urchueguía‡, E. Navarro‡ y A. Montagud‡
† Universidad de Pinar del Río, Cuba.‡ Universidad Politécnica de Valencia, España.
Nereis. Revista Iberoamericana Interdisciplinar de Métodos, Modelización y Simulación
3 25-31 Universidad Católica de Valencia “San Vicente Mártir”
Valencia (España) ISSN 1888-8550
ABSTrAcT
Synthetic biology focuses on the design and construction of artificial genetic systems that are capable of carrying out a specific function after being inserted into a living system. With the development of synthetic biology a new generation of bioengineers has appeared who develop complex, highly integrated genetic biological pathways. The improvement of this scientific discipline aims to establish a computational and conceptual framework that will support the development of modular artificial biological systems based on an engineering and systematic methodology. To achieve this, it will be necessary to provide new integrated computational tools in a common environment for the analysis of metabolic phenotypes, the design of new complex genetic pathways and the visualisation of metabolic maps to the next generation of designers in synthetic biology and future biotechnologists and biological engineers.A result of this research is the Hydra platform (Hybrid Draw and Routes Analysis) that integrates various tools for the design, analysis, and visualisation of metabolic networks.
KEYworDS: bioinformatics, biology of systems, synthetic biology, metabolic pathway.
rESUMEN
La Biología Sintética (BS) se centra en el diseño y la construcción de sistemas genéticos artificiales, capaces de desarrollar una función específica después de haber sido introducidos en un sistema vivo. Con el desarrollo de la BS, se observa una nueva generación de bioingenieros que desarrollan complejos circuitos biológicos genéticos con un alto nivel de integración. La mejora de esta disciplina científica tiene por objeto establecer un marco computacional y conceptual que dé asistencia al desarrollo de sistemas biológicos artificiales modulares basándose en una metodología ingenieril y sistemática, para lo que se necesita proveer a la próxima generación de diseñadores en Biología Sintética y a los futuros biotecnólogos e ingenieros biológicos de nuevas herramientas computacionales integradas en un entorno común para el análisis de fenotipos metabólicos, el diseño de nuevos circuitos genéticos complejos y la visualización de mapas metabólicos.Como resultado de esta investigación se obtiene la plataforma Hydra (Hybrid Draw and Routes Analysis), que integra diversas herramientas para el diseño, análisis y visualización de las redes metabólicas.
PALABrAS cLAVE: bioinformática, biología de sistemas, biología sintética, ruta metabólica.
INTroDUccIóN
La bioinformática, según una de sus definiciones más sencillas, es la aplicación de la tecnología de computadores a la gestión y análisis de datos biológicos. Los términos bioinformática, biología computacional y, en ocasiones, biocomputación, utilizados en muchas situaciones como sinónimos, hacen referencia a campos de estudios interdisciplinarios muy vinculados, que requieren el uso o desarrollo de diferentes técnicas que incluyen la informática, la matemática aplicada, la estadística, las ciencias de la computación, la inteligencia artificial, la química y la bioquímica para solucionar problemas, analizar datos o simular sistemas o mecanismos, todos ellos de índole biológica, y usualmente (pero no de forma exclusiva) en el nivel molecular. El
núcleo principal de estas técnicas se encuentra en la utilización de recursos computacionales para solucionar o investigar problemas sobre escalas de tal magnitud que sobrepasan el discernimiento humano. La investigación en biología computacional se solapa a menudo con la Biología de Sistemas [1].
La Biología de Sistemas es un área de investigación científica que se preocupa del estudio de procesos biológicos. Comenzó a desarrollarse en los años sesenta del siglo xx, si bien su institucionalización académica no se produjo hasta el año 2000. Se centra en estudiar sistemas biológicos en su totalidad, usando herramientas de modelación, simulación y comparación al experimentado.
Por otro lado, surge la Biología Sintética como una evolución conceptual de la Biología de Sistemas. Esta ciencia trata de entender
NEREIS 3 [Marzo 2011], 15-31, ISSN: 1888-8550
R. Reyes et al.26
el funcionamiento de las células desde un punto de vista global, centrándose en el sistema en su conjunto más que en las partes. Con el advenimiento de las técnicas experimentales de alto rendimiento se ha alcanzado un importante grado de desarrollo, hasta el punto de haber conseguido desarrollar modelos en los que el conjunto de reacciones que tienen lugar en una célula se representan de manera análoga a una red eléctrica o de comunicaciones, así como todo un conjunto de herramientas para operar sobre dichas redes [2].
Aunque la expresión Biología Sintética (BS) ha estado presente en la literatura científica y técnica desde la década de 1910, en la actualidad se ha convertido en un concepto que abarca la totalidad de las investigaciones desarrolladas en la frontera entre la Biología Molecular y la Ingeniería en sentido estricto [3]. Como tal, el término BS se está convirtiendo en un concepto cada vez más comprehensivo, que:
Abarca nuevos marcos teóricos que se ocupan de los sistemas 1. biológicos con las herramientas conceptuales y el lenguaje descriptivo de la Ingeniería.Utiliza enfoques de diseño de organismos con propiedades 2. novedosas inspirados en el diseño de circuitos eléctricos y mecánicos.Persigue la creación de nuevos organismos con propiedades “a 3. la carta” basada en la combinación racional de partes biológicas disociadas de su contexto natural.
Una de las características generales de los métodos automatizados es que producen conjuntos enormes de resultados que sólo se pueden analizar haciendo uso intensivo de herramientas bioinformáticas para facilitar la organización y sistematización de la información.
MéToDoS
La reconstrucción a escala genómica de una red metabólica es actualmente un proceso no automatizado e iterativo de toma de decisiones que fácilmente requiere el trabajo de al menos una persona/año para agrupar satisfactoriamente la lista de reacciones metabólicas para un organismo específico.
La reconstrucción de la red metabólica es un proceso de varios pasos en los que se utiliza esencialmente información genómica, metabolómica y datos fisiológicos del organismo en cuestión. El proceso implica la recopilación de todas las reacciones enzimáticas conocidas en las rutas metabólicas del sistema biológico, así como los genes asociados a la codificación de cada una de estas enzimas. Por otra parte, las publicaciones en revistas pueden ser utilizadas para identificar alguna información específica sobre las reacciones metabólicas, así como sobre sus genes relacionados.
La gran cantidad de información almacenada en bases de datos públicas, como por ejemplo información genómica [4], vías metabólicas [5], las enzimas [6] o las proteínas [7], puede ser recopilada para un organismo específico. Sin embargo, la falta de calidad debe ser considerada como uno de los principales inconvenientes de algunas de las bases de datos: falsos positivos, falsos negativos, así como objetos anotados erróneamente pueden obstaculizar los esfuerzos para reunir datos exactos [8]. En consecuencia, la reconstrucción manual a través de un control minucioso de todas y cada una de las reacciones, la ecuación de biomasa basada en moléculas constituyentes (como aminoácidos y nucleótidos), la coherencia y la integridad de la red son requisitos previos para la generación de un modelo metabólico útil y de alta calidad [9].
Aunque existen distintos software (ejemplo: Pathways Tools, Cobra, Simulink, CellDesigner) capaces de acceder a dichas bases de datos con
diferentes motivaciones, se puede decir que, aunque estos incorporan ciertos mecanismos de “depuración” y filtrado de la información, aún requieren un gran esfuerzo a nivel de desarrollo que permita reducir el tiempo que se necesita para realizar determinadas tareas. Por lo tanto, se hace necesario diseñar una base de datos que permita traducir la información biológica contenida en diversas bases de datos en un formato estándar que pueda ser usado ampliamente por la comunidad. Es el caso de SBML (del inglés, Systems Biology Markup Language), que permite su integración con distintas herramientas para el análisis y diseño de sistemas biológicos con funcionalidades noveles, garantizando la coherencia de los datos almacenados en diferentes bases de datos. Este lenguaje es un formato legible por ordenador para la representación de modelos de procesos biológicos. Es aplicable a simulaciones de metabolismo, la señalización celular, la regulación de genes y visualización de mapas metabólicos y muchos otros temas.
La adopción de SBML ofrece muchos beneficios, algunos de los cuales son [10]:
Permitir el uso de múltiples herramientas sin necesidad de 1. reescribir los modelos para cada herramienta.Crear modelos para ser compartidos y publicados en una 2. forma que otros investigadores puedan utilizar incluso en un ambiente de software diferente.Garantizar la supervivencia de los modelos (y el esfuerzo 3. intelectual puesto en ellos) más allá de la vida del software utilizado para crearlos.
Base de datos. contenedores de información biológica
Una base de datos o banco de datos es un conjunto de datos pertenecientes a un mismo contexto y almacenados sistemáticamente para su posterior uso. En este sentido, una biblioteca puede considerarse una base de datos compuesta en su mayoría por documentos y textos impresos en papel e indexados para su consulta. En la actualidad, y debido al desarrollo tecnológico de campos como la informática y la electrónica, la mayoría de las bases de datos están en formato digital (electrónico), que ofrece un amplio rango de soluciones al problema de almacenar datos [11]. Existen programas denominados Sistemas Gestores de Bases de Datos, abreviado SGBD, que permiten almacenar y posteriormente acceder a los datos de forma rápida y estructurada. Las propiedades de estos SGBD, así como su utilización y administración, se estudian dentro del ámbito de la informática. Las aplicaciones más usuales son para la gestión de empresas e instituciones públicas. También son ampliamente utilizados en entornos científicos con el objeto de almacenar la información experimental.
Una base de datos biológica es una biblioteca de información sobre ciencias de la vida, recogida de experimentos científicos, literatura publicada, tecnología de experimentación de alto rendimiento y análisis computacional. Contiene información de áreas de investigación como la genómica, la proteómica, la metabolómica, la expresión génica mediante microarrays y la filogenética. La información contenida en bases de datos biológicas incluye funciones, estructura y localización (tanto celular como cromosómica) de genes, efectos clínicos de mutaciones, así como similitudes de secuencias y estructuras biológicas [12].
Modelos de datos para la información biológica
Un modelo de base de datos o esquema de base de datos es la estructura o el formato de una base de datos, descrita en un lenguaje formal y soportada por el Sistema de Gestión de Bases de Datos. En

NEREIS 3 [Marzo 2011], 15-31, ISSN: 1888-8550
27Desarrollo de una plataforma computacional para el modelado metabólico de microorganismos
otras palabras, un “modelo de base de datos” es la aplicación de un modelo de datos usado en conjunción con un sistema de gestión de bases de datos. Los esquemas generalmente son almacenados en un diccionario de datos. Aunque un esquema se defina en un lenguaje de base de datos de texto, el término a menudo es usado para referirse a una representación gráfica de la estructura de la base de datos. Un modelo de datos no es solamente un modo de estructurar datos, sino que también define el conjunto de las operaciones que pueden ser realizadas sobre los datos [13].
Varias técnicas son usadas para modelar la estructura de datos. La mayor parte de los sistemas de bases de datos son construidos en torno a un modelo de datos particular, aunque sea cada vez más común para ciertos productos ofrecer el apoyo a más de un modelo. La concepción teórica de un modelo pertinente de datos asegurará el diseño adecuado de las bases de datos de información biológica a través de la coherencia, estandarización y completitud de los elementos responsables de las funciones biológicas, para el diseño y creación de circuitos genéticos.
Modelo de datos relacional
Una base de datos relacional es una base de datos que cumple con el modelo relacional, que es el modelo más utilizado en la actualidad para modelar problemas reales y administrar datos dinámicamente. Este modelo permite establecer interconexiones (relaciones) entre los datos (que están guardados en tablas), y trabajar con ellos conjuntamente. Tras ser postuladas sus bases en 1970 por Edgar Frank Codd, de los laboratorios IBM en San José (California), no tardó en consolidarse como un nuevo paradigma en los modelos de base de datos [14].
Para manipular la información se utiliza un lenguaje relacional. Actualmente se cuenta con dos lenguajes formales: el álgebra relacional y el cálculo relacional. El álgebra relacional permite describir la forma de realizar una consulta, en cambio el cálculo relacional sólo indica lo que se desea devolver. El lenguaje más común para construir las consultas en bases de datos relacionales es SQL (Structured Query Language), un estándar implementado por los principales motores o sistemas de gestión de bases de datos relacionales. Las bases de datos relacionales pasan por un proceso que se conoce como normalización de una base de datos, que es entendido como el proceso necesario para que una base de datos sea utilizada de manera óptima. Finalmente, la base de datos diseñada se basa en un modelo relacional para almacenar y gestionar la información biológica a partir de las relaciones existentes entre cada uno de los componentes biológicos.
web service
Un servicio web (WS) (en inglés, Web Service) es un conjunto de protocolos y estándares que sirven para intercambiar datos entre aplicaciones. Distintas aplicaciones de software desarrolladas en lenguajes de programación diferentes y ejecutadas sobre cualquier plataforma pueden utilizar los servicios web para intercambiar datos en redes de ordenadores como Internet. La interoperabilidad se consigue mediante la adopción de estándares abiertos. Para mejorar la interoperabilidad entre distintas implementaciones de servicios web se ha creado el organismo WS-I, encargado de desarrollar diversos perfiles para definir de manera más exhaustiva estos estándares [15]. Este servicio utiliza WSDL (en inglés, Web Services Description Language), que es un formato xML para describir los servicios de red como un conjunto de variables que operan en los mensajes que contienen, ya sea orientado o procedimiento orientadas a la información del documento [15]. El lenguaje WSDL es extensible para permitir la descripción de los puntos finales y sus mensajes sin importar qué formatos de mensaje o protocolos de red se utilizan para comunicarse.
Kegg API
Kegg proporciona valiosos medios para acceder a la información disponible en dicha base de datos, tanto para la búsqueda en los procesos bioquímicos celulares como para analizar el universo de los genes en los genomas completamente secuenciados. Los usuarios pueden acceder al servidor de Kegg API mediante la tecnología SOAP (en inglés, Simple Object Access Protocol) a través del protocolo HTTP (en español, protocolo de transferencia de hipertexto). El servidor SOAP también viene con el WSDL, lo que hace que sea fácil de construir una biblioteca de cliente para un lenguaje de programación específico [16]. Esto permite a los usuarios escribir sus propios programas para diversos propósitos y para automatizar el procedimiento de acceso al servidor Kegg API y recuperar los resultados.
Haciendo uso de Kegg API, se puede acceder a todas las funcionalidades de Kegg que fueron implementadas para el almacenamiento y la gestión de la información a diversos niveles de información biológica. De ahí que, una vez creado el Web Service Cliente para lograr una conexión entre las diferentes aplicaciones, se diseña e implementa una aplicación de escritorio, que logrará usar toda la información almacenada en Kegg para descargarla en la base de datos diseñada con este fin. La aplicación para gestionar el Web Service Cliente fue desarrollada en Java como lenguaje de programación y la información almacenada en Postgres como gestor de bases de datos. A continuación se describen algunas características de las herramientas utilizadas.
Java es un lenguaje de programación orientado a objetos, desarrollado por Sun Microsystems a principios de los años 90. El lenguaje en sí mismo toma mucha de su sintaxis de C y C++, pero tiene un modelo de objetos más simple y elimina herramientas de bajo nivel, que suelen inducir a muchos errores, como la manipulación directa de punteros o memoria. Entre diciembre de 2006 y mayo de 2007, Sun Microsystems liberó la mayor parte de sus tecnologías Java bajo la licencia GNU GPL, de acuerdo con las especificaciones del Java Community Process, de tal forma que prácticamente todo el Java de Sun es ahora software libre (aunque la biblioteca de clases de Sun que se requiere para ejecutar los programas Java aún no lo es) [17].
Postgres SQL está considerado el Sistema Gestor de Bases de Datos (SGBD) de código abierto más avanzado del mundo. Proporciona un gran número de características que normalmente sólo se encontraban en las bases de datos comerciales de alto calibre tales como Oracle.
Es un SGBD objeto-relacional, ya que aproxima los datos a un modelo objeto-relacional, y es capaz de manejar complejas rutinas y reglas. Su avanzada funcionalidad se pone de manifiesto con las consultas SQL (del inglés Structured Query Language) declarativas, el control de concurrencia multiversión, el soporte multiusuario, las transacciones, la optimización de consultas, la herencia y los valores no atómicos (atributos basados en vectores y conjuntos) [18].
La base de datos desarrollada permite suplir algunas de las deficiencias encontradas por la comunidad de Biología Sintética con relación a la coherencia, estandarización y completitud de los elementos responsables de las funciones biológicas. En este sentido, se ha logrado llevar a cabo un proceso de depuración de la información con vistas a evitar redundancias. El equipo ha trabajado en función de la estandarización de la información en aras de lograr términos comunes dentro de la comunidad de científicos. Además se trabaja en el desarrollo de algoritmos para lograr la completitud de la información, a través de otras bases de datos disponibles en la Red.

NEREIS 3 [Marzo 2011], 15-31, ISSN: 1888-8550
R. Reyes et al.28
rESULTADoS
Una vez obtenida toda la información biológica, y supliendo las deficiencias que actualmente persisten en diversas bases de datos, se genera un fichero SBML con la información referente a un organismo específico, lo que servirá de entrada a la nueva plataforma computacional para el diseño, análisis y representación de las rutas metabólicas.
Para la representación de la información usando SBML, se decide trabajar con el Nivel 2, Versión 1. El SBML Nivel 2 fue concebido en el V Taller de Plataformas de Software para Sistemas Biológicos, que se celebró en julio de 2002 en la Universidad de Hertfordshire [19]. Por esas fechas, cada vez más personas se implicaron en el grupo de colaboradores del SBML, de manera que se convirtió en un esfuerzo comunitario, con muchas herramientas nuevas que se iban mejorando para soportar SBML. Los participantes en el taller de 2002 decidieron colectivamente revisar la forma de SBML en el Nivel 2. El primer borrador de la especificación Versión 1 Nivel 2 fue liberado en agosto de 2002 y el grupo final de características se concluyó en mayo de 2003 en el VII Taller de Plataformas de Software para Biología de Sistemas en Ft. Lauderdale, Florida. Se trabaja en esta versión de Hydra con Nivel 2, Versión 1 de SBML por ser una de las más usadas en la comunidad de biólogos y por lo tanto de las más respaldadas en cuanto a pruebas realizadas.
Hydra
La integrabilidad de herramientas es algo muy esencial hoy en día en el trabajo de la Biología Sintética, por ello nuestra plataforma informática HYDRA (Hybrid Draw and Routes Analysis) integra un grupo de herramientas tales como FBA (Flux Balance Analysis) y RON Painter (Rational Organism Network Painter), las cuales se describirán a continuación.
FBA (Flux Balance Analysis)
La cuantificación de los flujos de la red metabólica se puede lograr a través del análisis de los flujos metabólicos. Este método usa la estequiometría de las reacciones metabólicas intracelulares, los flujos extracelulares y los flujos internos conocidos como entrada y retorno. Bajo este enfoque, se establece una relación entre las concentraciones de metabolitos intracelulares, los flujos de reacción y la estequiometría en un sistema metabólico por una ecuación de balance dinámico de masa [20].
Un sistema químico se puede describir mediante un sistema de ecuaciones diferenciales y se puede generalizar a cualquier red metabólica y representar de una manera más fácil mediante el uso de matrices, denominadas matriz estequiométrica. Un sistema está en estado estacionario cuando las tres derivadas (índices del cambio) son 0, o sea, cuando las concentraciones de estas sustancias no varían en el tiempo. El FBA implica realizar un análisis del estado estacionario característico de los sistemas biológicos, utilizando el sistema matricial que se obtiene del conjunto de reacciones.
De ahí que surja la aplicación FBA (Flux Balance Analysis), dentro de Hydra, para la gestión de una matriz estequiométrica que representa los flujos metabólicos en las rutas metabólicas. A partir de su integración en una aplicación web y sin necesidad de usar un software independiente, se accede a potentes herramientas alojadas en el servidor y de uso sencillo para gente no experta en programación ni en matemática discreta.
Con esta aplicación y su integración con Ron Painter, se podrá representar en las rutas metabólicas el valor de flujo de biomasa asociado a cada una de las reacciones.
roN Painter
RON Painter es una aplicación web que se inserta dentro de la plataforma Hydra. Se implementó con ASP.NET, C# y xML, utilizando como entorno de desarrollo Visual Studio.NET 2008 y beneficiándonos de la programación orientada a objetos, de un fuerte chequeo estático de tipos, de los componentes estándares que ofrece la biblioteca de clases y componentes de .NET Framework. Con las potencialidades que ofrece la plataforma y haciendo uso de zonas calientes se fue interactuando entre las páginas donde se representan el mapa metabólico y las rutas que lo integran.
Para el testeo de la aplicación se utilizó el fichero SBML correspondiente a la Synechocystis. sp PCC6803, aunque se debe destacar que RON Painter tiene como proyección futura hacer la visualización no solo de esta especie, sino del resto de las especies que están reconocidas en nuestra comunidad científica, contribuyendo así al avance de las herramientas para el uso de la biología y la investigación en esta rama.
ANáLISIS
Hydra fue implementada haciendo uso de los siguientes lenguajes y plataformas de desarrollo, lo que favorece la construcción de una aplicación segura y compatible con el resto de las aplicaciones implementadas y de las que están aún en desarrollo.
Xml
Es un formato de texto simple y flexible que puede ser usado como base para crear nuevos lenguajes de marca (como SBML y otros) que puedan ser usados para la publicación y el intercambio de documentos. Está basado en una serie de recomendaciones publicadas por un grupo de trabajo del W3C (World Wide Web Consortium) y por estas razones se encuentra en una inmejorable situación para ser usado en aplicaciones web [21].
c#
Es un lenguaje de programación diseñado para construir un amplio rango de aplicaciones que se ejecutarán sobre .Net Framework. Es simple, poderoso, fuertemente tipado, con un fuerte chequeo estático de tipos y orientado a objetos. Con sus muchas innovaciones C# nos permite desarrollar aplicaciones rápidamente manteniendo la expresividad y la elegancia de los lenguajes estilo C [22].
Visual Studio 2008
Visual Studio .Net es una suite completa de herramientas para crear, entre otras cosas, aplicaciones de escritorio y aplicaciones web. Se utiliza para desarrollar aplicaciones de alto rendimiento beneficiándonos de poderosas herramientas de desarrollo basadas en componentes y otras tecnologías para simplificar el trabajo en equipo. Visual Studio .Net soporta Visual C# con un muy cómodo Editor de Código, distintos tipos de proyectos, una confortable interfaz de diseño gráfico, un poderoso depurador fácil de usar y otras herramientas. La biblioteca de clases de .Net Framework nos permite acceder a un amplio espectro

NEREIS 3 [Marzo 2011], 15-31, ISSN: 1888-8550
29Desarrollo de una plataforma computacional para el modelado metabólico de microorganismos
de servicios y clases bien diseñadas que aceleran el ciclo de desarrollo significativamente [23].
ASP.NET
ASP.NET (parte de .NET Framework) brinda clases y herramientas para crear aplicaciones web dinámicas. Es un modelo unificado de desarrollo web que incluye los servicios que necesitamos para crear aplicaciones web profesionales con un mínimo de código y esfuerzo por parte de los programadores.
Desarrollando aplicaciones web con ASP.NET tenemos acceso a las clases de .NET Framework. Estas aplicaciones se pueden desarrollar utilizando cualquiera de los lenguajes compatibles con el CLR (Common Language Runtime), como por ejemplo C#, JScript .NET y J# entre otros. Estos lenguajes nos permiten desarrollar aplicaciones ASP.NET que se beneficien del CLR, de la programación orientada a objetos, entre otros [24].
La plataforma Hydra está publicada en el sitio <www.intertech.upv.es>. En éste existe un vínculo que se denomina Links donde se encuentra el enlace a Hydra. La interfaz de la herramienta tiene un contraste de colores que identifica a nuestro grupo de desarrollo Intertech. En la parte superior se muestra el nombre de la plataforma, en su parte inferior se visualiza la última fecha de actualización de la herramienta y un link a la dirección del correo electrónico del administrador de esta. A la izquierda se muestran las herramientas que integrarán esta plataforma y la herramienta RON Painter, donde para acceder a ésta se ejecuta un clic. Una vez que se examina y se hace la selección del fichero con extensión sbml se muestra en pantalla el mapa metabólico de la bacteria, dando además la oportunidad de acceder a las rutas que componen el mapa de dos formas: una es a través de un combobox donde al desplegarse se muestran todas las rutas existentes, y la otra es haciendo clic sobre un metabolito en cuestión. Esto da la posibilidad de que se muestre la ruta donde este metabolito se expresa, como se ve en la figura 1.
El mapa metabólico contiene todas las reacciones con su identificador, el nombre de los metabolitos y el nombre de las rutas. Por otra parte, en las rutas se muestra la misma información pero, además, se muestran todas las rutas donde se expresa un metabolito dado a través de cajas
rectangulares. En el momento en que está visualizada una ruta se activa el botón FBA, y al hacer clic sobre éste, se muestra, en la ruta, el valor de flujo de biomasa asociado a cada reacción. También se puede ir desde una ruta a otras haciendo clic sobre las cajas, como se muestra en la figura 2.
DIScUSIóN
Existen diversas herramientas para generar mapas metabólicos, sin embargo no preservan la forma en que tradicionalmente se representan en biología, dificultando el trabajo y reconocimiento de estos por parte de los investigadores con bagaje biológico. Algunos ejemplos son Cytoscape [25], CellDesigner [26] y Copasi [27], que hacen la representación del dibujo de una forma heurística y poco racional. Ni siquiera Kegg ha resuelto el problema, pues esta herramienta muestra los mapas y las rutas en toda su extensión, sin poder descartar los metabolitos que no están presentes en la red, lo que dificulta la claridad del modelo. Con lo cual se puede decir que Ron Painter suple estas deficiencias con la visualización de un modelo metabólico mucho más claro dentro de la comunidad de biólogos, a partir del análisis de los metabolitos que intervienen en cada una de las rutas y la generación de un modelo mucho más claro.
Por su parte, Hydra integra este conjunto de herramientas para el análisis, diseño y representación de redes metabólicas, lo que favorece el acceso rápido y directo a las distintas rutas que componen el mapa metabólico y la descripción de éstas, representando el nombre de cada metabolito, el identificador de cada reacción y la dirección de las rutas, así como mostrando el valor de flujo de cada reacción. La plataforma aún está en desarrollo, lo que facilitará la integración con nuevas herramientas en desarrollo para el análisis de los modelos metabólicos.
Es preciso destacar que la plataforma Hydra basa sus pruebas de modelado en la Synechosystis.sp PCC6803, por ser una cianobacteria considerada un buen candidato para la producción de una variedad de moléculas orgánicas de interés industrial, utilizando como fuente de carbono el CO2 (y/o azúcares) y la luz solar (y/o azúcares) como fuente
Figura 1. Visualización de una red metabólica haciendo uso de Hydra.
Figura 2. Ejemplo de representación del pathway de la Glycolysis.
NEREIS 3 [Marzo 2011], 15-31, ISSN: 1888-8550
R. Reyes et al.30
de energía [28]. La diversidad de aplicaciones potenciales en este sentido es amplia. Han sido publicados trabajos acerca de la producción heteróloga de varios metabolitos, entre los que se encuentra el bio-hidrógeno [29, 30]. Este elemento es producido gracias a la presencia de enzimas que intervienen directamente en su metabolismo, como las [Ni-Fe] hidrogenasas, las [Fe-Fe] hidrogenasas y las nitrogenasas, donde el hidrógeno es producido como un subproducto de la fijación de nitrógeno. Es bien conocido que la inhibición de la actividad de las hidrogenasas por el oxígeno formado en la fotosíntesis es el factor más importante que limita una producción rentable de hidrógeno utilizando este mecanismo [31].
No obstante, la aplicación Hydra servirá para modelar comportamientos en cualquier microorganismo de estudio.
coNcLUSIoNES
En los últimos años, las aplicaciones de la biotecnología en diferentes ámbitos de la ciencia y la tecnología se han multiplicado de forma considerable en paralelo al incremento exponencial de la información que se posee sobre los organismos. La información biológica, obtenida mediante diferentes tecnologías cada vez más poderosas y eficientes está pasando a formar parte de grandes bases de datos, muchas de ellas de libre acceso. Por su parte, la Biología Sintética se ha convertido en un área emergente de alto potencial científico y tecnológico e importancia estratégica para el mundo. Sin embargo la Biología Sintética precisa un gran impulso conceptual y metodológico para alcanzar su madurez como campo de desarrollo científico y tecnológico. Con este fin se ha logrado diseñar e implementar una plataforma computacional que integra un conjunto de herramientas para el diseño, análisis y visualización de las redes metabólicas de microorganismos, basándose las pruebas de la aplicación en la Synechosystis.sp PCC6803.
AGrADEcIMIENToS
Los autores desean agradecer el soporte financiero recibido por el Ministerio de Ciencia e Innovación a través de la concesión TIN2009-12359; la Conselleria de Inmigración y Ciudadanía de la Generalitat Valenciana (concesión 3012/2009) y la Comisión Europea (Proyecto TARPOL FP7 EU KBBE 212894).
BIBLIoGrAFÍA
Wikipedia, Enciclopedia Libre. Documentación libre de GNU. 1. [Internet]. Bioinformática. Disponible en: es.wikipedia.org
USDOE. 2005. Genomics: GTL Roadmap: 2. Systems biology for energy and environment. DOE/SC 0090. Disponible en: http://genomicsgtl.energy.gov. USDOE, Office of Science, Washington, DC.
DASIKA M., 2008 OptCircuit: An optimization based method 3. for computational design of genetic circuits. BMC Systems Biology 2008, 2,24.
GAFFRON H. Reduction of CO2 with H2 in green plants. 4. Nature 1939;143:204–5.
APPEL J., SCHULZ R., 1998. Hydrogen metabolism in 5. organisms with oxygenic photosynthesis: hydrogenases as important regulatory devices for a proper redox poising? Journal of Photobiology and Photochemistry 1998;47:1–11.
TING CS., ROCAP G., KING J, CHISHOLM SW., 2002. 6. Cyanobacterial photosynthesis in the oceans: the origins and
significance of divergent lightharvesting strategies. Trends Microbiol 10: 134–142
KASHINO Y., LAUBER WM., CARROLL JA., WANG Q, 7. WHITMARSH J., SATOH K, PAKRASI HB., 2002. Proteomic analysis of a highly active photosystemn II preparation from the cyanobacterium Synechocystis sp. PCC 6803 reveals the presence of novel polypeptides. Biochemistry 41: 8004–8012
ROOSE JL., PAKRASI HB., 2004. Evidence that D1 processing 8. is required for manganese binding and extrinsic protein assembly into photosystem II. J Biochemistry 279: 45417–45422
SHI T., FALKOWSKI PG., 2008. Genome evolution in 9. cyanobacteria: the stable core and the variable shell. Proc Natl Acad Sci USA, 105:2510-5
HUCKA M., 2003 10. The systems biology markup language (SBML): a medium for representation.BOURNE P. 11. A biological database be different from a biological journal Biol.. Vol. 1. n.º 3. pp. 179–81. DOI Modelo de datos.12. Disponible en la web en: http://es.wikipedia.org/wiki/Modelo_de_datos, Abril, 2010.ALBERCA, A., GáLVEZ, J., 2008. 13. Modelos avanzados de Bases de Datos. Bases de Datos Orientadas a Objeto y Bases de Datos Objeto-Relacionales.Communications of the ACM, volume=13, issue=6, pages=377-14. 387 Database Driven Webservices15. , 2008.Disponible en: www. Web Services/WebService_with_database_Mysql,_Webservices_database,_Develo/index.html
16. Manual de KEGG API, 2010. Disponible en: http://www.genome.jp/kegg/docs/keggapi_manual.html
17. Manuales de Java en línea. Disponibles en: http://www.desarrolloweb.com/manuales/57/
18. Wikipedia. La Enciclopedia Libre. PostgreSQL. Disponible en:: http://es.wikipedia.org/wiki/PostgreSQL
19. SBML Team. «The 5th Workshop on Software Platforms for Systems Biology».
20. YANG C., HUA Q., SHIMIZU K., 2002: Metabolic flux analysis in Synechocystis using isotope distribution from 13C-labeled glucose. Meta Eng 2002, 4:202-16
21. GARCíA, M. I., 2010. Curso introductorio de XML. Universidad de Granada, España. Disponible en: http://geneura.ugr.es/~maribel/xml/introduccion/index.shtml
22. Tutorial de CSharp. Wikipedia, Disponible en: http://msdn.microsoft.com/es-s/vcsharp/default.aspx
23. Tutorial de Visual Studio 2008. Wikipedia, Disponible en: http://msdn.microsoft.com/es-es/vstudio/default.aspx.
24. Tutorial de ASP.NET. Wikipedia, Disponible en: http://msdn.microsoft.com/es-es/vcsharp/default.aspx
25. SHANNON P., MARKIEL A, OZIER O., 2003. Cytoscape: un ambiente de software para los modelos integrados de las redes biomoleculares de la interacción”. Genoma Research. 13 (11): 2498-504. doi:10.1101/gr.1239303. PMID 14597658.
26. FUNAHASHI, A.; MATSUOKA, Y.; JOURAKU, A.; MOROHASHI, M.; KIKUCHI, N.; KITANO, H., 2008. “CellDesigner 3.5: una herramienta de modelado versátil para redes bioquímicas” Desarrollo de la IEEE Volumen 96, Número 8 , agosto 2008 Página (s): 1254 a 1265 [doi 10.1109/JPROC.2008.925458]
27. COPASI: Biochemical Network Simulator. Tutorial. Disponible en: http://www.copasi.org/tiki-view_articles.php
28. LINDBERG P., PARK S., MELIS A., 2010. Engineering a platform for photosynthetic isoprene production in cyanobacteria, using

NEREIS 3 [Marzo 2011], 15-31, ISSN: 1888-8550
31Desarrollo de una plataforma computacional para el modelado metabólico de microorganismos
Synechocystis as the model organism. Metabolic Engineering 2010, 12:70–79.
29. NAVARRO E., MONTAGUD A., FERNáNDEZ DE C. P., URCHUEGUíA JF., 2009. Metabolic flux analysis of the hydrogen production potential in Synechocystis sp. PCC6803, International Journal of Hydrogen Energy 2009, 34:8828–8838.
30. MCHUGH K., 2005. Hydrogen production methods. Report MPR-WP-0001. Alexandria, Virginia: MPR Associates, Inc.; 2005.
31. TAMAGNINI P., AxELSSON R., LINDBERG P., OxELFET F., WUNSCHIERS R., LINDBLAD P., 2002. Hydrogenases and hydrogen metabolism of cyanobacteria. Microbiology and Molecular Biology Reviews 2002; 66(1):1–20.

NEREIS 3 [Marzo 2011], 33-35, ISSN: 1888-8550
Pennella filosa (Linnaeus, 1758) (copepoda, Siphonostomatoida, Pennellidae) from Coryphaena hippurus Linnaeus, 1758 (Pisces, coryphaenidae) captured in western
Mediterranean (Balearic Islands). Morphological and biological aspects
Fecha de recepción y aceptación: 13 de noviembre de 2010, 1 de diciembre de 2010
A. Martí García†, E. Massuti Sureda‡ and P. González González∞
† Departamento de Zoología. Facultad de Biología. Universidad de Valencia, C/ Dr. Moliner, 50. 46100, Burjassot (Valencia). Spain.‡ IEO Centre Oceanogràfic de Balears. Palma de Mallorca, Spain∞ Fundación Terra Natura, Foia del Verdader 1, 03503, Benidorm, Spain, [email protected].
Nereis. Revista Iberoamericana Interdisciplinar de Métodos, Modelización y Simulación
3 33-35 Universidad Católica de Valencia “San Vicente Mártir”
Valencia (España) ISSN 1888-8550
ABSTrAcT
Sixty one fishes of the species Coryphaena hippurus (Linneo, 1758) have been examined for the presence of the pennellid copepod Pennella filosa (Linneo, 1758) from western Mediterranean (Balearic Islands). Prevalence was 46%. Head, neck, genital complex and abdomen were measured as well as horns. The cefalotorax of the parasites were attached in different locations on fishes but mainly on fins and dorsolateral muscles. Mean intensity, mean abundance and range were determined and data has been analysed by means of Pearson Correlation Coefficient. Likewise ecological aspects of the parasitism and some data of biological cycle were examined.
KEYworDS: pennellid, parasitism, prevalence, abundance, ecology.
rESUMEN
Se han examinado sesenta y un especímenes de Coryphaena hippurus (Linneo, 1758) para hallar la presencia del copépodo del género Pennella Pennella filosa (Linneo, 1758) del Mediterráneo occidental (Islas Baleares). La prevalencia fue del 46%. Se realizaron mediciones de cabeza, cuello, complejo genital y abdomen, así como de los “cuernos”. El cefalotórax de los parásitos estaba adherido a diferentes partes del cuerpo de los peces, pero principalmente a las aletas y a los músculos dorsolaterales. Se determinaron la intensidad media, la abundancia media y el rango, y se analizaron los datos mediante el coeficiente de correlación de Pearson. Igualmente, se examinaron aspectos ecológicos del parasitismo y algunos datos del ciclo biológico.
PALABrAS cLAVE: pennella, parasitismo, prevalencia, abundancia, ecología.
INTroDUcTIoN
Coryphaena hippurus L. is a teleost fish with a worldwide distribution in temperate and warm waters of Atlantic and Pacific oceans. Every year, migrate during May-June from Atlantic to Mediterranean Sea for reproduction and in September-October come back to Atlantic Ocean (Massuti and Morales Nin, 1995).
Species of genus Pennella Oksen, 1816, are mesoparasitic crustaceans that have been collected from the flesh marine mammals and pelagic fishes as large scombrids (Thunnus Sout, 1845), sword fish (Xiphias gladius L.), sun fish (Mola mola L.), exocoebids and coryphaenids from the Pacific and Atlanctic oceans, as well as Mediterranean sea (Yamaguti, 1963; Kabata, 1992; Pollock, 1994). Pennella species have a heterogenous life cycle where larval stages, males and premetamorphic females develop on the gills of cephalopoda mainly cuttlefishes and squids. After mating, infective females leave the cephalopods to attack cetaceans and fishes (Brian, 1906; Rose, 1941; Rose and Hammon, 1953; Kabata, 1981; Raibaut, 1991). Most descriptions of Penella species are poor and few criteria for identification has been stablished possibly due to the great morphological variability of this parasite (Kabata, 1979; Hogans, 1987; Raibaut, 1991; Carbonell et al., 1999). The aims of this study were to examine the morphology,
biometry and some ecological aspects of Pennella filosa collected from C. hippurus.
MATErIAL AND METHoDS
Sixty-one C. hippurus were captured using drifting surface long lines set in the Mediterranean sea (Balearic Islands, western mediterranean) during May-June 1990, 1991 and 1995. In the laboratory the fish were mesured to the nearest centimetre fork length (FL) weighed and sexed. The skin, fins, oral cavity and gills of fishes were examined and all parasites were removed. Sites occupied by parasites as well as the depth to which they were attached, their number and any host damage were noted. Parasites were washed and cleaned in a saline solution and fixed in 70 % alcohol for subsequent examination. Total length, head and horns, neck, trunk and abdomen were measured and antenal papillae and abdominal processes were removed to allow observation of cephalic structures and abdominal filaments. Biometric data were analyzed using the Pearson’s correlation coefficient (Nie et al., 1975) whereas infection data were analyzed according to standard methods to determine prevalence, mean intensity and range of the parasites (Bush et al., 1997).

NEREIS 3 [Marzo 2011], 33-35, ISSN: 1888-8550
A. Martí García et al.34
Table 1: Prevalence, intensity, abundance and range of Pennella filosa (Linnaeus, 1758) from females and males of Coryphaena
hippurus Linnaeus, 1758.
Females MalesN 31 30Prevalence (%) 61.3 30Mean Intensity 9.3±7.7 2.1±1.3Mean Abundance 5.7±7.5 0.6±1.2Range 1-33 1-5
rESULTS
From sixty-one fishes examined, thirty-one were females and thirty males. Females measured 96,7 cm ± 15,4 (range 67-124 cm) and weighed 8.3 kg ± 3.1 (range 2,7-15.6 kg) whereas males measured 88.3 kg ± 14,3 (range 62-114 cm) and weighed 7,8 kg ± 4,2 (range 2,3 -15,6 kg). The extraction of parasites was very difficult and consequently only 35 complete parasites were collected being all they ovigerous females, belonging to P. filosa species. The ecological data are showed in Table 1 (the length of somatic tagma and horns are detailed in Table 2). Twenty-eight fishes were parasitized (Prevalence 46 %). A higher number of females (19) than males (9) were found to be infected and the mean intensity and abundance were also higher in females.
Table 2: Measurements in mm. of Penella filosa (Linnaeus, 1758). = mean. SD = standard desviation and Range. (n = 38)
x SD Range Total length 61.5 17.8 40-135Head (spheric) 3.5 0.4 3-4Head (subspheric) 3.5 x 4.5 0.3 x 0.4 3-3.5 x 4-5 Neck 21.5 10 10-55 Trunk 18 8.5 10-52 Abdomen 14 6 10-40 Right horn 5.2 1.7 4-8 Left horn 4.3 1.6 3.5-8 Dorsal horn 2.2 0.9 1-4
Fishes parasitized do not showed any symptom of disease.Parasites were anchored in different locations, but mainly in fins
and corporal musculature and, to a lesser degree in the abdominal viscera and skin. Deeply anchored parasites had the cephalotorax and neck included in the flesh or abdominal cavity of the fish, whereas the ones superficially attached had only its cephalotorax encrusted and the neck, trunk and abdomen hanging from the fish.
Parasites were deeply attached in the dorsolateral muscles (24 %) and abdomen (12%), whereas the attachments were superficial at the base of fins, fins rays and skin (dorsal fin 52%, anal fin 55% an in the pelvic, pectoral andperianal skin, 4%). The head, opercula and gills of hosts were not parasitized.
The ovigerous females had a mean of total length of 60 mm with a range from 40 to 135 mm. the cephalotorax and neck were whitish without cuticular striations whereas the trunk and abdomen were black-brown and with cuticular annular striations.
Two types of cephalotorax were observed, spherical or cup-like. The former has a diameter from 3 to 4 mm and numerous small papillae occupying the apical region whereas the latter were 3-3.5 mm long and 4-5 mm wide and the papillae were less numerous, larger and occasionally bilobed. Generally the spherical cephalotorax belonged to parasites with a long deeply anchored neck, whereas the cuplike cephalotorax belonged to parasites with a shorter superficially attached neck. All females had three horns, two laterals similar and the dorsal always the smallest. The parasites deeply anchored showed larger horn than parasites attached to hard tissue (fins rays, bones, etc.).
Necks measured 21.5 mm (S.D. 10 mm), were cylindrical in shape smooth and narrower than trunk. They were longer in parasites with spherical cephalotorax and long horns and shorter in parasites with a cuplike cephalotorax and short horns.
Trunk was cylindrical in shape and slightly shorter than the neck (mean 18 ± 6 mm). Two genital orifices and two long egg strings were present. Egg strings were twice or three times longer than body length.
Abdomen was the shorter somatic tagma and showed typical abdominal processes. The number of filaments was 23 (s.d. 55.5) with a range from 15-45, and they showed branches without ancitomosis. 1st, 2nd, 3rd and 4th branches could be present and the number is higher in parasites attached to anal and caudal fins. Anastomosis was not observed.
DIScUSSIoN
This work has allowed us to show the epizootic character of P. fillosa infection in dolphinfish communities which every year migrate into the Mediterranean Sea. Fishes are presumably infected during the migratory period from the strait of Gibraltar to the Balearic Islands (Alboran Sea) where squid and cuttlefishes are abundant. It seems that these cephalopods are involved in Penella sp. vital cycle as intermediate hosts (Brian, 1906; Rose and Hammon, 1953; Kabata, 1981). On the other hand, squid (Lohigo, Eledone) are a important food item in the diet of C. hippurus captured in the Mediterranean Sea (Massuti et al., 1998; Carb et al., 1999) whereas in Atlantic and Pacific waters these invertebrates are not common in the diet of these fishes (Rose and Hassler, 1974; Manooch et al., 1984; Sakamoto and Taniguchi, 1993). This observation would explain the great prevalence of Penella infection in dolphinfish captured in the Mediterranean Sea.
There were no data about the location of P. fillosa.We have found both, parasites with cup-like cephalotorax
superficially attached to hard sites and with a deeply anchored spherical cephalotorax. This agrees with Hogans (1987) since in soft tissue hosts such as Mola mola, the cephalotorax remains spherical form, and in tuna, with soft and hard tissues. This is true, even, in a same host with soft and hard tissues. Hogans (1987) also noted that the variability of cephalic papillae is unknown; however, we found large and lobed papillae in the cup-like cephalotorax and small papillae in the spherical cephalotorax.
All the parasites found in our study had three horns, which were long in soft tissues and short in hard tissues. This observation is similar with that of Hogans (1987), although this author reports in his work the presence in some specimens of two horns. The same author also indicated that neck length is directly dependent on depth penetration. Nevertheless, we observed long and short necks in superficially attached parasites, and long necks in deeply anchored parasites. Hogans (1987) also notes that parasite age is the principal factor for variability of the trunk and abdomen. However, we consider that besides age, there are other responsible factors for morphological variability such as host

NEREIS 3 [Marzo 2011], 33-35, ISSN: 1888-8550
35Penella filosa (Linnaeus, 1758) (Copepoda, Siphonostomatoida, Pennellidae) from...
species, size, and the characteristics of parasitized musculature (e.g. muscle hardness, mass, motility). Additional factors include host behavior, including movement patterns and swimming speed, which determine the degree of water friction, resistance and turbulence and parasite penetration level, whether the attachment is superficial (e.g. fins, rays, tegument, subcutaneous tissue) or deep (e.g. muscles, bones, abdominal cavity, internal organs). Finally, the degree of inflammatory reaction or the capability of the host to develop fibrous tissue around the cephalotorax and neck of the parasite are other responsible factors.
There is too much morphological variability in the characters analyzed to find any taxonomic value in them. Consequently, we believe that it is necessary to study larval copepodites and chalimus stages, as well as premetamorphic females (possibly males also) in order to clarify the systematics of the genus Pennella.
AcKNowLEDGEMENTS
This work has been financed by Terra Natura Foundation (Benidorm, Alicante, Spain).
LITErATUrE cITED
BRIAN, A., 1906. Copepodi parassiti dei pesci d’Italia. Génova: Stab. Tipo-Litografico R. Istituto Sordomuti, 187p.
BUSH, A.O.; LAFFERTY, K.D.; LOTZ, J.L. and SHOSTAK, A.W., 1997. Parasitology meets ecology on its own terms: Margolis et al. revisited. J. Parasitol., 83, 575-583
CASTRO ROMERO, R. and BAEZA KUROKI, H., 1986. Premetamorphosis stages of two Pennellidae (Copepoda, Siphonostomatoida) from their definitive hosts. Crustaceana, 50(2), 167-175
CARBONELL, E.; MASSUTI, E.; CASTRO, J.J. and GARCíA, R.M., 1999. Parasitism of dolphinfishes, Coryphaena hippurus and Coryphaena equiselis, in the western Mediterranean (Balearic Islands) and central-eastern Atlantic (Canary Islands). Sci. Mar., 63(3-4), 343-354
HOGANS, W. E., 1987. Morphological variation in Pennella balaenoptera and P. filosa (Copepoda, Pennellidae) with a review of the genus Pennella Oken, 1816 parasitic on Cetacea. Bull. Mar. Sci., 40(3), 442-453
KABATA, Z., 1979. Parasitic Copepoda of British Fishes. London: The Ray Society, 468p.
KABATA, Z., 1981. Copepoda (Crustacea) parasitic of fishes: problems and perspectives. Adv. Parasitol., 19, 1-17
KABATA, Z., 1992. Copepods parasitic on fishes. Synopsis of British Fauna, 47. Linnean Society. London.
MANOOCH III, C.S.; MASON, D.L. and NELSON, R.S., 1984. Food and gastrointestinal parasites of dolphin Coryphaena hippurus collected along the Southeastern and Gulf Coast of the United States. Bull. Jap. Soc. Sci. Fish., 50, 1511-1525
MASSUTí, E. and MORALES NIN, B., 1995. Seasonality and reproduction of dolphin fish (Coryphaena hippurus) in the western Mediterranean. Sci. Mar., 59, 357-364
MASSUTí, E.; DEUDERO, S.; SáNCHEZ, P. and MORALES-NIN, B., 1998. Diet and feeding of dolphin (Coryphaena hippurus L.) in western Mediterranean waters. Bull. Mar. Sci., 63(2), 329-341
NIE, N.H.; HULL, C.H.; JENKINS, J.G.; STEINBRENNER, K. and BENT, D.H., 1975. SPSS: Statistical package for the social sciences (2nd ed). McGraw-Hill Book Co., New York.
POLLOCK, C. M., 1994. Pennella filosa (Copepoda) parasitic on albacore tunna, sunfish and sword fish. Ir. Na. J., 24(11), 473-474
RAIBAUT, A., 1991. A propos des Pennelles (Copepodes) parasites des Cetacés. Actes des Premieres Rencontres de Cetologie Mediterranéenne. Port-La-Nouvelle, pp. 43-49.
ROSE, M., 1941. Sur le male de Pennella, Copepode marin parasite des Poissons et des Cetacés. C. R. Soc. Biol., 135(17-18), 1478-1479
ROSE, M. and HAMMON, M., 1953. A propos de Pennella varians Steenstrup and Lutken, 1861, parasites des branchies de Caphalopodes. Bull. Soc. Hist. Nat. Afr. Nord, 44(5-6), 172-183
ROSE, C. D. and HASSLER, W. W., 1974. Food habits and sex ratios of dolphin Coryphaena hippurus captured in the Western Atlantic Ocean off Haleras, North Carolina. Trans. Am. Fish. Soc., 103, 94-110
SAKAMOTO, R. and TANIGUCHI, N., 1993. Stomach contents of dolphin fish, Coryphaena hippurus caught around bamboo rafts in Tosa Bay, the water Southwestern Japan. Bull. Jap. Soc. Fish. Oceanogr./ Suisan Kaiyo Kenkyu, 57, 17-29
YAMAGUTI, S., 1963. Parasitic Copepoda and Branchiura of Fishes. USA: John and Sons Inc., 1104p


NEREIS 3 [Marzo 2011], 37-44, ISSN: 1888-8550
Natural coastal risks and the coastal Zone Integrated Management Fecha de recepción y aceptación: 14 de diciembre de 2010, 9 de enero de 2011
r. cruz Nardo†, A. cabrera Hernández†, B. Moya Gonzalez‡, M. Morales González∞ and Y. García Quintana1§
† Office of Coastal Integrated Handling Beach of Varadero. Street 52 and Avenue Playa, Varadero, Cuba. Phone-fax 53 45 662939Email: [email protected]‡ Center Meteorological of Matanzas. Milanés 19, Matanzas, Cuba. Telephone-fax 53 45 286867. Email: [email protected] ∞ Division of Environmental Administration. Center of Environmental Services of Matanzas. South Freeway , km 14, Varadero, Cuba.Telephone-fax 53 45 613594. Email: [email protected](§) Universidad Católica de Valencia “San Vicente Mártir”, Valencia, España. Email: [email protected]
Nereis. Revista Iberoamericana Interdisciplinar de Métodos, Modelización y Simulación
3 37-44 Universidad Católica de Valencia “San Vicente Mártir”
Valencia (España) ISSN 1888-8550
ABSTrAcT
An analysis of the main natural risk factors of the Peninsula of Hicacos, on the coast center-west of Cuba is submitted. From an exhaustive bibliographic review, first it is presented a physical-geographical and socio-economic characterization of the peninsula of Hicacos, and on this basis are identified geological, geomorphological and hydrometeorological factors that determine natural hazards in the area under study. In particular an analysis of probabilities of extreme winds in the past 200 years associated with hurricanes, and the heights and periods of waves on the coast of the peninsula to different periods of return is materialize. Also it´s includes a brief analysis of the endogenous risks, and conclude that the hurricanes, the severe local storms and the frontal systems are the main natural dangers that affect the Peninsula. Finally the value of the MIZC for the study, prevision and confrontation of the natural risk is argued, and the positive experience of the application of that approach in the beach of Varadero.
KEYworDS: coastal process, coastal natural risks, integrated coastal management.
rESUMEN
Se presenta un análisis de los principales factores de riesgos naturales de la Península de Hicacos, en la costa centro-occidental de Cuba. A partir de una revisión bibliográfica exhaustiva, se presenta primero una caracterización físico-geográfica y socio-económica de la península de Hicacos y sobre esta base se identifican los factores geológicos, geomorfológicos e hidrometeorológicos que condicionan los riesgos naturales en la zona objeto de estudio. En particular se realiza un análisis de probabilidades de los vientos extremos en los últimos 200 años asociados a los huracanes, y de las alturas y periodos del oleaje en el litoral de la península para diferentes periodos de retorno. Se incluye un breve análisis de los riesgos endógenos, y se concluye que son los huracanes, las tormentas locales severas y los frentes fríos los principales peligros naturales que afectan la a Península. Finalmente, se argumenta el valor del enfoque de MIZC para el estudio, previsión y enfrentamiento de los riesgos naturales, y se expone la positiva experiencia de aplicación de tal enfoque en la playa de Varadero.
PALABrAS cLAVE: procesos costeros, riesgos naturales costeros, manejo integrado costero.
INTroDUcTIoN
The natural disasters show an exponential increased in last decades, causing bigger economical losses and the death of a lot of people. This affirmation is enough to understand the necessity of an adequate disasters management and its reduction. The control of these risks has become in an essential objective face to this situation.
The knowledge of this hazard, the analysis the natural and social vulnerabilities, focusing in the risk management should be especially considered in the definition and assessment of the sustainable development. Gradually the coastal natural risks category has converted in an intrinsic part of the development category (Lavell, 1996), and in this context the characterization, diagnostic and monitoring of those risks are widely recognized as an interesting key in the planning and decisions making process.
It is discussed the role of the intensity and length of the natural risk and the vulnerabilities in the level of damage produced. As it can be seeing the line of thought is that are the pre-existents conditions of vulnerability who elevate the risk concept to a critical situation, and that the fundamental objective has to be the identification and reduction of the vulnerabilities and the promotion of compatible models of the interrelations society-economy-nature.
In particular in the small insular states of the Caribbean, the natural disasters have a big impact as a result of the combination of high levels of natural dangers, the increase of vulnerabilities generated by an inappropriate socio-economic developing model, and very feeble alert and natural risks fighting systems (PNUMA, 2005; Program of United Nations for the Development).
The increased the intellectual and technological capacity in the study of natural risks and especially in the application of a Civil Defence

NEREIS 3 [Marzo 2011], 37-44, ISSN: 1888-8550
R. Cruz-Nardo et al.38
system that has advanced from the initial efforts, more directed to notify the dangers, until the current improvement of a uniform group of measures related with all the stages of the disasters reduction cycle the prevention, the preparative, the answer and the recovery. In this article the physical- geographic and socio- economic characteristic of the coastal zone are analyzed, identifying geological-geomorphologic and hidro- meteorology factors in the coastal natural risks, and finally illustrate the inclusion of risk management in the Coastal Integrated Management potentiating the study, forecast and confrontation of the natural risks.
MATErIALS AND METHoDS
For the analysis of the geological-geomorphologic and hydro-meteorological characteristics of the area, it was collected and processed information for approximately 40 years based on a large number of research reports with a local and general character, as well as the review of numerous articles, books, and other documents.
This cabinet work was complemented with the fieldwork that the authors have been developing over the past 12 -15 years, with the interpretation of cartographic materials, aerial and cosmic pictures of various scales and years, besides participate in interviews and exchanges of knowledge with several prominent scientists, specialists and personalities of the territory.
The analysis of hazards by hurricanes and strong winds is developed by statistical process. First this discrete variable responds to Poisson distribution and for the second case Fréchet distribution is applied.
The Poisson distribution is used to model the number of events occurring within a given time interval. The formula for the Poisson probability mass function is
is the shape parameter which indicates the average number of events in the given time interval.
Figure 1 show following the plot of the Poisson probability density function for four values of .
Fig. 1. Poisson probability density function.
For the analysis of maxim winds Frechet Distribution, was applied.
A function is Fréchet differentiable at ( ) if
exists. This is equivalent to the statement that ( ) has a removable
discontinuity at , where
Parameters
- continuous shape parameter ( )
- continuous scale parameter ( )
- continuous location parameter ( yields the two-parameter Frechet distribution)
Domain
and it is defined as:
Probability Density Function
Cumulative Distribution Function
Finally the evaluative documents in the integrated coastal management program of Varadero were studied, which has been implemented in the last 9 years, and accordingly sets out the benefits of applying this approach to studying and confronting the coastal natural hazards, and the challenges that are still ahead.
The assessment process of the management program of sand was distinguished by crossed utilization of three instruments: surveys to specialists, surveys to the population, and depth interviews with experts. This was supplemented by documentary analysis. All this methodology sequence, utilized in the development of our work is faithfully reflected in the structure of the article, its first part is referring to the physical and socioeconomic characterization, and on this basement, identify the principal coastal natural hazards that affect potentially these zones, and close with an argument for integrated coastal management approach in relation to the study and confrontation of coastal natural hazards.
General features of the coastal zone
The neo-tectonic activity, that has generated the forms of structures, is cause of the relief as much in the marine part as in the emerged areas. The region is constituted by a mosaic of blocks limited by tectonic flaws (Goatherd ET to, 2001).
FRECHET (MAXIMUM
EXTREME VALUE TYPE 2) DISTRIBUTION
(MATHWAVE, 2009)

NEREIS 3 [Marzo 2011], 37-44, ISSN: 1888-8550
39Natural coastal risks and the Coastal Zone Integrated Management
Young plains, Recent and later Pleistocen, developed on a very extended sandy substrate, and over sandy and sandstone, where the fossil dunes are distinguished, are predominate, although also appear other forms of relief associated to the sea-land exchange processes Cabrera et al (2004). The prevalence of young and low plains in the coastal areas is characteristic of high risk for these areas.
Main natural risks and vulnerabilities in the coastal zone
The coastal zone, and therefore, is exposed irremediably to the hazard of flood by marine penetrations but also by the intense rain. Penetrations of the sea they can occur so much in the winter as in summer, always associated to meteorological extremes, with strong cold fronts and subtropical Lows in the winter and the tropical low, disturb, depression, tropical storms and hurricanes between June and November. Other hydro meteorological extremes is the Severe Local Storm mainly from may to June, but also sometimes associated with the subtropical and tropical storms. (Alfonso, A y Florido, A, 1992). The most dangerous hazard in the tropical zone is the hurricanes, mainly when they have a trajectory along to the coasts. (Moya, et al. 2006)
The coastal zone is located W of the meridian 80°, considered the region of more frequency of occurrence of tropical hurricanes, tropical depressions and events migratory subtropical. They are the main generators of strong winds, intense rains and flooding low lying coasts.
On the other hand, the processes of coastal erosion have great relevance for the sand beach. The studies carried out during a long time, using topographical profiles and remote methods show that the beaches it is outstanding to execute a good program.Other important process, although slower and mostly concentrated in the winter station, it is the transfer of the grains of sand for the action of the wind, when this overcomes speeds bigger than 5 m/s. The balance of sediments produced by the interaction with the eolic effect is evidently significant, and it is object of specialized researches currently.
For all the above-mentioned it is evident that the most dangerous hydro-meteorological hazard that potentially can affect the tropical coastal zone is the presence of tropical storms and hurricanes, those can that produce significant impacts, in dependence of the speed of their winds, the precipitations and the elevation sea level over elevation (Juanes, J.L, 1996). Cuba is a typical example of very affected island for phenomena hidrometeorológical.
In Atlantic basin, Caribbean Sea and Gulf of Mexico, the multiannual variability shows periods of high and low activity with special period with moderate activity between 1825 and 1852. For instance in Varadero, located in Caribbean sea, (Fig. 2), being the June to November the riskiest period with the biggest frequencies in September and October (Table 1).( Moya, B.V. 2007).
In a 2009 years period, 32 hurricanes were reported, for an average of 0.15 hurricanes per year in Varadero, almost 1 hurricane every 6 years. During this period Hicacos was affected by 1 hurricane in 28 years and for 2 hurricanes in year in 2 occasions. (1933 and 2008). The period of more inactivity was between the 1953 and 1984 where they
didn’t register events, while in 3 occasions the affectation for hurricanes was in successive years. (1831 and 1832, 1875 and 1876 and 1894 and 1895). (Moya B. 2003).
The statistical analysis infers that the years with affectation for 1 hurricane have a period of return 5.9 years, while the years with 2 hurricanes they appear every 103 years (Table 2 and Fig. 3). Analyzing the hurricanes in last 200 year it was observed that at least 4 hurricanes reached great intensity in the area: in 1844, 1846, 1926 and 1933.The most probable hurricanes tracks in Matanzas, in general and near Varadero, in particular, shows in the follow figure. (Fig. 4)
Table 1. Hurricanes per month in Varadero and month’s relative frequency. Period 1800-2008.
Months June July August Sept Oct Nov
Hurricanes 1 1 4 10 14 2
Frequence 0.005 0.005 0.019 0.044 0.067 0.010
Fig. 2. Periods of high and low activity of hurricanes in the beach of Varadero, from 1800 up to 2008.
Fig 3. Years without, with one and with two hurricanes. Period 1800-2008.
Table 2. Hurricanes observed, expected and period of return in Varadero.
Observed (hurricanes) % Expected (hurricanes) % Observed-Expected Period Return (years) Year=0 179 85,64593 179,3294 85,80353 -0,329376Year=1 28 13,39713 27,4571 13,13738 0,542871 5.9Year=2 2 0,95694 2,2135 1,05909 -0,213495 103

NEREIS 3 [Marzo 2011], 37-44, ISSN: 1888-8550
R. Cruz-Nardo et al.40
Fig. 4. Most frequent hurricane track in Matanzas and Varadero.
The theoretical analysis of the maximum annual winds, developed by R. Vega in 1993 and Pérez R in 2007, expects an extreme value between 60 and 70 m/s in a 100 year period. However, in the meteorological series of Casablanca in the City of Havana (representative for the peninsula of Hicacos), there are two values upper the suggested by the theoretical distribution in the 80 year.
They are related with two hurricanes: one measured of 72.8 m/s and other estimated, from the minimum observed pressure and the damages produced damages, of 80 m/s in 1926. The study on hurricanes, estimated that a hurricane of maximum intensity with superior winds to 80 m/s can affect the area once every 100 years.
The following graph (Fig.5) shows the maximum probable gusts for different periods of return.
This hazard assessment is always necessary for the risk management. The knowledge of the hazard is the first step to develop an adequate risk program face to meteorological extremes.Following with the example of Varadero, the physical-geographical characteristics of the peninsula of Hicacos contributes in a certain natural susceptibility to the coastal risks (Cabrera, 2008).
Between the factors of susceptibility or natural vulnerability we can highlight the following ones:
– The configuration of the Peninsula, lengthened and it narrows, with less than two kilometers in their wider portion; and their southwest northeast orientation–
– Their geographical location, very near to the North American continent and the subtropical area, and of great exposure to the tropical and subtropical storms, and to the strong and persistent influence of the winds.
– The relief of young and unstable plains, with very little height on the sea level, and developed mostly on soft, sandy and sandy-loamy deposits, or weakly consolidated rocks
– The prevalence of climatic conditions of low precipitation and unfavorable hydric balance with a deficit upper 1000 mm a year
– A little developed soils covering.
To the above-mentioned it is necessary to add the action of the antropic process with economic taking place in the urbanization and tourism exploitation, producing modifications of the natural and original environment that are reverted in many cases in additional factors of the vulnerability of the territory. The knowledge of the vulnerability is the second necessary step for the risk determination and with this information and the hazard assessment, so it is possible develop a risk assessment as important part of the risk management.
Fig 5. Estimated Values of the maximum winds. Period 1909-2005. (Lower limit) (Pérez R, et al. 2007).
coast risk and integrated coastal management.
The World Meteorological Organization (WMO) sustains that, although the disasters cannot be avoided, the integrated evaluation of the risks and the early warming play an important role in the decreasing of their devastating effects and avoid the lost of the human lives. The Coastal integrated Management is convenient tool or mechanism where insert the coastal risk program.
In effect, the Integrated Management of Coastal (IMCZ) Zones have been constituted in a theoretical-methodological appropriate framework to approach the problem of the coastal risks.
It is considered the concept of integrated coastal Handling of Barragán (2008) which describes it as a process centered in the management and administration of the space and the resources guided to the sustainability of the coastal-marine environment, that is guided to the search of more balanced models between conservation / restoration of the resources and the human development, and in its application are implied public and private institutions.
It will be understood, then, that this management and administration the space and the coastal resources should necessarily include the study and management of the natural coastal risks.
Among the theoretical-practical principles in which the Programs of Integrated Coastal Handling are based stand out the following ones:
– The coastal areas are systems with high richness in elements, resources, ecological processes and natural fragility natural that require of a holistic focus holistic in its protection, management and rational exploitation.
– The identification of the impacts and the environmental problems produced by human activities, constitute the diagnostic and the first challenge, in the conformation, implementation and continuous improvement of the Program of Integrated Coastal Management.
The Integrated Coastal Management constitutes an adequate framework to develop strategies and programs face to coastal risks. The holistic knowledge focusing to the coastal area, avoiding the application of punctual solutions, often with negative effects in the adjacent areas.
The classic methodological sequence (using cycles, and the same way with other public politics) which evolves the implementation and design of a Program of Integrated Handling of Coastal areas (MIZC) is shown in the following figure (Fig.6)

NEREIS 3 [Marzo 2011], 37-44, ISSN: 1888-8550
41Natural coastal risks and the Coastal Zone Integrated Management
Fig. 6. Successive cycles of a program of integrated management of the coastal area. (GESAMP, 1996, Olsen et to the one., 1999).
How do face the coastal risk’s study and the management in the context of the integrated coastal management?
Following the methodological sequence which evolves the implementation and design of the Program of MIZC, its first step should be clarified it is the politic-legal and institutional framework for the risks management and study.
Then it is necessary a complex characterization and an integrated diagnostic of the coastal area allowing know the baseline of the natural hazards, the natural and anthropogenic vulnerabilities in the zone.
An analysis of the natural hazards is necessary at this time, focused to know its frequency, occurrence probability and period of return. It is necessary the hazard intensity and magnitude assessment, too. In the same way, the possible impacts should be known. In this sense it is good to know the worst option, but also the other hazards magnitudes and intensities. For the hazards simulation, the implementation of models is a useful tool to understand the hazards.
This characterization should show the strengths social weaknesses and the economic impacts that face to different hazards. In these studies the knowledge of hazard´s chronology is interesting because allow us to know from the past and present and facilitating what should be in the future. For this study is convenient the analysis of historic-evolutionary studies to know how has gone changing the natural vulnerability of the ecosystem.
The history of the land use change and the transformations in the socio-economic area. This knowledge is indispensable knowledge for the analysis about how the man has influenced in the vulnerability of the ecosystem. The use of cartographic of tools and teledetection are very useful in this analysis, and the historic knowledge of population and specialist is sometime very important for it. That matters.
In this phase it is interesting to study the level of hazard perception in the society, the same way the level of preparation of the people to face it, and know what are the vulnerability and strength for the risk management and their integration with MIZC. All this help in the determination of the key matters for the management, making the identification of the coastal risks play an important role.
The identification of the stakeholders participating in the implementation of the integrated management of the coastal area, is another steps in the risk management and its implementation in Coastal management. The identification and the stakeholder characterization, the clarification of their knowledge and their capacities or weaknesses, is a fundamental task to establish the operative framework in that risk management.
Arrived the moment to conform the Program of MIZC, is accepted include in an independent sub-program or a group of sub-programs.
The actions addressed to reducing natural coastal risks and facilitate the adaptation to climate change are interrelated. The final goal is to reduce the vulnerability to the meteorological and climatic hazards.
The identification and forecast of the natural coastal risks, the emission of early warning, the communication the decision makers and the population in general, the capacitating and education in risks management and the systematic monitoring, among other, they are essential actions for the risk control and also constitute operative measures for the group of the integrated management in the coastal area.
For the best operation of coastal risk management in the MIZC context, is mandatory the conformation of executives and scientist-technical structures in charge to the implementation of each one of the actions. The 3rd table shows up in a synthesized way all the moments to develop the coastal risks management in the MIZC.
Table 3. Sequence of the coast risks management in the context of MIZC.
Phases Essential Actions.Previous Phase Analysis of the policy framework of the
beginnings. Analysis of the existing normative-legal base.Identification of institutions and the task assign them.
Characterization and Diagnostic
Integrated characterization in the work area (Baseline).Identification and characterization of hazards, including frequency, intensity and potential impacts.Analysis of the vulnerabilities.Risk assessments.Studies of the risks perception, particularly in decision makers and local population.
Planning of uses: adequation to the map of risks
Analysis of the functional sectorization of the coastal area and their correspondence with the levels of hazards and risks.Current and potential uses in function of the risks mapping.
Design of the action program
Establishment of the actions addressed to the detecting and forecast, emission of early warning and other warnings, capacitance and education about risk control, etc.Definitions of the measures of coastal defense, adaptation to the uses of the territories and planned retreat of housings and facilities of any type at the coast.Establishment of the actions in the stages that defines the Civil Defense: informative, alerts, warnings and recuperation.
Insurance, implementation and evaluation of the Program
Establishment of the institutional structure under those which to be implemented the planning and financial budget.Implement actions to pilot scale.Planning and development of program assessments, facilitating their permanent improvement.

NEREIS 3 [Marzo 2011], 37-44, ISSN: 1888-8550
R. Cruz-Nardo et al.42
coast risks and integrated coastal management
The Integrated Program of actions for the sand beach proposes several work addresses, using subprograms with exchange among them, and their fundamental achievement has been the convergence of all the actors in the environmental and tourism management of the beach, led by a Coordinating Unit.
Among the main adopted measures stand out the absolute prohibition of the sand extractions, the elimination of facilities in the beach first line, the defense of some touristc facilities with high importance, building artificial dunes, with reinforced areas with geotextile padded of sand, allowing the dissipation of the wave energy. The same way a rigorous planning and control of the new investment is developed in the peninsula.
In synthesis the follow measures and actions have been introduced in the coastal zone.
Shedding and maintenance of the beach
The feeding of sand to the beach has been implemented, mainly in the critical sectors where the erosion process has decreasing the areas of sand, in which the narrowing of the sand is appraised, with rocky upwelling. Developing technical projects and tasks previously elaborated leading the feedings. This process also contributes to the restoration of morphology of the beach and the retention and accumulation of sand.
Actions of particular technological scientific meaning and great socioeconomic repercussion have been the great sand shedding, and have allowed to improve in short time the physical conditions and the sand strip in the beach.
The execution of the project of shedding of beach is one of the most important actions developed in the coastal zone. For instance, in 1998 1 087 000 m3 of sand that extended to the 12 kilometers With the preparation from Institute of Oceanographic of Cuba and executed with high quality and minimum time by the Dutch Company of dredged Blankevoort, and it is considered as one of the most effective in the world. The results monitoring developed 4 years later showed a very positive 80% of retention of the added sand.
The artificial accommodation of the sand with transportation of the excessive sand deposited in zones of increase of the beach towards the critics zones of coastal erosion. Besides to all this actions focused to the solution of the problems have been implemented that cause the eolic erosion during the winter season and the pluvial erosion in some specific zones of the beach.
These actions also include, the dune conformation and the reinforcing of the ones already existing, because many parts of the coastal zones are of low-lying land with risk of inundation by sea flooding , with which also was fulfilled the objective to create a defense for cases of extreme events.
It is important to emphasize that these methods to develop the shedding and all the actions of maintenance of the sand have been very effective in the physical improvement of the beach with a minimum impact on the ecology and environment. These actions improve the resistance of the beach, decreasing the vulnerability and risk and also avoiding the implementation of costal engineering, with hard measure and bigger impacts in the environment.
Dune rehabilitation
The morphologic of the dune and vegetal of the dunes rehabilitation, it have a significant role in the natural stability of beaches. Some
problems have been identified in different sectors, such as inadequate deforestation of the native vegetation, ecosystem fragmentation, inadequate access, deterioration in landscape and its general function. Face this situation, was orchestrated scientist-technical solutions improving the morphologic conformation and reforesting with typical species of dunes. (Cruz, 2008).
Physical planning and ordering of the coastal zone
The environmental regulations related to the coastal ordering have become more and more rigorous, and in this sense it is possible to emphasize in the correct location of facilities behind dunes, the use of a detachable rustic design of those facilities, mainly on piles, and the optimal management of the liquids or solids wastes, from the temporary facilities that offer gastronomical and recreational services in the zone of beach.
Complementarily, other measures addressed to regulating the accesses have been orchestrated in the beach, stimulating the effective construction of wood path and other techniques, as well as regulating the behavior of the users of the beach, applying informative and regulative signs with the objective to contribute to the environment education of the users.
Demolition of walls and facilities. Environmental reordering of the coastal zone
From the beginnings of the beach protection integrated management, the presence of facilities in the beach and in the dune, was reason of preoccupation by the fort impact that causes its actions for the natural dynamics of the beach.
In those places where constructions are located on the dune it is necessary the elaboration and put it in practice a demolitions plan and rehabilitation of areas of the beach. An example in Caribbean Sea is found in Varadero beach with the demolition of more than 80 facilities, mainly houses from tourist facilities, second houses and more than 3 000 meters of walls and fences in the critics zones from the point of view of the erosion of the beach, it is a good example. This continuous program in execution at this moment goes on to the demolition of other facilities that cause greater coastal erosion.
This work should be coordinated agreement of the Coordinating Unit of the coastal Zone Program with the authorities of the Tourism and other economic activity in the coast, and the Government, making joint decisions, taking in consideration the situation of the beach in each sector, the technological possibilities to execute the actions and the recuperation of these zones, the plans for the future development of the tourist destiny, the present use of the facilities and its economic behavior as well as the cultural and social historical values, and the level of conservation of the building (Institute of Oceanology, 1996). Later very positive valuations have taken place about the benefits that this measurement in the beach stability, although is clear that these processes are also influenced by natural factors still presents in the zone.
Complementarily, given historical, architectonic or social values in some facilities have a great economic value, also orchestrated protections, using the technique of geotextiles (sandttainer or sandbags), which are made of textile materials, with a high resistance to the tension and the wearing down by abrasion, and have been placed in such a way that they work like dissipater of the energy of the wave This technique with sandbag, that has been applied in numerous important facilities of the tourism, has the advantage of which when happening the years and breaking the material, the sand is recover for the dynamic of the

NEREIS 3 [Marzo 2011], 37-44, ISSN: 1888-8550
43Natural coastal risks and the Coastal Zone Integrated Management
beach and it contributes to improve the beach profile, without negative consequences for environment.
Scientific and integrated Monitoring of the beach
A monitoring of a group of structural and functional parameters of the beach it is very important, and this information contributes for the characterization of the ecosystem, and it has constituted in a solid base for the decision making in relation to the operation and the protection of the beach too. At the same time the monitoring has served to assess the effectiveness of the measures taken in any coastal area of sandy beach.
Coastal integrated Management also includes actions directed to the researches, the information and for environmental education and supervision. Scientific projects have studied the biological sand production, the rehabilitation of dunes. The influences of the global climatic changes and of the coastal risks have priority in the scientist activity.
The capacitating and environmental education extend more and more towards the different sectors from the local population, keeping integration between environmental culture and the general culture. This integration has taken deep root with the protection and use of the beach (Cabrera, 2008).
As is possible understand, this program for the coastal integrates management has journeyed important phases already. First the key subjects were identified, from the previous diagnostic, was later obtained the conformation and the formal adoption of the program, which implied an arduous process of consultations, questions and successive readjustments, until to obtain the approval from the local government, and the essential definitions of budgets.
Important aspects in the program for the coastal integrate management are:
– The real solution of the problems and risks previously identified– The Inter-institutional coordination and the qualification of
the personnel with responsibility in the environmental and tourist management of the beach
– The continuous monitoring and the development of new researches that guarantee the necessary feedback for the planning and attention to new problems and exigencies of the development. Recently a first assessment process of the implementation of the Program was culminated, and it was possible to be responded to key questions, such as
– What has been reached, how has changed the context since the program began?
– What new approaches and actions must be adopted like part of the continuous improvement of the Program?
The assessment shows that the program is causing positive changes in key aspects, very closely related to the control of the coastal natural risks and the decreasing of the vulnerabilities, such as a maintenance and systematic improvement of the sand area, the rehabilitation of dunes, as much from the morphology like the vegetal cover, the rigorous coastal environmental ordering, the increasing development of the monitoring actions and the development of research projects and scientific exchanges. All these actions have transformed into a strong support of the integrated coastal management, decreasing the vulnerabilities of coastal zone to natural hazards and off course, decreasing risk too.
coNcLUSIoNS
It has been argued that the focus of the Coastal integrated Management is a general philosophy of work, with methodological phases perfectly established and a very good opportunity to develop adaptative capacities and decrease vulnerability face to the natural hazards. It is a special space to develop a risk integrated management.
The application of the risk management into the Coastal integrated Management in the sand beach requires an appropriate mark: of coastal governance, a permanent process of identification, assessment and monitoring of coastal risks, decreasing the natural and antropic vulnerabilities. In this way also has contributed to the high quality environmental education and capacitating for decision makers, stakeholders and people in general. All that allow an improved answer, an effective recuperation and a better risk damage prevention face to coastal natural hazards, finally allow a real decreasing of the coastal risks.
rELATIoNSHIP oF FIGUrES AND cHArTS
Fig.1. The Poisson probability density function for four values of . Fig.2. Periods of more and smaller activity of hurricanes in the beach of Varadero, from 1800 up to 2008. Fig 3. Years without, with one and with two hurricanes. Period 1800-2008.Fig 4. Most frequent hurricane track in Matanzas and Varadero.Fig 5. Estimated Value of the maximun wind. Period 1909-2005. (lower limit).Fig. 6. The successive cycles of a program of integrated management of the coastal area (GESAMP, 1996, Olsen et al., 1999).Tabla 1. Hurricanes per moth in Varadero and month relative frequency. Period 1800-2008.Tabla 2. Hurricanes observed, expected and period of return in Varadero.Tabla 3. Sequence of the administration of coast risks in the context of the MIZC.
GrATEFULNESS
This article is a contribution of the “Ibero-American Net in Applied Teledetection to the Prevention of Risks Geologic Coasts” (www.tango.es, ref. 407RT0310) financed by the Ibero-American Program of Science and technology for the Development (CYTED, www.cyted.org).
rEFErENcES
ALFONSO, A Y FLORIDO A. 1992 The Climate of Matanzas. Editorial Academia. The Havana pp7-24 1992.
BARRAGáN, J.M. 2008. The Key Matters for the Integrated Coastal Handling in Iberoamérica. Working Manual: The Decalogue. The main task of the first year of the Net IBERMAR. (Unpublished).
CABRERA, JA. Diagnostic environmental of the beach in the Sector the Tainos. Varadero. Office of Costal Integrated Handling (OMIC). 2004. (Unpublished).
CABRERA H. J.A.. Programs of Integrated Handling of the beach of Varadero. Office of Coastal Integrated Handling (OMIC). 2008. (Unpublished).

NEREIS 3 [Marzo 2011], 37-44, ISSN: 1888-8550
R. Cruz-Nardo et al.44
CRUZ, R. Proposed of indicators of Pressure, State, Impact and Answer to contribute to the management of the Taínos Beach from the perspective of the MIZC. 2008. (Unpublished).
GESAMP (Joint Group of Experts on the Scientific Aspects of Environmental Marinates Protection). 1996. The Contributions of Science to Integrated Coastal Management, GESAMP Reports and Studies, No. 61. Food and Agriculture Organization of United Nations, Rome. 66p.
GOATHERD H. and collective of authors. It Programs Integrated of Stocks for the recovery, maintenance and improvement of the beach of Varadero. 2001.
INSTITUTE OF OCEANOLOGY. Program of demolitions and it improves of the beach of Varadero. 1996.
JUANES, J.L, 1996. The erosion in the beaches. Alternatives for their control. The doctoral thesis. University of the Havana. Cuba. 129 pp.
LAVELL, 1996. The administration of the disasters: hypothesis, concept and theory In State, Society and administration of the disasters in Latin America in search of the lost paradigm LARED – FLASCO. ITDG. Perú. 10 p.
MATHWAVE, F. (Maximum Extreme Value Type 2) Distribution From Mathwave. Data analysis and simulation. http://www.mathwave.com/help/easyfit/html/analyses/distributions/frechet.html accesed august 2009.
MOYA, B.V., CABRERA, J.A., CASTILLO, L. Y ROJO, J. 2007. Varadero ante el cambio Global Medioambiental. En: Cambios Globales en el Ambiente y Desarrollo Sustentable en América Latina. IAI. INE. UNEP. Brasil. 33-60.
MOYA B. 2003. The climate as natural resource for the integrated handling of the tourism in Varadero. Thesis of grade of Master in Sciences. University of Matanzas. 85 pp.
MOYA B, ELIZALDE H, HERNANDEZ A. Change and Variability of the climate. Matanzas. Nov/ 2006.
PéREZ R, VEGA R, LIMIA M. Probability of affectations for maximum winds of hurricanes in Cuba. Official Report. La Habana. Junio 2007.
WEISSTEIN, E. W. «Poisson Distribution.» From MathWorld--A Wolfram Web Resource. http://mathworld.wolfram.com/PoissonDistribution.html accessed august 2009.
PNUMA, 2005. Program of United Nations for the Development.VEGA R, LIMIA M. E. Regions of Cuba with winds of absolute
maximum speed ditorial Academia, La Habana. 1993WEISSTEIN, E. W. «Fréchet Derivative.» From MathWorld--A
Wolfram Web Resource. http://mathworld.wolfram.com/FrechetDerivative.html accessed august 2009.
WEISSTEIN, E. W. «Poisson Distribution.» From MathWorld--A Wolfram Web Resource. http://mathworld.wolfram.com/PoissonDistribution.html accessed august 2009.
NEREIS 3 [Marzo 2011], 45-51, ISSN: 1888-8550
Isotermas de sorción y transición vítrea de la pulpa de borojó (Borojoa patinoi cuatr.)
Fecha de recepción y aceptación: 15 de noviembre de 2010, 10 de diciembre de 2010
L. H. Mosquera†, G. Moraga‡, N. Martínez‡ y M.ª A. chiralt‡
† Grupo de Valoración de la Biodiversidad Universidad Tecnológica del Chocó (Colombia), [email protected].‡ Departamento de Tecnología de Alimentos. Universidad Politécnica de Valencia (España), 46022. [email protected].
Nereis. Revista Iberoamericana Interdisciplinar de Métodos, Modelización y Simulación
3 45-51 Universidad Católica de Valencia “San Vicente Mártir”
Valencia (España) ISSN 1888-8550
ABSTrAcT
The physicochemical properties of fresh borojó pulp and lyophilised pulp humidified to different moisture levels were evaluated. Humidity (xw), soluble solids, ºBrix, carbohydrates (major sugars, pectin (TP) and fibre (TF)), pH, titratable acidity (Ac) and total polyphenols were determined. The sorption isotherms were also determined and appropriately fitted to the BET, GAB, Henderson and Caurie models. The phase transitions were determined by differential scanning calorimetry (DSC). The glass transition temperature (Tg) for the samples as a function of humidity, the Tg of the maximally cryoconcentrated solution (Tg’ = -46.9 °C) and the temperature of formation of the last ice crystal in the product (Tm’ = -30.1) were identified. The variation of Tg as a function of xw was fitted to the Gordon and Taylor model, which enabled us to obtain the amount of unfreezable water in the sample (Wg’=0.177 g water/g sample). The combined analysis of the data enabled us to show that ambient storage conditions (20 °C and relative humidity of between 35% and 65%) do not ensure that the vitreous state of lyophilised borojó pulp is maintained. Therefore, the addition of high molecular weight substances is recommended.
KEYworDS: borojó, glass transition, sorption isotherms.
rESUMEN
Se han evaluado propiedades fisicoquímicas de la pulpa de borojó fresco y liofilizado, humectado a diferentes niveles de humedad. Se realizaron análisis de humedad (xw), sólidos solubles, ºBrix, carbohidratos (azúcares mayoritarios, pectina (TP) y fibra (TF)), pH, acidez valorable (Ac) y polifenoles totales. Igualmente, se analizaron las isotermas de sorción y se ajustaron adecuadamente a los modelos de BET, GAB, Henderson y Caurie. Las transiciones de fase fueron determinadas mediante calorimetría diferencial de barrido (DSC). Se identificó la temperatura de transición vítrea (Tg) de las muestras en función de la humedad, la Tg de la disolución máximamente crioconcentrada (Tg’ = –46,9 ºC) y la temperatura de formación del último cristal de hielo en el producto (Tm’ = –30,1). La variación de Tg en función de la xw se ajustó al modelo de Gordon y Taylor, lo que permitió obtener la cantidad de agua no congelable de la muestra (Wg’ = 0,177 g agua/g muestra). El análisis conjunto de los datos permitió identificar qué condiciones de almacenamiento ambiente (20 ºC y humedad relativa entre un 35 y un 65%) no aseguran el estado vítreo del borojó liofilizado. Por este motivo, se recomienda la adición de algunas sustancias de alto peso molecular.
PALABrAS cLAVE: borojó, transición vítrea, isotermas de sorción.
INTroDUccIóN
El borojó es una fruta selvática de unos 7 a 12 centímetros de diámetro, de color verde, que cambia a color chocolate cuando madura. La pulpa es también de color chocolate, ácida y bastante densa. Su fruto pesa entre 740 y 1.000 gramos y el 88% de su masa corresponde a la pulpa. Este fruto perteneciente a la familia Rubiaceae, es nativo de América tropical y existen dos especies: Borojoa patinoi Cuatrec. y Borojoa sorbilis Cuatrec., ambas arbóreas y restringidas al Chocó geográfico. En particular, las especies del género Borojoa están estrechamente relacionadas con seis de las especies del género Alibertia (Persson, 1999).
El fruto del borojó se utiliza comúnmente en Colombia. Sin embargo, se ha dado a conocer en otros países debido a su alta capacidad energética y nutricional relacionada con su contenido de fructosa y glucosa, cantidades importantes de proteínas, fósforo y vitaminas B y C, así como aportes de calcio y hierro, además de las supuestas propiedades afrodisíacas atribuidas por los grupos indígenas y negros de la región (quienes lo utilizan como alimento y medicina, para embalsamar cadáveres y preparar brebajes que aumentan la potencia sexual). No obstante, hasta el momento, son pocos los trabajos científicos sobre su composición para fundamentar esta información: Arango & Quijano, 1986; Ríos et al. 2005; Mosquera, Ríos & Zapata, 2006. Existen en el país algunas pequeñas empresas

NEREIS 3 [Marzo 2011], 45-51, ISSN: 1888-8550
L. H. Mosquera et al.46
transformadoras que comercializan pulpa de la fruta y otros elaborados como jaleas, mermeladas y jugos. Así mismo, empresas como Ecoflora, en colaboración con la Universidad Tecnológica del Chocó, han incursionado en la producción de un pulverizado mediante secado por atomización (una técnica eficaz y barata en la producción de pulverizados), abriendo nuevas alternativas para su comercialización en mercados internacionales teniendo en cuenta las dificultades para el manejo de la fruta, el transporte en relación con el peso de carga, el embalaje y la apariencia del producto.
A pesar de que una característica atractiva del secado en spray es que el daño por efecto del calor causado al producto es pequeño (Patel & Chen, 2005), es difícil producir pulverizados de azúcares y alimentos ricos en ácidos como la miel o los jugos de fruta, debido a la dureza de su forma natural (Adhikaria et al., 2005). En este sentido, el desarrollo de estos productos deshidratados requiere conocer algunas propiedades como las isotermas de sorción y transiciones de fase, relevantes para definir tanto las condiciones del proceso tecnológico de secado como la calidad y estabilidad del producto final.
Un método apropiado y ampliamente utilizado para este fin es la calorimetría diferencial de barrido (DSC), que aporta información valiosa sobre los cambios que ocurren en el sistema, fundamentalmente la capacidad calorífica relativa de éste en función de la temperatura (Conejero et al., 2000). El control de las propiedades fundentes de las grasas comestibles (cacao) o de los fenómenos de cristalización en polvos deshidratados (leche en polvo), la prevención del apelmazamiento de polvos, el control de la textura (relacionada con la cantidad de hielo) de un helado y la adecuación de la formulación de productos amiláceos son algunos ejemplos donde la aplicación de los conocimientos sobre transiciones de fase han redundado en importantes mejoras tecnológicas (Martínez-Navarrete et al., 2000).
La movilidad molecular en estado vítreo es baja, debido a la alta viscosidad de la matriz (sobre 1012 Pas), por lo que no se espera que tengan lugar reacciones de difusión controladas (Levine & Slade, 1986). Así, la Tg (temperatura de transición vítrea) puede tomarse como parámetro de referencia para caracterizar propiedades, calidad, estabilidad y seguridad de sistemas de alimentos (Roos, 1995). Recientemente, problemas de endurecimiento y aglomeración en productos pulverizados se han relacionado con sus bajos valores de Tg (Collares, Finzer & Kieckbusch, 2004, citado por Silva et al., 2006).
Aun cuando la actividad del agua ha sido una herramienta importante para predecir el estado físico y el agua disponible en alimentos sólidos (Roos, 1995), ha mostrado ser inadecuada para la evaluación de la vida útil de algunos productos (Delgado & Sun, 2002). En este sentido, la Tg se presenta como una poderosa herramienta para entender y cuantificar la movilidad del agua en alimentos, así como también para controlar la vida útil de estos productos (Ahmed & Ramaswany, 2006). La actividad del agua proporciona una medida relacionada con la disponibilidad de agua en los alimentos, mientras que la temperatura de transición vítrea puede considerarse como la medida más importante para caracterizar el estado amorfo de los alimentos (Martínez-Navarrete et al., 2000). Cuando la transición vítrea de un sistema se asume como una función de la composición, el cambio en los valores de la temperatura de transición indica cambios definitivos en la red vítrea (Dayanand & Salagram, 2004). Cualquier producto alimenticio a temperaturas por debajo de su Tg es estable y no habrá ningún cambio significativo en la calidad fisicoquímica o biológica (Ahmed & Ramaswany, 2006). En el presente trabajo se ha estudiado la composición del fruto de borojó en estado natural, además de las isotermas de sorción y transiciones de fase de la pulpa liofilizada como medidas para estimar las variables críticas de estabilidad de sus
componentes, de manera que puedan ser útiles en la optimización del proceso de secado por aspersión de la fruta.
MATErIALES Y MéToDoS
La pulpa de borojó utilizada proviene de frutos cultivados en el Centro de Investigación y Producción Agroforestal de la Universidad Tecnológica del Chocó, CIPAF (Colombia). Dicho centro está ubicado a 05º 30´ de latitud norte y 76º 33´ de longitud oeste, a 94 m sobre el nivel del mar, con una temperatura promedio anual de 29 ºC, 7020 mm de precipitación y una humedad relativa del 86%. Corresponde a zona de bosque húmedo tropical (bh-T) de acuerdo con la clasificación de Holdridge (Bonilla y Olave, 2003). Los frutos fueron empaquetados al vacío y transportados al laboratorio de Fisicoquímica del Departamento de Tecnología de Alimentos en la Universidad Politécnica de Valencia, España, en donde se procedió a retirar la piel y las semillas para obtener la pulpa. La mitad de la pulpa obtenida se depositó en bandejas de aluminio e inmediatamente se congeló a –18 ºC. Pasadas 24 horas fue liofilizada a –46,2 ºC y 6 x 10⁻² mb de presión (Lioalfa 6-809, Telstar) durante 24 horas. Se trabajó con tres lotes de fruta recolectados en épocas diferentes: M1 (febrero de 2006), M2 (septiembre de 2006) y M3 (mayo de 2007). De los tres lotes, se realizaron análisis de humedad en estufa de vacío a 60 ºC (Vaciotem, J. P. Selecta), ºBrix con refractómetro Atago 3T, actividad del agua (Decagon Aqualab, Series 3), densidad (utilizando un picnómetro de 25 ml y desaireando), proteínas según el método de Kenjdahjl empleando una unidad de digestión B-426, Buchi (F = 6,24), grasas (Soxtec 2055-Foss), cenizas (Mufla Select-Horn, J. P. Selecta), pectinas siguiendo lo descrito por Yu, Reitmeier & Love, 1996; fibra total según AOAC oficial Method 985.29.
Los azúcares se analizaron por cromatografía de intercambio iónico (cromatógrafo Waters 600E Sysmen controller, detector waters 464 pulsed electrochemical detector, columna Hamilton RCx-10, eluyente NaOH 0,15M temperatura 23-24 ºC), previa dilución y centrifugación de la muestra, inyectando el sobrenadante obtenido. Igualmente se midieron polifenoles totales, según el método descrito por Pastrana-Bonilla et al., 2003, pH (pH meter Crison M-40) y acidez valorable (Moraga, Martínez & Chiralt, 2002) en la fruta natural. Para la obtención de las isotermas y el análisis de la Tg, el producto liofilizado del lote M1 (aproximadamente 2 g) se acondicionó a 20 ºC y diferentes ambientes con distintas humedades relativas conseguidos a partir de disoluciones saturadas de sales de actividad del agua conocida, desde 0,230 hasta 0,840. Se realizó un control de la evolución del peso de las muestras y, una vez alcanzado el equilibrio (peso constante) al cabo de unas 4 semanas, se tomó una porción de cada muestra en minicápsulas de aluminio para determinar las transiciones de fase mediante calorimetría diferencial de barrido (DSC 220CU SSC/5200, Seiko Instruments). Se empleó nitrógeno líquido para enfriar las muestras y se aplicó un barrido de calentamiento a 5 ºC/min en un intervalo de temperaturas comprendido entre –100 y 90 ºC, dependiendo de la humedad. Se utilizó una cápsula vacía como referencia. La humedad de cada muestra fue calculada a partir de la humedad del producto liofilizado y la diferencia de peso registrada en el momento del equilibrio. La pulpa natural fue analizada también por DSC para la identificación de la temperatura de transición vítrea de la matriz máximamente crioconcentrada (Tg`). Para ello la muestra se enfrió desde 25 hasta –50 ºC a 2 ºC/min, se mantuvo a –50 ºC durante 30 min y se enfrió hasta –100 ºC a 5 ºC/min. El calentamiento se efectuó a 5 ºC/min. Todas las medidas se tomaron por triplicado.

NEREIS 3 [Marzo 2011], 45-51, ISSN: 1888-8550
47Isotermas de sorción y transición vítrea de la pulpa de borojó
rESULTADoS Y DIScUSIóN
composición de la fruta
En la actualidad se ha especulado mucho en torno al contenido nutricional del fruto del borojó. Existen algunos trabajos como los de Aranzales, 1995 y Cannelo, J. A., 2004. Sin embargo, los datos científicos sobre esta fruta están relacionados generalmente con el manejo agronómico y unos pocos (Arango & Quijano, 1986; Ríos et al., 2005; Mosquera, Ríos & Zapata, 2006) tratan sobre su composición nutricional.
La tabla 1 muestra los resultados de los análisis de la humedad y de los ºBrix medidos, así como del contenido en sólidos solubles calculado a partir de estos últimos, para los lotes M1, M2 y M3. Como puede observarse, el borojó presenta un porcentaje de humedad considerable, del orden del 70%, sin embargo un tanto menor que el de otras frutas tropicales como el madroño (Calycophylum) (86%), pero mayor que en el caso del café (Coffea) (40%), géneros pertenecientes a la misma familia.
Los ºBrix fueron alrededor de 27. Las mayores desviaciones estándar observadas para el lote M3 son debidas a que los análisis fueron realizados en 5 piezas de fruta distintas (en cada una de ellas por triplicado), mientras que en los otros casos corresponde a una única pieza de fruta Los valores de actividad del agua de la fruta se presentan entre 0,984 ± 0,001. En cuanto a la densidad, se obtuvieron valores de 1,106 ± 0,001 g/ml. De igual forma fueron analizados parámetros relacionados con la fracción insoluble de la fruta, como proteínas, grasas y cenizas (tabla 1). Estos se presentan como componentes minoritarios en el fruto del borojó. En este trabajo se reporta un valor promedio de los tres lotes estudiados de 1,21% para las proteínas; 0,34% para grasas y 0,62% en el caso de cenizas. En otros trabajos se han publicado valores para estos parámetros del orden de 1,75%, 0,82% y 2,68% (Mosquera, Ríos & Zapata, 2006) y 5,51%, 0,00% y 1,49% respectivamente (Arango & Quijano, 1986). La pectina total analizada en el lote M3 fue de 2,63% y 0,09 (b.s) valores que pueden considerarse importantes si se comparan con valores de pectina total de otras frutas como la fresa, entre 0,53 y 0,66 g/100 g o la manzana, entre 0,77 y 0,844 (Moraga, Martínez-Navarrete
& Chiralt, 2002; Contreras et al., 2005; Contreras et al., 2007). Así mismo, también es una cantidad importante comparada con la analizada en fibras de limón (0,21 ± 0,01 g/100 g fibra seca), naranja (0,26 ± 0,01 g/100 g fibra seca) y manzana (0,013 ± 0,002 g/100 g fibra seca) según Córdoba, Martínez-Navarrete & Chiralt, 2005. La gráfica 1 muestra un ejemplo de los cromatogramas que permitieron identificar azúcares presentes en el borojó (M2). En orden de cantidad estos fueron fructosa, glucosa, sacarosa y rhamnosa, de acuerdo con los picos observados a los tiempos de retención correspondientes a estos carbohidratos. El total de azúcares analizados fue de 0,84 g/100 g de borojó, lo que contrasta bastante con los 27 ºBrix analizados. Es cierto que otros componentes solubles, como la pectina, ácidos, etc., pueden contribuir también a los ºBrix. Sin embargo, también es posible que el método de extracción utilizado no haya permitido la cuantificación total de los azúcares presentes Finalmente, los resultados en cuanto a pH, acidez valorable y polifenoles totales calculados para el borojó natural (M3), son comparados con los de otras frutas de referencia para estos parámetros. Los valores de pH medidos en el borojó son similares a los reportados para uva (3,89 % ± 0,0) (Darias et al., 2002) y naranja (3,62 ± 0,03) (Topuz et al., 2005), lo que no sucede con la acidez (0,53 a (Yun, Ying & Yunfei, 2006) y 0,68 ± 0,02 (Topuz et al., 2005) respectivamente), siendo ésta mucho menor en el caso del borojó.
0 1 2 3 4 5 6 7 8 9 10 11 12 13 14 15 16 17 18 19 20 21 22 23 min
200
400
600
800
1000
1200
1400
1600nA
Cell
rham
nosa
8.184
gluco
sa 41
.994
fructo
sa 60
.871
sacar
osa 2.
831
5
Gráfica 1. Cromatograma realizado para la cuantificación de azúcares en el borojó natural.
Tabla 1. Valor medio de los componentes analizados en el fruto de borojó a partir de los diferentes lotes de muestras (M1, M2 y M3).
ComponentesDensidad g/cm 3 1,1061 (0,001) 1,1059 (0,001) nc ncActividad de agua 0,984 (0,001) 0,979 (0,001) 0,977 (0,001)Humedad (agua/ 100g fruta) 70,23 (0,6) 68,34 (0,4) 70,90 (1,5)ºBrix 27,65 (0,6) 27,37 (0,1) 25,45 (1,6)Sòlidos solubles 26,84 (0,12) 25,75 (0,02) 24,20 (0,02)Proteínas g/100g de fruta 1,71 (0,01) 0,70 (0,01) ncGrasas (g/100g de fruta) 0,14 (0,001) 0,53 (0,08) ncCenizas (g/100g de fruta) 0,63 (0,002) 0,77 (0,1) 0,46 (0,1)Carbohidratos (g/100g de fruta)
Pectinas 2,63 (0,1)Fibras 23,58 (3,8)
Azúcares (g/100g de fruta)Rhamnosa 0,06
Glucosa 0,31Fructosa 0,45
Sacarosa 0,02total azucares 0,85
Polifenoles totales (g/100g de fruta) 0,028 (0,001)pH 3,04 (0,03)Acidez (gAc.Citrico/ 100 g de fruta) 0,17 (0,01)
Lote M2Lote M1 Lote M3

NEREIS 3 [Marzo 2011], 45-51, ISSN: 1888-8550
L. H. Mosquera et al.48
Hay que tener en cuenta que el cálculo de la acidez se ha hecho asumiendo que el ácido mayoritario es el cítrico, lo cual no está comprobado. En cuanto a los polifenoles totales, los valores se asemejan a los reportados para la uva, aunque son mucho menores que los de la naranja (0,024 ± 0,008 (Pastrana-Bonilla et al., 2003) y 0,154 ± 0,10 (Gorinstein et al., 2001) respectivamente).
Isoterma de sorción
La tabla 2 muestra los datos de sorción medidos para el borojó liofilizado equilibrado a diferentes humedades y a 20 ºC. Estos datos experimentales se ajustaron a los modelos de BET, GAB, Henderson y Caurie, obteniéndose los parámetros de cada uno de ellos, que se muestran en la tabla 3. Todos los puntos experimentales fueron considerados para la modelización por BET. Como puede observarse, se trata de una isoterma de tipo III, según la clasificación de Brunauer et al. (1938), comportamiento típico de productos ricos en compuestos de bajo peso molecular como azúcares. Esto lo confirman los valores del parámetro C obtenidos por BET y GAB, inferiores a 2 en ambos casos. we. La gráfica 2 muestra los puntos experimentales y predichos por los diferentes modelos. El modelo de GAB fue el que mejor reprodujo el comportamiento frente a la adsorción de agua según los datos analizados. El de BET fue el peor, lo cual es lógico ya que, a la vista de la forma de la isoterma, los fenómenos de disolución empiezan
a ser importantes a partir de aw 0,600 y, por lo tanto, el modelo de BET ya no es adecuado.
Análisis de la transición vítrea
La figura 1A muestra los termogramas obtenidos para las muestras liofilizadas equilibradas a diferente aw a partir de los cuales se determinaron, con el software del equipo, la temperatura de comienzo de la transición vítrea (T1), el punto medio (Tg) y el punto final (T2), así como la variación de calor específico asociado a la transición (∆Cp). Estos valores se presentan en la tabla 2. En el análisis de calorimetría realizado se observa que para el caso de la muestra equilibrada a aw 0,850 presenta un endodermo (∆Hf = 7,39 mJ/mg) en un intervalo de temperaturas correspondiente a la fusión del hielo. Esto supone que al menos parte del agua de esta muestra se congeló durante el enfriamiento. En este sentido, la Tg analizada no corresponde a la muestra con la humedad asignada, sino a una parcialmente crioconcentrada y, por lo tanto, no debe ser considerada. Ninguna de las otras muestras equilibradas presentó agua congelable. Respecto al borojó fresco, el termograma obtenido (fig. 1b) permitió identificar la Tg’ de la muestra (–46,9 ºC) y su Tm’ (–30,1 ºC), así como la variación de calor específico asociado a la transición (∆Cp 0,1861 mJ/ºC.mg) y el endodermo de fusión del agua (∆Hf = 212,512mJ/mg).
Tabla 2. Valores de las variables de sorción: Actividad del agua (aw), humedad expresada como g agua/g sólidos secos (we(b.s.)) y humedad expresada como g agua/g muestra (we (b.h.) y temperatura de transición vítrea (Tg) obtenidos para el borojó liofilizado equilibrado a diferentes
humedades.
aw 0,230 0,330 0,430 0,520 0,680 0,755 0,850we(b.s.) 0,021 (0,002) 0,032 (0,002) 0,054 (0,002) 0,078 (0,001) 0,144 (0,002) 0,195 (0,001) 0,310 (0,003)we(b.h.) 0,021 (0,002) 0,031 (0,002) 0,052 (0,001) 0,072 (0,001) 0,126 (0,001) 0,163 (0,002) 0,236 (0,001)Tg (°C) 33,6 (1,8) 26,3 (1,4) 4,0 (1,6) -5,35 (0,8) -27,8 (3,7) -41,9 (1,6)T1 (°C) 27,6 (5,2) 20,5 (6,7) -2,4 (2,0) -8,4 (5,0) -35,25 (3,4) -48,6 (3,5)T2 (°C) 41,4 (3,5) 32,175 (2,4) 8,8 (2,6) -1,6 (2,0) -16,4 (10,5) -35,98 (2,0)Cp (mJ) 0,3832 (0,1) 0,2602 (0,1) 0,3742 (0,1) 0,6342 (0,3) 0,4762 (0,07) 0,3127 (0,07)
NaCl KCl CH 3 COOK MgCl 2 K 2 CO 3 Mg(NO 3 ) 2 CuCl 2
Tabla 3. Modelos ajustados a los datos de sorción y parámetros obtenidos de los ajustes.
1 2 3 4 5 6 7 8 9 10 11 12
BET GAB Ecuación
Parámetros Wo (g agua/g sólidos secos)=0,0575
C = 1,3915 Wo (g agua/g sólidos secos)= 0,1070
C= 0,6950 K= 0,8980
R2 0,435 0,976 HENDERSON CAURIE Ecuación ( )n
f
aw1
10)1log((01,0 we
−−
= ( )
∗−⋅= Wsraw 5,4
1)ln(we
Parámetros n = 0,7262 f = -1,1525
Ws= 0,0463 r= 70,1054
R2 0,9954 0,9969

NEREIS 3 [Marzo 2011], 45-51, ISSN: 1888-8550
49Isotermas de sorción y transición vítrea de la pulpa de borojó
Isoterma de adsorción (20ºC)
0,000
0,050
0,100
0,150
0,200
0,250
0,300
0,350
0,400
0,000 0,200 0,400 0,600 0,800 1,000aw
we (b.s.)
EXPERIMENTALBETGABHENDERSONCAURIE
Gráfica 2. Isoterma de adsorción del borojó liofilizado a 20 ºC. Puntos experimentales y modelos de GAB, BET, Henderson y
Caurie ajustados.
La variación de la Tg con la humedad pudo ser modelizada por la ecuación de Gordon y Taylor (1952) (ec. 1). Los valores de los parámetros de este modelo, k (5,0886) y Tgs (Tg de los sólidos anhidros) (49,375), se obtuvieron del ajuste de los datos Tg – xw experimentales a la ecuación del modelo linealizada (ec. 2). R2 = 0,973.
)xk(x1
135xk)Tg)x1((Tgww
wsw
Ec. 1
w
ws x1
Tg135xkTgTg
Ec. 2
La gráfica 3 muestra la evolución de los valores de Tg en función del contenido en humedad para cada muestra (puntos experimentales y el modelo ajustado). Puede observarse que el incremento de la temperatura de transición vítrea en las muestras estudiadas es inverso al contenido de humedad, de esta forma, cuanto menor es la cantidad de agua presente en la fruta mayor es su Tg. Componentes como la pectina y otros solutos de alto peso molecular presentes en el borojó pueden contribuir a la ocurrencia de altos valores de Tg. El modelo ajustado permite calcular la cantidad de agua no congelable del borojó (Wg’), a partir de su Tg’. Este valor fue de 0,177 g agua/g muestra. Por otra parte, la bibliografía describe una relación lineal entre la Tg y la actividad del agua, especialmente a valores intermedios de aw (Roos y Karel, 1991; Roos, 1993), aunque si se considera todo el intervalo, la relación es sigmoidal. A partir de esta linealidad es posible predecir el efecto de la humedad relativa del ambiente sobre la Tg de muestras cuando éstas alcanzan el equilibrio. En este caso, la relación obtenida es la descrita por la ecuación 3:
Tg = –145,94aw + 64,90 Ec. 3. (R2 = 0,986)
La gráfica 4 muestra, de forma conjunta, la representación de los datos experimentales Tg – xw – aw. Así mismo, las curvas corresponden a las predicciones de los modelos de GAB y Gordon y Taylor. Según podemos observar, a temperatura ambiente (20 ºC), la actividad del agua crítica (CWA) para el paso de vítreo a gomoso es 0,347 y, por lo tanto, la humedad relativa máxima del ambiente que aseguraría el estado vítreo del producto durante todo el almacenamiento es 34,7%.
El correspondiente contenido de humedad crítica (CWC) es de 3,59 g agua/100 g de producto. Este valor de humedad crítico es del orden del de los productos secados por atomización, por lo que pueden presentar problemas de estabilidad durante su almacenamiento a temperatura ambiente.
En este sentido, para el desarrollo de un producto pulverizado a partir de pulpa de borojó estable, puede evaluarse la posibilidad de agregar sustancias de alto peso molecular que contribuyan a incrementar los valores de Tg, tales como la maltodextrina, ampliamente utilizada en la industria de alimentos. Se ha comprobado que la adición de maltodextrina en frutas tropicales liofilizadas disminuye la naturaleza higroscópica al aumentar su valor de Tg (Silva, Sobral & Kieckbusch, 2006). El aumento de la Tg supone un aumento de CWA y CWC.
-6000
-5000
-4000
-3000
-2000
-1000
0
1000
-100 -50 0 50 100T (ºC)
DSC
(uW
)
0.1 mW
Endo
DSC
aw= 0,230
aw= 0,,320 aw= 0,410
aw= 0,500
aw= 0,675
aw= 0,755
aw= 0,840
-6000
-5000
-4000
-3000
-2000
-80 -70 -60 -50 -40 -30 -20 -10 0 10 20T (ºC)
DS
C (u
W)
Tg’ Tm’
∆H (mJ/mg)
Endo
DSC
A B
Figura 1. Termogramas obtenidos a partir de DSC, del borojó liofilizado (A); muestras equilibradas a diferentes actividades de agua y natural (B).

NEREIS 3 [Marzo 2011], 45-51, ISSN: 1888-8550
L. H. Mosquera et al.50
-80
-60
-40
-20
0
20
40
60
0 0,2 0,4 0,6 0,8
aw
Tg
0,00
0,05
0,10
0,15
0,20
0,25
0,30
xw
Gráfica 4. Relación de la temperatura de transición vítrea-actividad del agua-humedad del borojó construida a partir de los modelos de
GAB y Gordon y Taylor.
coNcLUSIoNES
El análisis de composición realizado al fruto del borojó pone de manifiesto un contenido en agua menor que el de otras frutas y mayor que en sólidos solubles. Así mismo, destaca su contenido en fibra, lo que permite suponer que es una buena fuente de carbohidratos como azúcares, pectinas y fibras. Los datos de sorción fueron adecuadamente modelizados por GAB en todo el intervalo de humedad y actividad del agua considerado en el estudio. La calorimetría diferencial de barrido mostró ser un método adecuado para la determinación de las transiciones de fase en el borojó liofilizado, que pudieron modelizarse aplicando la ecuación propuesta por Gordon y Taylor. La combinación de los datos Tg-xw-aw permitió establecer que a una temperatura ambiente de 20 ºC el contenido de humedad crítico para la transición vítrea es de 3,5% y la correspondiente actividad del agua crítica 0,347. En este sentido, el almacenamiento del producto en estas condiciones requiere un adecuado envasado que impida su humectación, lo cual supondría el paso al estado gomoso, acelerando los fenómenos de apelmazamiento del polvo y otras reacciones de pérdida de calidad. En este sentido, valdría la pena evaluar la posibilidad de adicionar sustancias de alto peso molecular que aumenten la Tg del producto, con el fin de optimizar las condiciones de almacenamiento.
LITErATUrA cITADA
ADHIKARIA, B., Howesb, T., Lecomtea, D. & Bhandaric, B.R. 2005. A glass transition temperature approach for the prediction of the surface stickiness of a drying droplet during spray drying. Powder Technology 149 168–179.
AHMED. J., Ramaswany, H.S. ( 2006) Physico-chemical properties of commercial date pastes (Phoenix dactylifera). Journal of Food Engineering. 76, 348 - 352.
ARANGO, A.G. J. & Quijano, T.J. 1986. Estudio de los frutos de Boroja Patinoi(CUAT).IN: Revista Latinoamericana de Química. 17/3-4 pag. 167 – 169.
ARANZALES, J.A. 1995. El Borojó. Laboratorio de Bioquímica,Universidad del Valle.1-9 pag.
BIZOT, H. 1983. Using the G.A.B. model to construct sorption isotherms. Ed. Jowitt, R.; Escher, F.; Hallstrom, B.; Meffert, H.F.; Spiess, W.E.L. y Voss, G.. Applied Science Publisher, London, pp. 43-54.
BONILLA, F.J.A., Olave, M.E., & Ríos, H.A., 2003. Producción y valoración de Alimento Balanceado Regional para Pollos de Engorde. Trabajo de Grado para optar al titulo de Ingeniero Agroforestal en la Universidad Tecnológica del Chocó “Diego Luis Córdoba” N° pag. 56 -57.
BRUNAUER, S.; Emmett, P.H. y Teller, E., (1938). Adsorption of gases in multimolecular layers. Journal of the American Chemical Society, 60: 309-319
CANNELO, J.A. 2004. Borojó, Energía natural In: Boletín Alimentación Sana. URL:www.alimentacion-sana.com.ar
COLLARES, F.P., Finzer, J. R. D., & Kieckbusch, T. G. (2004) Glass transition control of the detachment of food pastes dried over glass plates. Journal of Food Engineering 61, 262 – 267. citado por Silva, M.A., Saboral, P.J.A., Kieckbusch, T.G. ( 2006). Satate diagrams of freeze-dried camu-camu (Myrciaria dubia (HBK) Mc Vaugh) pulp with and without maltodextrin addition. Journal of Food Engineering. 77, 426 – 432.
CONEJERO, F. L., López M. O. & Sadqi, M. 2000. “Estudio Termodinámico de los Estados Parcialmente Plegados del Dominio SH3 de Espectrina. Memoria para aspirar al grado de Doctor en Ciencias Químicas por Mourad Sadqi, Departamento de Química Física.Universidad de Granada.
CONTRERAS, C., M.E. Martín., N. Martínez-Navarrete., A. Chiralt. 2005. Effect of vacuum impregnation and microwave application on structuralchanges which occurred during air-drying of apple. LWT Food Science and Technology.38. 471–477
CONTRERAS, C., M. E. Martın-Esparza., N. Martínez-Navarrete., A. Chiralt. (2006) Influence of osmotic pre-treatment and microwave application on properties of air dried strawberry related to structural changes. European Food Research and Technology, 224, 499-504.
CÓRDOBA, S.A., Martínez-Navarrete, N., Chiralt., B.A..2005. caracterización de propiedades relacionadas con la textura de suspensiones de fibras alimentarias. Tesis Doctoral. Departamento de Tecnología de Alimentos. Universidad Politécnica de Valencia.
DARIAS, M. J., Martin, G.F., Pomar, G.M., Hontoria, F.M., Díaz, D.E. 2002. Potencial enológico de clones de variedades de uva tradicionalmente cultivadas en Tenerife (España) Influencia de la Virosis de la Vid. En: revista Alimentaria. No. 339, pag.85 - 88 ISSN: 03005755.
DAYANAND, C. & Salagram M. 2004. Thermal (DSC) characterization of xPbO–(1−x)P2O5 glass system. In: Ceramics International 30 () 1731–1735.
DELGADO, A. E., & Sun, D.W. (2002) Description isotherms and glass transition temperature for chicken meat. Journal of Food Engineering, 55, 1 – 8.
GORINSTEIN, S., Martín-Belloso, O. Park, Y-S., Haruenkit, R., Lojek, A., Milan C, Caspi, A., Libman, I., Trakhtenberg, S. 2001. Comparison of some biochemical characteristics of different citrus fruits. In: Food Chemistry (74 ) 309–315.
KAMLESH, C. P. & xiao, D. C. 2005.Prediction of Spray-Dried Product Quality Using Two Simple Drying Kinetics Models.Journal of Food Process Engineering 28 567–594.
LEVINE, H., & Slade, L. (1986) A polymer physico-chemical approach to the study of commercial starch hydrolysis products (SHPs). Carbohydrate polymers, 6 213 – 244.

NEREIS 3 [Marzo 2011], 45-51, ISSN: 1888-8550
51Isotermas de sorción y transición vítrea de la pulpa de borojó
MARTíNEZ, N. N., Andrés, G. A.M., Chiralt, B.A., Maupoey, P.F. 2000. Termodinámica y Cinética de Sistemas Alimento Entorno. Ed. Servicio de Publicaciones Universidad Politécnica de Valencia. I.S.B.N.: 84-7721-703-3.
MORAGA, B.G., Martínez-Navarrete, N., Chiralt, B. A. 2002. Aspectos Fisicoquímicos relacionados con la Crioprotección de Fresa y Kiwi. Tesis Doctoral. Departamento de Tecnología de Alimentos. Universidad Politécnica de Valencia.
MOSQUERA, M. L.H., Ríos, H. A. & Zapata, P. S. 2006. Obtención de una materia prima con valor agregado mediante secado por aspersión a partir del fruto fresco de borojó (Borojoa patinoi Cuatr.). En: Revista Institucional Universidad Tecnológica Del Chocó, v. 11, n. 23, p. 5-10.
PASTRANA-BONILLA, E., Akoh, C.C., Sellappan, S., Krewer, G. 2003. Phenolic content and antioxidant capacity of muscadine grapes. In: Journal of Agricultural and Food Chemestry. 51, 5497 – 5503.
PERSSON, C. 2000: “Phylogeny of the Neotropical Alibertia group (Rubiaceae), with emphasis on the genus Alibertia, inferred from ITS and 5S ribosomal DNA sequences”; American Journal of Botany 87:1018-1028.
RíOS, H. A., Cook, D. N., Mosquera, M. L. H. Zapata, P. S. 2005. Chalenge and Potential of Developing a New Natural Ingredient: The Example of Borojoa patinoi from the Chocó rainforest. In: Personal Care Ingredients Europe, París. PCIE Conference Procedings. Ukrania: STEP Exhibitions, p. 97-97.
ROOS, Y. & Karel. M. (1991). Plasticizing effect of water on thermal behavior and crystallization of amorphous food models. Journal of Food Science, 56: 38-43.
ROOS, Y.H. (1993). Water activity and physical state effects on amorphous food stability. Journal of Food Processing and Preservation, 16: 433-447.
ROOS, Y.H. (1995) Phase transitions in Foods (1st ed.). San Diego: Academic Press Inc.
SILVA, M.A., Saboral, P.J.A., Kieckbusch, T.G. ( 2006). Satate diagrams of freeze-dried camu-camu (Myrciaria dubia (HBK) Mc Vaugh) pulp with and without maltodextrin addition. Journal of Food Engineering. 77, 426 – 432.
TOPUZ A., Topakci, M., Canakci, M., Akinci, I., Ozdemir. F. 2005. Physical and nutritional properties of four orange varieties. In: Journal of Food Engineering 66 519–523.
VAN DEN BERG, C. y Bruin, S. 1981. Water activity and its estimation in food systems: Theoretical aspects. En Rockland, L.B.; Stewart, G.T. (Eds): Water Activity: Influences on food quality. Academic Press, London and New York. pp. 1-43.
YU, L., Reitmeier, C.A. & Love M. H. 1996. Starwberry Texture and Pectin Content as Affected by Electron Beam Irradiation. In: Jouernal of Food Science. Volume 61, No. 4. 844 pag.
YUN, D., Ying, W. & Yunfei, L. 2006. Physiological responses and quality attributes of ‘Kyoho’ grapes to controlled atmosphere storage. In: LWT 39. p. 584–590.The list of references to journal articles and books, found in the Journal, should be in the following basic format.


NEREIS 3 [Marzo 2011], 53-59, ISSN: 1888-8550
Análisis de la fórmula para la calificación de pruebas tipo test multi-respuesta
Fecha de recepción y aceptación: 19 de octubre de 2010, 15 de noviembre de 2010
J. L. González-Santander † y G. Martín†
† Departamento de Ciencias Experimentales y Matemáticas. Facultad de Ciencias Experimentales. Universidad Católica de Valencia, Valencia. [email protected] y [email protected]
Nereis. Revista Iberoamericana Interdisciplinar de Métodos, Modelización y Simulación
3 53-59 Universidad Católica de Valencia “San Vicente Mártir”
Valencia (España) ISSN 1888-8550
ABSTrAcT
We evaluate the approach which usually justifies how much has to be subtracted for every incorrect answer in a multiple choice test. We have developed a calculation which takes into account the possibility to blank answer some questions, which is not possible with the usual approach. We show that when the number of questions tends to infinity, both approaches are asymptotically equivalent.
KEYworDS: multiple choice tests, central limit theorem.
rESUMEN
Se trata de evaluar la aproximación del enfoque que habitualmente se utiliza para justificar cuánto ha de restar cada respuesta incorrecta en la calificación de un examen tipo test multi-respuesta. Se ha desarrollado un cálculo que tiene en cuenta la posibilidad de contestar preguntas en blanco, lo cual no es posible con el enfoque habitual. Se comprueba que cuando el número de preguntas tiende a infinito, ambos enfoques son asintóticamente equivalentes.
PALABrAS cLAVE: test de elección múltiple, teorema del límite central.
INTroDUccIóN
Es bien conocido que para calificar un examen tipo test no sólo deben contabilizarse las preguntas acertadas, sino también las falladas. Si no se descontara algo de puntuación por pregunta fallada, tendría sentido contestar al azar las preguntas cuya respuesta se desconoce, pues ello no supondría empeorar la nota, y en consecuencia, el alumno podría obtener una sobrenota que se debería al azar y no a sus conocimientos. En este trabajo se pretenden analizar las probabilidades de las distintas calificaciones que se pueden obtener en un examen tipo test multi-respuesta, en el supuesto de que se contesten las preguntas al azar.
MoDELo SIMPLIFIcADo
Esperanza y varianza en un examen aleatorio sin preguntas en blanco
Supongamos que tenemos un examen tipo test con N preguntas, y n opciones de respuesta por pregunta (n ≠ 1). Sea ci la calificación
de la i-ésima pregunta, siendo { , ,..., }i N∈ 1 2 . Supongamos que cada pregunta acertada contabiliza 1 punto y cada pregunta fallada –1/α puntos. Es decir,
si acierta.
si falla.ica
1=
−1
¿Qué valor ha de tener α para eliminar la sobrenota que se puede obtener respondiendo al azar? Si el alumno respondiera al azar todas las preguntas, la calificación esperable debería ser un cero. Si consideramos ci como una variable aleatoria discreta, con espacio muestral E = {1, –1/α}, debería tener la siguiente función de probabilidad,
( )1
1 si 1
1 1 sii
ii
=n c =
p cn c = a−−
.
. (1)
Entonces, el valor esperado de la calificación en una pregunta sería,
( )E .inc
n n na a1 −1 1 1 −1 = 1⋅ + 1− = 1−
(2)
La calificación C para un examen sería la suma de las calificaciones obtenidas en todas las preguntas, proporcionada a la puntuación máxima del examen, que llamaremos Cmax. Es decir,
max .i
N
i=
CC = c
N 1∑ (3)
A partir de (3), el valor esperado para la calificación de un examen sería entonces,
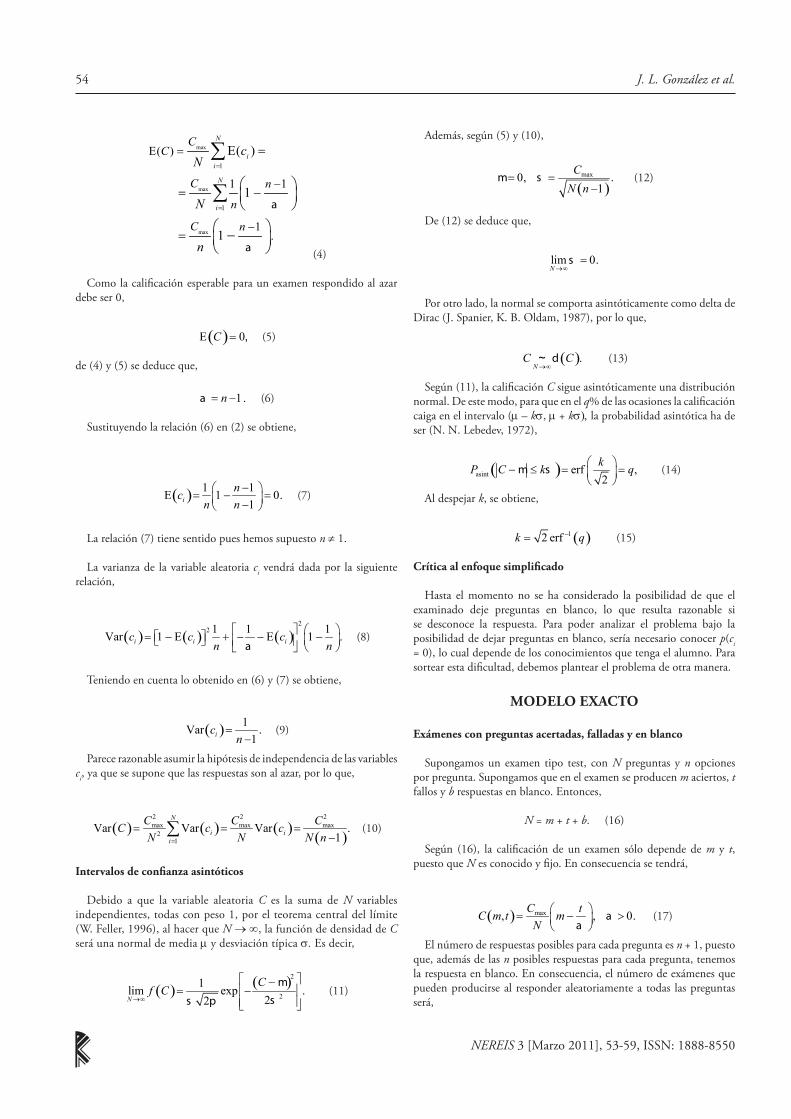
NEREIS 3 [Marzo 2011], 53-59, ISSN: 1888-8550
J. L. González et al.54
max
max
max
E( )
.
E( )=1
=1
=
1 − 1
− 1
=
= 1−
= 1
−
∑
∑
N
ii
N
i
CC
C n
n
C n
cN
N
n
a
a (4)
Como la calificación esperable para un examen respondido al azar debe ser 0,
( )E C = 0, (5)
de (4) y (5) se deduce que,
.na = −1 (6)
Sustituyendo la relación (6) en (2) se obtiene,
( )E .inc
n n1 −1 = 1− = 0 −1
(7)
La relación (7) tiene sentido pues hemos supuesto n ≠ 1.
La varianza de la variable aleatoria ci vendrá dada por la siguiente relación,
( ) ( ) ( )Var E E .i i ic c cn na
22 1 1 1 = 1− + − − 1−
(8)
Teniendo en cuenta lo obtenido en (6) y (7) se obtiene,
( )Var .icn
1=
−1 (9)
Parece razonable asumir la hipótesis de independencia de las variables ci, ya que se supone que las respuestas son al azar, por lo que,
( ) ( ) ( ) ( )max max maxVar Var Var .
N
i ii
C C CC c cN N N n
2 2 2
2=1
= = =−1∑ (10)
Intervalos de confianza asintóticos
Debido a que la variable aleatoria C es la suma de N variables independientes, todas con peso 1, por el teorema central del límite (W. Feller, 1996), al hacer que N → ∞, la función de densidad de C será una normal de media µ y desviación típica σ. Es decir,
( ) ( )lim exp .N
Cf C
m
ss p
2
2→∞
−1= −
22 (11)
Además, según (5) y (10),
( )max, .C
N nm s= 0 =
−1 (12)
De (12) se deduce que,
lim .N
s→∞
= 0
Por otro lado, la normal se comporta asintóticamente como delta de Dirac (J. Spanier, K. B. Oldam, 1987), por lo que,
( ).~→∞N
C Cd (13)
Según (11), la calificación C sigue asintóticamente una distribución normal. De este modo, para que en el q% de las ocasiones la calificación caiga en el intervalo (µ – kσ, µ + kσ), la probabilidad asintótica ha de ser (N. N. Lebedev, 1972),
( )asint erf ,kP C k qm s − ≤ = = 2 (14)
Al despejar k, se obtiene,
( )erfk q−1= 2 (15)
crítica al enfoque simplificado
Hasta el momento no se ha considerado la posibilidad de que el examinado deje preguntas en blanco, lo que resulta razonable si se desconoce la respuesta. Para poder analizar el problema bajo la posibilidad de dejar preguntas en blanco, sería necesario conocer p(ci = 0), lo cual depende de los conocimientos que tenga el alumno. Para sortear esta dificultad, debemos plantear el problema de otra manera.
MoDELo EXAcTo
Exámenes con preguntas acertadas, falladas y en blanco
Supongamos un examen tipo test, con N preguntas y n opciones por pregunta. Supongamos que en el examen se producen m aciertos, t fallos y b respuestas en blanco. Entonces,
N = m + t + b. (16)
Según (16), la calificación de un examen sólo depende de m y t, puesto que N es conocido y fijo. En consecuencia se tendrá,
( ) max, , .C tC m t mN
aa
= − > 0
(17)
El número de respuestas posibles para cada pregunta es n + 1, puesto que, además de las n posibles respuestas para cada pregunta, tenemos la respuesta en blanco. En consecuencia, el número de exámenes que pueden producirse al responder aleatoriamente a todas las preguntas será,

NEREIS 3 [Marzo 2011], 53-59, ISSN: 1888-8550
55Análisis de la fórmula para la calificación de pruebas tipo test multi-respuesta
( )VR +1= = +1 NNp nN n (*) (18)
* VR nm representa las variaciones con repetición de m elementos for-
mando grupos de n.
Si Nb es el número de exámenes con b preguntas en blanco, Nm el número de exámenes con m preguntas acertadas y b en blanco, y Nt el número de exámenes con t preguntas incorrectas, entonces el número de exámenes con m aciertos, t fallos y b respuestas en blanco, que llamamos Nb,m,t, será,
( ), , .tb m t b m t
N N bN N N N n
b m−
= ⋅ ⋅ = −1
(19)
Como b está determinada por N, m y t según (16), tendremos,
( ), , ,tb m t
N N mN n
m t−
= −1
(20)
en donde el paso de (19) a (20) se realiza de la siguiente forma, teniendo en cuenta (16),
! ( )!!( )! !( )!
! ( )!!( )! !( )!
! ( )!!( )! ! ( )!
! ( )!!( )! !( )!
.
tN m t
N N b N N bb m b N b m N b m
N N mb N m m N b m
N N mm N m b N b m
N N mm N m t N m tN N mm t
− −
− −= − − −
−=
− − −−
=− − −
−=
− − −
− =
Por tanto, de (20) se deduce que dado un examen con N preguntas y n opciones de respuesta, debido a la relación (16), tenemos dos grados de libertad, uno en m y otro en t.
Número de exámenes hasta cierta nota
Sea CN0
el número de exámenes con una calificación inferior a C0. Nótese que hay muchos exámenes con distinto número de aciertos m, fallos t y preguntas en blanco b, que tienen una calificación inferior a C0. Hemos de sumar todos estos posibles exámenes, entre ciertos
límites de m y t, para obtener .CN0
( )max max
min min
.m t
tC
m m t t
N N mN n
m t0= =
− = −1
∑ ∑ (21)
Además, el número mínimo de respuestas correctas, para cualquier nota C0, ha de ser 0,
mmin = 0. (22)
Por otro lado, dado un valor de m (número de respuestas correctas), el número máximo de respuestas incorrectas es,
tmax = N – m. (23)
Para obtener el número mínimo de respuestas incorrectas, tmin, que tiene un examen con una clasificación inferior a C0,
C(m, t) < C0,
podemos usar (17),
max ,C tm CN a 0
− <
que despejando se obtiene,
max
.NCt mC
a 0 > −
Luego tmin ha de ser,
min minmax
, .NCt m tC
a 0
= − +1 ≥ 0
(24)
Por otro lado, tanto tmin como tmax dependen del número de respuestas acertadas m. Podemos usar este hecho para determinar el número máximo de respuestas acertadas mmax, pues se ha de cumplir que,
tmin(mmax) = tmax(mmax),
es decir,
max maxmax
.NCm N mC
a 0
− +1 = −
(25)
Como N y mmax son números enteros, la relación (25) se puede escribir de la siguiente forma,
max maxmax
,NCm N mC
a 0
− +1− + = 0
es decir,
( ) maxmax
.Cm NCa
a 0 0 < +1 − +1 +1 < 1
Despejando,
maxmax max
.N C N CmC Ca a
a a a0 0 1
+1 − < < +1 +1 +1 +1
Como α > 0, entonces (α + 1)-1 < 1, y por tanto resulta que,
max maxmax
, ,N Cm mCa
a a0
1= +1 − ≥ 0
+1 +1 (26)

NEREIS 3 [Marzo 2011], 53-59, ISSN: 1888-8550
J. L. González et al.56
donde el número m de respuestas acertadas tiene que ser también un número entero no negativo. Finalmente, usando las relaciones (22), (23), (24) y (26), podemos escribir como,
( )max
min
.m N m
tC
m t t
N N mN n
m t0
−
=0 =
− = −1
∑ ∑ (27)
cálculo de probabilidades
Suponiendo que todas las respuestas posibles a un cierto examen tipo test sean equiprobables, entonces, de acuerdo con (18) y (27), la probabilidad de obtener un examen con una calificación inferior a C0 es,
( )( )
( )max max
min
.m t
tCN
m t tp
N N N mP C C n
m tN n0
0=0 =
− 1< = = −1
+1 ∑ ∑ (28)
Como es habitual, si F es la función de distribución de la variable aleatoria C, entonces,
( ) ( ).F C P C C0 0= <
De este modo, tendremos que,
( ) ( ) ( )( ) ( ).
P C C C P C C P C C
F C F C0 1 1 0
1 0
≤ < = < − <
= − (29)
Como C es una variable discreta, la diferencia mínima entre dos calificaciones ε viene dada por,
( ) ( ) max, , .CC m t C m tN
ea
= − +1 = (30)
Por tanto, podremos determinar la probabilidad de obtener exactamente una determinada nota,
( ) ( )( ) ( ).
P C C P C C C
P C C P C C
e
e0 0 0
0 0
= = ≤ < +
= < + − < (31)
Función de distribución asintótica
En esta sección vamos a ver el comportamiento asintótico cuando el número de preguntas tiende a infinito, N → ∞, de la función de distribución de probabilidad, a partir de la relación que da la probabilidad exacta (28).
comportamiento asintótico de la función de distribución en C0 ≠ 0
Cuando C0 < 0, teniendo en cuenta (24) y (26), se tiene que,
max
min
lim ,
lim .N
N
m
t→∞
→∞
= 0
= ∞
Por tanto,
( )( )
( )lim lim
.
N mt
NN N m t
N N mP C n
m tn
0 −
→∞ →∞=0 =∞
− 1< 0 = −1
+1 = 0
∑ ∑
(32)
Por otro lado, cuando C0 > 0, a partir de (24) y (26) resulta que,
max
min
lim ,
lim .N
N
m
t→∞
→∞
= ∞
= 0
Por tanto,
( )( )
( )lim lim .N m
tNN N m t
N N mP C n
m tn
∞ −
→∞ →∞=0 =0
− 1< 0 = −1
+1 ∑ ∑ (33)
Desarrollando el sumatorio interno mediante el binomio de Newton, se obtiene,
( )( )
lim lim .N mNN N m
NP C n
mn
∞−
→∞ →∞=0
1< 0 =
+1 ∑ (34)
Obsérvese que como el inverso del factorial de un número negativo es 0, la serie dada en (34) se corta en m = N,
( )( )( )( )
lim lim
lim .
NN m
NN N m
N
NN
NP C n
mn
nn
−
→∞ →∞=0
→∞
1< 0 =
+1
+1= = 1
+1
∑
(35)
donde se ha aplicado de nuevo el binomio de Newton.
A partir de (32) y (35), podemos concluir que asintóticamente la función de distribución F(C) se comporta como una función de Heaviside H(C), (J. Spanier, K. B. Oldam, 1987),
( ) ( ).~→∞N
F C H C (36)
Por tanto, la función de densidad f(C) de la variable aleatoria C será una delta de Dirac (J. Spanier, K. B. Oldam, 1987),
( ) ( ) ( ),→∞
′= ~N
f C F C Cd
que es un resultado coherente con el obtenido en (13) del modelo simplificado.
La probabilidad asintótica en C0 = 0
Tomando C0 = 0 en (31) y teniendo en cuenta (30), resulta que,
( ) ( )max .CP C P C P CNa
= 0 = < − < 0
(37)

NEREIS 3 [Marzo 2011], 53-59, ISSN: 1888-8550
57Análisis de la fórmula para la calificación de pruebas tipo test multi-respuesta
Tomando límites en (37) cuando N → ∞, y teniendo en cuenta (32),
( ) maxlim lim .N N
CP C P CNa→∞ →∞
= 0 = <
(38)
La relación (38) indica que,
maxlim .N
CCNa0 →∞
= = 0
Por tanto, según (24) y (26),
minlim ,N
t ma→∞
= (39)
maxlim lim .N N
Nma→∞ →∞
+1 = = ∞ +1 (40)
Al sustituir (39) y (40) en la relación (28), entonces (38) se convierte en,
( ) ( )lim lim , ,N N
P C N a→∞ →∞
= 0 =
en donde se ha definido,
( )( )
( ), .
NN m
tN
m t m
N N mN n
m tn
a
a
a
+1 +1 −
=0 =
− 1= −1
+1 ∑ ∑ (41)
Figura 1. Representación de ( ),N a , con α = n – 1, para valores
de n = 3, 4, 5.
En la figura 1 se ha representado gráficamente ( ),N a con respecto a N, tomado α = n – 1, que es el valor de α que según el enfoque simplificado equilibra la puntuación del valor del test, (véase (6)). A la vista de la figura 1, se puede conjeturar que,
( )lim ,N
P C→∞
1= 0 =
2 (42)
lo que resulta aceptable, ya que para toda distribución simétrica respecto a C = 0, se cumple que,
( )sim .F C 1= 0 =
2
Como la distribución de F es normal (asintóticamente), es simétrica, y por tanto,
( )lim .N
F C→∞
1= 0 =
2
Figura 2. Función de distribución de F(C), para N = 100, 500, 1000, n = 4 y α = n – 1.
Como según (36),
( )lim ,N
P C→∞
< 0 = 0
podemos concluir (42). En la figura 2, se muestra el comportamiento de la función distribución F(C) con N en un entorno de C = 0. Se puede observar cómo, cuando N va creciendo, F(C) se va asemejando a una función de Heaviside.
Figura 3. Representación gráfica de ( ),N a ,para α = 2,9, 3, 3,1, tomando n = 4.
En la figura 3, se muestra ( ),N a , para distintos valores de α. Se puede observar que una pequeña variación del parámetro α con respecto al valor de n – 1 hace que la probabilidad asintótica en C =

NEREIS 3 [Marzo 2011], 53-59, ISSN: 1888-8550
J. L. González et al.58
0 diverja del valor 1/2. Esto quiere decir que el parámetro α que hace que la distribución F sea asintóticamente simétrica, es el que elimina la sobrenota por acierto al azar.
Evaluación del modelo exacto
En esta sección se evalúa en qué medida la aproximación a la normal es una buena aproximación cuando N toma valores grandes. En la figura 4 se ha obtenido el ajuste de la distribución de probabilidad de la variable C a una curva gaussiana, tomando N = 100, n = 4, Cmax = 10 y α = n – 1. Nótese que la calificación mínima en un examen consiste en tener todas las respuestas incorrectas, es decir,
maxmin .CC 10
= − = −3 3
En esta misma figura 4 se observa que el ajuste es mucho mejor para calificaciones positivas que negativas, existiendo una cierta asimetría en la distribución de los puntos del cálculo exacto.
Figura 4. Ajuste de log[f(C)] a una parábola ax2 + b.
Considerando que la gaussiana de ajuste viene dada por la función,
( ) ( )fitfitfit
exp exp ,Cf C aC bss p
22
2
1= − = +
22 (43)
tenemos que,a ≈ – 1,46959,b ≈ – 5,72123.
Para cuantificar la bondad del ajuste, el coeficiente de determinación R2 es,
R2 ≈ 0,988722.
que puede ser considerado como un valor excelente.
La desviación típica σ, según (10), es,
( )max . ,C
N ns
2
= ≈ 0 57735−1
y según el ajuste sería realizado a los datos del cálculo exacto,
fit . ,a
s1
= ≈ 0 5832942
que otra vez debe ser considerado como muy bueno.Tomando un nivel de confianza q = 95%, según (15), el parámetro
k resulta ser,
( )erf . . .k −1= 2 0 95 ≈ 1 95996
Por tanto, el intervalo de confianza al 95% vendría dado por,
(– kα, kα) = (– 1,13159, 1,13159). (44)
Según el cálculo exacto (29), la probabilidad de que la calificación C esté en el intervalo de confianza (44) resulta ser ligeramente mayor que 0,95,
( ) . . .P k C ka a− ≤ < ≈ 0 96982 > 0 95
Para evaluar en qué medida el intervalo de confianza asintótico se ajusta al real, podemos definir la siguiente tasa r, entre la probabilidad asintótica que ofrece el teorema central del límite (14), y la probabilidad exacta en dicho intervalo (29),
( )( ) ( )
asintP C k qrP k C k P k C k
a
a a a a
≤= =
− ≤ < − ≤ <
En la figura 5 se ha representado la gráfica de la tasa r en función de q, tomando N = 100. Se puede observar que como r < 1, el intervalo (–kα, kα), determinado con el enfoque aproximado, está ligeramente sobrestimado.
Figura 5. Gráfica de la tasa r en función del nivel de confianza q, tomando N = 100, n = 4 y α = n – 1.

NEREIS 3 [Marzo 2011], 53-59, ISSN: 1888-8550
59Análisis de la fórmula para la calificación de pruebas tipo test multi-respuesta
coNcLUSIoNES
En este trabajo se ha abordado el problema de la puntuación en un examen tipo test multi-respuesta, de tal modo que se elimine la posible sobrenota por el acierto al azar en las respuestas. Con un modelo simplificado se concluye que si cada pregunta correcta vale 1 punto hay que descontar 1/(n – 1) puntos por cada pregunta incorrecta (n, número de opciones por pregunta), para compensar el posible intento de responder al azar las preguntas que no se saben. Este enfoque simplificado no permite plantear el problema con la posibilidad de dejar preguntas en blanco.
Se aborda también el cálculo exacto de la probabilidad de sacar una determinada calificación en un test, suponiendo que todas las maneras de contestarlo son equiprobables. Se ha comprobado que este cálculo exacto coincide con lo predicho por el teorema central del límite, cuando N → ∞, siendo N el número de preguntas del examen. Además, lo que
descuenta cada pregunta incorrecta, según el enfoque simplificado, es lo que permite que la distribución exacta de la calificación obtenida al azar sea simétrica cuando N → ∞. Por último, se comprueba que los intervalos de confianza en torno a la calificación más probable, rellenando el examen al azar, están ligeramente sobreestimados, cuando se usa para su obtención el teorema central del límite.
BIBLIoGrAFÍA
FELLER, W., 1996. Introducción a la teoría de las probabilidades y sus aplicaciones, Ciudad de México: Limusa, 456p.
SPANIER, J., OLDHAM, K. B., 1987. An atlas of functions, New York: Hemisphere Publising Corporation, 700p.
LEBEDEV, N. N., 1972. Special Functions and their applications, London: Prentice-Hall, Inc. Dover Publications, 308p.


NEREIS 3 [Marzo 2011], 61-62, ISSN: 1888-8550
1. Los trabajos se remitirán en formato doc, docx, odt o rtf como archivo adjunto en un correo electrónico a la dirección [email protected] indicando en el cuerpo del mensaje el formato y otras aplicaciones utilizadas (editor numéricos, editor de imágenes...), la sección de publicación, el nombre completo y apellidos de los autores, sus correos electrónicos y la dirección a la que debe dirigirse la correspondencia (sólo el autor principal).
2. Los trabajos, que deben ser originales y ajustados a estas normas, no pueden estar presentados a otra publicación simultáneamente. Pueden redactarse en español o inglés. Los temas deben ajustarse estrictamente a los propuestos por el Consejo Editorial.
3. La revista se publica en marzo de cada año. Los trabajos serán valorados por revisores anónimos y externos (referees) ajenos a la institución y al consejo de redacción según el sistema de revisión por pares (doble ciego). Se enviará la aceptación o rechazo motivado a los autores antes de 60 días naturales. La Revista se reserva el derecho de cambiar, parcialmente, el estilo o el formato de los trabajos presentados.
4. Cada autor se compromete a seguir las sugerencias de los revisores para modificar los trabajos aceptados. Después de la publicación, recibirán dos ejemplares de la revista y un archivo pdf con el formato definitivo.
NORMAS DE ADMISIÓN Y PRESENTACIÓN DE LAS COLABORACIONES ADMISSION AND PRESENTATION STANDARDS FOR CONTRIBUTIONS
Nereis. Revista Iberoamericana Interdisciplinar de Métodos, Modelización y SimulaciónNereis. Interdisciplinary Ibero-American Journal of Methods, Modelling and Simulation
1. Manuscripts will be in doc, docx, odt or rft formats as an attachment to an electronic mail message sent to the address, [email protected], indicating in the message body the format and other applications used (formula editor, image editor, etc.), the section of the publication, the full names and surnames of the authors, their electronic mail addresses and the address to which correspondence should be sent (only the principal author).
2. Manuscripts, which must be original and comply with these standards, must not be simultaneously presented to other publications. They may be written in Spanish or English. Topics must be strictly in accordance with the Editorial Board’s proposals.
3. The journal is published in March each year. Manuscripts will be reviewed by anonymous reviewers external to the institution (referees) and by the editorial board according to the peer review system (double blind). Acceptance or rejection will be sent to the authors within 60 calendar days. The Journal reserves the right to partially change the style or format of the manuscripts presented.
4. Authors will undertake to follow the reviewers’ suggestions for modifying the accepted manuscript. After publication, the author will receive two copies of the journal and a PDF file of the definitive version.

NEREIS 3 [Marzo 2011], 61-62, ISSN: 1888-8550
Nereis62
5. En la primera página se hará constar el título del artículo, el nombre y la filiación del autor. El cuerpo del texto deberá ir precedido necesariamente de dos resúmenes (uno de ellos en inglés y el otro en español) que no excedan las 200 palabras cada uno. Se anotarán también palabras clave en las lenguas en las que se hayan redactado los resúmenes.
6. Los originales se presentarán según la plantilla de la revista. La extensión máxima es de 15 páginas incluyendo figuras, notas, bibliografía y resúmenes. Las imágenes han de ser todas en blanco y negro.
7. Las notas se incorporarán al final del trabajo. Numeradas con cifras arábigas, se usarán si no es inevitable, evitando, especialmente, registrar sólo referencias bibliográficas.
5. The first page of the manuscript must show the title of the article, the author’s name and affiliation. The body of the text must be preceded by two summaries (one of them in English and the other in Spanish) that do not exceed 200 words each. Keywords will also be provided in the languages in which the summaries have been written.
6. The original will be presented on the journal template. The maximum length is 15 pages, including figures, notes, bibliography and summaries. The images must all be in black and white.
7. Notes (if unavoidable) are to be added at the end of the manuscript. They will by numbered using Arabic numerals and should not refer only to bibliographic references.