Nephrotic Syndrome* - Journal of Clinical Investigation
15
Journal of Clinical Investigation Vol. 43, No. 12, 1964 Selectivity of Protein Excretion in Patients with the Nephrotic Syndrome * GARY R. JOACHIMt J. STEWART CAMERONt MELVIN SCHWARTZ, AND E. LOVELL BECKER (From the Departments of Medicine and Public Health, the New York Hospital-Cornell Medical Center, New York, N. Y.) It is generally accepted that proteinuria results from increased permeability. Although no rec- ognizable structural abnormality has been defined to indicate a pathway of protein excretion, the permeability of the glomerular membrane, under conditions of moderate and heavy proteinuria, has been interpreted in terms of distribution of "pore size" (1-3). This concept suggests the presence of "defects" or "pores" in the glomerular membrane of such dimensions that permit the pas- sage of these proteins into the glomerular filtrate. Factors other than size and shape that may also influence the rate of diffusion of a molecule through a membrane (4) are considered negligible. Although indirectly applicable to proteins, clear- ance studies in animals utilizing dextrans of vary- ing molecular weight (5, 6) have demonstrated the distribution of "pore size" in the normal glo- merulus within a range of molecular weights from 5,000 to 85,000. In addition, these studies con- firm the relationship between clearance of a mole- cule and its molecular weight. The relationship of relative renal clearances of individual protein fractions to their corresponding molecular weight, serving as an index of glomeru- lar permeability, has been previously applied in the clinical investigation of patients with the nephrotic syndrome (7). In this investigation * Submitted for publication June 3, 1964; accepted August 14, 1964. Aided by grant no. AM 05009 from the National In- stitute of Arthritis and Metabolic Diseases and in part by grant no. FR-47, Division of General Medical Sci- ences, National Institutes of Health. t Supported by U. S. Public Health Service postdoc- toral fellowship (1-F2-HE-19,861-O1A1) from the Na- tional Heart Institute. i: Supported by postdoctoral training grant HT-5264 from the National Heart Institute. Present address: Department of Medicine, Guy's Hospital Medical School, London S.E. 1, England. this relationship has been expressed graphically as a straight line whose slope characterizes the degree of selective excretion of large or small protein molecules (Figure .1). A steep slope de- notes selective filtration of small molecules, and thus suggests that the size of the glomerular "defect" is correspondingly small. Selectivity patterns of protein excretion were determined and then compared with response to steroid therapy and renal pathology in individual patients. In addition, the patterns were corre- lated with blood urea nitrogen, inulin and para- aminohippuric acid clearances, total 24-hour uri- nary protein, and duration of disease. The re- sults show that those patients with the nephrotic syndrome secondary to intrinsic renal disease (primary renal disease group), demonstrating a high degree of selective protein excretion before treatment, appear to respond best to steroid ther- apy, irrespective of the histologic findings. Fur- thermore, the selectivity pattern remained fairly constant for a given patient even though the total daily urinary protein excretion was fluctuating. Although no characteristic selectivity pattern was found for any given pathologic group, those pa- tients with more advanced histologic changes in the glomeruli appeared to have the least selective type of proteinuria. Methods Studies were carried out in 48 patients (23 males, 25 females). Forty-five satisfied Berman and Schreiner's criteria for the nephrotic syndrome (8). Their ages ranged from 16 to 66 years with a median of 31 years, and the duration of illness ranged from 2 to 182 months with a median of 21 months. Renal biopsy was per- formed in 36 patients. Of the 12 patients not biopsied, the diagnosis was inferred in three who had diabetes mellitus, and in one patient in whom a unilateral renal vein thrombosis was demonstrated. Two patients with acute proliferative glomerulonephritis and one who was 2332
Transcript of Nephrotic Syndrome* - Journal of Clinical Investigation

Journal of Clinical InvestigationVol. 43, No. 12, 1964
Selectivity of Protein Excretion in Patients with theNephrotic Syndrome *
GARY R. JOACHIMt J. STEWART CAMERONt MELVIN SCHWARTZ, ANDE. LOVELL BECKER
(From the Departments of Medicine and Public Health, the New York Hospital-CornellMedical Center, New York, N. Y.)
It is generally accepted that proteinuria resultsfrom increased permeability. Although no rec-ognizable structural abnormality has been definedto indicate a pathway of protein excretion, thepermeability of the glomerular membrane, underconditions of moderate and heavy proteinuria,has been interpreted in terms of distribution of"pore size" (1-3). This concept suggests thepresence of "defects" or "pores" in the glomerularmembrane of such dimensions that permit the pas-sage of these proteins into the glomerular filtrate.Factors other than size and shape that may alsoinfluence the rate of diffusion of a moleculethrough a membrane (4) are considered negligible.Although indirectly applicable to proteins, clear-ance studies in animals utilizing dextrans of vary-ing molecular weight (5, 6) have demonstrated thedistribution of "pore size" in the normal glo-merulus within a range of molecular weights from5,000 to 85,000. In addition, these studies con-firm the relationship between clearance of a mole-cule and its molecular weight.The relationship of relative renal clearances of
individual protein fractions to their correspondingmolecular weight, serving as an index of glomeru-lar permeability, has been previously applied inthe clinical investigation of patients with thenephrotic syndrome (7). In this investigation
* Submitted for publication June 3, 1964; acceptedAugust 14, 1964.Aided by grant no. AM 05009 from the National In-
stitute of Arthritis and Metabolic Diseases and in partby grant no. FR-47, Division of General Medical Sci-ences, National Institutes of Health.
t Supported by U. S. Public Health Service postdoc-toral fellowship (1-F2-HE-19,861-O1A1) from the Na-tional Heart Institute.
i: Supported by postdoctoral training grant HT-5264from the National Heart Institute. Present address:Department of Medicine, Guy's Hospital Medical School,London S.E. 1, England.
this relationship has been expressed graphicallyas a straight line whose slope characterizes thedegree of selective excretion of large or smallprotein molecules (Figure .1). A steep slope de-notes selective filtration of small molecules, andthus suggests that the size of the glomerular"defect" is correspondingly small.
Selectivity patterns of protein excretion weredetermined and then compared with response tosteroid therapy and renal pathology in individualpatients. In addition, the patterns were corre-lated with blood urea nitrogen, inulin and para-aminohippuric acid clearances, total 24-hour uri-nary protein, and duration of disease. The re-sults show that those patients with the nephroticsyndrome secondary to intrinsic renal disease(primary renal disease group), demonstrating ahigh degree of selective protein excretion beforetreatment, appear to respond best to steroid ther-apy, irrespective of the histologic findings. Fur-thermore, the selectivity pattern remained fairlyconstant for a given patient even though the totaldaily urinary protein excretion was fluctuating.Although no characteristic selectivity pattern wasfound for any given pathologic group, those pa-tients with more advanced histologic changes inthe glomeruli appeared to have the least selectivetype of proteinuria.
Methods
Studies were carried out in 48 patients (23 males, 25females). Forty-five satisfied Berman and Schreiner'scriteria for the nephrotic syndrome (8). Their agesranged from 16 to 66 years with a median of 31 years,and the duration of illness ranged from 2 to 182 monthswith a median of 21 months. Renal biopsy was per-formed in 36 patients. Of the 12 patients not biopsied,the diagnosis was inferred in three who had diabetesmellitus, and in one patient in whom a unilateral renalvein thrombosis was demonstrated. Two patients withacute proliferative glomerulonephritis and one who was
2332

PROTEIN EXCRETION
not biopsied did not have the nephrotic syndrome. Inthe latter case, however, the nephrotic syndrome was
demonstrated 14 years before the present observation.Pertinent data on each patient are summarized in
Tables I and II. Twenty-six patients are classified un-
der the heading, "primary renal disease," which includesthe following histologic changes: pure membranous,mixed membranous-proliferative, and advanced lesionssuggesting the chronic state. One patient had no changeas seen by light microscopy (nil disease). The miscel-laneous group comprises 22 patients: six patients withlupus nephritis, two with unilateral renal vein throm-bosis, two with proliferative (poststreptococcal) glo-
1000 _
X
100_\
aU
c(.
a)Gc
L-
a)
c
c
U1)0Q
10
1
merulonephritis, three with diabetes mellitus, one withamyloidosis, and eight patients who were not biopsied.There were three deaths in the entire series.The immunochemical technique has been reported by
Soothill (9) and is described here in order to pointout certain differences and comment on some of thedifficulties encountered.
a) Collection of samples. Twenty-four-hour urinesamples were collected, and heparinized plasma was
obtained just after the close of the urine collection.In several instances, urine and plasma specimens were
obtained during clearance studies. One drop of 1: 1,000
gamma 7 S globulin
40 67 88 8 160 840
Albumin gamma 1A globulin alpha 2 macro-globulin
Transferrin(Molecular weight) x (1/1000)
7/ 24/ 64
FIG. 1. PATTERN OF SELECTIVE PROTEIN EXCRETION IN TWO PATIENTS WITH
THE NEPHROTIC SYNDROME. Line A represents the lower limit of average
selectivity; line B represents the lower limit of high selectivity.
2333

JOACHIM, CAMERON, SCHWARTZ, AND BECKER
TABLE I
Summary of clinical and pathological
Glomerular histology
Dura- BM Lob-tion of Biopsy thick- Cellu- ula- Adhe- PG fi- Hyalin-
Patient Age Sex illness date ening larity tion sions brosis ization Sclerosis
mos1. M.H. 47 M 24 10/62 (F) + + 0 0 0 0 02. M.R. 24 F 5 8/63 (F) ++ + + 0 0 0 03. T.F. 47 M 73 6/58 (F) + 0 0 0 0 0 0
1/59 (F)++ ± 04. E.C. 40 F 31 11/60 (D)++ 0 0 0 0 1 glom. 0
11/63 (F) + 0 0 1 glom. 0 2 glom. 05. M.M. 16 M 4 9/63 0 0 0 0 0 0 06. W.W. 18 M 36 8/61 (F) + 0 + ++ 0 0 0
7. B.L. 32 F 17 1/63 (F) + 0 0 0 0 0 0
8. R.B. 31 M 9 1/63 (F)++ 0 0 0 0 0 0
9. J.C. 37 F 10 5/63 (F) + 0 0 + 0 0 010. J.L. 30 M 2 12/63 (D) + + + + 0 0 0
11. M.O'C. 56 F 17 12/62 (F)++ 0 + 0 3glom. 0 1 glom.12. P.M. 18 F 9 5/63 (D) + 0 0 0 0 0 +13. B.H. 41 F 83 7/60 (F) + 0 0 0 0 0 2 glom.14. J.W. 25 M 13 9/63 (D) + + 0 0 0 0 015. G.A. 65 F 29 5/63 (D) +++ 4- + 0 0 0 +16. B.B. 17 F 13 6/63 (F) + 0 0 + + + 017. W.H. 24 M 29 5/63 (D)+ + + ++ 0 + + +18. J.V. 49 F 30 1/63 (D) ++ 0 + 0 0 0 019. R.C. 51 M 48 3/61R (F)++ + 0 + 0 0 0
3/61L (F)++ + 0 + 0 + 020. R.R. 49 F 75 12/61 (D)+ + 0 ++ + + 0 0
PM (D)++ 0 + + + ±+ +21. H.M. 56 F 51 1/59 (D) +++ 4+ + + 0 0 022. L.L. 53 M 24 7/62 (D) + 0 0 1 glom. 0 0 0
PM + 0 0 + ++ ++ ++23. J.R. 31 M 28 6/63 (D)++ ± 0 ++ + ++ 024. W.W. 46 M 84 11/63 (F) + + 0 ++ + + ++25. I.S. 41 F 58 5/63 (D) +++ ±- 0 + 0 0 2 glom.26. T.B. 16 M 12 11/63 (D)++ + + + + 0 +
* ± = equivocal; + = minimal; ++ = moderate; +++ = marked. R = right side; L = left side; PM = post-mortem; BM = basement membrane; (F) = focal; (D) = diffuse; glom. = glomerulus; PG = periglomerular; 0 =selectivity slope; LF = lost to follow-up; Uprot = urine protein; BUN = blood urea nitrogen; CIru0ii = inulin clearance;CPAH = para-aminohippuric acid clearance.
t Slope determined before therapy.
sodium azide was added to samples of urine and plasma,and the samples were stored at 40 C.
b) Preparation of agar plates. Two per cent agarwas prepared by boiling 5 g of Reinagar,' dissolved in250 ml of phosphate buffer having a pH of 7.4 and anionic strength of 0.15 (201 ml M/15 Na2PO4 + 49 mlM/15 KH2PO4), and then filtering this hot through glasswool. Eleven ml of agar was added to a 100- X 15-mmplastic Petri dish. After the agar had set, a pattern ofsix large holes (antigen wells, 8 mm diameter) sur-rounded by six smaller holes (antibody wells, 5 mm di-ameter) was made with a stainless steel die cutter.
c) Antisera. Goat 2 or rabbit 1 antisera were obtainedcommercially. Rabbit antisera were prepared accordingto the methods of Schulze and Schwick (10). The
1 Behringwerke, A. G., Marburg-Lahn, Germany.2 Hyland Laboratories, Los Angeles, Calif.
goat antisera were prepared by using isolated and puri-fied serum constituents as immunizing antigens. Severalmanipulations were required to obtain relatively purepreparations, but the yields frequently were poor (11).Both immunoelectrophoresis and a double diffusiontechnique were used to determine the specificity of theantigen. Dilutions and molecular weights of the proteins(12) used in this study are given in Table III.d) Technique. Urine and plasma were suitably di-
luted with 0.15 N NaCl, drops being counted fromPasteur pipettes of approximately the same bore. Fora urine sample containing 20 g of protein in 1.5 L (or13.5 g per L) and a plasma sample containing 3 g albu-min per 100 ml, the following dilution scheme for albu-min was used: urine, 1/32, 1/64; plasma, 1/64, 1/128,1/256, 1/512. The estimated urine/plasma ratio for al-bumin is about 1/3. The urine/plasma ratios of otherproteins were estimated in relation to that of albumin,
2334

PROTEIN EXCRETION
TABLE I
data: primary renal disease group*
Intersti- Responsetial infil-tration 9 Steroids Grade Class UProt BUN CITUlin CPAH
g/24 hrs mg/100 ml ml/min ml/min0 720t Yes 3 8.13 20 127 670.5+ 71.3°t Yes 4 11.0 18 75.2 2720 70.90 Yes 2 10.9 13
x2 10 70°t Yes 3, 3, 4 10.90 68.60 x3 2.25 10 74 2030 69.6°t Yes 4 18.0 150 68.5°t Yes 1 11.85 76 822.8
620 x2 1 9.60 67.90t Yes 3 8.2 10 102.4 717
70.70 3.260 67.20 Yes 2 4.8 11
(4 wks)0 660t Yes 3 10.4 25+ 65.20t Yes 1 11.0 20 80.6 656
600 x2 1 20.0+ 62.30 No C 32.0+ 62.3°t Yes 1 3.7 20 87.8 372.30 60.9 Yes 1 6.33 13 88 4560 590t Yes 1 19.5 31 34.9 270++ 58.20 Yes 0 14.2 33 19.6 124.2+ 580t Yes 1 6.95 52+ 57.4°t Yes 0 10.3 15 47.5 367
+ + 54.90t No LF 6.85 27 35 318.70 53.20t Yes 1 12.0 65 40 157.300 51.90 Yes 1 6.0 31 13.3 115.30 45.30+ 510 Yes 1 60 25.50 50.80t Yes 0 10.0 30++ 50.70 No D 10.0 51 25.8 410.30 49.50 No D 13.0 350 480t Yes 1 9.3 10+ 450t Yes 0 15.0 58 36 137.5
and urine and plasma dilutions were prepared accordingly.Diluted samples of urine were placed in the large wellsA and B (Figure 2) and diluted plasma samples in theother four large wells C, D, E, and F. Serial dilutionsof antibody were placed in the small wells in an alter-nating clockwise-counter-clockwise fashion.The plates were covered and left at room temperature
for 24 hours. Lines of precipitation were noted againsta dark background. If the urine samples did not fallwithin the range of plasma dilutions, the procedure wasrepeated with more suitable dilutions. The plates werefilled with 5%7 formalin, left standing for 4 hours, thenwashed for 3 days with frequent changes of 0.15 NNaCI. They were stained for 15 minutes with amidoblack lOB (0.5 g amido black lOB and 5.0 g mercuricchloride dissolved in 100 ml of 10% acetic acid). Theplates were destained with repeated washes of 5%o aceticacid until a clear, light background was obtained.
Drying the plates at room temperature resulted in athin film, and this was used for comparison of pre-cipitin lines.
e) Estimation of urine/plasma protein ratios. Theplates and the dried films were read by visually match-ing hexagonal (or semihexagonal) precipitin lines ofthe urine with those of the plasma. Distance of theline from the antibody well as well as clarity and den-sity of the line were the reference points. The use of aviewer and millimeter rule facilitated more accurateestimation. The result was expressed as a concen-tration ratio (urine/plasma). If a precipitin patternappeared to fall between two plasma dilutions, the re-sult was interpolated arithmetically, i.e., between 1/32and 1/64, a dilution would be read as 1/36, 1/40, 1/44,1/48, 1/52, or 1/56.
In some instances spurs or reactions of partial identitywere noted between precipitin bands. Usually this was
2335

JOACHIM, CAMERON, SCHWARTZ, AND BECKER
TABLE II
Summary of clinical data
Proliferative (poststreptococcal) glomerulonephritis
ResponseDuration
Patient Age Sex of disease 0 Steroids Grade Class UProt BUN CInulin CPAH
mos g/24 hrs mg/ ml/min ml/min
Miscellaneous group1. M.C. 36 M 62. N.N. 16 M 17
Diabetes mellitus1. B.N. 65 F 162. M.K. 66 F 183. M.C. 35 M 15
68.70* No59.40* No
61.60t Yes60.80 No53.90 No
3
Unilateral renal vein thrombosis1. J.V. 18 M 16 60.90 No2. R.L. 31 M 2 59.80t Yes
Amyloidosis1. S.K. 27 M 13 69.50
67.50
Lupus nephritis
No
100 ml
B 1.52 17C 2.0 15
10.4 21C 15.1 52C 19.6 21
C 6.69 16 647.35 11
C 23.139.7
517.7
16 40.7 17447 218
35 M 19 64.50 Yes33 F 60 60.40 Yes31 F 24 50.80 Yes
x217 F 12 43.80t Yes29 F 25 38.20 Yes24 F 2 44.5°t Yes
36.60
13
1
0
0
6.23.3
10.0
6.39.55.159.0
29
30
92 10.3 388.13390 10.5 107.6
Unbiopsied group
1. K.A. 16 F
2. W.G. 38 M
3. E.W. 47 F4. P.L. 33 F5. E.B. 20 F6. G.N. 23 F
7. K.D. 21 F8. H.K. 20 M
19 71 °t Yes72.20 x3
2 67.2 0* No128 63.80 Yes61 63.40 No4 55.8°* No
95 53.5°t Yesx2
36 51.90 No.182 39.50 No
4, 44
2
3, 1
20.05.5
C 4.83.5
C
C 5.24.37
C
D
17
8043 27 18540 21.4 20213
96.4 763.2
2494
* Selectivity slope determined early in course of disease.t Selectivity slope determined before steroid therapy.
TABLE III
Antibody dilutions
Approximate Dilutionsmolecular
Antibody to weight 1 2 3 4 5 6
Orosomucoid 40,000 1/1 1/2 1/4 1/8 1/12 1/16Albumin 67,000 1/1 1/2 1/4 1/8 1/16 1/32Transferrin 88,000 1/1 1/2 1/3 1/4 1/5 1/67 S gamma globulin 150,000 1/1 1/2 1/4 1/6 1/8 1/10GammaiA globulin 160,000 1/1 1/2 1/3 1/4 1/6 1/8Alpha2 macroglobulin 840,000 1/1 1/2 1/3 1/4 1/6 1/8Beta2 macroglobulin 890,000 1/1 1/2 1/3 1/4 1/6 1/10Beta lipoprotein 2,500,000 1/1 1/2 1/3 1/4 1/6 1/8
2336
1. C.Y.2. D.R.3. D.P.
4. E.R.5. R.D.6. T.F.

PROTEINEXCRETION2
not seen with albumin, transferrin, 8YA globulin, and y7sglobulin antisera. More than one precipitin line wasobserved with orosomucoid and beta lipoprotein, andoccasionally with a2 macroglobulin antisera. Dilutionof both antigen and antibody somewhat eliminates thisreaction when nonspecific antibodies are present in thetesting antisera (13), and the strongest band was used.
Sometimes splitting or reduplication of the precipitinline was noted, indicating an excess of antigen or anti-body. The determination was repeated using the sameantisera with more appropriate antigen dilutions.
It is apparent that different lots of antisera give dif-ferent results when measuring the same antigen. Thesame lot was used for a series of determinations, andits specificity was checked by immunoelectrophoresisagainst human serum.
f) Dctermination of the slope. From the urine/plasmaratios of five or more protein fractions, net proteinclearances were determined and expressed as the per-centage of transferrin clearance: e.g., (UAlbV/PAlb)-(UTransV/PTrans)X 100, where U = urinary concentra-tion of the protein; P = plasma concentration of theprotein; and V = urine flow in milliliters per minute.Because the urine flow is the same for the two clear-ances, the V term cancels out of the relative clearanceexpression leaving U1/P,. Since the technique for thedetermination of transferrin (Trans) has a slightly lowervariance than that of albumin (Alb), transferrin clear-ance is used as the reference in this relationship (14).These percentage values are plotted as ordinates againstrespective molecular weights on a log-log graph. Suchplots are generally linear (Figure 1). Among the dif-ferent plots investigated were arithmetic plot of clear-ance vs. molecular weight, log clearance vs. molecularweight, log molecular weight vs. clearance, etc. Noone of these empirical graphs produced the consistentlinearity of the log-log plot. A straight line was esti-mated by the method of least squares, and the slope (K)was determined. The angle (0) is derived from K, thetangent of 0, and expresses degree of selectivity. Pro-tein clearances, expressed as a percentage of inulinclearance, CAMb/CInulin, CTrans/CInulIn, etc., were simi-larly plotted. The slopes of these lines were nearlyidentical with those obtained using the transferrinpercentages.
g) A4nalyses. Sixty-five determinations of selectivitywere performed on 48 patients. The mean slope (ex-pressed here as 0) was 58.60, the median was 60.1°, thestandard deviation was 9.0°, the coefficient of variationwas 15.35%, and the standard error of the mean was1.3%.The selectivity measurements defined as 0, or alter-
natively as K (tangent 0), were plotted against a probitscale (Figure 3). This scale is essentially a scale inunits of standard deviation and has found its mostroutine application in dose response data, and it pro-vides a convenient method of examining data for con-sistency with a normal distribution. The linearity ofthe plot was taken to indicate that the distribution of se-lectivity slopes for the patient group studied was con-
FIG. 2. STAINED AND DRIED AGAR FILM SHOWING PRE-CIPITIN LINES OBTAINED BY THE IMMUNODIFFUSION TECH-NIQUE. The lettered wells A and B contain differentdilutions of urine; C, D, E, and F contain different dilu-tions of plasma. The numbered wells contain differentdilutions of specific antibody. The precipitin linesaround A and C are comparable as are those lines aroundB and D.
sistent with a normal or bell-shaped distribution. Al-though it would be difficult to set absolute limits withthe small number of individuals reported in this study,the roughly bell-shaped curve of the population allowsone to set up standards of selectivity in terms of thepatterns of protein excretion. The units of 1 SD de-marcated subjects into four groups (Table IV).
h) Chemical analyses. Total urinary protein was de-termined by a modification of the method of Hiller,McIntosh, and Van Slyke (15), in which Pro-Sol 3 wasused as the standard protein solution. Urine and plasmaalkali-stable inulin was determined by the method ofWalser, Davidson, and Orloff (16), and urine and plasmapara-aminohippurate was determined by the method ofSmith and associates (17).
Results
Effects of protein denaturation and loss. Patte,Baldassaire, and Loret (18) reported no differ-ences in immunochemical studies on urine storedat 4° C for 8 days without preservative. Berg-gard (19) found no alteration in the serologicprecipitation pattern of urinary gamma globulinafter the urine had been stored for 10 days at room
3 Pro-Sol was obtained from the Standard ScientificSupply Corp., New York, N. Y.
2337

JOACHIM, CAMERON, SCHWARTZ, AND BECKER
+ 7.0
+ 6.5
+ 6.0
+5.5
, +5.0
co
+4.0
+3.5
+3.0
35I
40 45 50 55 60 65 70 75
e (Selectivity slope)FIG. 3. SELECTIVITY SLOPES OF THE ENTIRE GROUP OF PATIENTS PLOTTED
AGAINST A PROBIT SCALE.
temperature. In this study identical results wereobtained from a fresh urine specimen, and thesame specimen was kept at 40 C for 2 weeks.Apparently many proteins retain immunologicspecificity despite denaturation from enzymatic
TABLE IV
Grouping of patients accordingto selectivity types
Selectivity typeof proteinuria 0 (Average 0 =58.6°, 1 SD =9.00)
Low Below 540 < (average 0 - I SD)Average 540-3° (average 0 ± j SD)Intermediate 63.1o-67° > (average 0 + i SD)
< (average 0 + 1 SD)High Greater than 670 (average 0 + 1 SD)
activity or other processes. Boiling urine untilthe protein precipitated did not alter the im-munologic reactivity of the protein fractionsmeasured.
In some cases urine samples were dialyzedagainst distilled water at room temperature intubing prepared from Visking membranes, thenpervaporated to obtain greater concentration.This treatment caused no protein loss as deter-mined immunochemically on pervaporated or ly-ophilized specimens of the dialyzate.
Reproducibility of results. Since this methodhas many variables that could add to the errors ofdetermination, and since it depends upon humanjudgment, a double blind study was performed totest the reproducibility of results. Five urine
2338
.
0
0
00
00
00
0
00
'a.
0
0
o0
0
0
0
0

PROTEIN EXCRETION
TABLE V
Results of double blind study*
U/P ratiosSelectivity
Patient slope Oroso Alb Trans 7 S Y1A a2M
1. A 71°07' 1:24 1:128 1:128 1:512 0t 0B 71°03' 1:20 1:200 1:200 1:512 0 0
2. A 75°44' 1:1.25 1:3.9 1:3 1:150 1:32 0B 69°39' 1:1 1:3.5 1:4 1:32 1:40 0
3. A 67033' 5.33 2.67 2.00 1:2 1:7B 71°44' 8.00 4.00 2.00 1:2 1:8 1:256
4. A 56007' 1.45 1:8 1:5 1:1.2 1:3 1:150B 62°04' 2.00 1:8 1:4 1:1.2 1:5 1:300
5. A 67°04' 1:1.5 1:3 1:2 1:6 1:20 0B 65°16' 1:1.5 1:2 1:2 1:8 1:12 0
* U/P = urine to plasma, Oroso = orosomucoid, Alb = albumin, and Trans = transferrin.t 0 = undetected at a 1: 1 dilution.
and plasma specimens were given to one individualwho divided each set into two pairs and codedthem. The pairs were distributed randomly totwo technicians who performed the entire pro-cedure, determining urine/plasma ratios and theselectivity slopes independently. Results aregiven in Table V. The degree of reproducibilitywas good. The results of technician A and tech-nician B did not differ significantly.
Comparison of selectivity type w~ith steroid re-sponse. The criteria for response to steroid ther-apy are given in Table VI. All patients receiv-ing steroids were treated initially with 60 mgprednisone or prednisolone per 24 hours for ap-proximately 4 weeks. The dose was then taperedto a maintenance level of 20 mg or more and givenover a prolonged period, usually 1 year. Dura-tion of follow-up ranged from 2 to 182 monthswith a median of 13 months. One patient was lostto follow-up.
In a prospective analysis (Figure 4), selec-tivity types were determined before therapy orearly in the course of disease in 29 patients.Twenty-one were treated with steroids. Of theeight with a grade 3 or 4 response followingsteroid therapy, six had high selectivity types ofproteinuria, and one had an intermediate selec-tivity slope. The one patient (B. N.) who haddiabetes mellitus and was treated with a shortcourse of steroids had a grade 3 response despitea slope equivalent to the average selectivity type.Of 13 patients who did not respond to steroid
therapy, six had low, five had average, one hadintermediate, and one patient, mentioned previ-ously, had high selectivity types of proteinuria.In the entire series, six patients had a grade 0response to steroids. Of these, four had low se-lectivity types of proteinuria (two with primary
TABLE VI
Criteria for response
To steroid therapyGrade 4 (excellent): Complete clinical remission with
normal blood chemistries andurine analysis
Grade 3 (good): Return to normal of biochemicalalterations but residual pro-teinuria
Grade 2 (fair): Diuresis but no significant changesin blood chemistries or urineanalysis
Grade 1 (poor): No alteration in the diseaseprocess
Grade 0 (worse): Exacerbation of the disease un-der steroid therapy, as judgedby blood pressure, blood chem-istries, and urine examination
Class A:Class B:
Class C:
Class D:
In the untreated patientSpontaneous remissionImprovement in renal functionand/or return to normal ofbiochemical alterations, butwith residual proteinuria
Unchanged clinical condition asjudged by blood chemistriesand urine analysis
Progressive deterioration
2339

JOACHIM, CAMERON, SCHWARTZ, AND BECKER
90
80 M
70 k
60a)CLM.0
I._
-)
50
40
30 F
20 F
10
0 L
0
0
X
2
0
0 1
Graded re
FIG. 4. ANALYSIS OF 22STEROIDS AFTER THE DETERMIN.SLOPE. The horizontal line intivity slope for each group.
renal disease, two with luFhad an average slope.The group comprising t
ondary forms of the nephr<therefore, it is uncertainment of the selectivity typ4of value as a possible guid(
In summary, in patiendisease and the nephrotic s
to be a direct relationship Ecal response to steroid theselective protein excretiotreated, six who had higcorded before therapy rest
The one patient who hadof proteinuria but did not i
found 15 months later to Ito the average selectivity
with low selectivity types of proteinuria did notrespond to therapy.
Comparison of selectivity type with total pro-tein excretion. There appears to be no correla-tion between the degree of selective protein ex-
O OX cretion and the total daily amount of protein ex-o 0 creted (r49 = + 0.03, p > 0.1). Some patients
who excreted more than 15 g of protein in 24X hours were found to have high selectivity types.
Other patients, whose total protein excretion wasless than 5 g in 24 hours, had low selectivity slopes.
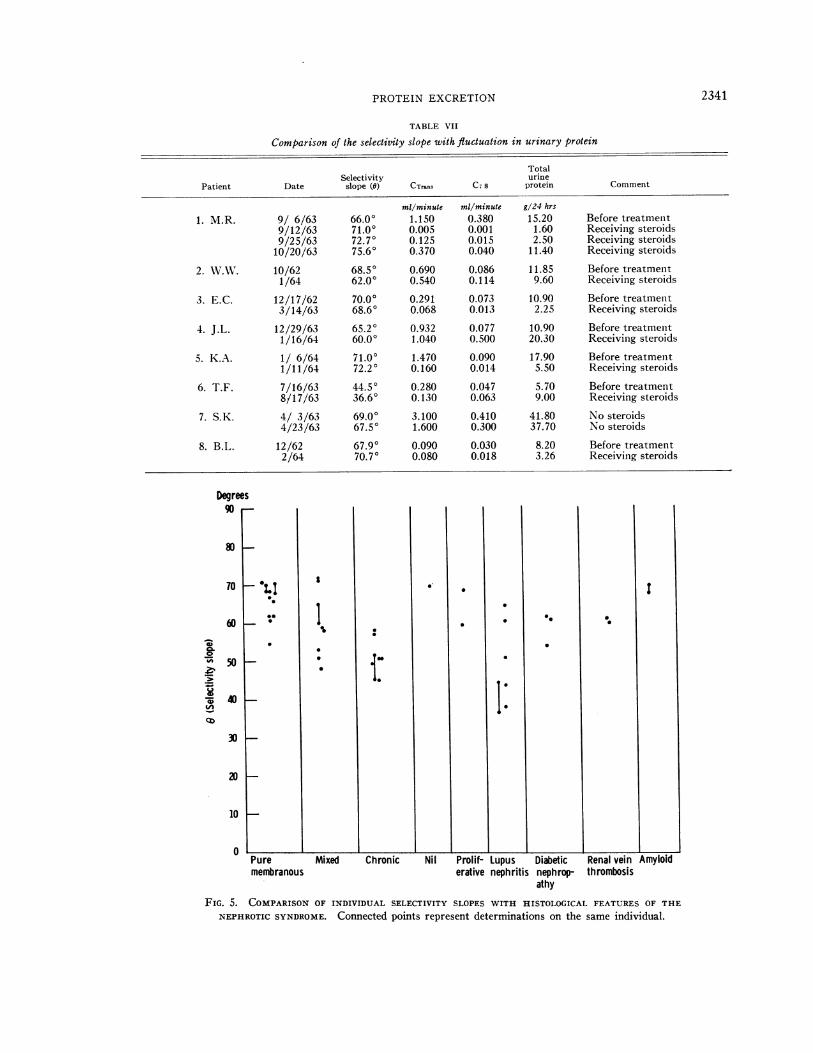
Table VII summarizes those patients in whomselectivity types were repeated and correlated withvarying total protein excretion observed duringresponse to therapy. In three patients who didnot respond to steroids, the selectivity slope wasless but not less than 1 SD from the original
.Primary renal slope. Two of these patients had a grade 0 re-dPrimary renal sponse. Four patients who did respond to ther-disease group apy had relatively constant selectivity types as
X Miscellaneous total protein excretion decreased. Squire, Hard-renal disease wicke, and Soothill (14) have commented thatgroup when proteinuria persists, the degree of selectivity
usually remains relatively constant over manyl months. All but one patient (M. R.) having re-
2 3 4 peated determinations of selectivity types over sev-
sponse to therapy eral months displayed no change greater than 1SD from the average.
PATIENTS TREATED WITH Comparison of selectivity type with glomerularATION OF THE SELECTIVITYdiCateS the average selec- histology. Blainey, Brewer, Hardwicke, and
Soothill (7), using the same technique employedhere, reported that patients with minimal glo-
)us nephritis), and two merular pathology had the highest selectivity typeof proteinuria, those with membranous glomeru-
hose patients with sec- lonephritis displayed the least selective type, andotic syndrome is small; those with proliferative glomerulonephritis had in-whether the measure- termediate selectivity. Although each group ine of proteinuria will be our study is small, those patients with membranouse to steroid therapy. glomerulonephritis displayed the highest selectivityts with primary renal type of proteinuria. Those patients having le-yndrome, there appears sions of chronic glomerulonephritis tended to have)etween the initial clini- a low selectivity type of proteinuria.rapy and the degree of In summary, those patients within the primaryn. Of eight patients renal disease group may have high selectivity types-h selectivity types re- of proteinuria irrespective of the degree of glo-)onded well to steroids. merular alteration in the acute or subacute state.a high selectivity type Those displaying chronic changes tend to have lowrespond to steroids was or average selectivity types. A comparison of thehave a slope equivalent histologic features of the nephrotic syndrome, bothtype. Those patients primary and secondary, with selectivity patterns
L
2340
PROTEIN EXCRETION
TABLE VII
Comparison of the selectivity slope with fluctuation in urinary protein
TotalSelectivity urine
Patient Date slope (0) CTrans C. s protein Comment
mil/minute ml/minute g/24 hrs
1. M.R. 9/ 6/63 66.00 1.150 0.380 15.20 Before treatment9/12/63 71.00 0.005 0.001 1.60 Receiving steroids9/25/63 72.70 0.125 0.015 2.50 Receiving steroids10/20/63 75.60 0.370 0.040 11.40 Receiving steroids
2. W.W. 10/62 68.50 0.690 0.086 11.85 Before treatment1/64 62.00 0.540 0.114 9.60 Receiving steroids
3. E.C. 12/17/62 70.00 0.291 0.073 10.90 Before treatment3/14/63 68.60 0.068 0.013 2.25 Receiving steroids
4. J.L. 12/29/63 65.20 0.932 0.077 10.90 Before treatment1/16/64 60.00 1.040 0.500 20.30 Receiving steroids
5. K.A. 1/ 6/64 71.00 1.470 0.090 17.90 Before treatment1/11/64 72.20 0.160 0.014 5.50 Receiving steroids
6. T.F. 7/16/63 44.50 0.280 0.047 5.70 Before treatment8/17/63 36.60 0.130 0.063 9.00 Receiving steroids
7. S. K. 4/ 3/63 69.00 3.100 0.410 41.80 No steroids4/23/63 67.50 1.600 0.300 37.70 No steroids
8. B.L. 12/62 67.90 0.090 0.030 8.20 Before treatment2/64 70.70 0.080 0.018 3.26 Receiving steroids
Degrees90 -
80
70
0
*40
cid
10
0Prolif- Lupus Diabetic Renal veinerative nephritis nephrop- thrombosis
athyFIG. 5. COMPARISON OF INDIVIDUAL SELECTIVITY SLOPES WITH HISTOLOGICAL FEATURES OF THE
NEPHROTIC SYNDROME. Connected points represent determinations on the same individual.
2341

JOACHIM, CAMERON, SCHWARTZ, AND BECKER
Mean 9
* Primary renal disease groupo Miscellaneous group
Median primary renal disease group
I .Mean 8
I SD
,.
I--- - - --I-
Median. (entire group)
lll l 0
00~~~~~
-I I- I- I- III L J10 20 30 40 50 60 70 80 90
9 (Selectivity slope)
FIG. 6. COMPARISON OF THE SELECTIVITY SLOPE WITH THE INULIN CLEARANCE.
is given in a scatter diagram (Figure 5). Renalbiopsy, however, samples only a small per centof the total nephron population and may not berepresentative.
Comparison of selectivity type with renal func-tion. Inulin and para-aminohippuric (PAHl)clearances were performed in 23 patients. An ad-ditional patient had only an inulin clearance.
All procedures were carried out at the time selec-
tivity slopes were determined. Fourteen patientshad clearances determined before steroid therapy,and three in the initial stage of their disease, after
which no steroids were given. Among the remain-
ing seven patients, clearances were performedsome time after an unsuccessful course of therapy
had been instituted in four, or after their diseasehad long been established in three.
Data obtained from clearance studies were
compared with selectivity slopes in individualpatients to test whether there was significant cor-
relation between near normal inulin and PAHclearances and a high selectivity type of proteinuria.The median inulin clearance was 40 ml per
minute for the entire group and 61 ml per minutefor those with primary renal disease. Correlationwas highly significant between the inulin clearanceand the selectivity slope within both the primaryrenal disease group (r16 = + 0.83, p < 0.001)and the entire group (r22 = + 0.66, p < 0.001)(Figure 6).
130
120
110
100
90
80
702EE
am
c
60
50
40
30
20
10
00In
2342
n

PROTEIN EXCRETION
The median PAH clearance was 319 ml per
minute for the entire group and 343 ml per min-ute for those with primary renal disease. Sig-nificant or borderline significant correlations ex-
isted between the PAH clearance and the selec-tivity slope for each group (r,1 = + 0.34, 0.1 >p > 0.05, and r14 = + 0.54, 0.05 > p > 0.02, re-
spectively).The values for blood urea nitrogen (BUN),
recorded at the time of initial observation, were
correlated with selectivity slopes in 44 patients.For the entire group the correlation between theinitial BUN and the selectivity slope was highlysignificant (rat =- 0.57, p < 0.001). In addi-tion, a significant correlation existed within theprimary renal disease group (r22 =- 0.63, 0.01> p > 0.001).Four patients in the primary renal disease
group had inulin clearances above the median andhad high selectivity types of proteinuria. All hada grade 3 or better response to steroid therapy.Four other patients who did not respond to ther-apy had inulin clearances above the median, butone had high selectivity slope (W. W.), and threehad slopes equivalent to the average.
Of nine patients in the primary group with inu-lin clearances below the median (61 ml per min-ute), five had low and four average but below themean selectivity types of proteinuria. In fivepatients there was no response to steroid therapy.In two patients, clearances were performed afteran unsuccessful course of therapy, and in the re-
maining two patients no therapy was instituted.In summary, those patients with a normal BUN
and a near normal (75 ml per minute or greater)inulin clearance can be expected to have a selec-tivity type of proteinuria that is at least equiva-lent to the average, but above the mean slopeobserved in this study (58.60). Those patientswho are azotemic, having grossly abnormal inulinclearances, invariably have selectivity slopesequivalent to the average but below the observedmean.
Comparison of selectivity type zvith duration ofdisease. Within the primary group, the durationof illness, estimated in months from the onset ofsymptoms to February 1964, was compared withrespective selectivity slopes. Only slight corre-
lation of borderline significance was found between
the length of illness and the degree of selectiveprotein excretion (ro, = - 0.35, 0.05 < p < 0.1).
Discussion
The applicability of the method employed inthis study is based on the following assumptions.a) When proteinuria exists, tubular reabsorptionof protein, if any, must be nonselective (1).Studies by Hardwicke and Soothill (3) andGregoire, Malmendier, and Lambert (20) sup-port this thesis. b) The urine proteins measuredare plasma-derived constituents, and protein com-ponents have not been added in any appreciableamount through tubular epithelium. Urinaryalbumin has been found to be identical with se-rum albumin (21, 22), and this is probably trueof other urinary proteins (23) in the nephroticsyndrome. c) Although the antisera used areimpure, the precipitin lines obtained in this methodreflect the total amount of the specific protein inquestion. d) Spiro's observations of "pores" or"breaks" in the basement membrane (24) havenot been confirmed by others (25, 26); neverthe-less, structural defects of variable dimensionsmust be present to explain differential proteinuriain terms of molecular size. e) Although the log-arithm of the molecular weight of a protein doesnot unvaryingly correspond to its molecular size,a direct proportion apparently exists for sphericalmolecules, with which we are concerned here(27). This relationship between clearance andmolecular weight may be summarized by the equa-tion, dC/dS =-- K(C), where C is the relativeclearance, S is the size or logarithm of the molecu-lar weight of a protein, and K is the fractional de-crease in relative clearance per change in unitsize.The results indicate a relationship between the
initial responsiveness to steroid therapy and thedegree of selective proteinuria that may be mani-fested by patients with the nephrotic syndrome.
Determination of the initial BUN and inulinclearance may give a preliminary indication of theselectivity pattern; however, alone it would notserve as a guide to steroid therapy. In one situa-tion, where the patient is initially azotemic and hasan abnormal inulin clearance, his selectivity slopecan be expected to be average but below the ob-served mean in this study, and response to therapy
2343

JOACHIM, CAMERON, SCHWARTZ, AND BECKER
is unlikely. If the initial BUN is normal and theinulin clearance is near normal, the selectivityslope can be expected to be at least average butabove the mean. In this situation it is impossibleto estimate with any degree of accuracy how thepatient will respond. A more reliable predictioncan be made from the selectivity slope.Some caution should be taken with regard to
the interpretation of the BUN and inulin clear-ance. It has been observed in children (28) andyoung adults (29) that the glomerular filtrationrate is frequently reduced and the BUN elevatedin the initial stages of the nephrotic syndrome,particularly in edematous states. These valuesreturned to normal when diuresis occurred (30)after steroid therapy. Although an adult patientwho responds favorably to steroid therapy mightbe expected to improve his inulin clearance, fourpatients in this study who did respond had a sig-nificantly higher inulin clearance at the initial ob-servation than nine who did not respond.
In assessing indications for steroid therapyin adult patients with the nephrotic syndrome,attention is paid most often to the findings ob-served on renal biopsy. There is growing ac-ceptance that those patients with nil disease re-spond best to steroids. Vernier, Farquhar, Brun-son, and Good (31) reported that clinical andlaboratory evidence of "recovery" from the ne-phrotic syndrome occurred only in children whoshowed on biopsy minimal glomerular changes.Johnson and Reader (32), however, reported twopatients who had normal renal histology beforetreatment, but one remained edematous and arepeat renal biopsy revealed normal histology,whereas the other died 15 months after the onsetof therapy.From the results obtained in this study, evi-
dently adults with the nephrotic syndrome maydisplay a high degree of selective protein excretiondespite significant glomerular pathology, and, apriori, respond to therapy. This implies that theglomerular "defect" in terms of "pore size," isnot related to the glomerular alterations seen on
renal biopsy. In some respects this would sub-stantiate Vernier's view that there is no relation-ship between the width of the basement membraneand the extent of proteinuria (33). In addition,the selectivity pattern was observed to remainfairly constant in the steroid-responsive patient.
This may indicate that the "defect" persists de-spite increasing glomerular impermeability as evi-denced by decreasing protein excretion. Studiesin a larger group of patients are required to de-termine whether the selectivity pattern does re-main constant during decreasing proteinuria. Ifthis is true, it would imply that the effect of ster-oid therapy on reducing proteinuria is exertedby a mechanism other than changing "pore size."
Several investigators have utilized other meth-ods of expressing glomerular permeability. Bymeans of a microtechnique for paper electropho-resis, Wolvius and Verschure (34) determinedthe clearance ratio of total globulins to albumin.They found no correlation between this clearanceratio and the severity of the renal disorder or theamount of protein excreted. McCrory, Rapoport,and Fleischer (35) compared the ratio of albu-min clearance to creatinine clearance in a groupof nephrotic children. They found that completeremission following steroid administration oc-curred in those with the lowest CAlb/Cereatinineratios. Lauson and associates (36) noted a strik-ing decrease in the ratio CAlb/Cih,1lnl1 in those chil-dren with the nephrotic syndrome who had favor-able responses to ACTH therapy. Schreiner (37)noted a relationship between a permeability factor,CAlb/CCreatinine, and the level of serum cholesterol.Those patients with higher serum cholesterol ap-peared to have a greater clearance of albumin.Heymann, Gilkey, and Lewis (38) noted in-creased amounts of globulin in the urine of ne-phrotic children in whom the renal lesion pro-gressed to glomerular fibrosis and atrophy,whereas Broch and Brodwall (39) reported thatelectrophoresis of the urine did not appear toyield any information regarding prognosis in pa-tients with proteinuria, except those with myelo-matosis.
Summary
With a gel diffusion precipitin technique andcommercially prepared antisera, urine/plasmia ra-tios of specific proteins were determined. Indi-vidual protein clearances, expressed as a per-centage of transferrin clearance, were plotted asordinates against respective molecular weights ona log-log graph. A straight line was evidentgraphically, its constants were estimated by themethod of least squares, and the slope, expressed
2344

PROTEIN EXCRETION
as 0, was determined. The slope of the line may
be said to express the degree of glomerular selec-tivity to protein excretion. Sixty-five determina-tions were performed in 48 patients, 45 satisfyingthe usual criteria of the nephrotic syndrome.
1) Those patients with primary renal diseaseanid the nephrotic syndrome who displayed highselectivity types of proteinuria (6 greater thanthe average for the group + 1 SD) usually re-
spond initially to steroid therapy, regardless ofthe acute or subacute glomerular changes observedon renal biopsy.
2) Those patients with chronic renal disease andthe nephrotic syndrome display an average andfrequently a low selectivity type of proteinuria.
3) There appears to be no characteristic typeof selectivity for a given pathologic group of pa-
tients with the nephrotic syndrome.4) The degree of selective protein excretion is
not related to the total daily amount of proteinbeing excreted at any one time and remains fairlyconstant despite fluctuation in the amount of pro-
tein being excreted.5) There is a slight correlation of borderline
significance between the degree of selective pro-
tein excretion and the duration of the disease, andthe initial para-aminohippuric acid clearance.
6) A statistically significant correlation existsbetween the initial blood urea nitrogen or inulinclearance and the selectivity type of protein ex-
cretion. Those patients who were not azotemicand had initially near-normal inulin clearanceshad ani average selectivity type or better.
7) It is suggested that if the adult patient isinitially azotemnic and has a grossly abnormal in-ulin clearance, response to therapy is unlikely,whereas if the blood urea nitrogen is normal andthe inulin clearance is near normal, response totherapy cannot be predicted with any degree of
accuracy. Further studies of adult patients withthe neplhrotic syndrome are required to substanti-ate this premise.
AcknowledgmentsWe express our appreciation to Miss M. J. Newton,
Miss J. Stubenbord, and Miss Dorothy Memolo for theirtechnical assistance.
References1. Hardwicke, J., and J. R. Squire. The relationship
between plasma albumin concentration and protein
excretion in patients with proteinuria. Clin. Sci.1955, 14, 509.
2. Rowe, D. S. The molecular weights of the proteinsof normal and nephrotic sera and nephrotic urine,and a comparison of selective ultrafiltrates of se-rum proteins wxith urine proteins. Biochem. J.1957, 67, 435.
3. Hardwicke, J., and J. F. Soothill. Glomerulardamage in terms of "pore size" ij Renal Biopsy,a Ciba Foundation Symposium, G. E. W. Wolsten-holme and M. P. Cameron, Eds. Boston, Little,Brown, 1961, p. 32.
4. Pappenheimer, J. R. Passage of molecules throughcapillary walls. Physiol. Rev. 1953, 33, 387.
5. Brewer, D. B. Renal clearances of dextrans of vary-ing molecular weights. Proc. roy. Soc. Med. 1951,44, 561.
6. Wallenius, G. Renal clearance of dextran as ameasure of glomerular permeability. Acta Soc.Med. upsalien. 1954, 59 (suppl. 4).
7. Blainey, J. D., D. B. Brewer, J. H. Hardwicke, andJ. F. Soothill. The nephrotic syndrome. Diag-nosis by renal biopsy and biochemical and immuno-logical analyses related to the response to steroidtherapy. Quart. J. Med. 1960, 29, 235.
8. Berman, L. B., and G. E. Schreiner. Clinical andhistologic spectrum of the nephrotic syndrome.Amer. J. Med. 1958, 24, 249.
9. Soothill, J. F. Estimation of eight serum proteinsby a gel diffusion precipitin technique. J. Lab.clin. Med. 1962, 59, 859.
10. Schultze, H. E., and G. Schwick. Quantitative im-munologische Bestimmung von Plasmaproteinen.Clin. chim. Acta 1959, 4, 15.
11. Lou, K. Personal communication.12. Schultze, H. E. Uber Glykoproteine. Dtsch. med.
Wschr. 1958, 83, 1742.13. Kekwick, R. A., L. Vallet, M. Cutbush, P. L. Mol-
lison, A. R. Thomas, P. G. H. Gell, and J. F.Soothill. Estimation of gamma globulin in theserum of patients with hypogammaglobulinaemia.J. clin. Path. 1961, 14, 470.
14. Squire, J. R., J. Hardwicke, and J. F. Soothill.Proteinuria in Renal Disease, D. A. K. Black,Ed. Philadelphia, F. A. Davis, 1962, p. 213.
15. Hawk, P. B., B. L. Oser, and W. H. Summerson.Practical Physiological Chemistry, 13th ed. NewYork, McGraw-Hill, 1954, p. 927.
16. Walser, M., D. G. Davidson, and J. Orloff. Therenal clearance of alkali-stable inulin. J. clin.Invest. 1955, 34, 1520.
17. Smith, H. W., N. Finkelstein, L. Aliminosa, B.Crawford, and M. Graber. The renal clearancesof substituted hippuric acid derivatives and otheraromatic acids in dog and man. J. clin. Invest.1945, 24, 388.
18. Patte, J. C., G. Baldassaire, and J. Loret. etudeimmuno-electrophoretique des proteinuries normaleset pathologiques. Rev. franc. Rtud. clin. biol.1958, 3, 960.
2345

JOACHIM, CAMERON, SCHWARTZ, AND BECKER
19. Berggard, I. The plasma proteins in normal urine.Nature (Lond.) 1960, 187, 776.
20. Gregoire, F., C. Malmendier, and P. P. Lambert.The mechanism of proteinuria, and a study of theeffects of hormonal therapy in the nephrotic syn-drome. Amer. J. Med. 1958, 25, 516.
21. Spector, W. G. Labelled glycine in the nephroticsyndrome. Clin. Sci. 1954, 13, 1.
22. Gitlin, D., and C. Janeway. An immunochemicalstudy of the albumins of serum, urine, asciticfluid, and edema fluid in the nephrotic syndrome.J. clin. Invest. 1952, 31, 223.
23. King, J. S., and W. H. Boyce. High MolecularWeight Substances in Human Urine. Springfield,Ill., Charles C Thomas, 1963, p. 39.
24. Spiro, D. The structural basis of proteinuria inman. Electron microscopic studies of renal biopsyspecimens from patients with lipid nephrosis,amyloidosis, and subacute and chronic glomerulo-nephritis. Amer. J. Path. 1959, 35, 47.
25. Farquhar, M. G. Electron microscopic studies on therenal glomerulus in the nephrotic syndrome inEdema, Mechanisms and Management, A Hahne-mann Symposium on Salt and Water Retention,J. H. Moyer and M. Fuchs, Eds. Philadelphia, W.B. Saunders, 1960, p. 497.
26. Fiashi, E., G. Andres, F. Giacomelli, and R. Nac-carato. Renal histopathology in the para-ne-phritic nephrotic syndrome; optical and electronmicroscopic studies of kidney biopsies. Sci. med.ital. (Eng. ed.) 1959, 7, 639.
27. Sobotka, H. Monomolecular layers: their applica-tion in physiology and medicine in Medical Physics,0. Glasser, Ed. Chicago, Year Book Publishers,1955, vol. 1, p. 777.
28. Bruck, E., M. Rapoport, and M. I. Rubin. Renalfunctions in the course of the nephrotic syn-drome in children. J. clin. Invest. 1954, 33, 699.
29. Folli, G., V. E. Pollak, R. T. W. Reid, C. L. Pirani,and R. M. Kark. Electronmicroscopic studies of
reversible glomerular lesions in the adult nephroticsyndrome. Ann. intern. Med. 1958, 49, 775.
30. Holland, W. W., J. R. Colley, and K. A. M. Moore.The nephrotic syndrome in children treated with acourse of prednisolone. Brit. med. J. 1958, 2, 479.
31. Vernier, R. L., M. G. Farquhar, J. G. Brunson, andR. A. Good. Chronic renal disease in children.Correlation of clinical findings with morphologicalcharacteristics seen by light and electron micros-copy. Amer. J. Dis. Child., 1958, 96, 306.
32. Johnson, J. R., and R. Reader. Prognosis in thenephrotic syndrome. A study with particularreference to the adult and older child. Aust. Ann.Med. 1959, 8, 200.
33. Vernier, R. L. Discussion in Renal Biopsy, a CibaFoundation Symposium, G. E. Wolstenholme andM. Cameron, Eds. Boston, Little, Brown, 1961, p.47.
34. Wolvius, D., and J. C. M. Verschure. The diagnosticvalue of the protein excretion pattern in varioustypes of proteinuria. J. clin. Path. 1957, 10, 80.
35. McCrory, W. W., M. Rapoport, and D. S. Fleischer.Estimation of severity of the nephrotic syndromein childhood as a guide to therapy and prognosis.Pediatrics 1959, 23, 861.
36. Lauson, H. D., C. W. Forman, H. McNamara, G.Mattar, and H. L. Barnett. The effect of corti-cotropin (ACTH) on glomerular permeability toalbumin in children with the nephrotic syndrome.J. clin. Invest. 1954, 33, 657.
37. Schreiner, G. E. The glomerular membrane in thenephrotic syndrome in Edema, Mechanisms andManagement, A Hahnemann Symposium on Saltand Water Retention, J. H. Moyer and M. Fuchs,Eds. Philadelphia, W. B. Saunders, 1960, p. 485.
38. Heymann, W., C. Gilkey, and M. Lewis. The prog-nostic significance of globulinuria in the nephroticsyndrome. Amer. J. Dis. Child. 1956, 91, 570.
39. Broch, 0. J., and E. Brodwall. Urinary proteins inrenal diseases. Acta med. scand. 1958, 160, 353.
2346