NEPHROLOGY ADVANCED PRACTITIONER SALARY … Nephrology Advanced... · Salary Survey Objectives...
26
NEPHROLOGY ADVANCED PRACTITIONER SALARY SURVEY Alexis Chettiar RN, MSN, ACNP-BC
Transcript of NEPHROLOGY ADVANCED PRACTITIONER SALARY … Nephrology Advanced... · Salary Survey Objectives...

NEPHROLOGY ADVANCED PRACTITIONER SALARY
SURVEY Alexis Chettiar RN, MSN, ACNP-BC

No financial interests or conflicts of interest to disclose

Background ■ CKD and ESRD are on the rise in the United states1
■ The number of medical graduates entering nephrology residencies is declining2
– 43% of US nephrology residency programs don’t fill all spots in 20143
■ Nephrology APs work across practice settings
■ Reimbursement systems unique to nephrology obscure AP revenue generation
– Traditional measures of productivity don’t accurately represent AP contribution
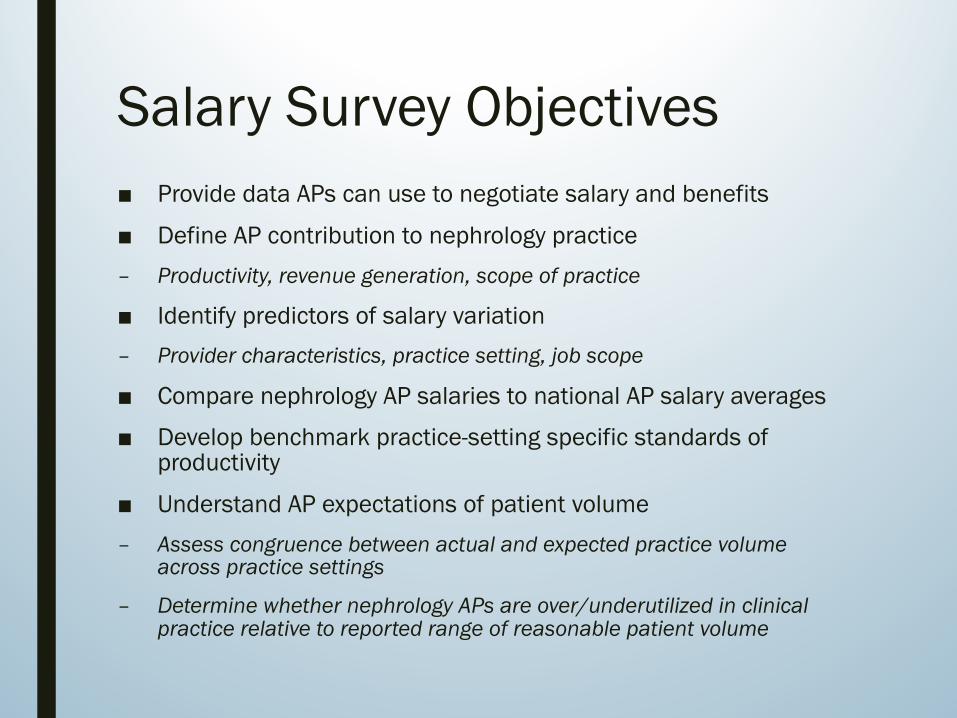
Salary Survey Objectives■ Provide data APs can use to negotiate salary and benefits
■ Define AP contribution to nephrology practice – Productivity, revenue generation, scope of practice
■ Identify predictors of salary variation– Provider characteristics, practice setting, job scope
■ Compare nephrology AP salaries to national AP salary averages
■ Develop benchmark practice-setting specific standards of productivity
■ Understand AP expectations of patient volume – Assess congruence between actual and expected practice volume
across practice settings
– Determine whether nephrology APs are over/underutilized in clinical practice relative to reported range of reasonable patient volume

Methods
■ Original survey developed by Kim Zuber PA-C■ Survey has been administered three times previously over
the last six years ■ Abbreviated survey developed with guidance from Dr. Susan
Chapman, an academic researcher experienced in survey development, administration and analysis
■ IRB approval obtained from University of California San Francisco
■ Survey was reviewed by a panel of nephrology APs for face and content validity
■ Data collected using Qualtrics survey tool■ Distributed to Nephrology Advanced Practitioners via professional
association listservs– PAs, Nurse Practitioners, Clinical Nurse Specialists

Methods■ Survey questions allow for free text to capture
responses outside of anticipated parameters
■ Content included the following domains– Demographics– Productivity/workload (actual and high/low estimate of reasonable
patient volume across practice settings)– Scope of practice– Compensation (wage and benefits)
■ Statistical analysis performed with STATA
Results
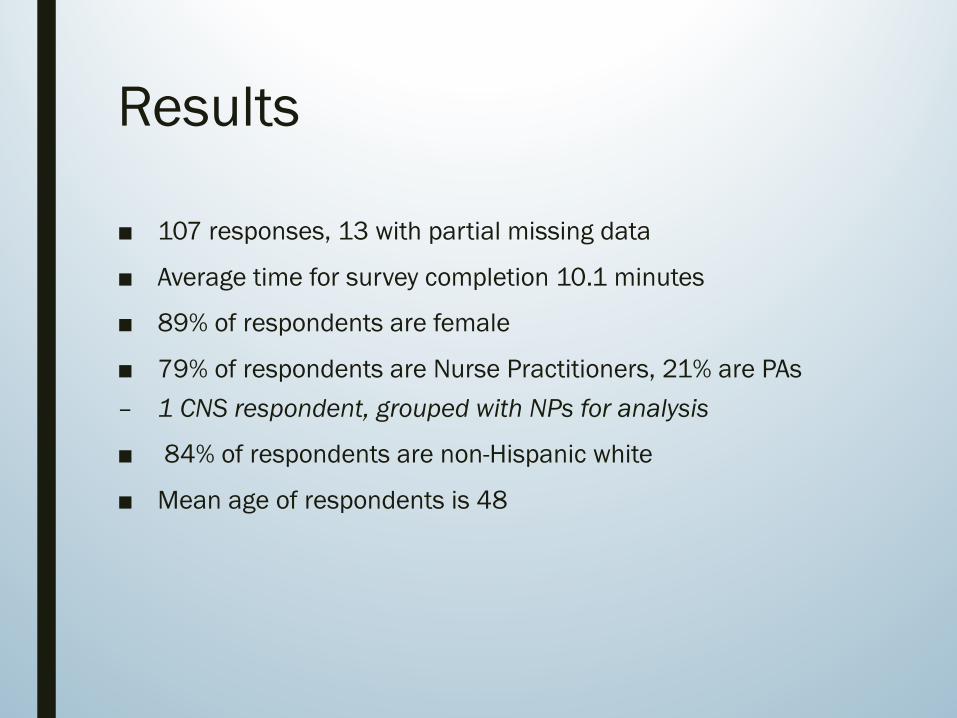
■ 107 responses, 13 with partial missing data
■ Average time for survey completion 10.1 minutes
■ 89% of respondents are female
■ 79% of respondents are Nurse Practitioners, 21% are PAs– 1 CNS respondent, grouped with NPs for analysis
■ 84% of respondents are non-Hispanic white
■ Mean age of respondents is 48

Respondent Characteristics
Age
0.01
.02
.03
.04
.05
Proportion
30 40 50 60 70age
Years Practicing in Nephrology
0.0
2.0
4.0
6.0
8P
rop
ort
ion
0 10 20 30Years Practicing in Nephrology

ANOVA Table of Salary Means by Characteristics of Provider and Practice Setting
Salary mean (SE) Salary mean (SE) Salary mean (SE) F (p)
Gender Female n=96103,363 (2288)
Male n=11100,218 (6079)
0.21 (.65)
Race Non-‐Hisp White n=90103,540 (2084)
Minority n=1799,454 (9009)
0.39 (.5)
Provider Type NP n=78103,546 (2581)
PA n=27104,777 (3788)
0.06 (.8)
Age Up to 35 n=22100,317 (5482)
35-‐50 n=28104,871 (3947)
>50 n=56102,230 (2790)
0.29 (.74)
Years in Nephrology 0-‐5 n=43100.939 (3856)
6-‐10 n=32103,578 (4451)
>10 n=31105,416 (2238)
0.39 (.67)
HRR Cost Quintile Low n=3298,955(3759)
High n=31103,525 (4001)
1.07 (.31)
Practice Size Small (1-‐5) n=18106,456 (5889)
Med (6-‐12) n=31101,897 (3757)
Large (>12) n=2198,574 (4112)
0.65 (.5)

■ Correlation between AP salary and regional medical spending
– Dartmouth Atlas hospital referral region (HRR) used to define spending quintiles
Dartmouth Atlas Hospital Referral Regions

Multivariable Regression Analysis of Salary Predictors
Characteristic (Reference Group) Salary N=98β coefficient (p value)
Benefits n=94β coefficient (p value )
Salary and Benefits n=94β coefficient (p value)
Provider Characteristics
Gender (Female) 2115 (.78) -‐680 (.86) 1436 (.88)
Age -‐120 (.54) -‐26 (.78) -‐147 (.54)
Race (White) -‐5097 (.4) -‐5898 (.05)* -‐10,993 (.14)
Provider Type (Physician Assistant)
112 (.98) 2185 (.43) 2297 (.74)
Years in Nephrology 376 (.28) 204 (.24) 581 (.18)
F, R-‐squared .48, .027 1.23, .065 .95, .051
Practice Setting
Practice Size -‐463 (.14) 32 (.79) -‐431 (.24)
Medicare Spending, HRR quintile 1315 (.43) 625 (.34) 1941 (.33)
F, R-‐squared 1.42, .043 0.51, .602 1.18, .034
Job Scope
Hemodialysis Unit -‐10,535 (.11) -‐624 (.83) -‐11158 (.15)
On-‐Call -‐6241 (.17) -‐709 (.74) -‐6951 (.2)
HDU Comprehensive Visits -‐900 (.84) 1764 (.4) 864 (.87)
Office 2488 (.17) 2888 (.16) 5377 (.3)
Peritoneal Dialysis Unit 2628 (.54) 1079 (.59) 3707 (.47)
Hospital 4699 (.27) 5193 (.01)* 9893 (.05)*
Administration 6005 (.16) 4779 (.02)* 10,784 (.04)*
F, R-‐squared 1.78, .121 2.62, .169 2.59, .167

Additional Practice Settings Reported■ Research (n=5)– 3 providers report participating in non-academic research
■ Post-acute Rehab (n=2)
■ Free clinic (n=1)
■ Transplant (n=1)
■ Tele-health (n=1)
■ Occupational health (n=1)

103,546
101,621
104,776
95,820
0 20,000 40,000 60,000 80,000 100,000 120,000
Nephrology NP salary
National NP salary 2014
Nephrology PA salary
National PA salary 2014
Nephrology NP and PA Salaries Compared with National Averages

81%
4%
10%
5%
Nephrology AP Compensation
Salary $103,860
Health insurance value $5159 (for single coverage)
Total paid time off $13,630 (vacation, sicktime, holiday)
Retirement benefit $5941 (401k, 403b, pension)
Total average annual compensation $128,590

0%
10%
20%
30%
40%
50%
60%
70%
80%
90%
100%
Health insurance
High deductible health plan
Employee contribution
96%
44%
65%
Health Insurance Benefits

0% 10% 20% 30% 40% 50% 60% 70% 80% 90% 100%
OTHER BENEFITS
SICK TIME
PAID TIME OFF
VACATION TIME
LIFE INSURANCE
ANY EMPLOYER SPONSORED RETIREMENT
OTHER RETIREMENT PLAN
PENSION PLAN
401K MATCH
PTO TO COMPLETE CME
CME REIMBURSEMENT
54%
38%
73%
30%
40%
98%
27%
17%
72%
88%
94%
Nephrology AP Benefits

Additional Benefits
■ License renewal■ Travel for conferences■ Higher education tuition
subsidy■ Membership to
professional organizations■ Journal and UpToDate
subscriptions■ Malpractice insurance■ Dental insurance■ Disability insurance
■ Phone ■ iPad■ Lab coats■ Costco membership■ Pay for sick leave not taken■ Mileage■ Car allowance■ Expense account■ Bonus Pay

Nephrology AP Practice Settings/Job Scope
Dialysis center Office Comprehensive visits at HDU
Hospital Peritoneal dialysis clinic
Call Home hemodialysis
clinic
85%
71%
53%
31% 30%
23%20%

Work Hours
■ 73% of Nephrology AP FTEs work more than 40 hours per week
■ Average number of hours/wk for FTEs (working 40 or >hrs/wk) is 45.2
81%
15%
3%
Full Time/Part Time Breakdown40 hours or greater 32-39 hours <32 hours

0
2
4
6
8
10
12Pa
tient
s pe
r hou
r
Actual and Ideal Number of Patients per Hour Aross Practice Settings
Ideal high mean
Actual mean 95%CI
Actual mean
Ideal low mean

3.5
3.3
3.9
1.6
2.7
1
1.5
2
2.5
3
3.5
4
4.5
5
Hemodialysis limited visits
Hemodialysis comprehensive visits
Home hemo/peritoneal dialysis visits
Office visits Hospital visits
Revenue to cost ratio at mean productivity
Revenue to cost ratio 95%CI
Ratio of Revenue Generated by Nephrology APs to Nephrology AP Employment Cost Across Practice Settings
Revenue generated by FT AP calculated in hospital, office and dialysis center settings based on average actual practice volume and current national average Medicare reimbursement rates
*Revenue adjusted for national average overhead costs in medical practice4
*Salary adjusted for non-comp costs to employer (payroll taxes, benefits, etc)5
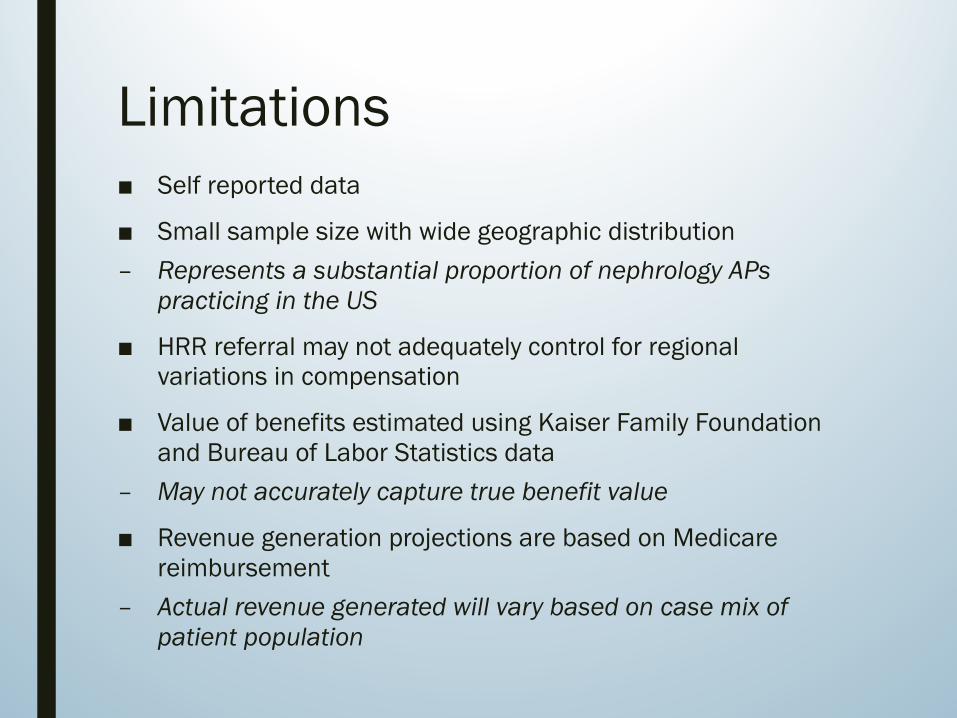
Limitations■ Self reported data
■ Small sample size with wide geographic distribution– Represents a substantial proportion of nephrology APs
practicing in the US
■ HRR referral may not adequately control for regional variations in compensation
■ Value of benefits estimated using Kaiser Family Foundation and Bureau of Labor Statistics data
– May not accurately capture true benefit value
■ Revenue generation projections are based on Medicare reimbursement
– Actual revenue generated will vary based on case mix of patient population

Conclusions
■ Non-Hispanic white race has a statistically significant association with higher value benefits and higher adjusted salary
■ Working in administration or hospital in hospital is associated with significant higher compensation (benefits, salary/benefits)
■ Nephrology APs work in a wide range of practice settings
■ Nephrology AP salaries are consistent with AP salaries nationwide
■ The majority of APs have HDHP and/or pay for part of their health insurance premiums

Conclusions
■ Nephrology APs report that actual patient volume is on the lower end of their self-defined ‘reasonable range’ in most practice settings
■ Nephrology APs can generate revenue up to 3x employment costs
■ Reimbursement to employment cost ratio is highest for dialysis, lowest in the office setting
■ Nephrology APs are a hard working bunch!

References[1] “Kidney Disease Statistics for the United States.” [Online]. Available:
http://www.niddk.nih.gov/health-information/health-statistics/Pages/kidney-disease-statistics-united-states.aspx. [Accessed: 26-Apr-2016].
[2] M. U. Sharif, M. E. Elsayed, and A. G. Stack, “The global nephrology workforce: emerging threats and potential solutions!,” Clin. Kidney J., vol. 9, no. 1, pp. 11–22, Feb. 2016.
[3] AJKDblog, “Nephrology Workforce Crisis: Don’t Forget International Medical Graduates (IMG),” AJKD Blog, 11-Dec-2014. .
[4] “AANP - Employment Negotiations.” [Online]. Available: https://www.aanp.org/practice/reimbursement/68articles/579employment-negotiations . [Accessed: 26-Apr-2016].
[5] Hadzima, J. "How Much Does An Employee Cost ” Boston Business Journal, [Online]. Available: http://core.qzu.edu.cn/NR/rdonlyres/Sloan-School-of-Management/15-975January--IAP--2005/508DA86B-42C1-4131-A07C-63A1F8049996/0/art33.pdf [Accessed: 26-Apr-2016] .

Questions?Comments?
Suggestions for next years survey….