neJrs I - OJP
98
___ -'-- .--- --- n \ I I National Criminal Justice Reference Service neJrs This microfiche was produced from documents received for inclusion in the NCJRS data base. Since NCJRS cannot exercise control over the physical condition of the documents submitted, the individual frame quality will vary. The resolution chart on this frame may be used to evaluate the document quality. \\\\\1. 0 11111 2 . 5 mi£ 1 __ - W .... cg r.:: ... u \\\\\ 1.25 \\1\\1.4 \\\\\ \.6 MICROCOPY RESOLUTION TEST CHART NATIONAL BUREAU OF STANDARDS-1963-A Microfilming procedures used to create this fiche comply with the standards set forth in 41CFR 101-11.504. Points of view or opinions stated in this document are those of the author(s) and do not represent the official position or policies of the U. S. Department of Justice . .".. ..... J National Institute of Justice United States Department of Justice Washington, D. C. 20531 I 6-6-83 \ --- - U.S. Department of Justice National Institute of Justice 75925 This document been reproduced exactly as received from the pers?n or organization originating it. Points of view or op;nions stated In thiS tho,s.e of the authors and do not necessarily the offiCial position or policies of the National Institute of ushce. Permission to reproduce this copyrighted material has been granted by , r General to the National Criminal Justice Reference Service (NCJRS). Further outside of the NCJRS system requires permis- sion of the cOPYright owner. ta SOLICITOR GENERAL If you have issues viewing or accessing this file contact us at NCJRS.gov.
Transcript of neJrs I - OJP

____ ~F.~·-- -'-- .--- ~~- ---
n \
I I National Criminal Justice Reference Service
~~----------------------------------------------------------
neJrs This microfiche was produced from documents received for inclusion in the NCJRS data base. Since NCJRS cannot exercise control over the physical condition of the documents submitted, the individual frame quality will vary. The resolution chart on this frame may be used to evaluate the document quality.
\\\\\1. 0 m~ ~III~£ 11111
2.5
mi£ 1 __ -
~ \\\~3.2 W
~~~ .... cg
~~
IIIII~ ~ r.:: ... u IU~LI.
\\\\\ 1.25 \\1\\1.4 \\\\\ \.6
MICROCOPY RESOLUTION TEST CHART NATIONAL BUREAU OF STANDARDS-1963-A
Microfilming procedures used to create this fiche comply with the standards set forth in 41CFR 101-11.504.
Points of view or opinions stated in this document are those of the author(s) and do not represent the official position or policies of the U. S. Department of Justice .
.".. ..... J
National Institute of Justice United States Department of Justice Washington, D. C. 20531
I
6-6-83 \
--- - ------~
U.S. Department of Justice National Institute of Justice
75925
This document ~as. been reproduced exactly as received from the pers?n or organization originating it. Points of view or op;nions stated In thiS documen~ ~re tho,s.e of the authors and do not necessarily
Jrepr~sent the offiCial position or policies of the National Institute of ushce.
Permission to reproduce this copyrighted material has been granted by ,
r General to the National Criminal Justice Reference Service (NCJRS).
Further reprodu~lion outside of the NCJRS system requires permission of the cOPYright owner.
ta SOLICITOR GENERAL
If you have issues viewing or accessing this file contact us at NCJRS.gov.

I I I f
f
I I
[
L L
L [
L
CROSS ~ PROVINCE INMATE SURVEY:
Inmate Population
in
Alberta Correctional Institutions
(March 31, 1977)
By: Mary Shanes
With the assistance of: P. T~~,$t.:·
Consultation from: W. Hoffmann
Research and Planning
SoltcttElr General
December ,1977 ' .... ,.'1.'
NCJRS
MAR 12 1981
ACQUIf" 'NS
I 1
I 1 I
I .1
f F t
II
\ 11 LiJ,
I I I I I J I J r "
.-j
'r ! f ~ i~
Special thanks to:
Susan Cribbs, Marianne Nielsen, Kathy Roczkowskyj, and Bl4enda Tempest
for their assistance with the organization and compilation of data.
~Jna Paley for her secretarial work.
The Supervisors and Staff of the Records Departments of all Alberta
Correctional Institutions for the time spent in collecting the data
and for their co-operation in providing additional information as requested.

r r r f f
f
r r I
f r L
f [
[
f~~
[
[
l.
<8
--~-------
The opinions expressed are those of the author and do not necessarily
represent those of the Ministry of the Alberta Solicitor General.
~ I; I I'
, ~ ~
~{,,,, \ i i{
T c ( l'
EXECUTIVE SUMMARY
1. This report, the third Cross-Province Inmate Survey to be compiled
by the Research and Planning Division of the Alberta, Solicitor General's
Department, examined the inmate population incarcerated in Alberta
correctional institutions on March 31, 1977 (a total of 1740 inmates).
The two previous studies examined the inmate populations incarcerated on
March 31, 1976 and July 16, 1976.
2.. The study was concerned with describing two major groups of inmates,
the sentenced and the remanded populations, with respect to a number of
socio-demographic and inmate-related variables. Four sub-groups of the
sentenced population, the young offenders, the sentenced native population,
the short-term inmate population, and the fine defaulters, were also
analyzed in some detail.
3. The socia-demographic variables considered for analysis included
age, education, occupation, native status, forwarding address (rural
urban residence), and self-reported alcohol use.
4. A descr'iption of inmate characteristics for each inmate population
was provided by an examination of the following: most serious sentence
offence, length of aggregate sentence, number of commitments (recidivism),
reason for incarceration (default of fine payment or mandatory sentence),
location within the institutional setting (for example, institution,
camp, temporary absence or community ."esidential centre), security
rating, for the total sentenced population ~nly, number.of days r~maining
to serve from March 31, 1977'.until release (remission) date, and for

r {
i 1
f
J
f
f
f
I I L I I I ~ ..
L
remanded inmates, number of days on remand as of March 31, 1977.
5. Significant findings, explored in greater detail in the data
analysis, can best be summarized as follows:
Sentenced Inmate Population
(i) A total of 1222 were sentenced on March 31, 1977.
(ii) Approximately 65% were twenty-five years of age or younger.
(iii) This group was characterized by a low level of educational attainment and lack of occupational skills.
(iv) One-third of the sentenced inmates were native.
(v) Slightly more than one-quarter reported a problem with alcohol use.
(vi) The majority of the sentenced inmate population were incarcerated on property offences, had aggregate sentences of less than one year, and had at least one previous commitment.
(vii) On March 31, 1977, three-quarters of the sentenced inmates were located within the institution itself and approximately 80% were classified as minimum security.
(viii) As of March 31,1977, approximately 57% had less than three months remaining until their release date.
Young Offenders
(1)
(i i )
The young offender inmate group (18 years of age and younger) comprised 21.6% of the sentenced population.
No ~ignificant differences were found between this group and the rest of the sentenced inmates with respect to educational attainment, native status, or rural-urban residence.
(iii) A significant proportion of both groups reported no occupational skills and no problem with alcohol use. A smaller percentage of young offenders reported problematic use of alcohol.
(iv) The two groups differed with respect to two major offence types. The young offenders were significantly more likely to be incarcerated for breaking and entering and less likely to be serving a sentence· for an alcohol-related crime.
T
J I I J I
I 1 I J
1 1
(v) Approximately 50% of the young offenders were recidivists (two or more commitments).
(vi) The young offender group were less likely than the older inmates to be incarcerated in default of fine payment.
Sentenced Native Population
(i) In comparison to the non-native inmates, a greater proportion of the sentenced native population were older, more poorly educated, and occup?ti6nally~ unskilled. They were also more likely to reside in rural areas and to reporia problem with al cohol use •.
(i1) C9nsideration of socio-demographic data indicated no significant dlfferences between tne status .Indian and Metis, non-status Indian groups.
(iii) However, analysis of a number of inmate characteristics indic,ated differences not.9nly between the sentenced native and non-native populations but a1so between the status Indian group and the Metis, non-status Indian group.
(1v) In comparison to both the Metis, non-status Indian group and the non-natives, the status Indian group was Significantly more likely to be incarcerated for an alcohol offence, to have an aggregate sentence of three months or less, and to be serving a sentence in default of fine payment.
(v) Both the status Indian group and the Metis, non-status Indian group were found to be highly recidivist (a significant proportion of each group had five or more commitments).
(vi) On March 31, 1977, approximately three-quarters of both native groups and the non-natives were located within the institution itself (rather than at camp, on a temporary absehce or at a community residential centre).
Short-Term Inmate Population
(i) Inmates with short-tet'm sentences (three months or less) comprised 23.3% of the sentenced population.
(ii) These inmates tended to be older (approximately 45% were twentysix years of age or older), poorly educated, and occupationally unski lled.

1
1
--------
(iii) Status Indians, in comparison to the Metis, non-status Indian group and the non-natives, were significantly more likely to be serving a sentence of three months or less.
(iv)
(v)
(vi)
Short-termers were slightly more likely to report a problem with alcohol use than those serving longer sentences.
These inmates were most likely to be incarcerated for an alcohol offence, an offence such as a technical violation"or a HTA or MVAA'violation, or for minor theft.
Short-termers were more likely than the re~t of thesen~enced P?pu1at1on'to be either on their first or on the1r f1fth or more comm1tment.
(vi 1) S11 ghtly more than one-th1 rd were selrving a sentence in default of f1ne paymen,t ..
(viii) These inmates were more likely than those with an aggregate sentence of over three months to be located in the institution on March 31, 1977.
Fine Defaul ters
(1)
(i i)
On March 31,1977,9.1% (111 inmates) of the sentenced inmates were incarcerated in defaul t of fine payment.
These inmates were found to be older, poorly educated, and occupationally unskilled.
(iii) A greater proportion of status Indians were incarcerated in default of fine payment rather than for a mandatory sentence.
(i v)
(v)
(vi)
These inmates were more Ii kely than the rest of the sentenced population to report a problein with alcohol lise.
Fine defaulters were more likely to be incarcerated for an alcohol offence or a crime such as a technical violation or a HTA or MVAA violation.
Over 90% of fine defaulters had an aggregate sentence of three months or less.
(vii) These inmates were found to be highly recidiV'ist. More than one-quarter had five or more commitments.
Remanded Inmate. Population
(i) A total of 394 inmates were remanded in custody on March 31, 1977.
I I
I L.;
(ii)
(iii)
(i v)
(v)
Discussion of the remanded inmate population was restricted to a consideration of remanded inmates at FSCI and CRC (364 inmates) .
There were no significant differences between the remanded inmates at FSCI and CRC with respect to age, education, or occupation: approximately 60% were twenty-five years of age or younger, approximately 40% had less than Grade 10 education, and slightly more than 58% reported no Occupational skills.
The findings indicated that 27.5% of the remanded population at FSCI were native in comparison to 14~ 1% at CRC.
The majority of remanded inmates at both FSCI and CRC reported a forwarding address in an urban centre.
(vi) Approximately one-quarter reported a problem with alcohol use. Considerable discrepancy, however, was noted between the two correctional institutions.
(vii) A significant proportion of this inmate population was incarcerated for a most serious offence in the violent crime cate~ory.
(viii) As of March 31,1977, approximately 20% of the remanded population at FSCI and CRC had been on remand for more than three months.
(ix) Variation was noted in the security ratings assigned to remanded inmates at FSCI and CRC. Almost all remanded inmates at FSCI (90.,8%) were classified as maximum security. The proportion of remanded inmates with a similar rating at CRC was considerably less (26.7%).

I r
f
r
r r r
f
f
-~~-------.--------~------------------------------------~-------
TABLE OF CONTENTS
Li s t of Ta b 1 es .•.•.....• ,,""""""""""""" b " " " " " " " " " " " " " " " " " " " " " " " "
Li s t of Fi gures " " " " " " " " " " " " " " " " " " " " " " <:I " " " " " " " " " " " " " " " " " " " " " " " " "
INTRODUCTION " " " " " " " " " " " " • " e " " " " " " " " " " " " " " " " " " " " " " " lit " " " " " " " " " " " "
METHODOLOGY """".,,"",,"" II " " " " " " " " " " " " " " " " " " " " " " " " " " " " " " " " " " " " " " " "
DATA ANALYSIS
I Preliminary Remarks " " . " " " " " " " " " " " " " " " " " " " " " " " " " " " " " " " " " " " " "
II Significant Findings
A. Sentenced Inmate Population " " " " " " " " " " " " " " " " " " " " " " " " " " " "
(a) Socio-Demographic Background •.•......••..••.•..•••
(b) Inmate Characteristics •.•••...•......••••.......••
1. Young Offenders """"""""""""""""""""""""""""""""""""
(a) Socio-Demographic Background .••.•.•.•.•..•..•.
(b) Inmate Characteristics ........................ 2. Sentenced Native Population •••••• II •••••••••••••••••
(a) Socio-Demographic Background ••....••••••...••.
(b) Inmate Characteristics ••.•......•.•..••.....••
3. Short-term Inmate Population •••••...•.•.•......•...
(a) Socio-Demographic Background •.•..••..........•
(b) Inmate Characteristics ..•••.•..••.•••.........
i
iii
ix
1
3
7
4. Fine Defaulters ··················a.····· ....... a ••••
(a) Socio-Demographic Background .••..••.....•....•
(b) Inmate Characteristics •.....•.•..•......•...•.
B. Remanded Inmate Population .••.•.•.•.•..•••....••....•..
(a) Socio-Demographic Background •....•.•.••......•..•..
(b) Inmate Characteristics .•....•.•.....•..........•.•.
SUMMARY AND CONCLUSIONS " " " " " " " " " " " " " " " " " " " " " " " " " " " " " " " " " " " " " " " "
APPENDIX I:
Page
64
64
65
70
71
72
76
Socio-Demographic Characteristics of Sentenced Inmate Population' Young Offenders; Sentenced Native Population; Short-Term Inmate Population; Flne Defaulters; Remanded Inmate Population (March 31, 1'977).... 86
APPENDIX II:
Additional Data on the Sentenced Status Indian Population (March 31, 1977) •••• ... .••••. ..•...... .•. .•• ....• .... ... ... .... 114
APPENDIX II I:
Coding Manual (CPIS-3) (includes: Offence Codes, Band Names for Treaty Indians, and list of Community Residential Centres) 121
ii

- ~--- ~~---------.------------------------------
LIST OF TABLES Table Number Title Page
13 Security Rating by Time Remaining to Serve for 33 Table Number Title Page Sentenced Inmates in Alberta Correctional Institutions
14 Time Remaining to Serve from March 31,1977 34 I.
for Sentenced Inmates in Alberta Correctional 1 Number of Inmates in Alberta Correctional 9 Institutions Institutions and Percent of the Total 15 Inmate Population
Time Remaining to Serve by Location for 35 Sentenced Inmates in Alberta Correctional 2 Status of Inmates in Alberta Correctional 10 Institutions Institutions (March 31, 1977) 16 ~ge by Offence Type for Sentenced Inmates 40 3 Status of Inmates in Alberta Correctional 12 1n Alberta Correctional Institutions
f Institutions (March 31, 1976)
4 Status of Inmates in Alberta Correctional 13 17 Age by Reason for Incarceration for 41 Institutions (July 16, 1976) Sentenced Inmates in Alberta Correctional Institutions 5 Number and Percentage of Sentenced Inmates 15
at each Alberta Correctional Institution 18 Age by Aggregate Sentence for Sentenced 41 Inmates in Alberta Correctional Institutions 6 Most Serious Offence Type for Sentenced 21
Inmates in Alberta Correctional Institutions 19 Age by Recidivism for Sentenced Inmates 42 7 Aggregate Sentence for Sentenced Inmates in 22 in Alberta Correctional Institutions Alberta Correctional Institutions 20 il Native Status of Sentenced Inmates in Alberta 43 8 Number of Commitments for Sentenced Inmates 25 j CorrectionaJ Institutions in Alberta Correctional Institutions 21 ~ Native Status of Sentenced Inmates in each 44 9 Reason for Incarceration for Sentenced Inmates 28 :) Alberta Corretti6na1 Institution in Alberta Correctional Institutions 22 Native Status by Offence Type for Sentenced 49
I 10 Reason for Incarceration for Sentenced Inmates 29 L Inmates in Alberta Correctional Institutions in Alberta Correctional Institutions (March
(March 31, 1977) 31,1976 and July 16,1976) .,~ 23 Native Status by Offence Type for Sentenced 1 50 I 11 Location of Sentenced Inmates in Alberta 30
Inmates in Alberta Correctional Institutions Correctional Institutions (March 31!) 1976)
f~1<;r
! I
24 Native Status by Offence Type for Sentenced 12 Security Rating for the Sentenced Population 32 I
50 :1 in Alberta Correctional Institutions
Inmates in Alberta Correctional Institutions I "'~ (~llJ 1 Y 1 6, 1 976 ) I j
I .~
iv iii
I [ I
{
. , ~-------- - _. ---

~~-~"~ .. ------
T i
,.:.;..,.
Table Number Title Page Table Number Title Page
25 Native Status by Offence Type for Sentenced 52 37 Number and Percentage of Remanded Inmates 70 Inmates in Alberta Correctional Institutions in FSCI and CRC (March 31, 1977)
38 Most Serious Offence Type for Remanded 73 Inmates 26 Native Status by Aggregate Sentence for 53 at FSCI and CRC Sentenced Inmates in Alberta Correctional J ~
Institutions 39 Number of Days on Remand as of March 31, 1977 74 for Remanded Inmates at FSCI and CRC 27 Native Status by Number of Commitments for 55
Sentenced Inmates in Alberta Correctional 40 Security Rating of Remanded Inmates at FSCI 75 Institutions and CRC
28 Native Status by Reason for Incarceration 56 41 Age of Sentenced Inmates in Alberta Correctional 88 for Sentenced Inmates in Alberta Correctional Institutions (March 31, 1977) I Institutions
42 Age of Sentenced Inmates in Alberta Correctional 89 29 Native Status by Location for Sentenced 57 Institutions (March 31, 1976 and July 16, 1976) Inmates in Alberta Correctional Institutions
60 43 Education Level of Sentenced Inmates in Alberta 91 30 Length of Sentence by Offence Type for Correctional Institutions (March 31, 1977) Sentenced Inmates in Alberta Correctional
Institutions 44 Education Level of Sentenced Inmates in Alberta 92 Length of Sentence by Recidivism for Sentenced 62 Correctional Institutions (March 31, 1976 and 31
July 16, 1976) Inmates .in Alberta Correctional Institutions
45 Occupation of Sentenced Inmates in Alberta 93 63 Correctional Institutions (March 31, 1977) 32 Length of Sentence by Reason for Incarceration
for Sentenced Inmates in Alberta Correctional 46 Occupation of Sentenced Inmates in Alberta 94 Institutions Correctional Institutions (March 31,1976;
Length of Sentence by Location for Sentenced 63 July 16,1976; March 31,1977) 33 Inmates in Alberta Correctional Institutions 47 Native Status of Sentenced Inmates in Alberta 95
34 Reason for Incarceration by Offence Type for 66 Correctional Institutions Sentenced Inmates in Alberta Correctional 48 Forwarding Address of Sentenced Inmates in 97 Institutions
Alberta Correctional Institutions 35 Reason for Incarceration by Aggregate Sentence 68
49 Alcohol Use of the Sentenced Inmate Population 98 for Sentenced Inmates in Alberta Correctional at Alberta Correctional Institutions Institutions I
i
I 50 Age by Education for Sentenced Inmates in . 99 36 Reason for Incarceration by Recidivism for 69
Alberta Correctional Institutions Sentenced Inmates in Alberta Correctional Institutions n'
\ ,! '
V
~ vi r ;l
[1

{
f
[
L
~ ..
~j ;u
Table Number
51
52
53
54
55
56
57
58
59
60
61
62
63
Title
Age by Native Status for Sentenced Inmates in Alberta Correctional Institutions
Age by Occupation for Sentenced Inmates in Alberta Correctional Institutions
Age by Alcohol Use for Sente~c~d.Inmates in Alberta Correctional Inst,tutlons '
Native Status by Age for Sentenced Inmates in Alberta Correctional Institutions
Native Status by Education for Sentenced Inwates in Alberta Correctional Institutions
Native Status by Occupation for Sentenced Inmates in Alberta Correctional Institutions
Native Status by Forwarding Address for Sentenced Inmates in Alberta Correctional Institutions
Native Status by Alcohol Use for Sentenced Inmates in Alberta Correctional Institutions
Length of Sentence by Age for Sentenced Inmates in Alberta Correctional Institutions
Length of Sentence by Education for Sentenced Inmates in Alberta Correctional Institutions
Length of Sentence by Native Status for Sentenced Inmates in Alberta Correctional Institutions
Length of Sentence by Alcohol Use for Sentenced Inmates in Alberta Correctional Institutions
Reason for Incarceration by Age for Sentenced Inmates in Alberta Correctional Institutions
vii
Page
99
100
100
101
102
103
104
104
105
106
107
107
108
i ~
! ,~ . [.
Table Number
64
65
66
67
68
69
70
71
72
73
74
75
Title
Reason for Incarce'ration by Education for Sentenced Inmates in Alberta Correctional Institutions
Reason for Incarceration by Occupation for Sentenced Inmates in Alberta Correctional Im;tituti ons
Reason for Incarceration by Native Status for Sentenced Inmates in Alberta Correctional Institutions
Reason for Incarceration by Alcohol Use for Sentenced Inmates in Alberta Correctional Institutions
Native Status of Remanded Inmates at FSCI and CRC
Forwarding Address of Remanded Inmates at FSCI and eRC
Alcohol Use of Remanded Inmates at FSCI and CRC
Native Band by Number (N) of Sentenced Status Indians in Alberta Correctional Institutions (March 31, 1977)
Native Band by Socia-Demographic Characteristics (Occupation; Education) for Sentenced Status Indians in Alberta Correctional Institutions (March 31, 1977)
Native Band by Offence Type for Sentenced Status Indians in Alberta Correctional Institutions
Native Band by Aggregate Sentence for Sentenced Status Indians in Alberta Correctional Institutions
Native Band by Inmate Characteristics (Number of Commitments and Reason for Present Incarceration) for Sentenced Status Indians in Alberta Correctional Institutions (March 31, 1977)
viii
Page
109
110
111
111
112
112
113
115
117
118
119
120
. ~- - --------_.-
...

-~ -- - ~--,------
--------------------------.--------~
LIST OF FIGURES
Fi gure Number Title Page
12 Mean and Median Age for Sentenced Inmates in 87 Figure Number Title Page
Alberta Correctional Institutions (March 31,1977) 13 Mean Education Level of Sentenced Inmates in 90 Alberta Correctional Institutions
1 Status of Inmates in Alberta Correctional 11 (March 31, 1977) Institutions (March 31,1977)
14 Native Status of Sentenced Inmates in Alberta 96 2 Mean and Median Aggregate Sentence for 23
Correctional Institutions (March 31, 1977) Sentenced Inmates in Alberta Correctional Institutions
15 Mean Age by Native Status for Sentenced Inmates 101 in Alberta Correctional Institutions 3 Mean Number of Commitments for Sentenced 26
Inmates in Alberta Correctional Institutions 16 Mean Education by Native Status for Sentenced 102 Inmates in Alberta Correctional Institutions
4 Age of Sentenced Inmates in Alberta 37 Correctional Institutions 17 Occupational Skills of Sentenced Inmates in 103 Alberta Correctional Institutions 5 Mean Number of Commitments by Age for 42 Sentenced Inmates in Alberta Correctional 18 Mean Age by Length of Sentence for Sentenced 105
Institutions Inmates in Alberta Correctional Institutions 6 Native Status of Sentenced Inmates in Alberta 45 19 Mean Education by Length of Sentence for 106
Correctional Institutions (~1arch 31, 1976; Sentenced Inmates in Alberta Correctional I July 16, 1976; March 31, 1977) Institutions 7 Mean Aggregate Sentence by Native Status for 54 20 Mean Age by Reason for Incarceration for 108
f ' Sentenced Inmates in Alberta Correctional Sentenced Inmates in Alberta Correctional Institutions Institutions 8 Mean Number of Commitments by Native Status 54 21 Mean Education by Reason for Incarceration 109
for Sentenced Inmates in Alberta Correctional for Sentenced Inmates in Alberta Correctional Institutions Institutions 9 'Mean Number of Commitments by Length of 62
Sentence for Sentenced Inmates in Alberta Correctional Institutions
10 Mean Aggregate Sentence by Reason for Incarce- 68 ration for Sentenced Inmates in Alberta Correctional Institutions
~ 11 Mean Number of Commitments by Reason for 69 ~ ,
Incarceration for Sentenced Inmates in Alberta ;r' Correctional Institutions 0\
L ix
x IT' (I
L
" A

".c:-::=::-::---~~~' ._- ~ ~- ---~- - ~-----r---------------~
[
t
CROSS-PROVINCE INMATE SURVEY:
INMATE POPULATION IN ALBERTA CORRECTIONAL INSTITUTIONS (MARCH 31,1977)
INTRODUCTION
This report, prepared by the Research and Planning Division
of the Alberta Solicitor Generalis Department, examines the inmate
population incarcerated in Alberta correctional institutions on
March 31,1977. This is the third Cross-Province Inmate Survey (CPIS-3)
to be compiled by the department. The two previous studies examined
the inmate populations incarcerated on March 31, 1976 and July 16, 1976.
Reference will be made to these studies throughout this report in order
to point out any differences in the trends found in the three surveys.
For the purpose of this analysis, it was decided that inmates
would be categorized according to their status on March 31, 1977.
The study focused upon socia-demographic and inmate characteristics of
two major groups of inmates, the sentenced population and the remanded
population. Analysis was restricted to the examination of the character
istics of those incarcerated under provincial jurisdiction. The number
and location of federal inmates will be presented in the section of
the II Data Analysis" entitled "Prel iminary Remarks ".
A description of data collection procedures and the variables
to be exami ned wi 11 be outl i ned in the "Methodo 1 ogy" secti on of the
report.
1
T .,
I ~ . I !
U
2
The following section entitled "Data Analysis" will provide a
discussion of the findings of the analysis undertaken for this study.
Both of the major "jnmate population groups (that is, the sentenced
inmate population and the remanded inmates) will be discussed in
detail. In addition, further information will be made available with
respect to four sub-groups of sentenced inmates: the young offender
population (inmates 18 years and younger), sentenced native inmates,
the short-term sentenced population (inmates serving a sentence of
three months or less), and f'ine defaulters (inmates incarcerated solely
because they did not pay a fine).
Summary data on all inmate populations discussed in the report
will be made available in the final section. Additional relevant
information will be prov'ided in the Appendices found at the conclusion
of the study.
-
--~- ,.--------- ---.---------------
3
METHODOLOGY
The population examined in this study included all inmates
incarcerated on March 31, 1977 at any of the following provincial
correctional institutions: Fort Saskatchewan Correctional Institution
(FSCI), Fort Saskatchewan Correctional Institution: Womenls Side
(FSCr(W)), Peace River Correctional Institution (PRCI), Lethbridge
Correctional Institution (LCI), Calgary Correctional Institution (CCI),
Belmont Community Corrections Centre (BCCe), Nordegg Base Forestry
Camp (NBFC), and Calgary Remand Centre (CRC).
Data for the Malrch 31, 1977 Cross-Provi nce Inmate Survey was
collected with the assistance of the Records Departments of these
correctional institutions. Standardized information on all inmates
incarcerated on March 31, 1977 was available from admission forms
(SG 13-028) completed by Records staff when an inmate was first
received at the correctional institution. This material and a
supplementary inmate list giving each inmatels status and security
rating on March 31, 1977 was compiled by Records staff and sent to the
* Solicitor Generalis office in Edmonton to be coded and analyzed for
this report by Research and Planning staff.
On the basis of the information received from the correctional
institutions, the inmate population incarcerated on March 31,1977 was
divided into three status groups: the sentenced inmate population,
the remanded inmate population, and the penitentiary inmate population.
* A copy of the coding manual used for this study is provided in Appendi x II!.
l
4
The sentenced inmate population consisted of all inmates
incarcerated solely because they were serving a sentence of less than
two yeal"S.
The remanded inmate population was comprised of all inmates
remanded in custody, sentenced and remanded, committed to trial, being
held for immigration, or awaiting appeal. Inmates who were sentenced
and also remanded on additional charges were included in this category
since they were considered to have a IIremandli status by the Records
Departments of the correctional institutions.
The penitentiary inmate population consisted of inmates sentenced
to two years or longer who were awaiting transfer to a penitentiary
or who were serving their sentence in an Alberta correctional institution
under federal-provincial agreement. This group also included penitentiary
inmates who had been returned to a provincial correctional institution
for court appearance (for further charges or appeal) or for violation
of parole (with no new charges). The penitentiary inmate population will
not be examined in any detail for the present study.
Data on socio-demographic characteristics for each inmate group
under discussion was provided by an examination of the following variables:
age, education, occupation, native status, forwarding address (rural-
urban residence), and self-reported use of alcohol.
Further clarification is perhaps necessary with respect to the
use of the term "native" in this study. For the purpose of the report,
all status Indian, Metis, and non-status Indian inmates were defined as
native. This is consistent with the definition used in the two previous
----------.------~.-~-.---.-

- -- .------ --- -- -
5
studies. However, in order to facilitate our understanding of this
group of inmates, a more detailed categorization was used for the
March 31, 1977 study. The status Indian inmates weY'e considered as
one group and the Metis and non-status Indians as another. This
provided a means of examining socio-demographic data and inmate
characteristics for each group so as to determine points of difference
and similarity that would otherwise be obscured in analysis.
A description of inmate characteristics for each inmate
population was provided by a consideration of the following: most
. * serl0US sentence offence, length of aggregate sentence, number of
commitments (recidivism), reason for incarceration (default of fine
payment), location within the institutional setting (for example,
institution, camp, temporary absence or community residential centre),
security rating, for the total sentenced population only, number of
days remaining to serve from March 31, 1977 to remission date, and for
remanded inmates, number of days on remand as of March 31, 1977.
The March 31, 1977 Cross-Provi nce Inmate Survey wi 11 exami ne the
relationships that exist between these variables and each of the inmate
populations described in this report. Reference will be made to the
two previous studies (March 31, 1976 and July 16, 1976) when a compari
son with March 31,1977 data indicates differences in the findings.
* This was determined on the basis of the length of sentence given for each offence. It was assumed that the longer the sentence, the more serious the offence. For list of offence codes, see addenda to Coding Manual, Appendix III. For the Remanded Inmate Population (those inmates not yet sentenced on March 31, 1977), this variable was replaced by most serious offence type. 1
I
6
Analysis of the findings involved the use of a "descriptive
method ll which allowed for the inter1inkage of a particular inmate
group with a number of variables thought to characterize each inmate
population. Data were treated to cross-tabular analysis in order to
* determine the strength of the relationship between an inmate group
and the socia-demographic and inmate-related variables under consideration.
By design, a one-day survey is somewhat limited in scope and
findings should be interpreted with some caution. Furthermore, any
conclusions based on the data available must be considered 'in the light
of our inability to accurately predict, at the present time, fluctuation
in the day-to-day numbers of inmates incarcerated, the questionable
reliability of self-reported data, and the lack of cross-province
standardization in the record-keeping procedures of the correctional
institutions. However, information relevant to policy decision and
institutional operation is made available and the consideration of
background data and inmate characteristics provides a means of
assessing the type of clientele under the jurisdiction of the
correctional institutions.
* The strength of the relationship was determined on the basis of chi-square computations.
==

f
f
f
f
{
f
1
I
l
t
I
l
r {
DATA ANALYSIS
I. Preliminary Remarks
The inmate population incarcerated in Alberta correctional
institutions on March 31, 1977 numbered 1740. This compared with a
total of 1618 inmates in the March 31, 1976 one-day survey and 1679
7
in the July 16, 1976 study. A breakdown of the number and percentage
of inmates incarcerated in each correctional institutions for the three
studies is presented in Table 1.
The status of the inmate population at each correctional
institution has been tabulated for the March 31,1977 study
(See Table 2; Figure 1). Comparison data for March 31, 1976 and
July 16, 1976 has been provided in Table 3 and Table 4.
On March 31, 1977, there was a total of forty parole violators
incarcerated in provincial correctional institutions. The findings
* indicated that 7 sentenced inmates, 15 remanded, and 18 penitentiary
inmates were also parole violators. More than half of these inmates
(27 out of the 40) were incarcerated at FSCI and 8 at CRC.
The following sections will outline, in some detail, relevant
findings with respect to the sentenced and the remanded inmate popu
lations. The discussion of the sentenced inmate population incarcerated
on March 31, 1977 will attempt to draw comparisons between all provincial
*.1\ parole violator with new charges is held on remand status for court appea ran ce .
:1 II
8
correctional institutions with the e-xception of CRC.1.. Analysis of the
remanded population will focus only upon inmates with remanded status 2 3 at FSCI and CRee
Four sub-group.s,.of .the sentenced population (the young offenders,
the sentenced native populatibn'u the short-term sentenced population,
and the fine defaulters) have also been selected for additional analysis.
The analysis of all inmate population groups will involve the
discussion of the socia-demographic and inmate-related variables
described in the IIMethodo1ogyil section. The penitentiary inmate
population (.124inmates) will not be considered for the present study.
Information pertaining to the length of stay and reason for the
incarceration of these inmates in provincial correctional institutions
will be examined in the three-month follow-up of the March 31,1977 inmate population.
lThe small number of sentenced inmates incarcerated at CRC on March 31, 1977 (4) precluded meaningful analysis. These cases were presented as missing data.
~ee IIMethodo1ogy il for definition of remand status.
1-he number Qf remanded inmates held elsewhere in the province (30) was considered too small for meaningful analysis.

, 9
" TABLE 1
Number of Inmates in Alberta Correctiona~i Institutions and Percent of the Total Inmate Population
March 31, 1976 July 16, 1976 March 31, 1977 Institution N %. N %: N 0/
/;
FSCI 571 35.3 591 35.2 603 34.7 CCI 362 22.4 400 23.8 332 19. 1 PRCI 173 10.7 171 10.2 151 . 8.7 LeI 150 9.3 160 9.6 159 9. 1 BCCC 100 6.2 104 6.2 147 8.4 CRC 149 9.2 143 8.5 170 9.8
J FSCI(W) 65 4.0 83 4.9 61 3.5 NBFC 48 3.0 27 1.6 117 6.7
I --------------------------------------------------------------------* 100% Total 1618 100.1% 1679 100% 1740
1 * Percent does not summ to 100 because of rounding.

~c:---~~" --~--- ------
r r TABLE 2
STATUS of Inmates in Alberta Correctional (~1arch 31, 1977)
Institutions
Status Sentenced and Institution Sentenced Remanded Remanded Penitenti ary Row Totals
FSCI 52.9% 29.0% 9.0% 9.1% 100% (319) (175) (54) (55) (603) CCI 93.7% 0.9% 5.4% 100% (311 ) (3 ) ( 18) (332) PRCI 96.0% 1.3% 0.7% 2.0% 100% (145) (2) (1) (3) (151) LCI 88.7% 6.9% 1.3% 3.1% 100% ( 141) (11 ) (2 ) (5) (159) BCCC 100% 100% (147) (147) CRC 2.4% 67.6% 11.8% 18.2% 100% (4) (115) (20) (31) (170) FSCI (W) 62.3% 13.1% 4.9% 19.7% 100% (38) (8) (3) (12 ) (61) NBFC 100% 100% ( 117) (1l7) .... Total 70.2% 17.9% 4.8% 7.1% 100% 0
(1222 ) (31T) (83) (124) ( 1740)

~--~~~ .. -.- - --- .--- --- ---.....-..
r r
400
300
III Ql +> I'd 8 s::: ....
I+- 200 0
L Ql ..c § z
100
o FSCI CCI
FIGURE 1
STATUS of Inmates in Alberta Correctional Institutions
. (March 31. 1977)
PRCI LCI
Institutions
BCCC CRG
§§I Sentenced Inmates
till] Remanded Inmates
NBFC
o Penitentiary Inmates
III Sentenced and Remanded Inmates ..... .....

-...--~~~ .. _-- ~ ~-- ~- ---- ---
r r TABLE 3
STATUS of Inmates in Alberta Correctional Institutions (March 31, 1976)
Status Sentenced ,and
Institution Sentenced Remanded Remanded Peni tenti ary Row Totals
FSCI 68. 1% 23.1% 5. 1% 3.7% 100% (389) (132) (29) (21) (571)
CCI 100% 100% (362) (362)
PRCI 96.5% 2.3% 1.2% 100% ( 167) (4) {2} (173)
LCI 93.3% 4.7% 2.0% 100% (140) (7) (3) (150)
BCee 100% 100% (100) (100)
CRC 4. n~ 62.4% 28.9% 4.0% 100% (7) (93) (43) (6) (149)
FSCI (W) 89.2% 1. 5% 6.2% 3.1% 100% (58) (1) (4) (2) (65)
NBFC 100% 100% (48) . (48)
...... Total 78.6% 14.6% 5.0% 1.8% 100% N
( 1271) (237) (81) (29) (1618)

::.~~-~~~ .. - .~--.. ~-~---- --------------------~-
r r
TABLE 4
STATUS of Inmates in Alberta Correctional Institutions (July 16, 197f)
Status Sentenced and
Institution Sentenced Remanded Remanded Penitentiary Row Totals
FSCI 63.8% 23.0% 8.5% 4.7% 100% (377) (136) (50) (28) (591 )
CCI 98.3% 1. 7% 100% (393) (7) (400)
PRCI 91.2% 6.4% 0.6% 1.8% 100% (156) (11 ) (l) (3) (171 )
LCI 89.4% 7.5% 0.6% 2.5% 100% (143) (12) (l) (4) (160)
Bcee 100% 100% (104) (104 )
eRe 7.7% 79.0% 6.3% 7.0% 100% (11 ) (113 ) (9) (10) (143)
FSCI(W) 71.1% 7.2% 9.6% 12.1% 100% (59) (6) (8) (10) (83)
NBFC 100% 100% (27) (27)
--' w Total 75.6% 16.6% 4.5% 3.3% 100%
(1270 ) (278) (76) (55) (1679)
01. , .

~~-~"~.,. - ~ --' ~ -~ ---~,;.
1
1
I
14 II Si gnifi cant Findings
A. Sentenced Inmate Population
A comparison of the number of sentenced inmates incarcerated
in Alberta correctional institutions on March 31,1976, July 16,1976,
and March 31,1977 is presented in Table 5. Sentenced inmates
comprised 70.2% (1222) of the total population incarcerated on
March 31, 1977, a decrease from 78.6% (1271) on March 31,1976 and
75.6% (1270) on July 16, 1976.
A more detailed discussion of the data available on socio-
demographic and inmate characteristics will be presented for the
sentenced population incarcerated in Alberta correctional institutions
on March 31, 1977. Reference will be made to the two previous
studies only when a comparison indicates significant and relevant
differences.
Particular sub-groups of the sentenced population will be
considered in greater detail. Additional information on the young
offenders, the sentenced native inmates, the short-term sentenced
inmates, and the fine defaulters will be provided in subsequent sections
of thi s report.
I ! I
I L
---------........-----"'-------------------~--~-,-,

~--~~~ .. ~----- ~--------
-
r r
TABLE 5
Number and Percentage of Sentenced Inmates at each Alberta Correctional Institution
Sentenced Population Total Inmate Population Institution March 31/76 July 16/76 March 31/77 March 31/76 July 16/76 March 31/77
I FSCI 68.1% 63.8% 52.9% 100% 100% 100% (389) (377) (319) (571 ) (591 ) (603) CCI 1 OO~; 98.3% 93.7% 100% 100% 100% (362) (393) (311) (362) (400) (332 ) BCCC 100% 100% 100% 100% 100% 100% (100 ) (104 ) (147) (100) (104 ) (147) PRCI 96.5% 91.2% 96.0% 100% 100% 100% (167) (156) (145) (173) (171 ) (151) LCI 93.3% 89.4% 88.7% 100% 100% 100% ( 140) (143) (141 ) (150) (160) (159) NBFC 100% 100% 100% 100% 100% 100% (48) (27) (117) (48) (27) (117) FSCI (W) 89.2% 71. 1% 62.3% 100% 100% 100% (58) (59) (38) (65) (83) (61) * 7.7% 2.4% 100% 100% CRC 4.7%
100% (7) (11 ) (4) (149) (143) (170) Total 78.6% ** 75.6% 70.2% 100% 100% 100% (1271) (1270 ) (1222 ) .... (1618) (1679) (1740) * . ' . '!\ .
In the following description of the sentenced inmate popu1ation, the sentenced inmates at CRC have been ...... presented as miSSing cases. The small number of inmates with sentenced status at this institution 01 precluded meaningful analysis.
** This total incorporates seven CRC sentenced inmates who were not included in the sentenced population of the March 31, 1976 study.
----------"--------.----~~- -~-~---~--

---~"~ ... - ---
I I
16
(a) Socio-Demographic Background*
Mean age for the sentenced inmate population incarcerated on
March 31, 1977 was found to be 25.4 years and the median age, 22.1
years. Comparison of mean and median age for each correctional
institution indicated considerable variation (see Figure 12).
Approximately 65% of the sentenced population in Alberta
correctional institutions on March 31, 1977 were 25 years or younger. A significant proportion of the sentenced inmates (43.3%)
were between 19 and 25 years of age (Table 41).
The sentenced inmates at LCI on March 31, 1977 were more
likely to be older (41.8% were over 25 years of age) than inmates at
the other correctional institutions. On the other hand, NBFC was
found to have the highest proportion of young inmates (36.8%) and
FSCI(W), the smallest (2.6%). Th~s latter finding may be at least
partially explained by the fact that women in Alberta do not
achieve legal status until 18 years of age.
In comparison to provincial population statistics for this
age category, a disproportionately high number of sentenced inmates
were found to be 18 years and younger (21.6%). Additional
information on the sentenced inmates in this age category will be
presented in the section on young offenders. Further analysis of
this sub-group of the sentenced population was undertaken in order
* Tables and figures pertaining to this sec~ion on S?cioDemographic characteristics can be found ln Appendlx I.
"
\
I
17
to determine characteristics of the young inmate population.
The overall low level of educational attainment of the
sentenced inmate population (mean was 9.3 grades, Figure 13) was
reflected by the finding that approximately half had less than
Grade 10 (Table 43). Differences were found to exist between
institutions. The highest proportion of sentenced inmates with a
low level of educational attainment was found at PRCI (60.8%) and
LCI (57.1%). Comparison data for the March 31, 1976 and July 16, 1976
studies are presented in Table 44.
The sentenced inmate population on March 31, 1977 was also
charact,erized by lack of occupational skills (approximately 72%
were occupationally unskilled). It was found that of the remaining
28% in the skilled occupation category, the majority tended to
report a trade occupation. A breakdown of the data for each institution
is presented in Table 45. but it is suggested that conclusions based on
these findings be interpreted with cautiQn. It is necessary to take
into account that this is self-reported data and that the method and
criteria used by the institutions in recording the data may differ.
In order to compare the findings of the March 31, 1977 study
with those of the March 31, 1976 and July 16, 1976 profiles, it was
necessary to redefine the "unskilled" category to include only
those inmates who reported an occupation of labourer or no occupation.
-----------------=-----"---'-----.--~--~---------
'W::;

(
~.-----------------~
18
* Data based on this definition is presented in Table 46.
The analysis also indicated that 33.7% (411) of the sentenced
inmate population were native.** A further breakdown of the data
revealed that 19.5% (238) of the sentenced population were status
Indian and 14.2% (173) Metis, non-status Indian (Table 47).
The proportion of sentenced native inmates at each Alberta
correctional institution on March 31, 1977 varied considerably
throughout the province and ranged from 58.6% at PRCI to 17.7% at
CCI (Table 47; Figure 14). It is important to note, however, that
although the percentage of sentenced native inmates at a particular
institution may be relatively high (for example, PRCI and LCI), it
should not be assumed that the proportion of status Indian to Metis,
non-status Indian is equal. Peace River Correctional Institution
*
**
The definition of lIunski lled" used in the March 31, 1976 and July 16, 1976 studies was not used in the present study (March 31, 1977) .. It was felt that' 'a more"comprehens'ive definition that' included other unskilled occupational categories was better suited to the data at hand. See footnote, Table 45 for the definitions of "unskilled" and "skilled" used in the March 31, 1977 study.
It should be noted that discrepancies between Table 45 and Table 46 in the number and percentage of unskilled sentenced inmates incarcerated on March 31, 1977 are due to the definition of "unskilled" used as the basis for presenting the findings. For example, the significantly higher percentage of sentenced inmates at FSCI(W) with an unskilled occupation reported in Table 45 is due to the fact that for the March 31, 1977 study, housewife and unskilled personal service occupations were included in the "unskilled" category.
The term "native" was defined as including all status Indian, non-status Indian and Metis inmates. However, in order to provide a more detailed analysis, the "native" population was further divided into the status Indian group and the Metis, non-status Indian group. 1
r i
~ II
1 ..
\ J
I I
19
had 25.5% status Indian on Mar~h 31, 1977 and 33.1% Metis, non-status
Indian while LCI had 36.2% status Indian but only 7.1% Metis, non
status Indian. Regional population characteristics (i.e. the
proportion of natives, or more specifically, the proportion of status
Indians,"Metis and non-status Indians, residing in a particular area
of the province) may playa significant role in ex~laining these
findings.
A subsequent section of this report will provide a more
detailed description of the socia-demographic background and inmate
characteristics of the sentenced native population.
The consideration of forwarding address as an ,indicator of
whether an inmate resided in a rural or urban area of Alberta or
outside the province provided data on the residential characteristics
of the sentenced inmate population at each correctional institution
(Table 48). It should be noted that the large number of missing
cases at LCI and NBFC severely limited data analysis and conclusions
based on these 'data must be viewed with caution. However, the
existence of particular trends suggests that further investigation
with more complete information would be warranted.
The findings indicated that 26.7% of the sentenced population
reported a problem with the use of alcohol. The percentage of sentenced
inmates at each correctional institution who considered themselves
intemperate showed some variation (Table 49). It was found that the
sentenced population at FSCIOv) were much more likely to report a
problem with alcohol use (78.8%). The reliability of these data,
u::::::
1

f
I I I {
I ; {
however, must be questioned simce not only is this self-reported
information but also the criteria used in recording alcohol Use may differ between institutions.
(b) Inmate Characteristics
20
Analysis of the data on most serious offence types for the
sentenced population indicated that the majority of inmates (53.7%)
Were incarcerated for property offences (that is, for major theft,
minor theft, or breaking and entering). This, however, does not
take into accOunt the fact that some of the "violent" crimes were also property offences.
The findings indicated distinct differences between institutions
in terms of the proportion of sentenced inmates incarcerated for
particular offence types. For example, the prOportion of inmates
incarcerated for violent crimes as a most serious offence type ranged
from 34.2% at FSCI(W) to 7.9% and 7.5% at LCI and BCCC respectively (Table 6).
The majority of the sentenced inmate population (74.3%) had
aggregate sentences of less than one year (Table 7). Mean aggregate
sentence was 2B4 days and ranged from 222 days at LCI to 395 days
at NBFC (Figure 2; for Comparison, median aggregate sentence is also presented on this graph).
The data indicated that LCI had the highest proportion of inmates
serving short-term senten~s (th~e months or less) and that slightly
mo~ than one-third of the sentenced inmates of both PRCI and NBFC were serving twelve months or more (see Table 7).
-,-------
i r I , I
.1
I i i I
J
I I I I
===
-------- -

~ .... '-- - --- --------
r r TABLE 6
MOST SERIOUS OFFENCE TYPE for Sentenced Inmates in Alberta Correctional Institutions
Most Serious Offence * Violent Major Minor Breaking & Drugs Alcohol Other Row Totals
Crimes Theft Theft Entering
FSCI 15.0% 17.9% 20.1% 18.2% 6.3% 7.5% 15.0% 100% (48) (57) (64) (58) (20) (24) (48) (319)
FSCI (W) 34.2% 8.4% 2.6% 0 21.1% 13.2% 10.5% 100% (13) (7) (1) (8) (5) (4 ) (38) .
PRCI 19.3% 18.6% 12.4% 26.2% 4.1% 8.3% 11.1% 100% (28) (27) (18) (38) (6) (12) (16) (145)
LCI 7.9% 17.3% 18.7% 16.5% 2.9% 17.3% 19.4% 100% (11) (24) (26) (23) (4) (24) (27) (139)
CeI 17.0% 15.1% 18.0% 16.1% 14.8% 10.3% 8.7% 100% (23) (47) (56) (50) (46) (32) (27) (311)
BCCC 7.5% 20.4% 23.1% 15.0% 15.0% 8.8% 10.2% 100% (11) (30) ~34) (22) (22) (13) (15) (147)
NBFC 21.4% 15.4% 12.8% 32.5% 11.0% 0.9% 6.0% 100% (25) (18) (15) (38) (13) (1) (7) (117)
TOTAL 15.5% 17~3% 17.6% 18.8% 9.8% 9.1% 11.9% 100% (189) (210) (214) (229) (119) (111) (144) (1216)
Chi Square = 134.241 Degrees of Freedom-=.36 Significance E.~ ~001 Missing Cases = 6
* The "other" category includes the following offence types: dangerous driving or criminal negligence in operation of a motor vehicle; sexual offences (non-violent N
or non-dangerous); dangerous weapon and related; disorderly conduct and general nuisance; careless ......
driving or driving while disqualified or prohibited; technical violations; other criminal code; Highway Traffic Act; HVAA; Immigration Act; other Federal, Provincial, Municipal Statutes (e.g. Public Health Act, Juvenile Delinquency Act).

r r I.
TABLE 7
AGGREGATE SENTENCE for Sentenced Inmates in Alberta Corr.ectional Institutions
Sentence Length
Institution 3 months 3-6 6 months 12-18 18 months Row Totals or less Months to 1 year Months or more
LCI 38.3% 19.9% 25.5% 12.8% 3.5% 100.0% (54) (28) (36) (18) (5) (141)
BCCC 27.9% 35.4% 21.1% 10.2% 5.4% 100.0% (41) (52) (31) (15) (8) (147)
CCI 26.7% 19.3% 29.9% 16.4% 7.7% 100.0% (83) (60) (93) (51) (24) (311)
FSCI (W) 23.7% 23.7% 31.6% 13.2% 7.9% 100.1%* (9) (9) (12) (5) (3) (38)
PRCI 21.4% 11.7% 31. 7% 21.4% 13.8% 100.0% (31) (17) (46) (31) (20) (145)
FSCI 20.7% 22.9% 28.2% 17.2% . 11.0% 100.0% (66) (73) (90) (55) (35) (319)
NBFC 0 13.7% 50.4% 19.7% 16. 2~& 100.0% (16) (59) (23) (19) (117)
TOTAL 23.3% 20.9% 30.1% 16.3% 9.4% 100.0% (284) (255) (367) (198) (114) (1218)
N N
Chi Square = 117.334 Degrees of Freedom = 24 Sign; fi cance E..::: .001
* \ Mi ss i ng Cas'es = 4 Percent does not sum to 100 because of rounding.
--~~----~~- -------~--

~~~~~~ .. ------~
r r a . «
Vl
~ Cl
If-. 0
So-<1J .0 E :::s z
30
200
100
FIGURE 2
MEAN AND MEDIAN AGGREGATE SENTENCE For Sentenced Inmates in Alberta Correctional Institutions
Institutions Total Sentenced
Population
III Mean Aggregate Sentence
r:J Median Aggregate Sentence
N W

---~M~" - ~---- ~------
24
An examination of the inmate characteristics of individuals
transferred to PRCI from other provincial correctional institutions
because of lack of space may help to explain the higher percentage
of inmates with longer aggregate sentences. This will be discussed
in greater detail in the three-month follow-up study of the
March 31, 1977 population.
The fact that the majority of inmates incarcerated at NBFC
on March 31, 1977 had aggregate sentences of six months or more is a
reflection of program directives that aim to involve the inmate in
an organized work program for a specified number of weeks.
Slightly more than 60% of the sentenced inmate population
had at least one previous commitment to the institution (Table 8).
The mean number of conmitments for the total sentenced population
was 3.5 but a breakdown by institution showed a wide range from
1.9 at CCI to a high of 8.1 at LeI (Figure 3). The particularly
high mean at LeI can be explained, at least in part, by the fact
that a small group of highly recidivist inmates (11) had had over
thirty commitments to the institution.
A high rate of recidivism was indicated for all institutions
but was perhaps most pronounced in the case of LCI. It was found
that 34.0% of the sentenced inmate population at this institution
had five or more commitments. (Approximately 20% of the sentenced
population at FSCI and PReI had five or more commitments).
I I
~
25
TABLE 8
NUMBER OF COMMITMENTS for Sentenced Inmates in
Alberta Correctional Institutions
Commitments
Institution One Two Three or Five Row Totals Four or More
FSCI (W) 55.3% 23.7% 13.2% 7.9% 100.1%* (21) (9) (5) (3) (38)
CCI 49.0% 29.3% 17.2% 4.5% 100.0% (142) (85) (50) (13) (290)
BCCC 43.8% 34.2% 12.3% 9.6% 99.9%* (64) (50) (18) (14) (146)
NBFC 38.6% 32.5% 20.2% 8.8% 100.1%* (44) (37) (23) (10) (114)
LCI 31.9% 20.6% 13.5% 34.0% 100.0% (45) (29) (19) (48) (141)
FSCI 30.1% 26.3% 23.8% 19.7% 99.9%* (96) (84) (76) (63) (319)
PRCI 29.2% 25.7% 26.4% 18.7% 100.0% (42) (37) (38) (27) (144)
TOTAL 38.1% 27.8% 19.2% 14.9% 100.0% (454) (331) (229) (178)** (1192)
Chi Square = 113.452 Degrees of Freedom = 18 Significance E.~ .001 Missing Cases = 30
* Per cent does not sum to 100 because of rounding· ** A total of 57 inmates had more than
inmates had over 30 commitments). 10 commitments (14 of these

~--~"~ .. -------- ~--------
r r
---....------------------~ -- - --
FIGURE 3
MEAN NUMBER OF COMMITMENTS for Sentenced Inmates in Alberta Correctional Institutions
en 10 -I-' C QJ E -I-'
8 .,... ~ 0
U
If- 6 0
So. QJ
..0 4 E :::s
z
2
0
-~ -
-
- ~
-LCI FSCI
Analysis of Variance F = 20.835 Significance ~~.OI Missing Cases = 30
II ~ 2,~ '"'"-
PRCI FSCI(W) BCCC
Institutions
2.3 r-
~
NDFC CCl
~- '
::?,~ .....-
Total Sentenced Population
N O"'t

1
1
1
1
l
I
1
! 1
1 i ~
I ~
f l ~ ij
I
-- ~ -- - ~-,--------------------------------------------
27
A small proportion (9.1%) of the total sentenced population
incarcerated on March 31, 1977 were serving sentences in default of
fi ne payment (Table 9). Table 10 presents compa ri son data for the
two previous one-day profiles (March 31, 1976 and July 16, 1976).
A breakdown of these data by institutions indicated that for
all three studies, the proportion of inmates incarcerated for this
reason at LCI was significantly higher than the percentage at the
other correctional institutions (see Table g'and Table 10 for
comparison data). One possible explanation is the greater occurrence
of incarceration for alcohol offences at this institution. The
interpretation of these findings, however, must take into account
the fact that comparison data for persons convicted of similar
offences for which a fine was paid were not available.
Data for location within the institutional setting indicated
that approximately 75% of the sentenced inmate population were
located within the institution itself on March 31, 1977 (Table 11).
Differences did emerge between the correctional institutions
with regard to the use made of alternatives to institutional
incarceration (such as, temporary absence, day parole, or Community
Residential Centres). This variation seemed to reflect program
policy and the types of alternatives available to each institution.
For example, 50.3% of the sentenced population at BCCC on
March 31, 1977 were on a T.A., a day parole', or at a CRC but at
other institutions (in particular, PReI and CCI), these aiternatives
were not in use (see Table 11).
I I U
J i
., :1 '; ,
~ ,
1 .. r:-;>
1
TABLE 9
REASON FOR INCARCERATION for Senfenced Inmates in
Alberta Correctional Institutions
Reason for Incarceration
Institution Mandatory Sentence
LCI 79.4% ( 112)
FSCI{W) 86.8% (33)
CCI 90.4% (281)
PRe I 92.4% (134)
FSCI 92.5% (295)
BCCC 92.5% (136)
NBFC 99.1% (116)
TOTAL 90.9% (1107)
Chi Square = 34.679 Degrees of Freedom = 6 Si gni fi cance E.!£ .001 Missing Cases = 4
In Default of Fine Payment
20.6% (29)
13.2% (5)
9.6% (30)
7.6% (11)
7.5% (24)
7.5% (11)
0.9% (1)
9.1% (111 )
28
Row Totals
100.0% (141)
100'.0% (38)
100.0% (311)
100.0% (145)
100.0% (319)
100.0% (147)
100.0% (117)
100.0% (1218)

r r
TABLE 10
REASON FOR INCARCERATION for Sentenced Inmates in Alberta Correctional Institutions (March 31, 1976 and July 16, 1976)
Reason for Incarceration Institution Mandatory Sentence In Default of I Row Totals I
Fine Payment I I I I March/76 July/76 March/76 July/76 }1arch/76 July/76 LCI 82.1% 79.0% _17.9% 21.0% 100% 100% (115) (113) (25) (30) (140) (143)
FSCI(W) 91A% 86.4% 8.6% 13.6~~ 100% 100% (53) (51) (5) (8) (58) (59) CCI 93.1% 93.4% 6.9% 6.6% 100% 100% (337) (367) (25) (26) (362) (393) PRCI 98.2% 96.2% 1.8% 3.8% 100% 100% (164) (150) (3) (6) (167) (156) FSCI 89.7% 92.3% 10.3% 7.7% 100% 100% (349) (348) (40) (29) (389) (377) BCCC 91.0% 97.1% 9.0% 2.9% 100% 100% (91) (101) (9 ) (3) (100) (104) NBFC 95.8% 96.3% 4.2% 3.7% 100% 100% (46) (26) (2) (1) (48) (27) TOTAL 91.4% 91.8% 8.6% 8.2% 100% 100%
N (1155) (1156) (109) (103) (1264 ) (1259 ) ID
Missing Cases: March 31, 1976 = 7 July 16, 1976 = 11
'i I !

.... ~- ~--~
[
r r ~-
~'
~.
~ ..
~
~
r ~ ["
[
~'
[
[
I I. I
----.---------~------~,.-
30
TABLE 11
LOCATION Of Sentenced Inmates in Alberta Correctional Institutions
Location
Institution
PRe I 91. 7% ( 133)
CCI 88.1% (274)
FSCI 85.3% (272)
FSCI (l~) 78.9% (30)
LCI 76.6% (108)
BCCC 40.1% (59)
NBFC* 36.8% (43)
TOTAL 75.5% (919)
Chi Square = 666.469 Degrees of Freedom = 18 Si gni fi cance £ ~ .001 Missing Cases = 4
Camp TA/Day Parole/CRC
8.3% 0 (12)
9.3% 0 (29)
13.5% 0.;-6% ( 43) (2)
0 2.1% (8)
10.6% 12.8% (15) (18)
0 50.3% (74)
56.4% 4.3% (66) (5)
13.5% 8.8% (165) ( 107)
Other : Rovi Tota 1 s I I I
0 I 100% I
(145) I I I
2.6% I
100% I I
(8) I (311 ) I I
0.6% I 100% I
I (2) I (319) I I I
100% 0 I I
(38) I I I I
100% 0 I I
( 141) I I I
9.5% I 100% I
(14) I
(147) I I I
2.6% I
100% I
( 3) I (117) I·
I I
2.2% I 100% I
I (1218) (27) I
I
~F.or the purpose of the study, NBFC was considered an institution with sate 11 i te camps.
I ,
I I ~l
-/
.. , J
. '
. il I !
1~
f·
I (
f ,-I I
II ·-1
31
Further information with regard to location within the
institutional setting and the use made of alternatives such as camp,
T;A., day parole, and CRC facilities will be made available in the
three-month follow~up of the March 31, 1977 inmate population.
On March 31, 1977, 80.1% of the total sentenced population
were classified as minimum security (Table 12). However,
differences were found to exist between the institutions. In some
cases, security classification was directly linked to institutional
programming (for example, NBFC and BCCC) but for other institutions
(such as PRCI and LCI), variation was more likely a consequence of
the fact that security classification has not been standardized throughout the province.
A conSideration of security rating by time remaining .to serve
(i.e. time from March 31, 1977 to release date) for the total
sentenced inmate population indicated that 27.6% of those with a
"maximum" security classification (21 inmates) had less than one
month remaining until their release date (see Table 13).
The data indicated that as of March 31, 1977, 57.2% of the
sentenced inmate population had less than three months remaining
until their release date (Table 14). Of the sentenced population
with less than one month to serve (321 inmates), only 15.9% (51
inmates) were involved in a community program (such as a T.A., day
parole, or CRC program). More than three-quarters of those with
less than a month to serve were located within the institution
itself on March 31, 1977 (Table 15).

"-"'
(
! '
I
f
f
1
\
f
1
L r L !
.... ~ - -~-.. --- --- - --
TABLE 12
SECURITY RATING for the Sentenced Population in
Alberta Correctional Institutions
Institution Minimum
NBFC 100.0% (117)
BCCC 100.0% (147)
CCI 95.5% (297)
LCI 80.1% (113)
FSCI(W) 76.3% (29)
FSCI 66.4% (211)
PRCI 42.1% (61)
TOTAL 80.1% ... 'h: (975)
Chi Square = 341.095 Degrees of Freedom = 12 Significance .E.~ .001 Missing Cases = 5
Security Rating
Medium Maximum
0 0
0 0
1.6% 2.9% (5) (9)
2.1% 17.7% (3) (25)
21.1% 2.6% (8) (1)
27.0% 6.6% (86) (21)
40.0% 17.9% (58) (26)
13.1% 6.7% (160) (82)
* . Per cent does not sum to 100 because of rounding
32
Row Totals
100.0% . {11?}
100.0% (147)
100.0% (311)
99.9%* (141)
100.0% (38)
100.0% (318)
100.0% (145)
99.9%* (1217)
..---_-------~--"----~---~~. c_' _~.n ____ _
~ ~
'J
1 ~ c
rr" ') 1
33
TABLE 13
SECURITY RATING BY TIME REMAINING TO SERVE for Sentenced Inmates in
Alberta Correctional Institutions
Time from March 31,1977 to Release (Remission) Date
Less than 1-3 3-6 More than Row Totals 1 Month Months Months 6 months
Minimum 28.8% 33.9% 20.6% 16.7% 100.0% (278) (327) (199) (160) (964)
Medium 13.7% 13.1% 26.3% 46.9% 100.0% (22) (21) (42) (75) (160)
Maximum 27.6% 23.7% 17.1% 31.6% 100.0% (21) (18) (13) (24) (76)
Chi Square = 97.940 Total = 1200
Degrees of Freedom = 6 Significance .E.~ .001 Missing Cases = 22

I 1
I
I
[
J
!
{
f
[
34
TABLE 14
TIME REMAINING TO SERVE from March 31, 1977 for Sentenced
Inmates in Alberta Correctional Institutions
Time to Release
Institution Less than 1 month
LCI 40.4% (57)
BCCC 39.0% (53)
FSCI(W) 34.2% (l3)
PRCI 24.8% (36)
FSCI 24.5% (78)
CCI 23.6% (72)
NBFC 10.3% (12)
TOTAL 26.7% (321)
Chi Square = 85.935 Degrees of Freedom = 18 Significance E.$ .001 Missing Cases = 21
1-3 Months
28.4% (40)
42.6% (58)
26.3% (10)
26.2% (38)
27.3% (87)
32.5% (99)
29.1% (34)
30.5% (366)
(Remission) Date
More than 3-6 Months 6 months
19.9% 11.3% (28) (16)
12.5% 5.9% (17) (8 )
13.2% 26.3% (5) (10)
24.1% 24.8% (36) (35)
21.3% 27.0% (68) (86)
20.7% 23.3% (63) (71)
32.5% 28.2% (38) (33)
21.2% 21.6% (255) (259)
*Per cent does not sum to 100 because of rounding
1
IRow Totals 1 I 1 1
I 100.0% ! (141) 1
! 100.0% : (136) I
: 100.0% : (38) 1 I
99.9%* 1 1 1 (145) 1 1 1 0
1 100.1%* ! !319) 1
! 100.1%* : (305) 1
I 100.1%* ! (117) 1 1
: 100.0% : (1201) 1
35
TABLE 15
TIME REMAINING TO SERVE BY LOCATION for Sentenced Inmates
in Alberta Correctional Institutions
.Location on March 31, 1977
Time from March 31, 1977 Institution Camp TAjDay Parole Other I Row to Release JCRC 'Totals (Remission) Date Less than 1 Month 76.3% 7.2% 15.9% 0.6% 100.0% (245) (23) (51) (2) (321)
1-3 Months 69.9% 18.6% 10.9% 0.6% 1 100 .0% (256) (68) (40) (2) (366) . -,
3-6 Months 75.3% 19.6% 3.9% 1.2% 100.0% (192) (50) (10) (3) (255)
More than 6 Months 87.3% 9.3% 2.3% 1.2% 100.1%* (226) (24) (6) (3) (259)
Tota'i = 1201 . -' Chi Square = 72.948 .- . Degrees of Freedom = 9
Si gni fi cance .E. ~ .001 i+ Missing Cases = 21
* Per cent does not sum to 100 because of rounding.
~1 " "
I n

[
I
[
} .
36
1. Young Offenders
The finding that 21.6% of the sentenced population incarcerated on
March 31, 1977 were eighteen years and younger was considered indicative
of the need for further examination of the socio-demographic and inmate
related variables characterizing the young offender group. The percentage
of young inmates at each correctional institution is presented in Figure 4.
Two institutions showed a significant change in the proportion of
sentenced inmates in the eighteen years and younger age category. The
data indicated a decrease from 38.3% on March 31,1976 to 25.5% on
March 31, 1977 at PRe I and from 25.0% to 15.6% at BCeC (for comparison,
see Table 41 and Table 42 in Appendix I). (a) * Socio-Demographic Background
Analysis of the relationship between age and number of socio
demographic background characteristics failed to distinguish between the
young offender group and the older sentenced inmates (over eighteen years
of age). No significant differences between the two age categories were
observed with respect to level of education attainment (mean for both
** groups was 9.3 grades), native status, or rural-urban residenc~ (forwarding address).
The majority of sentenced inmates in both age categories were
found to be occupationally unskilled. In comparison to the older inmate
group, the young offenders were less likely to report occupational skills
of any kind (Table 52). This may be a consequence of the fact that
younger inmates have had less opportunity to be involved in the work force.
* See Appendix I for presentation of statistical data. ** See Table 50 and Table 51.
w_

r r
s.. tlJ
100 '-
~ 50 '-::::I o >-
~ 40 '-VI s.. ItS
~ 30 ,-ex) ,....
20 1-
10 '-
o
FIGURE 4
AGE of Sentenced Inmates in Alberta Correctional Institutions
~
36.8 (43) r--
25.5 (37) 22.7 ~ (32) 20.7 19.6
r- (66) (61) 15.6 :-- - (23) r-
2.6 (1) rI
NBFC PRCI LeI FSCI CCI BCCC FSCI (H)
Institutions
Missing Cases = 4

r I r r f
f
38
Additional analysis indicated that the majority of inmates
in both age categories reported no problem with the use of alcohol.
However, the data also revealed that the incidence of problematic
use of alcohol reported by the sentenced population was significantly
lower for the young offender group than for the older inmates
(Table 53).
(b) Inmate Characteristics
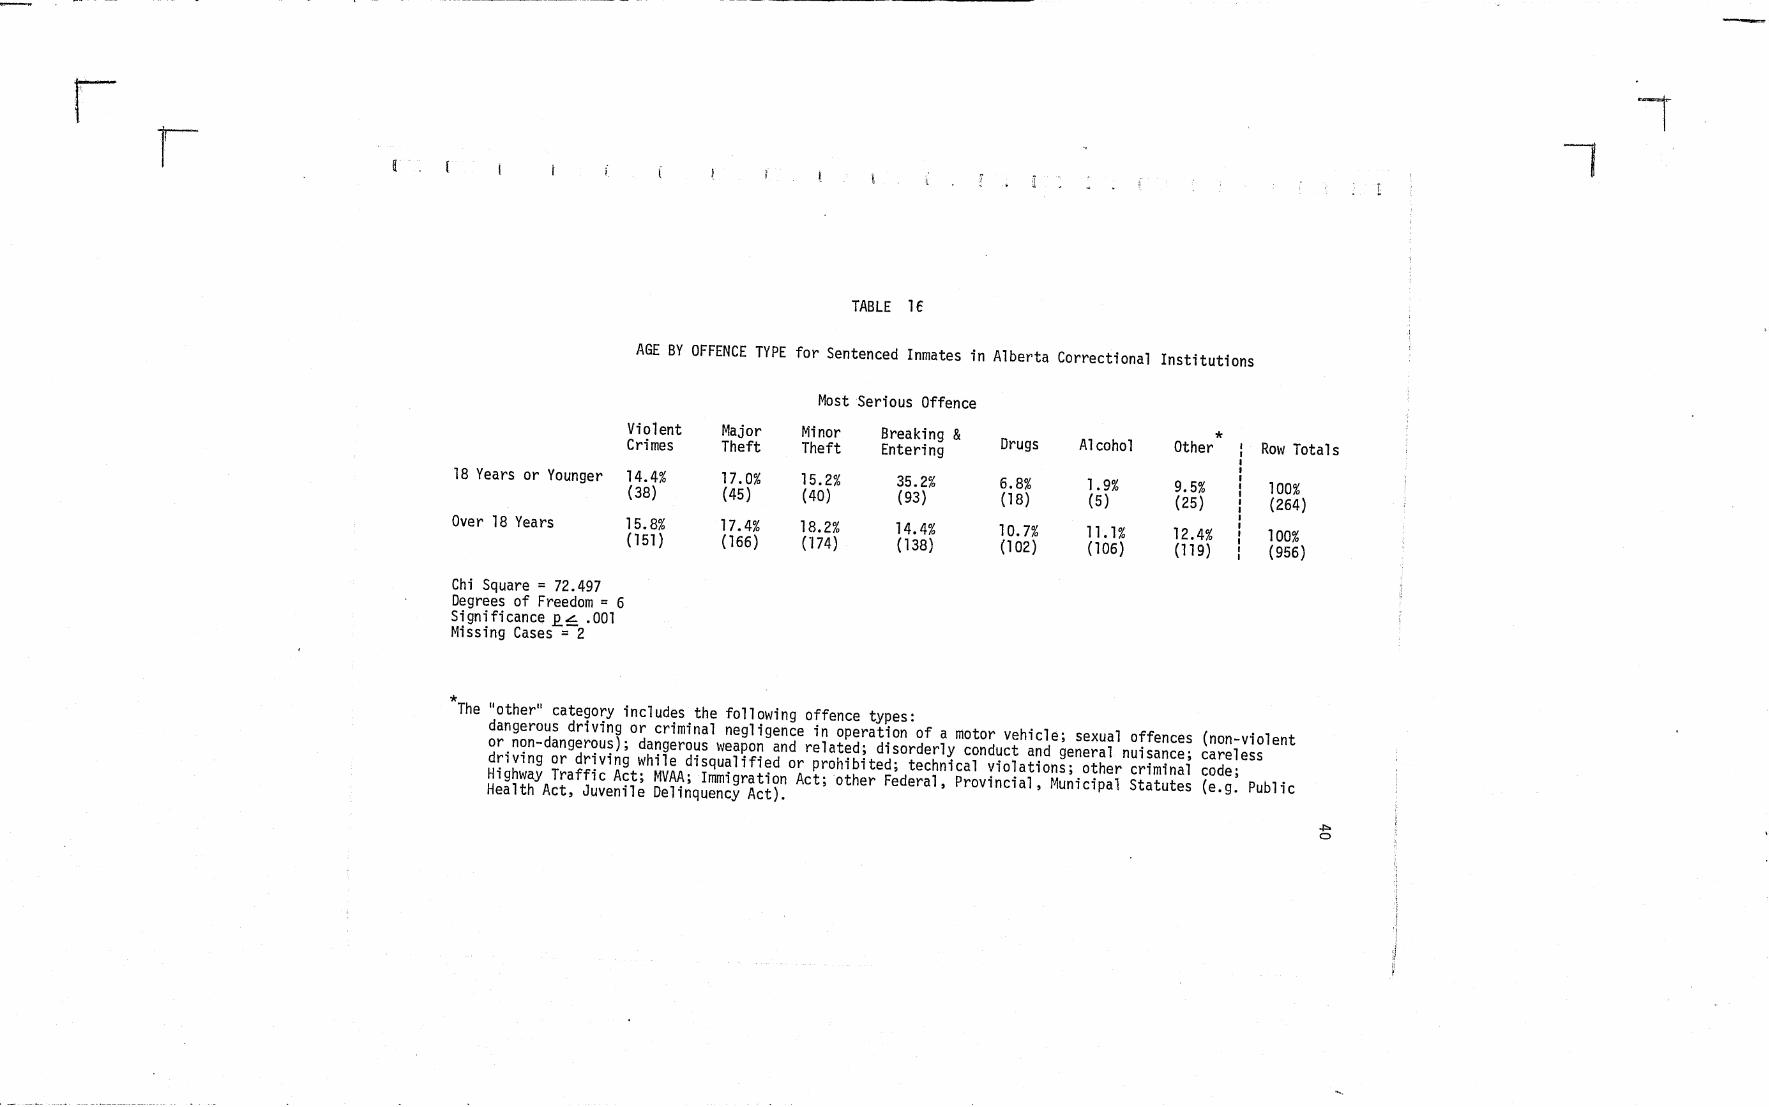
Analysis of the relationship between age and sentence offence
indicated that the young offender group and the older inmates differed
with respect to two major offence types. There was a significantly
greater tendency for the young offenders, in comparison to the older
inmates, to be incarcerated for breaking and entering (35.2% in
comparison to 14.4%). On the other hand, the young offenders were
much less likely to be incarcerated for an alcohol offence (1.9% in
comparison to 11.1%). (See Table 16 for comparison data).
A comparison of mean aggregate sentence for the two age groups
showed no significant difference. In addition, although the further
breakdown of aggregate sentence into various time periods revealed
some variation, the analysis did not indicate a characterizing trend
for either age category (Table 18).
The mean number of commi tments for the young offenders (1.8
commitments) was found to be lower than that for the older inmate
group (3.9 commitments; see Figure 5). This is reflected in the
finding that approximately 50% of the young offender group were
incarcerated on their first commitment in comparison to approximately
1
1 1
I I I I I
39
35% of the older inmates (Table 19). However, caution is urged in
the interpretation of these findings. To conclude that the young
offender group is characterized by a lower recidivism rate is perhaps
to overlook the fact that at least 50% of the young inmates (inmates
who were eighteen years and younger) were found to be recidivist
* (two or more commitments).
The young offender group was less likely to be incarcerated
in default of fine payment than the older inmate group (Table 17).
This is perhaps a reflection of the fact that this group was also
less likely to be incarcerated for an alcohol offence or to report
a problem with the use of alcohol. The conclusions reached from
this analysis are necessarily limited, however, since data on the
number of persons convicted of similar offences for·which a fine was
paid are not available at the present time.
A consideration of location within the institutional setting
on March 31, 1977 did not differentiate between the young offenders
and the older inmates. Three-quarters of the inmates in each group were
located within the institution itself on March 31, 1977 (rather than
at a camp or a CRC, or on temporary absence or day parole). Since
the findings were similar to those for the sentenced population as a
whole, statistical data is not presented.
* This discussion of the recidivism of young inmates is unavoidably incomp·lete. The possibility exists that these inmates may have been involved in criminal activities before reaching adult status. However, no record of criminal behavior for juvenile offenders is available at the present time.
--------~~---------"-~---"----" ---- ----
r r
TABLE lE
AGE BY OFFENCE TYPE for Sentenced Inmates in Alberta Correctional Institutions
Most Serious Offence
Violent Major Minor Breaking & * Crimes Theft Theft Entering Drugs Alcohol Other Row Totals 18 Years or Younger 14.4% 17.0% 15.2% 35. 27~ 6.8% 1. 9% 9.5% 100% (38) (45) (40) (93) (18) (5) (25) (264) Over 18 Years 15.8% 17.4% 18.2% 14.4% 10.7% 11. 1% 12.4% 100% (151 ) ( 166) ("174) ( 138) (102) (106) (119) (956)
Chi Square = 72.497 Degrees of Freedom = 6 Significance Q6 .001 Missing Cases = 2
* The lIother ll category incl udes the following offence types: dangerous driving or criminal negligence in operation of a motor vehicle; sexual offences (non-violent or non-dangerous); dangerous weapon and related; disorderly conduct and general nuisance; careless driving or driving while disqualified or prohibited; technical violations; other criminal code; Highway Traffic Act; ~1VAA; Immigration Act; other Federal, Provincial, r~unicipa1 Statutes (e.g. Public Health Act, Juvenile Delinquency Act).
".
-

--~P~'" ---- . -~--.---~
f
f
r
f
{
L
f' r [
f
i J
I
r
r
f
TABLE 17
AGE BY REASON FOR INCARCERATION for Sentenced Inmates in Alberta Correctional Institutions
Reason for Incarceration
41
Mandatory In Defau1 t of Sentence Fine Payment
Row Totals
18 Years 95.1% 4.9% or Younger (251) (l3)
Over 18 Years 89.8% 10.2% (860) (98)
Chi Square = 6.427; Degrees of Freedom = 1; £~ .05
TABLE 18
AGE BY AGGREGATE SENTENCE for Sentenced Inmates in Alberta Correctional Institutions
Aggregate Sentence
3 Mon. 3 - 6 6 Mon. 1 Yr.- Over or Less Mon. to Yr. 18 Mon. 18 Mon.
18 Years or Younger 19.7% 21.6% 36.0% 17.4% 5.3%
(52) (57) (95) (46) (14 ) Over 18 Years 24.2% 20.9% 28.4% 16.1% 10.4%
(232) (200) (272) (154) (100)
Chi Square = 11.923; Degrees of Freedom = 4; £~ .05
100% (264)
100% (958)
Row Totals
100% (264)
100% (958)
"'f'
! t..,;:,
r I
r , ~
! I;
, :,
I l' f
TABLE 19
AGE BY RECIDIVISM for Sentenced Inmates in Alberta Correctipnal Institutions
Number of Commitments to Institution of Incarceration
One Two Three or Five or Four More
18 Years or Younger 48.9% 29.5% 18.9% 2.7% (129) (78) (50) (7)
Over 18 Years 35.2% 27.3% 19.2% 18.3% (328) (254) (179) (171 )
Chi Square = 44.514 Degrees of Freedom = 3 Significance £~ .001 Missing Cases = 26
FIGURE 5
MEAN NUMBER OF COMMITMENTS BY AGE for Sentenced Inmates in Alberta Correctional Institutions
Entire Population /' (N = 1196) , X = 3.4
18 Years or Younger (N = 264)
Over 18 Years] (N = 932)
X = 1.8 X = 3.9 --Analysis of Vatiance: Missing Cases = 26
F = 21.609, £~ .01 ,
42
Row Totals
100% (264)
100% (932)

---~ .. ~ .. ------~
I ,.
I I I I {
* 2. Sentenced Native Population
43
The March 31,1977 sentenced population included 411 inmates
(33.7%) who held native status**:238(19.5%) were status Indian and
173 (14.2%) were metis or non-status Indian. Comparison data for
the March 31, 1976 and July 16, 1976 studies are provided in Table 20.
There has been very little fluctuation in the number and proportion
of native inmates in the sentenced population.
TABLE 20
NATIVE STATUS of Sentt~nced Inmates in Alberta Correctional Institutions
March 31, 1976 July 16, 1976 March 31, 1977
Status Indian 18. 7~~ 19.3% 19.5% (236) (244) (238)
Metis, 14.0% 12.9% 14.2%b Non-Status Indian (177) ( 163) (173)
Non-Native 67.3% 67.8% 66.3% (851) (858) (808)
Total 100% 100% 100% (1264)ll (1265) {1219)
Missing Cases 7 5 3
aThis total does not include 7 sentenced inmates at CRe on March 31, 1976. bFor the March 31, 1977 study, the sentenced Metis, non-status Indian group was comprised of 151 Metis and 22 non-status Indian inmates.
* Since the number of native inmates with remanded or penitentiary status on March 31, 1977 was comparatively small, the sentenced inmate population was chosen as the basis for comparison of the native and non-native inmate groups.
** Definition of the use of the term "native" in this report is provided in the methodology section.
1
;"1
~ -
, 1
~ : , \~l
;t 1\
!j ~ .
It.
L n • ~ :
Hi ~ ::
r 1 f U~
T
44·
TABLE 21
NATIVE STATUS of Sentenced Inmates in each Alberta Correctional Institution
Institution Sentenced Inmates With Total Sentenced Inmate Native Status . Population
March/76 July/76 March/77 : Mat'ch/76 July/76 March/77 I I
59.4% 58.6% I 100% 100% 100% PRCI 53.9% I
(85) I (167) (155) (145) (90) (92) I I I
36.2% 52.6% I 100% 100% 100% FSCI (W) 32.8% (19 ) (21) (20) (58) (58) (38)
100% 100% LCI 44.3% 50.0% 43~3% 100% (62) (71) (61) ( 140) ( 142) (141 )
100% 100% FSCI 37.3% 32.9% 38.5% 100% (145) (124 ) (123 ) (389) (377) (319)
BCCC 29.0% 24.0% 26.0% 100% 100% 100% (38) (100) (104 ) ( 146) (29) (25)
** 100%' NBFC 25.0% 42.3% 24.1% 100% 100% (12) (11) (28) (48) (26) (116)
.100% CCI 15.5% 15.8% 17.7% 100% 100% (56) (62) (55) (362) (392) (311 )
CRC (1) (11 ) (3) (1)
100% 100% Total 32.7% 32.2% 33.7% 100% * ( 413) (407) (411 ) (1264,) (1265 ) (1219),
Missing Cases: March 31, 1976 = 7; July 16, 1976 = 5; March 31,1977 = 3
*This total does not include seven sentenced inmates at CRC on March 31, 1976. These inmates have been presented as missing cases.
**This large increase in the p~oportion ?f n~ti~es at NBFC co~ld be the f result of a selectively appl1ed reductl0n ln lnmate populatlon: It should not be interpreted that an increasing percentage of natlves are serving at NBFC.

r r
Q)
> 'r-~J
to Z
Q) ~
c::(
o ..c:: 3: II) Q) ~ to E s:::
H
4-o ~ s::: Q) u ~ Q)
a..
100
60
50
40
30
20
10
o
[ a
FIGURE 6
fffiTIVE STATUS of Sentenced Inmates in Alberta Correctional Institutions
(March 31, 1976; JulY 16, ·1976; ~1arch '31, 1977)
Institutions
March 31, 1976
t~~l July 16, 1976
~ March 31,1977
ZlUk __

~
.. ~
I I r
f
f ",
f
f
••..••.. " •• t.l", •
A comparison of the percentage of sentenced native inmates
incarcerated at each correctional institution on March 31,1976,
46
July 16,1976, and March 31,1977 indicated little change (see Table 21;
Figure 6). The most noticeable increase occurred at FSCI(W) (from
32.8% on March 31,1976 to 52.6% on March 31,1977). However, caution
is urged interpreting the significance of this change since the number
of sentenced inmates incarcerated at this institution is relatively small.
The following sections will focus upon the relationship
between native status (i.e. status Indian, Metis, non-status Indian;
and non-native) and a number of socio-demographic and inmate-related
variables.
In addition, the relationship between native band and each
socio-demographic and inmate-related variable was also examined for
the status Indian population. Bands with a larger number of sentenced
inmates incarcerated in Alberta correctional institutions on March 31, 1977
were considered separately and the remaining bands were re-grouped on
the basis of geographical locality (i.e. southern, central, or northern
Alberta). Discussion of these findings will not be undertaken for this
report. However, for the reader's interest and perusal, the tabulized
data are presented in Appendix II.
(a)
*
* §ocio-Demographic Background
A comparison of mean age for the sentenced inmates, the natives,
Tables and figures for this sub-section are provided in Appendix I.
u ,
47
and the non-natives (Figure l~ showed the native group to be older
(a mean age of 26.3 years as compared to 25.0 years for the non-natives).
There was a greater tendency for natives, as compared to non-natives,
to be over 25 years of age. It was found that 44.5% of the status
Indians and 39.3% of the Metis, non-status Indians belonged to the older
age group (26 years and older). See Table 54.
The sentenced native inmate population also tended to be more
poorly educated. The native inmates were found to have a mean of 8.2
years of education as compared to 9.9 years for non-natives (Figure16).
The majority of both the status Indian group (73.9%) and the Metis,
non-status Indian group (71.5%) reported an educational level of less
than Grade 10. Thi7 compared to 35.1% of the non-natives who had
achi eved 1 ess than Grade 10 (Table 55).
The majority of all sentenced inmates (irrespective of native
status) were occupat;o~ally unskilled (Table 56) but it was the status
Indians who reported the highest proportion in this category (86.1%).
The percentage of both native and non-native inmates reporting an
unskilled occupation has risen over the past year (Figure 17). Although
this increase was substantial, conclusions based upon these findings
must be limited due to the possible unreliability of this self-reported data.
The majority of the status Indian group reported a forwarding
address in non-urban centres ;n both northern and southrrn Alberta
(see Table 57). On the other hand, while 51.9% of the Metis and
non-status Indians reported residence in non-urban centres in northern
Alberta, 32.3% ga,ve a 'forward'jng address in Edmonton.

I {
48
Conclusions drawn from this data should be considered with
caution since there were a substantial number of missing cases.
However, since these findings indicate the existence of particular
trends and residency patterns for the status Indian and Metis;
non-status Indi an groups, .further investi gation of thi s rel ationshi p
would be warranted.
The reported incidence of problem alcohol use was significantly
higher for natives than for non-natives. Both the status Indian group
and the Metis, non-status Indian group were more likely to report
alcohol consumption as a problem (39.8% and 32.2%, respectively) than
were the non-natives (21.8%). (See Table 58).
Again caution is urged in interpreting this data. Not only is
reliability affected by the fact that analysis is based upon self-reported
information but also the criteria used in recording problem use of
alcohol varies between institutions.
(b) Inmate Characteristics
Consideration of most serious offence type (based on length
of aggregate sentence) indicated a significant difference between the
native and non-native groups with respect to incarceration for alcohol
offences. It was found that 19.5% of the natives v/ere incarcerated
for a most serious offence that was an ·alcohol-related crime as compared to
3.8% of the non-natives (Table 22). This trend was also evident in
both of the previous one-day profiles (See Table 23 and Table 24 for
presentation of data from the March 31, 1976 and July 16, 1976 studies).
, I !
4·9
TABLE 22
NATIVE STATUS BY OFFENCE TYPE for Sentenced Inmates in Alberta Correctional Institutions
(March 31, 1977)
Most Serious Offence * Violent Major Minor Drugs Alcohol Other Row Totals
Crimes Theft Theft
Native 19.5% 13.2% 32.9% 0.5% 19.57. 14.4% 100% (80) (54) (135) (2) (80) (59) (410)
Non-Native 13.4% 19.5% 38.3% 14.5% 3.8% 10.5% 100% ( 108) (157) (309) (117) (31) (85) (807)
Missing Cases = 5
*In order to compare the March 31, 1977 data with the f~ndings o! the two previous studies, breaking and entering offences were li,cluded In the minor theft category.
---

I J
J
j
1
f
1
[
[
I I
TABLE 23
NATIVE STATUS BY'OFFENCE TYPE for Sentenced Inmates in Alberta Correctional Institutions
Native
Non-Native
Violent Crimes
20.6% (85)
15.1% (128)
Missing Cases = 12 *
(March 31, 1976)
Major Theft
14.6% (60) .
19.8% (168)
Most Serious Offence
Minor* Drugs Alcohol Theft
36.2% (149)
35.5% (301)
1. 7% (7)
15.3% (130)
14.8% (61)
6.0% (51)
Includes Breaking and Entering **
Percent does not sum to 100 because of rounding.
TABLE 24
Other
12.1% (50)
8. 1% (69)
NATIVE STATUS BY OFFENCE TYPE for Sentenced Inmates in Alberta Correctional Institutions
(July 16, 1976)
Most Serious Offence
Violent Major Crimes Theft
* Minor Drugs Theft
Alcohol Other
Native 19.2% (78)
11.3% (46)
34.0% (138)
0.5% (2 )
Non-Native 12.0% (l03)
Missing Cases = 7
*
22. 1% ( 189)
Includes Breaking and Entering
35.4% (303)
16.2% (139)
15.3X (62 )
5.0% (43)
19.7% (80)
9.3% (80)
50
Row Totals
100% (412)
99.8% (847)
**
Row Totals
100% (406)
100% (857)
j
'i
1 .1 iI ,)
1.1
Ii jj
i! ~f
,,-fI il
f1"
'I ;1'
~t'"
1
I
51
A more detailed breakdown of the findings on most serious
offence type for the March 31, 1977 study provided a means of examining
differences between the status Indian group and the Metis, non-status
Indian group (See Table 25). The data indicated that the tende~cy to
be incarcerated for an alcohol crime was significantly higher for a
status Indian (24.0%) than for a Metis or non-status Indian (13.4%).
This fact was obscured when these two groups were both included in the native category.
Native inmates (i.e. both status Indians and Metis, non-status
Indians) were found to be significantly less likely to be incarcerated
for a drug offence (0.5%). This compared to 14.5% for the non-native group (Table 22).
Consideration of mean aggregate sentence (See Figure 7) indicated
that the native inmates tended to be incarcerated for a shorter length
of time (mean aggregate sentence of 261 days) in comparison to the
non-natives (mean aggregate sentence of 297 days).
The proportion of status Indians ~ith an aggregate sentence of
three months or less (33.2%) was significantly higher than the
proportion of Metis and non-status Indians (20.2%) or non-natives (21.0%)
incarcerated for this length of time (Table 26). It is important to note
that this difference between the status Indian group and the Metis,
non-status Indian group would not have emerged if they had been
considered together as native.
The mean number of commitments for the sentenced native inmates
(6.2 commitments) was found to be considerably higher than that for the
non-natives (2.1 commitments). See Figure 8 •
-

r r .. r (.,::;:;~,
"" J.<::< 1..~ b
TABLE 25
NATIVE STATUS BY OFFENCE TYPE for Sentenced Inmates in Alberta Correctional Institutions
(March 31, 1977)
Most Serious Offence
Violent Major Minor & * Breaking Crimes Theft Theft Entering Drugs Alcohol Other Row Totals
Status Indian lB.5% 12.6% 17.2% 13.4% 0.4% 24.0% 13.9% 100% (44) (30) (41) (32) (1) (57) (33) (23B) Metis, 20.9% 14.0% 16.3% 19.B% 0.5% 13.4% 15.1% 100% Non-Status Indi an (36) (24 ) (2B) (34) (1) (23 ) (26) ( 172) Non-Native 13.4% 19.5% lB.O% '20.3% 14.5% 3.B% 10.5% 100% (lOB) (157) ( 145) (164) ( 117) (31) (B5) (B07)
Chi Square = l61.B04; Degrees of Freedom = 12; .E. ~ .001 Missing Cases = 5
* The !lother" category includes the following offence types: dangerous driving or criminal negligence in operation of a motor vehicle; sexual offences (non-violent or non-dangerous); dangerous weapon and related; disorderly conduct and general nuisance; careless driving or driving while disqualified or prohibited; technical violations; other criminal code; Highway Traffic Act; MVAA; Immigration Act; other Federal, Provincial, ~1unicipal Statutes (e.g. Public Health Act, Juvenile Delinquency Act).

~~-"~ .. ------
r
~-- -- - -.,-------------~-
TABLE 26
NATIVE STATUS BY AGGREGATE SENTENCE for Sentenced Inmates in Alberta Correctional Institutions
Status Indi an
Metis, Non-Status Indi an
Non-Native
Chi Square = 20.661 Degrees of Freedom = 8 Significance £~ .01 Missing Cases = 3
3 Months or Less
33.2% (79)
20.2% (35)
21.0% (170 )
3 - 6 Months
22:7% (54)
22.5% (39)
20.2% (163)
Aggregate Sentence
6 r40nths - 1 Year -1 Year 18 Months 18 Months + Row Total s 23.5% 13.5% 7.1% 100% (56) (32) (17) (238) 30.1% 16.8% 10.4% 100% (52) (29) ( 18) (173) 31.8% 17.2% 9.8% 100% (257) (139) (79) (808)
01 (.oj
-

·.~-,~~~~'4 ,--_-- ----
/,
f
I
FIGURE 7
MEAN AGGREGATE SENTE'NCE BY NATIVE STATUS for Sentenced Inmates in Alberta Correctional Institutions
fJn~poPulation (N = 1219) X = 285
. t:"~:=_llZIl
['Nafi'"~~ (N = 411) X = 261
~:if~~s.~
Analysis of Variance: F = 8.628, £ ~ .01 Missing Cases = 3
FIGURE 8
'MEAN NUMBER OF COMMITMENTS BY NATIVE STATUS for Sentenced Inmates in Alberta Correctional Institutions
Entire Population (N = 1193) X = 3.4
Native (N ::: 396) X = 6.2
Analysis of Variance: Missing Cases = 29
Non-Nati Vl'
(N = 797) X = 2.1
F = 114.849, £~ .01
54
I
55
The sentenced native population was more likely to be recidivist.
Approximately one-third of the natives were incarcerated on their fifth
or more commitment on March 31, 1977. Further breakdown indi cated that
36.0% of the status Indians and 27.4% of the Metis and non-status
Indians (in comparison to 6.3% of the non-natives) had five or more
commitments (Table 27).
Almost one-half of the sentenced non-natives (47.1%) incarcerated
on March 31, 1977 were on their first commitment to the institution. This
differed significantly from the sentenced native population. Only 19.3%
of the status Indians and 22.0% of the Metis and non-status Indians
were incarcerated on March 31, 1977 on their first commitment.
TABLE 27
NATIVE STATUS BY NUMBER OF COMmTMENTS for Sentenced Inmates in Alberta Correctional Institutions
Number of Commitments to Institution of Incarcaration
Three or Five or One Two Four More Row Totals Status Indian 19.3% 21.9% 22.8% 36.0% 100% (44) (50) (52) (82) (228) Metis, Non-Status Indi an 22.0% 23.2% 27.4% 27.4% 100% (27) (39) (46) (46) ( 168) Non-Native 47.1% 30.3% 16.3% 6.3% 100% (375) (242) ( 130) (50) (797)
Chi Square = 191.149; Missing Cases = 29 Degrees of Freedom = 6; £ ~ . 001

r r {
J
I
! 1
f
1
t
t f
t
-56
The status Indian group was more likely to be incarcerated
in default of fine payment (lB.l%) than either the Metis, non-status
Indian group (9.B%) or the non-natives (6.3%). See Table 2B. Although
this could be a reflection of the fact that a proportionately greater
number of status Indians were incarcerated for alcohol offences, it
is difficult to draw meaningful conclusions from these findings since
compa,rison data for persons convicted of similar offences for which a
fine was paid are' not currently available.
TABLE 2B
~~TIVE STATUS BY REASON FOR INCARCERATION for Sentenced Inmates in Alberta Correctional Institutions
Reason for Incarceration
In Defaul t of Mandatory Sentence Fine Payment
Status Indian 131.9% lB.1 % (195 ) (43)
Meti s, 90.2% 9.B% Non-Status Indian (156) (17) Non-Native 93.7% 6.3% (757) (51)
Chi Square = 30.822; Degrees of Freedom = 2; £. ~ .001 Missing Cases = 3
I I I
Row Total s I I I I
100% I I I (23B) I I I
100% I I
(173) I I I I
100% I I
(BOB) I I I
I !
I 1 j
I
-'
I 1 J
J. -:1 1}
~
57
Consideration of location within the institutional setting on
March 31, 1977 for the sentenced population indicated very little
difference between the status Indian group, the Metis and non-status
Indian group, and the non-natives (Table 29). Approximately three
quarters of each group was located within the institution itself on
March 31, 1977 (rather than at camp or a CRC, or on a temporary absence
or day parole). Further information with regard to the current use of
such alternatives to institutional incarceration for sentenced inmates
will be made available in the three-month fol1ow-up of the March 31,1977 population.
TABLE 29
NATIVE STATUS BY LOCATION for Sentenced Inmates in Alberta Correctional Institutions
Location
TA/Day Institution Camp Parol e/CRC Other:
I Status Indi an 73.5% 15.6% 10.1% O.B% I I
(175) (37) (24) (2) I I I I ~leti s, 76.9% 18.5% 2.9% 1. 7% I I Non-Status Indian (133) (32) (5) (3 ) I I I I Non-Native 75.7% 11.9% 9.7% 2.7% I I
(612) (96) (78) (22) I I I
Chi Square = 16.815; Missing Cases = 3
Degrees of Freedom = 6; £.~ .01
Row Totals
100% (23B)
100% (173)
100% (BOB)
• .... L

~---........... -~---~ ".------- - -~---------------~
I,
I I {
I i f
! {
I
f
I (
I L
58
3. Short-Term Inmate Population
Inmates with short-term sentences (three months or less) comprised
almost one-quarter (23.3%) of the sentenced population incarcerated on
f~arch 31, 1977. RefE:~rence is made to the n umber and percentage of the
sentenced population at each correctional institution with short aggregate
sentences in a preceding section describing the Sentenced Inmate Population
(See Table 7). As mentioned previously, LeI had the greatest proportion
of sentenced inmates with sentences of three months or less (38.3%).
(a) * Socia-Demographic Background
Short-termers were found to be older than inmates with sentences
of more than three months. Mean age was 28.0 years for those with
three months or less to serve in comparison to 24.7 years for those
with longer sentences (Figure 18). A significant proportion of
inmates with short-term sentences (45.4%) were twenty-six years or
older and there was a much greatel" tendency for these inmates, in
comparison to those with longer sentences, to belong to this older age
category (Table 59).
Although the relationship between length of sentence and level
of educational achievement was statistically significant, differences
between the two groups were not that pronounced. The proportion of
inmates with less than Grade 10 education was slightly greater 'for
short-termers than for those with longer sentences. f1ean level of
educational achievement was 8.9 years in comparison to 9.4 years for
those serving over three months (Table 60; Figure 19).
* See Appendix I for presentation of statistical data.
) ~ , '
: I: i'
) ,)
\ ~-'- ."'\.;

---~~~. ,-- ~ --- .---~ ---
·l 59
Similarly, occupational skills did not serve to differentiate
between the short-termers and the rest of the sentenced inmate
population. The majority of both groups lacked occupational skills.
Since the relationship between length of sentence and occupational
skills was not statistically significant, these data have not been
presented.
Status Indians, in comparison to both the Metis, non-status
Indian group and the non-natives, were significantly more likely to
be serving a sentence of three months or less. The majority of those
with a shorter aggregate sentence, however, were non-native (Table 61).
Consideration of length of sentence and reported alcohol use
i ndi cated that al though the maj ori ty of both groups reported no.
problem with alcohol use, inmates with an aggregate sentence of
three months or less were slightly more likely to report a problem
than those serving longer sentences (i.e. over three months). See
Table 62.
(b) Inmate Characteristics
Inmates with an aggregate sentence of three rr.onths or less were
most likely to be incarcerated for an alcohol offence (27.8%), an offence
categorized as other (21.8% were convicted of offences such as technical
violations, or violations of the Highway Traffic Act or Motor Vehicles
Administration Act), or for minor theft (19.7%). See Table 30.
Considerable differences were noted between inmates with short aggregate
sentences and those serving over three months with respect to incarce
ration for alcohol crimes and offences in the "other" category.
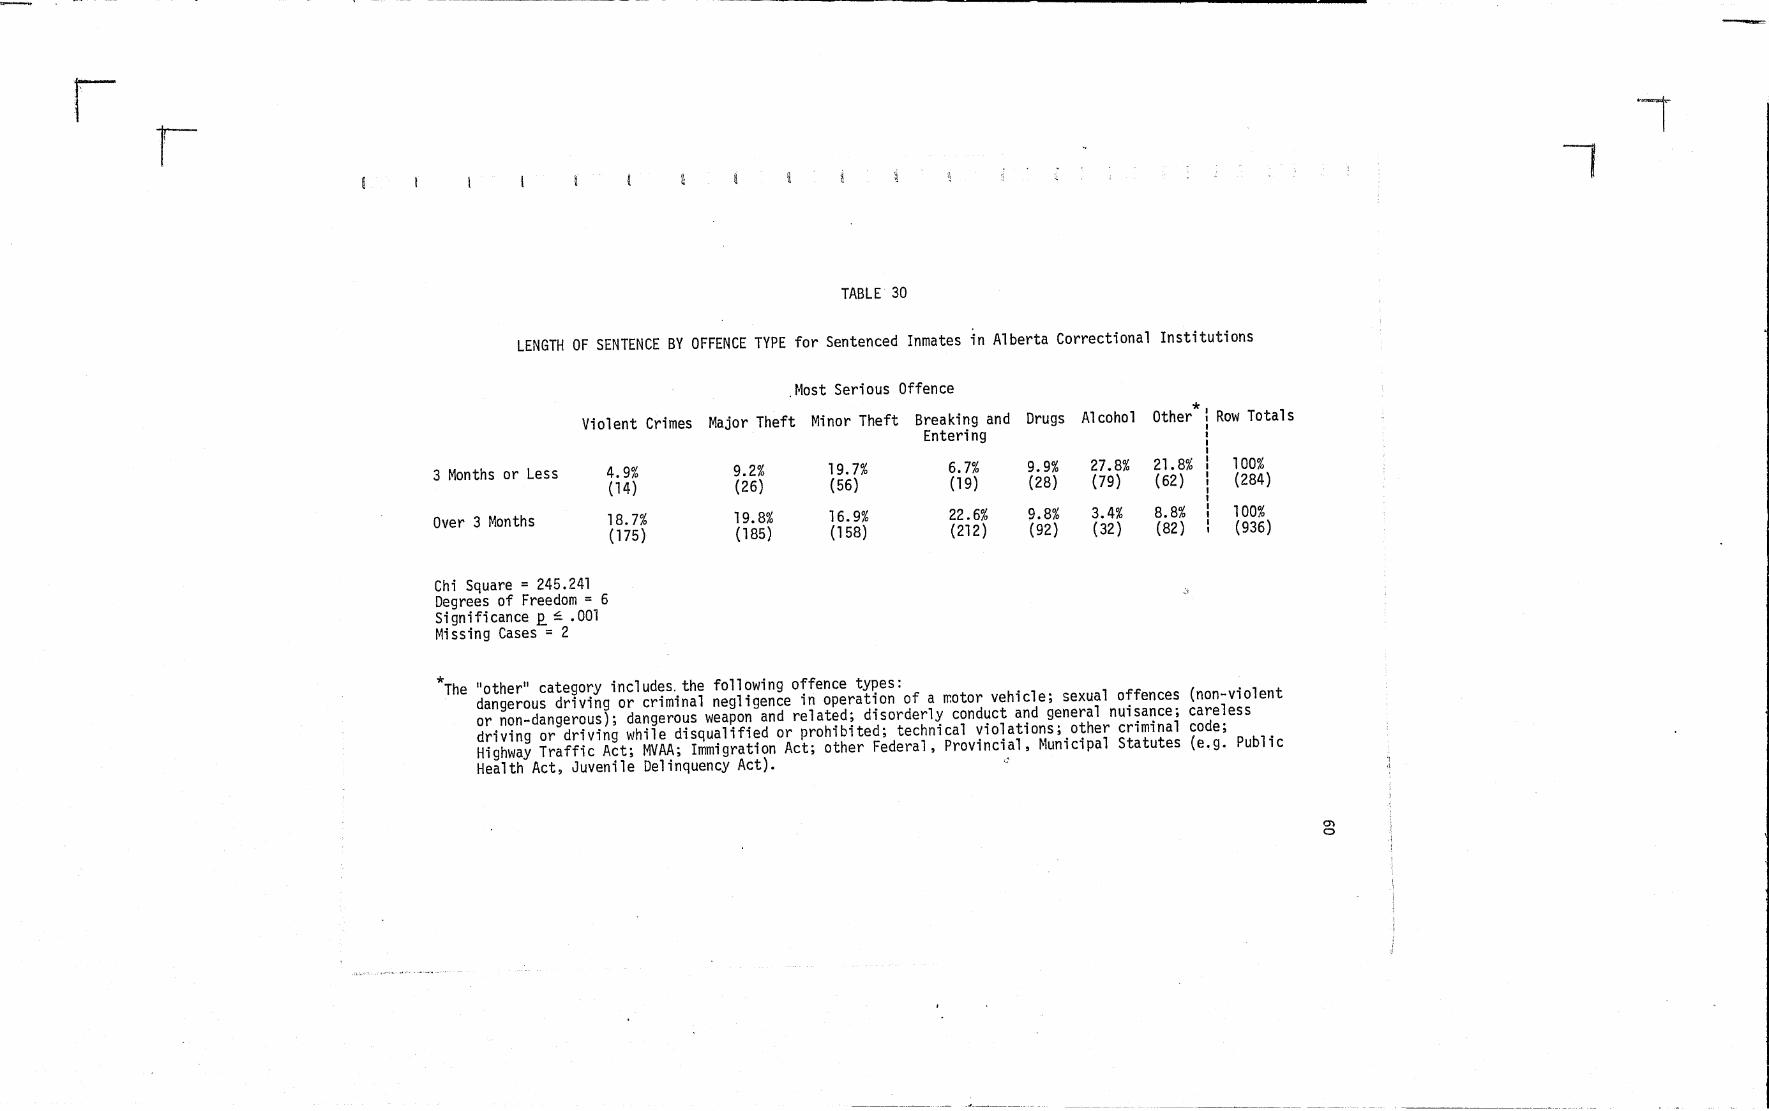
r r
TABLE 30
LENGTH OF SENTENCE BY OFFENCE TYPE for Sentenced Inmates in Alberta Correctional Institutions
.Most Serious Offence * Violent Crimes Major Theft Minor Theft Breaking and Drugs Alcohol Other Row Totals
Entering
3 Months or Less
Over 3 Months
4.9% (14 )
18.7% (175)
Chi Square = 245.241 Degrees of Freedom = 6 Significance £ ~ .001 Missing Cases = 2
9.2% (26)
19.8% (185)
19.7% (56)
16.9% (158)
6.7% (19 )
22.6% (212)
9.9% (28)
9.8% (92)
27.8% 21.8% (79) (62)
3.4% 8.8% (32) (82)
,)
100% (284)
100% (936)
*The lIother ll category incl udes. the foll owing offence types: dangerous driving or criminal negligence in operation of a motor vehicle; sexual offences (non-violent or non-dangerous); dangerous weapon and related; disorderly conduct and general nuisance; careless driving or driving while disqualified or prohibited; technical violations; other criminal code; Highway Traffic Act; t1VAA; Immigration Act; other Federal, Provincial, Municipal Statutes (e.g. Public Health Act~ Juvenile Delinquency Act). ~
0'1 a

---~"~ .. _- ---~
r f
r !
1
I
1
f
f
I f
61
In comparison to inmates with an aggregate s~ntence of over
three months, inmates with short-term sentences were more likely to
be either on their first commitment to the institution or on their
fifth or more commitment (Table 31). Mean number of commitments
for the short-term inmate group was 4.6 (Figure 9). This was slightly
higher than the mean for sentenced inmates with longer sentences and
can be partially explained by the influence of a few short-term.
inmates with an extremely large number of commitments to the institution.
Slightly more than one-third of the short-termers were serving
a sentence in default of fine payment (Table 32). Only 0.7% of those
with an aggregate sentence longer than three months were incarcerated
because they did not pay a fine.
Consideration of length of sentence by location within the
institutional setting on March 31, 1977 indicated that there was a
greater tendency for short-termers, in co~parison to those with an
aggregate sentence of over three months, to be located within the
institution itself on that day (Table 33). Although inmates with short
aggregate sentence~ were less likely to be at a camp on March 31,1977,
no difference was found in the proportion of either group on temporary
absence, day parole, or at a CRC.
u
t ' i
<! '
'I L
I I
-
TABLE 31
LENGTH OF SENTENCE BY RECIDIVISM for Sentenced Inmates in Alberta Correctional Institutions
62
Number of Commitments to Institution of Incarceration One Two Three or Four Five or More
3 Months or Less 43.2% (120)
Over 3 Months 36.7% (337)
Chi Square = 13.059 Degrees of Freedom = 3 Significance £ ~ .01 Missing ~ases = 26
22.7% (63)
29.3% (269)
FIGURE 9
15.0% 19.1% (42 ) (53)
20.4% 13.6% (187) (125)
MEAN NUMBER OF COMMITMENTS BY LENGTH OF SENTENCE for Sentenced Inmates in Alberta Correctional Institutions
Entire Population (N = 1196) X = 3.4 '---- '-x----_
3 Months or Less (N = 278) X = 4.6
Analysis of Variance F = 12.127 Significance £ ~ .01 Missing Cases = 26
~_ver_3 M_o_nth_S ,] (N = 918) X = 3.1
Row Total s
100% (278)
100% (918)
""""

TABLE 32
LENGTH OF SENTENCE BY REASON FOR INCARCERATION for Sentenced Inmates in Alberta Correctional Institutions
Reason for Incarceration
In Defaul t of Fine Payment
3 Months or Less
Over 3 Months
Chi Square = 339.655 Degrees of Freedom = 1 Significance ~ ~ .001
36.6% (104 )
0.7% (7)
TABLE 33
Mandatory Sentence
63.4% (180)
99.3% (931 )
Row Totals
100% (284)
100% (938)
LENGTH OF SENTENCE BY LOCATION for Sentenced Inmates in Alberta Correctional Institutions
Institution
3 Months or Less
Over 3 Months
Chi Square = 16.631 Degrees of Freedom = 3 Significance ~ ~ .001
82.8% (235)
73.4% (688)
Location
Camp TA/Day Other Parole/CRC
6.3% 8.8% 2.1% ( 18) (25) (6)
15.7% 8.7% 2.2% (147) (82) (21)
63
Row Totals
100% (284)
100% (938)
, , I
~ ,
i!
I
1 64
4. Fine Defaul ters
On March 31,1977, 9.1% of the sentenced population (111 inmates)
were incarcerated solely because they did not pay a fine(s). The
percentage of inmates at each correctional institution is presented
in Table 9 and comparison data for the March 31, 1976 and July 16, 1976
studies are available in Table 10.
(a) Socio~Demographic Background*
Analysis of the relationship between reason for incarceration
(that is, incarceration in default of fine payment) and a number of
socio-demographic variables indicated definite differences between
these inmates and the rest of the sentenced population.
Inmates incarcerated in default of fine payment were significantly
more likely to be older (26 years or more) than those serving a mandatory
sentence (Table 63). Mean age of the fine defaulters was 31.3 years in
comparison to 24.9 years for the remainder of the sentenced population
(Fi gure 20).
Although a significant proportion of the sentenced population
reported a low level of educational achievement and lack of occupational
skills, fine defaulters were less likely than those serving a mandatory
sentence to have Grade 10 or better education or occupational skills of
any kind (Table 64 and Table 65). Mean education of inmates incarcerated
in default of fine payment was 8.7 years. This compared to 9.4 years
for inmates serving a mandatory sentence (Figure 21).
* Statistical data pertaining to socio-demographic background are presented in Appendi x 1.

-c---~~~ •. -.- - ~- .---- -- - ---,----------------, -..
r r 1
I I I I 1
I
1
J
I J
r .~
~
I
65
The proportion of status Indians incarcerated in default of
fine payment was significantly greater than the proportion serving a
mandatory sentence. This relationship was reversed for non-native
inmates incarcerated on March 31,1977. Non-natives were much more
1 ike ly to be serving a mandatory sentence than en ther status Indi ans,
Metis or non-status Indians (Table 66),
This finding may be partially explained by the fact that there
is a greater tendency for status Indians to be incarcerated for alcohol
crimes (for ~/hich a fine may be imposed). In addition, economic factors
may also influence the likelihood that certain gt'OUps of inmates
may be more able (or willing) than others to pay a fine.
Inmates incarcerated in default of fine payment were much more
likely to report a problem with alcohol use than those serving a
mandatory sentence (Table 67). This also may reflect the finding that
a high proportion of fine defaulters are incarcerated for an alcohol
offence.
(b) Inmate Characteristics
Analysis of the relationship between reason for incarceration
and offence type indicated that fine defaulters were significantly more
likely to be incarcerated for an alcohol crime or for a crime in the
lI other l1 category such as a technical violation or a violation of the
Highway Traffic Act or Motor Vehicles Administration Act (Table 34).
This is perhaps to be expected since the nature of the offence most
decidedly influences whether a fine is imposed.

-..-~~~ .. ,- - - --~ -- --~ -.- - --,,--------------------
r r iJ~' U •
TABLE 34
REASON FOR INCARCERATION BY OFFENCE TYPE for Sentenced Inmates in Al berta Correctional Institutions
Default of Fine Payment
r·1andatory Sentence
Chi Square = 314.764 Degrees of Freedom = 6 Significance £ ~ .001 Missing Cases = 2
*
Vi 01 ent Crimes
1.8% (2)
16.9% (187)
Major Theft
2.7% ( 3)
18.8% (208)
Minor Theft
9.0% (lO)
18.4% (204)
Most Serious Offence
Breaking and Drugs Entering
0 8.1% ,( 9)
20.8% 10.0% (231) (111)
Alcohol
50.5% (56)
5.0% (55)
* Other
27.9% (31)
10.1% (113 )
Row Totals
100% (111 )
100% (11 09)
Thellotherll category includes the following offence types: dangerous driving or criminal neglrigence in operation of a motor vehicle; sexual offences (non-violent or non-dan~erous); dangerous'weapon and related; disorderly conduct and general nuisance; careless driving or driving while disqualified or prohibited; technical violations; other criminal code; Highway Traffic Act; MVAA; Immigration Act; other Federal, Provincial, Municipal Statutes (e.g. Public Health Act, Juvenile Delinquency Act).
- .......

.~--~"~ .. -'---" ~. ~--- - ~---.----- --~------------~~-------------------...
1 [
I ] f
67
Inmates incarcerated in defaul t of fine payment were found to
have a mean aggregate sentence of 48 days (Figure 10). This compared
to a mean of 308 days for inmates serving a mandatory sentence. The
fact that over 90% of fine defaulters had an aggregate sentence of
three months or less differed significantly from the finding that
only 16.2% of those serving a mandatory sentence had a similar aggregate
sentence (Table 35).
In addition to being characterized by short aggregate sentences
and incarceration for alcohol offences, fine defaulters were also more
likely than those serving a mandatory sentence to be highly recidivist.
The mean number of commitments was found to be 7.2 for fine defaulters
in comparison to 3.1 for those serving a mandatory sentence (Figure 11).
More than one quarter of the inmates incarcerated on March 31, 1977
in default of fine payment had five or more commitments to the
institution (Table 36). The proportion of inmates serving a mandatory
sentence with this rate of recidivism was significantly lo\'/er.
The relationship between reason for incarceration and location
in the institutional setting on March 31, 1977 was not found to be
statistically significant. Three-quarters of the inmates serving a
mandatory sentence were located within the institution itsel f on
March 31,1977. The proportion of fine defaulters was slightly
greater (82.9%). Additional information with regard to this variable
will be made available in the three-month follow-up of this population.
~ , I
1 ' 11 .i U
n'
!L ","'" r
~ """ 1.
68
TABLE 35
REASON FOR INCARCERATION BY AGGREGATE SENTENCE for Sentenced Inmates in Alberta Correctional Institutions
Default of Fine Payment
Mandatory Sentence
Chi Square = 339.655 Degrees of Freedom = 1 Significance £ ~ .001
*
Length of Sentence
3 Months or More than Less Months
93.7% 6.3% (104 ) (7)*
16.2% 83.8% (180) (931 )
3 Row Totals
100% (111)
100% (1111)
These 7 inmates incarcerated in default of fine payment were serving sentences of 3-6 months. '
FIGURE 10
MEAN AGGREGATE SENTENCE BY REASON FOR INCARCERATION for Sentenced Inmates in Alberta Correctional Institutions
Entire Population (N = 1222) X = 285
Defaul t of P~yment (N = 111)
Mandatory Sentence, (N = 1111)
X = 48
Analysis of Variance F = 196.120 Si gn; fi cance £. ~ .01
X = 308
--=-

---~~~.,' ---- '-'~----- - -----,.--- -------------
r I
I I·
r
TABLE 36
REASON FOR INCARCERATION BY RECIDIVISM for Sentenced Inmates in Alberta Correctional Institutions
69
Number of Commitments to Institution of Incarceration
One Two Three or Five or Row Totals , Four More
Default of 34. 5~& 21.8% 16.4% 27.3% 100% Fine Payment (38) (24) (18) (30) (110)
Mandato'fY Sentence 38.6% 28.4% 19.4% 13.6% 100% ( 419) (308) (211 ) (148) (1086)
Chi Square = 14.951 Degrees of Freedom = 3 Significance £~ .01 Missing Cases = 26
FIGURE 11
MEAN NUMBER OF COMMITMENTS BY REASON FOR INCARCERATION for Sentenced Inmates in Alberta Correctional Institutions
Entire Population (N = 1196)
Default of Fine Pay (N = 110) ment
X = 7.2
Analysis of Variance F = 43.637 Significance £ ~ .01 Missing Cases = 26
Mandatory Sentence (N = 1086) X = 3.1
II e: 70
B. Remanded Inmate Population
Inmates who were remanded, sentenced and remanded, committed to
trial, being held for immigration, or awaiting appeal on March 31, 1977
were considered IIremandedll for this study. The findings indicated
that the number of remanded inmates incarcerated in all Alberta
correctional institutions on March 31, 1977 comprised 22.7% of the
total inmate population. This compared to 19.6% on March 31, 1976 and
21.1% on July 16,1976 (See Tables 2,3, and 4).
Since 92.4% of the total number of remanded inmates incarcerated
* on March 31, 1977 were held at FSCI and CRC, the following will consider
only the remanded inmates at these two correctional institutions. Thus
TABLE 37
Number and Percentage of Remanded Inmates in FSCI and CRC
Remanded Inmates Total Inmate Population March/76 July/76 March/77 ~larch/76 July/76 March/77
FSCI 28.2% 31.5% 38.0% 100% 100% 100% (161 ) ( 186) (229) (571) (591) (603) CRC 91.3% 85.3% 79.4% 100% 100% 100% ( 136) ( 122) (135) ( 14·9) (143) (170 )
Total 41.3% 42.0% 47.1% 100% 100% 100% (297) (308) (364) ( 720) (734) (773)
* The additional thirty inmates with remand status on March 31, 1977 held elsewhere in the province included: 11 remanded inmates at FSCI(W), 3 at PRCI, 13 at LCI, and 3 at CCI.

ri f
I t
{
~
~
~ f
f
f
f
I I i i r
i ~,
~--- - ----.------------------
71
the number of remanded inmate's included in this discussion of the
March 31, 1977 remanded inmate population totalled 364 inmates (229
at FSCI and 135 at CRC). Comparison data for the March 31, 1976,
July 16, 1976 and March 31,1977 studies are presented in Table 37.
* (a) Socio-Demographic Background
Of the remanded population incarcerated at FSCI and CRC on
March 31, 1977, 62.6% (228 inmates) were 25 years or younger (mean age
was 25.2 years, median age was 22.6 years). Mean level of educational
h· t 9 6 a s The data indicated that 40.3% (145 inmates) ac levemen was . ye r .
reported less than Grade 10 education and that 58.3% (211 inmates)
reported no occupational skills. These findings were characteristic
of the remanded populations at both institutions. No significant
differences were noted between FSCI and CRC with respect to the age,
educational achievement, or occupational skills of these remanded
inmates.
On March 31, 1977, 22.5% of the remand population at FSCI and
CRC were native (i.e. status Indian, Metis, or non-status Indian).
See Table 68. This compared to 33.7% of the sentenced inmate population.
The proportion of remanded inmates with native status was considerably
higher at FSCI than at CRC (27.5% and 14.1%, respectively).
Differences between FSCI and CRC were most pronounced with
respect to the percentage of remanded inmates in the Metis, non-status
Indian category. The majority of remanded native inmates incarcerated
at FSCI on March 31, 1977 were Metis (37 inmates) rather than statu~ or
*Tables and figures pertaining to the soci~-demogra~hic characteristics of the remanded population are presented ,~ Aopend1x I.
-.1 ,
~ I
}
1
72
non-status Indian (a total of 26 inmates). Calg~ry Remand Centre,
on the other hand, had no remanded Metis inmates on March 31, 1977.
Regional differences with respect to the residence patterns of the
Metis population of Alberta help to explain this finding and to account
for the significantly greater percentage of native remanded inmates
incarcerated at FSCI.
The majority of remanded inmates at both FSCI and CRC reported
a forwarding address in an urban centre (Table 69). The findings also
indicated that 13.0% of the remanded population incarcerated on
March 31, 1977 reported a residence outside of Alberta.
Data on the use of alcohol by remanded inmates indicated that
approximately one-quarter reported a problem (Table 70). However, the
considerable discrepancy in the findings for the two institutions
seems to suggest the possible influence of extraneous factors.
Uniform criteria that \'/ould serve as guidelines in determining and
recording this information have not been established.
(b) Inmate Characteristics
A consideration of most serious offence type for the remanded
inmates at FSCI and CRC was not statistically significant. Very little
difference was ob~erved between the two institutions with respect to
the percentage of inmates remanded for particular types of offences.
A significant proportion of the remand population at both FSCI and CRC
were incarcerated for a most serious offence in the violent crime
category. Table 38 has been included in order to provide some

--~~~ .. -- - ~-- .---~- -- -
r r f
TABLE 38
MOST SERIOUS OFFENCE TYPE for Remanded Inmates at
Most Serious Offence Type
Violent Institution Crime
FSCI 36.7% (84)
CRC 43.0% (58)
Total 39.0% (142)
Chi Square = 5.914 Degrees of Freedom = 6
Major Ninor Theft Theft
8.7% 9.6% (20) (22 )
8.9% 10.4% (12 ) (14 )
8.8% 9.9% (32) (36)
Differences are not statistically significant
*
Breaking and Entering Drugs
18.3% 7.9% (42) (18)
14.1% 11.9% (19 ) (16 )
16.8% 9.3% (61) (34)
FSCI and CRC
* Al cohol Other
1. 7% 17.0% (4) (39)
0.7% 11. 1% (1) (15)
1.4% 14.8% (5) (54)
The "other" category inc1 udes the foll owing offence types: dangerous driving or criminal negligence in operation of a motor vehicle; sexual offences (non-violent or non-dangerous); dangerous weapon and related; disorderly conduct and general nuisance; careless driving or driving while disqualified or prohibited; technical violations; other criminal code; Highway Traffic Act; MVAA; Immigration Act; other Federal, Provincial, ~1unicipa1 Statutes (e.g. Public Health Act, Juvenile Delinquency Act).
** Per cent does not sum to 100 because of rounding.
Row Totals
99.9% ** (229)
100.1% ** (135 )
100% (364)

-~-~~~ .. -- - ~-~ .--~-~ -~- -~--
74
indication of the statistical breakdown of offence type for the
remanded population at these two institutions.
Since the study design of this one-day inmate population profile
imposed built-in time limitations, it was not possible to determine the
total number of days spent on remand by these inmates. However, suffi
cient data was available to calculate the number of days on remand as
of ~1arch 31,1977. Table 39 presents this information for bdth FSCI
and CRC. Differences between the two institutions \'I'ere not found to be
statistically significant. As of March 31, 1977, approximately twenty
percent of the remanded population at FSCI and CRC had been on remand for
more than three months (Table 39).
TAI3LE 39
NUMBER OF DAYS ON REMAND as of ~1arch 31, 1977 for Remanded Inmates at FSCI and CRC
Number of Days on Remand
Institution 10 Days or Less
FSCI 26.2% (60)
CRC 31.9% (43)
Total 28.3% (103)
Chi Square = 6.333 Degrees of Freedom = 3
11 to 30 1 to 3 Days Months
24.5% 31.0% (56) (71)
25.9% 19.3% (35) (26)
25.0% 26.6% (91) (97)
Di ffererices are not stati sti cally si gnifi cant
*
More than 3 Months
18.3% (42)
23.0% (31)
20. H' (73)
Percent does not sum to 100 because of rounding.
Row Totals
100% (229)
* 100% (135)
100% (364)
J r 75
A consideration of the security rating assigned to remanded
inmates at FSCI and CRC showed some variation between the two institutions
(See Table 40). It is most likely that such differences are influenced
by the physi'cal design of the institutions and the types of facilities
available. Although remanded inmates at FSCI are usually assigned
a maximum security rating, inmates with a status of sentenced and
remanded maybe given a medium or even minimum classification.
TABLE 40
SECURITY RATING of Remanded Inmates at FSCI and CRC
Institution
FSCI
CRC
Total
Minimum
5.3% (12 )
0
3.3% (l2)
Chi Square = 196.398 Degrees of Freedom = 2 Significance £.~ .001 Missing Cases =-1
Security Rating
Medium
3.9% (9)
73.3% (99)
29.8% (108)
Maximum
90.8% (207)
26.7% (36)
66.9% (243)
Row Totals
100% (228)
100% (135)
100% (363)

{
I
fJ:
r f {
{
(
f
f
,
i
f
I
~~-------~---
----------------------------------~
76
SUMMARY AND CONCLUSIONS
The present study has focused upon the inmate population incar
cerated in Alberta correctional institutions on March 31, 1977.
Comparisons were made with respect to the findings of the two previous
one-day surveys (March 31,1976 and July 16, 1976) when relevant
differences were noted.
An attempt was made in the March 31, 1977 study to descri be the
sentenced inmate population, four of its sub-groups (the young offenders,
the sentenced native population, the short-term inmate population, and
the fine defaulters), and also the remanded inmate population with
respect to partic~lar socio-demographic and inmate-related characteristics.
The socia-demographic variables under consideration included age,
education, occupation, native status, forwarding address, and alcohol
use. The discussion of inmate-related characteristics involved the
analysis of the following: most serious sentence offence, length of
aggregate sentence, number of commitments, reason for incarceration
(in default of fine payment or mandatory sentence), location within
the institutional setting, security rating, for the total sentenced
population only, number of days remaining to serve from March 31,1977
to remission date, and for remanded inmates, number of days on remand
as of March 31, 1977.
The inmate population incarcerated in Alberta correctional
institutions on March 31,1977 numbered 1740. This constituted an
increase of 122 inmates in comparison to the inmate population reported
in the March 31, 1976 study.
T
j' 1 !
77
The findings of the present study (March 31, 1977) indicated that
there were l22~ (70.2%) sentenced, 394 (22.7%) remanded, and 124 (7.1%)
penitentiary inmates. Considerable variation was noted between the
two one-day surveys with respect to both the number and proportion
of inmates in each group. In compari son to the March 31, 1976 study,
the number of sentenced inmates in the present study had decreased
while the number of remanded and penitentiary inmates had shown an increase.
Sentenced Inmate Population
The sentenced inmate population tended to be younger (approximately
65% were 25 years or younger) and characteri zed by a low 1 eve 1 of educa
tional attainment and lack of occupational skills.
One-third of the sentenced inmates were native (19.5% were
status Indian and 14.2% were Metis, non-status Indian) but the proportion
with native status ~t each provincial correctional institution varied
throughout the province. On March 31, 1977, this percentage ranged
from 17.6% at CCI to 58.6% at PRCI. A comparison of the findings of the
March 31, 1976, July 16, 1976, and March 31, 1977 studies showed little
fluctuation to have occurred in either the actual number or proportion
of sentenced native inmates.
The large number of missing cases with respect to forwarding
address (that is, rural-urban residence) of the sentenced inmates
precluded meaningful analysis.

i ~
i ~
f ~
)
~
~
78
The findings indicated that slightly more than one-quarter of
the sentenced inmates reported a problem with the use of alcohol.
The majority of sentenced inmates were incarcerated on property
offences (some variation was noted between institutions) and had aggregate
sentences of less than one year (approximately 75%). The findings
indicated that LCI had the highest proportion serving short-term sentences
while slightly more than one-third of the sentenced population of both
PRCI and NBFC had aggregate sentences of twelve months or more. Slightly
more than 60% had at least one previous commitment to the institution.
In other words, the majority of the sentenced population were found to
be recidivist.
On March 31,1977, approximately 75% of the sentenced inmate
population were located within the institution itself. Differences
between the institutions with respect to the use made of alternatives
to institutional incarceration (e.g. camp, temporary' absence program,
community residential centre, or day parole) seemed to reflect program
policy and the types of alternatives available to each institution.
Further information with respect to this will be discussed in the
three-month follow-up of the ~1arch 31, 1977 population.
Approximately 80% of the sentenced inmates were classified as
minimum security. Differences between the institutions could be
linked in some cases to institutional programming but for the most part.
were a consequence of a lack of standardization in the criteria used
in security classification.
I i " I ! !' «
i i r
,i J;
, {. It I,
79
The findings indicated that as of March 31, 1977, 57.2% had
less than three months remaining until their release date. Slightly
more than one-quarter had less than one month to serve.
Young Offenders
The findings indicated that 21.6% of the sentenced inmate popu
lation were eighteen years and younger.
No significant differences were found between the young offender
group and the older sentenced inmates with respect to educational
attainment, native status, or rural-urban residence. A significant
proportion of both groups reported no occupational skills and no problem
with alcohol use. (A smaller percentage of young offenders, in compar
ison to the older inmates, reported problematic use of alcohol).
The young offender population and the older sentenced inmates
differed with respect to two major offence types. The young offenders
were significantly more likely to be incarcerated for breaking and entering
and less likely to be serving a sentence for an alcohol-related crime.
Approximately 50% of the young offenders weY'e found to be recidivist
(two or more commitments).
Although they were less likely than the older inmates to be
incarcerated in default of fine payment, conc'Jusions based on this
analysis are limited by the fact that data on individuals convicted of
similar offences for which a fine is paid are not available.
Sentenced Native Population
In comparison to the sentenced non-native inmates, a greater
-

---~~~ .. _- ~ --~ -- -- - ---.----- ----------------~""
ff~
~~
f
{
i j
i 1 i J
f
1
I f
I f
t ~
{
\
.-
80
proportion of the sentenced native population (status Indians, Metis,
and non-status Indians) were older, more poorly educated (mean of 8.2
years), and occupationally unskilled (84.1%). They were also more
likely to reside in rural areas and to report a problem with alcohol
use. A comparison showed these trends to be similar to those found in
the March 31, 1976 and July 16, 1976 studies. For the March 31, 1977
study, considerat.ion of socia-demographic data indicated no significant
differences between the status Indian group and the Metis, non-status Indian group.
However, analysis of the relationship oetween native status and
a number of inmate characteristics indicated Significant differences 1
not only between the sentenced native and non-natlye populations but
also between the status Indian group and the Metis, non-status Indian
group. Comparison of the findings of the present study with those of
the two previous one-day surveys is somewhat limited since the previous
studies did not distinguish between the status Indian group and the
Metis, non-status Indian group.
In comparison to both the Metis, non-status Indian group and
the-non-natives, the status Indian group was Significantly more likely
to be incarcerated for an alcohol offence, to ~ave an aggregate sentence
of three months or less, and to be serving a sentence in default of fine piJyment.
Both the: status Indian group and the Metis, non-status Indians
were found to be highly recidivist. A significant proportion of each
group had five or more commitments. The. mean number of commitments
81
for the sentenced native population was found to be 6.2. This compared
to 2.1 for the sentenced non-native population.
With respect to location within the institutional setting
(institution, camp, temporary absence/CRC, or other) on March 31, 1977,
no significant differences were found between the. status Indian group,
the Metis and non-status Indian group, and the non-natives. Approxi
mately three-quarters of each group was located within the institution itself.
Short-Term Inmate Population
Inmates with short-term sentences (three months or less) comprised
23.3% of the sentenced population incarcerated on March 31, 1977.
Short-term inmates tended to be older (mean of 28.0 years)
than those serving longer sentences. The"findings indicated that 45.4%
of the short-term population were twenty-six years or older and that
they were s1ig~tly more likely than those with longer sentences to have
less than Grad~ -)0 education. The majority of both groups lacked
occupational skills.
The findings indicated that status Indians, in comparison to
the Metis, non-status Indian group and the non-natives, were Significantly
more likely to be serving a sentence of three months or less. It was
also found that short-termers were slightly more likely to report a
problem with alcohol use than those serving longer sentences.
Inmates with short aggregate sentences were most likely to be
incarcerated for an alcohol offence, an offence categorized as lIother"

--~~ ~~~-~--~ -~---.-----
(such as technical violations, or a HTA or MVAA violation),
or for minor theft. In comparison to inmates with longer
sentences, short-term inmates were either on their first commit-
82
ment or on their fifth or more commitment. The high mean number of
commitments of this inmate group (4.6) was due, at least in part,
to the influence of a few short-term inmates with extremf~ly high rates
of recidivism. It was also found that slightly more than one-third
of the short-termers were serving a sentence in default of fine payment.
Short-term inmates, in compar'ison to those with am aggregate
sentence of over three months, were more likely to be located in the
institution on March 31, 1977. It is hoped that the three-month
follow-up of the March 31, 1977 inmate population will provide additional
information regarding the use of alternatives to institutional incarcer
ation with respect to the short-termers.
Fi ne Defaul ters
The findings indicated that on March 31, 1977, 9.1% of the
sentenced population (lll inmates) were incarcerated in dE~fault of fine payment ..
Inmatas incarcerated in default of fine payment WE!re significantly
more likely to be older (mean age was 31.3 years, in comparison to 24.9
years for the remainder of the sentenced population). In addition,
these inmates were found to be less likely to have Grade 10 or better
education or occupational skills of any kind.
A significantly greater proportion of status Indians were
incarcerated in default of fine payment rather than for a mandatory
------------------------~----------~-
83
sentence. Two factors may help to explain this finding: status
Indians are more likely to be incarcerated for an alcohol offence (for
which a fine may be imposed); and certain groups of inmates may be
more economically able (or willing) than others to pay a fine.
It was also found that fine defaulters were more likely to
report a problem with alcohol use than those serving a mandatory
sentence. This finding may be influenced by the fact that a large'
proportion of fine defaulters were incarcerated for an alcohol offence
and also by the fact that the criteria used by the correctional institutions
in recording this information was not at this time standardized or well defined.
Since the imposition of a fine is determined by the nature of
the offence, it is to be expected that fine defaulters were more likely
to be incarcerated for an alcohol offence or for a crime such as a
technical violation or a violation of the Highway Traffic Act or Motor
Vehicles Administration Act.
Over 90% of the fine defaulters had an aggregate sentence of
three months or less (mean of 48 days in comparison to a mean of 308
days for inmates serving a mandatory sentence). These inmates serving
in default of fine payment were also found to br:. highly recidlvist.
More than one-quarter of the fine defaulters had five or more commit
ments to the institution.
Remanded Inmate Population
A total of 394 inmates were "remandedll in custody on March 31,
1977. This included inmates who were remanded, sentenced and remanded,

f t
~~--- -- -- ~--.-----~----~---------------------------
,84
committed to trial, being held for immigration, or awaiting appeal.
Since 92.4% of this total were incarcerated at FSCI and CRC on
March 31, 1977 (364 inmates~ discussion of the remanded inmate
population was restricted to a consideration of remanded inmates at
these two correctional institutions. This included 229 inmates at FSCI
and 135 at CRC.
No significant differences were found to distinguish t~e
remanded inmates at FSCI and CRC with respect to age, educational
achievement, or occupational skills. The findings indicated that
62.6% of remanded popuhtion under consi deration were twenty-five
years or younger, that 40.3% reported less than Grade 10 education,
and that 58.3% reported no occupational skills.
A difference was found between the two correctional institutions
with respect to the proportion of remanded inmates with native status:
27.5% of the remanded population at FSCI were native in comparison to
14.1% at CRC.,'
The majority of remanded inmates at both correctional institu
tions reported a forwarding address in an urban centre. It should also
be noted that 13.0% of the remanded population at FSCI and CRC reported
a residence outside of Alberta.
The findings indicated that approximately one-quarter of the
remanded inmates reported a problem with alcohol use. The considerable
discrepancy, however, between the two correctional institutions is
perhaps indicative of the influence of additional factors such as the
lack of uniform criteria in the recording of this information.
ri II
. '
,I
!t
85
Little difference was noted between FSCI and CRC with respect
to the percentage of inmates remanded for particular types of offences.
A significant proportion of the remanded inmate population were
incarcerated for a most serious offence in the violent crime category.
The calculation of number of days on remand as of March 31, 1977
indicated that approximately twenty percent of the remanded population
at FSCI and CRC had been on remand for more than three months.
Variation in the security ratings assigned to remanded inmates
at the two correctional institutions was most likely influenced by the
physical design and types of facilities available. An additional
factor to be considered is that inmates with a sentenced and remanded
status were also included in the remanded inmate population under discussion.
Analysis of the socio-demographic and inmate characteristics
of these inmate groups was intended to provide a description of the
clientele under the jurisdiction of the provincial correctional institu
tions. Conclusions bas~d on these findings should be considered with
some caution. The use of self-reported data and the lack of cro~s
province standardization in record-keeping procedures placed some limita
tions on the analY~is for this study. However, the findings are
indicative of the type of data currently available and do provide a
source of information relevant to the development of institutional and
community programming and to institutional operation.

_-~w .. -_~_--~~ ____ -_--------.--_____________________________ _ r f f
1
1
1
~ { .
1
t
1 L f"
1-
\ .
i'
L r \
APPENDIX I:
Socia-Demographic Characteristics of
Sentenced Inmate Population; Young Offenders; Sentenced Native
Population; Short-Term Inmate Population; Fine Defaulters; Remanded
Inmate Population (March 31, 1977)
86
-"as

r r
--~-----------------------------------------------.----'-------
Age 28
FIGURE 12
MEAN AND MEDIAN AGE of Sentenced Inmates in Alberta Correctional Institutions (March 31, 1977)
21.1
Missing Cases = 4
Institutions
• Mean
o Median

~- -~~~. ,--- --~ .~-------- ---.------~----------------------
r Fi r 88 -, [ TABLE 41
f AGE of Sentenced Inmates in Alberta Correctional Institutions
(March 31, 1977)
Age
J . Institution 18 Years or 19 - 25 Years 26 Years and Row Totals \ Younger Older
f NBFC 36.8% 51.3% 12.0% 0* ,100.1% (43) (60) (14) (117)
I PRCI 25.5% 45.5% 29.0% 100% (37) (66) (42) (145 ) LCI 22.7% 35.5% 41.8% 100%' [ (32) (50) (59) (141 ) FSCI 20.7% 41.4% 37.9% 100%
I (66) (132) (121 ) (319) CCI 19.6% 41.2% 39.2% 100% (61) (128) (122) (311 ) BCee 15.6% 47.6% * 36.7% 99.9% (23) (70) (54) (147)
} FSC!(W) 2.6% 57.9% 39.5% 100% (1) (22) (15) (38) f Total 21.6% 43.3% 35.1% 100%
(263)** (528) (427) (1218) f
Chi Square = 53.774
f Degrees pf Freedom = 12 Si gni fi cance E.. 6 .001 Missing Cases = 4
* Per cent does not sum to 100 because of rounding.
**Since the number of sentenced inmates inca'rcerated at CRC on March 31, 1977 (4) precluded meaningfu'l analysis, eRC data were not presented on this table. However, in the section describing the .¥oung Offenders,
{ the number of sentenced inmates who were eighteen years or younger on March 31,1977 included one additional inmate from CRC (N ~ 264).
\
-~~~------.----- -"-

_--, -~"'i .--~---~ ~-~---
=
r r
TABLE 42
AGE of Sentenced Inmates in Alberta Correctional Institutions (March 31, 1976 and July 16, 1976)
18 Years or Younger Over 18 Years Row Totals
Institution March 31/76 July 16/76 March 31/76 July 16/76 March 31/76 July 16/76
NBFC 25.0% 40.7% 75.0% 59.3% 100% 100% (12 ) (11 ) (36) ( 16) (48) (27)
PRCI 38.3% 37.2% 61.7% 62.8% 100% 100% (64) (58) (103) (98) (167) (156)
LCI 25.7% 18.2% 74.3% 81.8% 100% 100% (36) (26) (104) (117) (140) ( 143)
FSCI 25.9% 23.3% 74.1 % 76.7% 100% 100% (98) (88) (280) (289) (378) (377)
CCI 2"1.0% 23.4% 79.0% 76.6% 100% 100% (76) (92) (286) (301) (362) (393)
Bcec 25.0% 21.2% 75.0% 78.8% 100% 100% (25) (22) (75) (82) (100) (104)
FSCI (W) 6.9% 5. 1% 93. 1% 94.9% 100% 100% ( 4) (3) (54) (56) (58) (59)
Total 25. 1% 23.8% 74.9% 76.2% 100% 100% ( 315) (300) (938) , (959) (1253) (1259)
co Missing Cases: March 31/76 = 18; July 16/76 = 11. '.0

--~~~ .. --~ -~~
r r
Grade
10
9
8
r u .
FIGURE 13
MEAN EDUCATION LEVEL of Sentenced Inmates in Alberta Correctional Institutions
- 1.Cf
:1 "1.7 r- q,{;,
r--: I , ,
, : j .. r
I , i
i : I I ! ,
I i ; I I •
I 1 I j f I I
I j I i i
i i
BCCC FSCI (W) NBFC
Missing Cases = 9
(March 31, 1977)
:'./,1/ r---
1.1 'to J r l i
j
;
I I I I I I I I
! j i J J CCI LCI FSCI
Institutions
Cf,3 ~ I
8.'1 r--'-
I I
PRCI Total Sentenced Population
\.0 o

--~~~ ... - -- - ~--- .----- ---- - - -
TABLE 43
EDUCATION LEVEL of Sentenced Inmates in Alberta Correctional Institutions
(March 31, 1977)
Education
Institution Less than Grade 10
PRCI
LCI
FSCI
CCI
NBFC
BCCC
FSCI (W)
Total
60.8% (87)
57.1% (80)
47.9% ( 153)
46.9% ( 145)
40.2% (47)
38.8% (57)
34.3% (13 )
48.0% (582)
Chi Square = 25.06 Degrees of Freedom = 6 Significance ~6 .001 Missing Cases = 9
Grade 10 and Better
39.2% (56)
42.9% (60)
52.1% (166)
53.1% (164)
59.8% (70)
61.2% (90)
65.8% (25)
52.0% (631 )
91
! I t
1 :j !
Row Totals
100% (143)
100% (140)
~ 100% (319)
100% I
(309)
100% ( 117)
100% (147)
100% (38)
100% (1213)

r r
TABLE 44
EDUCATION LEVEL of Sentenced Inmates in Alberta Correctional Ins ti tut ions
(March 31, 1976 and July 16, 1976)
Less than Grade 10 Grade 10 and Better
Row Totals Institution March 31/76 July 16/76 March 31/76 July 16/76- March 31/76 July 16/76 PRCI 63.3% 67.7% 36.7% 32.3% 100% 100% (105) ( 105) (61) (50) (166) (155) LCI 57.9% 57.0% 42.1% 43.0% 100% 100% (81 ) (81) (59) (61) (140) (142) FSCI 53.9% 49.6% 46. 1% 50.4% 100% 100% (201) (187) (172 ) (190) (373) (377) CCI 41.6% 39.8% 58.4% 60.2% 100% 100% ( 149) (156) (209) (236) (358) (392) NBFC 47.9% 48.1% 52. 1% 51.9% 100% 100% (23) (13) (25) (14) (48) (27) BCCC 46.0% 37.5% 54.0% 62.5% 100% 100% (46) (39) (54) (65) (100) (104) FSCI O~) 41. 1% 33.9% 58.9% 66.1% 100% 100% (23) (20) (33) (39) (56) (59) Total 50.6% 47.9% 49.4% 52.1% 100% 100% \0
I\.)
(628) (601 ) (613) (655) (1241) (1256) Missing Cases: March 31, 1976 = 30; July 16, 1976 = 14
----~-----~----~------~

----~"~.-- ----- ~~~--- - -..,.----------------------------------------------
f
I f
(
f
I L
TABLE 45
OCCUPATION of Sentenced Inmates in Alberta Correctional
(March 31, 1977)
* Reported Occupation
Institution Unskilled Skill ed
LCI
NBFC
CCI
PRCI
FSCI(W)
FSCI
BCCC
Total
Chi Square = 44.84 Degrees of Freedom = 6 £. ~ .001 Missing Cases = 10
*
80.6% 19.4% (112) (27)
80.3% 19.7% (94) (23)
80.1% 19.9% (249) (62)
75.2% 24.8% (109) (36)
63.2% 36.8% (24) (14 )
62.1% 37.9% (197) ( 120)
61.4% 38.6% (89) (56)
72. H~ 27.9% (874) (338)
93
Institutions
Row Totals
100% (139)
100% (117)
100% (311 )
100% (145)
100% (38)
100% ( 317)
lOmb (145 )
100% (1212 )
All inmates who reported an occupation in unskilled personal service, or as labourer, student, or housewife, or who were retired, unemployed, or held no occupation were grouped in the "unskilled ll category.
The IIskilled ll category included all inmates who reported a managerial, farming, professional, clerical, or trade occupation or an occupation in skilled personal service.

-- -~~~ ... -----' ~--~ --- - --,-----------------------------------------------
r r
"
TABLE 46
OCCUPATION of Sentenced Inmates in Alberta Correctional Institutions
(~1arch 31,1976; July 16, 1976; r~arch 31,1977) Reported Occupation
Unski lled * Skilled Row Totals
Institution ~llarch/76 July/76 March/77 March/76 July/76 March/77 March/76 July/76 March/77
LCI 70.6% 78.9% 76.3% 29.4% 21.1~b 23.7% 100% 100% 100% (96) (112 ) ( 106) (40) (30) (33) ( 136) (142) (139)
NBFC 55.3% 63.0% 72.6% 44.7% 37.0% 27.4% 100% 100% 100% (26) ( 17) (85) (21) (10) (32) (47) (27) (117)
CCI 40.7% 60. 1% 77.8% 59.3% 39.9% 22.2% 100% 100% 100% (146 ) (236) (242) (213) ( 157) (69) (359) (393) (311 )
PRCI 66.7% 74.8% 70.3% 33.3% 25.2% 29.7% 100% 100% 100% (11 0) ( 116) (102) (55) (39) (43) (165 ) (155) (145)
FSCI(W) 9. 1% 15.5% 13.2% 90.9% 84.5% 86.8% 100% 100% 100% (5) (9) (5) (50) (49) (33) (55) (58) (38)
FSCI 60.5% 53.8% 58.4% 39.5% 46.2% 41.6% 100% 100% 100% (219) (203) ( 185) (143) (174 ) ( 132) (362) (377) (317 )
BCCC 46.5% 48.1% 54.5% 53.5% 51. 9% 45.5% 100% 100% 100% (46) (50) (79) (53) (54) (66) (99) (104 ) ( 145)
Total 53.0% 59.2% 66.3% 47.0% 40.8% 33.7% 100% 100% 100% (648) (743) (804) (575) (513) (408) (1223) (1256) (1212 ) \0
~
Missing Cases: March 31, 1976 = 48; July 16, 1976 = 14; March 31, 1977 = 10
* This category is comprised only of sentenced inmates who reported an occupation of labourer or no occupation.

~ ~-~-- - -----,------------------------
95
TABLE 47 I NATIVE STATUS of Sentenced Inmates in Alberta
Correctional Institutions
Native Status , t •• , •
j Meti s,
Institution Status Indian Non-Status Indian Non-Native Row Totals
PRCI 25.5% 33.1% 41.4% 100%
I (37) (48) (60) (145)
FSCl (W) 28.9% 23.7% 47.4% 100%
J
(11) ( 9) (18) (38)
LCI 36.2% 7.1% 56.7% 100% (51) (10) (80) (141 )
FSCI 19.1% 19.4% 61.5% 100% (6l) (62) (196) (319)
BCCC 19.9% 6.1% 74.0% 1 OO,~ (29) (9) (108) ( 146)
NBFC 10.3% 13.8% 75.9% 100% (12) (16) .(88) (116)
CCl 11.9% 5.8% 82.3% 100% (37) (18) (256) (311 )
CRC (1) (2) (3)
Total 19.5% 14.2% 66.3% 100%
r (238) (173) (808) (1219)
( Chi Square = 145.989
I Degrees of Freedom = 14 Si gni fi cance £. f .001
I Missing Cases = 3
* eRG data were included in this table in order that the totals presented f
be consistent with the information provided in the section on the Sentenced Native Inmate Population.
I I
-- ___ .... __ L .. ___ --'--......o.~~ ___ _
---- ~----~ ----~

--~~~.,---..
r r
fl
QJ 100 >
or-.jj ItS z: 50 QJ S-
cl:
0 ..c: 3:
III QJ .jj ItS E s::
1-1
4-!=> .jj
s:: QJ
U
S-QJ
0..
- --- -----~-----.-
/1 ,
FIGURE 14
NATIVE STATUS of Sentenced Inmates in Alberta Correctional Institutions
(March 31, 1977)
Institutions III Status Indian
U ~1etis, Non-Status Indian
..

.~-~"~. <-- ~-- -~ .. --.---.-~-----------------------.-----
-~
-=
97 98

--~~~ .. ----
I I r
1
I t
I 1
f
f
1
1
1
---- ~---~-----
TABLE 50
AGE BY EDUCATION for Sentenced Inmates in Alberta. Correcti ona 1 Insti tuti ons
Education
Less than Grade 10
Grade 10 and Better
18 Years or Younger
Over 18 Years
Chi Square = 1.839 Degrees of Freedom = 1
51.7% (136)
46.8% (446)
Differences are not statistically significant Missing Cases = 5
TABLE 51
48.3% ( 127)
53.2% (508)
AGE BY NATIVE STATUS for Sentenced Inmat1es in Alberta Correctional Institutions
Native Status
Metis, Status Non-Status Indian Indian
18 Years or Younger 16.3% 13.6% (43) (36)
Over 18 Years 20.4% 14.3% (195 ) ( 137)
Chi Square = 2.612 Degrees of Freedom = 2 . Differences are not statistically significant Missing Cases = 3
Non-Native
70.1% (185 )
65.3% (623)
1 1 I' 1 1 1 1 1 1 I I I 1 I I 1 1
99
Row Total s
100% (263)
1 OO~~ (954)
Row Totals
100% (264)
100% (955)
TABLE 52
AGE BY OCCUPATION for 'Sentenced Inmates in Alberta Correctional Institutions
Age
18 Years or Younger
Over 18 Years
Chi Square = 28.285 Degrees of Freedom = 1 Significance E.~ .001 Missing Cases = 6
Reported Occupation
Unski 11 ed
85.2% (225)
68.4% (651)
TABLE 53
S0me Ski 11 s
14.8% (39)
31.6% (301)
AGE BY ALCOHOL" USE for Sentenced Inmates in Alberta Correctional Institutions
18 Years or Younger
Over 18 Years
Chi Square = 74.473 Degrees of Freedom = 1 Significance E~ .001 Missing Cases = 10
Reported Alcohol Use
Problem
5.7% (15)
32.6% (309)
No Problem
94.3% (248)
67.4% (640)
100
Row Totals
100% (264)
100% (952)
Row Totals
100% (263)
100% (949)

t r f
J
r
I I ~
f j
r ~
~
r t [
~~
~~:
[
TABLE 54
NATIVE STATUS BY AGE for Sentenced Inmates in Alberta Correctional Institutions
Age
18 Years 26 Years and Under 19-25 Years and 01 der
Status Indian 18.1% 37.4% 44.5% (43) (89) (106)
Metis, 20.8% 39.9% 39.3% Non-Status Indian (36) (69) (68) Non-Native 22.9% 45.7% 31.4%
(185 ) (369) (254)
Chi Square = 15.479; Missing Cases = 3
Degrees of Freedom = 4; R. ~ .01
FIGURE 15
MEAN AGE BY NATIVE STATUS for Sentenced Inmates in Alberta Correctional Institutions
x = 25.5
Non-Native (N = 808) X = 25.0
Analysis of Variance: F = 4.955, R. ~ .05 Missing Cases = 3
101
Row Total
100% (238)
100% ( 173)
100% (808)
... \ ..
if: , !,
! :
i ;
-
TABLE 55
NATIVE STATUS BY EDUCATION for Sentenced Inmates in Alberta Correctional Institutions
Reported Education Achieved
102
Less than Grade 10 Row Totals Grade 10 and Better
Status Indian 73.9% 26.1% (176 ) (62)
Metis, 71.5% 28.5% Non-Status Indian ( 123) (49) Non Native 35.1% 64.9%
(282) (522)
Chi Square = 156.143; Degrees of Freedom = 2; R.~ .001 Missing Cases = 8
FIGURE 16
100% (238)
100% (172)
100% (804)
MEAN EDUCATION BY NATIVE STATUS for Sentenced Inmates in Alberta Corr~ctiona1 Institutions
Entire POPUla~ (N = 1214)
~ X = 9.3
Native (N = 410) X = 8.2
Analysis of Variance: Missing Cases = 8
CIon-Nati ve (N = 804) . X = 9.9
" """""""""-........ """""'_..a
F = 201. 496, E.. ~ .01
. .. ~~ ..
...

r r r L
I i I r r [
[
[
[
"0 Q) r-r-..... ~ VI t:
::> oj.)
t: Q) u
S-Q)
0..
Status
Metis,
TABLE 56
NATIVE STATUS BY OCCUPATION for Sentenced Inmates in Alberta Correctional Institutions
Reported Occupation
Unskilled Some Skills
Indian 86.1% 13.9% (204) (33)
81.5% 18.5% Non-Status Indian ( 141) (32 )
Non-Native 65.8% 34.2% (528) (275)
Chi Square = 46.55; Degrees of Freedom = 2; £ ~ .001 Missing Cases = 9
100
80
60
40
20
0
FIGURE 17
: OCCUPATIONAL SKILLS of Sentenced Inmates in Al berta Correctional Institutions
March/76 July/76 March/77
103
Row Totals
100% (237)
100% (173 )
100% (803)
III Native Inmates
:~ Non-Native Inmates
...---..~ ________ ~_~ __ ~ ___ ~C __ • _. ______ _
; 1
I 1 ! ;1
! J .
I 1 d !!
~ :1 il 'I
IJ
,I
I i
I
I !
TABLE 57
NATIVE STATUS BY FORWARDING ADDRESS for Sentenced Inmates in Alberta Correctional Institutions
Forwarding Address Location
104
Northern Southern Edmonton Calgary Alberta Alberta Other Row Totals
Status Indian 9.8% 6.6% 59.0% (18) (12) ( 108)
Metis, 32. 3~~ 7.0% 51. 9% Non-Status Indian (51) ( 11) (82) Non-Native 30.7% 29.9% 21.0%
(209) (203) (143)
Chi Square = 198.387; Degrees of Freedom = 8; £ G
Mi ss i ng Cases = 201:N -
*
16.9% 7.7% (31) (14 )
3. 1% 5.7% (5) (9 )
6.2% 12.2% (42) (83)
.001
A large proportion of the missing cases was due to the fact that forwarding address was not available on all admiss·ion forms (LCI Nordegg) at the time of the March 31,1977 study. '
TABLE 58
NATIVE STATUS BY ALCOHOL USE for Sentenced Inmates in Alberta Correctional Institutions
Reported Alcohol Use
100% ( 183)
100% (158)
100% (680)
Problem No Problem Row Totals Status Indi an 39.8% 60.2%
(94) (142) Metis, 32.2% 67.8% Non-Status Indian (55) (116) Non-Nati ve 21.8% 78.2%
(175 ) (627)
Chi Square = 33.072; Degrees of Freedom = 2; £!f .001 Missing Cases = 13
100% (236)
100% (171)
100% (802)
--

--~"~ .. -- ---- .~--~---
~
f
I f
I
f
TABLE 59
LENGTH OF SENTENCE BY AGE for Sentenced Inmates in Alberta Correctional Institutions
Age
18 Years or 19-25 Years Younger
3 Months or Less 18.3% (52)
Over 3 Months 22.6% (212)
Chi Square = 17.584 Degrees of Freedom = 2 Significance £ ~ .001
36.3% (103)
45.5% (427)
FIGURE 18
26 Years or Older
45.4% (129)
31.9% (299)
MEAN AGE BY LENGTH OF SENTENCE for Sentenced Alberta Correctional Institutions
Inmates
Entire Population (N=1222) X = 25.5
3 Months or Less (N = 284)
Over 3 Months (N = 938)
X = 28.0
Analysis of variance F = 28.281 Si gni fi cance £ 6 .01
X = 24.7
105
1 J
Row Totals
100% (284)
100% (938)
.. \ ,j
i 'J,
i
in I
r --~~. -~ .. --- --------"
TABLE 60
LENGTH OF SENTENCE BY EDUCATION for Sentenced Inmates in Alberta Correctional Institutions
Reported Education Achieved
106
Less than Grade 10 Grade 10 and Better I Row Totals I
3 Monhts or Less
Over 3 Months
Chi Square = 6.775 Degrees of Freedom = 1 Si gni fi cance £ ~ .01 Missing Cases = 5
54.8% (155)
45.7% (427)
FIGURE 19
I
45.2% I I I
(128) I I I
54.3% I I I
(507) I I
MEAN EDUCATION BY LENGTH OF SENTEliCE for Sentenced Inmates in Alberta Correctional Institutions
Entire Population (N = 1217)
3 Months or Less (N = 283) X = .8.9
Analysis of Variance F = 10.947 Si gni fi cance £ ~ .01 Missing Cases = 5
---_--.::-----] Over 3 ~lonths (N = 934) X = 9.4 _
100% (283)
100% (934)

--~"~ .. _- ~-- ---~---- ------..--.,.
r r f
f
107
TABLE 61
LENGTH OF SENTENCE BY NATIVE STATUS for Sentenced Inmates in Alberta Correctional Institutions
Status Indian
3 Months or Less 27.8% (79)
Over 3 Months 17.0% (159 )
Chi Square = 16.257 Degrees of Freedom = 2 Significance .P. ~ .001 Missing Cases = 3
Native Status
Metis, NonStatus Indian
12.3% (35)
14.8% (138)
TABLE 62
Non-Native
59.9% (170)
68.2% (638)
Row Totals
100% (284 )
1 OO?~ (935)
LENGTH OF SENTENCE BY ALCOHOL USE for Sentenced Inmates in Alberta Correctional Institutions
3 Months or Less
Over 3 Months
Chi Square = 4.513 Degrees of Freedom = 1 Si gni fi cance .p. ~ .05 Missing Cases = 10
Reported Alcohol Use
Problem No Problem
31.8% 68.2% (90) (193)
25.2% 74.8% (234) (695)
Row Totals
100% (283)
100% (929)
I i
"
:1 I}
'I !I 'J
i il
1
'l
, ';
il
V
Ii fl
~ If " r;
~!
~'
11
---- -------~-- ---------
TABLE 63
REASON FOR INCARCERATION BY AGE for Sentenced Inmates in Alberta Correctional Institutions
Age
108
18 Years and Under
19-25 Years 26 Years and Older
Row Totals
Defaul t of 11.7% Fine Payment (13)
~landatory Sentence 22.6% (251 )
Chi Square = 30.075 Degrees of Freedom = 2 Significance .P.~ .001
29.7% 58.6% (33) (65)
44.7% 32.7% (497) (363)
FIGURE 20
100% (111 )
100% (1111 )
MEAN AGE BY REASON FOR INCARCERATION for Sentenced Inmates in Alberta Correctional Institutions
Entire Population (N = 1222)
Default of Fine Pay (N = 111) ment
X = 31. 3
Analysis of Variance F = 49.358 Significance'p'~ .01
Mandatory Sentence (1'1 = 1111)
X = 24.9

TABLE 64
REASON FOR INCARCERATION BY EDUCATION for Sentenced Inmates in Alberta Correctional Institutions
Recorded Education A~hieved
109
Less than Grade 10
Grade 10 and Better
Row Totals
Default of Fine Payment
Mandatory Sentence
Chi Square = 7.192 Degrees of Freedom = 1 Significance £ b .01 Missing Cases = 5
60.0% (66)
46.6% ( 516)
FIGURE 21
40.0% (44)
53.4% (591 )
100% (ll 0)
100% (1107 )
MEAN EDUCATION BY REASON FOR INCARCERATION for Sentenced Inmates in Alberta Correctional Institutions
Entire Population (N = 1217) X = 9.3
Default of Fine Pay (N = 110) ment
Mandatory Sentence (N = 1107)
X = 8.7
Analysis of Variance F = 11. 281 Significance £ 6 .01 Missing Cases = 5
X = 9.4
I
I
i
t i !
I II
f, :
I! 1 t
! I.
r
j
:\
1
)j ';
II Ii ~
TABLE 65
REASON FOR INCARCERATION BY OCCUPATION for Sentenced Inmates in Alberta Correctional Institutions
Reported Occupation
110
Ski lled
18.2% (20)
Unskilled Row Totals Defaul t of Fine Payment
Mandatory Sentence
Chi Square = 5.783 Degrees of Freedom = 1 Significance £ ~ .02 Missing Cases = G
28.9% (320)
81.8% (gO)
71.1% (786)
100% (110)
100% (11 06)
--=

It
f 1
I
! 1
I ! I i J
1
J
1
f
(
~
i ~.~
~,
111
TABLE 66
REASON FOR INCARCERATION BY NATIVE STATUS for Sentenced Inmates in Alberta Correctional Institutions
Default of Fine Payment
Mandatory Sentence
Chi Square = 30.822 Degrees of Freedom = 2 Significance £ ~ .001 Missing Cases = 3
Status Indian
38.8% (43)
17.6% (195)
Native Status
Metis, Non-Status Indian
15.3% (17)
14.1% (156)
TABLE 67
Non-Native I Row Totals I I I I I
45.9% I 100% I
(51) I (111 ) I I I
68.3% I 100% I
(757) , (11 08) I
REASON FOR INCARCERATION BY ALCOHOL USE for Sentenced Inmates in Alberta Correctional Institutions
Default of Fine Payment
Mandatory Sentence
Chi Square = 18,8979 Degrees of Freedom = 1 Significance £ ~ .001 Missing Cases = 10
Reported Alcohol Use
Problem
44.1 % (49)
25.0% (275)
No Problem
55.9% (62)
75.0% (826)
I Row Totals , I I , 100% I I (111 ) I I ,
100% , I , (1101 ) I
l "1 ~ ) ,
! Jt
I~
)
1
\
i i
I i ~
\ J
112
TABLE 68
NATIVE STATUS of Remanded Inmates at FSCI and CRC
Native Status
Institution Status Metis,
* Indian Non-Status Indian Non-Native Row Totals 10.5% 17.0% 72.5% 100% (24) (39) (166) (229)
FSCI
8.2% 5.9% 85.9% 100% (11 ) (8) (16) (135)
CRC
9.6% 12.9% 77.5% 100% (35) (47) (282) (364)
Total
Chi Square = 33.978; Degrees of Freedom = 2; Significance £L .001 * On March 31, 1977, the remanded population included 2 non-status Indians at PSCI and 8 at CRC.
TABLE 69
FORWARDING ADDRESS of Remanded Inmates at FSCI and CRC
Location
Northern Northern Institution Edmonton Cal gary Alberta Alberta Other FSCI 66.1% 3. 1% 16.5% 0.9% 13.4% ( 148) (7') (37) (2) (30) CRC 8.7% 73.9% 1. 7% 3.5% 12.2% (lO) (85) (2) (4) (14 )
Total 46. 6~~ 27.1% 11.5% 1. 8% 13.0% ( 158) (92) ( 39) (6) (44)
Row Totals
100% (224)
100% (115)
1 DO?; (339)
Chi Square = 211.361; MiSSing Cases = 25 Degrees of Freedom = 4; Significance £6 .001;

~--~~~ .. --~--- -~----- -~ -..------------------------------~------------------
TABLE 70
ALCOHOL USE of Remanded. Inmates at FSCI and CRe
Reported Alcohol Use
Institution Problem
FSCI 17.3% (39)
eRC 40.8% (53)
Total 25.8% (92)
Chi Square = 23.796 Degrees of Freedom = 1 Significance £ f: .001 Missing Cases = 8
No Problem
82.7% (187)
59.2% (77)
74.2% (264)
I I I I I I I I I I I I I I I I I I I I I
113
Row Totals
100% (226)
100% (130)
100% (356)
1 ,
i I ~ II
,
.-j f
j,
J
! J
j
i 'I "
1
)
APPENDIX II:
Additional Data on the Sentenced Status Indian Population
(March 31, 1977)
114

--_~~~. , __ -~ __ - w---- -- _ ---.------ --------------
r \ ,}
1 TABLE 71 115 r ; 116
I N NATIVE BAI~D BY NUMBER (N) OF SENTENCED STATUS INDIANS 0
in Alberta Correctional Institutions* Lesser Slave Lake Agency: I March 31, 1977
Bigstone Band 1
I Duncan I s Band 0 N Driftpile Band 2
Sawridge Band 0 l. SOUTHERN ALBERTA Sturgeon Lake Band 7 I Swan River Band 1 Blackfoot/Stoney/Sarcee District: Sucker Creek Band 0 Horse Lake Band a
1 Bl ackfoot Band 16 Whitefish Lake Band 2 Bearspaw (Stoney) Band 3 Grouard Band 1 Chiniquay (Stoney) Band 2 Lubicon Lake Band 0 O'Chiese Band 3 SaY'cee Band 1 Saddle Lake/Ath2basca District: Sunchild Cree Band 8 Wesley Group (Stoney) Band 1 Co 1 d Lake Band 6
Chipewyan Band 2 Blood/Peigan District: j Cree Band 1 I Janvier Band 2
I Blood Band 44 I \ Fort McKay Band 1 Peigan Band 10 i Fort McMurray Band 1 j
~ Heart Lake Band a
I 2. CENTRAL ALBERTA Beaver Lake Band 0
I I Frog Lake Band 4 Edmonton/Hobbema District: '1 Goodfish Lake Band 1
Kehewin Band 4 Alexander Band 1 Saddle Lake Band 17 Alexis Band 3 Ermineskin Band 11 I Out of Province 37 I Louis Bu" Band 4 Enoch Band 4 Total . 230 Samson Band 14 Paul Band 7 Man tana Band 1 Missing Cases = 8
3. NPRTHERN ALBERTA
I Fort Vermilion Agency:
1 Boyer River Band 2 ft
~ Little Red River Band 0 ,~ , Slave Band (Hay Lakes) 5
I Tall Cree Band 0
N U
! * ~ For analysis, underlined bands were ~:'lsidered separately. The rema 1 m ng 11
ft.l berta bands were re-grouped into tt",ree categories according to geo- U ,
L 'graphical locality (i.e. southern, central, an"d northern lI.lberta).
.., . ],
r r ; ,

---,----
r r
--------------------------
TABLE 72
NATIVE BAND BY SOCIO-DEMOGRAPHIC CHARACTERISTICS (Occupation; Education) for Sentenced Status Indians in Alberta-Correctional Institutions
March 31, 1977
Number in Number Reporting Number Reporting Less Native Band Institutions Unskilled Occupation than Grade 10 Education Blackfoot 16 14
7 Peigan 10 10 9 Blood 44 43 32 Other Southern Alberta 18 18 16 ----;--------------------------------------- --------------------------- ---------------------------ELMS 30 24 24
Other Central Alberta 15 12 12
-------------------------------------------- --------------------------- ---------------------------SiAddle Lake Other Northern Alberta
17
43 11 34
12 32 -------------------------------------------- --------------------------- ---------------------------Out of Province 37 30 24 -------------------------------------------- --------------------------- ---------------------------
Total
Missing Cases =
*
230
8
196
9
Ermineskin, Louis Bull, Montana, Samson Bands (located at Hobbema Reservation)
168
9

----~~~ .. - ---
r r ,I
.. ~
I , f \ i - L
TABLE 73
NATIVE BAND BY OFFENCE TYPE for Sentenced Status Indians in Alberta Correctional Institutions
Most Serious Offence
Breaking Native Band Violent Crimes Major Theft Minor Theft and Entering Alcohol Other - Tota 1 N N N N N N N Blackfoot 6 1 3 1 5 0 16 Peigan 2 2 3 0 3 0 10 Blood 4 4 4 5 18 9 44 Other Southern Al barta 2 0 2 2 7 5 18 ---------------------------------------------------------------------------------------------------------,--------* I
ELMS 1 6 5 2 9 7 : 30 I Other Central Alberta 5 3 3 1 2 1 : 15 I -----------------------------------------------------------------~---------------------------------------Ir-------I Saddl e Lake 3 3 4 2 2 3 : 17
I ** Other Northern Alberta 9 6 4 15 6 2 : 43 I ----------------------------------------------------------------------------------------------------------r-------I Out of Provi nee 11 2 13 3 4 4 : 37 I ----------------------------------------------------------------------------------------------------------r-------I ** Total 43 27 41 31 56 31 : 230
Missing Cases = 8 I
* Ermineskin, Louis Bull, Montana, Samson Bands (located'at Hobbema Reservation)
** Total includes 1 drug offender

- ~~- --.-- ----
a [
TABLE 74
NATIVE BAND BY AGGREGATE SENTENCE for Sentenced Status Indians in Alberta Correctional Institutions
Aggregate Sentence
Native Band 3 Months or Less 3 - 6 Months 6 Months - 1 Year 1 Year or More : Total ,
Blackfoot Peigan Blood Other Southern Alberta
N
4
4
27
7
N
6
2
7
4
N
1
1
3
6
N
5
3
7
1
, I , , I I I I I , I I , , I I I
N
16
10
44 18
----------------------------------------------------------------------------------------------------~--------* I ELMS 7 9 7 7: I ,
Other Central Alberta 3 6 2 4 l 30
15 ----------------------------------------------------------------------------------------------------~--------
Saddle Lake 6
Other Northern Alberta 10
4
9
3
16
4 8
, , , , I , I
17
43 ----------------------------------------------------------------------------------------------------~--------Out of Province 8 7 13 9
, I , I
37 ----------------------------------------------------------------------------------------------------~--------I , Total 76 54 52 48 : 230
I
Missing Cases = 8
*Ermineskin, Louis Bull, ~1ontana, Samson Bands (located at Hobbema Reservation)

r r
TABLE 75
NATIVE BAND BY INMATE CHARACTERISTICS (Number of Commitments and Reason for Present Incarceration) for Sentenced Status Indians in Alberta Correctional Institutions
March 31, 1977
Nati ve Band
Bl ackfoot Peigan Blood Other Southern Alberta
Number ;1')
Institutions
16
10
44 18
----;--------------------------------------ELMS 30 Other Central Alberta 15 -------------------------------------------Saddle Lake Other' Northern Alberta
17
43
Number Having 5 or More .Commitments
2
9
29 2
--~----------------------13
6 -------------------------
6
11
Number Incarcerated in Default of Fine Payment On Most Recent Commitment
2
4 19
4 ------------------------------
3
1 ------------------------------
1
5 ------------------------------------------- ------------------------~ ------------------------------Out of Province 37 -------------------------------------------Total
Mi ss·ing Cases
*
230
8
I
-----------~-------------I'---------------~--~-----------81 42
18 8
Ermineskin, Louis Bull, Montana, Samson Bands (located at Hobbema Reservation)

f I
f
I
I /.
t
(
{
t [
APPENDIX III:
Coding ~1anual (CPIS-3)
(includes: Offence Codes, Band Names for Treaty Indians, and
List of Community Residential Centres)
121
i I j
r I I
r J.
I I
l J
CODING ~~NUAL (CPIS-3)
VARIABLE & SOURCE CODE -1 CARD
COLU~lN
-----"--'----------------+------
122
VARII\BLE N tJr1!3E R
-_._-- -_. ____ 0_-. __ .
2 - II
12
13 - 18
19
20
Samp 1 e Numbe r
Identification Number
Institution
Inmate Number
3
(first 4 letters of name and date of birth - day, month,
1 = FSC I year)
2 = FSCI (Women) 3 = PRCI 4 = LCI 5 = CCI 6 = BCCC 7 = NBFC 8 = CRC
- Transcribe from Inmate List FSCI = record 6 digit number FSCI (W) = precede number by
zero PRCI = precede number by 2
zeros. LCI = precede number by 2
zeros
CCI = precede number by J zer BCCC = precede number by I ze 0
NBFC = precede number by 3 zeros
CRC = precede number by 2 zeros
Status 1 = Sentenced - From Inmate List 2 = Remand (a 1 so Remand and
committed to tr i al) 3 = Committed to Trail 4 = Immigration Hold 5 = Awaiting Appeal 6 = Penitentiary 7 = Sentenced and Remand and/
or committed to Trial, and/or Judges Order
Parole Violation I = Yes 2 = No
Vl
V2
V3
V4
V5
V6
==

f
i I i 1
I
I f
I I i ~-!-I,
CARD COLU~/1N
.. ---'---' 21
22
23 - 24
25
26
27 - 28
VARIABLE & SOURCE CODE "It"~
123
v 1~ln /\!3 L E N Inm r: R
-+---------------I·---·------·----·--~-·------- - -~-Location
- From Inmate List
Security Rating
- From Inmate List
Age
- .SG 13-028 (Age) - If missing (OOB)
Native Status ---. - 5G 13-028 (I NO) (Met).
Current Marital Status
- SG 13-028 (M/S)
Occupation
- SG 13-028 (Tra0e)
= In the institution V7 (includes Nordegg)
2 = Camp b (TA) 3 = Temporary A sence \ or
Pre-Release 4 - D~y Parole (op) 5 = Sscaped or Unlawfully at
Large (UAL) 6 = At Hospital (e.g. Alberta
Hospital or General Hospi al 7 = Fine Option Program 8 = Out to Court 9 At CRC (Community Residen
tial Centre, e.g. Henwood
I = Minimum 2 = Medium 3 = Maximum (and Maximum +)
RecorJ Years 99 = Unknown
I = Status Indian (if Status number or band is given)
2 = Non-Status Indian (Indian)
3 = Metis 4 = C<;lucasian 5 = Other (East-Indian, Negro
etc. ) 9 = Unknown
I = Single 2 Marri ed 3 = Wi dow(er) 4 = Divorced 5 = Separated 6 = Common Law 9 = Unknown
01 = Managerial - in any area at a manager or owner level, including farmi~g_
02 Professional and TechnIcal - medical, teachers, entertainers, artists, scientists, social workers, model, etc.
v8
V9
VIO
VII
VI2
!
I i I ! ~ I, f
-. I
1 CARD I COLUf-'IN VARIABLE & SOURCE J --~------t----_______ _ I J
Occupation (cont'd)
29 Re Ii g ion
- SG 13-028 (Re I g.)
" .i J
j
124
\f/~RI/\!3LE NUt-mE R I---COD~
---------._--- - - - --- -- - . - - . 03 = Clerical/Sales - secret
arial, bookkeeping, sales clerk, cashier, bankte Iler
04 = Craftsman/Tradesman _ skilled or semi-skilled (electrician, plumber, welder, carpenter, etc.) skilled transportation occupation (truck driver seamstress; miner; cook; apprentice
05 = Protective Service _ armed forces, police, fireman, guards
06 = Skilled personal service barber, hairdresser, stewardess, bartender, maitre'd, orderly
07 = Unskilled personal service - waitress, waiter, domestic, cocktai I waitress, dishwashe
08 = Labourers and Helpers _ unskilled workers, carpenter's helpers, loading trucks (Swampers), brush clearing, janitor,
09 = roughneck Studen t Housewife Retired Unemployed
10 II 12 13 99
1 = 2 = 3 =
= = = = =
None (never been emrloye ) Unknown
None Roman Catho I i c Protestant (Lutheran, Pentecostal, United Churc Baptist, Angl ican, Presby terian)
4 = Other Christian (Greek or Russian Orthodox, Christian Reformed, Salva tion Army)
5 = Other (~ehovah Witness, Jewish, Native
9 = unknown
VI3

--~ ~~~------~-
CARD COLUI1N
1-----------I
I 30
31 - 32
33 - 34
35 - 36
37 - 38
VARIABLE & SOURCE
Alcohol Use
- SG 13-028 (Hab.)
Education
Number of Commitments to the Institution
- SG 13-028 (record the number in brackets for CCI and CRC)
Place of Birth
- SG 13-028 (Born)
Forwarding Address Location
- SG 13-028
1 = Abstainer 2 = Temperate 3 = Intemperate, Heavy,
Al cohol i c 9 = Unknown
vl4
00 = None Vl5 01 to 12 = Grade completed
(completion of high school grade 13 included)
13 = Any post-secondary education (college, tech., university)
99 = Unknown
1st = 01 2nd = 02, etc. 98 98 or over 99 = Unknown
01 = Edmonton 02 = Calgary 03 = Lethbridge 04 = Peace River 05 = Other, Southern Alberta
(South of Highway 27 and 19)
06 = Othe~ Northern Alberta 07 = British Columbia 08 = Saskatchewan 09 = Manitoba 10 = Ontario 1 1 Quebec 12 = Maritimes 13 = North ~.Jest Terr i tori es, 14 = USA 15 = Europe 16 = Mexico, Central and
South Ame rica 17= Other 18 = "Alberta" 99 = Unknown
01 = Edmonton 02 = Calgary 03 = Lethbridge 04 = Peace River 05 = Other, Southern Alberta
(South of Highway 27 and 29)
Vl6
Vl7
ukon
Vl8
,."
i J
I ..;.j
125 .., I !
~j-
"", ! i ...
.. l
--1.
i ! .i
<!
. i I
-i,
T .,
.~
.",.
I
~.
I , I'
I;
I J l,.
126
-t-----t---------------I--------,----------- ------
CARD COLUt'lN
39 - 40
41
42 - 45
49 50
51 - 53
54 55
56 - 58
VARIABLE .r., SOURCE CODE VARII\!3LE N Uf"18E R
-------------/------------------ --- --- -~- - - - ~- ---
Forwarding Add ress Location (cont'd)
Other, Northern Alberta British Columbia Saskatchewan Man i toba Ontario Quebec Maritimes
06 07 = 08 = 09 = 10 = 11 = 12 = 13 :: 14 = 15 = 16 =
North West Territories, ukon USA
Nat i ve Band
- SG 13-028 (Indian)
Europe Mex1co, Central and South America
17 = Other 18 = Alberta 99 = Unknown
00 = Non Treaty Indian, Non Native For Treaty Indians only:
See Appendix B for Codes
I-nmate is incarcerated solely 1 = Yes because he did not pay a fine.2 = No
Aggregate Sentence
FSCI - Transfer & Movements FSCI(W) - Calculate PRCI - Transfer & Movements LCI - Calculate CC I -BRC - Transfer & Movements NFC CRC -
Sentenced
1st Most Severe Offence -. SG 13-028 (Off. & Sent.)
Number of other convictions
Remand
- 1st Most Severe Offence
Number of other charges
9 = Unknown
Record number of days, preceded by zeros if necessar 9999 = Unknown or
indeterminate 9998 = N/A
(Remand - no aggregate sentence)
See Appendix A
998 = N/A (i.e. Remand)
98 :: N/A
998 = N/A (i.e. Sentenced)
98 = N/A
Number of days on remand status as of March 31/77 Remand and Sentenced and Remanded} .
998 :: Not appl icable (fo 999 = Unknown
Vl9
V20
V21
V22
V23
v24
V25
V26
-

f
1
1
I i t [
ft. ~.
I
CARD COLUMN
59
60 - 63
VARIABLE & SOURCE
Sex
Number of days from March 31, 1977 to remi ss i on date .
127
CODE VARIABLE " NUMBER
1 = Male V27 2 = Female
Record number of days for Sentenced v28 Sentenced and Remanded inmates 9998 = N/A (Remand) 9999 = Unknown or indeterminate
.
1\ t
~ n ii ;
1 .
~
OFFENCE CODES
PART 1 - Criminal Code Offences
The offences: Attempt. to Commit (Sec.421), Conspiracy (Sec. 423) and Accessory after the fact (Sec. 23) are always associated with another offence ~nd are thus not to be coded as separate offences.
000 = No offence
VIOLENCE AGAINST THE PERSON OR THINGS
001 -- Murder 002 -- Criminal Negligence 003 -- Manslaughter 004 -- Attempt to wound (attempt to murder, Sec. 222 cc) 005 -- Bodily Harm with Intent 006 -- Assault Causing Bodily Harm 007 -- Assault Causing Grievous Bodily Harm 008 -- Wounding 009 -- Assaulting a Police Officer 010 -- Assault Resisting Arrest 011 -- Kidnapping 012 -- Abduction of a female under 14 or under 16 013 -- Utter threats 014 -- Forcible Seizure of a person 015 -- Threatening Telephonn r~11~ 016 -- Wilful Damage or Mischief (Section 387 (2) only) 017 -- Arson
SEXUAL OFFENCES (VIOLENT OR DANGEROUS)
018 --Indecent Assault on Female 019 -- Indecent Assault on Male 020 -- Rape 021 -- Attempt to Commit Rape
THEFT RELATED VIOLENCE
022 -- Robbery 023 -- Robbery with Violence 024 -- Armed Robbery 025 -- Attempted Robbery 026 -- Break and Enter with Assault 027 -- Extortion
128
028 -- DANGEROUS DRIVING OR CRIMINAL NEGLIGENCE IN OPERATION OF A MOTOR VEHICLE
SEXUAL OFFENCES (NON-VIOLENT OR NON-DANGEROUS)
029 -- Gross Indecency 030 -- Buggery or Bestiality 031 -- Intercourse with a female under 14 032 -- Incest 033 -- Indecent Act
034 -- Intercourse with feeble-minded 035 -- Seduction under promise of
marriage 036 Sexual Intercourse with Step
daughter or female employee

__ ~._ - ____ . w·----- --- - - -
I I I J
1
1
1
1
I i 1
1
1
1
1
t
L t ~ ..
(cont'd)
037 -- Obscene Telephone Calls 038 -- Indecent Exposure 039 -- Nudity 040 -- Seduction of Female 16 - 18
DANGEROUS WEAPON AND RELATED
041 -- Carrying an Offensive Weapon 042 -- Pointing a Firearm 043 -- Unregistered Firearm 044 -- Possession of Explosives 045 -- Dangerous Use of a Firearm 046 -- Carrying a Concealed Weapon 047 -- Possession of Prohibited Weapon 048 -- Possession of a Restricted Weapon 049 __ Possession of a Weapon (possession of a dangerous weapon) 050 -- Prohibited Weapon in Motor Vehicle 051 -- Restricted Weapon in Motor Vehicle 052 -- Unregistered Weapon in Motor Vehicle 053 -- Delivering Firearm to person under 16
054 __ NARCOTICS CONTROL ACT AND FOOD AND DRUG ACT (N.C.A. or F.D.A.)
FRAUD AND RELATED OFFENCES
055 -- Forgery 056 -- Obtain Food and Lodging by Fraud 057 -- Uttering A Forged Document 058 -- False Pretences 059 -- Attempted False Pretences 060 -- Theft of Telecommunications 061 -- Fraud 062 -- Obtaining Transportation by Fraud 063 -- Attempted Fraud 064 -- Personation 065 -- possession of Counterfeit Currency 066 -- Bankruptcy Act 067 -- Bigamy 068 -- Falsifying a Medical Prescription
069 -- THEFT OVER $200
070 -- THEFT UNDER $200
071 __ TAKING MOTOR VEHICLE WITHOUT OWNERS CONSENT (JOYRIDING)
072 -- BREAKING AND ENTERING AND RELATED
073 -- POSSESSION OF STOLEN PROPERTY
129
! I
I :1 1
:/1 ~
I I
» II
; :~
ij
I
OTHER NON-VIOLENT THEFT
074 -- Attempted Theft 075 -- Theft by ·.Person Requi red to Account 076 -- Possession of Housebreaking Instruments 077 -- Possession of Exchequer Bill Paper 078 -- Posse.ssion of Instrument to Break into Coin-Operated Devise 079 -- Stolen Property into Canada
DISORDERLY CONDUCT AND GENERAL NUISANCE
080 -- Obstructing a Peace Officer 081 -- Resisting Arrest 082 -- Public Mischief 083 -- Impersonating a Peace Officer 084 -- Solicitina 085 -- Common Nuisance 086 -- Creating a Disturbance 087 -- Prowling at Night (Trespassing) 088 -- Vagancy or Loitering 089 -- Obstructing a Clergyman 090 -- Living Off Avails 091 -- Betting 092 -- Disturbing a Religious Worship 093 -- Keeping a Betting House 094 -- Keeping a Bawdy House 095 -- Unlawfully in a Dwelling 096 -- False Fire Alarm 097 -- Wilful damage/mischief except Section 387 (2) 098 -- Assault - Common Section 245 099 -- Wilful Damage Less Than $50, Section 388 C.C.
IMPAIRED DRIVING
100 -- Driving while Impaired 101 -- Driving with More than 80 mgs. of Alcohol in Blood 102 -- Failing to Take a Breathalyzer
CARELESS DRIVING OR DRIVING WHILE DISQUALIFIED OR PROHIBITED
103 -- Driving while Disqualified or Prohibited 104 -- Careless Driving
TECHNICAL VIOLATIONS
105 -- Escaping Custody 106 -- Corrupting a Witness 107 -- Perjury 108 -- Violation of Parole 109 -- Skipping Bail 110 -- Contempt of Court 111 -- Breach of Recognizancp. 112 -- Failing to Comply with a Probation Order 113 -- Unlawfully at Large 114 -- Failing to Appear
130

---~.-- - -----
I 1
1
I
I
I
! f
J
J
f
1
1
L t [,
115 -- Defeating the Course of Justice 116 -- Bribery 117 -- False Declaration 118 -- Disobeying an Order of Court 119 -- Prison Breach 120 -- Fail to Make Restitution
OTHER CRIMINAL CODE
121 --122 --123 --124 --125
126
Procuring an Abortion Killing Cattle Injuring Cattle Cause Unnecessary Suffering to Animals Other
LIQUOR CONTROL ACT (L.C.A.)
127 -- HIGHWAY TRAFFIC ACT (H.T.A.)
131
128 -- OTHER FEDERAL, PROVINCIAL, MUNICIPAL STATUTES (eg. MVAA, Public Health Act, Immigration Act, Juvenile Delinquency Act)
999 -- UNAVAILABLE, MISSING
11 f , , 1/
I I
:1 J
1
) ~
J
~ 1 <I ~
~ Ii [J
ij 1)
Pi
~
~ J
;1 :I ~
~
~
~ ~'
r I
1
LIST OF BAND NAMES FOR TREATY INDIANS
00 Non-treaty Indian, Metis, Non-native
Blackfoot/Stoney/Sarcee District
Ol=Blackfoot Band 02=Bearspaw (Stoney) Band 03=Chiniquay (Stoney) Band 04=0'Chiese Band 05=Sarcee Band 06=Sunchild Cree Band 07=1,10,"1,,\1 C .... ""D (Stoney) Band ' u"-'" IC,] \AI V\AI_
Blood/Peigan District
08=Blood Band 09=Peigan Band
Edmonton/Hobbema District
10=A1exander Band 11=A1exis Band 12=Ermi neskin· Band l3=Louis Bull Band l4=Enoch Band l5=Samson Band 16=Pau1 Band 17=Montana Band
Fort Vermilion Agency
l8=Boyer Ri ver Band 19=Little Red River Band 20=Sl ave Band (Hay La.kes) 2l=Tal1 Cree Band
Lesser Slave Lake Agency
22=Bigstone Band 23=Duncan ' s Band 24=Driftpi1e Band 25=Sawridge Band 26=Sturgeon Lake Band 27=Swan River Band 28=Sucker Creek Band 29=Horse Lake Band 30=Whitefish Lake Band 31=Grouard Band 32=Lubicon Lake Band
-
132

---~~~.. - - --~
r
[
[
Saddle Lake/Athabasca District
33=Cold Lake Band 34=Chipewyan Band 35=Cree Band 36=Janvier Band 37=Fort McKay Band 38=Fort McMurray Band 39=Heart Lake Band 40=Beaver Lake Band 41=Frog Lake Band 42=Goodfish Lake Band 43=Kehewi n Band 44=Saddle Lake Band
98=Out of Province 99= Una va i 1 ab 1 e
133
\
J '"" r 'I ~,
J 1
.J
J
J
1 ! J.
]. j
1 ....
I J.
-, ~
1
l
J
1 1 I
J:
l n~;,
J'
'1' , , I
F .... "". ,/ '
134 COMMUNITY RESIDENTIAL C[NTRES
Locatioll C.R,C .
Grande Prairie 1. Wapit i
[3onnyvi 11 e 1. Bonnyville Centre
Edmonton 1. Kindred House
2. McDougall House
3. Proj ect 72
4. Howard Manor
5. John Howard II
6. Recovery Acres
7. Salvation Army
8. Poundmaker' s Lodge
9. Youth Orientation Units
10. Alberta Seventh Step
Calgary 1. Patterson (CYAC)
2. Albl~rta Seventh Step
3. Ramsay House
4. Crowfoot-Sunrise Residence
5. 1835 House
6. Social Orientation Services
Lethb'ridge 1. Napi Lodge
2. 630 House
Red Deer' 1. John Howard Society

r r , f