Neighborhood-Level Determinants of Life Expectancy in Oakland, CA
42
TECHNICAL REPORT Center on Human Needs Virginia Commonwealth University Richmond, Virginia September 2012 Neighborhood-Level Determinants of Life Expectancy in Oakland, CA
Transcript of Neighborhood-Level Determinants of Life Expectancy in Oakland, CA
8/11/2019 Neighborhood-Level Determinants of Life Expectancy in Oakland, CA
http://slidepdf.com/reader/full/neighborhood-level-determinants-of-life-expectancy-in-oakland-ca 1/42
TECHNICAL REPORTCenter on Human NeedsVirginia Commonwealth UniversityRichmond, Virginia
September 2012
Neighborhood-Level
Determinants of LifeExpectancy in Oakland, CA

8/11/2019 Neighborhood-Level Determinants of Life Expectancy in Oakland, CA
http://slidepdf.com/reader/full/neighborhood-level-determinants-of-life-expectancy-in-oakland-ca 2/42

8/11/2019 Neighborhood-Level Determinants of Life Expectancy in Oakland, CA
http://slidepdf.com/reader/full/neighborhood-level-determinants-of-life-expectancy-in-oakland-ca 3/42
Amber D. Haley, M.P.H.Emily Zimmerman, Ph.D.
Steven H. Woolf, M.D., M.P.H.Benjamin F. Evans, M.H.S.A.
Neighborhood-Level
Determinants of LifeExpectancy in Oakland, CA
TECHNICAL REPORTCenter on Human Needs
Virginia Commonwealth UniversityRichmond, Virginia
© Virginia Commonwealth University Center on Human Needs, 2012

8/11/2019 Neighborhood-Level Determinants of Life Expectancy in Oakland, CA
http://slidepdf.com/reader/full/neighborhood-level-determinants-of-life-expectancy-in-oakland-ca 4/42

8/11/2019 Neighborhood-Level Determinants of Life Expectancy in Oakland, CA
http://slidepdf.com/reader/full/neighborhood-level-determinants-of-life-expectancy-in-oakland-ca 5/42
5© Virginia Commonwealth University Center on Human Needs, 2012
Preface
Health is in uenced by more than health care, and the same is true for health dispari -
ties. 1 Inequities in health exist for reasons that transcend access to health care or adequatehealth insurance coverage. Health is also heavily in uenced by health behaviors (suchas tobacco use), modi able risk factors (such as obesity), and environmental conditions.These conditions are only partly a matter of personal choice. Adopting a healthier diet re -quires access to supermarkets or farmers’ markets that sell fresh produce. Regular physi -cal activity requires a conducive built environment and access to safe parks, pedestrianroutes, and green space for residents to walk, bicycle, or play. Tobacco and alcohol useis in uenced by enticing advertising and marketing practices. Exposure to environmen -tal pollutants from unhealthy housing or from nearby factories and smokestacks are notchoices made by residents but by society.
Figure 1:World Health Organization
Conceptual Model for SocialDeterminants of Health
In the language of social epidemiology, “downstream” determinants of health—rangingfrom unhealthy behaviors to living and working conditions—are the byproduct of “up -stream” structural determinants (Figure 1) such as socioeconomic position, race-ethnicity,occupation, and social cohesion. These socioeconomic circumstances are themselvesthe result of upstream policies that create opportunities for education and employment,income and savings, social equality, and environmental stewardship. Macroeconomic
policies create commercial incentives for industries to either promote unhealthy productsor more healthful alternatives. 2
From: A Conceptual Model for Taking Action on the Social Determinants of Health.Geneva: World Health Organization, 2010 (reprinted with permission)

8/11/2019 Neighborhood-Level Determinants of Life Expectancy in Oakland, CA
http://slidepdf.com/reader/full/neighborhood-level-determinants-of-life-expectancy-in-oakland-ca 6/42
6© Virginia Commonwealth University Center on Human Needs, 2012
Health also varies sharply by geography—across communities and neighborhoods—be -cause unhealthful downstream conditions are often concentrated in disadvantaged areas.Areas populated by the poor or communities of color typically experience greater expo -sure to unhealthy conditions and material deprivation, a vicious cycle that is itself shaped
by upstream factors. These upstream in uences include historical antecedents, such as
racial or ethnic discrimination and recurring cycles of poverty that inhibit economicgrowth and social mobility over generations, but also modern-day decisions about whereto position highways and supermarkets and how much resource to invest in public trans -
portation, housing, local development, crime prevention, public schools, job training, andsocial services. The recognition that “place matters” to health and the need to understandhow unwise social policies foment health inequity comes at the recommendation of pres -tigious commissions sponsored by the World Health Organization, 3 MacArthur Founda -tion, 4 and Robert Wood Johnson Foundation. 5

8/11/2019 Neighborhood-Level Determinants of Life Expectancy in Oakland, CA
http://slidepdf.com/reader/full/neighborhood-level-determinants-of-life-expectancy-in-oakland-ca 7/42
7© Virginia Commonwealth University Center on Human Needs, 2012
The Place Matters technical reports were produced by the Virginia Commonwealth Uni -versity (VCU) Center on Human Needs (CHN) in collaboration with the Joint Center forPolitical and Economic Studies/Health Policy Institute (HPI) and the Virginia Network forGeospatial Health Research (VANGHR). All maps and geospatial analyses were produced
by VANGHR.
The production of the Place Matters technical reports was funded by HPI under a subawardfrom a parent grant from the National Institutes of Health (grant 5RC2MD004795-02). Thegoal of the project was to prepare and disseminate a series of locally tailored CommunityHealth Equity reports (CHERs) to assess population health inequities and related social and
economic conditions for the following eight communities:
• Alameda County, California • Cook County, Illinois• Baltimore, Maryland • San Joaquin Valley, California• Bernalillo County, New Mexico • Boston, Massachusetts• Orleans Parish, Louisiana • South Delta, Mississippi
The VCU CHN and VANGHR were contracted by HPI to develop technical reports onwhich the eight CHERs were based. What follows is the technical report for AlamedaCounty, California. The focus of the report and the research questions it addresses wereguided by extensive input from the Place Matters team in Alameda County. See the Meth -ods Appendix on the CHN website for more details on analytic methods.The project wasapproved by the VCU Institutional Review Board.
For more information about the Place Matters technical reports or collaboratingorganizations visit the websites listed below:
Center on Human Needs: www.humanneeds.vcu.eduHealth Policy Institute : www.jointcenter.org/institutes/health-policyPlace Matters Initiative : www.jointcenter.org/hpi/pages/place-mattersVirginia Network for Geospatial Health Research: vnghr.org/
About the PlaceMatters Project

8/11/2019 Neighborhood-Level Determinants of Life Expectancy in Oakland, CA
http://slidepdf.com/reader/full/neighborhood-level-determinants-of-life-expectancy-in-oakland-ca 8/42

8/11/2019 Neighborhood-Level Determinants of Life Expectancy in Oakland, CA
http://slidepdf.com/reader/full/neighborhood-level-determinants-of-life-expectancy-in-oakland-ca 9/42
9© Virginia Commonwealth University Center on Human Needs, 2012
Introduction
The health of Alameda County residents is related to many factors. 6 As is true elsewhere,disease rates vary dramatically by age, gender, race, and ethnicity as well as with the
prevalence of risky health-related behaviors. 3,7–12 Place matters in health because charac -teristics of the areas in which people live affect health choices, behaviors, environmentalrisks, and access to medical care. 13–18 Local conditions that may affect health includelevels of stress and environmental toxins, the social and economic characteristics ofindividuals and families (such as education and income), and the characteristics of thecommunities in which people live.
Countywide statistics oversimplify important geographic differences that exist betweendifferent neighborhoods and communities within Alameda County and that contribute tolarge differences in the health of residents. Geographic disparities in health status withinAlameda County re ect, in part, geographic patterns in the population and living condi -tions. The health challenges faced by individuals and households are in uenced by theneighborhood. 19,20 Regardless of one’s education, income, or motivation to make healthychoices, risks may be introduced by increased crime, air pollution, the absence of placesto exercise or obtain nutritious food, poor schools, a scarcity of good jobs, and stressrelated to these community challenges. 18,21–28 Historical patterns contribute to long-termtrends of placing vulnerable populations in stressed areas. This in turn reinforces cyclesof hardship that entrench patterns of socioeconomic disadvantage. 29–32
This report will focus on the characteristics of Alameda County and its communities thatmay affect health outcomes for residents, including public safety, socioeconomic opportu -nity, the built environment, and educational conditions. Life expectancy will be exploredas well as the interrelations between these various community characteristics. Particularattention will be paid to the characteristics and health outcomes of the City of Oakland,
the largest city in Alameda County.
Part I of this report provides background information about Alameda County and the Cityof Oakland, including population data, health outcomes, socioeconomic conditions, andcommunity characteristics. Part II examines the relationship between socioeconomic sta -tus, educational factors, public safety, the built environment, and health outcomes. Part III
presents conclusions about community-level factors related to life expectancy in AlamedaCounty. Appendix A (available on the CHN website) presents detail about the data andmethods that were used in preparing this report.

8/11/2019 Neighborhood-Level Determinants of Life Expectancy in Oakland, CA
http://slidepdf.com/reader/full/neighborhood-level-determinants-of-life-expectancy-in-oakland-ca 10/42

8/11/2019 Neighborhood-Level Determinants of Life Expectancy in Oakland, CA
http://slidepdf.com/reader/full/neighborhood-level-determinants-of-life-expectancy-in-oakland-ca 11/42
11© Virginia Commonwealth University Center on Human Needs, 2012
I. Background: Population,Community Characteristics,
and Health in AlamedaCounty
Map 1:Population Density
by Block Group, Alameda County (2009).
PopulationAlameda County is located in the San Francisco Bay Area of California. It includes14 cities; the four largest are Oakland, Fremont, Hayward, and Berkeley. Oakland’s
population of 409,151 made up over one fourth of the total Alameda County population
(1,491,482) in 2009. The overall population density in Oakland was 7,134.9 persons persquare mile in 2009, which is over three and half times the population density of Alame -da County (Map 1).
8/11/2019 Neighborhood-Level Determinants of Life Expectancy in Oakland, CA
http://slidepdf.com/reader/full/neighborhood-level-determinants-of-life-expectancy-in-oakland-ca 12/42
12© Virginia Commonwealth University Center on Human Needs, 2012
Table 1:Demographic Characteristics
of the City of Oakland, Alameda County, the Stateof California, and the United
States
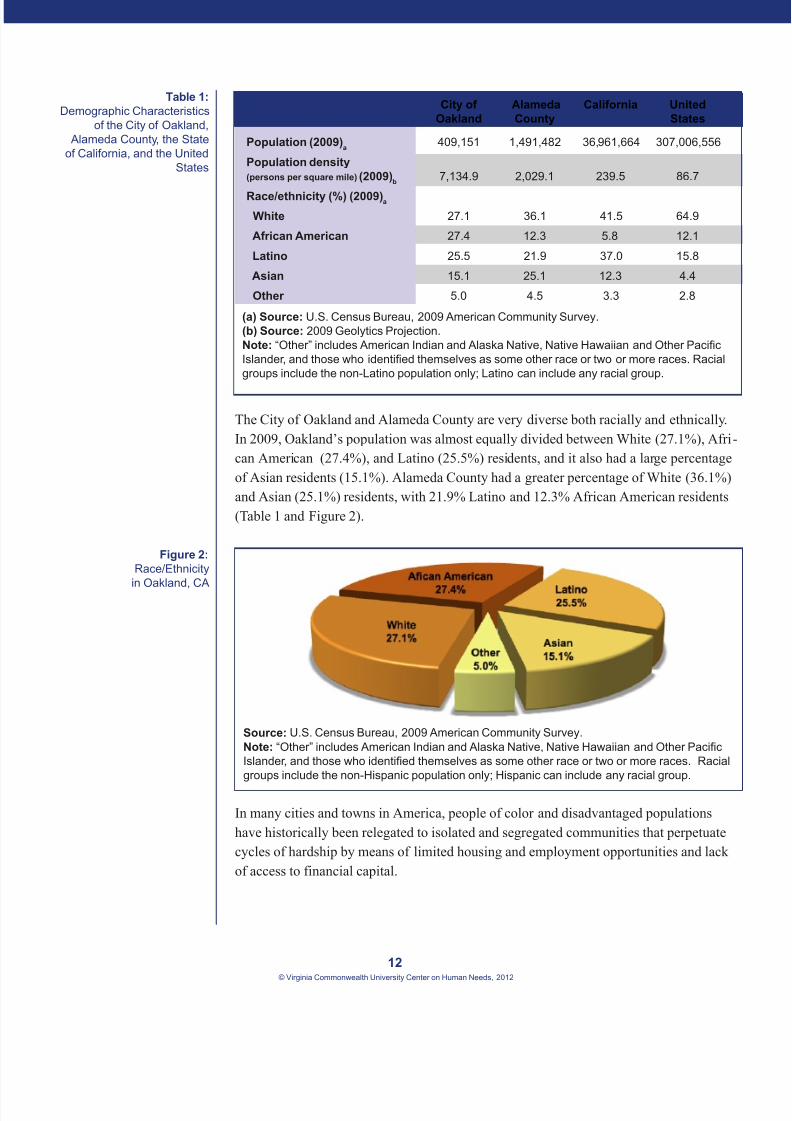
Figure 2:Race/Ethnicity
in Oakland, CA
(a) Source: U.S. Census Bureau, 2009 American Community Survey.(b) Source: 2009 Geolytics Projection.Note: “Other” includes American Indian and Alaska Native, Native Hawaiian and Other Paci cIslander, and those who identi ed themselves as some other race or two or more races. Racialgroups include the non-Latino population only; Latino can include any racial group.
City of Alameda California United Oakland County States
Population (2009) a 409,151 1,491,482 36,961,664 307,006,556
Population density(persons per square mile) (2009) b 7,134.9 2,029.1 239.5 86.7
Race/ethnicity (%) (2009) a White 27.1 36.1 41.5 64.9
African American 27.4 12.3 5.8 12.1
Latino 25.5 21.9 37.0 15.8
Asian 15.1 25.1 12.3 4.4
Other 5.0 4.5 3.3 2.8
Source: U.S. Census Bureau, 2009 American Community Survey.Note: “Other” includes American Indian and Alaska Native, Native Hawaiian and Other Paci cIslander, and those who identi ed themselves as some other race or two or more races. Racialgroups include the non-Hispanic population only; Hispanic can include any racial group.
The City of Oakland and Alameda County are very diverse both racially and ethnically.In 2009, Oakland’s population was almost equally divided between White (27.1%), Afri -can American (27.4%), and Latino (25.5%) residents, and it also had a large percentageof Asian residents (15.1%). Alameda County had a greater percentage of White (36.1%)and Asian (25.1%) residents, with 21.9% Latino and 12.3% African American residents(Table 1 and Figure 2).
In many cities and towns in America, people of color and disadvantaged populationshave historically been relegated to isolated and segregated communities that perpetuatecycles of hardship by means of limited housing and employment opportunities and lackof access to financial capital.
8/11/2019 Neighborhood-Level Determinants of Life Expectancy in Oakland, CA
http://slidepdf.com/reader/full/neighborhood-level-determinants-of-life-expectancy-in-oakland-ca 13/42
13© Virginia Commonwealth University Center on Human Needs, 2012
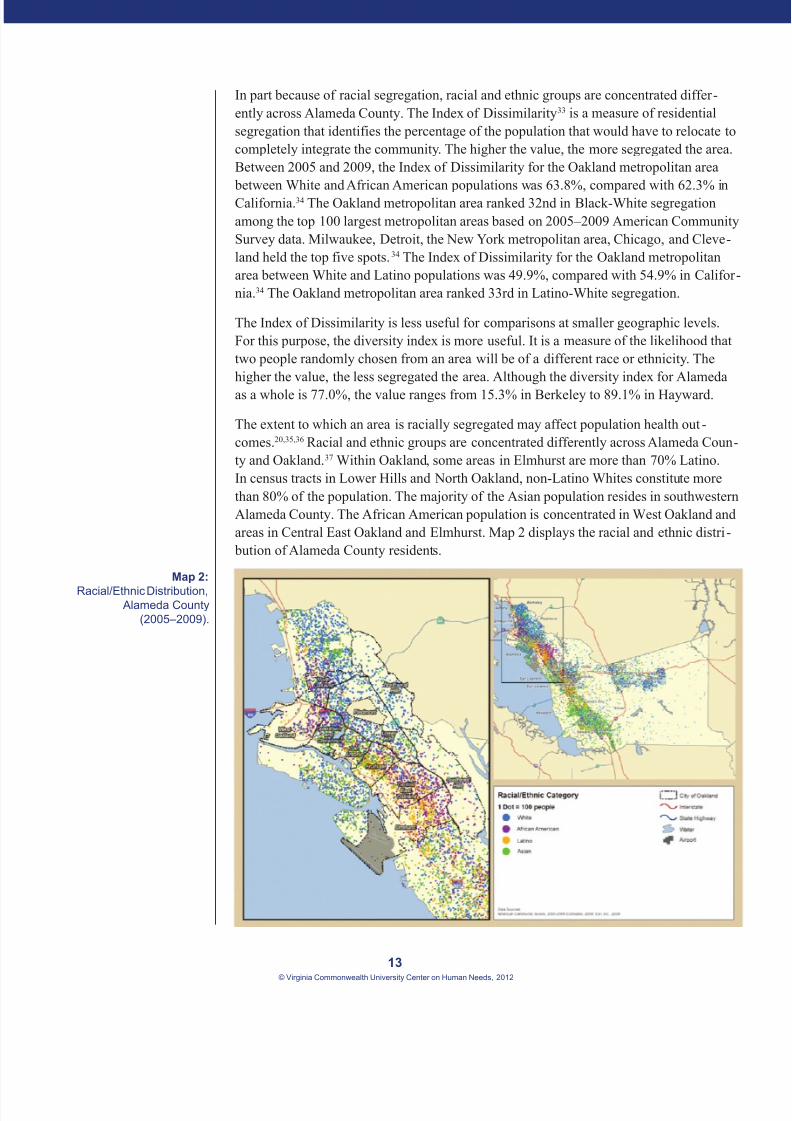
Map 2:Racial/Ethnic Distribution,
Alameda County(2005–2009).
In part because of racial segregation, racial and ethnic groups are concentrated differ -ently across Alameda County. The Index of Dissimilarity 33 is a measure of residentialsegregation that identifies the percentage of the population that would have to relocate tocompletely integrate the community. The higher the value, the more segregated the area.Between 2005 and 2009, the Index of Dissimilarity for the Oakland metropolitan area
between White and African American populations was 63.8%, compared with 62.3% inCalifornia. 34 The Oakland metropolitan area ranked 32nd in Black-White segregationamong the top 100 largest metropolitan areas based on 2005–2009 American CommunitySurvey data. Milwaukee, Detroit, the New York metropolitan area, Chicago, and Cleve -land held the top five spots. 34 The Index of Dissimilarity for the Oakland metropolitanarea between White and Latino populations was 49.9%, compared with 54.9% in Califor -nia. 34 The Oakland metropolitan area ranked 33rd in Latino-White segregation.
The Index of Dissimilarity is less useful for comparisons at smaller geographic levels.For this purpose, the diversity index is more useful. It is a measure of the likelihood thattwo people randomly chosen from an area will be of a different race or ethnicity. Thehigher the value, the less segregated the area. Although the diversity index for Alameda
as a whole is 77.0%, the value ranges from 15.3% in Berkeley to 89.1% in Hayward.
The extent to which an area is racially segregated may affect population health out -comes. 20,35,36 Racial and ethnic groups are concentrated differently across Alameda Coun -ty and Oakland. 37 Within Oakland, some areas in Elmhurst are more than 70% Latino.In census tracts in Lower Hills and North Oakland, non-Latino Whites constitute morethan 80% of the population. The majority of the Asian population resides in southwesternAlameda County. The African American population is concentrated in West Oakland andareas in Central East Oakland and Elmhurst. Map 2 displays the racial and ethnic distri -
bution of Alameda County residents.
8/11/2019 Neighborhood-Level Determinants of Life Expectancy in Oakland, CA
http://slidepdf.com/reader/full/neighborhood-level-determinants-of-life-expectancy-in-oakland-ca 14/42
14© Virginia Commonwealth University Center on Human Needs, 2012
Figure 3:Ratio of Income to
Poverty in Oakland, CA
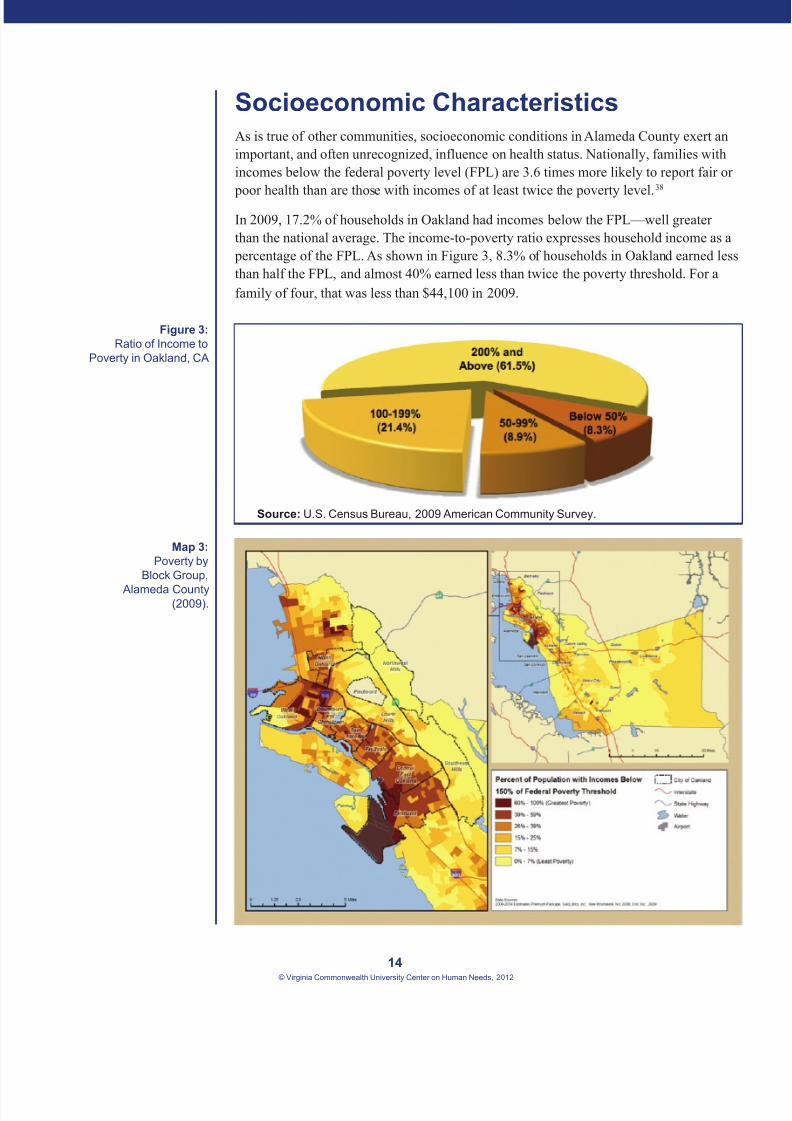
Socioeconomic CharacteristicsAs is true of other communities, socioeconomic conditions in Alameda County exert animportant, and often unrecognized, influence on health status. Nationally, families withincomes below the federal poverty level (FPL) are 3.6 times more likely to report fair or
poor health than are those with incomes of at least twice the poverty level.38
In 2009, 17.2% of households in Oakland had incomes below the FPL—well greaterthan the national average. The income-to-poverty ratio expresses household income as a
percentage of the FPL. As shown in Figure 3, 8.3% of households in Oakland earned lessthan half the FPL, and almost 40% earned less than twice the poverty threshold. For afamily of four, that was less than $44,100 in 2009.
Source: U.S. Census Bureau, 2009 American Community Survey.
Map 3:Poverty by
Block Group,
Alameda County(2009).

8/11/2019 Neighborhood-Level Determinants of Life Expectancy in Oakland, CA
http://slidepdf.com/reader/full/neighborhood-level-determinants-of-life-expectancy-in-oakland-ca 15/42
15© Virginia Commonwealth University Center on Human Needs, 2012
According to the U.S. Census Bureau, 22.0% of households in the United States reportedan income below 150% of the FPL in 2009. 37 In Alameda County, 18.0% of the popu -lation had incomes less than 150% of the FPL, yet 35.7% of Alameda census tracts— representing 109 tracts—met or exceeded this level of poverty. In Oakland, 67.9% of thecensus tracts and 70.9% of block groups met or exceeded the county’s average poverty
rate. Poverty levels were highest in West Oakland, Downtown, and Chinatown (Map 3).
Persistence of concentrated poverty across several decades may have additional healthand social consequences, particularly for the children living in those areas. A persistentlack of economic resources during childhood has consequences on cognitive, emotional,
behavioral, and physical development. 39,40 Persistent poverty may also diminish thelikelihood of high school completion, 39,40 thus perpetuating disadvantage and the multi -generational cycle of living in conditions that adversely affect health. Persistent poverty,in which at least 20% of the population have incomes under 100% of the FPL for at leasttwo census periods, has been a pervasive influence in Oakland. Out of 45 census tractsthat meet the criteria for persistent poverty in Alameda, all but four (91.1%) are in Oak -land. Within Oakland, West Oakland fares the worst, with 11 out of 14 (78.5%) censustracts in persistent poverty (Map 4).
Map 4:Persistent Poverty by
Census Tract, Alameda County
(1970–2009).
Note: The category of “Persistent Poverty” includes census tracts with a poverty rate of at least 20% for at least two consecu-tive census periods, looking retrospectively from 2009. This concept is based on the U.S. Department of Agriculture’s researchon counties with persistent poverty.

8/11/2019 Neighborhood-Level Determinants of Life Expectancy in Oakland, CA
http://slidepdf.com/reader/full/neighborhood-level-determinants-of-life-expectancy-in-oakland-ca 16/42
16© Virginia Commonwealth University Center on Human Needs, 2012
Figure 4:
Poverty byRace-Ethnicity in
Oakland, CA
Insufficient income to meet basic needs intensifies material hardship. A lack of financialresources exposes individuals to further risks from the environment in which they live.Lower percentages of community-level, owner-occupied housing are associated withadverse outcomes in crime and education. 41–44 Because of a lack of access to financialcapital, impoverished families are more likely to rent rather than own property and to live
in less desirable areas. In 2009, only 41.5% of housing units in Oakland were owner-occupied, compared with 54.7% in Alameda County, 57.6% in California, and 60.7%nationally. 45
The demographic characteristics of a community can be associated with poverty. Pov -erty rates are generally higher among racial and ethnic minorities than among White
populations. In Oakland, White residents are least likely to live below the poverty level(6.5%), whereas almost one out of every four African American residents lives in poverty(24.0%) (Figure 4).
30%
25%
20%
15%
10%
5%
0%
White Latino Asian African American
Source: U.S Census Bureau 2009 American Community SurveyRacial groups include non-Hispanic population only; Hispanic can include anyracial group.

8/11/2019 Neighborhood-Level Determinants of Life Expectancy in Oakland, CA
http://slidepdf.com/reader/full/neighborhood-level-determinants-of-life-expectancy-in-oakland-ca 17/42
17© Virginia Commonwealth University Center on Human Needs, 2012
Figure 5:Educational Attainment in
Oakland, California
EducationEducation is a pathway to higher income and net worth, which also have strong influ -ences on health status and access to health care. In 2009, American adults with less than ahigh school diploma as their highest educational attainment had less than half the earn -
ings ($18,432 versus $47,510) 37 and were three times more likely to die before age 65 aswere those with at least a Bachelor’s degree. 46 They were also more likely to engage inunhealthy behaviors such as cigarette smoking. 47
Residents of impoverished communities are more likely to have low educational attain -ment. In Oakland, two out of five adults living in poverty have less than a high school di -
ploma. Race and ethnicity are also strong predictors of educational attainment. Comparedwith non-Latino Whites in the same time period, African American adults in Oaklandwere more than three times as likely to lack a high school education (Figure 5). 37 Latinoresidents fare even worse, with more than half of adults lacking a high school education.
100%
80%
60%
40%
20%
0% Total White African Asian Latino Below American Poverty Level
Source: U.S. Census Bureau 2009 American Community SurveyNotes: Other includes Two or More Races, American Inidan and Alaska Native,Native Hawaiian and Other Paci c Islander, Some Other Race. Racial groupsinclude non-Hispanic population only; Hispanic can can include any racial group.
Bachelor’s Degreeor Higher
Some College or Associate Degree
High School Only
Less than HighSchool

8/11/2019 Neighborhood-Level Determinants of Life Expectancy in Oakland, CA
http://slidepdf.com/reader/full/neighborhood-level-determinants-of-life-expectancy-in-oakland-ca 18/42

8/11/2019 Neighborhood-Level Determinants of Life Expectancy in Oakland, CA
http://slidepdf.com/reader/full/neighborhood-level-determinants-of-life-expectancy-in-oakland-ca 19/42
19© Virginia Commonwealth University Center on Human Needs, 2012
Table 3:Health Characteristics of
Alameda County, State ofCalifornia, and United States
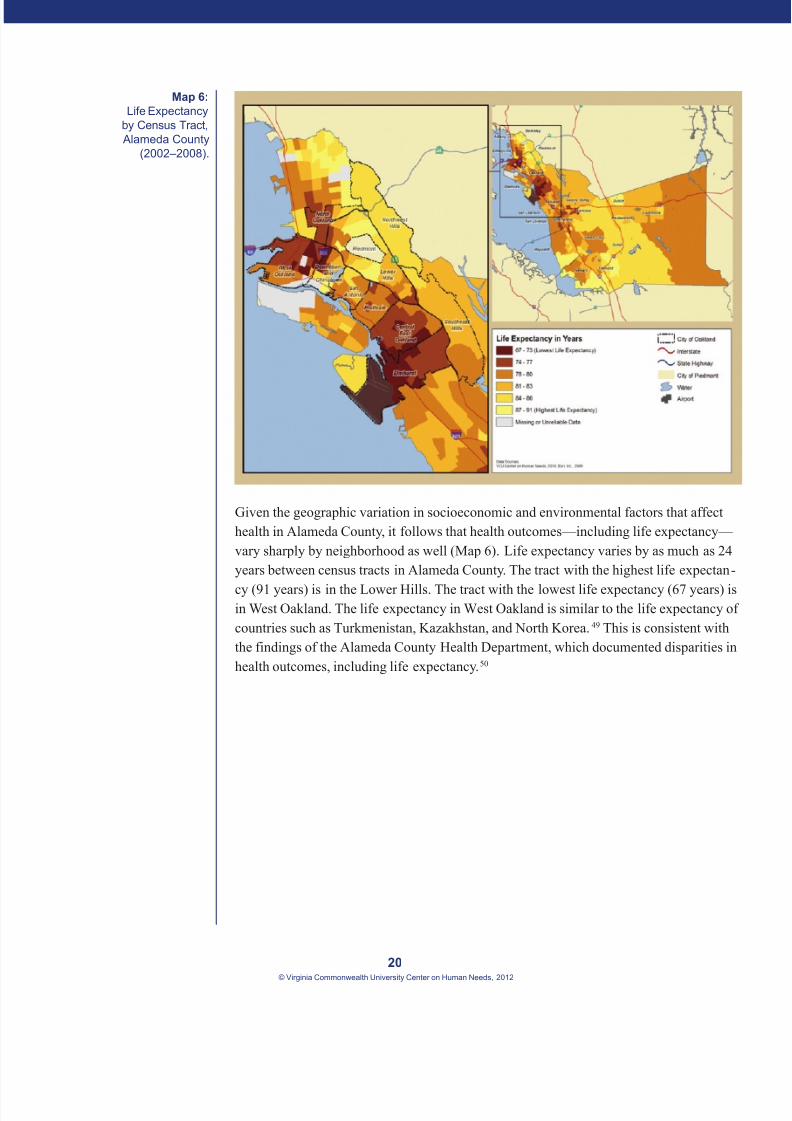
Health OutcomesAlameda County has longer life expectancy at birth (80.5 years) than do California (80.0years) and the United States (78.0 years) (Table 3). However, the all-cause mortality rateand the low birth weight rate for Alameda County were both somewhat higher than the
rates in California.
Rates for all-cause mortality and low birth weight babies in the region tend to be loweramong Latinos than among non-Latinos. The highest rates for both all-cause mortalityand low birth weight are observed among African Americans, who also have elevatedrates at the state and national levels.
Alameda California United States
Life expectancy (years) 80.5 a 80.0 b 78.0 b
All-cause mortality rate* (1999–2007) c 732.3 675.0 759.5
Non-Latino 749.4 702.8 776.3
Latino 577.3 537.9 546.1
White 761.0 790.4 815.9
African American 1092.5 1061.1 1068.5
Asian 462.8 482.2 458.6
Low birth weight rate (%) (2008) d 7.1 6.8 8.2
Non-Latino 7.9 7.5 8.6
Latino 5.3 6.1 7.0
White (%) 6.8 6.4 7.2
African American (%) 11.3 12.1 13.7
Asian (%) 7.3 7.7 8.2
(a) Calculations performed by the Alameda County Health Department from data provided byCalifornia Death Master le 2002–2008.(b) Calculations performed by American Human Development Index from data provided bythe Centers for Disease Control and Prevention’s National Vital Statistics Survey and the USCensus Bureau.(c) Data from the Centers for Disease Control and Prevention, CDC Wonder, adjusted to the2000 Census Population.(d) The Centers for Disease Control and Prevention National Vital Statistics System 2008.*Mortality statistics are per 100,000 population.
8/11/2019 Neighborhood-Level Determinants of Life Expectancy in Oakland, CA
http://slidepdf.com/reader/full/neighborhood-level-determinants-of-life-expectancy-in-oakland-ca 20/42

8/11/2019 Neighborhood-Level Determinants of Life Expectancy in Oakland, CA
http://slidepdf.com/reader/full/neighborhood-level-determinants-of-life-expectancy-in-oakland-ca 21/42
21© Virginia Commonwealth University Center on Human Needs, 2012
II. NeighborhoodCharacteristics and
Health OutcomesThis section explores health opportunities associated with neighborhood characteristicsthat represent different domains of community life: economics, education, public safety,and the built environment. For economics, education, and public safety, we constructedmultivariate indices that provide summary values for each census tract. For educationand economics, high index values indicate high opportunity, whereas low values indicatelower opportunity. For public safety, high index values represent areas with higher crime.For the built environment, we also explored the use of multivariate indices, but becausethese were not reliable, we present data on individual measures of these domains.
Although we will explore each of these domains separately, it is important to note thatthey are deeply interrelated. To better understand how these individual variables interactto shape a community environment that affects how long a person can expect to live,we combined the indices together in order to examine the relationship between multiplecommunity-level risks and life expectancy simultaneously.
Map 7:Economic Opportunity Index
by Block Group, AlamedaCounty (2009).
Note: The economic opportunity index is a composite index based on the following indicators: percent employed, percentageof owner-occupied houses, percentage of households with an automobile, and percentage of population with incomes above150% of the FPL. Higher scores represent higher levels of economic opportunity.

8/11/2019 Neighborhood-Level Determinants of Life Expectancy in Oakland, CA
http://slidepdf.com/reader/full/neighborhood-level-determinants-of-life-expectancy-in-oakland-ca 22/42
22© Virginia Commonwealth University Center on Human Needs, 2012
Map 8:Foreclosure by
Block Group, Alameda County
(2009).
Life Expectancy and EconomicConditionsIndividual and community-level economic resources are known to be important tohealth. 13,17,51–54 Income, race, educational attainment, and health behaviors are some ofthe strongest predictors of a long life 55 across a variety of geographic levels, includ -ing neighborhood (census tract), county, state, and nation. To examine the relationship
between economic opportunity and health in Oakland, we created an index to representeconomic opportunity based on rates of employment, home ownership, automobileownership, and poverty from 2009 Geolytics data (see Appendix A for more details onmethods). The lowest scores on the economic opportunity index, representing extremeeconomic disadvantage, can be found in West Oakland, Elmhurst, Downtown, and China -town (Map 7). The higher rates of foreclosure can be found in West Oakland, Downtown,Chinatown, Central East Oakland, and Elmhurst (Map 8).
Strong neighborhood-level effects of economic factors on health have been observed, particularly with regard to income, 17,53,56,57 indicating that economic opportunities in agiven geographic area correlate with mortality indicators. In Oakland, we found a mod -erately strong correlation between the economic opportunity index and life expectancy(r = 0.59, P < 0.0001) at the census-tract level, indicating that as economic opportunityincreases, life expectancy tends to increase.

8/11/2019 Neighborhood-Level Determinants of Life Expectancy in Oakland, CA
http://slidepdf.com/reader/full/neighborhood-level-determinants-of-life-expectancy-in-oakland-ca 23/42
23© Virginia Commonwealth University Center on Human Needs, 2012
Figure 6:Life Expectancy by
Economic Opportunity,Oakland 2002-2009
Map 9:Co-occurrence of Low
Economic Opportunity andLow Life Expectancy byCensus Tract, Oakland
(2002–2009).
In Figure 6, Alameda County census tracts are divided into quintiles (five groups) fromthe highest economic opportunity to the lowest. Life expectancy in census tracts in thehighest economic opportunity quintile averaged 7.7 years longer than life expectancy incensus tracts in the lowest economic opportunity quintile. West Oakland, Downtown, andChinatown contain census tracts with the lowest economic opportunity and the lowestlife expectancy (Map 9).
84
82
80
78
7674
72
70 Low Moderate High Opportunity Opportunity Opportunity
Source (a): Alameda County Vital Statistics, 2002-2008Source (b): Geolytic Projections, 2009
Economic Opportunity Quintiles b
L i f e E x p e c t a n c y
i n Y e a r s
a
Note: Lowest economic opportunity = –3.07 to –1.65; lower economic opportunity = –3.07 to –0.79; low economicopportunity= –3.07 to –0.06; lowest life expectancy = 67 to 72 years; lower life expectancy = 67 to 75 years; low lifeexpectancy = 67 to 78 years

8/11/2019 Neighborhood-Level Determinants of Life Expectancy in Oakland, CA
http://slidepdf.com/reader/full/neighborhood-level-determinants-of-life-expectancy-in-oakland-ca 24/42

8/11/2019 Neighborhood-Level Determinants of Life Expectancy in Oakland, CA
http://slidepdf.com/reader/full/neighborhood-level-determinants-of-life-expectancy-in-oakland-ca 25/42
25© Virginia Commonwealth University Center on Human Needs, 2012
Map 11:Co-occurrence of
Education OpportunityIndex and Life Expectancy
by Census Tract,Oakland (2002-2009).
Table 4:Characteristics of
Low Public Safety andHigh Public Safety
Census Tracts/Block Group inOakland, 2007–2009
Life Expectancy and Public SafetyLiving in a high-crime neighborhood can pose a number of direct risks, such as assault andhomicide, as well as indirect health risks, such as increased risk for disease due to highlevels of chronic stress. 63 Like other health risks, crime is not evenly distributed acrosscommunities. High crime rates are consistently observed in communities with lower edu -cational attainment and less economic opportunity, as well as in highly segregated commu -nities. 41,64,65 In Oakland, census tracts in the highest-crime quintile according to the publicsafety opportunity index are more likely to have low housing ownership rates and loweducational attainment, high liquor store density, and low life expectancy (Table 4).
(a) Urban Strategies Council with data from the Oakland Police Department, 2007–2009(b) Geolytics Projections, 2009(c) California Department of Alcoholic Beverage Control, 2010(d) Calculations performed by the Alameda County Health Department from data provided byCalifornia Death Master le 2002-2008*High public safety values are based on the average values for block groups that fall into thelowest 20% of the index. Low public safety values are based on the average values for thehighest 20%.
High public safety* Low public safety*
Violent crime rate/100,000 persons a 441 5,001
Property crime rate/100,000 persons a 3,233 19,346
Owner-occupied households (%) b 66.2 27.7
Less than a high school diploma (%) b 5.9 34.1
Liquor store density/square mile c 55.8 299.4
Life expectancy in years d 82.5 73.8

8/11/2019 Neighborhood-Level Determinants of Life Expectancy in Oakland, CA
http://slidepdf.com/reader/full/neighborhood-level-determinants-of-life-expectancy-in-oakland-ca 26/42
26© Virginia Commonwealth University Center on Human Needs, 2012
According to the Federal Bureau of Investigation, in 2009 Oakland had a violent crimerate of 1,679 per 100,000 residents, which is more than three times the rate for Califor -nia and the United States (Table 5). 66 Oakland’s violent crime rate included high rates ofmurder, rape, robbery, and aggravated assault that exceeded national and state averages. 66
The property crime rate and all of its subcomponents were also significantly higher in
Oakland than in California or the United States.66
It is important to note, however, thatcrime rates are highly dependent on the type of setting (urban versus rural) as well as thesocial and economic characteristics of an area.
Source: United States Justice Department—Federal Bureau of Investigation; 2009 Crime inthe United States.
Oakland California United States
Violent crime rate per 100,000 1,679 472 429
Murder and non-negligent manslaughter 26 5 5
Forcible rape 81 24 29
Robbery 716 173 133
Aggravated assault 857 270 263Property crime rate per 100,000 4,986 2,732 3,036
Burglary 1,186 623 716
Larceny-theft 2,183 1,665 2,061
Motor vehicle theft 1,617 444 259
Table 5:Crime Rates in Oakland,
the State of California,and the United States,
2009
Figure 7:Percentage of Students
who Reported FeelingUnsafe or Very Unsafe
at School, 2010
18%
16%
14%
12%
10%
8%
6%
4%
2%
0% Asian White Hispanic Black
Source: California Healthy Kids Survey, 2010.
Alameda County
Oakland
Studies increasingly document indirect threats to health when there is inadequate com -munity safety. Children and youth living in high-crime neighborhoods have been shownto have higher levels of chronic psychological distress. 67 This elevated stress becauseof perceived lack of safety has been associated with chronic stress and elevated risk forstress-related diseases. 63,67,68 Youth living in high-crime areas may suffer from pressuresto participate in criminal activity because of limited economic opportunity, 64 the needto protect themselves from threats of physical violence, or perceived social norms. 69 In
8/11/2019 Neighborhood-Level Determinants of Life Expectancy in Oakland, CA
http://slidepdf.com/reader/full/neighborhood-level-determinants-of-life-expectancy-in-oakland-ca 27/42
27© Virginia Commonwealth University Center on Human Needs, 2012
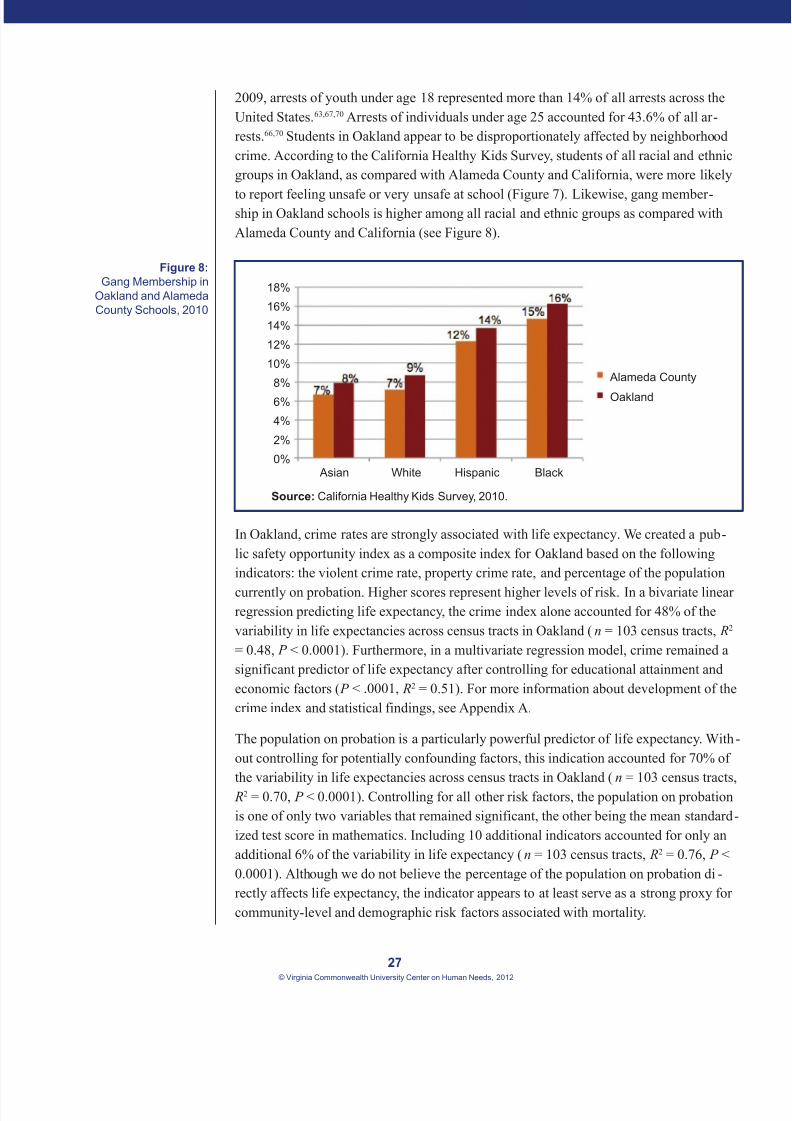
Figure 8:Gang Membership in
Oakland and AlamedaCounty Schools, 2010
2009, arrests of youth under age 18 represented more than 14% of all arrests across theUnited States. 63,67,70 Arrests of individuals under age 25 accounted for 43.6% of all ar -rests. 66,70 Students in Oakland appear to be disproportionately affected by neighborhoodcrime. According to the California Healthy Kids Survey, students of all racial and ethnicgroups in Oakland, as compared with Alameda County and California, were more likely
to report feeling unsafe or very unsafe at school (Figure 7). Likewise, gang member -ship in Oakland schools is higher among all racial and ethnic groups as compared withAlameda County and California (see Figure 8).
18%
16%
14%
12%
10%
8%
6%
4%
2%
0% Asian White Hispanic Black
Source: California Healthy Kids Survey, 2010.
Alameda County
Oakland
In Oakland, crime rates are strongly associated with life expectancy. We created a pub -lic safety opportunity index as a composite index for Oakland based on the followingindicators: the violent crime rate, property crime rate, and percentage of the population
currently on probation. Higher scores represent higher levels of risk. In a bivariate linearregression predicting life expectancy, the crime index alone accounted for 48% of thevariability in life expectancies across census tracts in Oakland ( n = 103 census tracts, R2 = 0.48, P < 0.0001). Furthermore, in a multivariate regression model, crime remained asignificant predictor of life expectancy after controlling for educational attainment andeconomic factors ( P < .0001, R2 = 0.51). For more information about development of thecrime index and statistical findings, see Appendix A.
The population on probation is a particularly powerful predictor of life expectancy. With -out controlling for potentially confounding factors, this indication accounted for 70% ofthe variability in life expectancies across census tracts in Oakland ( n = 103 census tracts,
R2 = 0.70, P < 0.0001). Controlling for all other risk factors, the population on probationis one of only two variables that remained significant, the other being the mean standard -ized test score in mathematics. Including 10 additional indicators accounted for only anadditional 6% of the variability in life expectancy ( n = 103 census tracts, R2 = 0.76, P <0.0001). Although we do not believe the percentage of the population on probation di -rectly affects life expectancy, the indicator appears to at least serve as a strong proxy forcommunity-level and demographic risk factors associated with mortality.
8/11/2019 Neighborhood-Level Determinants of Life Expectancy in Oakland, CA
http://slidepdf.com/reader/full/neighborhood-level-determinants-of-life-expectancy-in-oakland-ca 28/42
28© Virginia Commonwealth University Center on Human Needs, 2012
Map 12:Public Safety Opportunity
by Block Group,Oakland (2007–2010)
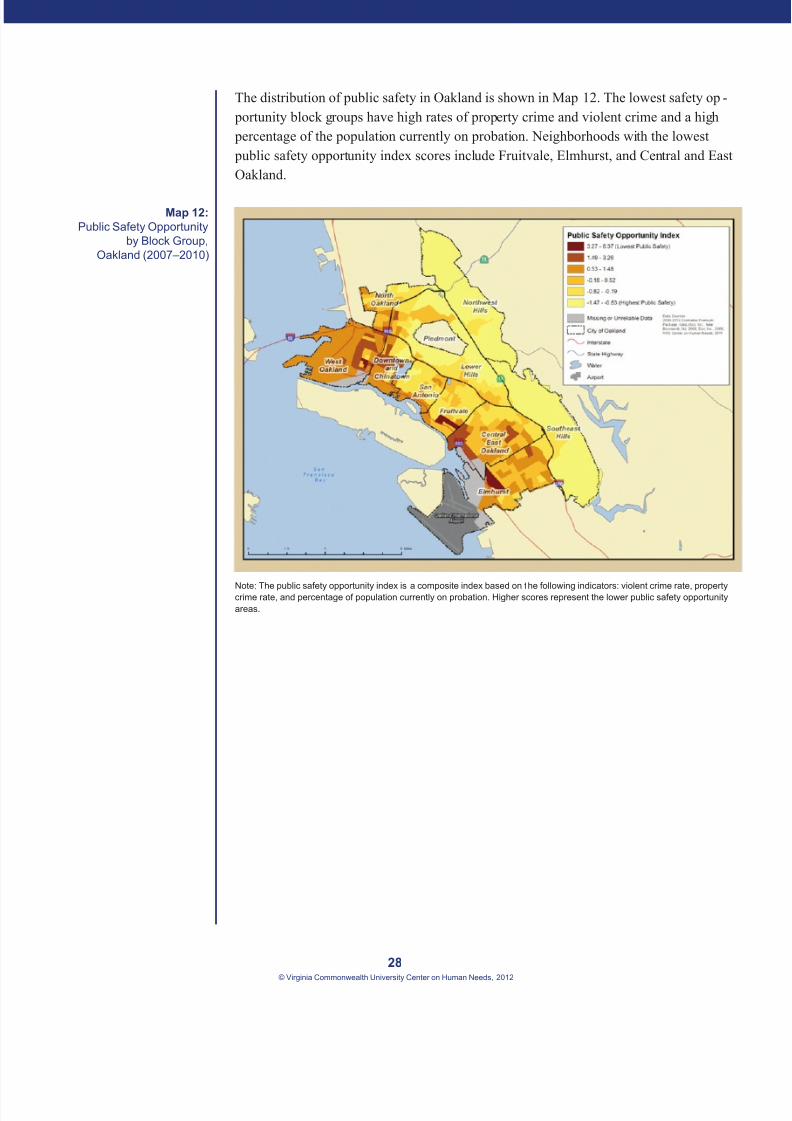
The distribution of public safety in Oakland is shown in Map 12. The lowest safety op - portunity block groups have high rates of property crime and violent crime and a high percentage of the population currently on probation. Neighborhoods with the lowest public safety opportunity index scores include Fruitvale, Elmhurst, and Central and EastOakland.
Note: The public safety opportunity index is a composite index based on t he following indicators: violent crime rate, propertycrime rate, and percentage of population currently on probation. Higher scores represent the lower public safety opportunityareas.

8/11/2019 Neighborhood-Level Determinants of Life Expectancy in Oakland, CA
http://slidepdf.com/reader/full/neighborhood-level-determinants-of-life-expectancy-in-oakland-ca 29/42
29© Virginia Commonwealth University Center on Human Needs, 2012
Map 13:Co-occurrence of Low
Public Safety Opportunityand Life Expectancy byCensus Tract, Oakland
(2002–2009)
Census tracts in Oakland with the lowest public safety opportunity index scores areshown in Map 13, together with the lowest life expectancies. These are in Fruitvale, Elm -hurst, Central East Oakland, and West Oakland.
Note: Lowest public safety opportunity = 1.49 to 2.79; lower public safety opportunity = 0.56 to 2.79; low public safety opportu-nity = 0.08 to 2.79; Lowest life expectancy = 67 to 72 years; lower life expectancy = 67 to 74 years; low life expectancy = 67 to77 years.
Life Expectancy and the BuiltEnvironmentSocial determinants of health are not restricted to the characteristics of individuals andfamilies. Socioeconomically disadvantaged communities and communities of color oftenface additional health risks because of characteristics of the physical environment, suchas exposure to environmental hazards, lack of access to healthy food choices, and fewopportunities for safe physical activity. Based on indicators of interest to the AlamedaCounty Place Matters team, we attempted to create an index using measures of respira -tory risk and density of liquor stores, grocery stores, and parks to examine the relation -ship between the “built environment” and life expectancy. However, these variables didnot fit well into a reliable index, so they are explored individually below (see Appendix Afor more details).

8/11/2019 Neighborhood-Level Determinants of Life Expectancy in Oakland, CA
http://slidepdf.com/reader/full/neighborhood-level-determinants-of-life-expectancy-in-oakland-ca 30/42
30© Virginia Commonwealth University Center on Human Needs, 2012
Map 14:Density of Liquor Stores
and Store Locationsby Block Group,
Alameda County(2011).
Previous research has documented that closer proximity to hazardous sites and height -ened exposure to pollution are more common in neighborhoods populated by people ofcolor and the economically disadvantaged. 71–76 Some longitudinal studies suggest thattoxic facilities are deliberately sited in minority communities, 77 possibly because suchneighborhoods are socially isolated and hold limited political power to resist undesirable
land-use decisions by governments and corporations.78
These findings appear consistentwith some environmental hazard data for Oakland.
The very same communities often lack nutritious food options and have a surfeit ofunhealthy options, including fast food outlets and liquor stores. Access to grocery storesand green space are considered important for promoting healthy diets 79–81 and physicalactivity, 82–85 which may affect some health outcomes such as obesity and related healthcomplications. 86 In Oakland, however, we did not observe a relationship between thesemeasures and life expectancy. Map 14 shows the distribution of liquor stores in Oak -land. Compared with Oakland as a whole, liquor store density is 1.5 times higher in thelowest–life expectancy census tracts and at least 3.5 times higher in the highest-crimecensus tracts. The literature does not suggest that liquor store density is directly associat -ed with mortality; however, studies have found significant positive associations betweenliquor store density and both violent crime and economic disadvantage, which in turn areassociated with poor health outcomes. 87–90
Exposure to environmental hazards, lack of access to healthy foods, and a high density ofliquor stores often occur in the same Oakland communities that are home to the highestcrime, lowest educational attainment, and fewest economic opportunities.
8/11/2019 Neighborhood-Level Determinants of Life Expectancy in Oakland, CA
http://slidepdf.com/reader/full/neighborhood-level-determinants-of-life-expectancy-in-oakland-ca 31/42
31© Virginia Commonwealth University Center on Human Needs, 2012
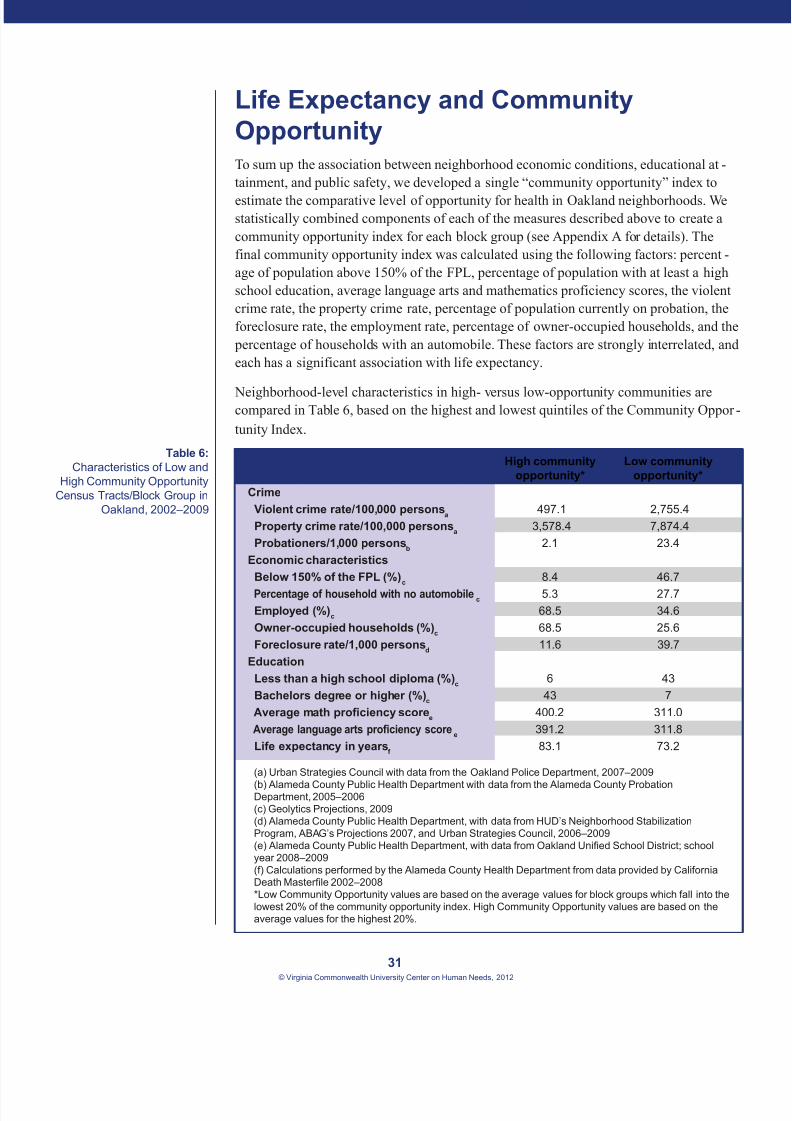
Life Expectancy and CommunityOpportunityTo sum up the association between neighborhood economic conditions, educational at -tainment, and public safety, we developed a single “community opportunity” index toestimate the comparative level of opportunity for health in Oakland neighborhoods. Westatistically combined components of each of the measures described above to create acommunity opportunity index for each block group (see Appendix A for details). Thefinal community opportunity index was calculated using the following factors: percent -age of population above 150% of the FPL, percentage of population with at least a highschool education, average language arts and mathematics proficiency scores, the violentcrime rate, the property crime rate, percentage of population currently on probation, theforeclosure rate, the employment rate, percentage of owner-occupied households, and the
percentage of households with an automobile. These factors are strongly interrelated, andeach has a significant association with life expectancy.
Neighborhood-level characteristics in high- versus low-opportunity communities arecompared in Table 6, based on the highest and lowest quintiles of the Community Oppor -tunity Index.
Table 6:Characteristics of Low and
High Community OpportunityCensus Tracts/Block Group in
Oakland, 2002–2009
High community Low communityopportunity* opportunity*
Crime Violent crime rate/100,000 persons a 497.1 2,755.4
Property crime rate/100,000 persons a 3,578.4 7,874.4 Probationers/1,000 persons b 2.1 23.4
Economic characteristicsBelow 150% of the FPL (%) c 8.4 46.7
Percentage of household with no automobile c 5.3 27.7 Employed (%) c 68.5 34.6 Owner-occupied households (%) c 68.5 25.6 Foreclosure rate/1,000 persons d 11.6 39.7Education
Less than a high school diploma (%) c 6 43 Bachelors degree or higher (%) c 43 7 Average math profciency score e 400.2 311.0 Average language arts profciency score e 391.2 311.8 Life expectancy in years f 83.1 73.2
(a) Urban Strategies Council with data from the Oakland Police Department, 2007–2009
(b) Alameda County Public Health Department with data from the Alameda County ProbationDepartment, 2005–2006(c) Geolytics Projections, 2009(d) Alameda County Public Health Department, with data from HUD’s Neighborhood StabilizationProgram, ABAG’s Projections 2007, and Urban Strategies Council, 2006–2009(e) Alameda County Public Health Department, with data from Oakland Uni ed School District; schoolyear 2008–2009(f) Calculations performed by the Alameda County Health Department from data provided by CaliforniaDeath Master le 2002–2008*Low Community Opportunity values are based on the average values for block groups which fall into thelowest 20% of the community opportunity index. High Community Opportunity values are based on theaverage values for the highest 20%.

8/11/2019 Neighborhood-Level Determinants of Life Expectancy in Oakland, CA
http://slidepdf.com/reader/full/neighborhood-level-determinants-of-life-expectancy-in-oakland-ca 32/42

8/11/2019 Neighborhood-Level Determinants of Life Expectancy in Oakland, CA
http://slidepdf.com/reader/full/neighborhood-level-determinants-of-life-expectancy-in-oakland-ca 33/42
33© Virginia Commonwealth University Center on Human Needs, 2012
Map 16:Co-occurrence of
Community Opportunityand Low Life Expectancy
by Census Tract, Oakland(2002–2010).
Note: Lowest community opportunity index = –2.04 to –1.22; lower community opportunity index = –2.04 to –0.65; low com-munity opportunity index = –2.04 to –0.13; Lowest life expectancy = 67 to 72 years; lower life expectancy = 67 to 75 years; low life expectancy = 67 to 78 years
The observed relationship between community opportunity and life expectancy does not provide evidence for a causal relationship. A variety of factors may affect life expectancy,including social, environmental, and behavioral factors—many of which are themselves
associated with the indicators measured by the community opportunity index. To somedegree, the observed association between our index and life expectancy may representthe influence of these confounding variables and not a causal role of the measured indica -tors themselves.
Furthermore, data on life expectancy were only available at the census-tract level, andthus individual-level analyses of relationships between socioeconomic characteristics,crime, education, the built environment, and life expectancy were not possible. Nonethe -less, our analyses showed that areas with high census-tract-level community opportunityfactors had significantly higher life expectancies.

8/11/2019 Neighborhood-Level Determinants of Life Expectancy in Oakland, CA
http://slidepdf.com/reader/full/neighborhood-level-determinants-of-life-expectancy-in-oakland-ca 34/42
34© Virginia Commonwealth University Center on Human Needs, 2012
III. ConclusionsThe analyses presented here have shown that crime, economic conditions, education, andthe built environment are strongly linked with life expectancy in Oakland at the neigh -
borhood level. Indicators that comprised these indices (poverty, foreclosure rates, homeownership, employment, percentage of population with an automobile, education, crimerates, density of individuals on probation, and average standardized test scores) are alsostrongly correlated with life expectancy. Together, these factors explain more than half ofthe variability in life expectancy in Oakland.
Understanding of the causal relationship between crime, economics, education, and the built environment and health is still evolving. The analyses included in this report areentirely cross-sectional (studies of the relationship between two variables at one point intime rather than sequentially) and ecological (studies of the characteristics of populationsrather than individuals) and do not address the literature that examines the mechanisms
by which these and other factors might relate to the natural history of disease or mortal -ity.
Health disparities associated with economic opportunity, education, and the environmentare complex, multifactorial relationships that cannot be reduced to a single etiology ormitigated by a single policy solution. The literature and this analysis suggest, however,that interventions aimed at crime prevention, community and economic development,and improving educational opportunities may be important public health strategies inOakland, particularly in West Oakland, Central East Oakland, and Elmhurst.

8/11/2019 Neighborhood-Level Determinants of Life Expectancy in Oakland, CA
http://slidepdf.com/reader/full/neighborhood-level-determinants-of-life-expectancy-in-oakland-ca 35/42

8/11/2019 Neighborhood-Level Determinants of Life Expectancy in Oakland, CA
http://slidepdf.com/reader/full/neighborhood-level-determinants-of-life-expectancy-in-oakland-ca 36/42
36© Virginia Commonwealth University Center on Human Needs, 2012
1. Woolf SH, Braveman P. Where health disparities begin: The role of social and economic determinants— and why current policies could make matters worse. Health Affairs. 2011;30:1852–1859.
2. Solar O, Irwin A,World Health Organization. A conceptual framework for action on the socialdeterminants of health. Social Determinents of Health Discussion Paper . 2nd ed. Geneva, Switzerland:World Health Organization; 2010.
3. WHO Commission on Social Determinants of Health, World Health Organization. Closing the gap ina generation: Health equity through action on the social determinants of health. Final report. Geneva,Switzerland: World Health Organization; 2008.
4. John D. and Catherine T. MacArthur Foundation. Reaching for a Healthier Life; Facts onSocioeconomic Status and Health in the United States . Chicago, IL: MacArthur Foundation Research
Network on Socioeconomic Status and Health; 2008.
5. Braveman P, Egerter S. Overcoming Obstacles to Health . Princeton, NJ: Robert Wood JohnsonFoundation; 2008.
6. McGinnis JM, Williams-Russo P, Knickman JR. The case for more active policy attention to health promotion. Health Aff (Millwood) . 2002;21(2):78–93.
7. Agency for Healthcare Research and Quality. 2009 National healthcare disparities report. Rockville,
MD: U.S. Department of Health and Human Services; 2010.
8. Smedley BD, Stith AY, Nelson AR, Institute of Medicine (U.S.), Committee on Understanding andEliminating Racial and Ethnic Disparities in Health Care. Unequal Treatment:Confronting Racial and
Ethnic Disparities in Health Care. Washington, DC: National Academy Press; 2003.
9. Wilkinson RG, Marmot MG, World Health Organization, et al. Social Determinants of Health: TheSolid Facts. 2nd ed. Copenhagen: WHO Regional Of ce for Europe; 2003.
10. Marmot M. Social determinants of health inequalities. Lancet. 2005;365:1099–1104.
11. Wilkinson RG, Marmot MG, World Health Organization, et al. Social Determinants of Health: TheSolid Facts. 2nd ed. Copenhagen: WHO Regional Of ce for Europe; 2003.
12. Adler NE, John D. and Catherine T. MacArthur Foundation, Research Network on SocioeconomicStatus and Health. Reaching for a Healthier Life: Facts on Socioeconomic Status and Health in theU.S. San Francisco, CA: John D. and Catherine T. MacArthur Foundation Research Network onSocioeconomic Status and Health; Chicago, IL; 2007.
13. Shaw M. Housing and public health. Annu Rev Public Health. 2004;25:397–418.
14. Leventhal T, Brooks-Gunn J. The neighborhoods they live in: The effects of neighborhood residence onchild and adolescent outcomes. Psychol Bull . 2000;126(2):309–337.
15. Lynch JW, Kaplan GA, Salonen JT. Why do poor people behave poorly? Variation in adult health behaviours and psychosocial characteristics by stages of the socioeconomic lifecourse. Soc Sci Med. 1997;44(6):809–819.
16. Smedley BD, Syme SL, Institute of Medicine (U.S.), Committee on Capitalizing on Social Science andBehavioral Research to Improve the Public’s Health. Promoting Health: Intervention Strategies fromSocial and Behavioral Research. Washington, DC: National Academy Press; 2000.
17. Yen IH, Syme SL. The social environment and health: A discussion of the epidemiologic literature. Annu Rev Public Health . 1999;20:287–308.
18. McNeill LH, Kreuter MW, Subramanian SV. Social environment and physical activity: A review ofconcepts and evidence. Soc Sci Med . 2006;63(4):1011–1022.
19. Robert SA. Socioeconomic position and health: The independent contribution of communitysocioeconomic context. Annu Rev Soc .1999;25:489–516.

8/11/2019 Neighborhood-Level Determinants of Life Expectancy in Oakland, CA
http://slidepdf.com/reader/full/neighborhood-level-determinants-of-life-expectancy-in-oakland-ca 37/42
37© Virginia Commonwealth University Center on Human Needs, 2012
20. Sampson RJ, Morenoff JD, Gannon-Rowley T. Assessing “neighborhood effects”: Social processes andnew directions in research. Annu Rev Soc . 2002;28:443–478.
21. Jencks C, Mayer SE. Segregation, job proximity, and black job opportunities: The empirical status ofthe spatial mismatch hypothesis. In: Lynn LE, McGeary MGH, eds. Inner-City Poverty in the UnitedStates. Washington, DC: National Academy Press; 1990:187–222.
22. Mouw T. Job relocation and the racial gap in unemployment in Detroit and Chicago, 1980 to 1990. AmSociol Rev . 2000;65(5):730–753.
23. Small ML, McDermott M. The presence of organizational resources in poor urban neighborhoods: Ananalysis of average and contextual effects. Soc Forces . 2006;84(3):1697–1724.
24. Diez-Roux AV, Nieto FJ, Caul eld L, Tyroler HA, Watson RL, Szklo M. Neighbourhood differencesin diet: The atherosclerosis risk in communities (ARIC) study. J Epidemiol Commun Health.1999;53(1):55–63.
25. Larson NI, Story MT, Nelson MC. Neighborhood environments: Disparities in access to healthy foodsin the U.S. Am J Prev Med. 2009;36(1):74–81.
26. Coulton CJ, Crampton DS, Irwin M, Spilsbury JC, Korbin JE. How neighborhoods in uence childmaltreatment: A review of the literature and alternative pathways. Child Abuse Negl . 2007;31(11–
12):1117–1142.
27. McEwen BS. Stress, adaptation, and disease. Allostasis and allostatic load. Ann N Y Acad Sci.1998;840:33–44.
28. Steptoe A, Marmot M. The role of psychobiological pathways in socio-economic inequalities incardiovascular disease risk. Eur Heart J . 2002;23(1):13–25.
29. Massey DS, Denton NA. American Apartheid: Segregation and the Making of the Underclass.Cambridge, Mass: Harvard Univ Press; 1993.
30. Jargowsky PA. Poverty and Place: Ghettos, Barrios, and the American City . New York: Russell SageFoundation; 1997.
31. Charles CZ. The dynamics of racial residential segregation. Annu Rev Sociol . 2003;29:167–207.
32. Squires GD, Kubrin CE. Privileged places: Race, uneven development and the geography ofopportunity in urban America. Urban Stud . 2005;42(1):47–68.
33. Jahn J, Schmid CF, Schrag C. The measurement of ecological segregation. Am Sociol Rev .1947;12:293–303.
34. Frey WH. New Racial Segregation Measures for States and Large Metropolitan Areas: Analysis of the2005–2009 American Community Survey. Available at: http://censusscope.org/ACS/Segregation.html.Accessed February 15, 2011.
35. Subramanian SV, Kim DJ, Kawachi I. Social trust and self-rated health in US communities: A multilevelanalysis. J Urban Health . 2002;79:S21–S34.
36. Kawachi I, Kennedy BP, Lochner K, Prothrow-Stith D. Social capital, income inequality, and mortality. Am J Public Health. 1997;87(9):1491–1498.
37. U.S. Census Bureau. U.S. Census Bureau 2009 American Community Survey; 2010.
38. Adams PF, Barnes PM, Vickerie JL. Summary health statistics for the U.S. population: National healthinterview survey, 2007. Vital Health Stat 10 . 2008;(238)(238):1–104.
39. Brooks-Gunn J, Duncan GJ. The effects of poverty on children. Future Child . 1997;7(2):55–71.
40. Duncan GJ, Brooks-Gunn J, Klebanov PK. Economic deprivation and early childhood development.Child Dev. 1994;65(2 Spec No):296–318.

8/11/2019 Neighborhood-Level Determinants of Life Expectancy in Oakland, CA
http://slidepdf.com/reader/full/neighborhood-level-determinants-of-life-expectancy-in-oakland-ca 38/42
38© Virginia Commonwealth University Center on Human Needs, 2012
41. Caywood-Thomas-E. Social ecology & urban homicides: Milwaukee, wisconsin 1987–1992. Social Ecology & Urban Homicides: Milwaukee, Wisconsin 1987–1992 . Thesis, Sam Houston StateUniversity; 1995.
42. Suresh G, Vito GF. Homicide patterns and public housing: The case of Louisville, KY (1989–2007). Homicide Stud . 2009;13:411–433.
43. Rephann T. Rental housing and crime: The role of property ownership and management. Annu Reg Sci. 2009;43:435–451.
44. Forest SA, Sager I. A great place to bring up kids. BusinessWeek . 2003:8–8.
45. Geolytics I. 2009 estimates premium. East Brunswick, NJ: Geolytics; 2009.
46. Heron M, Hoyert DL, Murphy SL, Xu J, Kochanek KD, Tejada-Vera B. Deaths: Final data for 2006. Natl Vital Stat Rep . 2009;57:1–134.
47. Centers for Disease Control and Prevention (CDC). Cigarette smoking among adults—United States,2002. MMWR Morb Mortal Wkly Rep . 2004;53:427–431.
48. U.S. Census Bureau. Census of population and housing; 2010.
49. Central Intelligence Agency. CIA World Factbook. Life Expectancy at Birth; 2011.50. Beyers M, Brown J, Cho S, et al. Life and Death from Unnatural Causes: Health and Social Inquity in
Alameda County. Oakland, CA: Alameda County Public Health Department; 2008.
51. Franzini L, Spears W. Contributions of social context to inequalities in years of life lost to heart diseasein texas, USA. Soc Sci Med. 2003;57:1847–1861.
52. Antonovsky A. Social class, life expectancy and overall mortality. Milbank Mem Fund Q . 1967;45:31– 73.
53. Chen JT, Rehkopf DH, Waterman PD, et al. Mapping and measuring social disparities in prematuremortality: The impact of census tract poverty within and across Boston neighborhoods, 1999–2001. JUrban Health . 2006;83(6):1063–1084.
54. Mans eld CJ, Wilson JL, Kobrinski EJ, Mitchell J. Premature mortality in the United States: The rolesof geographic area, socioeconomic status, household type, and availability of medical care. Am J Public Health . 1999;89(6):893–898.
55. Centers for Disease Control and Prevention. CDC health disparities and inequalities report—UnitedStates, 2011. Atlanta, GA: Centers for Disease Control and Prevention; 2011.
56. Cooper RS, Kennelly JF, Durazo-Arvizu R, Oh H, Kaplan G, Lynch J. Relationship between prematuremortality and socioeconomic factors in black and white populations of U.S. metropolitan areas. Public
Health Rep. 2001;116(5):464.
57. Subramanian SV, Chen JT, Rehkopf DH, Waterman PD, Krieger N. Racial disparities in context: Amultilevel analysis of neighborhood variations in poverty and excess mortality among black populationsin Massachusetts [corrected] [published errata appear in Am J Public Health. Mar, 2005;95(3):375]. Am
J Public Health . 2005;95(2):260–265.
58. Muller A. Education, income inequality, and mortality: A multiple regression analysis. BMJ .2002;324:23–25.
59. Reither EN, Peppard PE, Remington PL, Kindig DA. Increasing educational disparities in prematureadult mortality, Wisconsin, 1990–2000. WMJ . 2006;105:38–41.
60. Elo IT, Preston SH. Educational differentials in mortality: United States, 1979–85. Soc Sci Med. 1996;42:47–57.

8/11/2019 Neighborhood-Level Determinants of Life Expectancy in Oakland, CA
http://slidepdf.com/reader/full/neighborhood-level-determinants-of-life-expectancy-in-oakland-ca 39/42
39© Virginia Commonwealth University Center on Human Needs, 2012
61. Artnik B, Vidmar G, Javornik J, Laaser U. Premature mortality in Slovenia in relation to selected biological, socioeconomic, and geographical determinants. Croat Med J . 2006;47:103–113.
62. Rebell MA, Wolff JR. Moving Every Child Ahead: From NCLB Hype to Meaningful EducationalOpportunity. New York: Teachers College Press; 2008.
63. Gould Ellen I, Mijanovich T, Dillman K-N. Neighborhood effects on health: Exploring the links and
assessing the evidence. J Urban Aff. 2001;23(3):391–408.64. Brown MJ, McCulloch JW, Hiscox J. Criminal offences in an urban area and their associated social
variables. Br J Criminol. 1972;12:250–268.
65. Pearson-Nelson B. Understanding Homicide Trends: The Social Context of a Homicide Epidemic . NewYork: LFB Scholarly Pub; 2008.
66. United States Department of Justice, Federal Bureau of Investigation. Crime in the United States , 2009;2010. Table 6.
67. Fowler PJ, Tompsett CJ, Braciszewski JM, Jacques-Tiura AJ, Baltes BB. Community violence: Ameta-analysis on the effect of exposure and mental health outcomes of children and adolescents. Dev
Psychopathol . 2009;21:227–259.
68. Johnson SL, Solomon BS, Shields WC, McDonald EM, McKenzie LB, Gielen AC. Neighborhoodviolence and its association with mothers’ health: Assessing the relative importance of perceived safetyand exposure to violence. J Urban Health. 2009;86:538–550.
69. Jargowsky P A, Park Y. Cause or consequence? suburbanization and crime in U.S. metropolitan areas.Crime Delinq. 2009 ;55:28–50.
70. United States Department of Justice, Federal Bureau of Investigation. Crime in the United States, 2009 ;2010.
71. Evans GW, Kantrowitz E. Socioeconomic status and health: The potential role of environmental riskexposure. Annu Rev Public Health . 2002;23:303.
72. Morello-Frosch R, Pastor Jr. M, Porras C, Sadd J. Environmental justice and regional inequality insouthern California: Implications for future research. Environ Health Perspec Suppl. 2002;110:149.
73. Szasz A, Meuser M. Environmental inequalities: Literature review and proposals for new directions inresearch and theory. Curr Sociol. 1997;45(3):99–120.
74. Ringquist EJ. Assessing evidence of environmental inequities: A meta-analysis. J Pol Anal Manage.2005;24(2):223–247.
75. Mohai P, Bryant B. Environmental racism: Reviewing the evidence. In: Race and the Incidence of Environmental Hazards: A Time for Discourse. Mohai P, Bryant B, eds. Boulder, CO: Westview Press;1992:163.
76. United States Institute of Medicine. Toward Environmental Justice: Research, Education, and Health Policy Needs. Washington, DC: National Academy Press; 1999.
77. Pastor J, Manuel, Sadd J, Hipp J. Which came rst? Toxic facilities, minority move-in, andenvironmental justice. Journal of Urban Affairs. 2001;23(1):1.
78. Bullard RD, Johnson JS, Torres AO. Sprawl City: Race, Politics, and Planning in Atlanta. Washington,DC: Island Press; 2000.
79. Wang MC, Kim S, Gonzalez AA, MacLeod KE, Winkleby MA. Socioeconomic and food-related physical characteristics of the neighbourhood environment are associated with body mass index. J Epidemiol Comm Health . 2007;61:491–498.
80. Inagami S, Cohen DA, Finch BK, Asch SM. You are where you shop: Grocery store locations, weight,and neighborhoods. Am J Prev Med. 2006;31:10–17.

8/11/2019 Neighborhood-Level Determinants of Life Expectancy in Oakland, CA
http://slidepdf.com/reader/full/neighborhood-level-determinants-of-life-expectancy-in-oakland-ca 40/42

8/11/2019 Neighborhood-Level Determinants of Life Expectancy in Oakland, CA
http://slidepdf.com/reader/full/neighborhood-level-determinants-of-life-expectancy-in-oakland-ca 41/42

8/11/2019 Neighborhood-Level Determinants of Life Expectancy in Oakland, CA
http://slidepdf.com/reader/full/neighborhood-level-determinants-of-life-expectancy-in-oakland-ca 42/42


![Proposals to Extend Healthy Life Expectancy in Shizuoka ...€¦ · [Gap between life expectancy and healthy life expectancy in Shizuoka Prefecture] Healthy life expectancy *Source:](https://static.fdocuments.us/doc/165x107/5f427921a09c2479a15262fb/proposals-to-extend-healthy-life-expectancy-in-shizuoka-gap-between-life-expectancy.jpg)