Negotiations on Non-Agriculture Market Access (NAMA ... · •Special and Differential Treatment...
32
Negotiations on Non-Agriculture Market Access (NAMA) before and after Nairobi: Opportunities and Challenges for Indonesia Jully P. Tambunan Directorate of Multilateral Cooperation Directorate General of International Trade Cooperation
Transcript of Negotiations on Non-Agriculture Market Access (NAMA ... · •Special and Differential Treatment...

Negotiations on Non-Agriculture Market Access (NAMA) before and
after Nairobi: Opportunities and Challenges for Indonesia
Jully P. TambunanDirectorate of Multilateral Cooperation
Directorate General of International Trade Cooperation

Key Presentation Points
• Introduction to NAMA in the WTO
• NAMA negotiations in DDA: key Issues
• Progress made in NAMA negotiations prior to Nairobi
• Key Positions and Differences on NAMA of major WTO members/groups
• What happened in Nairobi on NAMA
• Opportunities and Challenges for Indonesia

(1) Introduction to NAMA in the WTO
4
INTERNATIONAL TRADE AND GROWTH
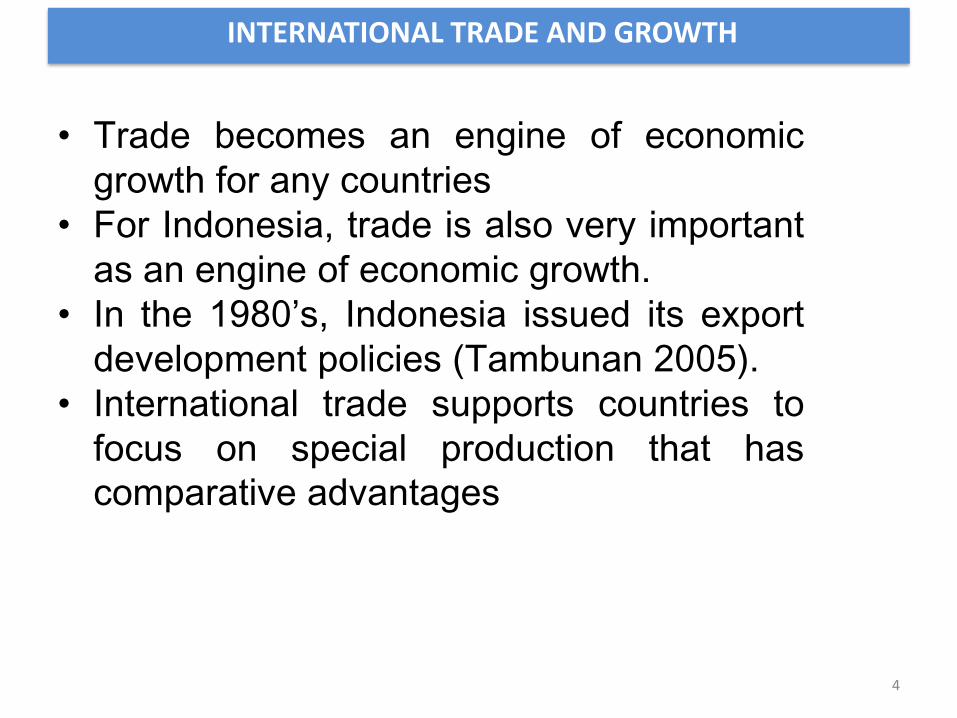
• Trade becomes an engine of economic
growth for any countries
• For Indonesia, trade is also very important
as an engine of economic growth.
• In the 1980’s, Indonesia issued its export
development policies (Tambunan 2005).
• International trade supports countries to
focus on special production that has
comparative advantages

History of the WTO
• During the multilateral trade negotiations of the Uruguay Round, It wasagreed to set up the World Trade Organization (WTO) on 1 January 1995.
• Since 1 January 1995, multilateral trade negotiations were organized bythe WTO. The scope of the negotiations cover goods, services and IPR.
• Indonesia was an original member of the WTO (now total 164
members); Indonesia has ratified the agreement of WTO in the
Law number (UU) No. 7/1994 (2 November 1994) re Ratification ofthe WTO.
• Main task of WTO is to support free trade, to eliminate and erase thetrade barrier (tariff and non tariff); provide international negotiationforum; solve trade disputes and conduct trade policy reviews amongmember countries.

Three Pillar of the world economy
Based on the three pillars of the “Bretton Woods” system:
• IMF (International Monetary Fund) the year 1946;
• IBRD (International Bank for Reconstruction andDevelopment)/World Bank the year 1945;
• ITO (International Trade Organization) failed due to therejection of the US Congress but GATT survived.– GATT (General Agreement on Tariff and Trade) in 1947 World
Trade Organization/ WTO in 1995.
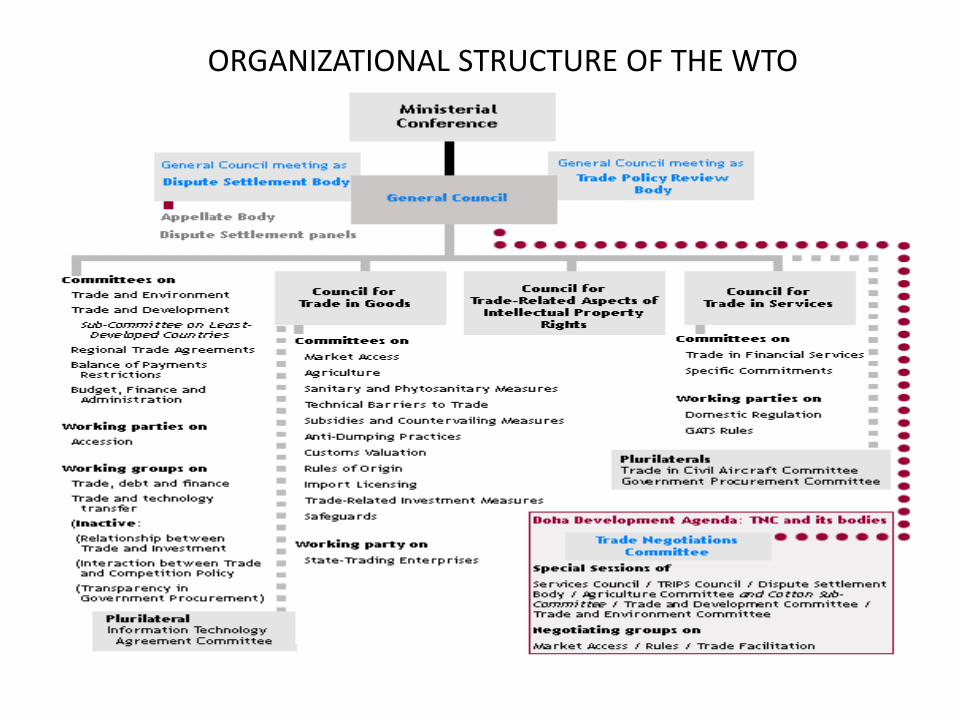
ORGANIZATIONAL STRUCTURE OF THE WTO

8
Base Principal of the MULTILATERAL
TRADING SYSTIM
• Non-discrimination MFN Most Favoured Nation : non discrimantion
among WTO member countries
National Treatment: non discrimination among
imported products and domestic product.
• Transparency:
TPRM: Review on trade policies of the WTO
member coutries on a regular basis
Notifications: submit rules and policies of the
trade of WTO member countries.

9
The basic principles of multilateral trading
system
• Reduce trade barriers (tariff and non-tariff)
To create trade with more open and predictable
• Special and Differential Treatment
Allowing the members of developing countries to
adjust, the flexibility and other treatments
• Tariff Protection to protect with tariffmechanism only;
• ReciprocityApart from the above, trade policy issues that are
developed can create more competitive because it
eliminates unfair trade practices. Furthermore, trade
systems which are developed by WTO can be more
competitive becaus it reduces tariffs.
More competitive because it reduces unfair trade practices
such as dumping and subsidy
NAMA negotiations in DDA: key Issues

11
Doha Mandate on NAMA:
“…reduce or as appropriate eliminate tariffs, including reduction or elimination of tariff peaks, high tariffs & tariff escalation, as well as NTBs, in particular on products of export interest to developing countries”
“… take fully into account the special needs & interests of developing & least-developed country participants, including through less than full reciprocity in reduction commitments”
the overarching principle remains: development

Progress Made in NAMA Negotiations prior to Nairobi

13
Selected Members
Binding Coverage
Average Applied
Tariff
Average Bound Tariff
Swiss Ave. Bound Tariff
Coe 8 Coe 20 Coe 22 Coe 25
US 100 3.1 3.3 2.34
EU 100 4.2 3.9 2.62
Brazil 100 14.1 30.8 12.13 12.83 13.80
China 100 9.1 9.0 6.21 6.39 6.62
Costa Rica 100 4.6 43.1 13.66 14.57 15.82
Egypt 99.2 9.3 27.5 11.58 12.22 13.10
India 70.5 10.2 34.6 12.67 13.45 14.51
Malaysia 81.9 5.5 14.9 8.54 8.88 9.34
Nigeria 7.0 11.1 49.2 14.22 15.20 16.58
Thailand 71.3 8.3 25.4 11.19 11.79 12.60
Indonesia 96.1 6.7 35.6 12.81 13.60 14.69
Source: unknown

• Instrumen Modalitas NAMA
a) Tariff ReductionSimple Swiss Formula
b) Special and Differencial Treatment (S&D)Azas perlakuan khusus yang berbeda bagi Negara Berkembang (NB) dibandingkan NegaraMaju (NM) dalam implementasi modalitas NAMA.
Draft Text NAMA Modalitas – Fourth Revision, Dec 6th, 2008
MODALITAS NAMA WTO
• Swiss Simple Formula : (untuk Negara Berkembang)
koefisien (b) x t0 (tarif awal)t1 (tarif akhir) = ---------------------------------
koefisien (b) + t0 (tarif awal)
where,t1 = Final bound rate of dutyt0 = Base rate of duty x = 20, y = 22, z = 25 (to be chosen) = Coefficients for Developing Members.
8 =Coefficient for Develop Members

Koefisien Formula Untuk
NB
Fleksibilitas: Opsi 1(Pemotongan Tarif separuh dari
pemotongan tarif dengan formula)
Fleksibilitas: Opsi 2(Tidak dikenakan formula
atau “post tarif unbound”)
Jumlah Post Tarif (%)
Nilai Impor Maks (%)
Jumlah Post Tarif (%)
Nilai Impor Maks (%)
Opsi X: 20 14% 16% 6,5% 7,5%
Opsi Y: 22 10% 10% 5% 5%
Opsi Z: 25 0 0 0 0
MODALITAS NAMA WTO
• Coefficient and Flexibilities for Developing Members

(1) Current position:• Average bound tariff : 36.79%• Number of Post Tariff Unbound : 443 • Number of total tariff line (2003) : 6446
(2) Application of Swiss formula:
No DescriptionCoefficient:
Flex. for Un-Bound:
Coefficient opt.; Flexibility
X Y Z
20 22 25
6,5% 5% 0
abcdef
New average bound tariff (%)Average discounted per bound tariff (%)Average Applied Tariff (2003) (%)New average Applied Tariff (2003) (%)Average discounted per Applied Tariff (%)Post Tariff which are discounted to get avg new bound tariff:- Number of (%) post Tarif (2003)- Number of Post Tarif
12,8665,067,036,606,19
15,45997
13,6662,877,036,724,44
15,45997
14,7759,857,036,872,32
9,83634
g -Number Unbound Tariff which have to be bounded-Number of tariff which are remain unbound (443-419)=
24419
120323
4430
Source: Tariff Schedule Indonesia (HS 2002); WTO Sekretariat (Tariff Simulation)Note : 1. Simulation is not including Unbound tariff; 2.Total of Tariff Unbound : 6,87%; 3. Aplied Tariff average of 2010 : 6,7%
MODALITAS NAMA WTO
2. Simulasi Pengurangan Tarif NAMA (Simple Swiss Formula)

17
0
5
10
15
20
25
30
35
40
Can
ada
EC-1
5
Jap
an
USA
Ch
ina,
PR
Ho
ng
Kon
g…
Ind
one
sia
Kor
ea
Mal
aysi
a (*
)
Phi
lippi
nes
Sin
gap
ore
Thai
land
Arg
ent
ina
Bra
zil
Ch
ile
Ind
ia
Me
xico
Sou
th A
fric
a
AV
G (%
)
AVG Final Bound
AVG MFN Applied
(*) Binding coverage could be overestimated due to partial bindings; Courtesy of South Center
Results of Uruguay Round: Bound vs Applied Rates

18
What on the table? 2008 Draft Modality Rev.3. Some consider it toocomplex & needs simplification (Argentina’s non-paper)
HK Declaration: “ We adopt a Swiss Formula with coefficients….” appliedon a line-by-line basis:
{a or (x or y or z)} x t0
t1 = ___________________________ where{a or (x or y or z)} + t0
t1 = Final bound rate of dutyt0 = Base rate of duty a = 8 = Coefficient for developed Membersx = 20, y = 22, z = 25 Coefficients for developing Members.
Other issues to address: anti-concentration, preference erosion, tariff peaks, high tariffs, tariff escalation, NTBs, sectoral initiatives (14), DFQF,remanufactured goods, environmental goods, different tariff structures
The Ministry of Trade of the Republic of Indonesia
Ekspor Impor Selisih Ekspor Impor Selisih Ekspor Impor
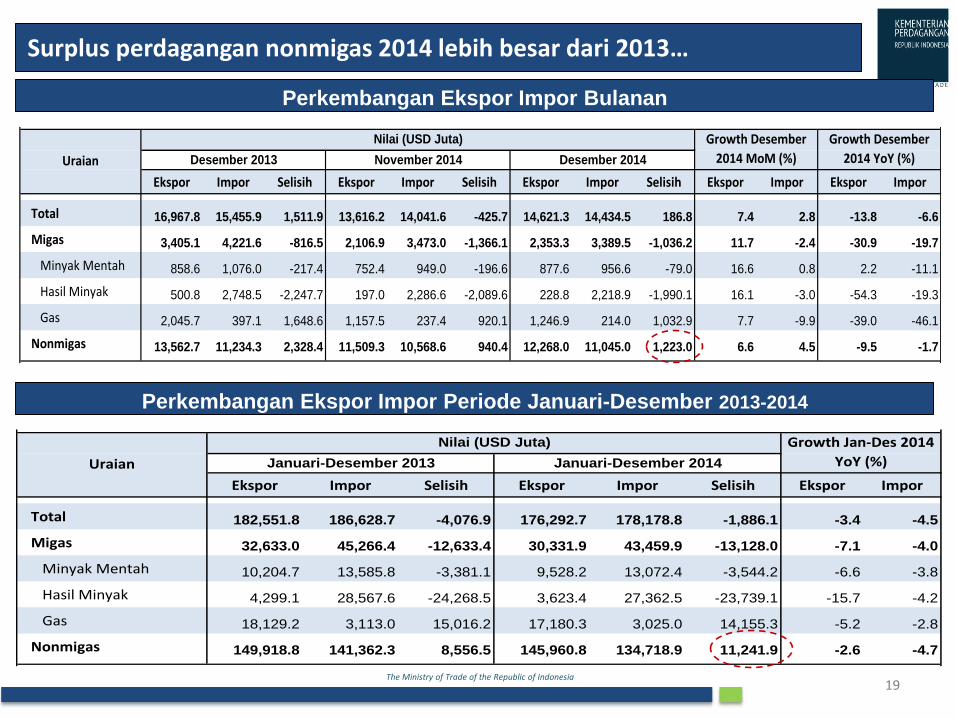
Total 182,551.8 186,628.7 -4,076.9 176,292.7 178,178.8 -1,886.1 -3.4 -4.5
Migas 32,633.0 45,266.4 -12,633.4 30,331.9 43,459.9 -13,128.0 -7.1 -4.0
Minyak Mentah 10,204.7 13,585.8 -3,381.1 9,528.2 13,072.4 -3,544.2 -6.6 -3.8
Hasil Minyak 4,299.1 28,567.6 -24,268.5 3,623.4 27,362.5 -23,739.1 -15.7 -4.2
Gas 18,129.2 3,113.0 15,016.2 17,180.3 3,025.0 14,155.3 -5.2 -2.8
Nonmigas 149,918.8 141,362.3 8,556.5 145,960.8 134,718.9 11,241.9 -2.6 -4.7
Uraian
Growth Jan-Des 2014
YoY (%)Januari-Desember 2014Januari-Desember 2013
Nilai (USD Juta)
Ekspor Impor Selisih Ekspor Impor Selisih Ekspor Impor Selisih Ekspor Impor Ekspor Impor
Total 16,967.8 15,455.9 1,511.9 13,616.2 14,041.6 -425.7 14,621.3 14,434.5 186.8 7.4 2.8 -13.8 -6.6
Migas 3,405.1 4,221.6 -816.5 2,106.9 3,473.0 -1,366.1 2,353.3 3,389.5 -1,036.2 11.7 -2.4 -30.9 -19.7
Minyak Mentah 858.6 1,076.0 -217.4 752.4 949.0 -196.6 877.6 956.6 -79.0 16.6 0.8 2.2 -11.1
Hasil Minyak 500.8 2,748.5 -2,247.7 197.0 2,286.6 -2,089.6 228.8 2,218.9 -1,990.1 16.1 -3.0 -54.3 -19.3
Gas 2,045.7 397.1 1,648.6 1,157.5 237.4 920.1 1,246.9 214.0 1,032.9 7.7 -9.9 -39.0 -46.1
Nonmigas 13,562.7 11,234.3 2,328.4 11,509.3 10,568.6 940.4 12,268.0 11,045.0 1,223.0 6.6 4.5 -9.5 -1.713732.36 11210.40 13732.36 11210.40
Uraian
Growth Desember
2014 YoY (%)November 2014 Desember 2014
Growth Desember
2014 MoM (%)Desember 2013
Nilai (USD Juta)
Surplus perdagangan nonmigas 2014 lebih besar dari 2013…
19
Perkembangan Ekspor Impor Bulanan
Perkembangan Ekspor Impor Periode Januari-Desember 2013-2014

Key Positions and Differences on NAMA of major WTO members/groups
21
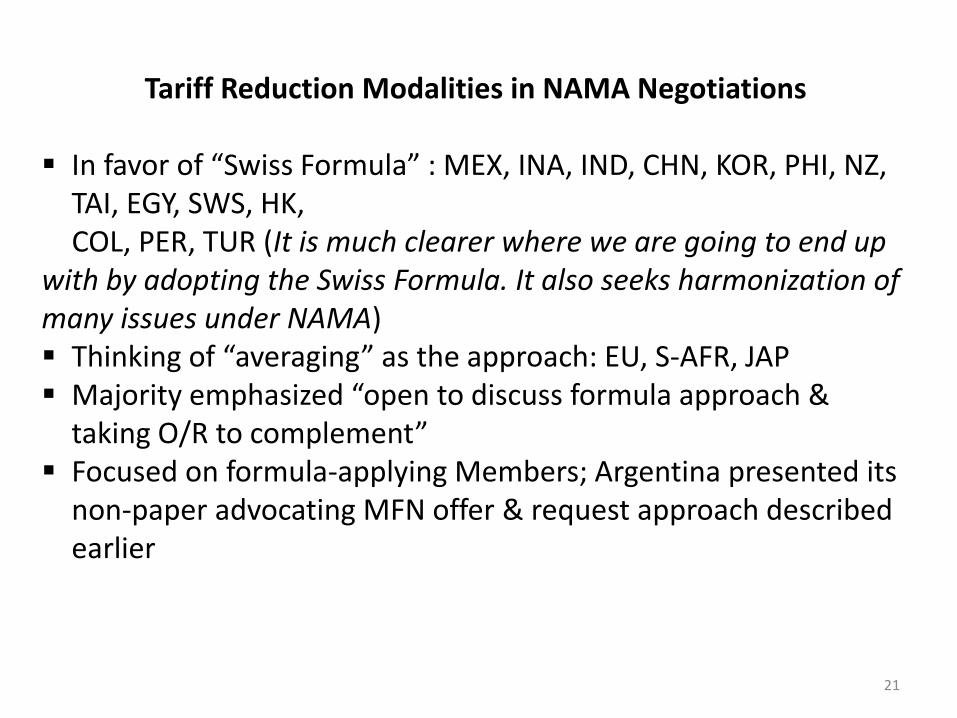
Tariff Reduction Modalities in NAMA Negotiations
In favor of “Swiss Formula” : MEX, INA, IND, CHN, KOR, PHI, NZ, TAI, EGY, SWS, HK, COL, PER, TUR (It is much clearer where we are going to end up
with by adopting the Swiss Formula. It also seeks harmonization of many issues under NAMA) Thinking of “averaging” as the approach: EU, S-AFR, JAP Majority emphasized “open to discuss formula approach &
taking O/R to complement” Focused on formula-applying Members; Argentina presented its
non-paper advocating MFN offer & request approach described earlier

22
Argentina Non-Paper (3 February 2015) referred to Bali Declaration on Post-Bali Work Program: “… including the need to look at ways that may allow Members to overcome the most critical and fundamental stumbling blocks”
“MFN Treatment Requests & Offers Negotiating Procedures to help building and keeping an ongoing balance country by country negotiation with demand driven results. In such approach no specific defensive tools will be needed”
“Members shall submit bilaterally at their own initiative requests and offers to other members and engage in negotiations with those members in a limited timeframe to be agreed upon”
“There would be the following types of requests: (i) removal of tariffs, charges & other duties on products concerned; (ii) reduction of tariffs, charges & other duties on products concerned; (iii) the binding of unbound products (if applicable); (iv) creation of a TRQ of volume expansion of an existing TRQ”

23
Cautions & recommendations from the South Center:
“Swiss Formula” leads to deeper cuts for developing countries Bind only the average tariff, not line-by-line Stop protecting declining industries & cut tariff unilaterally Consider time-bound agreements
RI might also:
Focus on increasing the binding coverage of as other countries: HK, Korea, Malaysia, Philippines, Singapore, Thailand,India levelling the playing field for RI with major competitors

What happened in Nairobi on NAMA

Information Technology Agreement
• The Information Technology Agreement (ITA) is a plurilateral tradeagreement that requires participants to eliminate their tariffs on aspecific list of information technology (IT) and telecommunicationsproducts. The agreement covers approximately 97 percent of worldtrade in defined IT products, which is currently estimated to exceed $1trillion.
• The ITA is a tariff-cutting agreement focused on trade in informationtechnology goods, and does not include services or software; the agreementdoes contain a commitment to address non-tariff barriers, but withoutspecifics.
• It is subject to a "free rider" problem since all WTO members would benefitwhen the expanded agreement is concluded. Under WTO most-favored nationprinciples, the non-participating WTO members are able to benefit from theconcessions made by other countries while maintaining their own tariffs.
• In order to minimize the free rider problem, the ITA requires a threshold 90% ofglobal trade coverage to come into force. There are currently 81 participants inthe original ITA, including the United States, the 28 members of the EuropeanUnion (EU), and key East Asian trading partners Japan, South Korea, China andTaiwan

ITA countinue ...
• Products covered under the ITA include computer hardware andperipherals, telecommunications equipment, computer software,semiconductor manufacturing equipment, analytical instruments,and semiconductors and other electronic components. The chartbelow gives examples of the products in the ITA.
• The Ministerial Declaration on Trade in Information TechnologyProducts (ITA) was concluded by 29 participants at the SingaporeMinisterial Conference in December 1996.
• The number of participants has grown to 81, representing about 97per cent of world trade in information technology products. The ITAprovides for participants to completely eliminate duties on ITproducts covered by the Agreement. Indonesia is a member of ITA.
• After 17 rounds of negotiations, at a meeting on 24 July 2015, nearlyall the participants agreed to expand the products covered by theAgreement and eliminate tariffs on an additional list of 201 products– Information Technology Agreement 2 – ITA2

ITA2 Negotiations In Nairobi
• Negotiations on the expanded ITA were conducted by 53WTO members, including both developed and developingcountries, which account for approximately 90 per cent ofworld trade in these products.
• All WTO members will benefit from the agreement, asthey will all enjoy duty-free market access to the marketsof the members eliminating tariffs on these products.
• For every product on the list, ITA2 participants havenegotiated the level of reductions and over how manyyears it will fully eliminate the tariffs. As a result of thesenegotiations, approximately 65% of tariff lines will be fullyeliminated by 1 July 2016. Most of the remaining tarifflines will be completely phased out in four stages overthree years. This means that by 2019, almost all importsof the relevant products will be duty free.
• Indonesia has not yet decided to join the ITA2.

Opportunities and Challenges for Indonesia

Indonesia, 597.912
AS, 11.301.656
Korea, 614.776
India, 1.202.762
Cina, 3.127.233
EU, 11.791.878
Brasil, 121.238
Jepang, 5.376.9150%
2%
4%
6%
8%
10%
12%
14%
16%
18%
-10,000 0 10,000 20,000 30,000 40,000 50,000 60,000
Ra
ta-r
ata
Ta
rif
Be
a M
asu
k
PDB per Kapita
Tariff MFN Product Non-Agriculture (2010)
Sumber : WTO, 2010, diolah Kemenperin
NON-AGRICULTURE
Country GDP/capAverage Tariff
Line
GDP (billion) /
2010
1 EU 32.700,00 4,00% 11.791.878
2 AS 46.860,24 3,30% 11.301.656
3 Japan 42.782,52 2,50% 5.376.915
4 China 4.382,13 8,70% 3.127.233
5 Brazil 10.816,48 14,20% 1.530.110
6 India 1.371 10,10% 1.202.762
7 Korea 20.756,24 6,60% 614.776
8 Indonesia 2.974,02 6,60% 597.912
29
Challenges for Indonesian Manufactures

Daya Saing Global
A. TANTANGAN GLOBALISASI BAGI INDUSTRI MANUFAKTUR
The Global Competitiveness index 2014-2015 rankings and 2013-2014 comparisons
Ranking tertinggi diduduki oleh negara barat yang maju dan tiga macan asia.
Posisi Indonesia lebih rendah dari Singapura, Jepang, N.Zealand, Malaysia, Korea dan China. Namun posisi Indonesia lebih baik dari Brazil, Turkey, Mexico, India dan Russia. Ranking Idonesia meningkat 4 point dibandingkan dengan tahun sebelumnya.
Source: Global Competitiveness Report 2014-2015,World Economic Forum

Competitiveness Industrial Performance Index
----- ASEAN FTA Dialog Partners -----
----- ASEAN -----
Source: Competitiveness Industrial Performance Report, 2012/2013,UNIDO
Daya Saing Industri Manufaktur
A. TANTANGAN GLOBALISASI BAGI INDUSTRI MANUFAKTUR

CONCLUSIONS