NEGLECTED DISEASE RESEARCH AND DEVELOPMENT: … · Trachoma 72 Rheumatic fever 74...
122
NEGLECTED DISEASE RESEARCH AND DEVELOPMENT: REACHING NEW HEIGHTS POLICY CURES RESEARCH 2018 Dr Nick Chapman Anna Doubell Lisette Oversteegen Dr Paul Barnsley Dr Vipul Chowdhary Dr George Rugarabamu Ming Ong Juliette Borri
Transcript of NEGLECTED DISEASE RESEARCH AND DEVELOPMENT: … · Trachoma 72 Rheumatic fever 74...
NEGLECTED DISEASE RESEARCH AND DEVELOPMENT:REACHING NEW HEIGHTS
POLICY CURES RESEARCH
2018
Dr Nick ChapmanAnna DoubellLisette OversteegenDr Paul BarnsleyDr Vipul ChowdharyDr George RugarabamuMing OngJuliette Borri
POLIC
Y CU
RES RESEARC
HG
-FIND
ER 2018 N
EGLEC
TED D
ISEASE RESEA
RCH
& DEVELO
PMEN
T : REACH
ING
NEW
HEIG
HTS
ACKNOWLEDGEMENTS
This is the eleventh in a series of annual reports published as part of the G-FINDER project. We are very grateful to all of the survey participants who have contributed to this effort. With their commitment, we have been able to continue to provide accurate, up-to-date financial information in the field of research and development (R&D) for neglected diseases. The patience and engagement of the participating government and multilateral agencies, academic and research institutions, product development partnerships (PDPs), philanthropic institutions and pharmaceutical and biotechnology companies have made this project possible.
We would like to extend our gratitude to our Advisory Committee and other experts for their invaluable advice on the design and scope of our study. A particularly warm thank you goes to the Resource Tracking for HIV Prevention Research and Development Working Group, and to the International Federation of Anti-Leprosy Associations for coordinating their initiatives with ours where possible.
We are especially grateful to Richard Fisher, our Executive Chairman; Philippa Telford, our executive assistant and office manager; Lee Sternberg, our accounting manager; Shigemi Nakamura-Simms, our designer; and our contract researchers Amelia Hynen, Delfina Rampone, Allisa Robertson, Jesse Schnall, Margaret Shi, Iona Tjoeng and Inthira Yamabhai. Their dedicated efforts were key to the survey’s success.
Finally, Policy Cures Research would like to thank the project funder, the Bill & Melinda Gates Foundation, for their ongoing support.
We would also like to acknowledge the following organisations for their commitment and patience in collating large datasets for the G-FINDER survey this year: Australian National Health and Medical Research Council (NHMRC); Bill & Melinda Gates Foundation; Brazilian Support Foundation for Research in the State of Minas Gerais (FAPEMIG); Brazilian Support Foundation for Research in the State of São Paulo (FAPESP); Canadian Institutes of Health Research (CIHR); European and Developing Countries Clinical Trials Partnership (EDCTP); European Commission (EC); Institut Pasteur; Liverpool School of Tropical Medicine (LSTM); South Africa Medical Research Council (MRC); Swiss National Science Foundation (SNSF); UK Medical Research Council (MRC); University of Pittsburgh; US National Institutes of Health – National Institute of Allergy and Infectious Disease (NIAID); Wellcome Trust; and all of the PDPs.
In addition, we would like to acknowledge the following organisations for their collaboration with Dr Vipul Chowdhary: Biotechnology Industry Research Assistance Council (BIRAC); Indian Council of Medical Research (ICMR); Indian Department of Biotechnology, Ministry of Science and Technology (DBT); Indian Department of Health Research, Union Ministry of Health and Family Welfare (DHR); Indian Department of Science and Technology (DST); International Centre for Genetic Engineering and Biotechnology (ICGEB), India; and the following Indian Council of Scientific and Industrial Research (CSIR) labs: Central Drug Research Institute (CDRI), Lucknow; Centre for Cellular and Molecular Biology (CCMB), Hyderabad; Indian Institute of Chemical Biology (IICB), Kolkata; Indian Institute of Integrative Medicine (IIIM), Jammu; Institute of Genomics and Integrative Biology (IGIB), Delhi; Institute of Microbial Technology (IMTECH), Chandigarh.
NEGLECTED DISEASE RESEARCH AND DEVELOPMENT:REACHING NEW HEIGHTS
Dr Nick ChapmanAnna DoubellLisette OversteegenDr Paul BarnsleyDr Vipul ChowdharyDr George RugarabamuMing OngJuliette Borri
2018
POLICY CURES RESEARCH
CO
NT
ENT
S
PAGE3
CONTENTS
GLOSSARY 4EXECUTIVE SUMMARY 7INTRODUCTION 12
Background to the G-FINDER survey 12The survey scope 12Survey methodology 17Reading the G-FINDER report 18The latest G-FINDER survey 19
FUNDING BY DISEASE 22HIV/AIDS 25Malaria 29Tuberculosis 33Diarrhoeal diseases 37Kinetoplastids 41Helminth infections 45Salmonella infections 49Dengue 53Bacterial pneumonia & meningitis 57Hepatitis C 61Leprosy 64Cryptococcal meningitis 66Leptospirosis 68Buruli ulcer 70Trachoma 72Rheumatic fever 74Non-disease-specific funding 76
FUNDERS 80Funder overview 80Public funders 81Philanthropic funders 88Private sector funders 91Funding by organisation 95
FUNDING FLOWS 96Funding flow trends 97Funding flows by R&D stage 98Funding for product development partnerships 99Funding for other intermediaries 102
DISCUSSION 105ANNEXES 108
Annexe 1: Advisory Committee members & additional experts 108Annexe 2: Survey respondents 110Annexe 3: References 114
0
ガル図法(赤道縮尺) 1:47,000,000
1000 2000 3000 4000 5000km
75゜
60゜
45゜
30゜
15゜
0゜
15゜
30゜
45゜
60゜
75゜
90゜
180゜ 165゜ 150゜ 135゜ 120゜ 105゜ 90゜ 75゜ 60゜ 45゜ 30゜ 15゜ 15゜ 0゜ 165゜ 150゜ 135゜ 120゜ 105゜ 90゜ 75゜ 60゜ 45゜
PAGE4
GLO
SSA
RY GLOSSARY
ACT Artemisinin-based combination therapy
Aggregate industry Aggregate pharmaceutical and
biotechnology companies
AHRI Africa Health Research Institute
AIDS Acquiredimmunedeficiencysyndrome
ALM American Leprosy Missions
ALRA Austrian Leprosy Relief Association
ARV Antiretroviral
Australia-India SRF Australia-India Strategic Research
Fund
Australian ACH2 Australian Centre for HIV and
Hepatitis Virology Research
Australian DFAT Australian Department of Foreign
Affairs and Trade
Australian DIIS Australian Department of Industry,
Innovation and Science
Australian NHF Australian National Heart
Foundation
Australian NHMRC Australian National Health and
Medical Research Council
bNabs Broadly neutralising anti-HIV antibodies
Brazilian BNDES Brazilian Development Bank
Brazilian DECIT Brazilian Ministry of Health:
Department of Science and Technology
Brazilian FAPESP Brazilian Support Foundation for
Research in the State of São Paulo
Brazilian FINEP Brazilian Innovation Agency
Canadian CIHR Canadian Institutes of Health
Research
CEWG Consultative Expert Working Group on Research and Development: Financing and Coordination
CHAI Clinton Health Access Initiative
CLTRF Cebu Leprosy and Tuberculosis Research Foundation
DAA Direct-acting antivirals
DAHW German Leprosy and TB Relief Association
DALY Disability adjusted life year
DNDi Drugs for Neglected Diseases initiative
Dutch DGIS Dutch Ministry of Foreign Affairs - Directorate General of Development Cooperation
EAEC Enteroaggregative E. coli
EC European Commission: Directorate-General for Research and Innovation
EDCTP European and Developing Countries Clinical Trials Partnership
Egyptian ASRT EgyptianAcademyofScientific
Research and Technology
EID Emerging infectious disease
EMA European Medicines Agency
ETEC Enterotoxigenic E. coli
FIND Foundation for Innovative New Diagnostics
Flemish EWI Flemish Department of Economics,
Science and Innovation
French ANR French National Research Agency
French ANRS French National Agency for
Research on AIDS and Viral Hepatitis
GLOSSARY
PAGE5
GLO
SSA
RY
French IRD French Research Institute for Development
FTE Full-time equivalent
FY Financial Year
Gates Foundation Bill & Melinda Gates Foundation
Gavi Gavi, the Vaccine Alliance
GBD Global Burden of Disease Study
GDP Gross domestic product
German BMBF German Federal Ministry of
Education and Research
German DFG German Research Foundation
German DZIF German Centre for Infection
Research
G-FINDER Global Funding of Innovation for Neglected Diseases
GHIT Fund Global Health Innovative Technology Fund
HCV Hepatitis C virus
HIC High-income country
HIV Humanimmunodeficiencyvirus
IAVI International AIDS Vaccine Initiative
IDC Innovative developing country
IDRI Infectious Disease Research Institute
IHME Institute for Health Metrics and Evaluation
IMI Innovative Medicines Initiative
IMPAACT Network International Maternal Pediatric
Adolescent AIDS Clinical Trials Network
Indian DBT Indian Department of Biotechnology
Indian BIRAC Indian Biotechnology Industry
Research Assistance Council
Indian CSIR IndianCouncilofScientificandIndustrial Research
Indian ICMR Indian Council of Medical Research
Inserm French National Institute of Health and Medical Research
IPM International Partnership for Microbicides
IRS Indoor residual spraying
ISC III Carlos III Health Institute
ISGlobal Barcelona Institute for Global Health
IVCC Innovative Vector Control Consortium
IVI International Vaccine Institute
Korean CDC Korean Centers for Disease
Control and Prevention
Korean HIDI Korean Health Industry Development Institute
Korean KOICA Korean International Cooperation
Agency
LLIN Long-lasting insecticide treated nets
LMIC Low- and middle-income country
LRI Leprosy Research Initiative
MDR-TB Multidrug-resistant tuberculosis
MIC Middle-income country
MMV Medicines for Malaria Venture
MNC Multinational pharmaceutical company
MSF Médecins Sans Frontières
New Zealand HRC Health Research Council of New
Zealand
GLOSSARY
PAGE6
GLO
SSA
RY
NTS Non-typhoidal Salmonella enterica
OAR OfficeofAIDSResearch
ODA Officialdevelopmentassistance
OWH OneWorld Health
PCV Pneumococcal conjugate vaccine
PDP Product development partnership
PrEP Pre-exposure prophylaxis
R&D Research and development
RDT Rapid diagnostic tests
RT-PCR Reverse transcription polymerase chain reaction
S&T Science and Technology
SFI Science Foundation Ireland
SME Small pharmaceutical and biotechnologyfirms
South African DST South African Department of
Science and Technology
South African MRC South African Medical Research
Council
SSI Statens Serum Institute
Swedish SIDA Swedish International Development
Agency
Swiss SDC Swiss Agency for Development and Cooperation
Swiss SNSF Swiss National Science Foundation
TB Tuberculosis
Thai GPO Thailand Government Pharmaceutical Organisation
TLMI The Leprosy Mission International
UK United Kingdom
UK DFID UK Department for International Development
GLOSSARY
UK DHSC UK Department of Health and Social Care
UK MRC UK Medical Research Council
US United States
US CDC US Centers for Disease Control and Prevention
US DOD US Department of Defense
US FDA US Food and Drug Administration
US NIAID US National Institute of Allergy and Infectious Diseases
US NIH US National Institutes of Health
USAID US Agency for International Development
VCP Vector control product
WHO World Health Organization
WHO/TDR World Health Organization – Special Programme for Research and Training in Tropical Diseases
XDR-TB Extensively drug-resistant tuberculosis
YOY Year-on-year
PAGE7
The survey
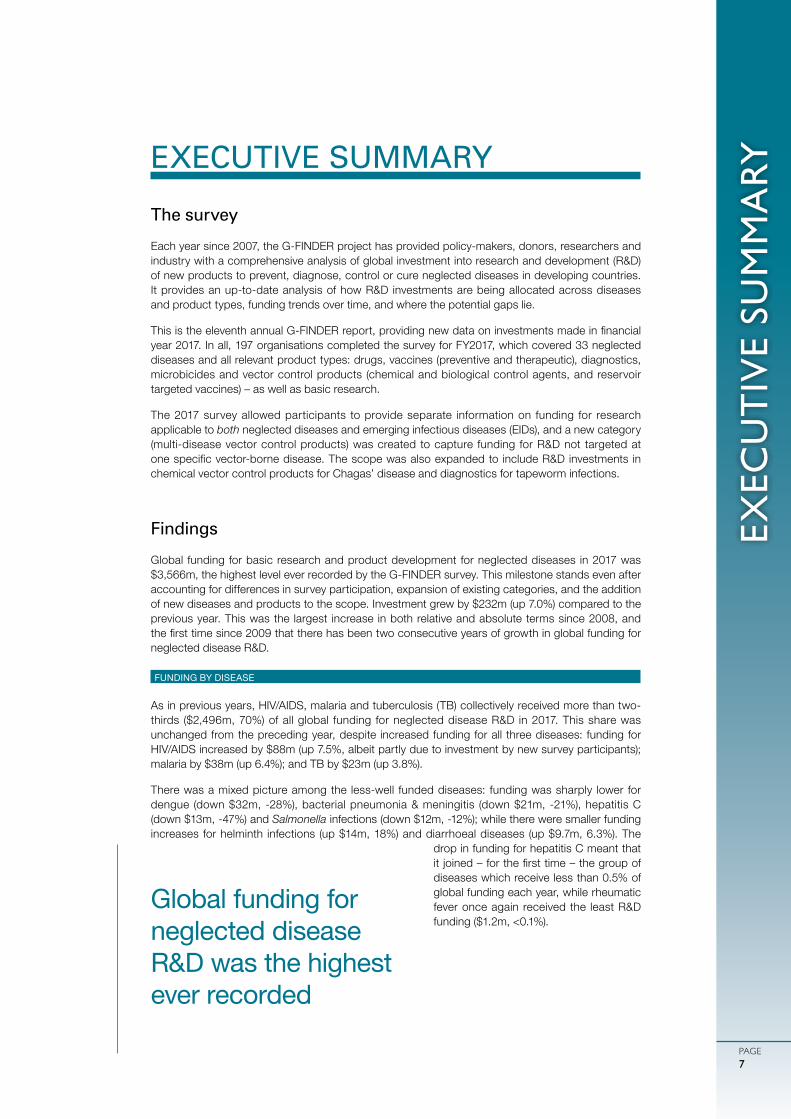
Each year since 2007, the G-FINDER project has provided policy-makers, donors, researchers and industry with a comprehensive analysis of global investment into research and development (R&D) of new products to prevent, diagnose, control or cure neglected diseases in developing countries. It provides an up-to-date analysis of how R&D investments are being allocated across diseases and product types, funding trends over time, and where the potential gaps lie.
ThisistheeleventhannualG-FINDERreport,providingnewdataoninvestmentsmadeinfinancialyear 2017. In all, 197 organisations completed the survey for FY2017, which covered 33 neglected diseases and all relevant product types: drugs, vaccines (preventive and therapeutic), diagnostics, microbicides and vector control products (chemical and biological control agents, and reservoir targeted vaccines) – as well as basic research.
The 2017 survey allowed participants to provide separate information on funding for research applicable to both neglected diseases and emerging infectious diseases (EIDs), and a new category (multi-disease vector control products) was created to capture funding for R&D not targeted at onespecificvector-bornedisease.Thescopewasalsoexpandedto includeR&Dinvestments inchemical vector control products for Chagas’ disease and diagnostics for tapeworm infections.
Findings
Global funding for basic research and product development for neglected diseases in 2017 was $3,566m, the highest level ever recorded by the G-FINDER survey. This milestone stands even after accounting for differences in survey participation, expansion of existing categories, and the addition of new diseases and products to the scope. Investment grew by $232m (up 7.0%) compared to the previous year. This was the largest increase in both relative and absolute terms since 2008, and thefirsttimesince2009thattherehasbeentwoconsecutiveyearsofgrowthinglobalfundingforneglected disease R&D.
FUNDING BY DISEASE
As in previous years, HIV/AIDS, malaria and tuberculosis (TB) collectively received more than two-thirds ($2,496m, 70%) of all global funding for neglected disease R&D in 2017. This share was unchanged from the preceding year, despite increased funding for all three diseases: funding for HIV/AIDS increased by $88m (up 7.5%, albeit partly due to investment by new survey participants); malaria by $38m (up 6.4%); and TB by $23m (up 3.8%).
There was a mixed picture among the less-well funded diseases: funding was sharply lower for dengue (down $32m, -28%), bacterial pneumonia & meningitis (down $21m, -21%), hepatitis C (down $13m, -47%) and Salmonella infections (down $12m, -12%); while there were smaller funding increases for helminth infections (up $14m, 18%) and diarrhoeal diseases (up $9.7m, 6.3%). The
drop in funding for hepatitis C meant that it joined–forthefirsttime–thegroupofdiseases which receive less than 0.5% of global funding each year, while rheumatic fever once again received the least R&D funding ($1.2m, <0.1%).
EXECUTIVE SUMMARY
EXEC
UT
IVE
SUM
MA
RY
Global funding for neglected disease R&D was the highest ever recorded
0
ガル図法(赤道縮尺) 1:47,000,000
1000 2000 3000 4000 5000km
75゜
60゜
45゜
30゜
15゜
0゜
15゜
30゜
45゜
60゜
75゜
90゜
180゜ 165゜ 150゜ 135゜ 120゜ 105゜ 90゜ 75゜ 60゜ 45゜ 30゜ 15゜ 15゜ 0゜ 165゜ 150゜ 135゜ 120゜ 105゜ 90゜ 75゜ 60゜ 45゜
PAGE8
EXEC
UT
IVE
SUM
MA
RY
Therewasasubstantial increase innon-disease-specificR&D investment. This category, which includes core funding of multi-disease R&D organisations, investments in platform technologies and multi-disease vector control products, and other R&D investment that cannot be allocatedtoaspecificdisease,accountedfor11%($382m)of global funding in 2017. This was $129m higher than in 2016,(up51%),largelyduetoasignificantincreaseincorefunding (up $118m, 75%).
FUNDERS
Thepublicsectorcontinuedtobethemostsignificantsourceoffundingin2017,providingalmosttwo-thirds ($2,318m, 65%) of the global total. It was also the key driver of the overall increase in funding, with public sector funding increasing by $181m (up 8.5%). Industry investment increased by $49m (up 9.7%), although this was due to investment by new survey participants. If irregular survey participants are excluded, industry funding was in fact marginally lower than last year (down $9.8m, -2.0%). Philanthropic funding was essentially unchanged (up $1.2m, 0.2%).
Large increases in funding from the UK government (up $87m, 89%) and the European Commission (EC, up $40m, 50%) narrowed the gap between the second and third-largest public funders and the US government, although US government funding also increased (up $23m, 1.5%) and it remained the largest public funder of neglected disease R&D. The growth in UK government funding was driven by the Department for International Development (DFID, up $46m, 83%), and the Department of Health and Social Care (new funding of $40m), while the increase from the EC was the result of a nearly seven-fold increase in its funding to the European & Developing Countries Clinical Trials Partnership (EDCTP, up $47m, 571%). Other large increases came from India (up $21m, 38%), driven by increased investment from the Indian Council of Medical Research (up $23m, 52%); and Germany (up $18m, 39%), primarily due to additional funding from the German Federal Ministry of Education and Research (up $12m, 40%). The increase in Indian government investment helped drive an overall increase in public funding from low- and middle-income countries (LMICs, up $17m, 19%), marking the third consecutive year of growth and the second-largest LMIC public investment on record (behind only 2013).
The philanthropic sector provided a total of $692m in funding for basic research and product development for neglected diseases in 2017, almost unchanged from 2016. Funding growth from other sectors meant that the philanthropic sector’s share of total funding fell slightly (to 19%, from 21% in 2016), marking the sector’s smallest share of overall funding for neglected disease R&D since 2010. Once again, the Bill & Melinda Gates Foundation and the Wellcome Trust together provided the vast majority (95%) of philanthropic funding. A slight drop in Gates Foundation spending (down $11m, -1.9%) was fully offset by additional funding from the Wellcome Trust along with several smaller donors.
The private sector invested a total of $554m in neglected disease R&D in 2017, accounting for 16% of total global funding. As usual, multinational pharmaceutical companies (MNCs) provided the majorityofthisinvestment($445m,80%),withsmallpharmaceuticalandbiotechnologyfirms(SMEs)contributing the remainder ($109m, 20%). Growth in reported funding was driven by new survey participants; contributions from regular survey participants actually fell slightly in 2017, with MNC investment down $5.9m (-1.5%) and SMEs down $3.9m (-3.9%).
Clinical or field development and post-registration studies accounted for nearly three-quarters ($77m, 71%) of all SME investment and almost two-thirds ($270m, 61%) of all MNC investment in neglected disease R&D in 2017, but less than a third ($644m, 29%) of all investment by HIC governments and multilaterals. And while only a quarter ($181m, 26%) of all philanthropic sector investmentwasexclusivelydirectedtoclinicalorfielddevelopmentandpost-registrationstudies,
Public funding increased considerably, led by the UK and the EC
PAGE9
EXEC
UT
IVE
SUM
MA
RY
a further third was either core funding for multi-disease organisations or grants not specifying a specificproductorR&Dstage($248m,36%)whichinthiscaseprimarilyrepresentsportfolio-basedfunding to support product development from discovery through to registration.
FUNDING FLOWS
Organisations can invest in neglected disease R&D in two ways: by funding their own in-house research (internal investment/self-funding) or by giving grants to others (external investment). Once again, just under three-quarters ($2,604m, 73%) of all funding for neglected disease basic research and product development in 2017 was given externally. Of this external funding, almost three-quarters ($1,913m, 73%) was given directly to researchers and developers, $508m (19%) was channelled through PDPs, and the remainder ($184m, 7.1%) was given to other intermediaries. The mostsignificantchangewasadoublingoffundingtootherintermediaries(up$91m,99%),primarilyas a result of increased funding for EDCTP. Funding for PDPs also rebounded (up $52m, 11%) after an historic low in 2016, driven by increased funding from UK and US government agencies. After a big increase the previous year, funding given directly to researchers and developers remained stable in 2017 (up $5.6m, 0.3%).
Internal investments (self-funding) accounted for just over a quarter ($962m, 27%) of all funding for neglected disease R&D in 2017, an increase of $84m (up 9.5%). This was driven by industry investment (up $45m, 9.1%), as well as internal investment by government agencies (up $37m, 9.8%),althoughthescaleofthisheadline increasewasheavily influencedbynewindustrysurveyparticipants.
DISCUSSION
Global funding for neglected disease R&D reached a record high in 2017, on the back of a second consecutive year of increasing investment
• Global funding for basic research and product development for neglected diseases in 2017 totalled $3,566m. This was an increase of $232m (up 7.0%) from the previous year, and the highest level ever recorded by the G-FINDER survey – an achievement that continues to hold even taking into account the changes in survey participation and to the scope of the survey over the 11 years since G-FINDER’s inception.
• This was both the largest annual increase in global funding for neglected disease R&D and the firsttimethatfundinghadincreasedintwoconsecutiveyearssincetheprevious,fiscalstimulus-drivenpeakof2008-2009,allowingtotalfundingtofinallyeclipseitsprevioushighof2009afterspending nearly a decade below this peak.
Funding growth in 2017 was very different from that in 2009: this time it came mainly from Europe, not the US, and went to product development, not basic research
• The increase in global funding for neglected disease R&D in 2009 was driven by US government spending,astheglobalfinancialcrisispromptedarapidreleaseoffundingaimedatstimulatingthe domestic economy. The US National Institutes of Health (NIH) played the key role, providing almost 98% of the net overall increase in spending. Most of this new investment went to academic institutions – which typically focus on basic research – and US-based SMEs.
• The 2017 increase also came from the public sector, but this time it was primarily driven by the UK and the European Commission, along with India and Germany. And this time the increase was primarily directed towards PDPs and intermediaries – organisations that focus on clinical trials and product development – with 90% of the net increase in investment going to either core funding or clinical development.
0
ガル図法(赤道縮尺) 1:47,000,000
1000 2000 3000 4000 5000km
75゜
60゜
45゜
30゜
15゜
0゜
15゜
30゜
45゜
60゜
75゜
90゜
180゜ 165゜ 150゜ 135゜ 120゜ 105゜ 90゜ 75゜ 60゜ 45゜ 30゜ 15゜ 15゜ 0゜ 165゜ 150゜ 135゜ 120゜ 105゜ 90゜ 75゜ 60゜ 45゜
PAGE10
EXEC
UT
IVE
SUM
MA
RY
• The combined effect of these changes was twofold. Firstly, the gap between the share of funding coming from the US government and that from the second-largest public funder shrank to its lowestlevelonrecord.Andsecondly,2017markedthefirsttimeeverthatPDPsreceivedmoreoftheir funding from governments than they did from philanthropic organisations.
Funders outside of the traditional top three or four continued to increase their commitment to neglected disease R&D
• Last year’s G-FINDER report recognised important increases in funding from a range of emerging funders, including Unitaid, Médecins Sans Frontières, Gavi, and the governments of Japan, India and Brazil. All of these funders increased their contributions in 2017, aside from Brazil, where a cap on public spending was responsible for a drop in R&D funding.
• In addition to the emerging funders called out in last year’s report, German government funding forneglecteddiseaseR&Dalsoincreasedsignificantlyin2017.Thiseclipseditsprevioushigh(setin2012)by24%,clearlyestablishingGermany’spositionasthemostsignificantEuropeanpublicfunder after the UK and EC.
• Two of the three largest LMIC public funders also increased their funding for neglected disease R&D: as noted above, the Indian government sharply increased its funding (up $21m, 38%), remaining the fourth-largest public funder overall, and providing the highest reported level of public funding from an LMIC. South Africa’s government also increased its contribution (up $2.7m, 24%), resulting in the largest ever investment as a share of gross domestic product (GDP) provided by an LMIC.
A half decade of consecutive yearly increases in industry investment has come to an end, but this is not necessarily cause for alarm
• Industry funding provided by regular survey participants was down slightly in 2017, for both MNCsandSMEs,bringingtoanendfiveconsecutiveyearsofgrowth.Whileanyfurtherdeclinewould be worth monitoring closely, this slight fall should be viewed in the context of the strong recent growth, and the way industry investment is driven by the state of the product pipeline: for example, the recent notable rise and fall of industry investment in malaria drug development was largely due to the progression of tafenoquine through late-stage trials and to successful registration.
• Industry investment is also less concentrated than either public or philanthropic funding, each of which is dominated by two or three organisations. Since the inception of the G-FINDER survey, the top three industry funders in any given year have accounted for an average of only 55% of all industry funding, compared to 73% for the top three public funders and 97% for the top three philanthropic organisations – a pattern that continued to hold in 2017. This diversity should help guard against any precipitous decline in industry investment, but ongoing industry investment in neglected disease R&D can only be guaranteed if there is sustained public and philanthropic commitment.
We are seeing the impact of sustained investment in neglected disease R&D, but we are still falling short of where we need to be
• Thisyearalonesawseveralsignificantnewproductapprovals:fexinidazole,thefirstall-oral,shortcoursetreatmentforbothstagesofsleepingsickness;moxidectin,thefirstnewonchocerciasistreatmentin20years;tafenoquine,thefirstsingle-doseradicalcureforP. vivax malaria; Typbar TCV,thefirstconjugatetyphoidvaccine;andROTASIIL, a heat-stable rotavirus vaccine designed for developing country use.
PAGE11
EXEC
UT
IVE
SUM
MA
RY
• But despite global funding for neglected diseases reaching a record high in 2017, not a single country government in 2017 met the recommendation of the WHO Global Strategy and Plan of Action on Public Health, Innovation and Intellectual Property (GSPOA) that member states dedicate at least 0.01% of their GDP to research into the health needs of developing countries. Only two countries – the US with 0.0082% and the UK with 0.0071% – were even close, with no other country even reaching half the target level. In fact, over the 11 year history of the G-FINDER report, only the US has ever met this target (which it did between 2007 and 2012).
• The gap is narrowing between the two largest funders of neglected disease R&D (the US government and the Gates Foundation) and the rest of the world. This follows record investments by many members of the next tier of funders, including the UK, India, Germany and Unitaid; along with close-to-historic highs from the EC, the Wellcome Trust, and the pharmaceutical industry. This is unequivocally a positive development, but it also means that continuing to deliver the impact we’ve seen recently will require these funders to either sustain or further increase their current level of investment in neglected disease R&D.
0
ガル図法(赤道縮尺) 1:47,000,000
1000 2000 3000 4000 5000km
75゜
60゜
45゜
30゜
15゜
0゜
15゜
30゜
45゜
60゜
75゜
90゜
180゜ 165゜ 150゜ 135゜ 120゜ 105゜ 90゜ 75゜ 60゜ 45゜ 30゜ 15゜ 15゜ 0゜ 165゜ 150゜ 135゜ 120゜ 105゜ 90゜ 75゜ 60゜ 45゜
PAGE12
INT
RO
DU
CT
ION INTRODUCTION
Background to the G-FINDER survey
Each year since 2007, the G-FINDER project has provided policy-makers, donors, researchers and industry with a comprehensive analysis of global investment into research and development (R&D) of new products to prevent, diagnose, control or cure neglected diseases in developing countries. It provides an up-to-date analysis of how R&D investments are being allocated across diseases and product types, funding trends over time, and where the potential gaps lie.
G-FINDER is recognised as the gold standard in tracking and reporting global funding for neglected disease R&D. The World Health Organization (WHO) Expert Panel’s Global Strategy and Plan of Action on Public Health, Innovation and Intellectual Property (GSPOA) includes a recommendation for Member States to commit to providing information to G-FINDER, and G-FINDER has been included – as both a primary source and an indicator – in agenda items presented at the WHO Executive Board meeting and World Health Assembly.1,2 G-FINDER is the primary source of neglected disease R&D funding data for both the WHO Global Observatory on Health R&D and Donor Tracker, and helps support the work of many other groups in the broader global health community.
This is the eleventh annual G-FINDER report; in addition to the previous ten years of funding data, it reportsoninvestmentsmadeinfinancialyear(FY)2017,referredtoas2017inthetext.
The survey scope
DEFINING NEGLECTED DISEASES AND PRODUCTS
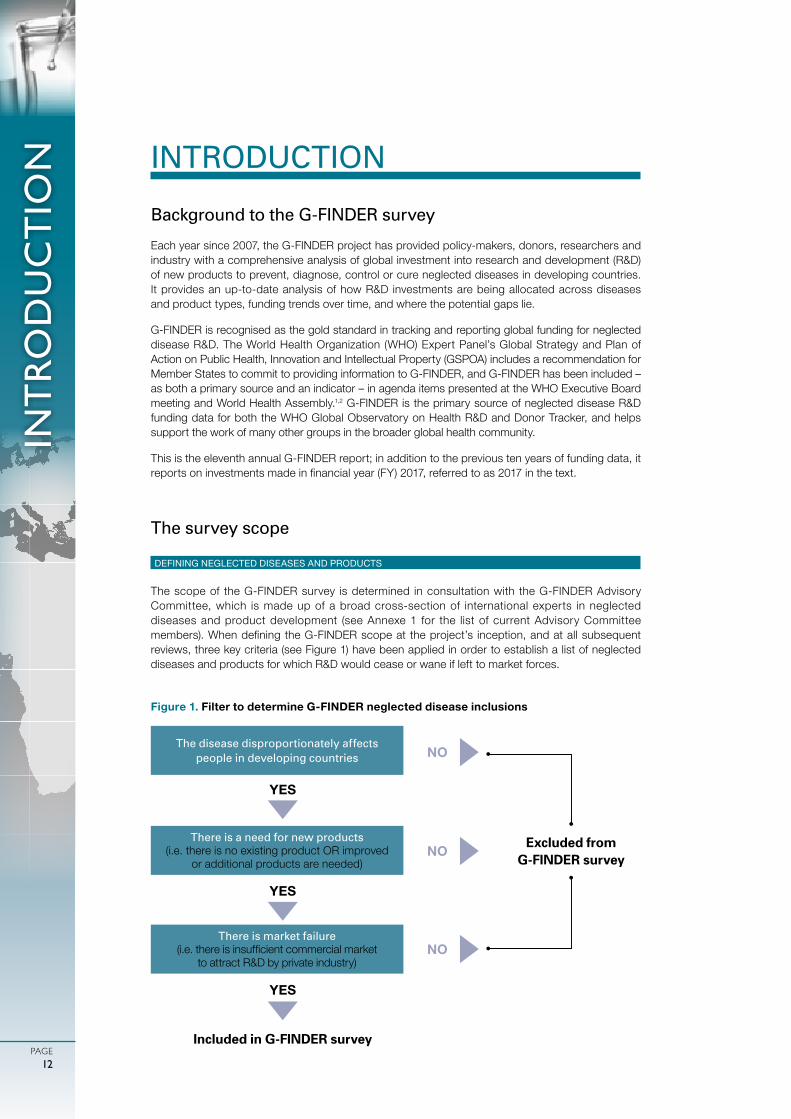
The scope of the G-FINDER survey is determined in consultation with the G-FINDER Advisory Committee, which is made up of a broad cross-section of international experts in neglected diseases and product development (see Annexe 1 for the list of current Advisory Committee members).WhendefiningtheG-FINDERscopeat theproject’s inception,andatallsubsequentreviews, three key criteria (see Figure 1) have been applied in order to establish a list of neglected diseases and products for which R&D would cease or wane if left to market forces.
Figure 1. Filter to determine G-FINDER neglected disease inclusions
The disease disproportionately affects people in developing countries
There is a need for new products (i.e. there is no existing product OR improved
or additional products are needed)
There is market failure (i.e.thereisinsufficientcommercialmarket
to attract R&D by private industry)
NO
Included in G-FINDER survey
YES
YES
YES
NO
NO
Excluded from G-FINDER survey
PAGE13
INT
RO
DU
CT
ION
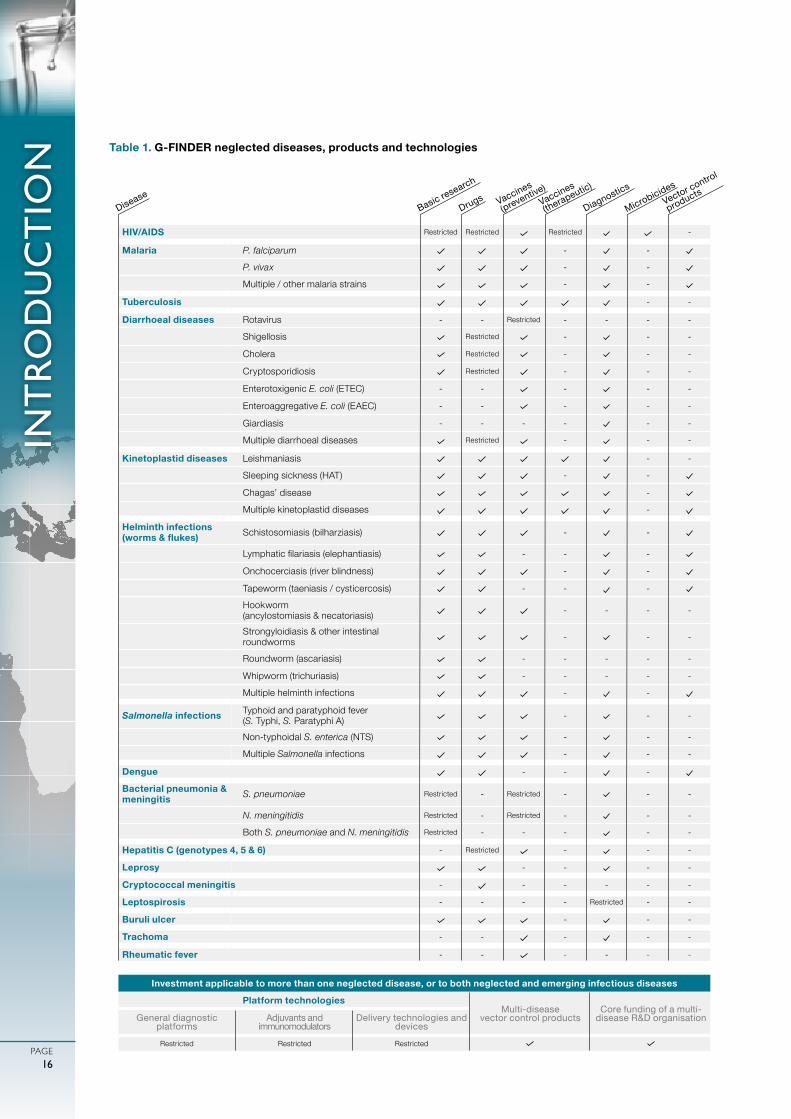
Although basic research and all relevant p roduc t t ypes – d rugs, vacc ines (preventive and therapeutic), diagnostics, microbicides and vector control products (chemical and biological control agents, and reservoir targeted vaccines) – were considered for inclusion in relation to every disease, it is important to note that not all areas are included in the G-FINDER scope for all diseases, and some are included only with restrictions. For example, pneumonia drugs are excluded because there is a sufficient commercial market; while pneumonia vaccine investments are only included if they meet G-FINDER requirements for strain, vaccine type and target age group.
P lat fo rm techno log ies (ad juvants, d iagnost ic p lat forms and de l i ve r y devices) and multi-disease vector control products (VCPs) are a lso included in the scope of G-FINDER. Platform
technologies can potentially be applied to a range of neglected diseases and products, but have not yet been attached to a specific product for a specific disease. Multi-disease VCPs target vectors capable of transmitting several different diseases.
Investments that do not meet the G-FINDER scope are excluded from the results. This includes activities such as advocacy and behavioural research, which are critical to effecting change, but which are distinct from product development and fall outside the G-FINDER criteria.
A comprehensive explanation of all inclusions, exclusions and restrictions is outlined in the detailed G-FINDER R&D scope document, which is available online. A matrix summarising the neglected diseases, products and technologies included in this year’s G-FINDER report is shown in Table 1.
TYPES OF RESEARCH INCLUDED
G-FINDERquantifiesneglecteddiseaseR&D investments intotwooverarchingcategories,eachbroken down into a number of further categories:
• Basic and early-stage research, including: • Basic research • Discovery and pre-clinical development• Clinicalorfielddevelopmentandpost-registrationstudies,including: • Baseline epidemiology in preparation for product trials • Clinicalorfieldproductdevelopment • Phase IV/pharmacovigilance studies of new products
A detailed explanation of what types of R&D activities are included in each of these categories, aswellasspecific inclusionsandexclusionsrelatedto theG-FINDERscope, isprovided in theG-FINDER neglected disease R&D scope document.
Many research activities that are extremely important for global health are excluded from G-FINDER because they are not related to the development of new tools for neglected diseases
0
ガル図法(赤道縮尺) 1:47,000,000
1000 2000 3000 4000 5000km
75゜
60゜
45゜
30゜
15゜
0゜
15゜
30゜
45゜
60゜
75゜
90゜
180゜ 165゜ 150゜ 135゜ 120゜ 105゜ 90゜ 75゜ 60゜ 45゜ 30゜ 15゜ 15゜ 0゜ 165゜ 150゜ 135゜ 120゜ 105゜ 90゜ 75゜ 60゜ 45゜
PAGE14
INT
RO
DU
CT
ION
The purpose of G-FINDER is to track and analyse global investment in the research and development of new health technologies for neglected diseases. G-FINDER does not, and is not intended to, capture investment in the entire spectrum of neglected disease research. Many research activities that are extremely important for global health are excluded from G-FINDER because they are not related to the development of new tools for neglected diseases; this includes health systems and operations/implementation research (for example, research into health systems or policy issues, or research into the programmatic delivery of non-product interventions, or existing health technologies), and sociological, behavioural and epidemiological research not related to the development of new health technologies. We also exclude investment into non-pharmaceutical tools such as untreated bed nets, or interventions such as circumcision. General therapies such as painkillers or nutritional supplements are also excluded, as these investments cannot be ring-fenced to neglected disease treatment only. Investment that is not research-related is similarly excluded: although we recognise the vital importance of activities such as health programme delivery, advocacy, routine disease surveillance programmes, community education and general capacity building to address neglected diseases, investment in these activities falls outside the scope of G-FINDER.
CHANGES TO THE G-FINDER R&D SCOPE FOR NEGLECTED DISEASES
Although maintaining a consistent scope is important in order to allow analysis of multi-year R&D funding trends, the scope of the G-FINDER survey is reviewed annually in consultation with the Advisory Committee.
In year two of the G-FINDER survey (FY2008), the typhoid and paratyphoid fever disease category was expanded to include non-typhoidal Salmonella enterica (NTS) and multiple Salmonella infections,whileR&Dforlymphaticfilariasisdiagnosticswasadded.
In FY2013 (the seventh survey year), the survey was expanded to include three additional diseases: cryptococcal meningitis, hepatitis C (genotype 4) and leptospirosis. Dengue vaccines were determinedtonolongerfitthecriteriafor inclusion intheG-FINDERsurveygiventheemergenceof a commercial market, and dengue vaccine R&D funding (including all previously reported investment) was removed from the survey. All other dengue product areas were retained.
In FY2014 (the eighth survey year), the hepatitis C category was expanded to capture investment in R&D for two additional genotypes (genotypes 5 and 6) that disproportionately affect people in developing countries.
In FY2016 (the tenth survey year), the bacterial pneumonia & meningitis category was expanded to explicitly include developing country-focused basic research for both Streptococcus pneumoniae (S. pneumoniae) and Neisseria meningitides (N. meningiditis).Developingcountry-specificresearchintotherapeuticvaccinesforHIV/AIDSwasalsoaddedasarestrictedcategory,reflectingemergingresearch into broadly neutralising anti-HIV antibodies (bNAbs) and their potential use in developing countries.
In FY2017, Policy Cures Research changed how funding for vector control R&D and funding targeted at multiple diseases is reported by G-FINDER. Some of these changes result in funding falling into different categories than it would have in previous years, while other changes expand the scope of funding included in G-FINDER.
In conjunction with our ongoing collection of emerging infectious disease (EID) R&D investment data, the latest version of our survey (FY2017) allowed participants to provide separate information on funding intended to support research applicable to both neglected diseases and EIDs, under core funding, platform technologies and other R&D. Our inclusion of this funding resulted in an expanded scope for each of these categories in FY2017. Funding for R&D targeted exclusively at EIDs continues to be excluded from G-FINDER.
PAGE15
INT
RO
DU
CT
ION
In FY2017 a new category, multi-disease vector control products, was created to capture funding for R&D not targeted at one specific vector-borne disease. This category includes funding that cannot be allocated to a single neglected disease, resulting in a change to how grants are classified,butnottoG-FINDER’soverallscope.However,thenewcategoryalsocapturesfundingfor R&D applicable to both neglected diseases and EIDs, which would not have been included in previous years.
For example, the Aedes aegypti mosquito transmits both the dengue virus (a neglected disease) and the Zika virus (an EID). Funding for R&D targeted at controlling the Aedes aegypti mosquito has historically been divided between the two diseases, with only the portion notionally allocated to dengue included in G-FINDER. Under the new approach, the full value of this kind of funding was included under the new category for multi-disease vector control products.
The FY2017 report also added R&D stage categories to the biological vector control products and reservoirtargetedvaccinecategories,reflectingthedevelopinginternationalconsensusontheR&Dpathways for these products. These changes affect the way funding is categorised, but do not expand the scope of G-FINDER.
Finally, in FY2017 the G-FINDER scope was expanded to include R&D investments in chemical vector control products for Chagas’ disease and diagnostics for tapeworm infections; and the chemical vector control product category now explicitly includes funding of novel insecticide-based tools for controlling outdoor transmission, provided they are designed for use in developing countries.
HANDLING OF EMERGING INFECTIOUS DISEASES
In response to the 2014 West African Ebola epidemic, the G-FINDER survey scope was expanded for FY2014 (the eighth survey year) to capture investments in Ebola R&D for diagnostics, drugs and preventive vaccines, as well as basic research. For FY2015 (year nine), the survey scope was further expanded to include other African viral haemorrhagic fevers (VHFs). In addition to Ebola, this new category allowed respondents to also report R&D funding for Marburg and other African VHFs. InFY2016(thetenthsurveyyear),aseparatescopedefinitionwasdevelopedtoidentifyinvestmentinR&Dforallpriorityemerginginfectiousdiseases(EIDs) identifiedintheWHOR&DBlueprintforaction to prevent epidemics.
Although EID funding data continues to be collected alongside investments in R&D for neglected diseases, the analysis of this data will be reported separately. The only exception is investment in R&D that is applicable to both neglected and emerging infectious diseases, the full value of which will be included in both analyses, as described earlier.
0
ガル図法(赤道縮尺) 1:47,000,000
1000 2000 3000 4000 5000km
75゜
60゜
45゜
30゜
15゜
0゜
15゜
30゜
45゜
60゜
75゜
90゜
180゜ 165゜ 150゜ 135゜ 120゜ 105゜ 90゜ 75゜ 60゜ 45゜ 30゜ 15゜ 15゜ 0゜ 165゜ 150゜ 135゜ 120゜ 105゜ 90゜ 75゜ 60゜ 45゜
PAGE16
INT
RO
DU
CT
ION Table 1. G-FINDER neglected diseases, products and technologies
HIV/AIDS Restricted Restricted Restricted -
Malaria P. falciparum - -
P. vivax - -
Multiple / other malaria strains - -
Tuberculosis - -
Diarrhoeal diseases Rotavirus - - Restricted - - - -
Shigellosis Restricted - - -
Cholera Restricted - - -
Cryptosporidiosis Restricted - - -
Enterotoxigenic E. coli (ETEC) - - - - -
Enteroaggregative E. coli (EAEC) - - - - -
Giardiasis - - - - - -
Multiple diarrhoeal diseases Restricted - - -
Kinetoplastid diseases Leishmaniasis - -
Sleeping sickness (HAT) - -
Chagas’ disease -
Multiple kinetoplastid diseases -
Helminth infections (worms & flukes) Schistosomiasis (bilharziasis) - -
Lymphaticfilariasis(elephantiasis) - - -
Onchocerciasis (river blindness) - -
Tapeworm (taeniasis / cysticercosis) - - -Hookworm (ancylostomiasis & necatoriasis) - - - -
Strongyloidiasis & other intestinal roundworms - - -
Roundworm (ascariasis) - - - - -
Whipworm (trichuriasis) - - - - -
Multiple helminth infections - -
Salmonella infections Typhoid and paratyphoid fever (S. Typhi, S. Paratyphi A) - - -
Non-typhoidal S. enterica (NTS) - - -
Multiple Salmonella infections - - -
Dengue - - -
Bacterial pneumonia & meningitis S. pneumoniae Restricted - Restricted - - -
N. meningitidis Restricted - Restricted - - -
Both S. pneumoniae and N. meningitidis Restricted - - - - -
Hepatitis C (genotypes 4, 5 & 6) - Restricted - - -
Leprosy - - - -
Cryptococcal meningitis - - - - - -
Leptospirosis - - - - Restricted - -
Buruli ulcer - - -
Trachoma - - - - -
Rheumatic fever - - - - - -
Investment applicable to more than one neglected disease, or to both neglected and emerging infectious diseases
Platform technologiesMulti-disease
vector control productsCore funding of a multi-
disease R&D organisationGeneral diagnostic platforms
Adjuvants and immunomodulators
Delivery technologies and devices
Restricted Restricted Restricted
Basic research
Drugs Vaccines
(preventive)Vaccines
(therapeutic)
Diagnostics
MicrobicidesVector control
productsDisease
PAGE17
Survey methodology
DATA COLLECTION
Over the past decade, the G-FINDER survey has operated according to two key principles: capturing and analysing data in a manner that is consistent and comparable across all funders and diseases;andpresentingfundingdatathatisascloseaspossibleto‘real’investmentfigures.
G-FINDER was originally designed as an online survey. An online survey platform was developed tocapturegrantdataandisstillusedbythemajorityofsurveyparticipants.Anofflinegrant-basedreporting tool is also available. Industry (pharmaceutical companies and biotechnology firms) investment in R&D is not grant-based, so a version of the reporting tool has been tailored for these participants. Instead of grants, companies enter the number of staff working on neglected disease programmes, their salaries, and direct project costs related to these programmes. Companies are requiredtoexclude‘soft’figuressuchasin-kindcontributionsandcostsofcapital.
Forsomeorganisationswithverylargedatasets,theonlinesurveyandequivalentofflinereportingtoolaredifficulttouse.TheG-FINDERteamwasthereforeaskedtousepubliclyavailabledatabasesto identify the relevant funding. For the US National Institutes of Health (NIH), grants are collected using the Research Portfolio Online Reporting Tools (RePORTER) and the Research, Condition and Disease Categorization (RCDC) process. For the Biomedical Advanced Research and Development Authority (BARDA), funding information is identifiedusingthe internationalanddomestic ‘ProjectMaps’ retrieved from the Medical Countermeasures website. Information on funding from the US Department of Defense (DOD) is collected using the Defense Technical Information Center’s ‘DOD investment budget search’ tool. Funding from the European Commission (EC)* is retrieved from the Community Research and Development Information Service (CORDIS) public database and Innovative Medicines Initiative’s (IMI) online project list. Supplementary data is provided by the EC. Information about the R&D projects funded by Innovate UK is extracted from spreadsheets available on its website.
All participating organisations are asked to only include disbursements (or receipts), rather than commitments made but not yet disbursed. In general, only primary grant data is accepted; the only exception is in the case of data collection collaborations between G-FINDER and other R&D funding surveys, such as AVAC. Data from all sources is subject to verification using the same processes and inclusion criteria.
VALIDATION
Allentriesover$0.5mareverifiedagainsttheinclusioncriteria.Cross-checkingisconductedusingautomated reconciliation reports – which match investments reported as disbursed by funders with investments reported as received by intermediaries and product developers – followed by manual grant-level review of the report outputs. Any discrepancies are resolved by contacting both groups toidentifythecorrectfigure.ForgrantsfromtheUSNIH,fundingdataissupplementedandcross-referenced with information received from the Office of AIDS Research (OAR) and the National Institute of Allergy and Infectious Diseases (NIAID).
IndustryfiguresarereviewedagainstindustryportfolioinformationheldbyPolicyCuresResearchand against full-time equivalent (FTE) and direct costs provided by other companies. Costs that fall outside the expected range, for example, above average FTE costs for clinical staff, are queried and corrected with the company.
UNSPECIFIED FUNDING
Around 1.3% ($48m) of funding was reported to the survey as ‘unspecified’, usually for multi-disease programmes where funds could not easily be apportioned by disease. A proportion of
INT
RO
DU
CT
ION
* The term ‘EC’ used here and throughout the report refers to funding from the European Union budget that is managed by the European Commission or related European Union partnerships and initiatives, such as the European & Developing Countries Clinical Trials Partnership (EDCTP) and Innovative Medicines Initiative (IMI).
0
ガル図法(赤道縮尺) 1:47,000,000
1000 2000 3000 4000 5000km
75゜
60゜
45゜
30゜
15゜
0゜
15゜
30゜
45゜
60゜
75゜
90゜
180゜ 165゜ 150゜ 135゜ 120゜ 105゜ 90゜ 75゜ 60゜ 45゜ 30゜ 15゜ 15゜ 0゜ 165゜ 150゜ 135゜ 120゜ 105゜ 90゜ 75゜ 60゜ 45゜
PAGE18
fundingforsomediseaseswasalso‘unspecified’,forinstance,whenfundersreportedagrantforresearch into tuberculosis (TB) basic research and drugs without apportioning funding to each product category. This means that reported funding for some diseases and products will be slightly lowerthanactualfunding,withthedifferencebeingincludedas‘unspecified’funding.
A further 7.8% ($277m) of global funding was given as core funding to R&D organisations that work in multiple disease areas, for example, the European & Developing Countries Clinical Trials Partnership (EDCTP) and the Foundation for Innovative New Diagnostics (FIND). As this funding could not be accurately allocated by disease it was reported as unallocated core funding. In cases wheregrants toamulti-diseaseorganisationwereearmarked foraspecificdiseaseorproduct,theywereincludedunderthespecificdisease-productarea.
DATA AGGREGATION
All pharmaceutical industry funding data is aggregated and anonymised for confidentiality purposes. Rather than being attributed to individual companies, pharmaceutical company investment is instead reported according to the type of company, with a distinction made between multinationalpharmaceuticalcompanies(MNCs)andsmallpharmaceuticalandbiotechnologyfirms(SMEs).
INFLATION ADJUSTMENTS
Funding data is adjusted for inflation and converted to US dollars (US$) to eliminate artefactual effectscausedbyinflationandexchangeratefluctuations,allowingaccuratecomparisonofannualchanges.Duetotheseadjustments,historicalG-FINDERdata intablesandfigures inthisreportwill differ to data in previous G-FINDER reports. All funding data in this report is in 2017 US$.
LIMITATIONS
Whilethesurveymethodologyhasbeenrefinedoverthepastdecade,therearelimitationstothedata presented, including survey non-completion, time lags in the funding process, an inability to disaggregate some investments, and non-comparable or missing data. Please see the G-FINDER methodology document, available online at www.policycuresresearch.org/g-finder-2018, for a more in-depth discussion of these limitations.
Reading the G-FINDER report
STRUCTURE
The G-FINDER report is structured in four main parts: 1) analysis of funding by neglected disease; 2) analysis of neglected disease funders; 3) analysis of funding flows; and 4) discussion of key findings.
YEARS
Throughoutthetext,referencestoyears,otherthansurveyyears,refertofinancialyears.
YEAR-ON-YEAR CHANGES
To avoid reporting on artefactual variations related to survey participation, year-on-year (YOY) funding analysis was previously based only on funding reported by organisations that had participated in every year of the survey – referred to as ‘YOY funders’.
G-FINDER is now in its eleventh year, and survey participation from the major funders has stabilised. Therefore annual changes mentioned in the FY2017 report are based on funding reported by all survey participants. In instances where changes were materially influenced by survey participation, an explanation has been provided.
INT
RO
DU
CT
ION
PAGE19
COUNTRY GROUPINGS
For brevity, we use the terms ‘LMICs’ and ‘developing countries’ to denote low- and middle-income countries,and‘HICs’todenotehigh-incomecountries,asdefinedbytheWorldBank.3 Innovative developing countries (IDCs) are developing countries with a strong R&D base, which in the context of this report refers to Brazil, India, South Africa, China, the Russian Federation, Turkey, Mexico and Malaysia.4
BURDEN OF DISEASE FIGURES
Unless otherwise noted, all mortality and DALY (disability-adjusted life year) estimates in this report represent totals for all LMICs, taken from the Institute for Health Metrics and Evaluation’s (IHME) Global Burden of Disease Study 2017 (GBD 2017),5 which provides the most comprehensive and up to date figures available. Following the formal agreement between IHME and the World HealthOrganizationtocollaborativelypublishestimatesofglobaldiseaseburden,figuresfromtheWHO’s Global Health Estimates are no longer included in this report.6 We note that some GBD estimates may differ from those published in previous G-FINDER reports due to updates to IHME’s methodology.7
Pathogen-specific diagnosis for diarrhoeal diseases, and bacterial pneumonia & meningitis is challenging, which affects estimates of disease burden. The diarrhoeal disease group in GBD 2017, when presented by cause, includes diseases outside the scope of G-FINDER. Therefore, estimates of mortality and DALYs for the diarrhoeal disease group presented in this report have been calculatedbysubtractingpathogens identifiedbyaetiologyasoutofscopefromtheGBD2017diarrhoeal disease grouping by cause total – and may therefore include some burden of disease caused by pathogens outside the G-FINDER scope. GBD 2017 includes an ‘Other meningitis’ cause category which is not disaggregated to a level where it can be established what proportion of the data falls within the scope of G-FINDER. Estimates of mortality and DALYs for bacterial pneumonia & meningitis presented in this report include ‘Other meningitis’, and may therefore include some burden of disease caused by pathogens outside the scope of G-FINDER. GBD 2017 does not include estimates for giardiasis or strongyloidiasis by cause or aetiology.
The latest G-FINDER survey
The eleventh G-FINDER survey was open for a six-week period from May to June 2018. Intensive follow-up and support for key participants led to a total of 10,333 recorded entries in the database forfinancialyear2017.
PARTICIPANTS
G-FINDER is primarily focused on funding, and therefore the emphasis is on surveying funding organisations. A total of 197 organisations participated in the G-FINDER survey in 2018, reporting on behalf of 207 organisations. 137 of the 197 direct participants were funders. A wide range of funding intermediaries, product development partnerships (PDPs), and researchers and developers who received funding also participated. Data from funding recipients was used to collect data on investments from funders who did not participate in the survey; to better understand how and whereR&Dinvestmentsweremade;totrackfundingflowsthroughthesystem;topreventdoublecounting; and to verify reported data.
Participants originated from 31 countries. Organisations included:
• The EC and public, private and philanthropic funders from 20 HICs• Public funders from nine MICs (Argentina, Brazil, Colombia, Cuba, Egypt, India, Mexico, Thailand
and South Africa)• Private sector funders from three MICs (Brazil, India and South Africa)• AcademicorganisationsfromfiveMICs(Argentina,Cameroon,India,ThailandandthePhilippines)
INT
RO
DU
CT
ION
0
ガル図法(赤道縮尺) 1:47,000,000
1000 2000 3000 4000 5000km
75゜
60゜
45゜
30゜
15゜
0゜
15゜
30゜
45゜
60゜
75゜
90゜
180゜ 165゜ 150゜ 135゜ 120゜ 105゜ 90゜ 75゜ 60゜ 45゜ 30゜ 15゜ 15゜ 0゜ 165゜ 150゜ 135゜ 120゜ 105゜ 90゜ 75゜ 60゜ 45゜
PAGE20
INT
RO
DU
CT
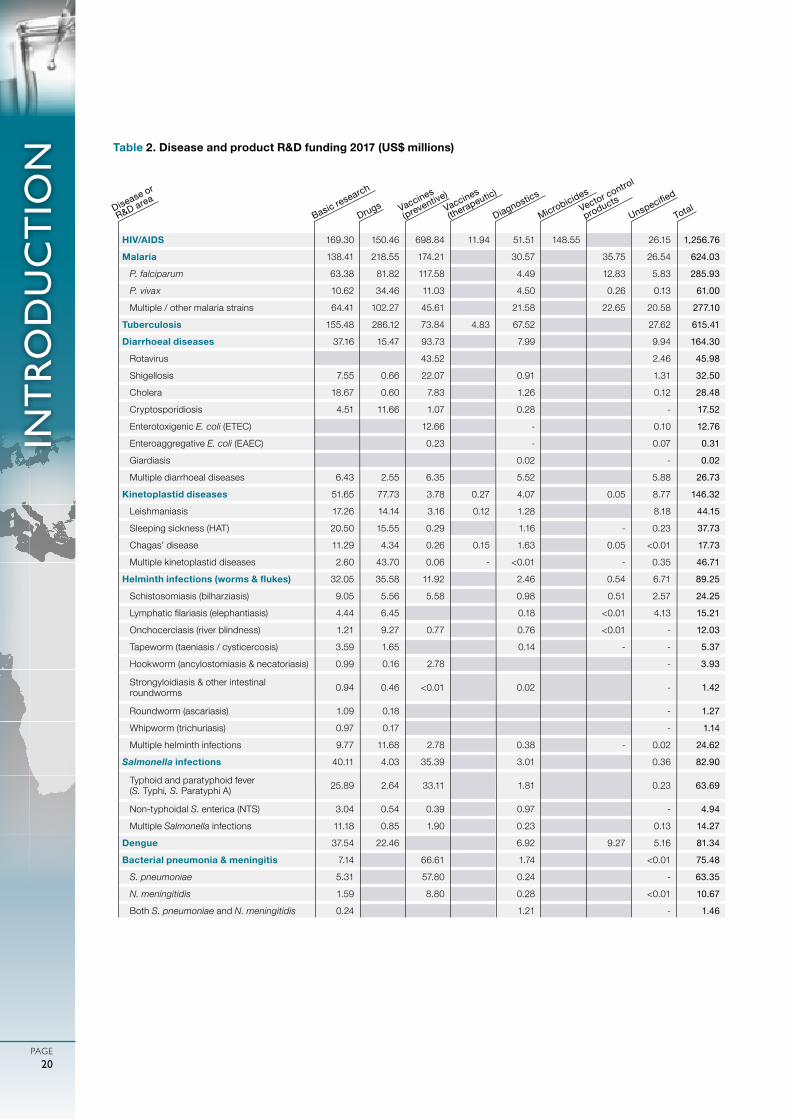
ION Table 2. Disease and product R&D funding 2017 (US$ millions)
HIV/AIDS 169.30 150.46 698.84 11.94 51.51 148.55 26.15 1,256.76
Malaria 138.41 218.55 174.21 30.57 35.75 26.54 624.03
P. falciparum 63.38 81.82 117.58 4.49 12.83 5.83 285.93
P. vivax 10.62 34.46 11.03 4.50 0.26 0.13 61.00
Multiple / other malaria strains 64.41 102.27 45.61 21.58 22.65 20.58 277.10
Tuberculosis 155.48 286.12 73.84 4.83 67.52 27.62 615.41
Diarrhoeal diseases 37.16 15.47 93.73 7.99 9.94 164.30
Rotavirus 43.52 2.46 45.98
Shigellosis 7.55 0.66 22.07 0.91 1.31 32.50
Cholera 18.67 0.60 7.83 1.26 0.12 28.48
Cryptosporidiosis 4.51 11.66 1.07 0.28 - 17.52
Enterotoxigenic E. coli (ETEC) 12.66 - 0.10 12.76
Enteroaggregative E. coli (EAEC) 0.23 - 0.07 0.31
Giardiasis 0.02 - 0.02
Multiple diarrhoeal diseases 6.43 2.55 6.35 5.52 5.88 26.73
Kinetoplastid diseases 51.65 77.73 3.78 0.27 4.07 0.05 8.77 146.32
Leishmaniasis 17.26 14.14 3.16 0.12 1.28 8.18 44.15
Sleeping sickness (HAT) 20.50 15.55 0.29 1.16 - 0.23 37.73
Chagas’ disease 11.29 4.34 0.26 0.15 1.63 0.05 <0.01 17.73
Multiple kinetoplastid diseases 2.60 43.70 0.06 - <0.01 - 0.35 46.71
Helminth infections (worms & flukes) 32.05 35.58 11.92 2.46 0.54 6.71 89.25
Schistosomiasis (bilharziasis) 9.05 5.56 5.58 0.98 0.51 2.57 24.25
Lymphaticfilariasis(elephantiasis) 4.44 6.45 0.18 <0.01 4.13 15.21
Onchocerciasis (river blindness) 1.21 9.27 0.77 0.76 <0.01 - 12.03
Tapeworm (taeniasis / cysticercosis) 3.59 1.65 0.14 - - 5.37
Hookworm (ancylostomiasis & necatoriasis) 0.99 0.16 2.78 - 3.93
Strongyloidiasis & other intestinal roundworms 0.94 0.46 <0.01 0.02 - 1.42
Roundworm (ascariasis) 1.09 0.18 - 1.27
Whipworm (trichuriasis) 0.97 0.17 - 1.14
Multiple helminth infections 9.77 11.68 2.78 0.38 - 0.02 24.62
Salmonella infections 40.11 4.03 35.39 3.01 0.36 82.90
Typhoid and paratyphoid fever (S. Typhi, S. Paratyphi A) 25.89 2.64 33.11 1.81 0.23 63.69
Non-typhoidal S. enterica (NTS) 3.04 0.54 0.39 0.97 - 4.94
Multiple Salmonella infections 11.18 0.85 1.90 0.23 0.13 14.27
Dengue 37.54 22.46 6.92 9.27 5.16 81.34
Bacterial pneumonia & meningitis 7.14 66.61 1.74 <0.01 75.48
S. pneumoniae 5.31 57.80 0.24 - 63.35
N. meningitidis 1.59 8.80 0.28 <0.01 10.67
Both S. pneumoniae and N. meningitidis 0.24 1.21 - 1.46
Basic research
Drugs Vaccines
(preventive)Vaccines
(therapeutic)
Diagnostics
MicrobicidesVector control
productsDisease or
R&D areaUns
pecified
Total
PAGE21
INT
RO
DU
CT
ION
- No reported funding Category not included in G-FINDER
SUPPLEMENTARY MATERIALS
A detailed methodology is available at: http://www.policycuresresearch.org/g-finder-2018
All of the data behind the G-FINDER report is available through the online search tool at https://gfinder.policycuresresearch.org/PublicSearchTool
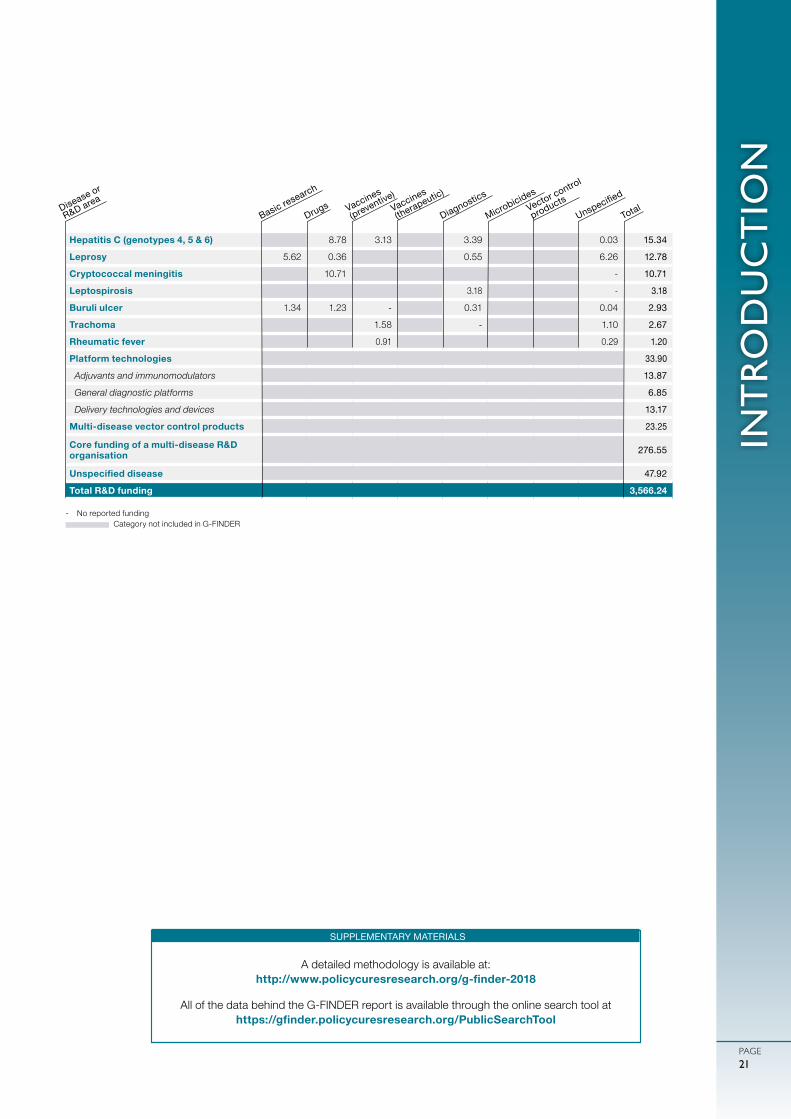
Hepatitis C (genotypes 4, 5 & 6) 8.78 3.13 3.39 0.03 15.34
Leprosy 5.62 0.36 0.55 6.26 12.78
Cryptococcal meningitis 10.71 - 10.71
Leptospirosis 3.18 - 3.18
Buruli ulcer 1.34 1.23 - 0.31 0.04 2.93
Trachoma 1.58 - 1.10 2.67
Rheumatic fever 0.91 0.29 1.20
Platform technologies 33.90
Adjuvants and immunomodulators 13.87
General diagnostic platforms 6.85
Delivery technologies and devices 13.17
Multi-disease vector control products 23.25
Core funding of a multi-disease R&D organisation 276.55
Unspecified disease 47.92
Total R&D funding 3,566.24
Basic research
Drugs Vaccines
(preventive)Vaccines
(therapeutic)
Diagnostics
MicrobicidesVector control
productsDisease or
R&D areaUns
pecified
Total
0
ガル図法(赤道縮尺) 1:47,000,000
1000 2000 3000 4000 5000km
75゜
60゜
45゜
30゜
15゜
0゜
15゜
30゜
45゜
60゜
75゜
90゜
180゜ 165゜ 150゜ 135゜ 120゜ 105゜ 90゜ 75゜ 60゜ 45゜ 30゜ 15゜ 15゜ 0゜ 165゜ 150゜ 135゜ 120゜ 105゜ 90゜ 75゜ 60゜ 45゜
FIN
DIN
GS
- D
ISEA
SES
PAGE22
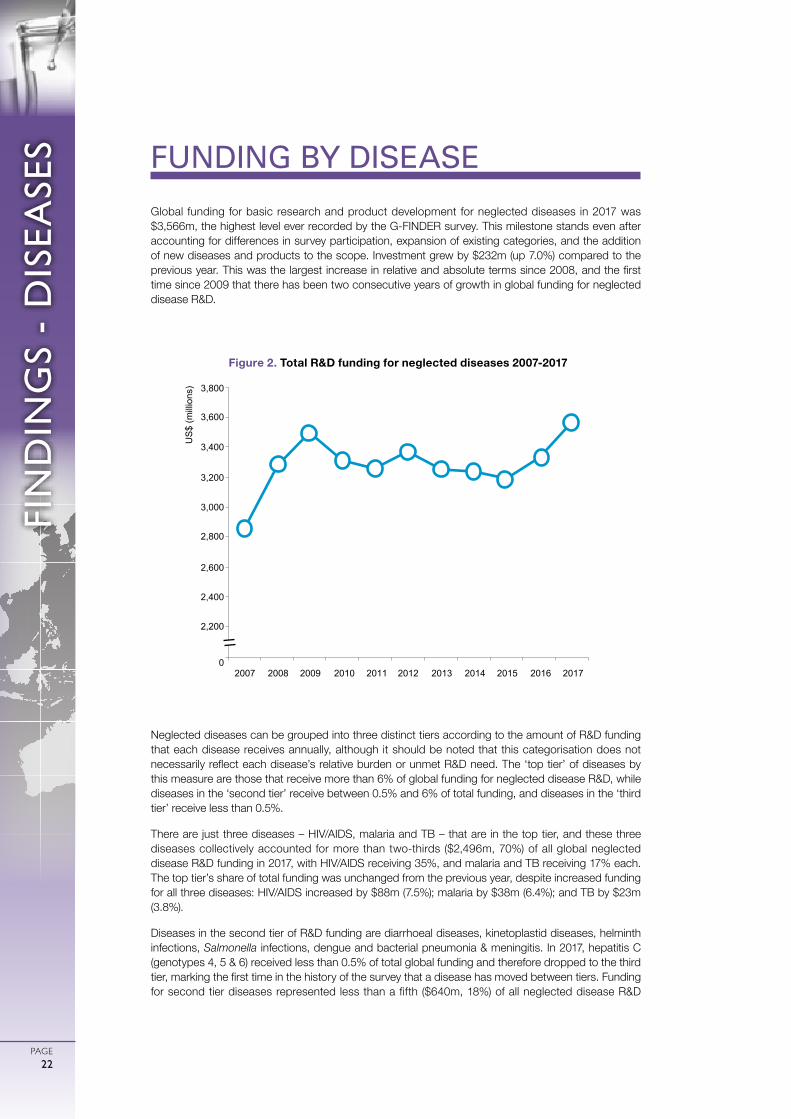
Global funding for basic research and product development for neglected diseases in 2017 was $3,566m, the highest level ever recorded by the G-FINDER survey. This milestone stands even after accounting for differences in survey participation, expansion of existing categories, and the addition of new diseases and products to the scope. Investment grew by $232m (up 7.0%) compared to the previous year. This was the largest increase in relative and absolute terms since 2008, and the first time since 2009 that there has been two consecutive years of growth in global funding for neglected disease R&D.
Neglected diseases can be grouped into three distinct tiers according to the amount of R&D funding that each disease receives annually, although it should be noted that this categorisation does not necessarily reflect each disease’s relative burden or unmet R&D need. The ‘top tier’ of diseases by this measure are those that receive more than 6% of global funding for neglected disease R&D, while diseases in the ‘second tier’ receive between 0.5% and 6% of total funding, and diseases in the ‘third tier’ receive less than 0.5%.
There are just three diseases – HIV/AIDS, malaria and TB – that are in the top tier, and these three diseases collectively accounted for more than two-thirds ($2,496m, 70%) of all global neglected disease R&D funding in 2017, with HIV/AIDS receiving 35%, and malaria and TB receiving 17% each. The top tier’s share of total funding was unchanged from the previous year, despite increased funding for all three diseases: HIV/AIDS increased by $88m (7.5%); malaria by $38m (6.4%); and TB by $23m (3.8%).
Diseases in the second tier of R&D funding are diarrhoeal diseases, kinetoplastid diseases, helminth infections, Salmonella infections, dengue and bacterial pneumonia & meningitis. In 2017, hepatitis C (genotypes 4, 5 & 6) received less than 0.5% of total global funding and therefore dropped to the third tier, marking the first time in the history of the survey that a disease has moved between tiers. Funding for second tier diseases represented less than a fifth ($640m, 18%) of all neglected disease R&D
FUNDING BY DISEASE
Figure 2. Total R&D funding for neglected diseases 2007-2017
US
$ (m
illio
ns)
2,200
2,400
2,600
2,800
3,000
3,200
3,400
3,800
3,600
2007 2008 2009 2010 2011 2012 2013 2014 2015 2016 20170
FIN
DIN
GS
- D
ISEA
SES
PAGE23
funding in 2017. This drop in funding share compared to the previous year was only partly a result of hepatitis C investment being reallocated to the third tier of diseases; funding was sharply lower for three of the six remaining second tier diseases: dengue (down $32m, -28%); bacterial pneumonia & meningitis (down $21m, -21%); and Salmonella infections (down $12m, -12%). These declines were only marginally offset by smaller funding increases for the other three second tier diseases: spending on R&D for helminth infections rose by $14m (18%); diarrhoeal diseases by $9.7m (6.3%); and kinetoplastid diseases by $1.3m (0.9%).
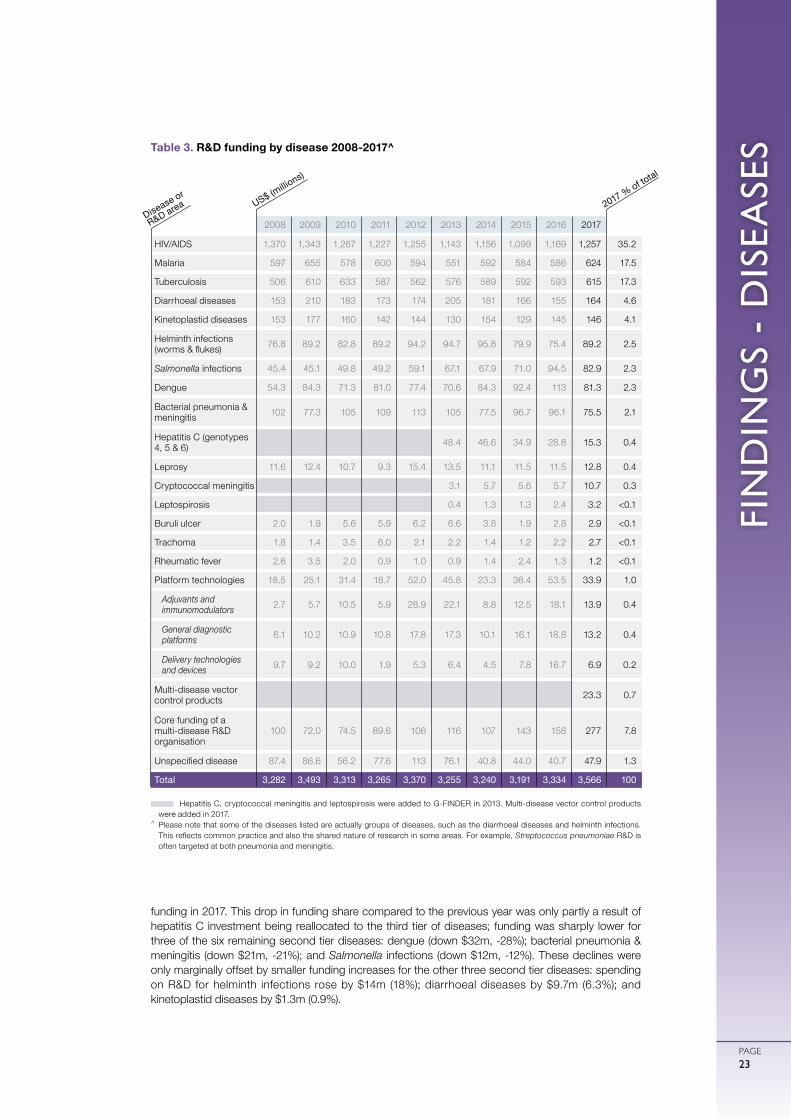
Hepatitis C, cryptococcal meningitis and leptospirosis were added to G-FINDER in 2013. Multi-disease vector control products were added in 2017.
^ Please note that some of the diseases listed are actually groups of diseases, such as the diarrhoeal diseases and helminth infections. This reflects common practice and also the shared nature of research in some areas. For example, Streptococcus pneumoniae R&D is often targeted at both pneumonia and meningitis.
Table 3. R&D funding by disease 2008-2017^
2008 2009 2010 2011 2012 2013 2014 2015 2016 2017
HIV/AIDS 1,370 1,343 1,267 1,227 1,255 1,143 1,156 1,099 1,169 1,257 35.2
Malaria 597 655 578 600 594 551 592 584 586 624 17.5
Tuberculosis 506 610 633 587 562 576 589 592 593 615 17.3
Diarrhoeal diseases 153 210 183 173 174 205 181 166 155 164 4.6
Kinetoplastid diseases 153 177 160 142 144 130 154 129 145 146 4.1
Helminth infections (worms & flukes) 76.8 89.2 82.8 89.2 94.2 94.7 95.8 79.9 75.4 89.2 2.5
Salmonella infections 45.4 45.1 49.8 49.2 59.1 67.1 67.9 71.0 94.5 82.9 2.3
Dengue 54.3 84.3 71.3 81.0 77.4 70.6 84.3 92.4 113 81.3 2.3
Bacterial pneumonia & meningitis 102 77.3 105 109 113 105 77.5 96.7 96.1 75.5 2.1
Hepatitis C (genotypes 4, 5 & 6) 48.4 46.6 34.9 28.8 15.3 0.4
Leprosy 11.6 12.4 10.7 9.3 15.4 13.5 11.1 11.5 11.5 12.8 0.4
Cryptococcal meningitis 3.1 5.7 5.6 5.7 10.7 0.3
Leptospirosis 0.4 1.3 1.3 2.4 3.2 <0.1
Buruli ulcer 2.0 1.9 5.6 5.9 6.2 6.6 3.8 1.9 2.8 2.9 <0.1
Trachoma 1.8 1.4 3.5 6.0 2.1 2.2 1.4 1.2 2.2 2.7 <0.1
Rheumatic fever 2.6 3.5 2.0 0.9 1.0 0.9 1.4 2.4 1.3 1.2 <0.1
Platform technologies 18.5 25.1 31.4 18.7 52.0 45.8 23.3 36.4 53.5 33.9 1.0
Adjuvants and immunomodulators 2.7 5.7 10.5 5.9 28.9 22.1 8.8 12.5 18.1 13.9 0.4
General diagnostic platforms 6.1 10.2 10.9 10.8 17.8 17.3 10.1 16.1 18.8 13.2 0.4
Delivery technologies and devices 9.7 9.2 10.0 1.9 5.3 6.4 4.5 7.8 16.7 6.9 0.2
Multi-disease vector control products 23.3 0.7
Core funding of a multi-disease R&D organisation
100 72.0 74.5 89.6 106 116 107 143 158 277 7.8
Unspecified disease 87.4 86.6 56.2 77.6 113 76.1 40.8 44.0 40.7 47.9 1.3
Total 3,282 3,493 3,313 3,265 3,370 3,255 3,240 3,191 3,334 3,566 100
2017 % of total
US$ (millio
ns)
Disease or
R&D area
0
ガル図法(赤道縮尺) 1:47,000,000
1000 2000 3000 4000 5000km
75゜
60゜
45゜
30゜
15゜
0゜
15゜
30゜
45゜
60゜
75゜
90゜
180゜ 165゜ 150゜ 135゜ 120゜ 105゜ 90゜ 75゜ 60゜ 45゜ 30゜ 15゜ 15゜ 0゜ 165゜ 150゜ 135゜ 120゜ 105゜ 90゜ 75゜ 60゜ 45゜
FIN
DIN
GS
- D
ISEA
SES
PAGE24
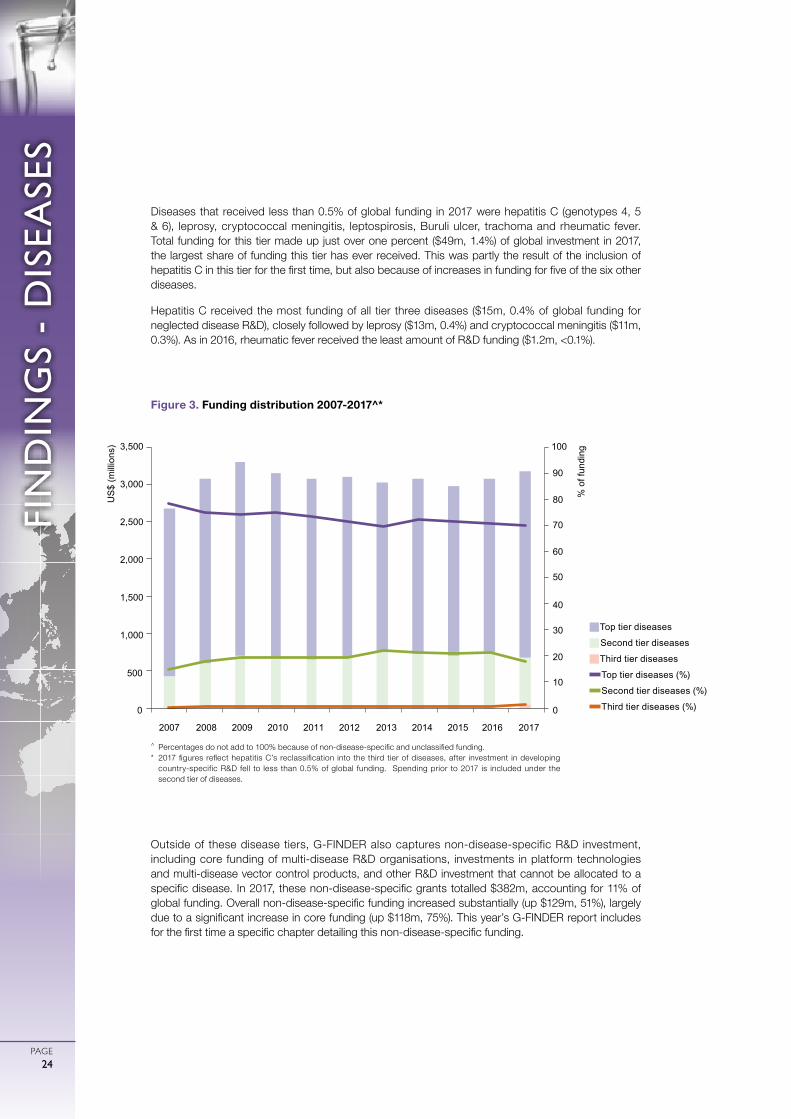
Diseases that received less than 0.5% of global funding in 2017 were hepatitis C (genotypes 4, 5 & 6), leprosy, cryptococcal meningitis, leptospirosis, Buruli ulcer, trachoma and rheumatic fever. Total funding for this tier made up just over one percent ($49m, 1.4%) of global investment in 2017, the largest share of funding this tier has ever received. This was partly the result of the inclusion of hepatitis C in this tier for the first time, but also because of increases in funding for five of the six other diseases.
Hepatitis C received the most funding of all tier three diseases ($15m, 0.4% of global funding for neglected disease R&D), closely followed by leprosy ($13m, 0.4%) and cryptococcal meningitis ($11m, 0.3%). As in 2016, rheumatic fever received the least amount of R&D funding ($1.2m, <0.1%).
Outside of these disease tiers, G-FINDER also captures non-disease-specific R&D investment, including core funding of multi-disease R&D organisations, investments in platform technologies and multi-disease vector control products, and other R&D investment that cannot be allocated to a specific disease. In 2017, these non-disease-specific grants totalled $382m, accounting for 11% of global funding. Overall non-disease-specific funding increased substantially (up $129m, 51%), largely due to a significant increase in core funding (up $118m, 75%). This year’s G-FINDER report includes for the first time a specific chapter detailing this non-disease-specific funding.
0
10
20
30
40
50
60
70
80
90
100
500
1,000
1,500
2,000
2,500
3,000
3,500
2007 2008 2009 2010 2011 2012 2013 2014 2015 2016 2017
US
$ (m
illio
ns)
% o
f fun
ding
0
gTop tier diseases
gSecond tier diseases
gThird tier diseases
Top tier diseases (%)
Second tier diseases (%)
Third tier diseases (%)
Figure 3. Funding distribution 2007-2017^*
^ Percentages do not add to 100% because of non-disease-specific and unclassified funding.* 2017 figures reflect hepatitis C’s reclassification into the third tier of diseases, after investment in developing
country-specific R&D fell to less than 0.5% of global funding. Spending prior to 2017 is included under the second tier of diseases.
FIN
DIN
GS
- D
ISEA
SES
PAGE25
HIV/AIDS
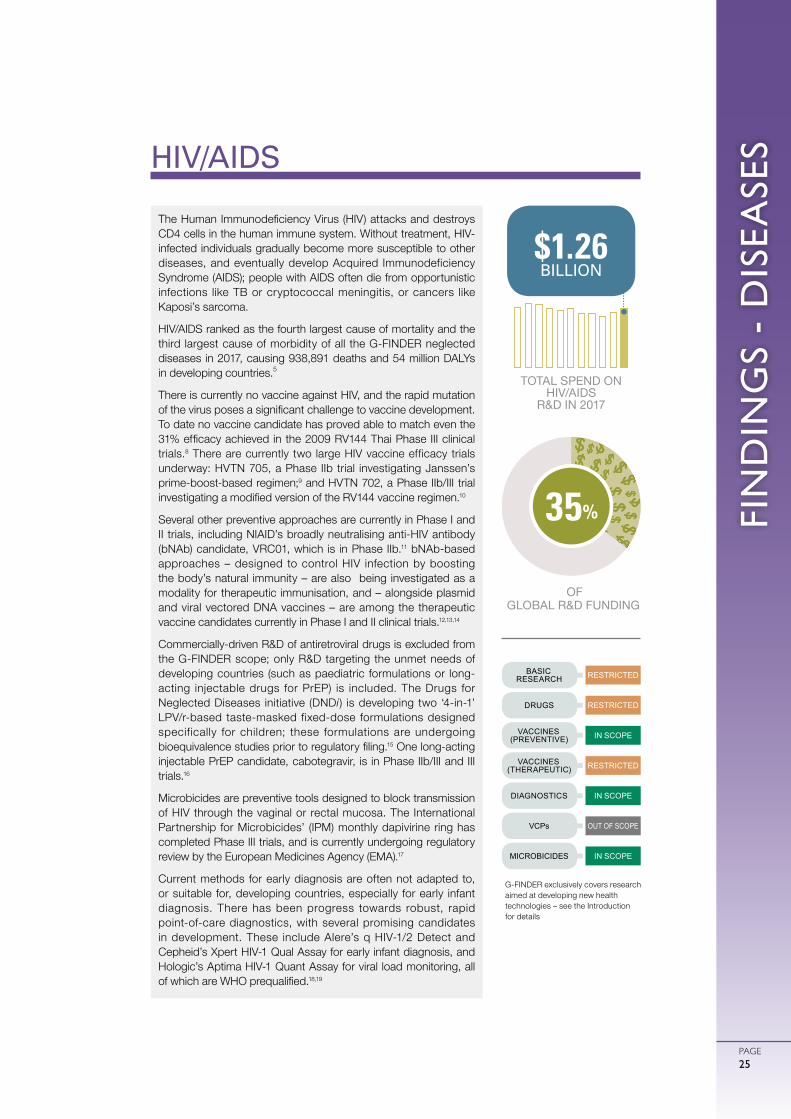
The Human Immunodeficiency Virus (HIV) attacks and destroys CD4 cells in the human immune system. Without treatment, HIV-infected individuals gradually become more susceptible to other diseases, and eventually develop Acquired Immunodeficiency Syndrome (AIDS); people with AIDS often die from opportunistic infections like TB or cryptococcal meningitis, or cancers like Kaposi’s sarcoma.
HIV/AIDS ranked as the fourth largest cause of mortality and the third largest cause of morbidity of all the G-FINDER neglected diseases in 2017, causing 938,891 deaths and 54 million DALYs in developing countries.5
There is currently no vaccine against HIV, and the rapid mutation of the virus poses a significant challenge to vaccine development. To date no vaccine candidate has proved able to match even the 31% efficacy achieved in the 2009 RV144 Thai Phase III clinical trials.8 There are currently two large HIV vaccine efficacy trials underway: HVTN 705, a Phase IIb trial investigating Janssen’s prime-boost-based regimen;9 and HVTN 702, a Phase IIb/III trial investigating a modified version of the RV144 vaccine regimen.10
Several other preventive approaches are currently in Phase I and II trials, including NIAID’s broadly neutralising anti-HIV antibody (bNAb) candidate, VRC01, which is in Phase IIb.11 bNAb-based approaches – designed to control HIV infection by boosting the body’s natural immunity – are also being investigated as a modality for therapeutic immunisation, and – alongside plasmid and viral vectored DNA vaccines – are among the therapeutic vaccine candidates currently in Phase I and II clinical trials.12,13,14
Commercially-driven R&D of antiretroviral drugs is excluded from the G-FINDER scope; only R&D targeting the unmet needs of developing countries (such as paediatric formulations or long-acting injectable drugs for PrEP) is included. The Drugs for Neglected Diseases initiative (DNDi) is developing two ‘4-in-1’ LPV/r-based taste-masked fixed-dose formulations designed specifically for children; these formulations are undergoing bioequivalence studies prior to regulatory filing.15 One long-acting injectable PrEP candidate, cabotegravir, is in Phase IIb/III and III trials.16
Microbicides are preventive tools designed to block transmission of HIV through the vaginal or rectal mucosa. The International Partnership for Microbicides’ (IPM) monthly dapivirine ring has completed Phase III trials, and is currently undergoing regulatory review by the European Medicines Agency (EMA).17
Current methods for early diagnosis are often not adapted to, or suitable for, developing countries, especially for early infant diagnosis. There has been progress towards robust, rapid point-of-care diagnostics, with several promising candidates in development. These include Alere’s q HIV-1/2 Detect and Cepheid’s Xpert HIV-1 Qual Assay for early infant diagnosis, and Hologic’s Aptima HIV-1 Quant Assay for viral load monitoring, all of which are WHO prequalified.18,19
32%35%
IN SCOPE
OUT OF SCOPE
IN SCOPE
RESTRICTED
RESTRICTED
RESTRICTED
IN SCOPE
BASIC RESEARCH
DRUGS
VACCINES (PREVENTIVE)
VACCINES (THERAPEUTIC)
DIAGNOSTICS
VCPs
MICROBICIDES
$1.26 BILLION
TOTAL SPEND ON HIV/AIDS
R&D IN 2017
OF GLOBAL R&D FUNDING
G-FINDER exclusively covers research aimed at developing new health technologies – see the Introduction for details
0
ガル図法(赤道縮尺) 1:47,000,000
1000 2000 3000 4000 5000km
75゜
60゜
45゜
30゜
15゜
0゜
15゜
30゜
45゜
60゜
75゜
90゜
180゜ 165゜ 150゜ 135゜ 120゜ 105゜ 90゜ 75゜ 60゜ 45゜ 30゜ 15゜ 15゜ 0゜ 165゜ 150゜ 135゜ 120゜ 105゜ 90゜ 75゜ 60゜ 45゜
FIN
DIN
GS
- D
ISEA
SES
PAGE26
Global funding for HIV/AIDS basic research and product development in 2017 was $1,257m. This represented more than a third (35%) of all neglected disease R&D investment captured in the survey in 2017, the largest share of any disease. After trending downwards for much of the last decade, global funding for HIV/AIDS R&D increased in 2017 for the second consecutive year. The headline increase (up $88m, 7.5%) includes a large contribution from a new survey participant; if investment from all irregular survey participants is excluded, the real change in HIV/AIDS R&D funding was a more modest increase of $35m (up 3.0%).
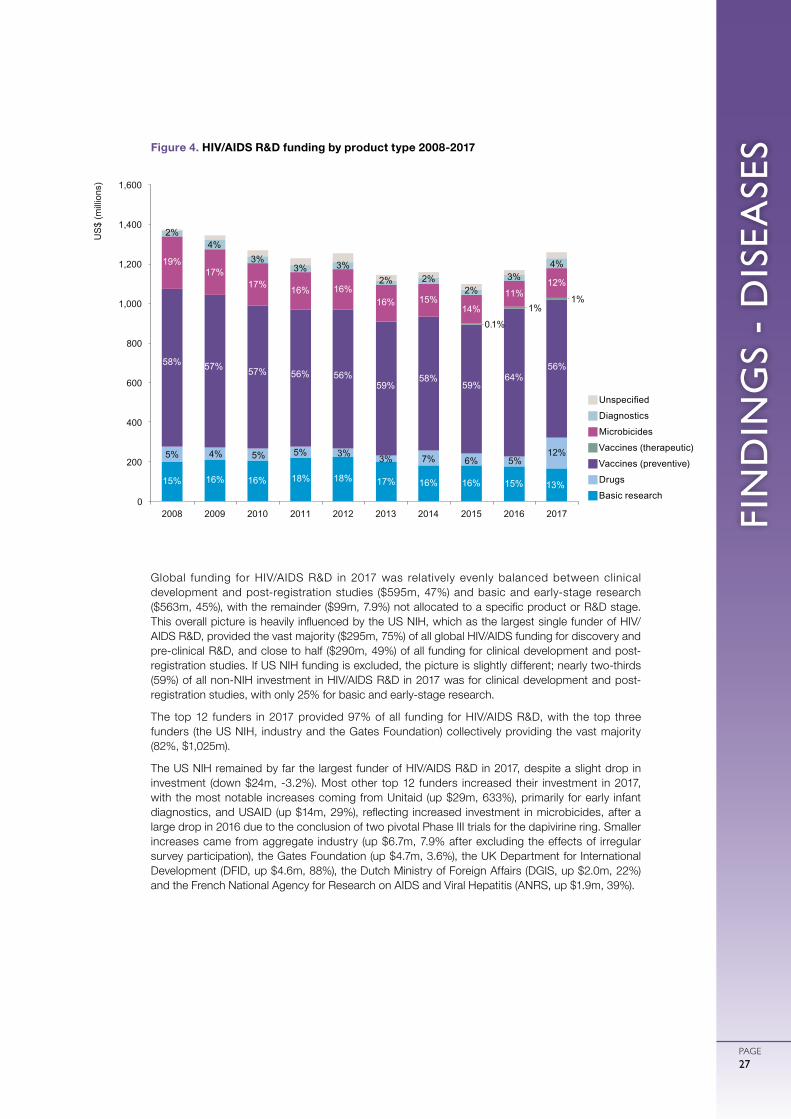
Just over half of all HIV/AIDS R&D funding in 2017 was for the development of preventive vaccines ($699m, 56%), with most of the remainder fairly evenly split between basic research ($169m, 13%), developing country-focused drugs ($150m, 12%) and microbicides ($149m, 12%). Both diagnostics ($52m, 4.1%) and developing country-focused therapeutic vaccines ($12m, 1.0%) received very little funding in comparison.
Following a major increase the preceding year, funding for HIV/AIDS preventive vaccine R&D fell in 2017 (down $47m, -6.2%), almost entirely due to reduced investment from the US National Institutes of Health (NIH, down $42m, -8.6%). This was the only area to see a significant decline. The apparent near-tripling of funding for drug R&D was partly an artefact of changing survey participation, but there was still a substantial and real increase of $44m (up 85%) after excluding irregular funders. This was accompanied by smaller but significant increases in funding for microbicides (up $21m, 17%) and diagnostics (up $19m, 58%). Funding for developing country-focused basic research (down $5.0m, -2.9%) and therapeutic vaccine R&D (up $0.4m, 3.1%) was essentially stable.
The increase in drug R&D investment came as some of the largest funders focused on furthering their research into long-acting HIV drug formulations: the US NIH increased its total HIV/AIDS drug funding by $16m (up 47%), of which $12m was additional funding for the HIV Prevention Trials Network’s long-acting Pre-Exposure Prophylaxis (PrEP) clinical trials; industry committed an additional $14m (up 165%), reflecting the progression of key long-acting injectable candidates to late-stage clinical trials; and the Gates Foundation contributed $7.4m in new funding for the development of an HIV PrEP implant suited to developing country use, as part of its $13m total increase in drug R&D funding (up from $0.9m in 2016).
The increase in funding for microbicide R&D was the first since 2012, and was driven by the US Agency for International Development’s (USAID, up $15m, 75%) investment in Phase IIIb follow-on trials and regulatory filing for the dapivirine ring. The increase in investment in diagnostic R&D was backed by funding from Unitaid ($27m) for the pilot implementation of early infant diagnostics, pushing investment in this product area to historically high levels.
FIN
DIN
GS
- D
ISEA
SES
PAGE27
Global funding for HIV/AIDS R&D in 2017 was relatively evenly balanced between clinical development and post-registration studies ($595m, 47%) and basic and early-stage research ($563m, 45%), with the remainder ($99m, 7.9%) not allocated to a specific product or R&D stage. This overall picture is heavily influenced by the US NIH, which as the largest single funder of HIV/AIDS R&D, provided the vast majority ($295m, 75%) of all global HIV/AIDS funding for discovery and pre-clinical R&D, and close to half ($290m, 49%) of all funding for clinical development and post-registration studies. If US NIH funding is excluded, the picture is slightly different; nearly two-thirds (59%) of all non-NIH investment in HIV/AIDS R&D in 2017 was for clinical development and post-registration studies, with only 25% for basic and early-stage research.
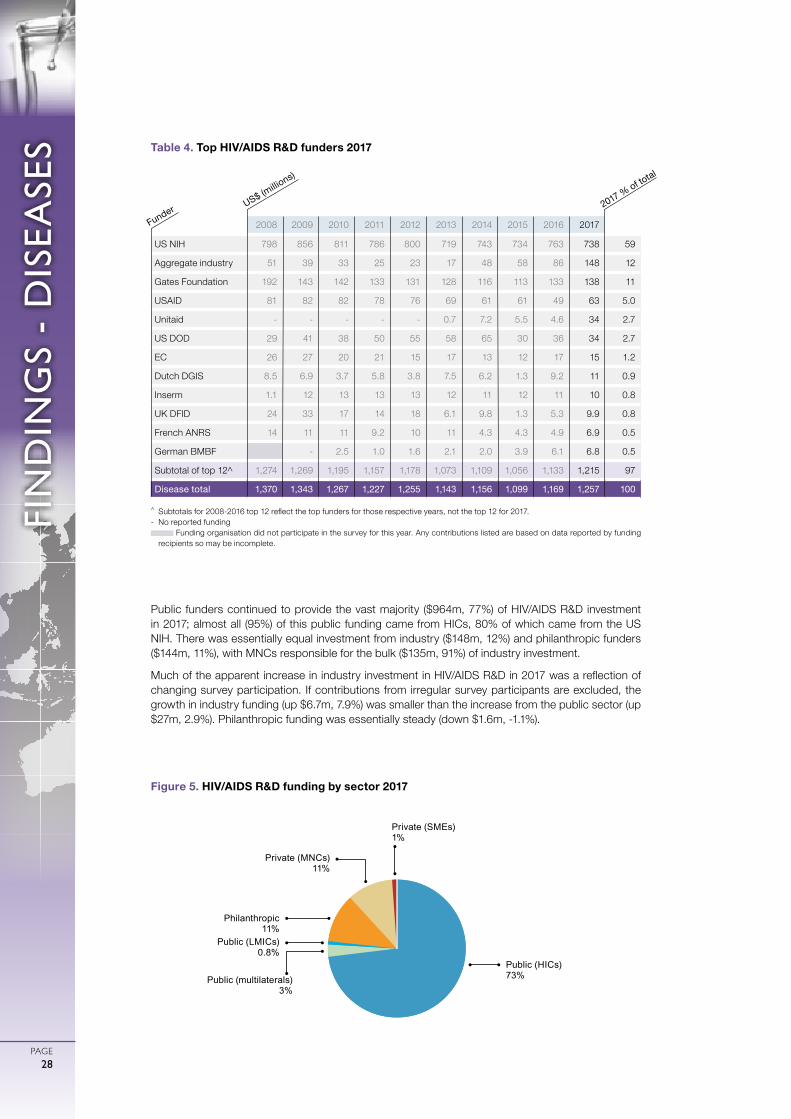
The top 12 funders in 2017 provided 97% of all funding for HIV/AIDS R&D, with the top three funders (the US NIH, industry and the Gates Foundation) collectively providing the vast majority (82%, $1,025m).
The US NIH remained by far the largest funder of HIV/AIDS R&D in 2017, despite a slight drop in investment (down $24m, -3.2%). Most other top 12 funders increased their investment in 2017, with the most notable increases coming from Unitaid (up $29m, 633%), primarily for early infant diagnostics, and USAID (up $14m, 29%), reflecting increased investment in microbicides, after a large drop in 2016 due to the conclusion of two pivotal Phase III trials for the dapivirine ring. Smaller increases came from aggregate industry (up $6.7m, 7.9% after excluding the effects of irregular survey participation), the Gates Foundation (up $4.7m, 3.6%), the UK Department for International Development (DFID, up $4.6m, 88%), the Dutch Ministry of Foreign Affairs (DGIS, up $2.0m, 22%) and the French National Agency for Research on AIDS and Viral Hepatitis (ANRS, up $1.9m, 39%).
gUnspecified
gDiagnostics
gMicrobicides
gVaccines (therapeutic)
gVaccines (preventive)
gDrugs
gBasic research
Figure 4. HIV/AIDS R&D funding by product type 2008-2017
16% 16% 18% 18% 17% 16% 16% 15% 13%
0
200
400
600
800
1,000
1,200
1,400
1,600
US
$ (m
illio
ns)
16% 16% 16% 15%
14%
11% 12%
2% 4%
3% 3% 3%
2% 2% 2%
3% 4%
2008 2009 2010 2011 2012 2013 2014 2015 2016 2017
5% 4% 5% 5% 3% 3% 7% 6% 5% 12%
58% 57% 57% 56% 56% 59%
58% 59%
64% 56%
0.1%
1% 1%
19% 17%
17%
15%
0
ガル図法(赤道縮尺) 1:47,000,000
1000 2000 3000 4000 5000km
75゜
60゜
45゜
30゜
15゜
0゜
15゜
30゜
45゜
60゜
75゜
90゜
180゜ 165゜ 150゜ 135゜ 120゜ 105゜ 90゜ 75゜ 60゜ 45゜ 30゜ 15゜ 15゜ 0゜ 165゜ 150゜ 135゜ 120゜ 105゜ 90゜ 75゜ 60゜ 45゜
FIN
DIN
GS
- D
ISEA
SES
PAGE28
Public funders continued to provide the vast majority ($964m, 77%) of HIV/AIDS R&D investment in 2017; almost all (95%) of this public funding came from HICs, 80% of which came from the US NIH. There was essentially equal investment from industry ($148m, 12%) and philanthropic funders ($144m, 11%), with MNCs responsible for the bulk ($135m, 91%) of industry investment.
Much of the apparent increase in industry investment in HIV/AIDS R&D in 2017 was a reflection of changing survey participation. If contributions from irregular survey participants are excluded, the growth in industry funding (up $6.7m, 7.9%) was smaller than the increase from the public sector (up $27m, 2.9%). Philanthropic funding was essentially steady (down $1.6m, -1.1%).
Figure 5. HIV/AIDS R&D funding by sector 2017
Public (HICs) 73%
Public (LMICs) 0.8%
Private (MNCs) 11%
Private (SMEs) 1%
Philanthropic 11%
Public (multilaterals)3%
2008 2009 2010 2011 2012 2013 2014 2015 2016 2017
US NIH 798 856 811 786 800 719 743 734 763 738 59
Aggregate industry 51 39 33 25 23 17 48 58 86 148 12
Gates Foundation 192 143 142 133 131 128 116 113 133 138 11
USAID 81 82 82 78 76 69 61 61 49 63 5.0
Unitaid - - - - - 0.7 7.2 5.5 4.6 34 2.7
US DOD 29 41 38 50 55 58 65 30 36 34 2.7
EC 26 27 20 21 15 17 13 12 17 15 1.2
Dutch DGIS 8.5 6.9 3.7 5.8 3.8 7.5 6.2 1.3 9.2 11 0.9
Inserm 1.1 12 13 13 13 12 11 12 11 10 0.8
UK DFID 24 33 17 14 18 6.1 9.8 1.3 5.3 9.9 0.8
French ANRS 14 11 11 9.2 10 11 4.3 4.3 4.9 6.9 0.5
German BMBF - 2.5 1.0 1.6 2.1 2.0 3.9 6.1 6.8 0.5
Subtotal of top 12^ 1,274 1,269 1,195 1,157 1,178 1,073 1,109 1,056 1,133 1,215 97
Disease total 1,370 1,343 1,267 1,227 1,255 1,143 1,156 1,099 1,169 1,257 100
Table 4. Top HIV/AIDS R&D funders 2017
^ Subtotals for 2008-2016 top 12 reflect the top funders for those respective years, not the top 12 for 2017.- No reported funding
Funding organisation did not participate in the survey for this year. Any contributions listed are based on data reported by funding recipients so may be incomplete.
2017 % of total
US$ (millio
ns)
Funder
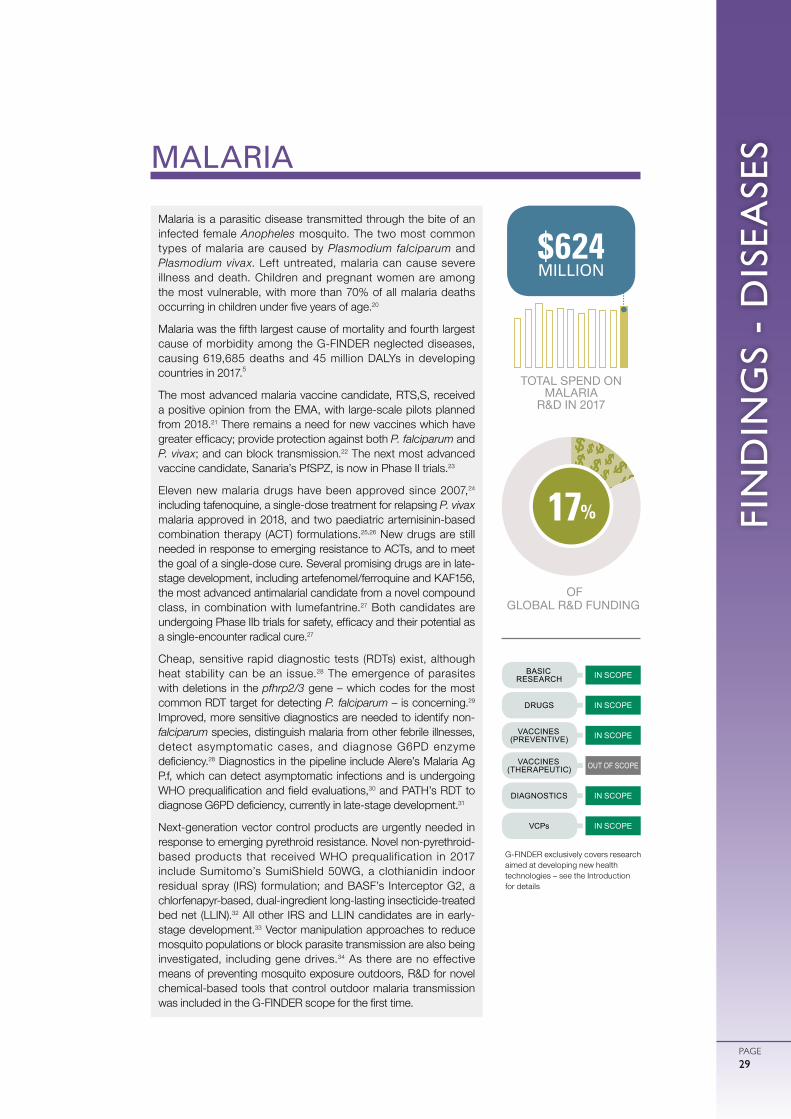
FIN
DIN
GS
- D
ISEA
SES
PAGE29
MALARIA
Malaria is a parasitic disease transmitted through the bite of an infected female Anopheles mosquito. The two most common types of malaria are caused by Plasmodium falciparum and Plasmodium vivax. Left untreated, malaria can cause severe illness and death. Children and pregnant women are among the most vulnerable, with more than 70% of all malaria deaths occurring in children under five years of age.20
Malaria was the fifth largest cause of mortality and fourth largest cause of morbidity among the G-FINDER neglected diseases, causing 619,685 deaths and 45 million DALYs in developing countries in 2017.5
The most advanced malaria vaccine candidate, RTS,S, received a positive opinion from the EMA, with large-scale pilots planned from 2018.21 There remains a need for new vaccines which have greater efficacy; provide protection against both P. falciparum and P. vivax; and can block transmission.22 The next most advanced vaccine candidate, Sanaria’s PfSPZ, is now in Phase II trials.23
Eleven new malaria drugs have been approved since 2007,24
including tafenoquine, a single-dose treatment for relapsing P. vivax malaria approved in 2018, and two paediatric artemisinin-based combination therapy (ACT) formulations.25,26 New drugs are still needed in response to emerging resistance to ACTs, and to meet the goal of a single-dose cure. Several promising drugs are in late-stage development, including artefenomel/ferroquine and KAF156, the most advanced antimalarial candidate from a novel compound class, in combination with lumefantrine.27 Both candidates are undergoing Phase IIb trials for safety, efficacy and their potential as a single-encounter radical cure.27
Cheap, sensitive rapid diagnostic tests (RDTs) exist, although heat stability can be an issue.28 The emergence of parasites with deletions in the pfhrp2/3 gene – which codes for the most common RDT target for detecting P. falciparum – is concerning.29 Improved, more sensitive diagnostics are needed to identify non-falciparum species, distinguish malaria from other febrile illnesses, detect asymptomatic cases, and diagnose G6PD enzyme deficiency.28 Diagnostics in the pipeline include Alere’s Malaria Ag P.f, which can detect asymptomatic infections and is undergoing WHO prequalification and field evaluations,30 and PATH’s RDT to diagnose G6PD deficiency, currently in late-stage development.31
Next-generation vector control products are urgently needed in response to emerging pyrethroid resistance. Novel non-pyrethroid-based products that received WHO prequalification in 2017 include Sumitomo’s SumiShield 50WG, a clothianidin indoor residual spray (IRS) formulation; and BASF’s Interceptor G2, a chlorfenapyr-based, dual-ingredient long-lasting insecticide-treated bed net (LLIN).32 All other IRS and LLIN candidates are in early-stage development.33 Vector manipulation approaches to reduce mosquito populations or block parasite transmission are also being investigated, including gene drives.34 As there are no effective means of preventing mosquito exposure outdoors, R&D for novel chemical-based tools that control outdoor malaria transmission was included in the G-FINDER scope for the first time.
32%17%
IN SCOPE
IN SCOPE
OUT OF SCOPE
IN SCOPE
IN SCOPE
IN SCOPE
BASIC RESEARCH
DRUGS
VACCINES (PREVENTIVE)
VACCINES (THERAPEUTIC)
DIAGNOSTICS
VCPs
TOTAL SPEND ON MALARIA
R&D IN 2017
OF GLOBAL R&D FUNDING
$624 MILLION
G-FINDER exclusively covers research aimed at developing new health technologies – see the Introduction for details
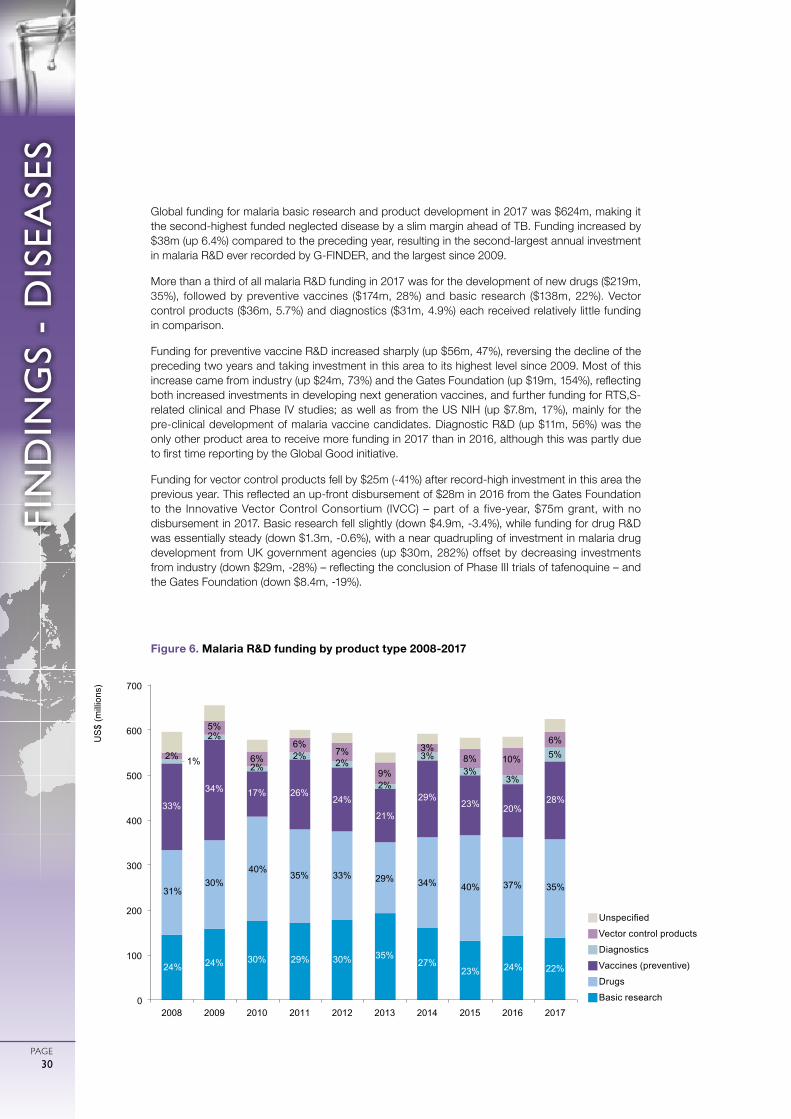
0
ガル図法(赤道縮尺) 1:47,000,000
1000 2000 3000 4000 5000km
75゜
60゜
45゜
30゜
15゜
0゜
15゜
30゜
45゜
60゜
75゜
90゜
180゜ 165゜ 150゜ 135゜ 120゜ 105゜ 90゜ 75゜ 60゜ 45゜ 30゜ 15゜ 15゜ 0゜ 165゜ 150゜ 135゜ 120゜ 105゜ 90゜ 75゜ 60゜ 45゜
FIN
DIN
GS
- D
ISEA
SES
PAGE30
Global funding for malaria basic research and product development in 2017 was $624m, making it the second-highest funded neglected disease by a slim margin ahead of TB. Funding increased by $38m (up 6.4%) compared to the preceding year, resulting in the second-largest annual investment in malaria R&D ever recorded by G-FINDER, and the largest since 2009.
More than a third of all malaria R&D funding in 2017 was for the development of new drugs ($219m, 35%), followed by preventive vaccines ($174m, 28%) and basic research ($138m, 22%). Vector control products ($36m, 5.7%) and diagnostics ($31m, 4.9%) each received relatively little funding in comparison.
Funding for preventive vaccine R&D increased sharply (up $56m, 47%), reversing the decline of the preceding two years and taking investment in this area to its highest level since 2009. Most of this increase came from industry (up $24m, 73%) and the Gates Foundation (up $19m, 154%), reflecting both increased investments in developing next generation vaccines, and further funding for RTS,S-related clinical and Phase IV studies; as well as from the US NIH (up $7.8m, 17%), mainly for the pre-clinical development of malaria vaccine candidates. Diagnostic R&D (up $11m, 56%) was the only other product area to receive more funding in 2017 than in 2016, although this was partly due to first time reporting by the Global Good initiative.
Funding for vector control products fell by $25m (-41%) after record-high investment in this area the previous year. This reflected an up-front disbursement of $28m in 2016 from the Gates Foundation to the Innovative Vector Control Consortium (IVCC) – part of a five-year, $75m grant, with no disbursement in 2017. Basic research fell slightly (down $4.9m, -3.4%), while funding for drug R&D was essentially steady (down $1.3m, -0.6%), with a near quadrupling of investment in malaria drug development from UK government agencies (up $30m, 282%) offset by decreasing investments from industry (down $29m, -28%) – reflecting the conclusion of Phase III trials of tafenoquine – and the Gates Foundation (down $8.4m, -19%).
gUnspecified
gVector control products
gDiagnostics
gVaccines (preventive)
gDrugs
gBasic research
Figure 6. Malaria R&D funding by product type 2008-2017
24% 24% 30% 29% 30% 35% 27%
23% 24% 22%
31% 30%
40% 35% 33% 29% 34% 40% 37% 35%
33%
34% 17% 26% 24%
21%
29% 23% 20%
28%
1%
2%
2% 2%
2%
2%
3% 3%
3%
5% 2%
5%
6% 6%
7%
9%
3% 8% 10%
6%
0
100
200
300
400
500
600
700
2008 2009 2010 2011 2012 2013 2014 2015 2016 2017
US
$ (m
illio
ns)
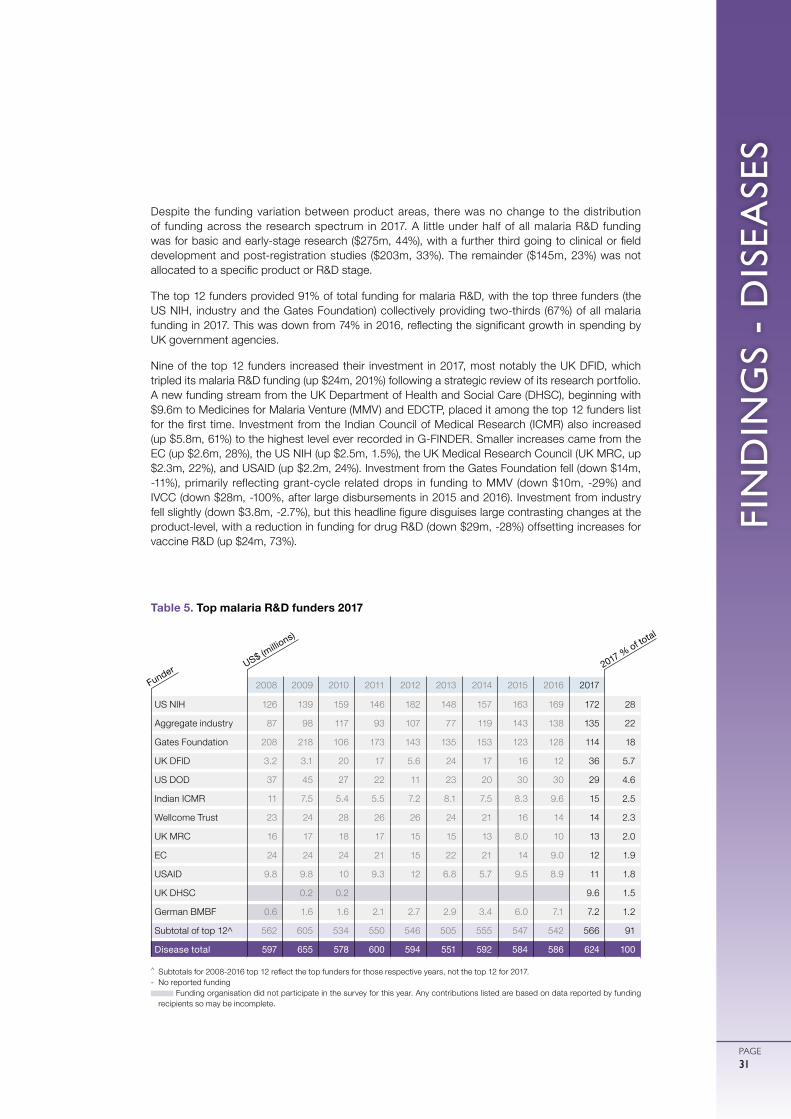
FIN
DIN
GS
- D
ISEA
SES
PAGE31
Despite the funding variation between product areas, there was no change to the distribution of funding across the research spectrum in 2017. A little under half of all malaria R&D funding was for basic and early-stage research ($275m, 44%), with a further third going to clinical or field development and post-registration studies ($203m, 33%). The remainder ($145m, 23%) was not allocated to a specific product or R&D stage.
The top 12 funders provided 91% of total funding for malaria R&D, with the top three funders (the US NIH, industry and the Gates Foundation) collectively providing two-thirds (67%) of all malaria funding in 2017. This was down from 74% in 2016, reflecting the significant growth in spending by UK government agencies.
Nine of the top 12 funders increased their investment in 2017, most notably the UK DFID, which tripled its malaria R&D funding (up $24m, 201%) following a strategic review of its research portfolio. A new funding stream from the UK Department of Health and Social Care (DHSC), beginning with $9.6m to Medicines for Malaria Venture (MMV) and EDCTP, placed it among the top 12 funders list for the first time. Investment from the Indian Council of Medical Research (ICMR) also increased (up $5.8m, 61%) to the highest level ever recorded in G-FINDER. Smaller increases came from the EC (up $2.6m, 28%), the US NIH (up $2.5m, 1.5%), the UK Medical Research Council (UK MRC, up $2.3m, 22%), and USAID (up $2.2m, 24%). Investment from the Gates Foundation fell (down $14m, -11%), primarily reflecting grant-cycle related drops in funding to MMV (down $10m, -29%) and IVCC (down $28m, -100%, after large disbursements in 2015 and 2016). Investment from industry fell slightly (down $3.8m, -2.7%), but this headline figure disguises large contrasting changes at the product-level, with a reduction in funding for drug R&D (down $29m, -28%) offsetting increases for vaccine R&D (up $24m, 73%).
2008 2009 2010 2011 2012 2013 2014 2015 2016 2017
US NIH 126 139 159 146 182 148 157 163 169 172 28
Aggregate industry 87 98 117 93 107 77 119 143 138 135 22
Gates Foundation 208 218 106 173 143 135 153 123 128 114 18
UK DFID 3.2 3.1 20 17 5.6 24 17 16 12 36 5.7
US DOD 37 45 27 22 11 23 20 30 30 29 4.6
Indian ICMR 11 7.5 5.4 5.5 7.2 8.1 7.5 8.3 9.6 15 2.5
Wellcome Trust 23 24 28 26 26 24 21 16 14 14 2.3
UK MRC 16 17 18 17 15 15 13 8.0 10 13 2.0
EC 24 24 24 21 15 22 21 14 9.0 12 1.9
USAID 9.8 9.8 10 9.3 12 6.8 5.7 9.5 8.9 11 1.8
UK DHSC 0.2 0.2 9.6 1.5
German BMBF 0.6 1.6 1.6 2.1 2.7 2.9 3.4 6.0 7.1 7.2 1.2
Subtotal of top 12^ 562 605 534 550 546 505 555 547 542 566 91
Disease total 597 655 578 600 594 551 592 584 586 624 100
Table 5. Top malaria R&D funders 2017
^ Subtotals for 2008-2016 top 12 reflect the top funders for those respective years, not the top 12 for 2017.- No reported funding
Funding organisation did not participate in the survey for this year. Any contributions listed are based on data reported by funding recipients so may be incomplete.
2017 % of total
US$ (millio
ns)
Funder
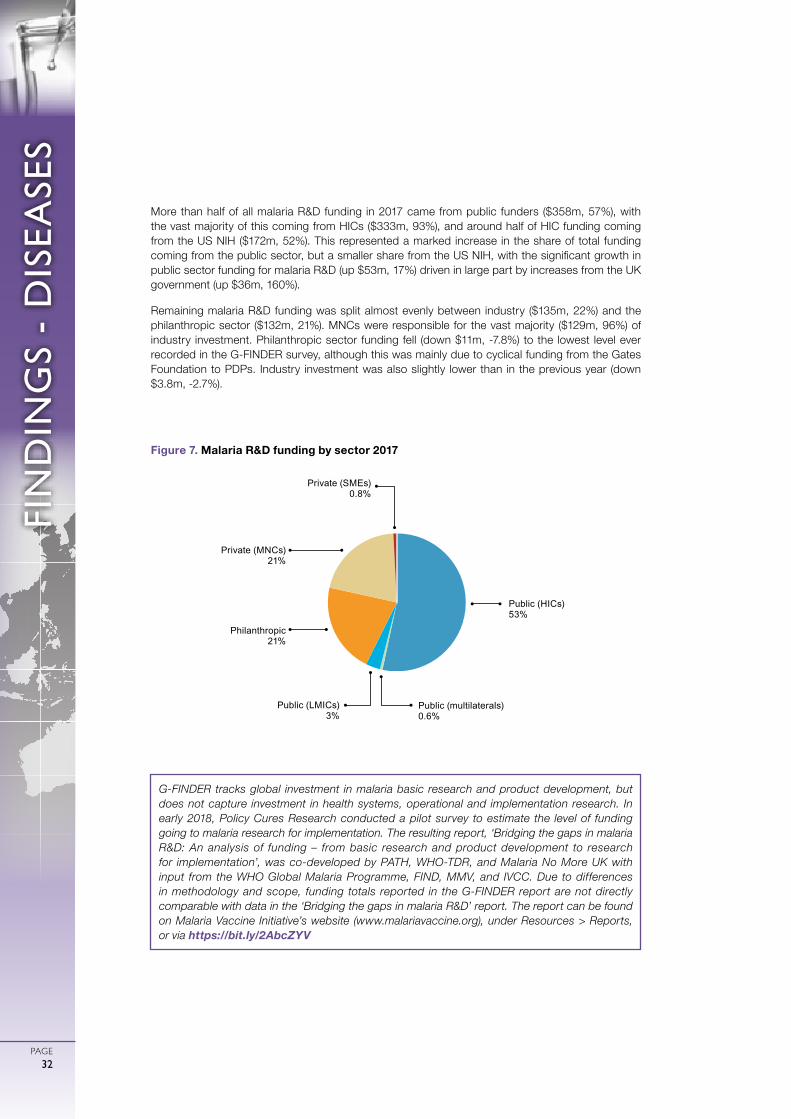
0
ガル図法(赤道縮尺) 1:47,000,000
1000 2000 3000 4000 5000km
75゜
60゜
45゜
30゜
15゜
0゜
15゜
30゜
45゜
60゜
75゜
90゜
180゜ 165゜ 150゜ 135゜ 120゜ 105゜ 90゜ 75゜ 60゜ 45゜ 30゜ 15゜ 15゜ 0゜ 165゜ 150゜ 135゜ 120゜ 105゜ 90゜ 75゜ 60゜ 45゜
FIN
DIN
GS
- D
ISEA
SES
PAGE32
More than half of all malaria R&D funding in 2017 came from public funders ($358m, 57%), with the vast majority of this coming from HICs ($333m, 93%), and around half of HIC funding coming from the US NIH ($172m, 52%). This represented a marked increase in the share of total funding coming from the public sector, but a smaller share from the US NIH, with the significant growth in public sector funding for malaria R&D (up $53m, 17%) driven in large part by increases from the UK government (up $36m, 160%).
Remaining malaria R&D funding was split almost evenly between industry ($135m, 22%) and the philanthropic sector ($132m, 21%). MNCs were responsible for the vast majority ($129m, 96%) of industry investment. Philanthropic sector funding fell (down $11m, -7.8%) to the lowest level ever recorded in the G-FINDER survey, although this was mainly due to cyclical funding from the Gates Foundation to PDPs. Industry investment was also slightly lower than in the previous year (down $3.8m, -2.7%).
G-FINDER tracks global investment in malaria basic research and product development, but does not capture investment in health systems, operational and implementation research. In early 2018, Policy Cures Research conducted a pilot survey to estimate the level of funding going to malaria research for implementation. The resulting report, ‘Bridging the gaps in malaria R&D: An analysis of funding – from basic research and product development to research for implementation’, was co-developed by PATH, WHO-TDR, and Malaria No More UK with input from the WHO Global Malaria Programme, FIND, MMV, and IVCC. Due to differences in methodology and scope, funding totals reported in the G-FINDER report are not directly comparable with data in the ‘Bridging the gaps in malaria R&D’ report. The report can be found on Malaria Vaccine Initiative’s website (www.malariavaccine.org), under Resources > Reports, or via https://bit.ly/2AbcZYV
Public (HICs) 53%
Public (LMICs) 3%
Private (MNCs) 21%
Private (SMEs)0.8%
Philanthropic 21%
Public (multilaterals) 0.6%
Figure 7. Malaria R&D funding by sector 2017
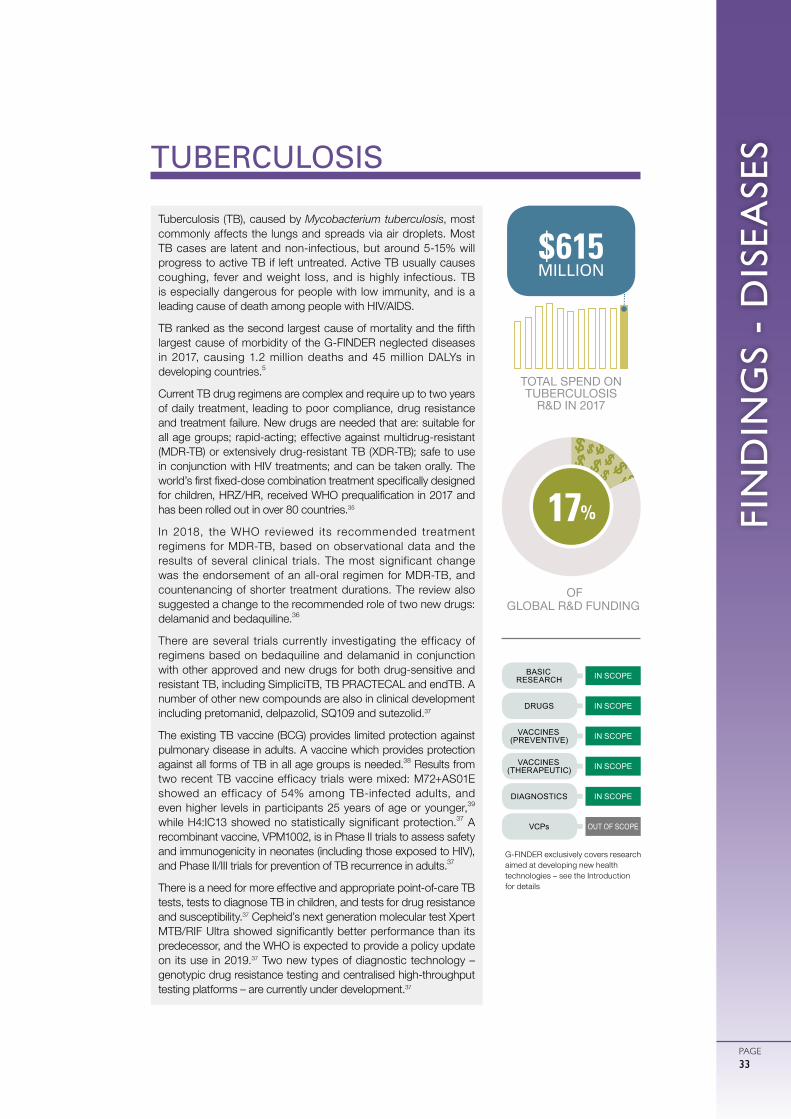
FIN
DIN
GS
- D
ISEA
SES
PAGE33
TUBERCULOSIS
Tuberculosis (TB), caused by Mycobacterium tuberculosis, most commonly affects the lungs and spreads via air droplets. Most TB cases are latent and non-infectious, but around 5-15% will progress to active TB if left untreated. Active TB usually causes coughing, fever and weight loss, and is highly infectious. TB is especially dangerous for people with low immunity, and is a leading cause of death among people with HIV/AIDS.
TB ranked as the second largest cause of mortality and the fifth largest cause of morbidity of the G-FINDER neglected diseases in 2017, causing 1.2 million deaths and 45 million DALYs in developing countries.5
Current TB drug regimens are complex and require up to two years of daily treatment, leading to poor compliance, drug resistance and treatment failure. New drugs are needed that are: suitable for all age groups; rapid-acting; effective against multidrug-resistant (MDR-TB) or extensively drug-resistant TB (XDR-TB); safe to use in conjunction with HIV treatments; and can be taken orally. The world’s first fixed-dose combination treatment specifically designed for children, HRZ/HR, received WHO prequalification in 2017 and has been rolled out in over 80 countries.35
In 2018, the WHO reviewed its recommended treatment regimens for MDR-TB, based on observational data and the results of several clinical trials. The most significant change was the endorsement of an all-oral regimen for MDR-TB, and countenancing of shorter treatment durations. The review also suggested a change to the recommended role of two new drugs: delamanid and bedaquiline.36
There are several trials currently investigating the efficacy of regimens based on bedaquiline and delamanid in conjunction with other approved and new drugs for both drug-sensitive and resistant TB, including SimpliciTB, TB PRACTECAL and endTB. A number of other new compounds are also in clinical development including pretomanid, delpazolid, SQ109 and sutezolid.37
The existing TB vaccine (BCG) provides limited protection against pulmonary disease in adults. A vaccine which provides protection against all forms of TB in all age groups is needed.38 Results from two recent TB vaccine efficacy trials were mixed: M72+AS01E showed an efficacy of 54% among TB-infected adults, and even higher levels in participants 25 years of age or younger,39
while H4:IC13 showed no statistically significant protection.37 A recombinant vaccine, VPM1002, is in Phase II trials to assess safety and immunogenicity in neonates (including those exposed to HIV), and Phase II/III trials for prevention of TB recurrence in adults.37
There is a need for more effective and appropriate point-of-care TB tests, tests to diagnose TB in children, and tests for drug resistance and susceptibility.37 Cepheid’s next generation molecular test Xpert MTB/RIF Ultra showed significantly better performance than its predecessor, and the WHO is expected to provide a policy update on its use in 2019.37 Two new types of diagnostic technology – genotypic drug resistance testing and centralised high-throughput testing platforms – are currently under development.37
TOTAL SPEND ON TUBERCULOSIS
R&D IN 2017
$615 MILLION
OF GLOBAL R&D FUNDING
32%17%
IN SCOPE
OUT OF SCOPE
IN SCOPE
IN SCOPE
IN SCOPE
IN SCOPE
BASIC RESEARCH
DRUGS
VACCINES (PREVENTIVE)
VACCINES (THERAPEUTIC)
DIAGNOSTICS
VCPs
G-FINDER exclusively covers research aimed at developing new health technologies – see the Introduction for details
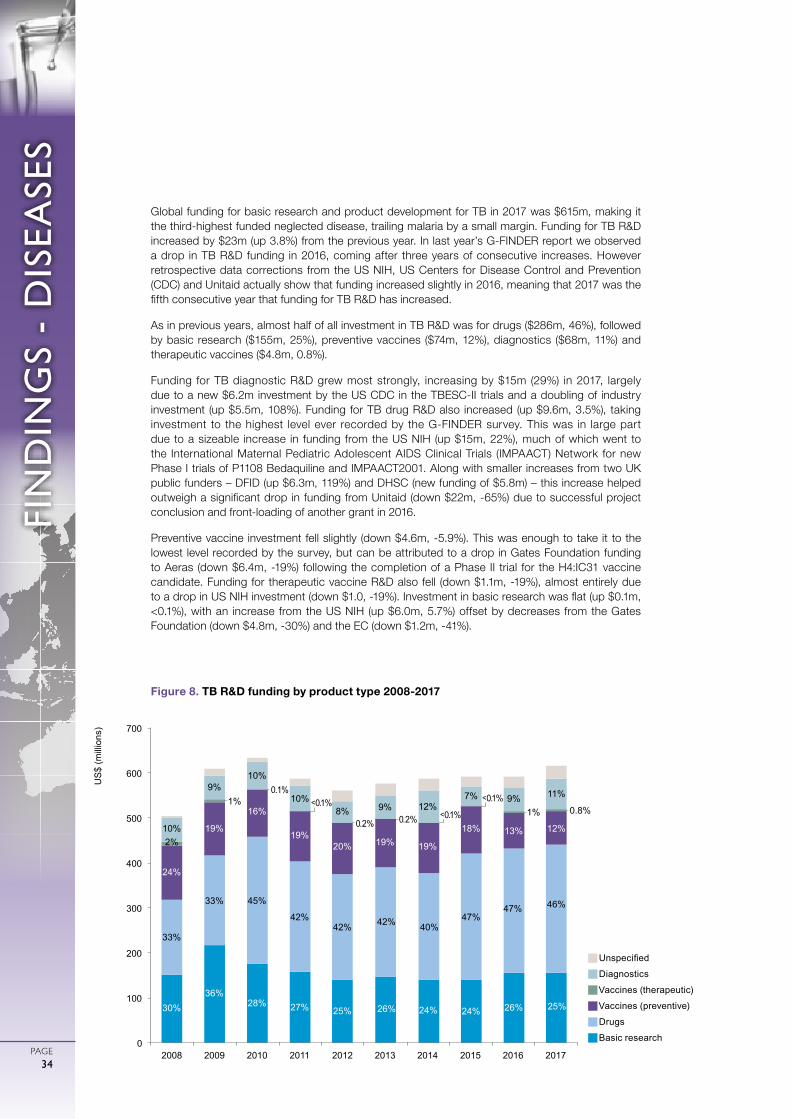
0
ガル図法(赤道縮尺) 1:47,000,000
1000 2000 3000 4000 5000km
75゜
60゜
45゜
30゜
15゜
0゜
15゜
30゜
45゜
60゜
75゜
90゜
180゜ 165゜ 150゜ 135゜ 120゜ 105゜ 90゜ 75゜ 60゜ 45゜ 30゜ 15゜ 15゜ 0゜ 165゜ 150゜ 135゜ 120゜ 105゜ 90゜ 75゜ 60゜ 45゜
FIN
DIN
GS
- D
ISEA
SES
PAGE34
Global funding for basic research and product development for TB in 2017 was $615m, making it the third-highest funded neglected disease, trailing malaria by a small margin. Funding for TB R&D increased by $23m (up 3.8%) from the previous year. In last year’s G-FINDER report we observed a drop in TB R&D funding in 2016, coming after three years of consecutive increases. However retrospective data corrections from the US NIH, US Centers for Disease Control and Prevention (CDC) and Unitaid actually show that funding increased slightly in 2016, meaning that 2017 was the fifth consecutive year that funding for TB R&D has increased.
As in previous years, almost half of all investment in TB R&D was for drugs ($286m, 46%), followed by basic research ($155m, 25%), preventive vaccines ($74m, 12%), diagnostics ($68m, 11%) and therapeutic vaccines ($4.8m, 0.8%).
Funding for TB diagnostic R&D grew most strongly, increasing by $15m (29%) in 2017, largely due to a new $6.2m investment by the US CDC in the TBESC-II trials and a doubling of industry investment (up $5.5m, 108%). Funding for TB drug R&D also increased (up $9.6m, 3.5%), taking investment to the highest level ever recorded by the G-FINDER survey. This was in large part due to a sizeable increase in funding from the US NIH (up $15m, 22%), much of which went to the International Maternal Pediatric Adolescent AIDS Clinical Trials (IMPAACT) Network for new Phase I trials of P1108 Bedaquiline and IMPAACT2001. Along with smaller increases from two UK public funders – DFID (up $6.3m, 119%) and DHSC (new funding of $5.8m) – this increase helped outweigh a significant drop in funding from Unitaid (down $22m, -65%) due to successful project conclusion and front-loading of another grant in 2016.
Preventive vaccine investment fell slightly (down $4.6m, -5.9%). This was enough to take it to the lowest level recorded by the survey, but can be attributed to a drop in Gates Foundation funding to Aeras (down $6.4m, -19%) following the completion of a Phase II trial for the H4:IC31 vaccine candidate. Funding for therapeutic vaccine R&D also fell (down $1.1m, -19%), almost entirely due to a drop in US NIH investment (down $1.0, -19%). Investment in basic research was flat (up $0.1m, <0.1%), with an increase from the US NIH (up $6.0m, 5.7%) offset by decreases from the Gates Foundation (down $4.8m, -30%) and the EC (down $1.2m, -41%).
gUnspecified
gDiagnostics
gVaccines (therapeutic)
gVaccines (preventive)
gDrugs
gBasic research
Figure 8. TB R&D funding by product type 2008-2017
30% 36%
28% 27% 25% 26% 24% 24% 26% 25%
33%
33% 45%
42% 42% 42% 40%
47% 47% 46%
24%
19%
16%
19% 20% 19% 19%
18% 13% 12% 2%
1% <0.1% 1% 0.8%
10%
9% 10%
10% 8% 9% 12%
7% 9% 11%
0
100
200
300
400
500
600
700
2008 2009 2010 2011 2012 2013 2014 2015 2016 2017
US
$ (m
illio
ns)
0.1%
<0.1%
<0.1%
0.2% 0.2%
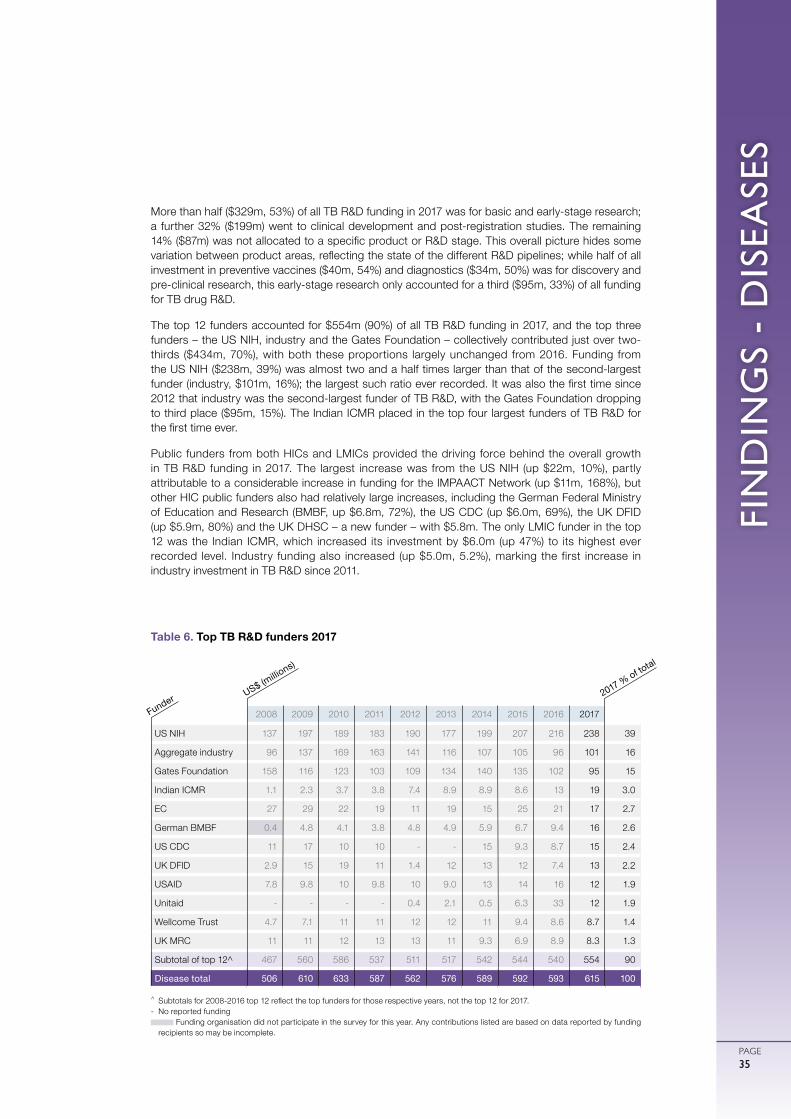
FIN
DIN
GS
- D
ISEA
SES
PAGE35
More than half ($329m, 53%) of all TB R&D funding in 2017 was for basic and early-stage research; a further 32% ($199m) went to clinical development and post-registration studies. The remaining 14% ($87m) was not allocated to a specific product or R&D stage. This overall picture hides some variation between product areas, reflecting the state of the different R&D pipelines; while half of all investment in preventive vaccines ($40m, 54%) and diagnostics ($34m, 50%) was for discovery and pre-clinical research, this early-stage research only accounted for a third ($95m, 33%) of all funding for TB drug R&D.
The top 12 funders accounted for $554m (90%) of all TB R&D funding in 2017, and the top three funders – the US NIH, industry and the Gates Foundation – collectively contributed just over two-thirds ($434m, 70%), with both these proportions largely unchanged from 2016. Funding from the US NIH ($238m, 39%) was almost two and a half times larger than that of the second-largest funder (industry, $101m, 16%); the largest such ratio ever recorded. It was also the first time since 2012 that industry was the second-largest funder of TB R&D, with the Gates Foundation dropping to third place ($95m, 15%). The Indian ICMR placed in the top four largest funders of TB R&D for the first time ever.
Public funders from both HICs and LMICs provided the driving force behind the overall growth in TB R&D funding in 2017. The largest increase was from the US NIH (up $22m, 10%), partly attributable to a considerable increase in funding for the IMPAACT Network (up $11m, 168%), but other HIC public funders also had relatively large increases, including the German Federal Ministry of Education and Research (BMBF, up $6.8m, 72%), the US CDC (up $6.0m, 69%), the UK DFID (up $5.9m, 80%) and the UK DHSC – a new funder – with $5.8m. The only LMIC funder in the top 12 was the Indian ICMR, which increased its investment by $6.0m (up 47%) to its highest ever recorded level. Industry funding also increased (up $5.0m, 5.2%), marking the first increase in industry investment in TB R&D since 2011.
2008 2009 2010 2011 2012 2013 2014 2015 2016 2017
US NIH 137 197 189 183 190 177 199 207 216 238 39
Aggregate industry 96 137 169 163 141 116 107 105 96 101 16
Gates Foundation 158 116 123 103 109 134 140 135 102 95 15
Indian ICMR 1.1 2.3 3.7 3.8 7.4 8.9 8.9 8.6 13 19 3.0
EC 27 29 22 19 11 19 15 25 21 17 2.7
German BMBF 0.4 4.8 4.1 3.8 4.8 4.9 5.9 6.7 9.4 16 2.6
US CDC 11 17 10 10 - - 15 9.3 8.7 15 2.4
UK DFID 2.9 15 19 11 1.4 12 13 12 7.4 13 2.2
USAID 7.8 9.8 10 9.8 10 9.0 13 14 16 12 1.9
Unitaid - - - - 0.4 2.1 0.5 6.3 33 12 1.9
Wellcome Trust 4.7 7.1 11 11 12 12 11 9.4 8.6 8.7 1.4
UK MRC 11 11 12 13 13 11 9.3 6.9 8.9 8.3 1.3
Subtotal of top 12^ 467 560 586 537 511 517 542 544 540 554 90
Disease total 506 610 633 587 562 576 589 592 593 615 100
Table 6. Top TB R&D funders 2017
^ Subtotals for 2008-2016 top 12 reflect the top funders for those respective years, not the top 12 for 2017.- No reported funding
Funding organisation did not participate in the survey for this year. Any contributions listed are based on data reported by funding recipients so may be incomplete.
US$ (millio
ns)
Funder 2017 % of total
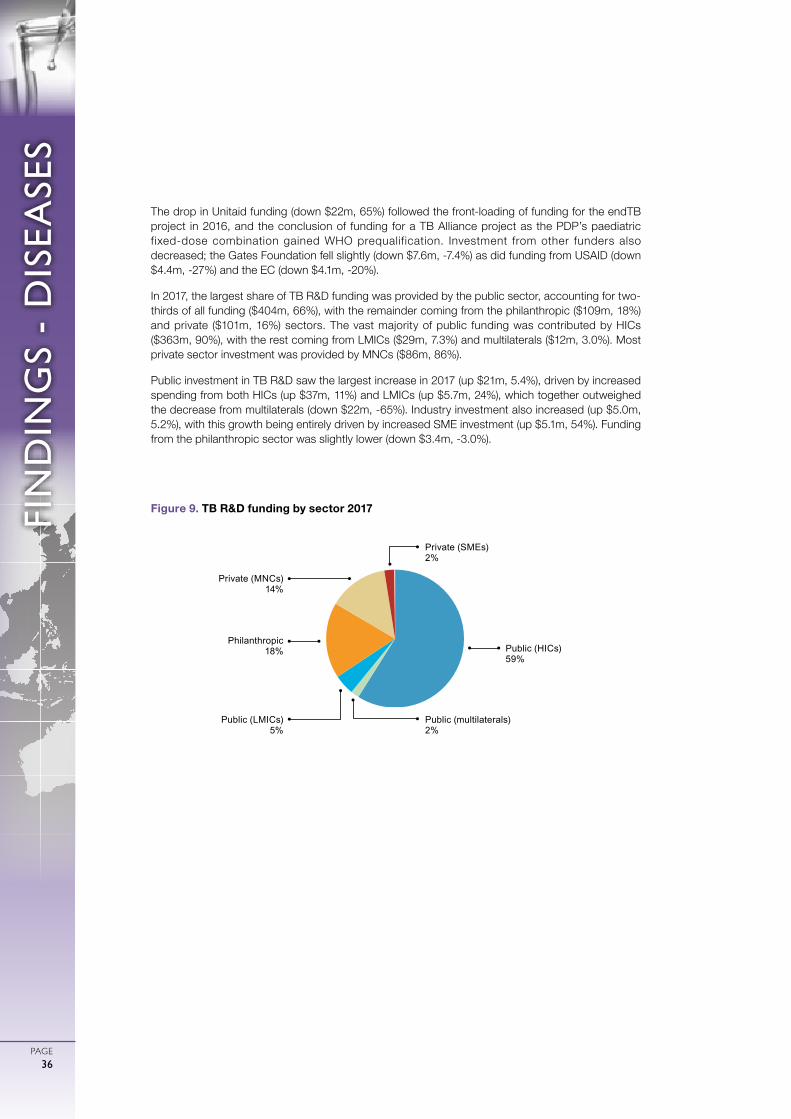
0
ガル図法(赤道縮尺) 1:47,000,000
1000 2000 3000 4000 5000km
75゜
60゜
45゜
30゜
15゜
0゜
15゜
30゜
45゜
60゜
75゜
90゜
180゜ 165゜ 150゜ 135゜ 120゜ 105゜ 90゜ 75゜ 60゜ 45゜ 30゜ 15゜ 15゜ 0゜ 165゜ 150゜ 135゜ 120゜ 105゜ 90゜ 75゜ 60゜ 45゜
FIN
DIN
GS
- D
ISEA
SES
PAGE36
The drop in Unitaid funding (down $22m, 65%) followed the front-loading of funding for the endTB project in 2016, and the conclusion of funding for a TB Alliance project as the PDP’s paediatric fixed-dose combination gained WHO prequalification. Investment from other funders also decreased; the Gates Foundation fell slightly (down $7.6m, -7.4%) as did funding from USAID (down $4.4m, -27%) and the EC (down $4.1m, -20%).
In 2017, the largest share of TB R&D funding was provided by the public sector, accounting for two-thirds of all funding ($404m, 66%), with the remainder coming from the philanthropic ($109m, 18%) and private ($101m, 16%) sectors. The vast majority of public funding was contributed by HICs ($363m, 90%), with the rest coming from LMICs ($29m, 7.3%) and multilaterals ($12m, 3.0%). Most private sector investment was provided by MNCs ($86m, 86%).
Public investment in TB R&D saw the largest increase in 2017 (up $21m, 5.4%), driven by increased spending from both HICs (up $37m, 11%) and LMICs (up $5.7m, 24%), which together outweighed the decrease from multilaterals (down $22m, -65%). Industry investment also increased (up $5.0m, 5.2%), with this growth being entirely driven by increased SME investment (up $5.1m, 54%). Funding from the philanthropic sector was slightly lower (down $3.4m, -3.0%).
Public (HICs)59%
Public (multilaterals)2%
Public (LMICs)5%
Private (MNCs) 14%
Private (SMEs)2%
Philanthropic 18%
Figure 9. TB R&D funding by sector 2017
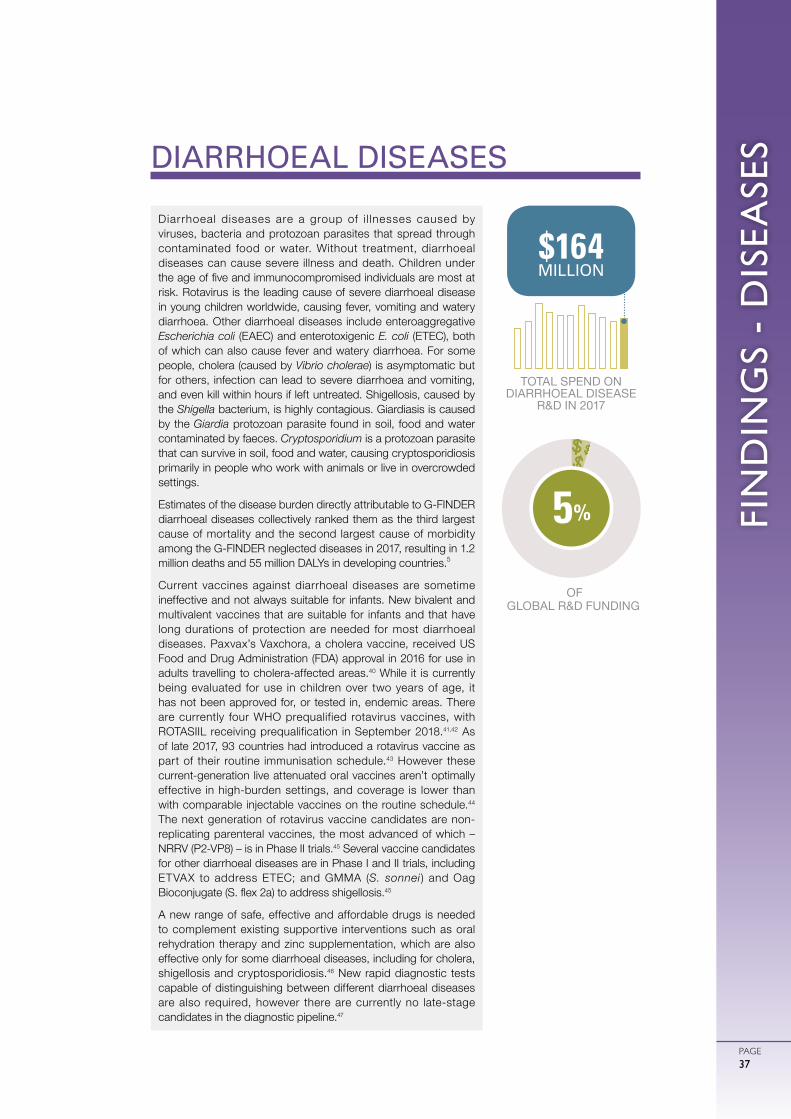
FIN
DIN
GS
- D
ISEA
SES
PAGE37
DIARRHOEAL DISEASES
Diarrhoeal diseases are a group of i l lnesses caused by viruses, bacteria and protozoan parasites that spread through contaminated food or water. Without treatment, diarrhoeal diseases can cause severe illness and death. Children under the age of five and immunocompromised individuals are most at risk. Rotavirus is the leading cause of severe diarrhoeal disease in young children worldwide, causing fever, vomiting and watery diarrhoea. Other diarrhoeal diseases include enteroaggregative Escherichia coli (EAEC) and enterotoxigenic E. coli (ETEC), both of which can also cause fever and watery diarrhoea. For some people, cholera (caused by Vibrio cholerae) is asymptomatic but for others, infection can lead to severe diarrhoea and vomiting, and even kill within hours if left untreated. Shigellosis, caused by the Shigella bacterium, is highly contagious. Giardiasis is caused by the Giardia protozoan parasite found in soil, food and water contaminated by faeces. Cryptosporidium is a protozoan parasite that can survive in soil, food and water, causing cryptosporidiosis primarily in people who work with animals or live in overcrowded settings.
Estimates of the disease burden directly attributable to G-FINDER diarrhoeal diseases collectively ranked them as the third largest cause of mortality and the second largest cause of morbidity among the G-FINDER neglected diseases in 2017, resulting in 1.2 million deaths and 55 million DALYs in developing countries.5
Current vaccines against diarrhoeal diseases are sometime ineffective and not always suitable for infants. New bivalent and multivalent vaccines that are suitable for infants and that have long durations of protection are needed for most diarrhoeal diseases. Paxvax’s Vaxchora, a cholera vaccine, received US Food and Drug Administration (FDA) approval in 2016 for use in adults travelling to cholera-affected areas.40 While it is currently being evaluated for use in children over two years of age, it has not been approved for, or tested in, endemic areas. There are currently four WHO prequalified rotavirus vaccines, with ROTASIIL receiving prequalification in September 2018.41,42 As of late 2017, 93 countries had introduced a rotavirus vaccine as part of their routine immunisation schedule.43 However these current-generation live attenuated oral vaccines aren’t optimally effective in high-burden settings, and coverage is lower than with comparable injectable vaccines on the routine schedule.44
The next generation of rotavirus vaccine candidates are non-replicating parenteral vaccines, the most advanced of which – NRRV (P2-VP8) – is in Phase II trials.45 Several vaccine candidates for other diarrhoeal diseases are in Phase I and II trials, including ETVAX to address ETEC; and GMMA (S. sonnei ) and Oag Bioconjugate (S. flex 2a) to address shigellosis.45
A new range of safe, effective and affordable drugs is needed to complement existing supportive interventions such as oral rehydration therapy and zinc supplementation, which are also effective only for some diarrhoeal diseases, including for cholera, shigellosis and cryptosporidiosis.46 New rapid diagnostic tests capable of distinguishing between different diarrhoeal diseases are also required, however there are currently no late-stage candidates in the diagnostic pipeline.47
TOTAL SPEND ON DIARRHOEAL DISEASE
R&D IN 2017
$164 MILLION
OF GLOBAL R&D FUNDING
32%5%
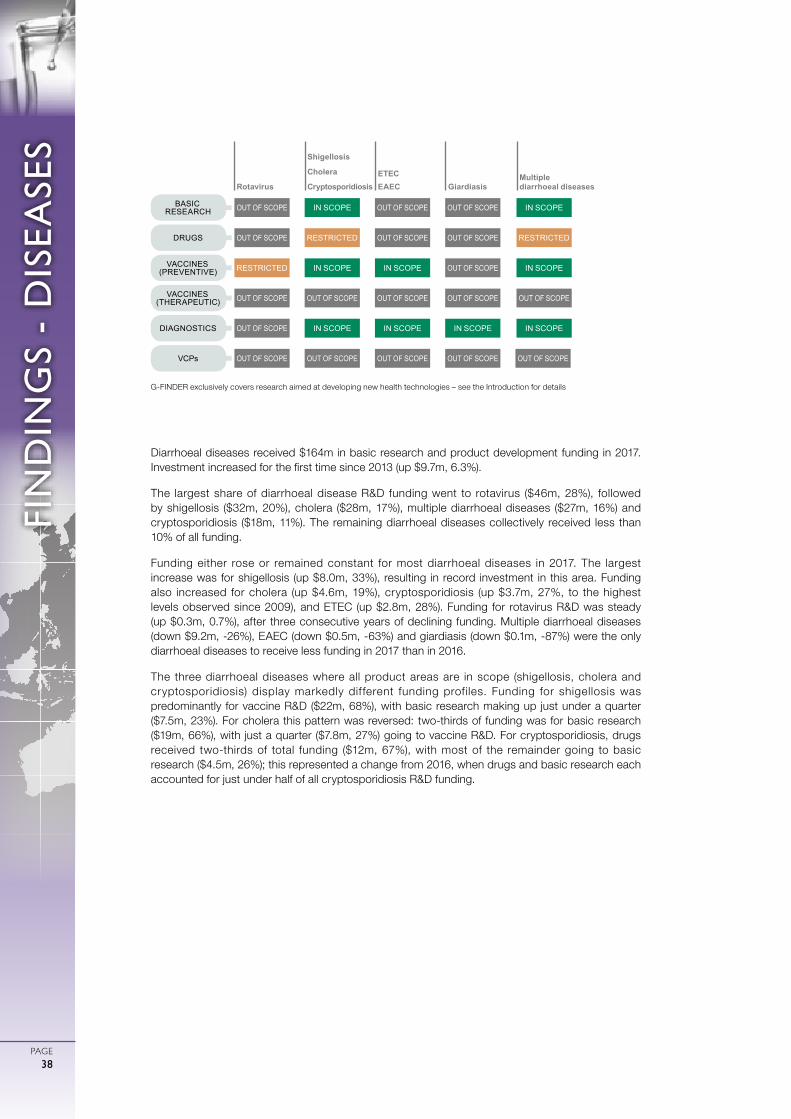
0
ガル図法(赤道縮尺) 1:47,000,000
1000 2000 3000 4000 5000km
75゜
60゜
45゜
30゜
15゜
0゜
15゜
30゜
45゜
60゜
75゜
90゜
180゜ 165゜ 150゜ 135゜ 120゜ 105゜ 90゜ 75゜ 60゜ 45゜ 30゜ 15゜ 15゜ 0゜ 165゜ 150゜ 135゜ 120゜ 105゜ 90゜ 75゜ 60゜ 45゜
FIN
DIN
GS
- D
ISEA
SES
PAGE38
Diarrhoeal diseases received $164m in basic research and product development funding in 2017. Investment increased for the first time since 2013 (up $9.7m, 6.3%).
The largest share of diarrhoeal disease R&D funding went to rotavirus ($46m, 28%), followed by shigellosis ($32m, 20%), cholera ($28m, 17%), multiple diarrhoeal diseases ($27m, 16%) and cryptosporidiosis ($18m, 11%). The remaining diarrhoeal diseases collectively received less than 10% of all funding.
Funding either rose or remained constant for most diarrhoeal diseases in 2017. The largest increase was for shigellosis (up $8.0m, 33%), resulting in record investment in this area. Funding also increased for cholera (up $4.6m, 19%), cryptosporidiosis (up $3.7m, 27%, to the highest levels observed since 2009), and ETEC (up $2.8m, 28%). Funding for rotavirus R&D was steady (up $0.3m, 0.7%), after three consecutive years of declining funding. Multiple diarrhoeal diseases (down $9.2m, -26%), EAEC (down $0.5m, -63%) and giardiasis (down $0.1m, -87%) were the only diarrhoeal diseases to receive less funding in 2017 than in 2016.
The three diarrhoeal diseases where all product areas are in scope (shigellosis, cholera and cryptosporidiosis) display markedly dif ferent funding profiles. Funding for shigellosis was predominantly for vaccine R&D ($22m, 68%), with basic research making up just under a quarter ($7.5m, 23%). For cholera this pattern was reversed: two-thirds of funding was for basic research ($19m, 66%), with just a quarter ($7.8m, 27%) going to vaccine R&D. For cryptosporidiosis, drugs received two-thirds of total funding ($12m, 67%), with most of the remainder going to basic research ($4.5m, 26%); this represented a change from 2016, when drugs and basic research each accounted for just under half of all cryptosporidiosis R&D funding.
RESTRICTED
RESTRICTED RESTRICTED
IN SCOPE
IN SCOPE
IN SCOPE IN SCOPE
IN SCOPE
IN SCOPE IN SCOPE IN SCOPE IN SCOPE
OUT OF SCOPE
OUT OF SCOPE
OUT OF SCOPE
OUT OF SCOPE
Rotavirus
Shigellosis
Cholera
CryptosporidiosisETECEAEC Giardiasis
Multiple diarrhoeal diseases
OUT OF SCOPE
OUT OF SCOPE
OUT OF SCOPE
OUT OF SCOPE
OUT OF SCOPE
OUT OF SCOPE
OUT OF SCOPE
OUT OF SCOPE OUT OF SCOPE
OUT OF SCOPE
OUT OF SCOPE
OUT OF SCOPE
OUT OF SCOPE
OUT OF SCOPE
BASIC RESEARCH
DRUGS
VACCINES (PREVENTIVE)
VACCINES (THERAPEUTIC)
DIAGNOSTICS
VCPs
G-FINDER exclusively covers research aimed at developing new health technologies – see the Introduction for details
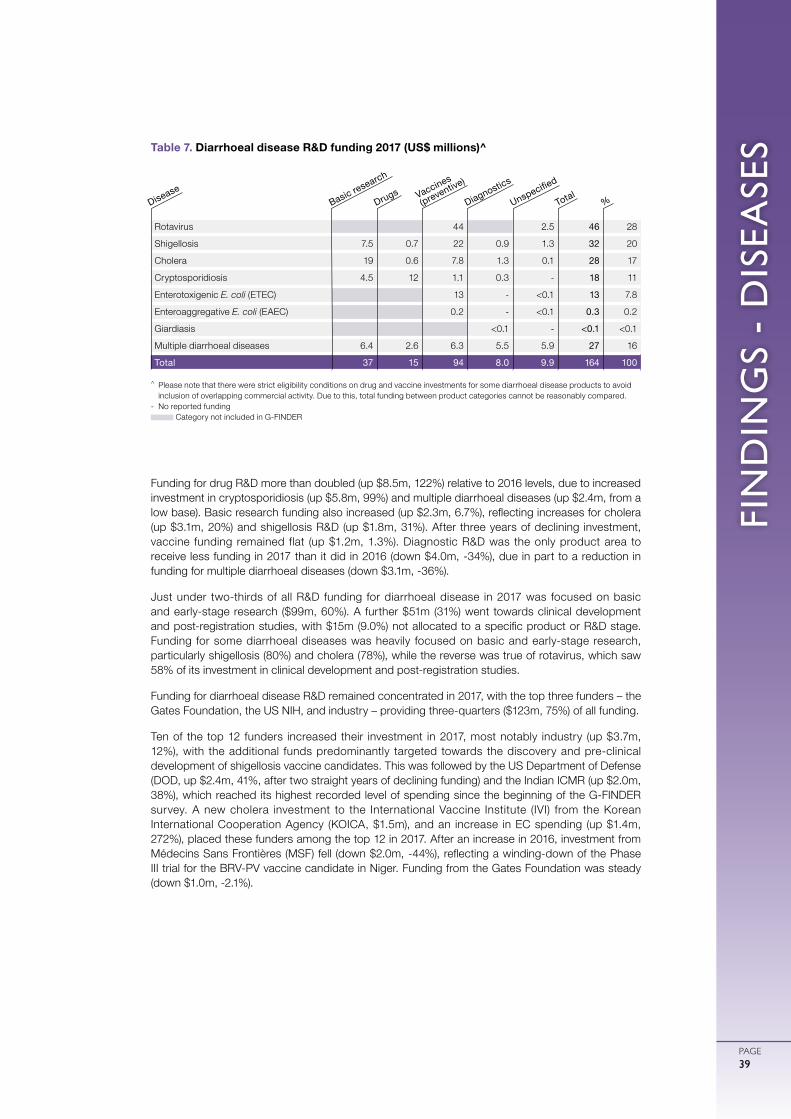
FIN
DIN
GS
- D
ISEA
SES
PAGE39
Funding for drug R&D more than doubled (up $8.5m, 122%) relative to 2016 levels, due to increased investment in cryptosporidiosis (up $5.8m, 99%) and multiple diarrhoeal diseases (up $2.4m, from a low base). Basic research funding also increased (up $2.3m, 6.7%), reflecting increases for cholera (up $3.1m, 20%) and shigellosis R&D (up $1.8m, 31%). After three years of declining investment, vaccine funding remained flat (up $1.2m, 1.3%). Diagnostic R&D was the only product area to receive less funding in 2017 than it did in 2016 (down $4.0m, -34%), due in part to a reduction in funding for multiple diarrhoeal diseases (down $3.1m, -36%).
Just under two-thirds of all R&D funding for diarrhoeal disease in 2017 was focused on basic and early-stage research ($99m, 60%). A further $51m (31%) went towards clinical development and post-registration studies, with $15m (9.0%) not allocated to a specific product or R&D stage. Funding for some diarrhoeal diseases was heavily focused on basic and early-stage research, particularly shigellosis (80%) and cholera (78%), while the reverse was true of rotavirus, which saw 58% of its investment in clinical development and post-registration studies.
Funding for diarrhoeal disease R&D remained concentrated in 2017, with the top three funders – the Gates Foundation, the US NIH, and industry – providing three-quarters ($123m, 75%) of all funding.
Ten of the top 12 funders increased their investment in 2017, most notably industry (up $3.7m, 12%), with the additional funds predominantly targeted towards the discovery and pre-clinical development of shigellosis vaccine candidates. This was followed by the US Department of Defense (DOD, up $2.4m, 41%, after two straight years of declining funding) and the Indian ICMR (up $2.0m, 38%), which reached its highest recorded level of spending since the beginning of the G-FINDER survey. A new cholera investment to the International Vaccine Institute (IVI) from the Korean International Cooperation Agency (KOICA, $1.5m), and an increase in EC spending (up $1.4m, 272%), placed these funders among the top 12 in 2017. After an increase in 2016, investment from Médecins Sans Frontières (MSF) fell (down $2.0m, -44%), reflecting a winding-down of the Phase III trial for the BRV-PV vaccine candidate in Niger. Funding from the Gates Foundation was steady (down $1.0m, -2.1%).
Rotavirus 44 2.5 46 28
Shigellosis 7.5 0.7 22 0.9 1.3 32 20
Cholera 19 0.6 7.8 1.3 0.1 28 17
Cryptosporidiosis 4.5 12 1.1 0.3 - 18 11
Enterotoxigenic E. coli (ETEC) 13 - <0.1 13 7.8
Enteroaggregative E. coli (EAEC) 0.2 - <0.1 0.3 0.2
Giardiasis <0.1 - <0.1 <0.1
Multiple diarrhoeal diseases 6.4 2.6 6.3 5.5 5.9 27 16
Total 37 15 94 8.0 9.9 164 100
Table 7. Diarrhoeal disease R&D funding 2017 (US$ millions)^
^ Please note that there were strict eligibility conditions on drug and vaccine investments for some diarrhoeal disease products to avoid inclusion of overlapping commercial activity. Due to this, total funding between product categories cannot be reasonably compared.
- No reported funding Category not included in G-FINDER
Basic research
DiseaseDrugs Vaccines
(preventive)
Diagnostics
Unspecified
Total%
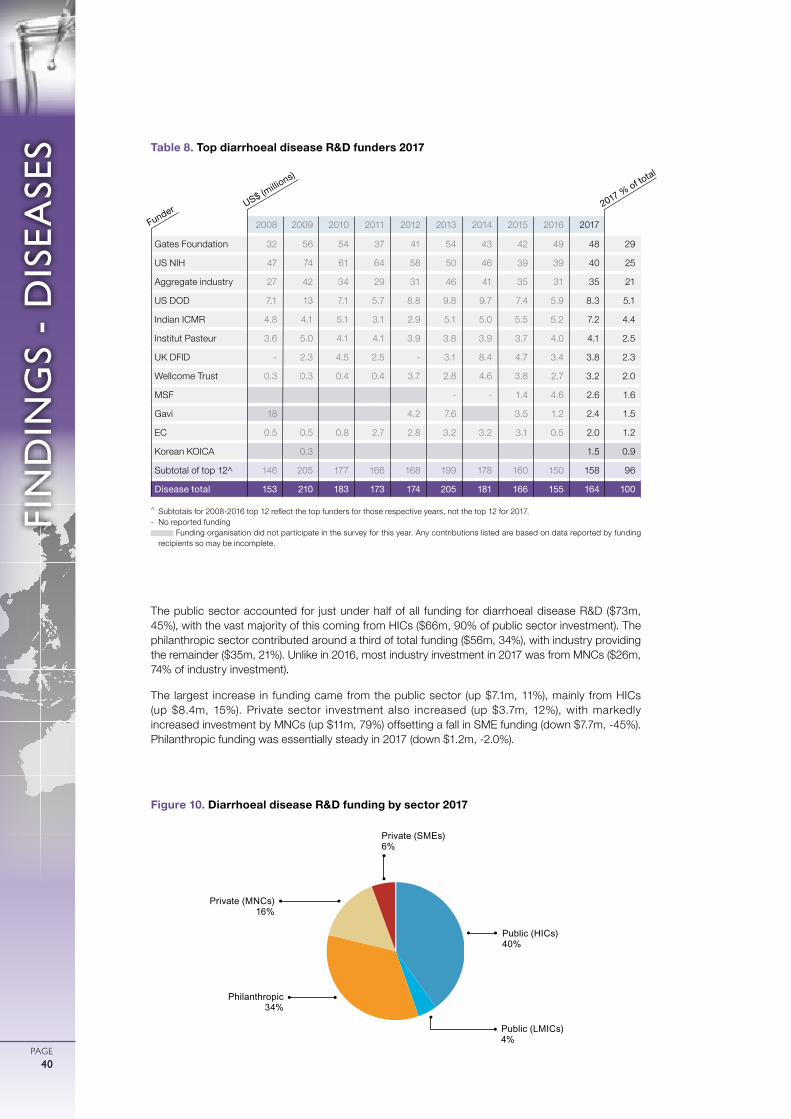
0
ガル図法(赤道縮尺) 1:47,000,000
1000 2000 3000 4000 5000km
75゜
60゜
45゜
30゜
15゜
0゜
15゜
30゜
45゜
60゜
75゜
90゜
180゜ 165゜ 150゜ 135゜ 120゜ 105゜ 90゜ 75゜ 60゜ 45゜ 30゜ 15゜ 15゜ 0゜ 165゜ 150゜ 135゜ 120゜ 105゜ 90゜ 75゜ 60゜ 45゜
FIN
DIN
GS
- D
ISEA
SES
PAGE40
The public sector accounted for just under half of all funding for diarrhoeal disease R&D ($73m, 45%), with the vast majority of this coming from HICs ($66m, 90% of public sector investment). The philanthropic sector contributed around a third of total funding ($56m, 34%), with industry providing the remainder ($35m, 21%). Unlike in 2016, most industry investment in 2017 was from MNCs ($26m, 74% of industry investment).
The largest increase in funding came from the public sector (up $7.1m, 11%), mainly from HICs (up $8.4m, 15%). Private sector investment also increased (up $3.7m, 12%), with markedly increased investment by MNCs (up $11m, 79%) offsetting a fall in SME funding (down $7.7m, -45%). Philanthropic funding was essentially steady in 2017 (down $1.2m, -2.0%).
Public (HICs)40%
Public (LMICs)4%
Private (MNCs) 16%
Private (SMEs)6%
Philanthropic 34%
Figure 10. Diarrhoeal disease R&D funding by sector 2017
2008 2009 2010 2011 2012 2013 2014 2015 2016 2017
Gates Foundation 32 56 54 37 41 54 43 42 49 48 29
US NIH 47 74 61 64 58 50 46 39 39 40 25
Aggregate industry 27 42 34 29 31 46 41 35 31 35 21
US DOD 7.1 13 7.1 5.7 8.8 9.8 9.7 7.4 5.9 8.3 5.1
Indian ICMR 4.8 4.1 5.1 3.1 2.9 5.1 5.0 5.5 5.2 7.2 4.4
Institut Pasteur 3.6 5.0 4.1 4.1 3.9 3.8 3.9 3.7 4.0 4.1 2.5
UK DFID - 2.3 4.5 2.5 - 3.1 8.4 4.7 3.4 3.8 2.3
Wellcome Trust 0.3 0.3 0.4 0.4 3.7 2.8 4.6 3.8 2.7 3.2 2.0
MSF - - 1.4 4.6 2.6 1.6
Gavi 18 4.2 7.6 3.5 1.2 2.4 1.5
EC 0.5 0.5 0.8 2.7 2.8 3.2 3.2 3.1 0.5 2.0 1.2
Korean KOICA 0.3 1.5 0.9
Subtotal of top 12^ 146 205 177 166 168 199 178 160 150 158 96
Disease total 153 210 183 173 174 205 181 166 155 164 100
Table 8. Top diarrhoeal disease R&D funders 2017
^ Subtotals for 2008-2016 top 12 reflect the top funders for those respective years, not the top 12 for 2017.- No reported funding
Funding organisation did not participate in the survey for this year. Any contributions listed are based on data reported by funding recipients so may be incomplete.
US$ (millio
ns)
Funder 2017 % of total
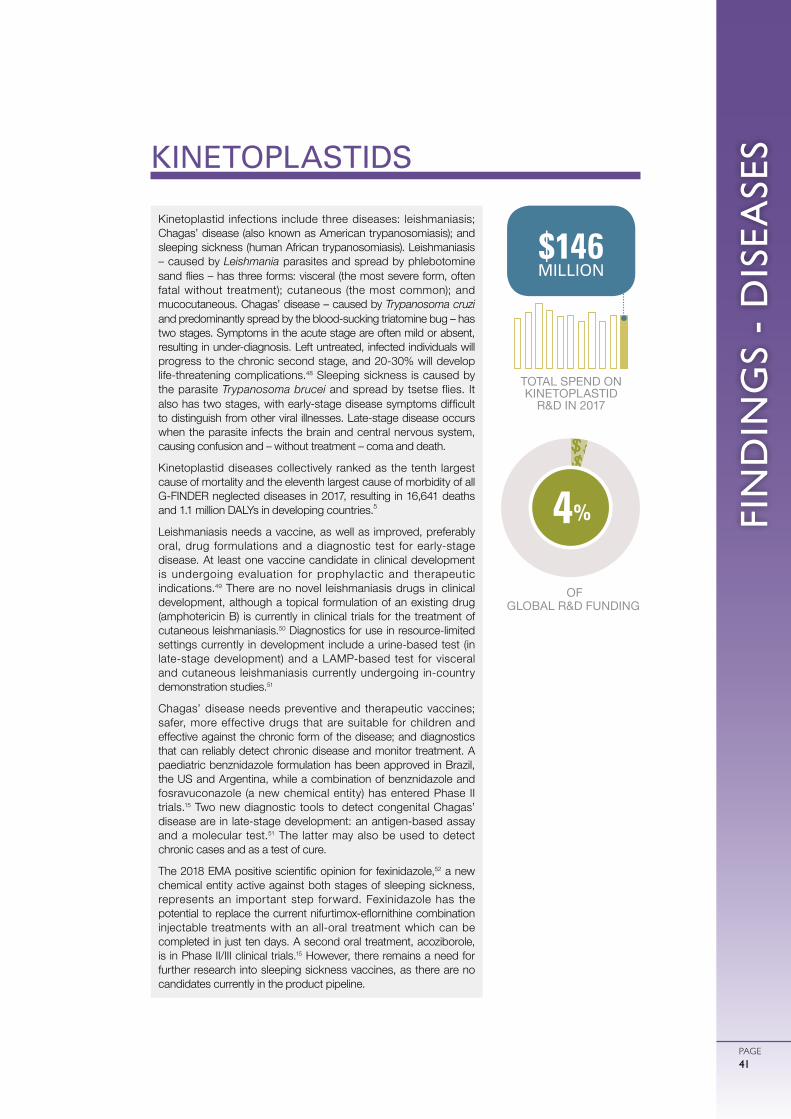
FIN
DIN
GS
- D
ISEA
SES
PAGE41
KINETOPLASTIDS
Kinetoplastid infections include three diseases: leishmaniasis; Chagas’ disease (also known as American trypanosomiasis); and sleeping sickness (human African trypanosomiasis). Leishmaniasis – caused by Leishmania parasites and spread by phlebotomine sand flies – has three forms: visceral (the most severe form, often fatal without treatment); cutaneous (the most common); and mucocutaneous. Chagas’ disease – caused by Trypanosoma cruzi and predominantly spread by the blood-sucking triatomine bug – has two stages. Symptoms in the acute stage are often mild or absent, resulting in under-diagnosis. Left untreated, infected individuals will progress to the chronic second stage, and 20-30% will develop life-threatening complications.48 Sleeping sickness is caused by the parasite Trypanosoma brucei and spread by tsetse flies. It also has two stages, with early-stage disease symptoms difficult to distinguish from other viral illnesses. Late-stage disease occurs when the parasite infects the brain and central nervous system, causing confusion and – without treatment – coma and death.
Kinetoplastid diseases collectively ranked as the tenth largest cause of mortality and the eleventh largest cause of morbidity of all G-FINDER neglected diseases in 2017, resulting in 16,641 deaths and 1.1 million DALYs in developing countries.5
Leishmaniasis needs a vaccine, as well as improved, preferably oral, drug formulations and a diagnostic test for early-stage disease. At least one vaccine candidate in clinical development is undergoing evaluation for prophylactic and therapeutic indications.49 There are no novel leishmaniasis drugs in clinical development, although a topical formulation of an existing drug (amphotericin B) is currently in clinical trials for the treatment of cutaneous leishmaniasis.50 Diagnostics for use in resource-limited settings currently in development include a urine-based test (in late-stage development) and a LAMP-based test for visceral and cutaneous leishmaniasis currently undergoing in-country demonstration studies.51
Chagas’ disease needs preventive and therapeutic vaccines; safer, more effective drugs that are suitable for children and effective against the chronic form of the disease; and diagnostics that can reliably detect chronic disease and monitor treatment. A paediatric benznidazole formulation has been approved in Brazil, the US and Argentina, while a combination of benznidazole and fosravuconazole (a new chemical entity) has entered Phase II trials.15 Two new diagnostic tools to detect congenital Chagas’ disease are in late-stage development: an antigen-based assay and a molecular test.51 The latter may also be used to detect chronic cases and as a test of cure.
The 2018 EMA positive scientific opinion for fexinidazole,52 a new chemical entity active against both stages of sleeping sickness, represents an important step forward. Fexinidazole has the potential to replace the current nifurtimox-eflornithine combination injectable treatments with an all-oral treatment which can be completed in just ten days. A second oral treatment, acoziborole, is in Phase II/III clinical trials.15 However, there remains a need for further research into sleeping sickness vaccines, as there are no candidates currently in the product pipeline.
TOTAL SPEND ON KINETOPLASTID
R&D IN 2017
$146 MILLION
OF GLOBAL R&D FUNDING
32%4%
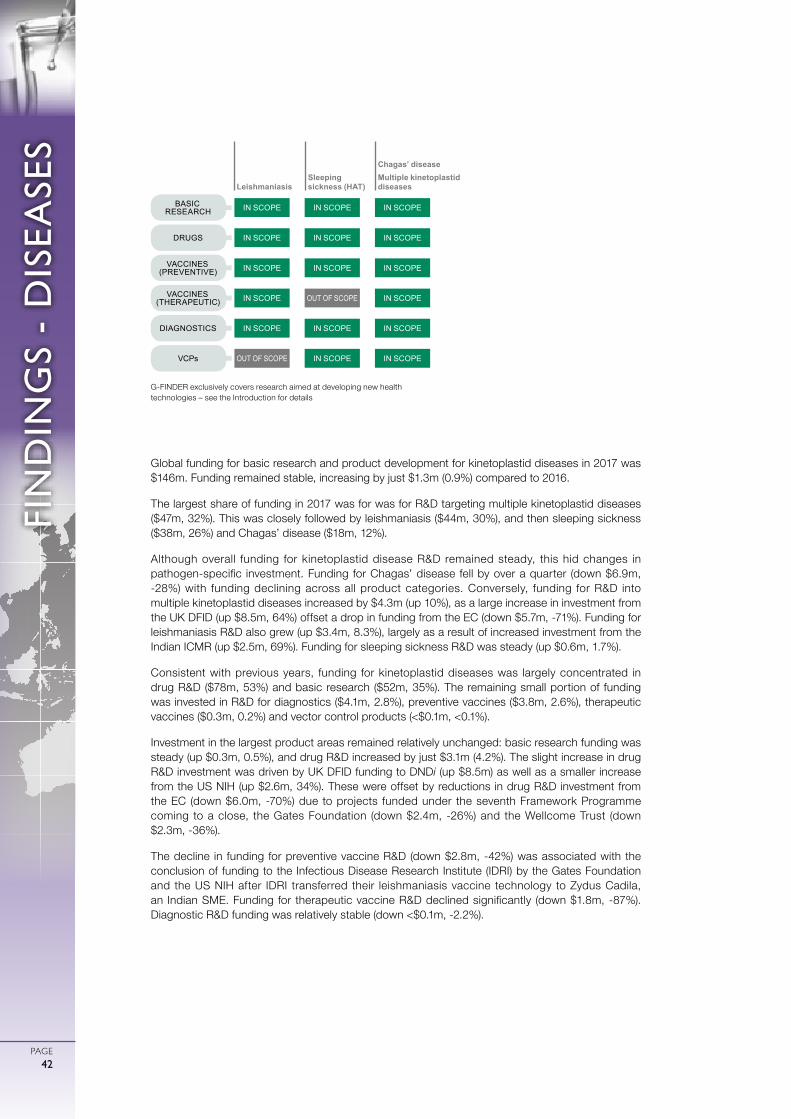
0
ガル図法(赤道縮尺) 1:47,000,000
1000 2000 3000 4000 5000km
75゜
60゜
45゜
30゜
15゜
0゜
15゜
30゜
45゜
60゜
75゜
90゜
180゜ 165゜ 150゜ 135゜ 120゜ 105゜ 90゜ 75゜ 60゜ 45゜ 30゜ 15゜ 15゜ 0゜ 165゜ 150゜ 135゜ 120゜ 105゜ 90゜ 75゜ 60゜ 45゜
FIN
DIN
GS
- D
ISEA
SES
PAGE42
Global funding for basic research and product development for kinetoplastid diseases in 2017 was $146m. Funding remained stable, increasing by just $1.3m (0.9%) compared to 2016.
The largest share of funding in 2017 was for was for R&D targeting multiple kinetoplastid diseases ($47m, 32%). This was closely followed by leishmaniasis ($44m, 30%), and then sleeping sickness ($38m, 26%) and Chagas’ disease ($18m, 12%).
Although overall funding for kinetoplastid disease R&D remained steady, this hid changes in pathogen-specific investment. Funding for Chagas’ disease fell by over a quarter (down $6.9m, -28%) with funding declining across all product categories. Conversely, funding for R&D into multiple kinetoplastid diseases increased by $4.3m (up 10%), as a large increase in investment from the UK DFID (up $8.5m, 64%) offset a drop in funding from the EC (down $5.7m, -71%). Funding for leishmaniasis R&D also grew (up $3.4m, 8.3%), largely as a result of increased investment from the Indian ICMR (up $2.5m, 69%). Funding for sleeping sickness R&D was steady (up $0.6m, 1.7%).
Consistent with previous years, funding for kinetoplastid diseases was largely concentrated in drug R&D ($78m, 53%) and basic research ($52m, 35%). The remaining small portion of funding was invested in R&D for diagnostics ($4.1m, 2.8%), preventive vaccines ($3.8m, 2.6%), therapeutic vaccines ($0.3m, 0.2%) and vector control products (<$0.1m, <0.1%).
Investment in the largest product areas remained relatively unchanged: basic research funding was steady (up $0.3m, 0.5%), and drug R&D increased by just $3.1m (4.2%). The slight increase in drug R&D investment was driven by UK DFID funding to DNDi (up $8.5m) as well as a smaller increase from the US NIH (up $2.6m, 34%). These were offset by reductions in drug R&D investment from the EC (down $6.0m, -70%) due to projects funded under the seventh Framework Programme coming to a close, the Gates Foundation (down $2.4m, -26%) and the Wellcome Trust (down $2.3m, -36%).
The decline in funding for preventive vaccine R&D (down $2.8m, -42%) was associated with the conclusion of funding to the Infectious Disease Research Institute (IDRI) by the Gates Foundation and the US NIH after IDRI transferred their leishmaniasis vaccine technology to Zydus Cadila, an Indian SME. Funding for therapeutic vaccine R&D declined significantly (down $1.8m, -87%). Diagnostic R&D funding was relatively stable (down <$0.1m, -2.2%).
IN SCOPE
IN SCOPE
IN SCOPE
IN SCOPE
IN SCOPE
IN SCOPE IN SCOPE
OUT OF SCOPE
IN SCOPE
IN SCOPE
IN SCOPE
LeishmaniasisSleeping sickness (HAT)
Chagas’ diseaseMultiple kinetoplastid diseases
IN SCOPE
IN SCOPE
OUT OF SCOPE
IN SCOPE
IN SCOPE
IN SCOPE
IN SCOPE
BASIC RESEARCH
DRUGS
VACCINES (PREVENTIVE)
VACCINES (THERAPEUTIC)
DIAGNOSTICS
VCPs
G-FINDER exclusively covers research aimed at developing new health technologies – see the Introduction for details
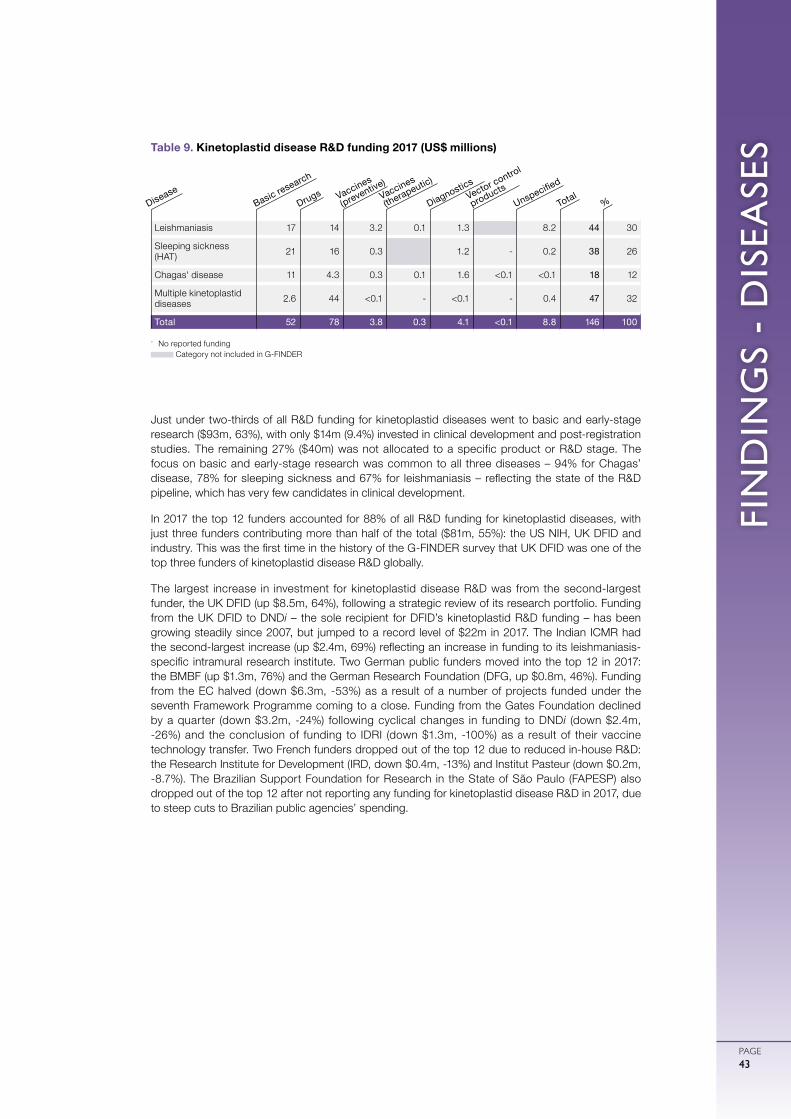
FIN
DIN
GS
- D
ISEA
SES
PAGE43
Just under two-thirds of all R&D funding for kinetoplastid diseases went to basic and early-stage research ($93m, 63%), with only $14m (9.4%) invested in clinical development and post-registration studies. The remaining 27% ($40m) was not allocated to a specific product or R&D stage. The focus on basic and early-stage research was common to all three diseases – 94% for Chagas’ disease, 78% for sleeping sickness and 67% for leishmaniasis – reflecting the state of the R&D pipeline, which has very few candidates in clinical development.
In 2017 the top 12 funders accounted for 88% of all R&D funding for kinetoplastid diseases, with just three funders contributing more than half of the total ($81m, 55%): the US NIH, UK DFID and industry. This was the first time in the history of the G-FINDER survey that UK DFID was one of the top three funders of kinetoplastid disease R&D globally.
The largest increase in investment for kinetoplastid disease R&D was from the second-largest funder, the UK DFID (up $8.5m, 64%), following a strategic review of its research portfolio. Funding from the UK DFID to DNDi – the sole recipient for DFID’s kinetoplastid R&D funding – has been growing steadily since 2007, but jumped to a record level of $22m in 2017. The Indian ICMR had the second-largest increase (up $2.4m, 69%) reflecting an increase in funding to its leishmaniasis-specific intramural research institute. Two German public funders moved into the top 12 in 2017: the BMBF (up $1.3m, 76%) and the German Research Foundation (DFG, up $0.8m, 46%). Funding from the EC halved (down $6.3m, -53%) as a result of a number of projects funded under the seventh Framework Programme coming to a close. Funding from the Gates Foundation declined by a quarter (down $3.2m, -24%) following cyclical changes in funding to DNDi (down $2.4m, -26%) and the conclusion of funding to IDRI (down $1.3m, -100%) as a result of their vaccine technology transfer. Two French funders dropped out of the top 12 due to reduced in-house R&D: the Research Institute for Development (IRD, down $0.4m, -13%) and Institut Pasteur (down $0.2m, -8.7%). The Brazilian Support Foundation for Research in the State of São Paulo (FAPESP) also dropped out of the top 12 after not reporting any funding for kinetoplastid disease R&D in 2017, due to steep cuts to Brazilian public agencies’ spending.
Leishmaniasis 17 14 3.2 0.1 1.3 8.2 44 30
Sleeping sickness (HAT) 21 16 0.3 1.2 - 0.2 38 26
Chagas' disease 11 4.3 0.3 0.1 1.6 <0.1 <0.1 18 12
Multiple kinetoplastid diseases 2.6 44 <0.1 - <0.1 - 0.4 47 32
Total 52 78 3.8 0.3 4.1 <0.1 8.8 146 100
Table 9. Kinetoplastid disease R&D funding 2017 (US$ millions)
- No reported funding Category not included in G-FINDER
Basic research
DiseaseDrugs Vaccines
(preventive)Vaccines
(therapeutic)
DiagnosticsVector control
products
Unspecified
Total%
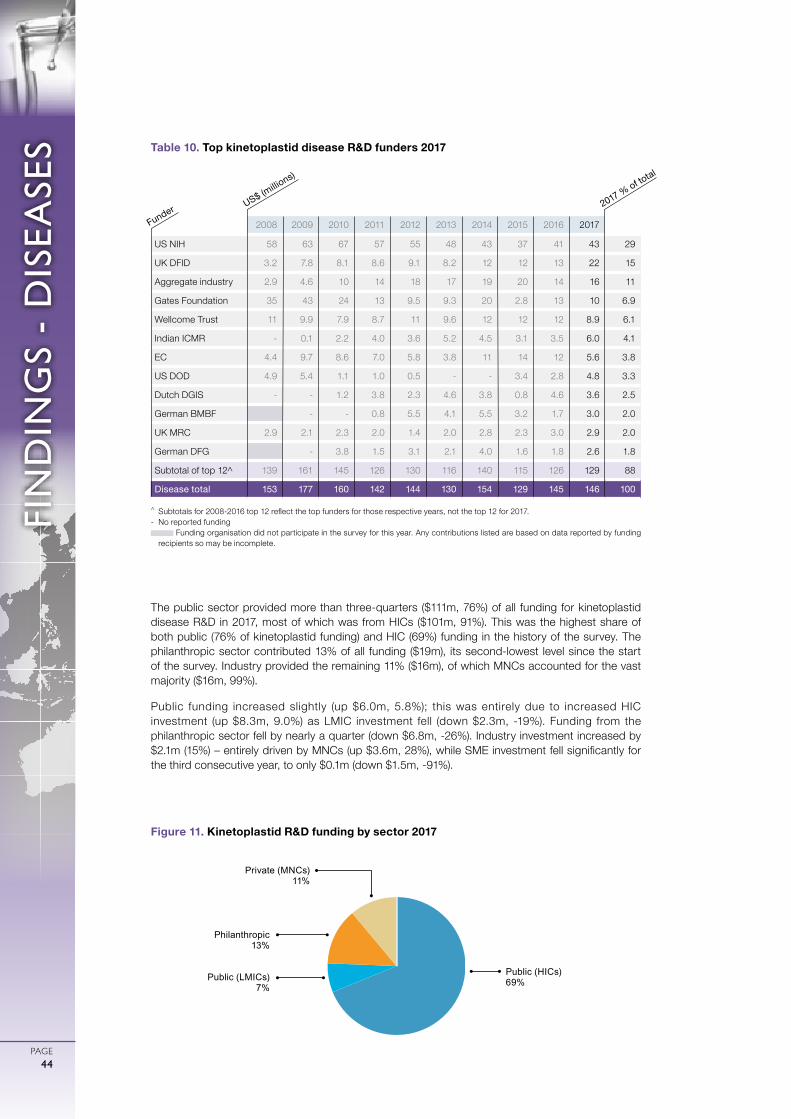
0
ガル図法(赤道縮尺) 1:47,000,000
1000 2000 3000 4000 5000km
75゜
60゜
45゜
30゜
15゜
0゜
15゜
30゜
45゜
60゜
75゜
90゜
180゜ 165゜ 150゜ 135゜ 120゜ 105゜ 90゜ 75゜ 60゜ 45゜ 30゜ 15゜ 15゜ 0゜ 165゜ 150゜ 135゜ 120゜ 105゜ 90゜ 75゜ 60゜ 45゜
FIN
DIN
GS
- D
ISEA
SES
PAGE44
The public sector provided more than three-quarters ($111m, 76%) of all funding for kinetoplastid disease R&D in 2017, most of which was from HICs ($101m, 91%). This was the highest share of both public (76% of kinetoplastid funding) and HIC (69%) funding in the history of the survey. The philanthropic sector contributed 13% of all funding ($19m), its second-lowest level since the start of the survey. Industry provided the remaining 11% ($16m), of which MNCs accounted for the vast majority ($16m, 99%).
Public funding increased slightly (up $6.0m, 5.8%); this was entirely due to increased HIC investment (up $8.3m, 9.0%) as LMIC investment fell (down $2.3m, -19%). Funding from the philanthropic sector fell by nearly a quarter (down $6.8m, -26%). Industry investment increased by $2.1m (15%) – entirely driven by MNCs (up $3.6m, 28%), while SME investment fell significantly for the third consecutive year, to only $0.1m (down $1.5m, -91%).
Public (HICs)69%
Philanthropic13%
Private (MNCs) 11%
Public (LMICs)7%
Figure 11. Kinetoplastid R&D funding by sector 2017
2008 2009 2010 2011 2012 2013 2014 2015 2016 2017
US NIH 58 63 67 57 55 48 43 37 41 43 29
UK DFID 3.2 7.8 8.1 8.6 9.1 8.2 12 12 13 22 15
Aggregate industry 2.9 4.6 10 14 18 17 19 20 14 16 11
Gates Foundation 35 43 24 13 9.5 9.3 20 2.8 13 10 6.9
Wellcome Trust 11 9.9 7.9 8.7 11 9.6 12 12 12 8.9 6.1
Indian ICMR - 0.1 2.2 4.0 3.6 5.2 4.5 3.1 3.5 6.0 4.1
EC 4.4 9.7 8.6 7.0 5.8 3.8 11 14 12 5.6 3.8
US DOD 4.9 5.4 1.1 1.0 0.5 - - 3.4 2.8 4.8 3.3
Dutch DGIS - - 1.2 3.8 2.3 4.6 3.8 0.8 4.6 3.6 2.5
German BMBF - - 0.8 5.5 4.1 5.5 3.2 1.7 3.0 2.0
UK MRC 2.9 2.1 2.3 2.0 1.4 2.0 2.8 2.3 3.0 2.9 2.0
German DFG - 3.8 1.5 3.1 2.1 4.0 1.6 1.8 2.6 1.8
Subtotal of top 12^ 139 161 145 126 130 116 140 115 126 129 88
Disease total 153 177 160 142 144 130 154 129 145 146 100
Table 10. Top kinetoplastid disease R&D funders 2017
^ Subtotals for 2008-2016 top 12 reflect the top funders for those respective years, not the top 12 for 2017.- No reported funding
Funding organisation did not participate in the survey for this year. Any contributions listed are based on data reported by funding recipients so may be incomplete.
US$ (millio
ns)
Funder 2017 % of total

FIN
DIN
GS
- D
ISEA
SES
PAGE45
Helminths are parasitic worms and flukes that can cause disease in humans. The most common mode of transmission to humans is through ingesting or coming into contact with contaminated food, water, or soil. Helminth infections transmitted in this manner include ancylostomiasis and necatoriasis (hookworm), ascariasis (roundworm), trichuriasis (whipworm) and strongyloidiasis (intestinal roundworms) – collectively referred to as soil-transmitted helminths – as well as taeniasis/cysticercosis (tapeworm) and schistosomiasis (bilharziasis, also known as snail fever). Other helminth infections are transmitted by bites of blood-sucking arthropods: these include lymphatic filariasis, which is transmitted by mosquitoes, and river blindness (onchocerciasis), which is transmitted by the black fly.Adult worms can reside in the intestines and other organs, causing malnutrition and impaired cognitive development (hookworms), or progressive damage to the bladder, ureter and kidneys (schistosomiasis). Onchocerciasis is a major cause of blindness in many African and some Latin American countries, while lymphatic filariasis can cause painful, disfiguring swelling of the scrotum (hydrocele) and limbs (elephantiasis).Helminth infections were the eleventh largest cause of mortality and the ninth largest cause of morbidity among G-FINDER neglected diseases in 2017, leading to 12,765 deaths and 7.5 million DALYs in developing countries.5 With no vaccines, disease control efforts rely on mass-drug administration.73 Variable drug efficacy and the need to control transmission mean that treatment programmes must continue for many years, increasing the risk of drug resistance.74 New and more effective drugs are needed for many helminth infections, as are paediatric formulations of existing drugs. Current diagnostic products for detection of some helminths are outdated or complex; new and effective diagnostics that can measure infection intensity and detect drug resistance are needed.74
In 2018, the US FDA approved moxidectin, the first new onchocerciasis treatment in 20 years. Candidates in clinical development include an orodispersible praziquantel tablet for schistosomiasis in children (Phase II) and ABBV-4083 for filarial diseases (Phase I). Among the schistosomiasis vaccines in development is Sm14, which has completed a Phase IIa trial.43,75 Two candidate vaccines against human hookworm infection are in clinical development. Na-GST 1 – the most advanced candidate – entered 2018 Phase II trials using a controlled human hookworm infection model.43 All of the current vaccine candidates against onchocerciasis are in pre-clinical development.76 There are several diagnostic tests in development for helminth infections, including the Ov16/Wb123 biplex rapid test – a dual detection point-of-care test for onchocerciasis and lymphatic filariasis currently in field evaluation78 – and the UCP-LF CAA assay to diagnose schistosomiasis in low-prevalence settings, which is in clinical development.79 Diagnostic R&D for tapeworm was included in the G-FINDER scope for the first time this year, as consensus shows that the currently available tools are insufficient to achieve control and elimination.80
HELMINTH INFECTIONS (WORMS AND FLUKES)
TOTAL SPEND ON HELMINTH
R&D IN 2017
$89.2 MILLION
OF GLOBAL R&D FUNDING
32%3%
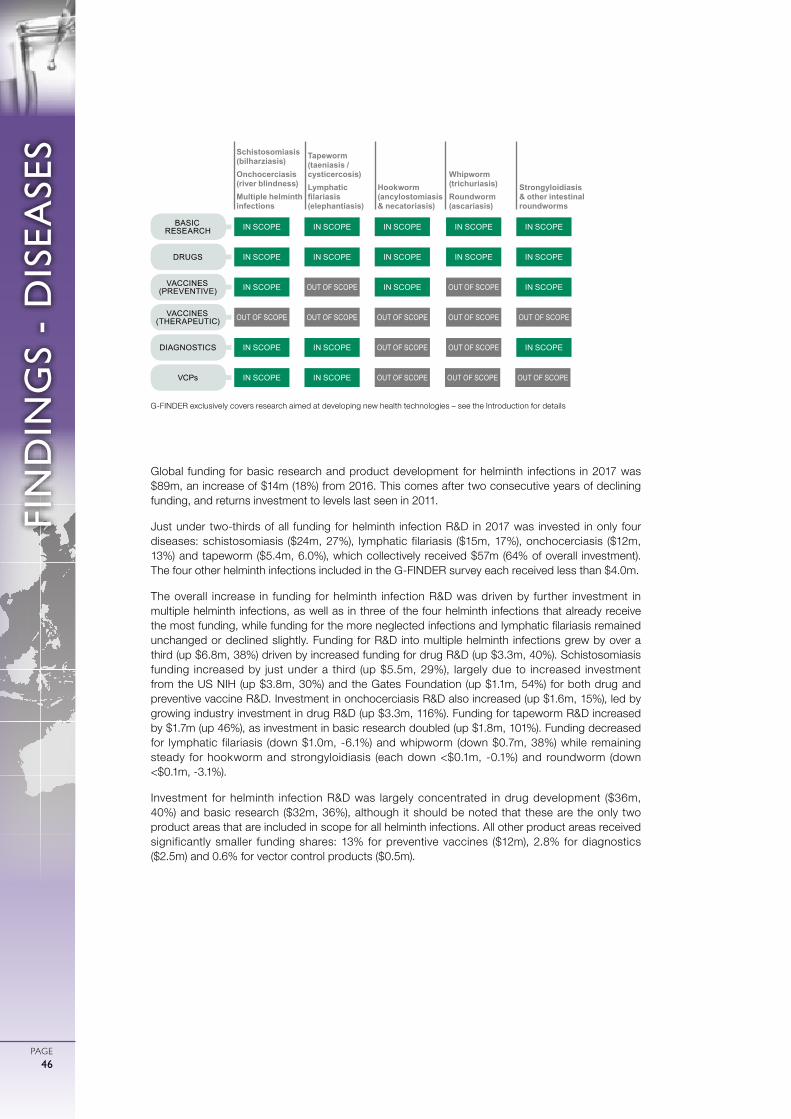
0
ガル図法(赤道縮尺) 1:47,000,000
1000 2000 3000 4000 5000km
75゜
60゜
45゜
30゜
15゜
0゜
15゜
30゜
45゜
60゜
75゜
90゜
180゜ 165゜ 150゜ 135゜ 120゜ 105゜ 90゜ 75゜ 60゜ 45゜ 30゜ 15゜ 15゜ 0゜ 165゜ 150゜ 135゜ 120゜ 105゜ 90゜ 75゜ 60゜ 45゜
FIN
DIN
GS
- D
ISEA
SES
PAGE46
Global funding for basic research and product development for helminth infections in 2017 was $89m, an increase of $14m (18%) from 2016. This comes after two consecutive years of declining funding, and returns investment to levels last seen in 2011.
Just under two-thirds of all funding for helminth infection R&D in 2017 was invested in only four diseases: schistosomiasis ($24m, 27%), lymphatic filariasis ($15m, 17%), onchocerciasis ($12m, 13%) and tapeworm ($5.4m, 6.0%), which collectively received $57m (64% of overall investment). The four other helminth infections included in the G-FINDER survey each received less than $4.0m.
The overall increase in funding for helminth infection R&D was driven by further investment in multiple helminth infections, as well as in three of the four helminth infections that already receive the most funding, while funding for the more neglected infections and lymphatic filariasis remained unchanged or declined slightly. Funding for R&D into multiple helminth infections grew by over a third (up $6.8m, 38%) driven by increased funding for drug R&D (up $3.3m, 40%). Schistosomiasis funding increased by just under a third (up $5.5m, 29%), largely due to increased investment from the US NIH (up $3.8m, 30%) and the Gates Foundation (up $1.1m, 54%) for both drug and preventive vaccine R&D. Investment in onchocerciasis R&D also increased (up $1.6m, 15%), led by growing industry investment in drug R&D (up $3.3m, 116%). Funding for tapeworm R&D increased by $1.7m (up 46%), as investment in basic research doubled (up $1.8m, 101%). Funding decreased for lymphatic filariasis (down $1.0m, -6.1%) and whipworm (down $0.7m, 38%) while remaining steady for hookworm and strongyloidiasis (each down <$0.1m, -0.1%) and roundworm (down <$0.1m, -3.1%).
Investment for helminth infection R&D was largely concentrated in drug development ($36m, 40%) and basic research ($32m, 36%), although it should be noted that these are the only two product areas that are included in scope for all helminth infections. All other product areas received significantly smaller funding shares: 13% for preventive vaccines ($12m), 2.8% for diagnostics ($2.5m) and 0.6% for vector control products ($0.5m).
IN SCOPE
IN SCOPE IN SCOPE IN SCOPE
OUT OF SCOPE
IN SCOPE
IN SCOPE OUT OF SCOPE IN SCOPE
IN SCOPE IN SCOPE
IN SCOPE OUT OF SCOPE OUT OF SCOPE IN SCOPE
IN SCOPE
OUT OF SCOPE
IN SCOPE
IN SCOPE
Schistosomiasis (bilharziasis)Onchocerciasis (river blindness)Multiple helminth infections
Tapeworm (taeniasis /cysticercosis)Lymphatic filariasis (elephantiasis)
Hookworm (ancylostomiasis & necatoriasis)
Whipworm (trichuriasis)Roundworm (ascariasis)
Strongyloidiasis & other intestinal roundworms
IN SCOPE
IN SCOPE
OUT OF SCOPE
OUT OF SCOPE
OUT OF SCOPE
IN SCOPE
IN SCOPE
OUT OF SCOPE OUT OF SCOPE
OUT OF SCOPE OUT OF SCOPE
BASIC RESEARCH
DRUGS
VACCINES (PREVENTIVE)
VACCINES (THERAPEUTIC)
DIAGNOSTICS
VCPs
G-FINDER exclusively covers research aimed at developing new health technologies – see the Introduction for details
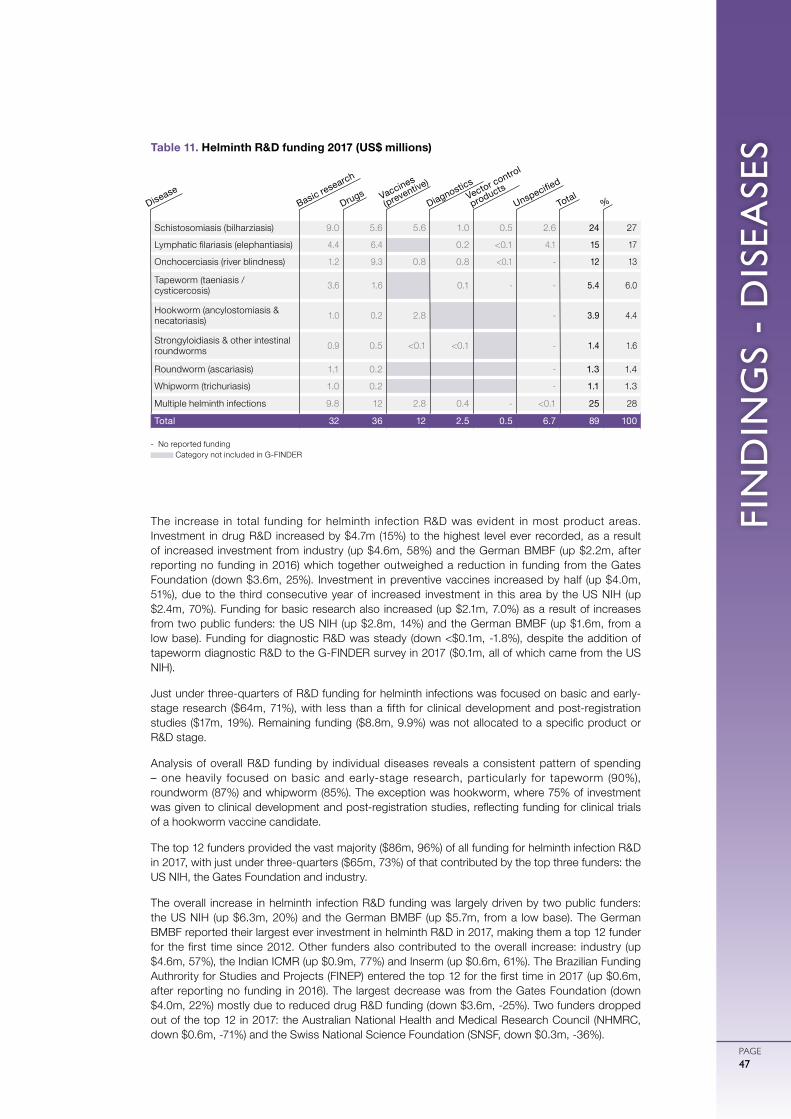
FIN
DIN
GS
- D
ISEA
SES
PAGE47
The increase in total funding for helminth infection R&D was evident in most product areas. Investment in drug R&D increased by $4.7m (15%) to the highest level ever recorded, as a result of increased investment from industry (up $4.6m, 58%) and the German BMBF (up $2.2m, after reporting no funding in 2016) which together outweighed a reduction in funding from the Gates Foundation (down $3.6m, 25%). Investment in preventive vaccines increased by half (up $4.0m, 51%), due to the third consecutive year of increased investment in this area by the US NIH (up $2.4m, 70%). Funding for basic research also increased (up $2.1m, 7.0%) as a result of increases from two public funders: the US NIH (up $2.8m, 14%) and the German BMBF (up $1.6m, from a low base). Funding for diagnostic R&D was steady (down <$0.1m, -1.8%), despite the addition of tapeworm diagnostic R&D to the G-FINDER survey in 2017 ($0.1m, all of which came from the US NIH).
Just under three-quarters of R&D funding for helminth infections was focused on basic and early-stage research ($64m, 71%), with less than a fifth for clinical development and post-registration studies ($17m, 19%). Remaining funding ($8.8m, 9.9%) was not allocated to a specific product or R&D stage.
Analysis of overall R&D funding by individual diseases reveals a consistent pattern of spending – one heavily focused on basic and early-stage research, particularly for tapeworm (90%), roundworm (87%) and whipworm (85%). The exception was hookworm, where 75% of investment was given to clinical development and post-registration studies, reflecting funding for clinical trials of a hookworm vaccine candidate.
The top 12 funders provided the vast majority ($86m, 96%) of all funding for helminth infection R&D in 2017, with just under three-quarters ($65m, 73%) of that contributed by the top three funders: the US NIH, the Gates Foundation and industry.
The overall increase in helminth infection R&D funding was largely driven by two public funders: the US NIH (up $6.3m, 20%) and the German BMBF (up $5.7m, from a low base). The German BMBF reported their largest ever investment in helminth R&D in 2017, making them a top 12 funder for the first time since 2012. Other funders also contributed to the overall increase: industry (up $4.6m, 57%), the Indian ICMR (up $0.9m, 77%) and Inserm (up $0.6m, 61%). The Brazilian Funding Authrority for Studies and Projects (FINEP) entered the top 12 for the first time in 2017 (up $0.6m, after reporting no funding in 2016). The largest decrease was from the Gates Foundation (down $4.0m, 22%) mostly due to reduced drug R&D funding (down $3.6m, -25%). Two funders dropped out of the top 12 in 2017: the Australian National Health and Medical Research Council (NHMRC, down $0.6m, -71%) and the Swiss National Science Foundation (SNSF, down $0.3m, -36%).
- No reported funding Category not included in G-FINDER
Schistosomiasis (bilharziasis) 9.0 5.6 5.6 1.0 0.5 2.6 24 27
Lymphatic filariasis (elephantiasis) 4.4 6.4 0.2 <0.1 4.1 15 17
Onchocerciasis (river blindness) 1.2 9.3 0.8 0.8 <0.1 - 12 13
Tapeworm (taeniasis / cysticercosis) 3.6 1.6 0.1 - - 5.4 6.0
Hookworm (ancylostomiasis & necatoriasis) 1.0 0.2 2.8 - 3.9 4.4
Strongyloidiasis & other intestinal roundworms 0.9 0.5 <0.1 <0.1 - 1.4 1.6
Roundworm (ascariasis) 1.1 0.2 - 1.3 1.4
Whipworm (trichuriasis) 1.0 0.2 - 1.1 1.3
Multiple helminth infections 9.8 12 2.8 0.4 - <0.1 25 28
Total 32 36 12 2.5 0.5 6.7 89 100
Basic research
DiseaseDrugs Vaccines
(preventive)
DiagnosticsVector control
productsUnspecified
Total%
Table 11. Helminth R&D funding 2017 (US$ millions)
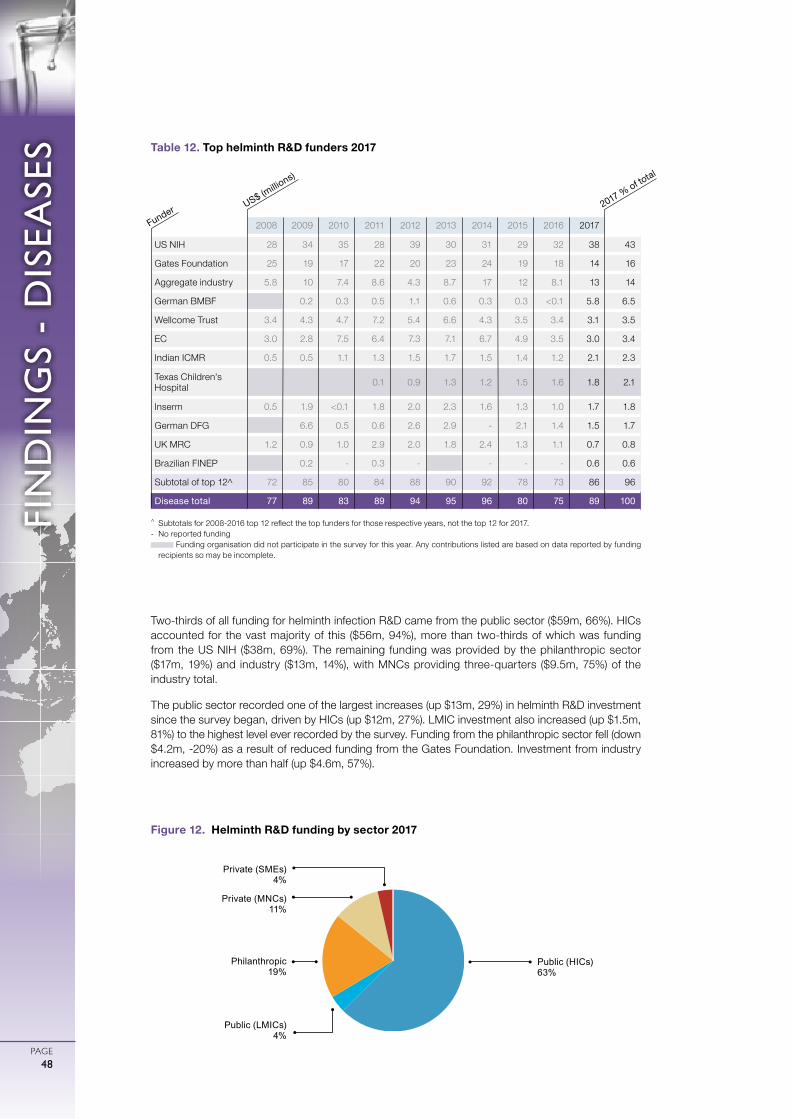
0
ガル図法(赤道縮尺) 1:47,000,000
1000 2000 3000 4000 5000km
75゜
60゜
45゜
30゜
15゜
0゜
15゜
30゜
45゜
60゜
75゜
90゜
180゜ 165゜ 150゜ 135゜ 120゜ 105゜ 90゜ 75゜ 60゜ 45゜ 30゜ 15゜ 15゜ 0゜ 165゜ 150゜ 135゜ 120゜ 105゜ 90゜ 75゜ 60゜ 45゜
FIN
DIN
GS
- D
ISEA
SES
PAGE48
Two-thirds of all funding for helminth infection R&D came from the public sector ($59m, 66%). HICs accounted for the vast majority of this ($56m, 94%), more than two-thirds of which was funding from the US NIH ($38m, 69%). The remaining funding was provided by the philanthropic sector ($17m, 19%) and industry ($13m, 14%), with MNCs providing three-quarters ($9.5m, 75%) of the industry total.
The public sector recorded one of the largest increases (up $13m, 29%) in helminth R&D investment since the survey began, driven by HICs (up $12m, 27%). LMIC investment also increased (up $1.5m, 81%) to the highest level ever recorded by the survey. Funding from the philanthropic sector fell (down $4.2m, -20%) as a result of reduced funding from the Gates Foundation. Investment from industry increased by more than half (up $4.6m, 57%).
Public (LMICs) 4%
Philanthropic 19%
Private (SMEs)4%
Public (HICs) 63%
Private (MNCs)11%
Figure 12. Helminth R&D funding by sector 2017
^ Subtotals for 2008-2016 top 12 reflect the top funders for those respective years, not the top 12 for 2017.- No reported funding
Funding organisation did not participate in the survey for this year. Any contributions listed are based on data reported by funding recipients so may be incomplete.
2008 2009 2010 2011 2012 2013 2014 2015 2016 2017
US NIH 28 34 35 28 39 30 31 29 32 38 43
Gates Foundation 25 19 17 22 20 23 24 19 18 14 16
Aggregate industry 5.8 10 7.4 8.6 4.3 8.7 17 12 8.1 13 14
German BMBF 0.2 0.3 0.5 1.1 0.6 0.3 0.3 <0.1 5.8 6.5
Wellcome Trust 3.4 4.3 4.7 7.2 5.4 6.6 4.3 3.5 3.4 3.1 3.5
EC 3.0 2.8 7.5 6.4 7.3 7.1 6.7 4.9 3.5 3.0 3.4
Indian ICMR 0.5 0.5 1.1 1.3 1.5 1.7 1.5 1.4 1.2 2.1 2.3
Texas Children's Hospital 0.1 0.9 1.3 1.2 1.5 1.6 1.8 2.1
Inserm 0.5 1.9 <0.1 1.8 2.0 2.3 1.6 1.3 1.0 1.7 1.8
German DFG 6.6 0.5 0.6 2.6 2.9 - 2.1 1.4 1.5 1.7
UK MRC 1.2 0.9 1.0 2.9 2.0 1.8 2.4 1.3 1.1 0.7 0.8
Brazilian FINEP 0.2 - 0.3 - - - - 0.6 0.6
Subtotal of top 12^ 72 85 80 84 88 90 92 78 73 86 96
Disease total 77 89 83 89 94 95 96 80 75 89 100
Table 12. Top helminth R&D funders 2017
US$ (millio
ns)
Funder 2017 % of total
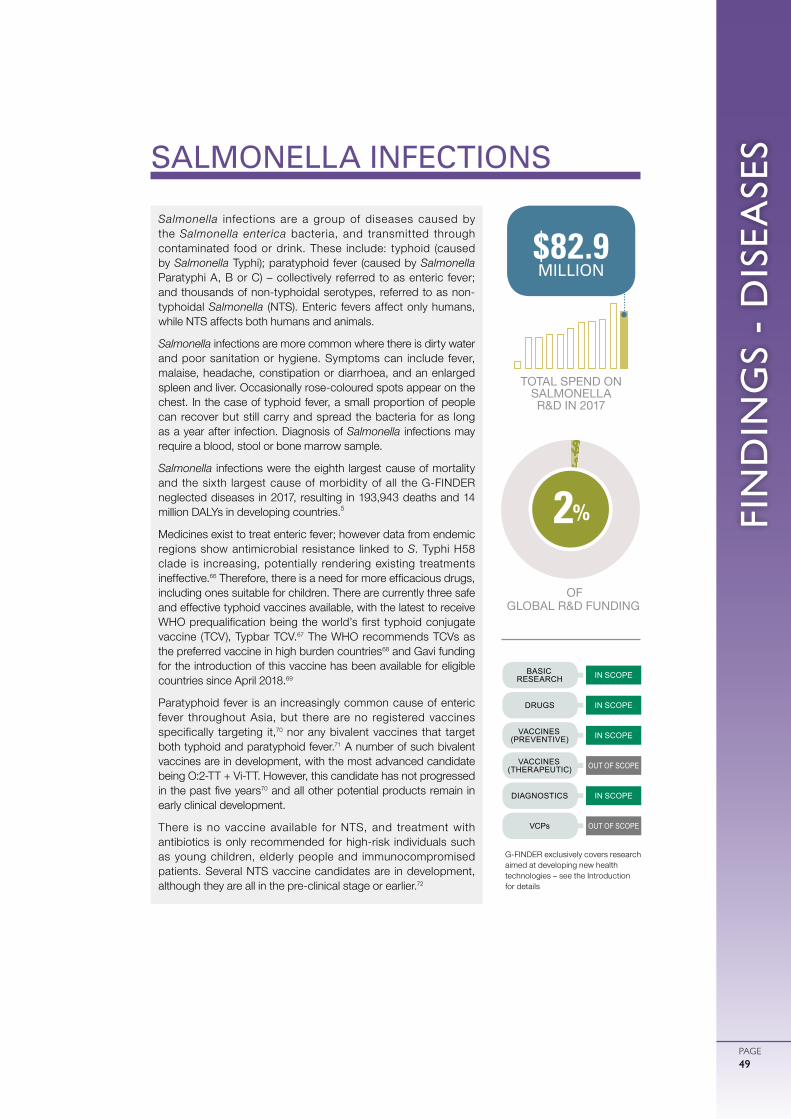
FIN
DIN
GS
- D
ISEA
SES
PAGE49
SALMONELLA INFECTIONS
Salmonella infections are a group of diseases caused by the Salmonella enterica bacteria, and transmitted through contaminated food or drink. These include: typhoid (caused by Salmonella Typhi); paratyphoid fever (caused by Salmonella Paratyphi A, B or C) – collectively referred to as enteric fever; and thousands of non-typhoidal serotypes, referred to as non-typhoidal Salmonella (NTS). Enteric fevers affect only humans, while NTS affects both humans and animals.
Salmonella infections are more common where there is dirty water and poor sanitation or hygiene. Symptoms can include fever, malaise, headache, constipation or diarrhoea, and an enlarged spleen and liver. Occasionally rose-coloured spots appear on the chest. In the case of typhoid fever, a small proportion of people can recover but still carry and spread the bacteria for as long as a year after infection. Diagnosis of Salmonella infections may require a blood, stool or bone marrow sample.
Salmonella infections were the eighth largest cause of mortality and the sixth largest cause of morbidity of all the G-FINDER neglected diseases in 2017, resulting in 193,943 deaths and 14 million DALYs in developing countries.5
Medicines exist to treat enteric fever; however data from endemic regions show antimicrobial resistance linked to S. Typhi H58 clade is increasing, potentially rendering existing treatments ineffective.66 Therefore, there is a need for more efficacious drugs, including ones suitable for children. There are currently three safe and effective typhoid vaccines available, with the latest to receive WHO prequalification being the world’s first typhoid conjugate vaccine (TCV), Typbar TCV.67 The WHO recommends TCVs as the preferred vaccine in high burden countries68 and Gavi funding for the introduction of this vaccine has been available for eligible countries since April 2018.69
Paratyphoid fever is an increasingly common cause of enteric fever throughout Asia, but there are no registered vaccines specifically targeting it,70 nor any bivalent vaccines that target both typhoid and paratyphoid fever.71 A number of such bivalent vaccines are in development, with the most advanced candidate being O:2-TT + Vi-TT. However, this candidate has not progressed in the past five years70 and all other potential products remain in early clinical development.
There is no vaccine available for NTS, and treatment with antibiotics is only recommended for high-risk individuals such as young children, elderly people and immunocompromised patients. Several NTS vaccine candidates are in development, although they are all in the pre-clinical stage or earlier.72
TOTAL SPEND ON SALMONELLA R&D IN 2017
$82.9 MILLION
OF GLOBAL R&D FUNDING
32%2%
IN SCOPE
OUT OF SCOPE
OUT OF SCOPE
IN SCOPE
IN SCOPE
IN SCOPE
BASIC RESEARCH
DRUGS
VACCINES (PREVENTIVE)
VACCINES (THERAPEUTIC)
DIAGNOSTICS
VCPs
G-FINDER exclusively covers research aimed at developing new health technologies – see the Introduction for details
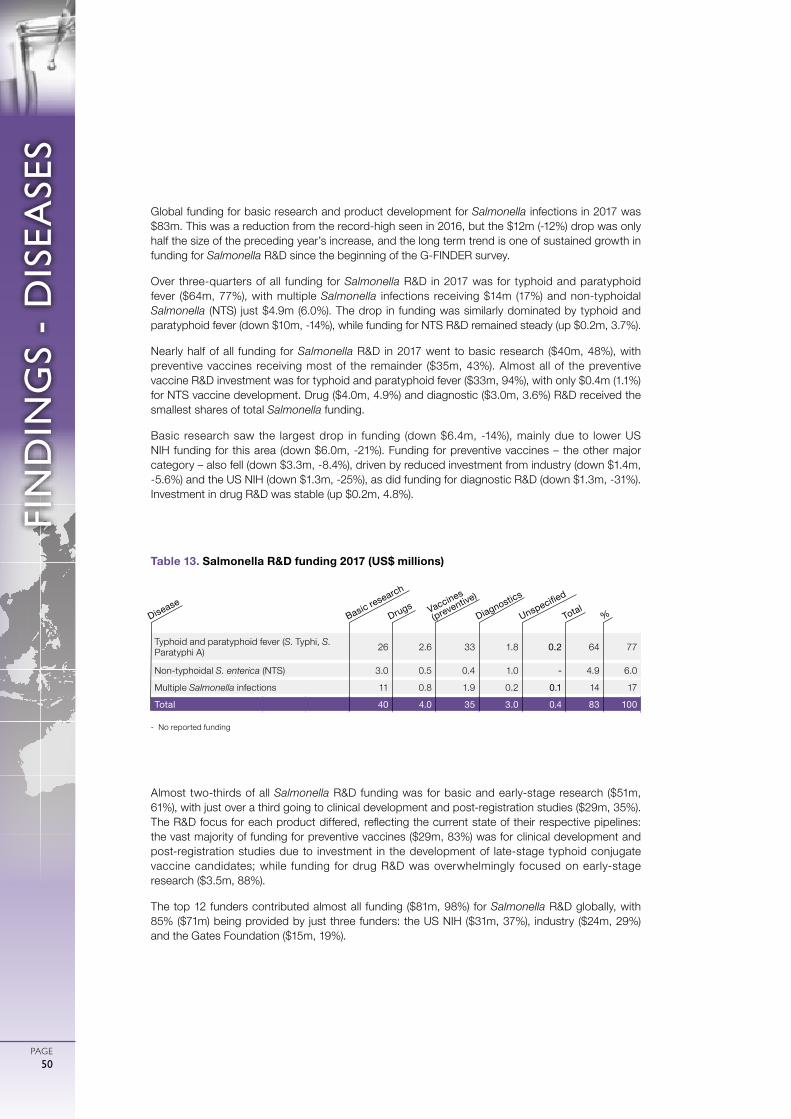
0
ガル図法(赤道縮尺) 1:47,000,000
1000 2000 3000 4000 5000km
75゜
60゜
45゜
30゜
15゜
0゜
15゜
30゜
45゜
60゜
75゜
90゜
180゜ 165゜ 150゜ 135゜ 120゜ 105゜ 90゜ 75゜ 60゜ 45゜ 30゜ 15゜ 15゜ 0゜ 165゜ 150゜ 135゜ 120゜ 105゜ 90゜ 75゜ 60゜ 45゜
FIN
DIN
GS
- D
ISEA
SES
PAGE50
Global funding for basic research and product development for Salmonella infections in 2017 was $83m. This was a reduction from the record-high seen in 2016, but the $12m (-12%) drop was only half the size of the preceding year’s increase, and the long term trend is one of sustained growth in funding for Salmonella R&D since the beginning of the G-FINDER survey.
Over three-quarters of all funding for Salmonella R&D in 2017 was for typhoid and paratyphoid fever ($64m, 77%), with multiple Salmonella infections receiving $14m (17%) and non-typhoidal Salmonella (NTS) just $4.9m (6.0%). The drop in funding was similarly dominated by typhoid and paratyphoid fever (down $10m, -14%), while funding for NTS R&D remained steady (up $0.2m, 3.7%).
Nearly half of all funding for Salmonella R&D in 2017 went to basic research ($40m, 48%), with preventive vaccines receiving most of the remainder ($35m, 43%). Almost all of the preventive vaccine R&D investment was for typhoid and paratyphoid fever ($33m, 94%), with only $0.4m (1.1%) for NTS vaccine development. Drug ($4.0m, 4.9%) and diagnostic ($3.0m, 3.6%) R&D received the smallest shares of total Salmonella funding.
Basic research saw the largest drop in funding (down $6.4m, -14%), mainly due to lower US NIH funding for this area (down $6.0m, -21%). Funding for preventive vaccines – the other major category – also fell (down $3.3m, -8.4%), driven by reduced investment from industry (down $1.4m, -5.6%) and the US NIH (down $1.3m, -25%), as did funding for diagnostic R&D (down $1.3m, -31%). Investment in drug R&D was stable (up $0.2m, 4.8%).
Almost two-thirds of all Salmonella R&D funding was for basic and early-stage research ($51m, 61%), with just over a third going to clinical development and post-registration studies ($29m, 35%). The R&D focus for each product differed, reflecting the current state of their respective pipelines: the vast majority of funding for preventive vaccines ($29m, 83%) was for clinical development and post-registration studies due to investment in the development of late-stage typhoid conjugate vaccine candidates; while funding for drug R&D was overwhelmingly focused on early-stage research ($3.5m, 88%).
The top 12 funders contributed almost all funding ($81m, 98%) for Salmonella R&D globally, with 85% ($71m) being provided by just three funders: the US NIH ($31m, 37%), industry ($24m, 29%) and the Gates Foundation ($15m, 19%).
Typhoid and paratyphoid fever (S. Typhi, S. Paratyphi A) 26 2.6 33 1.8 0.2 64 77
Non-typhoidal S. enterica (NTS) 3.0 0.5 0.4 1.0 - 4.9 6.0
Multiple Salmonella infections 11 0.8 1.9 0.2 0.1 14 17
Total 40 4.0 35 3.0 0.4 83 100
Table 13. Salmonella R&D funding 2017 (US$ millions)
- No reported funding
Basic research
DiseaseDrugs Vaccines
(preventive)
Diagnostics
Unspecified
Total%
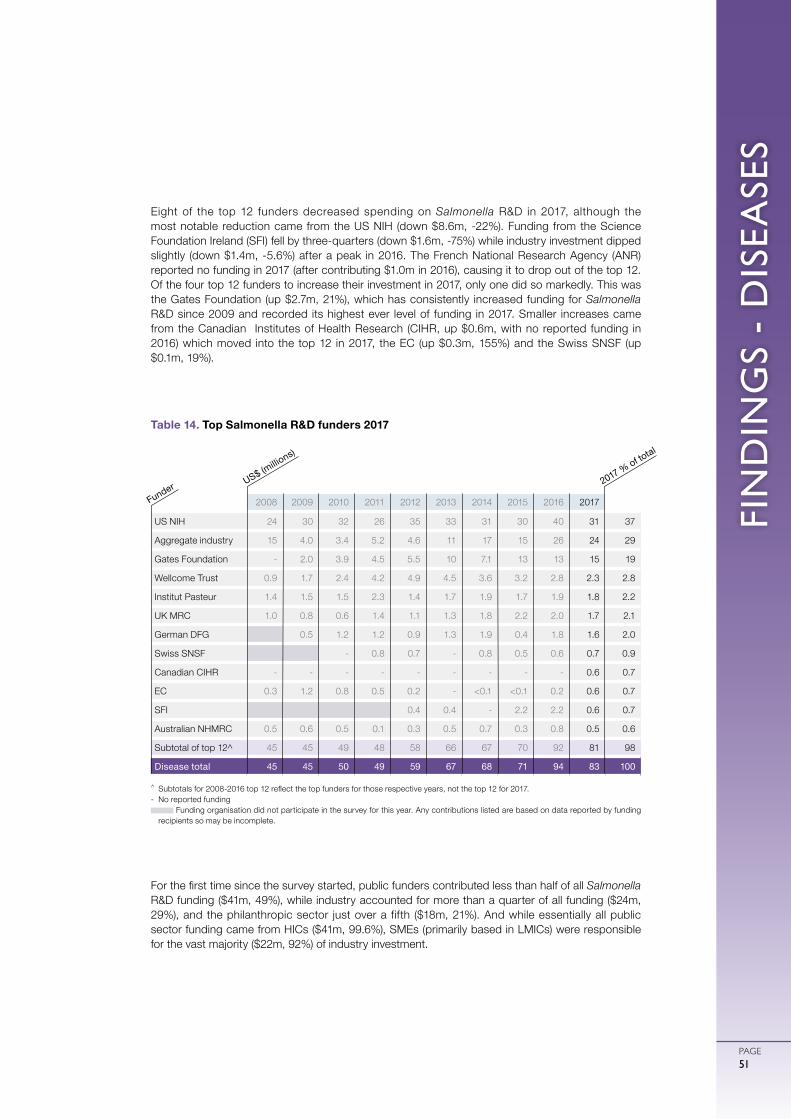
FIN
DIN
GS
- D
ISEA
SES
PAGE51
Eight of the top 12 funders decreased spending on Salmonella R&D in 2017, although the most notable reduction came from the US NIH (down $8.6m, -22%). Funding from the Science Foundation Ireland (SFI) fell by three-quarters (down $1.6m, -75%) while industry investment dipped slightly (down $1.4m, -5.6%) after a peak in 2016. The French National Research Agency (ANR) reported no funding in 2017 (after contributing $1.0m in 2016), causing it to drop out of the top 12. Of the four top 12 funders to increase their investment in 2017, only one did so markedly. This was the Gates Foundation (up $2.7m, 21%), which has consistently increased funding for Salmonella R&D since 2009 and recorded its highest ever level of funding in 2017. Smaller increases came from the Canadian Institutes of Health Research (CIHR, up $0.6m, with no reported funding in 2016) which moved into the top 12 in 2017, the EC (up $0.3m, 155%) and the Swiss SNSF (up $0.1m, 19%).
For the first time since the survey started, public funders contributed less than half of all Salmonella R&D funding ($41m, 49%), while industry accounted for more than a quarter of all funding ($24m, 29%), and the philanthropic sector just over a fifth ($18m, 21%). And while essentially all public sector funding came from HICs ($41m, 99.6%), SMEs (primarily based in LMICs) were responsible for the vast majority ($22m, 92%) of industry investment.
2008 2009 2010 2011 2012 2013 2014 2015 2016 2017
US NIH 24 30 32 26 35 33 31 30 40 31 37
Aggregate industry 15 4.0 3.4 5.2 4.6 11 17 15 26 24 29
Gates Foundation - 2.0 3.9 4.5 5.5 10 7.1 13 13 15 19
Wellcome Trust 0.9 1.7 2.4 4.2 4.9 4.5 3.6 3.2 2.8 2.3 2.8
Institut Pasteur 1.4 1.5 1.5 2.3 1.4 1.7 1.9 1.7 1.9 1.8 2.2
UK MRC 1.0 0.8 0.6 1.4 1.1 1.3 1.8 2.2 2.0 1.7 2.1
German DFG 0.5 1.2 1.2 0.9 1.3 1.9 0.4 1.8 1.6 2.0
Swiss SNSF - 0.8 0.7 - 0.8 0.5 0.6 0.7 0.9
Canadian CIHR - - - - - - - - - 0.6 0.7
EC 0.3 1.2 0.8 0.5 0.2 - <0.1 <0.1 0.2 0.6 0.7
SFI 0.4 0.4 - 2.2 2.2 0.6 0.7
Australian NHMRC 0.5 0.6 0.5 0.1 0.3 0.5 0.7 0.3 0.8 0.5 0.6
Subtotal of top 12^ 45 45 49 48 58 66 67 70 92 81 98
Disease total 45 45 50 49 59 67 68 71 94 83 100
^ Subtotals for 2008-2016 top 12 reflect the top funders for those respective years, not the top 12 for 2017.- No reported funding
Funding organisation did not participate in the survey for this year. Any contributions listed are based on data reported by funding recipients so may be incomplete.
Table 14. Top Salmonella R&D funders 2017
US$ (millio
ns)
Funder 2017 % of total
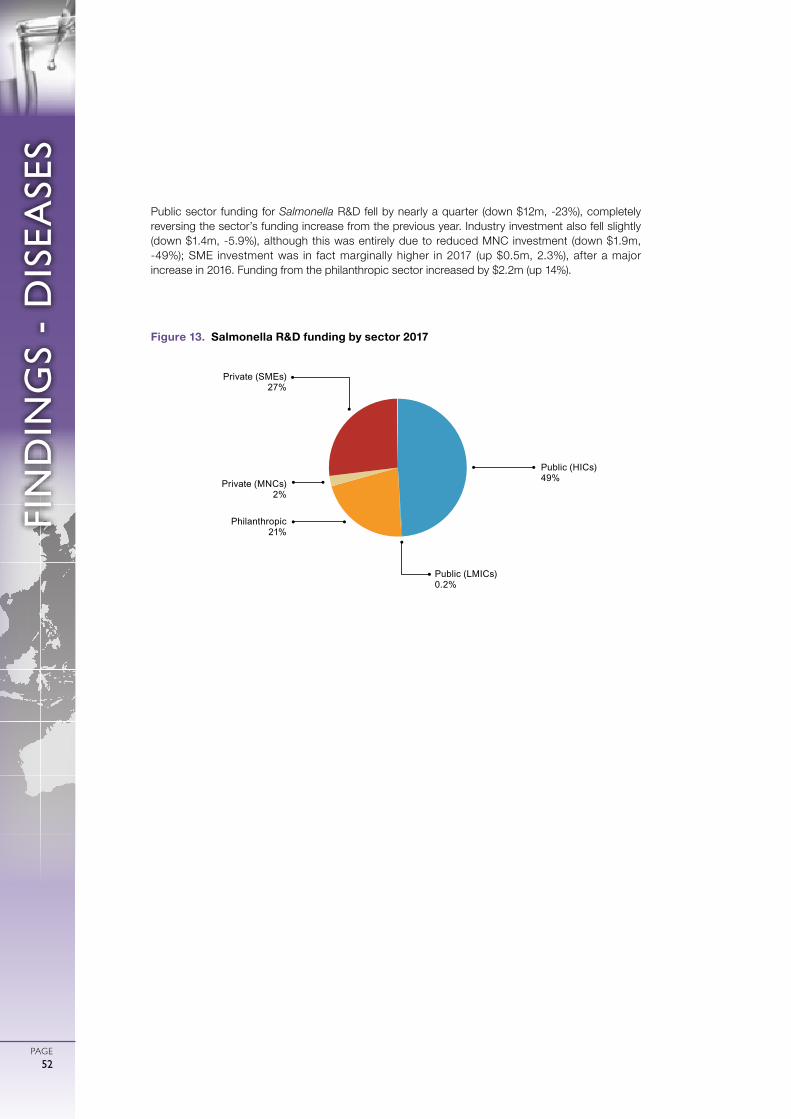
0
ガル図法(赤道縮尺) 1:47,000,000
1000 2000 3000 4000 5000km
75゜
60゜
45゜
30゜
15゜
0゜
15゜
30゜
45゜
60゜
75゜
90゜
180゜ 165゜ 150゜ 135゜ 120゜ 105゜ 90゜ 75゜ 60゜ 45゜ 30゜ 15゜ 15゜ 0゜ 165゜ 150゜ 135゜ 120゜ 105゜ 90゜ 75゜ 60゜ 45゜
FIN
DIN
GS
- D
ISEA
SES
PAGE52
Public sector funding for Salmonella R&D fell by nearly a quarter (down $12m, -23%), completely reversing the sector’s funding increase from the previous year. Industry investment also fell slightly (down $1.4m, -5.9%), although this was entirely due to reduced MNC investment (down $1.9m, -49%); SME investment was in fact marginally higher in 2017 (up $0.5m, 2.3%), after a major increase in 2016. Funding from the philanthropic sector increased by $2.2m (up 14%).
Public (LMICs) 0.2%
Philanthropic 21%
Private (SMEs)27%
Public (HICs) 49%Private (MNCs)
2%
Figure 13. Salmonella R&D funding by sector 2017
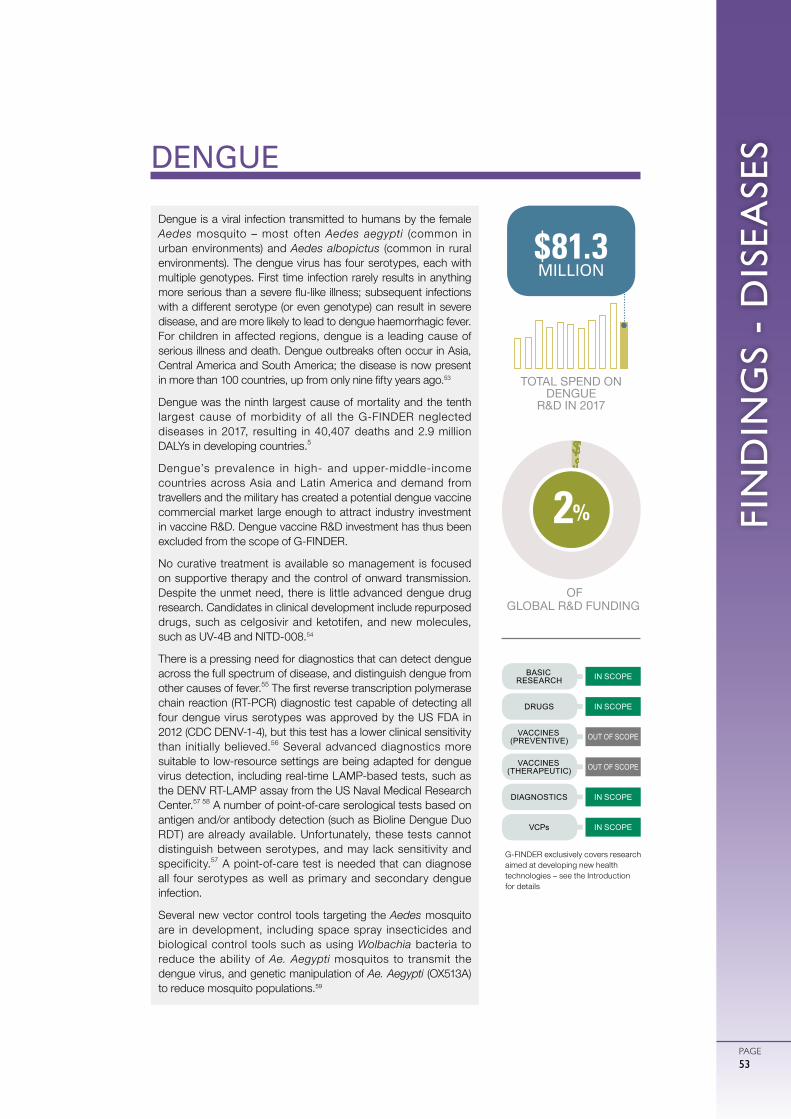
FIN
DIN
GS
- D
ISEA
SES
PAGE53
DENGUE
Dengue is a viral infection transmitted to humans by the female Aedes mosquito – most often Aedes aegypti (common in urban environments) and Aedes albopictus (common in rural environments). The dengue virus has four serotypes, each with multiple genotypes. First time infection rarely results in anything more serious than a severe flu-like illness; subsequent infections with a different serotype (or even genotype) can result in severe disease, and are more likely to lead to dengue haemorrhagic fever. For children in affected regions, dengue is a leading cause of serious illness and death. Dengue outbreaks often occur in Asia, Central America and South America; the disease is now present in more than 100 countries, up from only nine fifty years ago.53
Dengue was the ninth largest cause of mortality and the tenth largest cause of morbidity of all the G-FINDER neglected diseases in 2017, resulting in 40,407 deaths and 2.9 million DALYs in developing countries.5
Dengue’s prevalence in high- and upper-middle-income countries across Asia and Latin America and demand from travellers and the military has created a potential dengue vaccine commercial market large enough to attract industry investment in vaccine R&D. Dengue vaccine R&D investment has thus been excluded from the scope of G-FINDER.
No curative treatment is available so management is focused on supportive therapy and the control of onward transmission. Despite the unmet need, there is little advanced dengue drug research. Candidates in clinical development include repurposed drugs, such as celgosivir and ketotifen, and new molecules, such as UV-4B and NITD-008.54
There is a pressing need for diagnostics that can detect dengue across the full spectrum of disease, and distinguish dengue from other causes of fever.55 The first reverse transcription polymerase chain reaction (RT-PCR) diagnostic test capable of detecting all four dengue virus serotypes was approved by the US FDA in 2012 (CDC DENV-1-4), but this test has a lower clinical sensitivity than initially believed.56 Several advanced diagnostics more suitable to low-resource settings are being adapted for dengue virus detection, including real-time LAMP-based tests, such as the DENV RT-LAMP assay from the US Naval Medical Research Center.57 58 A number of point-of-care serological tests based on antigen and/or antibody detection (such as Bioline Dengue Duo RDT) are already available. Unfortunately, these tests cannot distinguish between serotypes, and may lack sensitivity and specificity.57 A point-of-care test is needed that can diagnose all four serotypes as well as primary and secondary dengue infection.
Several new vector control tools targeting the Aedes mosquito are in development, including space spray insecticides and biological control tools such as using Wolbachia bacteria to reduce the ability of Ae. Aegypti mosquitos to transmit the dengue virus, and genetic manipulation of Ae. Aegypti (OX513A) to reduce mosquito populations.59
TOTAL SPEND ON DENGUE
R&D IN 2017
$81.3 MILLION
OF GLOBAL R&D FUNDING
32%2%
OUT OF SCOPE
IN SCOPE
OUT OF SCOPE
IN SCOPE
IN SCOPE
IN SCOPE
BASIC RESEARCH
DRUGS
VACCINES (PREVENTIVE)
VACCINES (THERAPEUTIC)
DIAGNOSTICS
VCPs
G-FINDER exclusively covers research aimed at developing new health technologies – see the Introduction for details
0
ガル図法(赤道縮尺) 1:47,000,000
1000 2000 3000 4000 5000km
75゜
60゜
45゜
30゜
15゜
0゜
15゜
30゜
45゜
60゜
75゜
90゜
180゜ 165゜ 150゜ 135゜ 120゜ 105゜ 90゜ 75゜ 60゜ 45゜ 30゜ 15゜ 15゜ 0゜ 165゜ 150゜ 135゜ 120゜ 105゜ 90゜ 75゜ 60゜ 45゜
FIN
DIN
GS
- D
ISEA
SES
PAGE54
In 2017, a new category – multi-disease vector control products – was added to the G-FINDER scope, affecting the way investments in vector control product R&D are treated if they are applicable to more than one disease. For example, funding reported to G-FINDER prior to 2017 for R&D targeted at controlling the Aedes aegypti mosquito, which transmits both dengue and Zika, was apportioned to dengue R&D on a pro rata basis, with only the portion notionally allocated to dengue included in G-FINDER. Under the new approach, the full value of this kind of funding (including the portion which would have previously been assigned to dengue) was included under the new multi-disease category. In 2017 this category totalled $23m, with at least half ($12m) of this amount being applicable to dengue and Zika vector control. Using the approach from 2016, half of this funding in turn ($6.2m) would have been allocated to dengue. Due to this change in methodology, funding data from 2017 for dengue vector control product R&D is not directly comparable to previous years.
Global funding for dengue basic research and product development in 2017 was $81m, which was a drop of more than a quarter (down $32m, -28%) from the previous year. Not only was this the largest decrease dengue R&D funding has experienced since the start of the G-FINDER survey, it also largely reversed the gains seen over the past three consecutive years of funding growth. Roughly one-fifth of this fall was due to the reallocation of investment into multi-disease vector control products, meaning that the majority of the reduction was caused by other factors.
Despite the drop in funding and the new vector control category, there was very little change in the distribution of dengue R&D funding in 2017. Just under half of all funding was for basic research ($38m, 46%), and a little over a quarter for drugs ($22m, 28%). Dengue-specific vector control products received $9.3m (11%, down from 18% in 2016), and diagnostics $6.9m (8.5%). Funding was lower across-the-board, with the biggest reductions seen in basic research (down $13m, -26%) and vector control products (down $11m, -54%), followed by drugs (down $6.5m, -22%) and diagnostics (down $1.6m, -19%). Two of these falls were largely attributable to the US NIH, which decreased its funding for dengue basic research by $8.2m (-22%) and diagnostics by $2.1m (-39%). The decrease for drugs was largely the result of industry investment in this area falling by over a third (down $5.8m, -37%).
The overall drop in funding for dengue vector control products was influenced by the reallocation of investment into multi-disease vector control products but was actually primarily driven by other factors, and masked countervailing changes at the sub-product-level. Funding for biological control products fell significantly (down $13m, -66%), almost entirely due to an expected downturn in funding for Monash University’s World Mosquito Program (down $10m, -67%), following a large disbursement from the Gates Foundation in the previous year. In contrast, spending on chemical vector control products rebounded to historically high levels (up $2.1m, from a low base), on account of revitalised industry investment in the development of space spraying and chemical larvicides specifically targeting dengue, making it the only area of dengue R&D to receive an increase in funding.
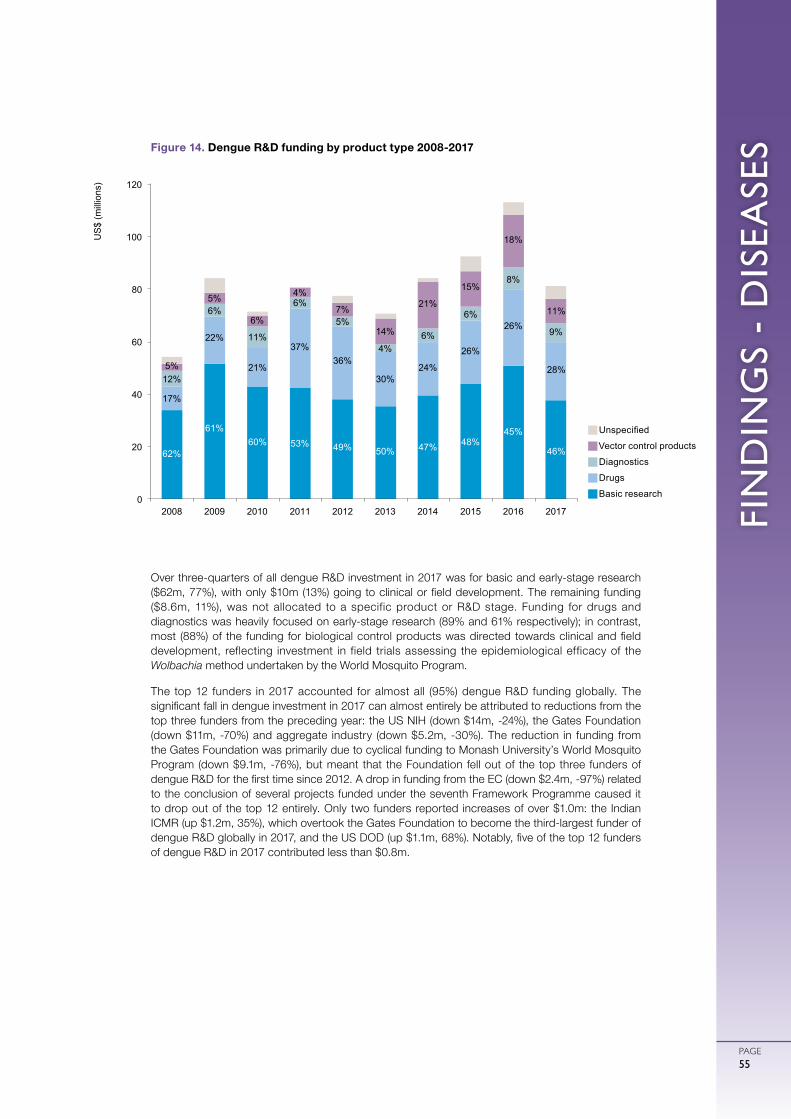
FIN
DIN
GS
- D
ISEA
SES
PAGE55
Over three-quarters of all dengue R&D investment in 2017 was for basic and early-stage research ($62m, 77%), with only $10m (13%) going to clinical or field development. The remaining funding ($8.6m, 11%), was not allocated to a specific product or R&D stage. Funding for drugs and diagnostics was heavily focused on early-stage research (89% and 61% respectively); in contrast, most (88%) of the funding for biological control products was directed towards clinical and field development, reflecting investment in field trials assessing the epidemiological efficacy of the Wolbachia method undertaken by the World Mosquito Program.
The top 12 funders in 2017 accounted for almost all (95%) dengue R&D funding globally. The significant fall in dengue investment in 2017 can almost entirely be attributed to reductions from the top three funders from the preceding year: the US NIH (down $14m, -24%), the Gates Foundation (down $11m, -70%) and aggregate industry (down $5.2m, -30%). The reduction in funding from the Gates Foundation was primarily due to cyclical funding to Monash University’s World Mosquito Program (down $9.1m, -76%), but meant that the Foundation fell out of the top three funders of dengue R&D for the first time since 2012. A drop in funding from the EC (down $2.4m, -97%) related to the conclusion of several projects funded under the seventh Framework Programme caused it to drop out of the top 12 entirely. Only two funders reported increases of over $1.0m: the Indian ICMR (up $1.2m, 35%), which overtook the Gates Foundation to become the third-largest funder of dengue R&D globally in 2017, and the US DOD (up $1.1m, 68%). Notably, five of the top 12 funders of dengue R&D in 2017 contributed less than $0.8m.
gUnspecified
gVector control products
gDiagnostics
gDrugs
gBasic research
Figure 14. Dengue R&D funding by product type 2008-2017
62%
61% 60% 53% 49% 50% 47% 48%
45%
46%
17%
22%
21%
37% 36%
30% 24%
26%
26%
28% 12%
6%
11%
6%
5%
4% 6%
6%
8%
9%
5%
5%
6%
4%
7%
14%
21%
15%
18%
11%
0
20
40
60
80
100
120
2008 2009 2010 2011 2012 2013 2014 2015 2016 2017
US
$ (m
illio
ns)
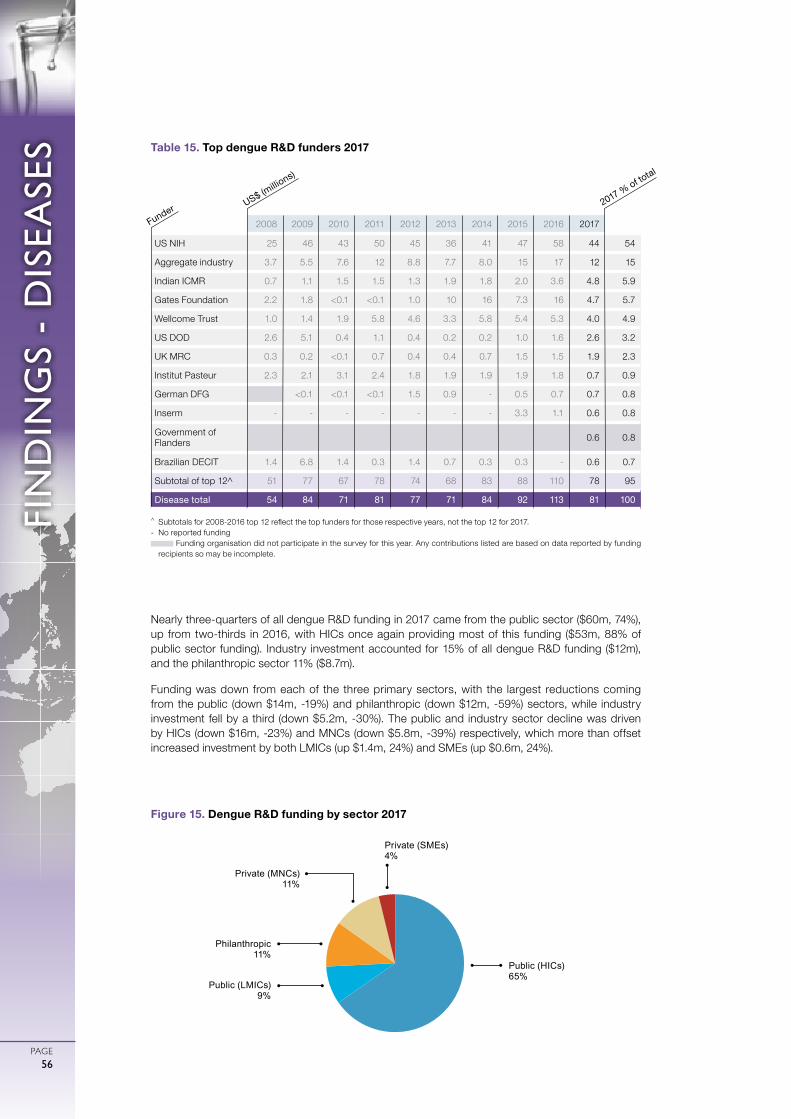
0
ガル図法(赤道縮尺) 1:47,000,000
1000 2000 3000 4000 5000km
75゜
60゜
45゜
30゜
15゜
0゜
15゜
30゜
45゜
60゜
75゜
90゜
180゜ 165゜ 150゜ 135゜ 120゜ 105゜ 90゜ 75゜ 60゜ 45゜ 30゜ 15゜ 15゜ 0゜ 165゜ 150゜ 135゜ 120゜ 105゜ 90゜ 75゜ 60゜ 45゜
FIN
DIN
GS
- D
ISEA
SES
PAGE56
Nearly three-quarters of all dengue R&D funding in 2017 came from the public sector ($60m, 74%), up from two-thirds in 2016, with HICs once again providing most of this funding ($53m, 88% of public sector funding). Industry investment accounted for 15% of all dengue R&D funding ($12m), and the philanthropic sector 11% ($8.7m).
Funding was down from each of the three primary sectors, with the largest reductions coming from the public (down $14m, -19%) and philanthropic (down $12m, -59%) sectors, while industry investment fell by a third (down $5.2m, -30%). The public and industry sector decline was driven by HICs (down $16m, -23%) and MNCs (down $5.8m, -39%) respectively, which more than offset increased investment by both LMICs (up $1.4m, 24%) and SMEs (up $0.6m, 24%).
Public (HICs)65%
Philanthropic11%
Private (MNCs) 11%
Private (SMEs)4%
Public (LMICs)9%
Figure 15. Dengue R&D funding by sector 2017
2008 2009 2010 2011 2012 2013 2014 2015 2016 2017
US NIH 25 46 43 50 45 36 41 47 58 44 54
Aggregate industry 3.7 5.5 7.6 12 8.8 7.7 8.0 15 17 12 15
Indian ICMR 0.7 1.1 1.5 1.5 1.3 1.9 1.8 2.0 3.6 4.8 5.9
Gates Foundation 2.2 1.8 <0.1 <0.1 1.0 10 16 7.3 16 4.7 5.7
Wellcome Trust 1.0 1.4 1.9 5.8 4.6 3.3 5.8 5.4 5.3 4.0 4.9
US DOD 2.6 5.1 0.4 1.1 0.4 0.2 0.2 1.0 1.6 2.6 3.2
UK MRC 0.3 0.2 <0.1 0.7 0.4 0.4 0.7 1.5 1.5 1.9 2.3
Institut Pasteur 2.3 2.1 3.1 2.4 1.8 1.9 1.9 1.9 1.8 0.7 0.9
German DFG <0.1 <0.1 <0.1 1.5 0.9 - 0.5 0.7 0.7 0.8
Inserm - - - - - - - 3.3 1.1 0.6 0.8
Government of Flanders 0.6 0.8
Brazilian DECIT 1.4 6.8 1.4 0.3 1.4 0.7 0.3 0.3 - 0.6 0.7
Subtotal of top 12^ 51 77 67 78 74 68 83 88 110 78 95
Disease total 54 84 71 81 77 71 84 92 113 81 100
Table 15. Top dengue R&D funders 2017
^ Subtotals for 2008-2016 top 12 reflect the top funders for those respective years, not the top 12 for 2017.- No reported funding
Funding organisation did not participate in the survey for this year. Any contributions listed are based on data reported by funding recipients so may be incomplete.
US$ (millio
ns)
Funder 2017 % of total
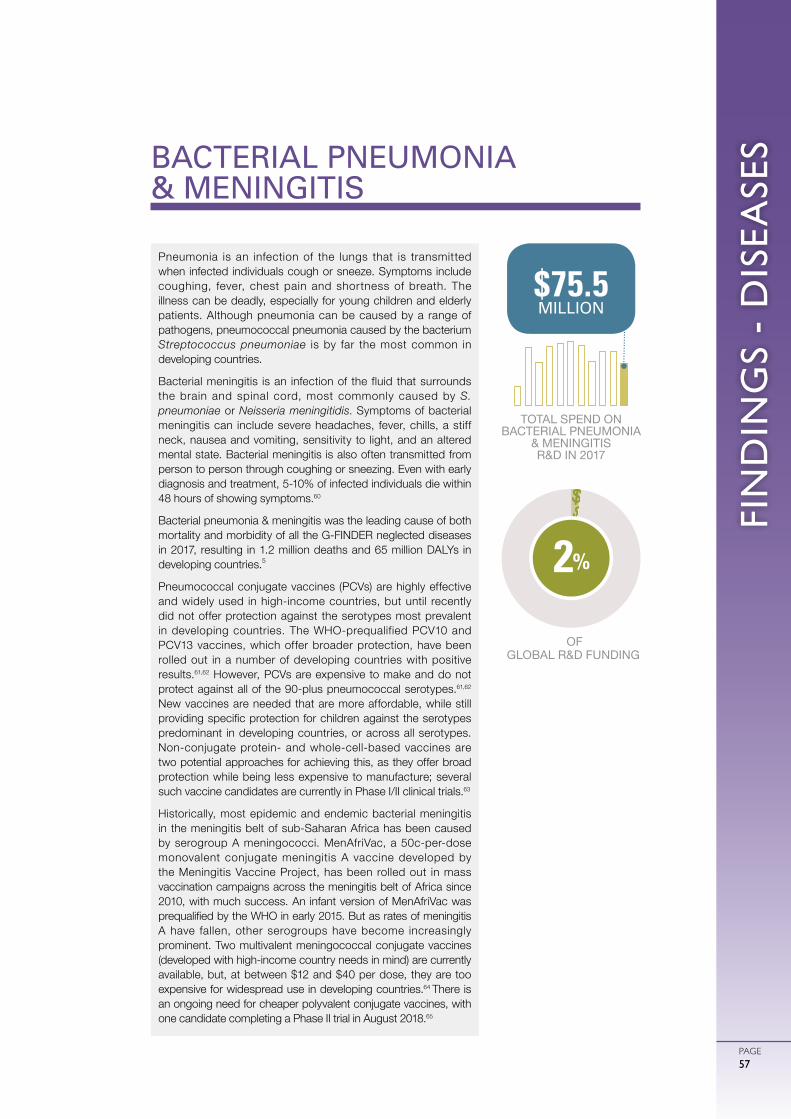
FIN
DIN
GS
- D
ISEA
SES
PAGE57
BACTERIAL PNEUMONIA & MENINGITIS
Pneumonia is an infection of the lungs that is transmitted when infected individuals cough or sneeze. Symptoms include coughing, fever, chest pain and shortness of breath. The illness can be deadly, especially for young children and elderly patients. Although pneumonia can be caused by a range of pathogens, pneumococcal pneumonia caused by the bacterium Streptococcus pneumoniae is by far the most common in developing countries.
Bacterial meningitis is an infection of the fluid that surrounds the brain and spinal cord, most commonly caused by S. pneumoniae or Neisseria meningitidis. Symptoms of bacterial meningitis can include severe headaches, fever, chills, a stiff neck, nausea and vomiting, sensitivity to light, and an altered mental state. Bacterial meningitis is also often transmitted from person to person through coughing or sneezing. Even with early diagnosis and treatment, 5-10% of infected individuals die within 48 hours of showing symptoms.60
Bacterial pneumonia & meningitis was the leading cause of both mortality and morbidity of all the G-FINDER neglected diseases in 2017, resulting in 1.2 million deaths and 65 million DALYs in developing countries.5
Pneumococcal conjugate vaccines (PCVs) are highly effective and widely used in high-income countries, but until recently did not offer protection against the serotypes most prevalent in developing countries. The WHO-prequalified PCV10 and PCV13 vaccines, which offer broader protection, have been rolled out in a number of developing countries with positive results.61,62 However, PCVs are expensive to make and do not protect against all of the 90-plus pneumococcal serotypes.61,62
New vaccines are needed that are more affordable, while still providing specific protection for children against the serotypes predominant in developing countries, or across all serotypes. Non-conjugate protein- and whole-cell-based vaccines are two potential approaches for achieving this, as they offer broad protection while being less expensive to manufacture; several such vaccine candidates are currently in Phase I/II clinical trials.63
Historically, most epidemic and endemic bacterial meningitis in the meningitis belt of sub-Saharan Africa has been caused by serogroup A meningococci. MenAfriVac, a 50c-per-dose monovalent conjugate meningitis A vaccine developed by the Meningitis Vaccine Project, has been rolled out in mass vaccination campaigns across the meningitis belt of Africa since 2010, with much success. An infant version of MenAfriVac was prequalified by the WHO in early 2015. But as rates of meningitis A have fallen, other serogroups have become increasingly prominent. Two multivalent meningococcal conjugate vaccines (developed with high-income country needs in mind) are currently available, but, at between $12 and $40 per dose, they are too expensive for widespread use in developing countries.64 There is an ongoing need for cheaper polyvalent conjugate vaccines, with one candidate completing a Phase II trial in August 2018.65
TOTAL SPEND ON BACTERIAL PNEUMONIA
& MENINGITISR&D IN 2017
OF GLOBAL R&D FUNDING
32%2%
$75.5 MILLION
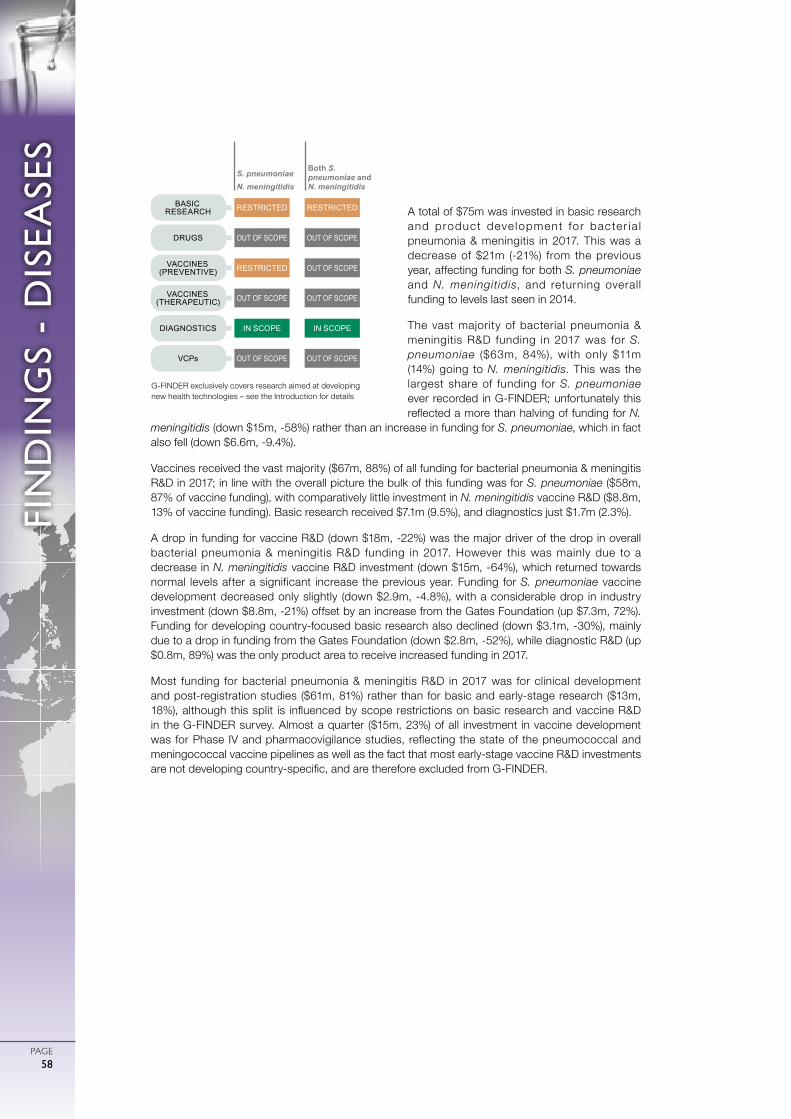
0
ガル図法(赤道縮尺) 1:47,000,000
1000 2000 3000 4000 5000km
75゜
60゜
45゜
30゜
15゜
0゜
15゜
30゜
45゜
60゜
75゜
90゜
180゜ 165゜ 150゜ 135゜ 120゜ 105゜ 90゜ 75゜ 60゜ 45゜ 30゜ 15゜ 15゜ 0゜ 165゜ 150゜ 135゜ 120゜ 105゜ 90゜ 75゜ 60゜ 45゜
FIN
DIN
GS
- D
ISEA
SES
PAGE58
A total of $75m was invested in basic research and product deve lopment for bacter ia l pneumonia & meningitis in 2017. This was a decrease of $21m (-21%) from the previous year, affecting funding for both S. pneumoniae and N. meningitidis, and returning overall funding to levels last seen in 2014.
The vast majority of bacterial pneumonia & meningitis R&D funding in 2017 was for S. pneumoniae ($63m, 84%), with only $11m (14%) going to N. meningitidis. This was the largest share of funding for S. pneumoniae ever recorded in G-FINDER; unfortunately this reflected a more than halving of funding for N.
meningitidis (down $15m, -58%) rather than an increase in funding for S. pneumoniae, which in fact also fell (down $6.6m, -9.4%).
Vaccines received the vast majority ($67m, 88%) of all funding for bacterial pneumonia & meningitis R&D in 2017; in line with the overall picture the bulk of this funding was for S. pneumoniae ($58m, 87% of vaccine funding), with comparatively little investment in N. meningitidis vaccine R&D ($8.8m, 13% of vaccine funding). Basic research received $7.1m (9.5%), and diagnostics just $1.7m (2.3%).
A drop in funding for vaccine R&D (down $18m, -22%) was the major driver of the drop in overall bacterial pneumonia & meningitis R&D funding in 2017. However this was mainly due to a decrease in N. meningitidis vaccine R&D investment (down $15m, -64%), which returned towards normal levels after a significant increase the previous year. Funding for S. pneumoniae vaccine development decreased only slightly (down $2.9m, -4.8%), with a considerable drop in industry investment (down $8.8m, -21%) offset by an increase from the Gates Foundation (up $7.3m, 72%). Funding for developing country-focused basic research also declined (down $3.1m, -30%), mainly due to a drop in funding from the Gates Foundation (down $2.8m, -52%), while diagnostic R&D (up $0.8m, 89%) was the only product area to receive increased funding in 2017.
Most funding for bacterial pneumonia & meningitis R&D in 2017 was for clinical development and post-registration studies ($61m, 81%) rather than for basic and early-stage research ($13m, 18%), although this split is influenced by scope restrictions on basic research and vaccine R&D in the G-FINDER survey. Almost a quarter ($15m, 23%) of all investment in vaccine development was for Phase IV and pharmacovigilance studies, reflecting the state of the pneumococcal and meningococcal vaccine pipelines as well as the fact that most early-stage vaccine R&D investments are not developing country-specific, and are therefore excluded from G-FINDER.
RESTRICTED
OUT OF SCOPE
OUT OF SCOPE
RESTRICTED
IN SCOPE
OUT OF SCOPE
OUT OF SCOPE
OUT OF SCOPE
RESTRICTED
S. pneumoniaeN. meningitidis
Both S. pneumoniae and N. meningitidis
IN SCOPE
OUT OF SCOPE
OUT OF SCOPE
BASIC RESEARCH
DRUGS
VACCINES (PREVENTIVE)
VACCINES (THERAPEUTIC)
DIAGNOSTICS
VCPs
G-FINDER exclusively covers research aimed at developing new health technologies – see the Introduction for details
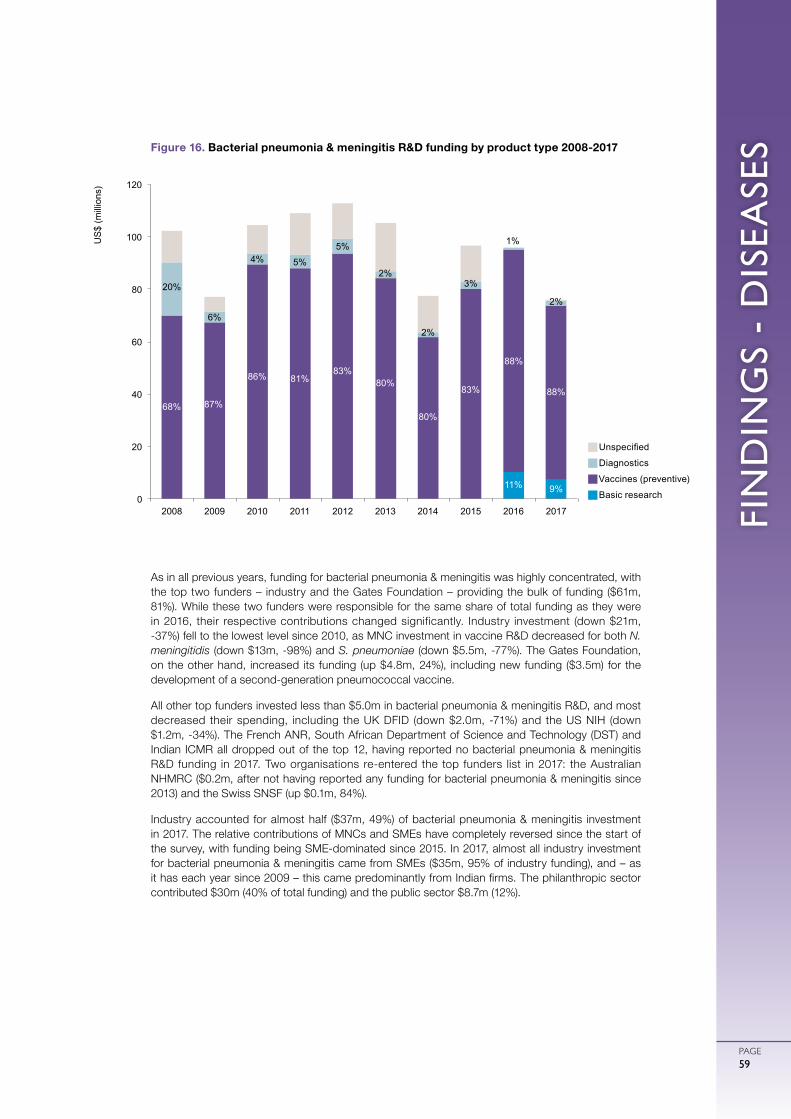
FIN
DIN
GS
- D
ISEA
SES
PAGE59
As in all previous years, funding for bacterial pneumonia & meningitis was highly concentrated, with the top two funders – industry and the Gates Foundation – providing the bulk of funding ($61m, 81%). While these two funders were responsible for the same share of total funding as they were in 2016, their respective contributions changed significantly. Industry investment (down $21m, -37%) fell to the lowest level since 2010, as MNC investment in vaccine R&D decreased for both N. meningitidis (down $13m, -98%) and S. pneumoniae (down $5.5m, -77%). The Gates Foundation, on the other hand, increased its funding (up $4.8m, 24%), including new funding ($3.5m) for the development of a second-generation pneumococcal vaccine.
All other top funders invested less than $5.0m in bacterial pneumonia & meningitis R&D, and most decreased their spending, including the UK DFID (down $2.0m, -71%) and the US NIH (down $1.2m, -34%). The French ANR, South African Department of Science and Technology (DST) and Indian ICMR all dropped out of the top 12, having reported no bacterial pneumonia & meningitis R&D funding in 2017. Two organisations re-entered the top funders list in 2017: the Australian NHMRC ($0.2m, after not having reported any funding for bacterial pneumonia & meningitis since 2013) and the Swiss SNSF (up $0.1m, 84%).
Industry accounted for almost half ($37m, 49%) of bacterial pneumonia & meningitis investment in 2017. The relative contributions of MNCs and SMEs have completely reversed since the start of the survey, with funding being SME-dominated since 2015. In 2017, almost all industry investment for bacterial pneumonia & meningitis came from SMEs ($35m, 95% of industry funding), and – as it has each year since 2009 – this came predominantly from Indian firms. The philanthropic sector contributed $30m (40% of total funding) and the public sector $8.7m (12%).
gUnspecified
gDiagnostics
gVaccines (preventive)
gBasic research11% 9%
68% 87%
86% 81% 83%
80%
80%
83%
88%
88%
20%
6%
4% 5%
5%
2%
2%
3%
1%
2%
0
20
40
60
80
100
120
2008 2009 2010 2011 2012 2013 2014 2015 2016 2017
US
$ (m
illio
ns)
Figure 16. Bacterial pneumonia & meningitis R&D funding by product type 2008-2017
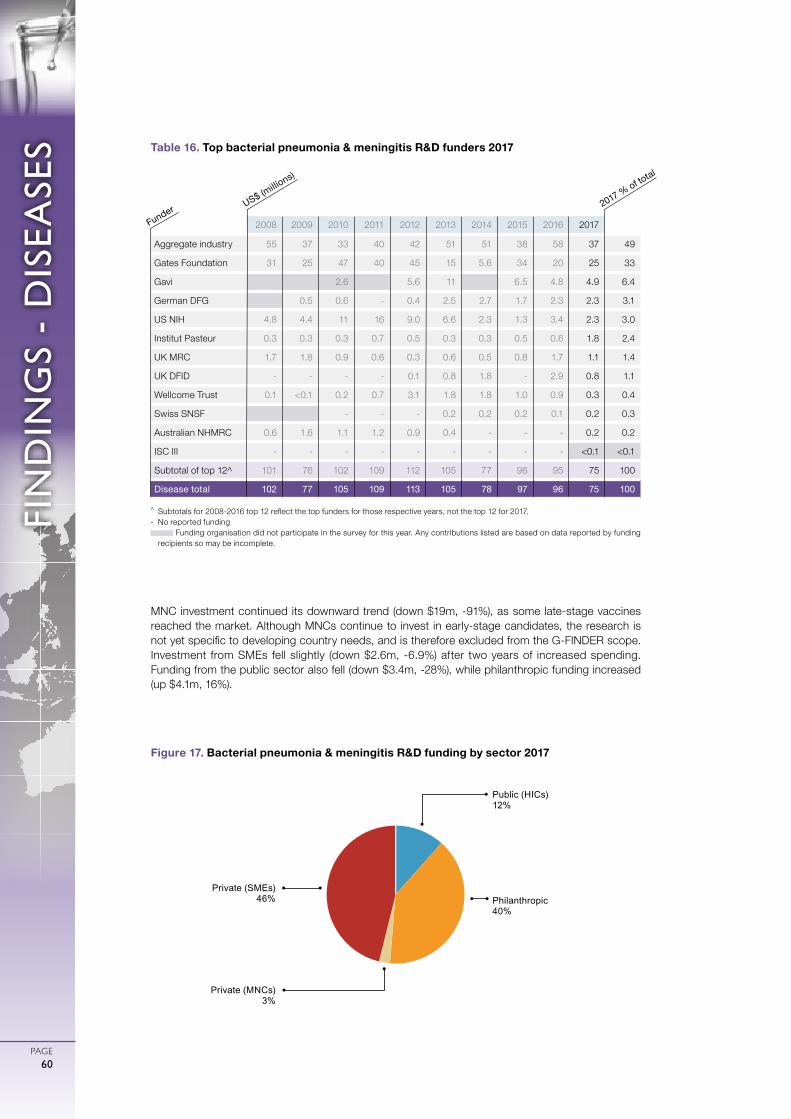
0
ガル図法(赤道縮尺) 1:47,000,000
1000 2000 3000 4000 5000km
75゜
60゜
45゜
30゜
15゜
0゜
15゜
30゜
45゜
60゜
75゜
90゜
180゜ 165゜ 150゜ 135゜ 120゜ 105゜ 90゜ 75゜ 60゜ 45゜ 30゜ 15゜ 15゜ 0゜ 165゜ 150゜ 135゜ 120゜ 105゜ 90゜ 75゜ 60゜ 45゜
FIN
DIN
GS
- D
ISEA
SES
PAGE60
MNC investment continued its downward trend (down $19m, -91%), as some late-stage vaccines reached the market. Although MNCs continue to invest in early-stage candidates, the research is not yet specific to developing country needs, and is therefore excluded from the G-FINDER scope. Investment from SMEs fell slightly (down $2.6m, -6.9%) after two years of increased spending. Funding from the public sector also fell (down $3.4m, -28%), while philanthropic funding increased (up $4.1m, 16%).
Philanthropic 40%
Private (SMEs)46%
Public (HICs) 12%
Private (MNCs)3%
Figure 17. Bacterial pneumonia & meningitis R&D funding by sector 2017
^ Subtotals for 2008-2016 top 12 reflect the top funders for those respective years, not the top 12 for 2017.- No reported funding
Funding organisation did not participate in the survey for this year. Any contributions listed are based on data reported by funding recipients so may be incomplete.
2008 2009 2010 2011 2012 2013 2014 2015 2016 2017
Aggregate industry 55 37 33 40 42 51 51 38 58 37 49
Gates Foundation 31 25 47 40 45 15 5.6 34 20 25 33
Gavi 2.6 5.6 11 6.5 4.8 4.9 6.4
German DFG 0.5 0.6 - 0.4 2.5 2.7 1.7 2.3 2.3 3.1
US NIH 4.8 4.4 11 16 9.0 6.6 2.3 1.3 3.4 2.3 3.0
Institut Pasteur 0.3 0.3 0.3 0.7 0.5 0.3 0.3 0.5 0.6 1.8 2.4
UK MRC 1.7 1.8 0.9 0.6 0.3 0.6 0.5 0.8 1.7 1.1 1.4
UK DFID - - - - 0.1 0.8 1.8 - 2.9 0.8 1.1
Wellcome Trust 0.1 <0.1 0.2 0.7 3.1 1.8 1.8 1.0 0.9 0.3 0.4
Swiss SNSF - - - 0.2 0.2 0.2 0.1 0.2 0.3
Australian NHMRC 0.6 1.6 1.1 1.2 0.9 0.4 - - - 0.2 0.2
ISC III - - - - - - - - - <0.1 <0.1
Subtotal of top 12^ 101 76 102 109 112 105 77 96 95 75 100
Disease total 102 77 105 109 113 105 78 97 96 75 100
Table 16. Top bacterial pneumonia & meningitis R&D funders 2017
US$ (millio
ns)
Funder 2017 % of total
FIN
DIN
GS
- D
ISEA
SES
PAGE61
HEPATITIS C
Hepatitis C is a blood-borne infectious disease caused by the hepatitis C virus (HCV), primarily affecting the liver. HCV causes both acute and chronic infection, with symptoms in the acute phase including fever, fatigue and jaundice. However, up to 80% of acute cases are asymptomatic, meaning that many HCV infections will go undetected until chronic disease develops, sometimes decades later. Although 20-40% of acute infections resolve spontaneously without treatment, the remaining 60-80% of cases will progress to chronic infection.81 Without treatment, chronic hepatitis C is a lifelong disease which can lead to serious liver damage (cirrhosis and fibrosis) and hepatocellular carcinoma (liver cancer), both of which can be life threatening.
There are six main genotypes of HCV, three of which (genotypes 4, 5 and 6) disproportionately affect developing countries, while having a low prevalence in high-income countries. As a result, these genotypes are neglected from an R&D perspective. Developing country-specific R&D investment for hepatitis C genotype 4 was included in G-FINDER in 2014, and genotypes 5 and 6 were added in 2015. Genotype 4 is most prevalent in Central Africa and the Middle East, genotype 5 in Southern Africa, and genotype 6 in South-East Asia.82
Reliable genotype-specific estimates of hepatitis C morbidity and mortality do not exist. Hepatitis C (all genotypes) was the sixth largest cause of mortality and the seventh largest cause of morbidity of the thirteen G-FINDER neglected disease categories covered by IHME, resulting in 449,333 deaths and 13 million DALYs in developing countries in 2017.5
As of 2018, there are 13 direct-acting antiviral (DAA) drugs available on the market, including four pan-genotype combinations. DAA-based regimens are more effective, require a shorter duration of treatment, are appropriate for most patients (including those with HIV coinfection) and have fewer side effects than previous interferon- and ribavirin-based treatments. Due to these advancements in the treatment of hepatitis C, in 2018 the WHO recommended that all individuals over the age of 12 years diagnosed with HCV infection should be treated with DAAs.83 Shortly following this recommendation, the Medicines Patent Pool licenced a pan-genotype, fixed-dose combination DAA (glecaprevir/pibrentasvir), enabling the development of a generic version in certain LMICs. This is a positive development because DAA-based regimens are expensive, and despite discounted pricing, access remains limited in developing countries.84 More research is also needed to assess the use of DAA-based regimens among developing country populations, adolescents, children under the age of 12, and pregnant women. In addition to those already approved, there are several multi- or pan-genotypic DAA-based regimens in late-stage development, including ravidasvir/sofosbuvir.83
There is also a need for hepatitis C diagnostic tests that are affordable and simple to use in developing country contexts,83
especially tests that could be used for treatment monitoring. The WHO has prequalified seven hepatitis C diagnostic tests, including three RDTs and one viral load test.85 There is no vaccine for hepatitis C, although there are some pan-genotypic candidates in early-stage development, such as the Burnet Institute’s Delta3 candidate.86
IN SCOPE
OUT OF SCOPE
OUT OF SCOPE
RESTRICTED
OUT OF SCOPE
IN SCOPE
BASIC RESEARCH
DRUGS
VACCINES (PREVENTIVE)
VACCINES (THERAPEUTIC)
DIAGNOSTICS
VCPs
TOTAL SPEND ON HEPATITIS CR&D IN 2017
$15.3MILLION
G-FINDER exclusively covers research aimed at developing new health technologies – see the Introduction for details
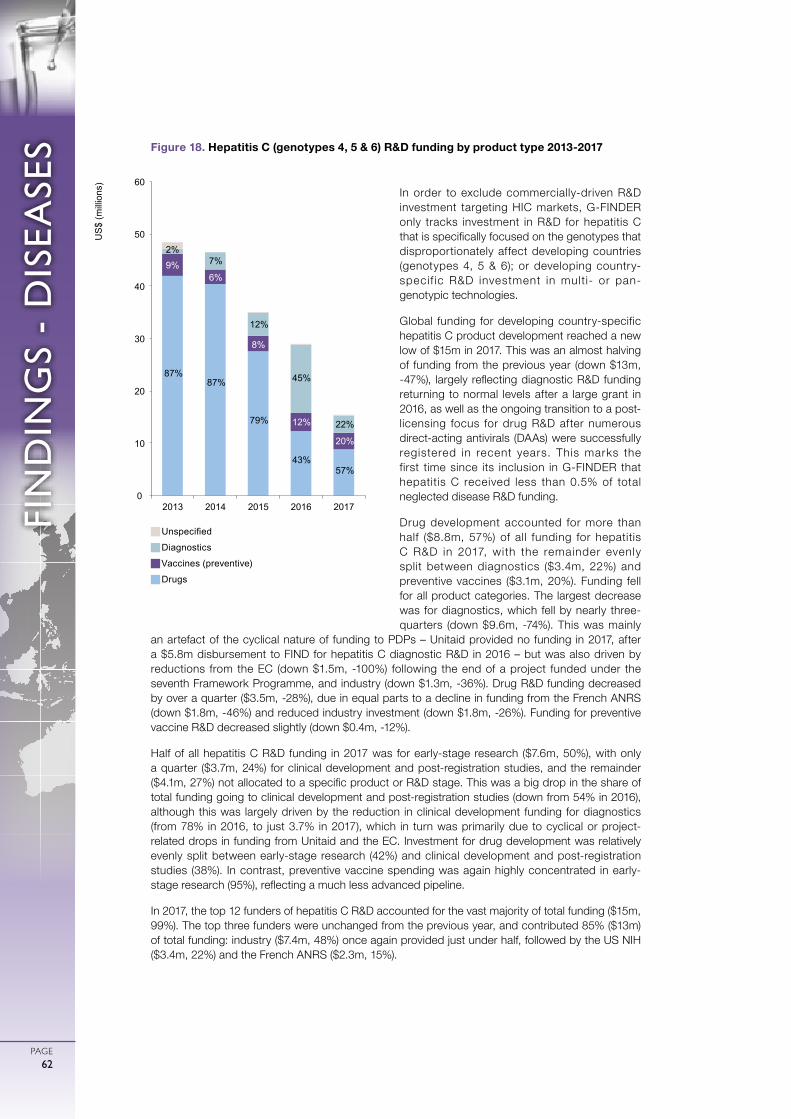
0
ガル図法(赤道縮尺) 1:47,000,000
1000 2000 3000 4000 5000km
75゜
60゜
45゜
30゜
15゜
0゜
15゜
30゜
45゜
60゜
75゜
90゜
180゜ 165゜ 150゜ 135゜ 120゜ 105゜ 90゜ 75゜ 60゜ 45゜ 30゜ 15゜ 15゜ 0゜ 165゜ 150゜ 135゜ 120゜ 105゜ 90゜ 75゜ 60゜ 45゜
FIN
DIN
GS
- D
ISEA
SES
PAGE62
In order to exclude commercially-driven R&D investment targeting HIC markets, G-FINDER only tracks investment in R&D for hepatitis C that is specifically focused on the genotypes that disproportionately affect developing countries (genotypes 4, 5 & 6); or developing country-specif ic R&D investment in multi- or pan-genotypic technologies.
Global funding for developing country-specific hepatitis C product development reached a new low of $15m in 2017. This was an almost halving of funding from the previous year (down $13m, -47%), largely reflecting diagnostic R&D funding returning to normal levels after a large grant in 2016, as well as the ongoing transition to a post-licensing focus for drug R&D after numerous direct-acting antivirals (DAAs) were successfully registered in recent years. This marks the first time since its inclusion in G-FINDER that hepatitis C received less than 0.5% of total neglected disease R&D funding.
Drug development accounted for more than half ($8.8m, 57%) of all funding for hepatitis C R&D in 2017, with the remainder evenly split between diagnostics ($3.4m, 22%) and preventive vaccines ($3.1m, 20%). Funding fell for all product categories. The largest decrease was for diagnostics, which fell by nearly three-quarters (down $9.6m, -74%). This was mainly
an artefact of the cyclical nature of funding to PDPs – Unitaid provided no funding in 2017, after a $5.8m disbursement to FIND for hepatitis C diagnostic R&D in 2016 – but was also driven by reductions from the EC (down $1.5m, -100%) following the end of a project funded under the seventh Framework Programme, and industry (down $1.3m, -36%). Drug R&D funding decreased by over a quarter ($3.5m, -28%), due in equal parts to a decline in funding from the French ANRS (down $1.8m, -46%) and reduced industry investment (down $1.8m, -26%). Funding for preventive vaccine R&D decreased slightly (down $0.4m, -12%).
Half of all hepatitis C R&D funding in 2017 was for early-stage research ($7.6m, 50%), with only a quarter ($3.7m, 24%) for clinical development and post-registration studies, and the remainder ($4.1m, 27%) not allocated to a specific product or R&D stage. This was a big drop in the share of total funding going to clinical development and post-registration studies (down from 54% in 2016), although this was largely driven by the reduction in clinical development funding for diagnostics (from 78% in 2016, to just 3.7% in 2017), which in turn was primarily due to cyclical or project-related drops in funding from Unitaid and the EC. Investment for drug development was relatively evenly split between early-stage research (42%) and clinical development and post-registration studies (38%). In contrast, preventive vaccine spending was again highly concentrated in early-stage research (95%), reflecting a much less advanced pipeline.
In 2017, the top 12 funders of hepatitis C R&D accounted for the vast majority of total funding ($15m, 99%). The top three funders were unchanged from the previous year, and contributed 85% ($13m) of total funding: industry ($7.4m, 48%) once again provided just under half, followed by the US NIH ($3.4m, 22%) and the French ANRS ($2.3m, 15%).
gUnspecified
gDiagnostics
gVaccines (preventive)
gDrugs
Figure 18. Hepatitis C (genotypes 4, 5 & 6) R&D funding by product type 2013-2017
87% 87%
79%
43% 57%
9% 6%
8%
12%
20%
2% 7%
12%
45%
22%
0
10
20
30
40
50
60
2013 2014 2015 2016 2017
US
$ (m
illio
ns)
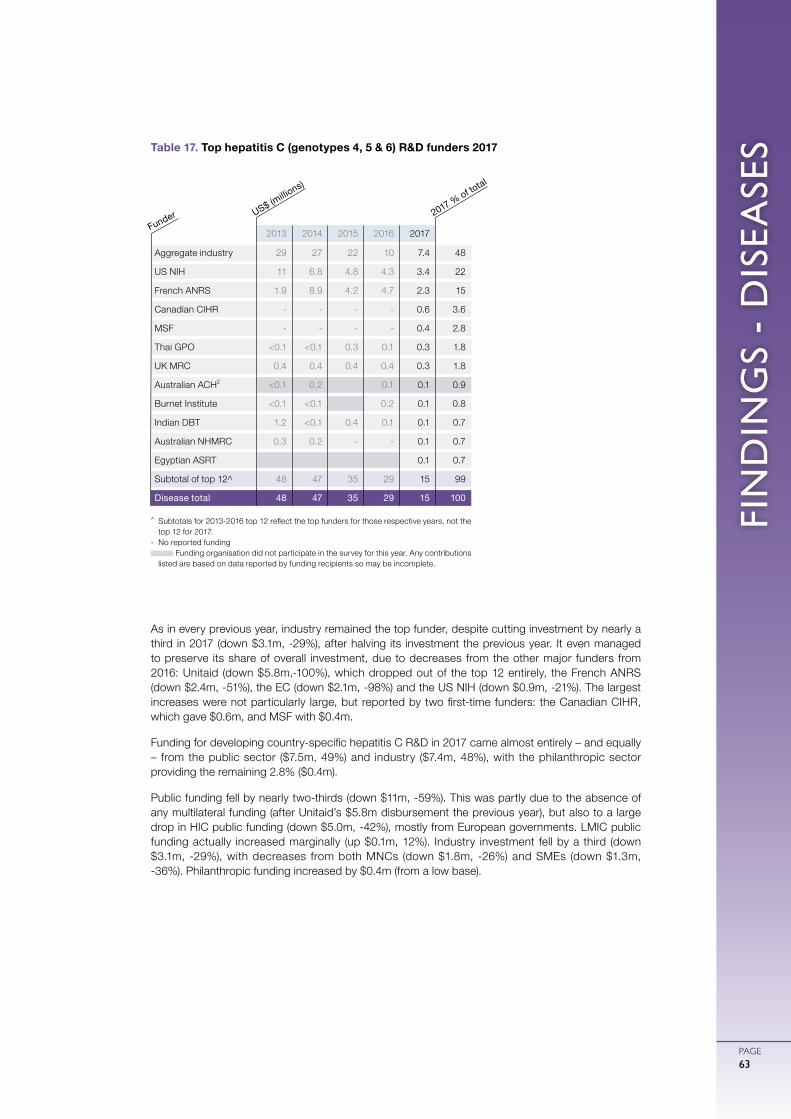
FIN
DIN
GS
- D
ISEA
SES
PAGE63
As in every previous year, industry remained the top funder, despite cutting investment by nearly a third in 2017 (down $3.1m, -29%), after halving its investment the previous year. It even managed to preserve its share of overall investment, due to decreases from the other major funders from 2016: Unitaid (down $5.8m,-100%), which dropped out of the top 12 entirely, the French ANRS (down $2.4m, -51%), the EC (down $2.1m, -98%) and the US NIH (down $0.9m, -21%). The largest increases were not particularly large, but reported by two first-time funders: the Canadian CIHR, which gave $0.6m, and MSF with $0.4m.
Funding for developing country-specific hepatitis C R&D in 2017 came almost entirely – and equally – from the public sector ($7.5m, 49%) and industry ($7.4m, 48%), with the philanthropic sector providing the remaining 2.8% ($0.4m).
Public funding fell by nearly two-thirds (down $11m, -59%). This was partly due to the absence of any multilateral funding (after Unitaid’s $5.8m disbursement the previous year), but also to a large drop in HIC public funding (down $5.0m, -42%), mostly from European governments. LMIC public funding actually increased marginally (up $0.1m, 12%). Industry investment fell by a third (down $3.1m, -29%), with decreases from both MNCs (down $1.8m, -26%) and SMEs (down $1.3m, -36%). Philanthropic funding increased by $0.4m (from a low base).
Table 17. Top hepatitis C (genotypes 4, 5 & 6) R&D funders 2017
2013 2014 2015 2016 2017
Aggregate industry 29 27 22 10 7.4 48
US NIH 11 6.8 4.8 4.3 3.4 22
French ANRS 1.9 8.9 4.2 4.7 2.3 15
Canadian CIHR - - - - 0.6 3.6
MSF - - - - 0.4 2.8
Thai GPO <0.1 <0.1 0.3 0.1 0.3 1.8
UK MRC 0.4 0.4 0.4 0.4 0.3 1.8
Australian ACH2 <0.1 0.2 0.1 0.1 0.9
Burnet Institute <0.1 <0.1 0.2 0.1 0.8
Indian DBT 1.2 <0.1 0.4 0.1 0.1 0.7
Australian NHMRC 0.3 0.2 - - 0.1 0.7
Egyptian ASRT 0.1 0.7
Subtotal of top 12^ 48 47 35 29 15 99
Disease total 48 47 35 29 15 100
^ Subtotals for 2013-2016 top 12 reflect the top funders for those respective years, not the top 12 for 2017.
- No reported funding Funding organisation did not participate in the survey for this year. Any contributions
listed are based on data reported by funding recipients so may be incomplete.
Funder US$ (millio
ns)
2017 % of total
0
ガル図法(赤道縮尺) 1:47,000,000
1000 2000 3000 4000 5000km
75゜
60゜
45゜
30゜
15゜
0゜
15゜
30゜
45゜
60゜
75゜
90゜
180゜ 165゜ 150゜ 135゜ 120゜ 105゜ 90゜ 75゜ 60゜ 45゜ 30゜ 15゜ 15゜ 0゜ 165゜ 150゜ 135゜ 120゜ 105゜ 90゜ 75゜ 60゜ 45゜
FIN
DIN
GS
- D
ISEA
SES
PAGE64
LEPROSY
Global funding for leprosy R&D in 2017 was $13m; this was both the first material increase and the highest reported level of investment since 2013.
Just under half of all funding was for basic research ($5.6m, 44%), with only $0.9m (7.1%) going to product development. Diagnostics ($0.5m, 4.3%) received marginally more funding than drugs ($0.4m, 2.8%). The remaining $6.3m (49%) of funding was not allocated to a specific research area.
Just under half ($5.9m, 46%) of all funding for leprosy R&D in 2017 was for basic and early-stage research, with only $0.4m (3.0%) reported for clinical development and post-registration studies. The remaining funding was not allocated to a specific product or R&D stage ($6.5m, 51%), though the vast majority of this amount was core funding from ICMR to its intramural leprosy R&D sites, which typically conducts basic and early-stage research, meaning that this type of research likely accounted for more than 90% of all leprosy R&D funding.
Leprosy, also known as Hansen’s disease, is caused by Mycobacterium leprae and is transmitted via air droplets from the nose or mouth of infected people. Leprosy mainly affects the skin and nerves and has an incubation period that can be as long as 20 years. The disease is curable with multidrug therapy using a combination of rifampicin, clofazimine and dapsone (for multibacillary leprosy), or rifampicin and dapsone (for paucibacillary leprosy). However, if left untreated, leprosy can cause nerve damage, muscle weakness and permanent impairments.
Leprosy was the thirteenth largest cause of morbidity of all the G-FINDER neglected diseases, resulting in 31,397 DALYs in developing countries in 2017.5
Diagnosis of leprosy is primarily based on identifying key clinical features of infection, meaning that asymptomatic early-stage cases are often missed or diagnosed late, leading to continued disease transmission. Elimination of leprosy will likely require new and improved diagnostics capable of identifying asymptomatic cases, as well as al l symptomatic forms (paucibacillary, borderline tuberculoid, borderline, borderline lepromatous or multibacillary) of the disease.87 The current drug regimen for leprosy has been standard treatment for 30 years and, although highly effective, it requires between six and 24 months of treatment.88 Further research is needed to improve and simplify drug regimens, and to provide products for nerve function management.88,89
Bedaquiline, an antibiotic approved for the treatment of MDR-TB, has been found to be effective in the treatment of leprosy in animal models.90 The Infectious Disease Research Institute (IDRI) is one organisation currently developing rapid diagnostic tests for leprosy.91,92
OUT OF SCOPE
OUT OF SCOPE
OUT OF SCOPE
IN SCOPE
IN SCOPE
IN SCOPE
BASIC RESEARCH
DRUGS
VACCINES (PREVENTIVE)
VACCINES (THERAPEUTIC)
DIAGNOSTICS
VCPs
TOTAL SPEND ON LEPROSY
R&D IN 2017
$12.8 MILLION
G-FINDER exclusively covers research aimed at developing new health technologies – see the Introduction for details
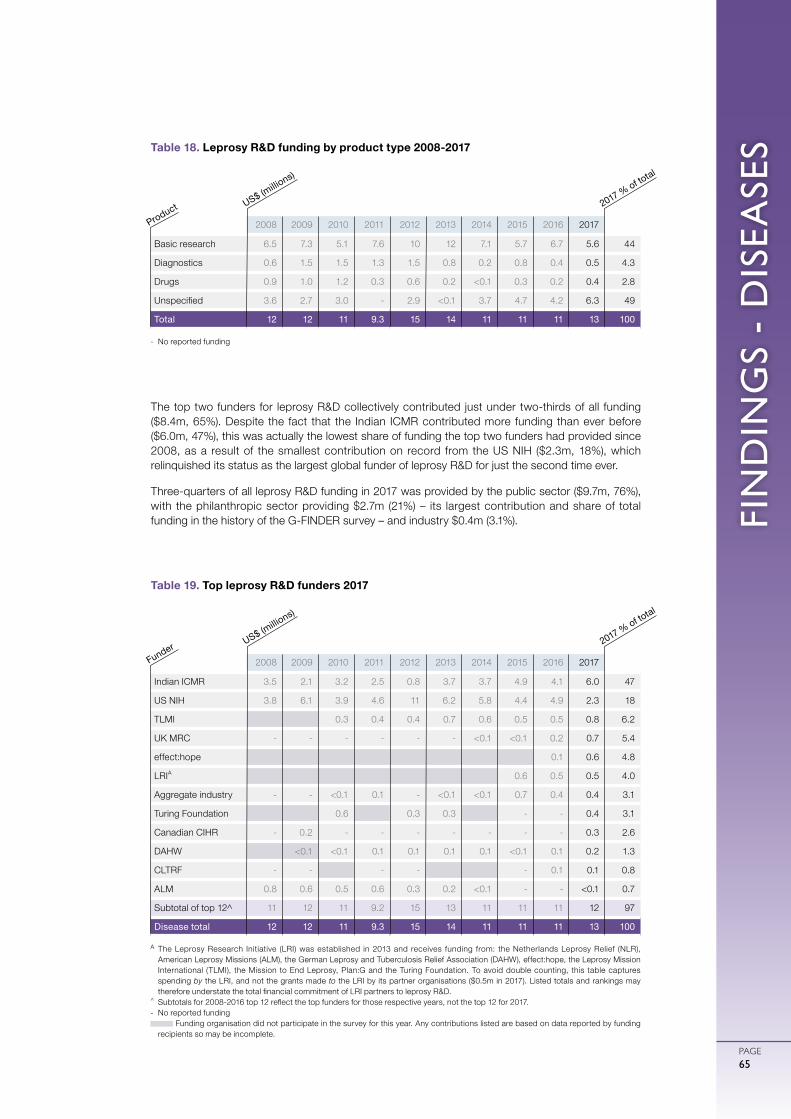
FIN
DIN
GS
- D
ISEA
SES
PAGE65
The top two funders for leprosy R&D collectively contributed just under two-thirds of all funding ($8.4m, 65%). Despite the fact that the Indian ICMR contributed more funding than ever before ($6.0m, 47%), this was actually the lowest share of funding the top two funders had provided since 2008, as a result of the smallest contribution on record from the US NIH ($2.3m, 18%), which relinquished its status as the largest global funder of leprosy R&D for just the second time ever.
Three-quarters of all leprosy R&D funding in 2017 was provided by the public sector ($9.7m, 76%), with the philanthropic sector providing $2.7m (21%) – its largest contribution and share of total funding in the history of the G-FINDER survey – and industry $0.4m (3.1%).
- No reported funding
2008 2009 2010 2011 2012 2013 2014 2015 2016 2017
Basic research 6.5 7.3 5.1 7.6 10 12 7.1 5.7 6.7 5.6 44
Diagnostics 0.6 1.5 1.5 1.3 1.5 0.8 0.2 0.8 0.4 0.5 4.3
Drugs 0.9 1.0 1.2 0.3 0.6 0.2 <0.1 0.3 0.2 0.4 2.8
Unspecified 3.6 2.7 3.0 - 2.9 <0.1 3.7 4.7 4.2 6.3 49
Total 12 12 11 9.3 15 14 11 11 11 13 100
Table 18. Leprosy R&D funding by product type 2008-2017
A The Leprosy Research Initiative (LRI) was established in 2013 and receives funding from: the Netherlands Leprosy Relief (NLR), American Leprosy Missions (ALM), the German Leprosy and Tuberculosis Relief Association (DAHW), effect:hope, the Leprosy Mission International (TLMI), the Mission to End Leprosy, Plan:G and the Turing Foundation. To avoid double counting, this table captures spending by the LRI, and not the grants made to the LRI by its partner organisations ($0.5m in 2017). Listed totals and rankings may therefore understate the total financial commitment of LRI partners to leprosy R&D.
^ Subtotals for 2008-2016 top 12 reflect the top funders for those respective years, not the top 12 for 2017.- No reported funding
Funding organisation did not participate in the survey for this year. Any contributions listed are based on data reported by funding recipients so may be incomplete.
2008 2009 2010 2011 2012 2013 2014 2015 2016 2017
Indian ICMR 3.5 2.1 3.2 2.5 0.8 3.7 3.7 4.9 4.1 6.0 47
US NIH 3.8 6.1 3.9 4.6 11 6.2 5.8 4.4 4.9 2.3 18
TLMI 0.3 0.4 0.4 0.7 0.6 0.5 0.5 0.8 6.2
UK MRC - - - - - - <0.1 <0.1 0.2 0.7 5.4
effect:hope 0.1 0.6 4.8
LRIA 0.6 0.5 0.5 4.0
Aggregate industry - - <0.1 0.1 - <0.1 <0.1 0.7 0.4 0.4 3.1
Turing Foundation 0.6 0.3 0.3 - - 0.4 3.1
Canadian CIHR - 0.2 - - - - - - - 0.3 2.6
DAHW <0.1 <0.1 0.1 0.1 0.1 0.1 <0.1 0.1 0.2 1.3
CLTRF - - - - - 0.1 0.1 0.8
ALM 0.8 0.6 0.5 0.6 0.3 0.2 <0.1 - - <0.1 0.7
Subtotal of top 12^ 11 12 11 9.2 15 13 11 11 11 12 97
Disease total 12 12 11 9.3 15 14 11 11 11 13 100
Table 19. Top leprosy R&D funders 2017
US$ (millio
ns)
Product 2017 % of total
US$ (millio
ns)
Funder 2017 % of total
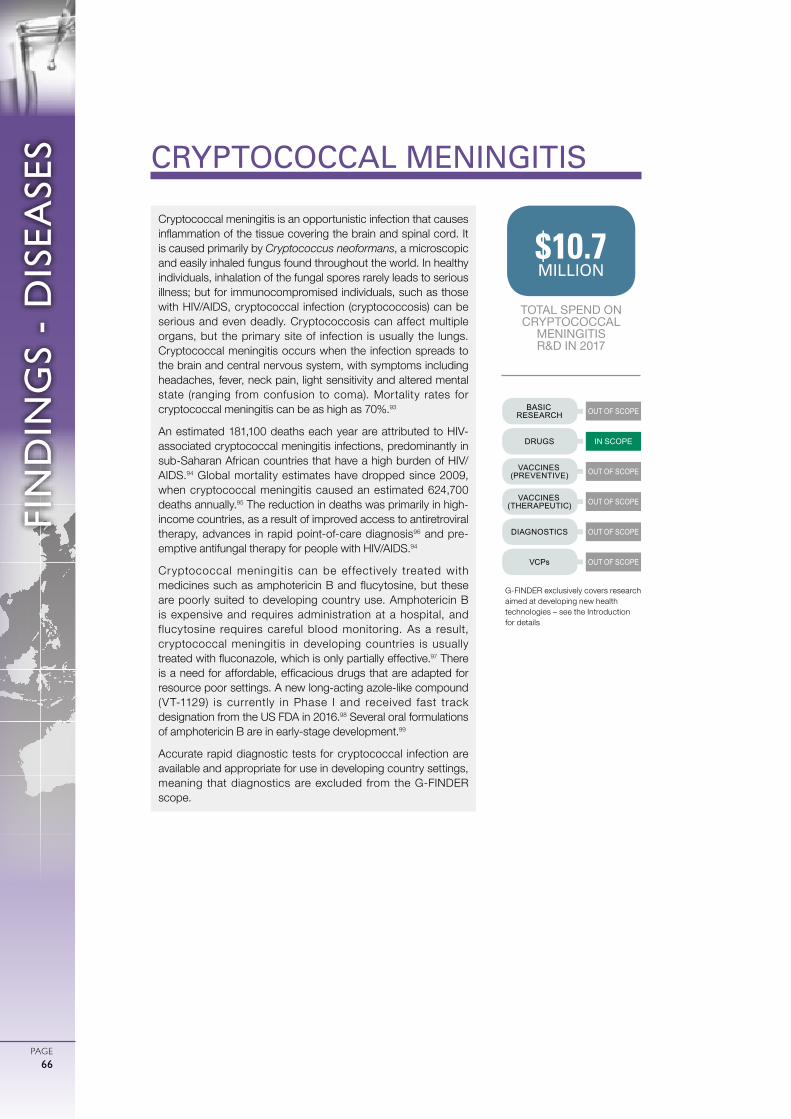
0
ガル図法(赤道縮尺) 1:47,000,000
1000 2000 3000 4000 5000km
75゜
60゜
45゜
30゜
15゜
0゜
15゜
30゜
45゜
60゜
75゜
90゜
180゜ 165゜ 150゜ 135゜ 120゜ 105゜ 90゜ 75゜ 60゜ 45゜ 30゜ 15゜ 15゜ 0゜ 165゜ 150゜ 135゜ 120゜ 105゜ 90゜ 75゜ 60゜ 45゜
FIN
DIN
GS
- D
ISEA
SES
PAGE66
CRYPTOCOCCAL MENINGITIS
Cryptococcal meningitis is an opportunistic infection that causes inflammation of the tissue covering the brain and spinal cord. It is caused primarily by Cryptococcus neoformans, a microscopic and easily inhaled fungus found throughout the world. In healthy individuals, inhalation of the fungal spores rarely leads to serious illness; but for immunocompromised individuals, such as those with HIV/AIDS, cryptococcal infection (cryptococcosis) can be serious and even deadly. Cryptococcosis can affect multiple organs, but the primary site of infection is usually the lungs. Cryptococcal meningitis occurs when the infection spreads to the brain and central nervous system, with symptoms including headaches, fever, neck pain, light sensitivity and altered mental state (ranging from confusion to coma). Mortality rates for cryptococcal meningitis can be as high as 70%.93
An estimated 181,100 deaths each year are attributed to HIV-associated cryptococcal meningitis infections, predominantly in sub-Saharan African countries that have a high burden of HIV/AIDS.94 Global mortality estimates have dropped since 2009, when cryptococcal meningitis caused an estimated 624,700 deaths annually.95 The reduction in deaths was primarily in high-income countries, as a result of improved access to antiretroviral therapy, advances in rapid point-of-care diagnosis96 and pre-emptive antifungal therapy for people with HIV/AIDS.94
Cryptococcal meningitis can be ef fectively treated with medicines such as amphotericin B and flucytosine, but these are poorly suited to developing country use. Amphotericin B is expensive and requires administration at a hospital, and flucytosine requires careful blood monitoring. As a result, cryptococcal meningitis in developing countries is usually treated with fluconazole, which is only partially effective.97 There is a need for affordable, efficacious drugs that are adapted for resource poor settings. A new long-acting azole-like compound (VT-1129) is currently in Phase I and received fast track designation from the US FDA in 2016.98 Several oral formulations of amphotericin B are in early-stage development.99
Accurate rapid diagnostic tests for cryptococcal infection are available and appropriate for use in developing country settings, meaning that diagnostics are excluded from the G-FINDER scope.
OUT OF SCOPE
OUT OF SCOPE
OUT OF SCOPE
IN SCOPE
OUT OF SCOPE
OUT OF SCOPE
BASIC RESEARCH
DRUGS
VACCINES (PREVENTIVE)
VACCINES (THERAPEUTIC)
DIAGNOSTICS
VCPs
TOTAL SPEND ON CRYPTOCOCCAL
MENINGITIS R&D IN 2017
$10.7 MILLION
G-FINDER exclusively covers research aimed at developing new health technologies – see the Introduction for details
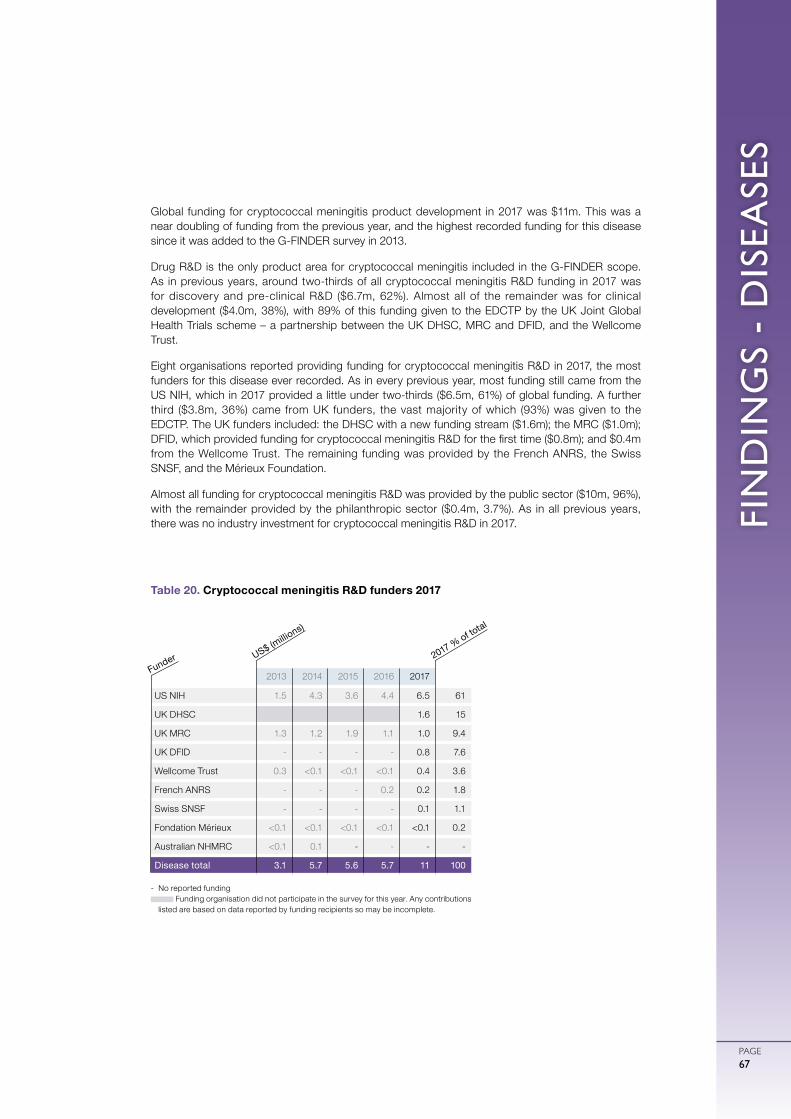
FIN
DIN
GS
- D
ISEA
SES
PAGE67
Global funding for cryptococcal meningitis product development in 2017 was $11m. This was a near doubling of funding from the previous year, and the highest recorded funding for this disease since it was added to the G-FINDER survey in 2013.
Drug R&D is the only product area for cryptococcal meningitis included in the G-FINDER scope. As in previous years, around two-thirds of all cryptococcal meningitis R&D funding in 2017 was for discovery and pre-clinical R&D ($6.7m, 62%). Almost all of the remainder was for clinical development ($4.0m, 38%), with 89% of this funding given to the EDCTP by the UK Joint Global Health Trials scheme – a partnership between the UK DHSC, MRC and DFID, and the Wellcome Trust.
Eight organisations reported providing funding for cryptococcal meningitis R&D in 2017, the most funders for this disease ever recorded. As in every previous year, most funding still came from the US NIH, which in 2017 provided a little under two-thirds ($6.5m, 61%) of global funding. A further third ($3.8m, 36%) came from UK funders, the vast majority of which (93%) was given to the EDCTP. The UK funders included: the DHSC with a new funding stream ($1.6m); the MRC ($1.0m); DFID, which provided funding for cryptococcal meningitis R&D for the first time ($0.8m); and $0.4m from the Wellcome Trust. The remaining funding was provided by the French ANRS, the Swiss SNSF, and the Mérieux Foundation.
Almost all funding for cryptococcal meningitis R&D was provided by the public sector ($10m, 96%), with the remainder provided by the philanthropic sector ($0.4m, 3.7%). As in all previous years, there was no industry investment for cryptococcal meningitis R&D in 2017.
Table 20. Cryptococcal meningitis R&D funders 2017
2013 2014 2015 2016 2017
US NIH 1.5 4.3 3.6 4.4 6.5 61
UK DHSC 1.6 15
UK MRC 1.3 1.2 1.9 1.1 1.0 9.4
UK DFID - - - - 0.8 7.6
Wellcome Trust 0.3 <0.1 <0.1 <0.1 0.4 3.6
French ANRS - - - 0.2 0.2 1.8
Swiss SNSF - - - - 0.1 1.1
Fondation Mérieux <0.1 <0.1 <0.1 <0.1 <0.1 0.2
Australian NHMRC <0.1 0.1 - - - -
Disease total 3.1 5.7 5.6 5.7 11 100
- No reported funding Funding organisation did not participate in the survey for this year. Any contributions
listed are based on data reported by funding recipients so may be incomplete.
Funder US$ (millio
ns)
2017 % of total
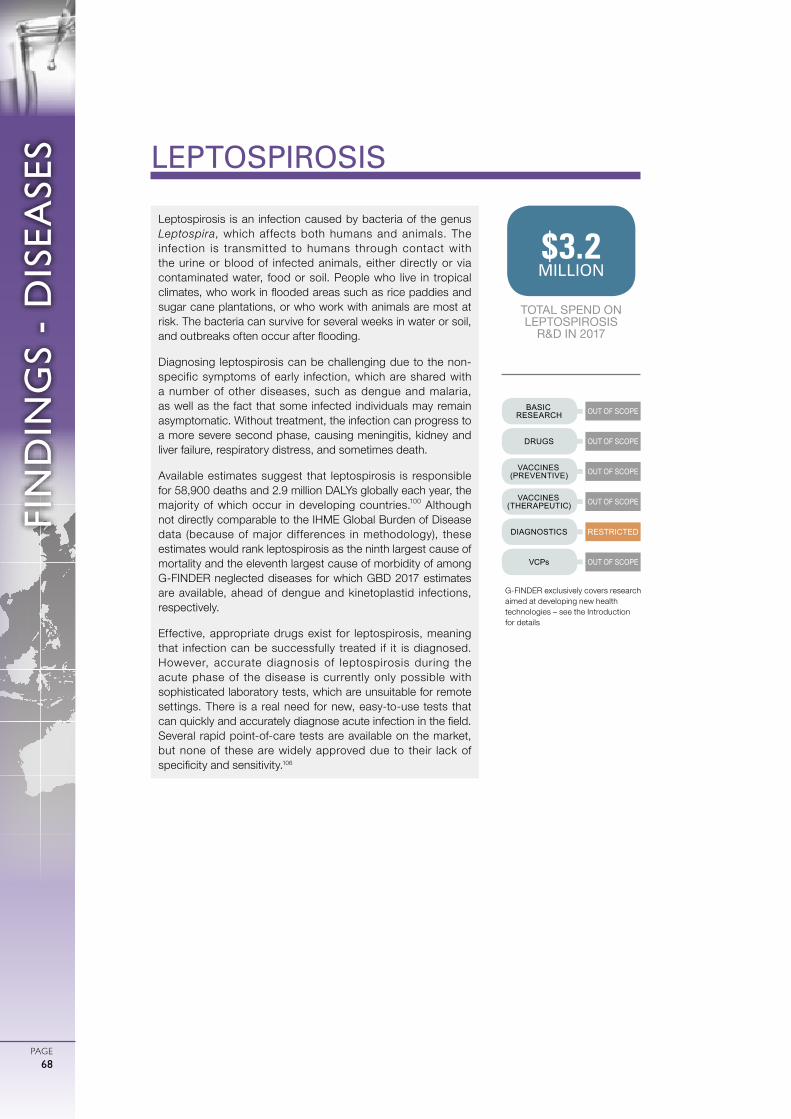
0
ガル図法(赤道縮尺) 1:47,000,000
1000 2000 3000 4000 5000km
75゜
60゜
45゜
30゜
15゜
0゜
15゜
30゜
45゜
60゜
75゜
90゜
180゜ 165゜ 150゜ 135゜ 120゜ 105゜ 90゜ 75゜ 60゜ 45゜ 30゜ 15゜ 15゜ 0゜ 165゜ 150゜ 135゜ 120゜ 105゜ 90゜ 75゜ 60゜ 45゜
FIN
DIN
GS
- D
ISEA
SES
PAGE68
LEPTOSPIROSIS
Leptospirosis is an infection caused by bacteria of the genus Leptospira, which affects both humans and animals. The infection is transmitted to humans through contact with the urine or blood of infected animals, either directly or via contaminated water, food or soil. People who live in tropical climates, who work in flooded areas such as rice paddies and sugar cane plantations, or who work with animals are most at risk. The bacteria can survive for several weeks in water or soil, and outbreaks often occur after flooding.
Diagnosing leptospirosis can be challenging due to the non-specific symptoms of early infection, which are shared with a number of other diseases, such as dengue and malaria, as well as the fact that some infected individuals may remain asymptomatic. Without treatment, the infection can progress to a more severe second phase, causing meningitis, kidney and liver failure, respiratory distress, and sometimes death.
Available estimates suggest that leptospirosis is responsible for 58,900 deaths and 2.9 million DALYs globally each year, the majority of which occur in developing countries.100 Although not directly comparable to the IHME Global Burden of Disease data (because of major differences in methodology), these estimates would rank leptospirosis as the ninth largest cause of mortality and the eleventh largest cause of morbidity of among G-FINDER neglected diseases for which GBD 2017 estimates are available, ahead of dengue and kinetoplastid infections, respectively.
Effective, appropriate drugs exist for leptospirosis, meaning that infection can be successfully treated if it is diagnosed. However, accurate diagnosis of leptospirosis during the acute phase of the disease is currently only possible with sophisticated laboratory tests, which are unsuitable for remote settings. There is a real need for new, easy-to-use tests that can quickly and accurately diagnose acute infection in the field. Several rapid point-of-care tests are available on the market, but none of these are widely approved due to their lack of specificity and sensitivity.106
OUT OF SCOPE
OUT OF SCOPE
OUT OF SCOPE
OUT OF SCOPE
OUT OF SCOPE
RESTRICTED
BASIC RESEARCH
DRUGS
VACCINES (PREVENTIVE)
VACCINES (THERAPEUTIC)
DIAGNOSTICS
VCPs
TOTAL SPEND ON LEPTOSPIROSIS
R&D IN 2017
$3.2 MILLION
G-FINDER exclusively covers research aimed at developing new health technologies – see the Introduction for details
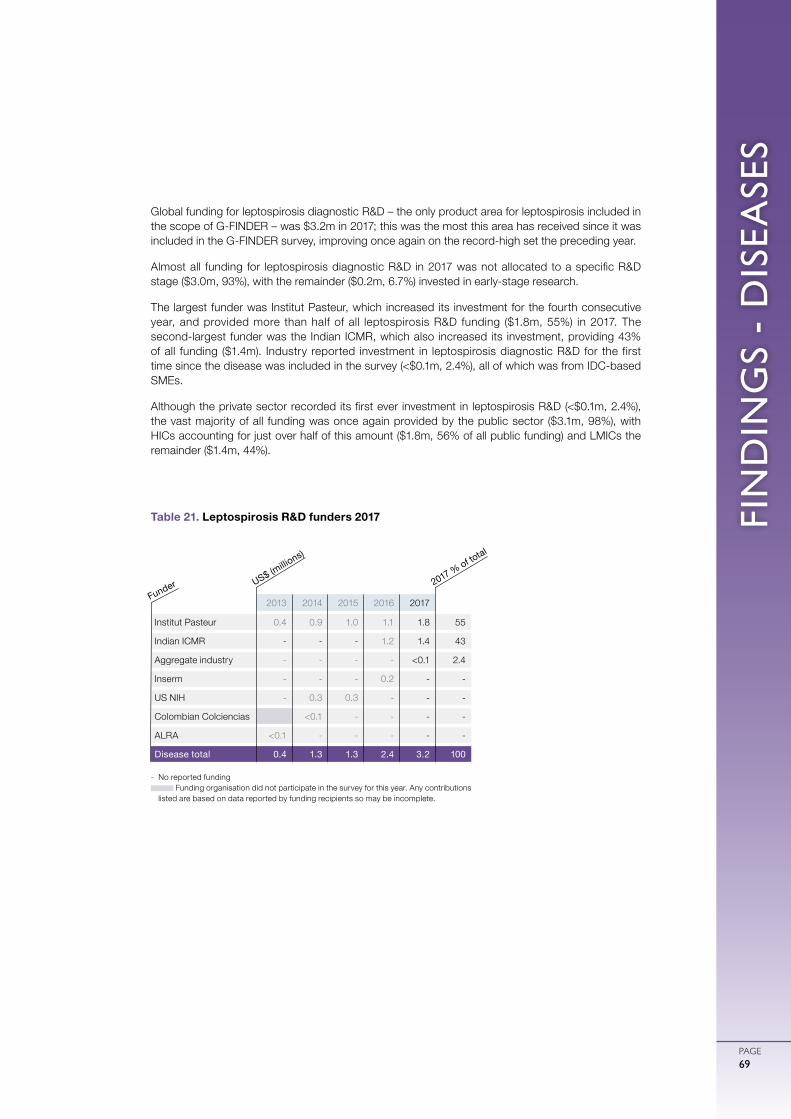
FIN
DIN
GS
- D
ISEA
SES
PAGE69
Global funding for leptospirosis diagnostic R&D – the only product area for leptospirosis included in the scope of G-FINDER – was $3.2m in 2017; this was the most this area has received since it was included in the G-FINDER survey, improving once again on the record-high set the preceding year.
Almost all funding for leptospirosis diagnostic R&D in 2017 was not allocated to a specific R&D stage ($3.0m, 93%), with the remainder ($0.2m, 6.7%) invested in early-stage research.
The largest funder was Institut Pasteur, which increased its investment for the fourth consecutive year, and provided more than half of all leptospirosis R&D funding ($1.8m, 55%) in 2017. The second-largest funder was the Indian ICMR, which also increased its investment, providing 43% of all funding ($1.4m). Industry reported investment in leptospirosis diagnostic R&D for the first time since the disease was included in the survey (<$0.1m, 2.4%), all of which was from IDC-based SMEs.
Although the private sector recorded its first ever investment in leptospirosis R&D (<$0.1m, 2.4%), the vast majority of all funding was once again provided by the public sector ($3.1m, 98%), with HICs accounting for just over half of this amount ($1.8m, 56% of all public funding) and LMICs the remainder ($1.4m, 44%).
Table 21. Leptospirosis R&D funders 2017
2013 2014 2015 2016 2017
Institut Pasteur 0.4 0.9 1.0 1.1 1.8 55
Indian ICMR - - - 1.2 1.4 43
Aggregate industry - - - - <0.1 2.4
Inserm - - - 0.2 - -
US NIH - 0.3 0.3 - - -
Colombian Colciencias <0.1 - - - -
ALRA <0.1 - - - - -
Disease total 0.4 1.3 1.3 2.4 3.2 100
- No reported funding Funding organisation did not participate in the survey for this year. Any contributions
listed are based on data reported by funding recipients so may be incomplete.
Funder US$ (millio
ns)
2017 % of total
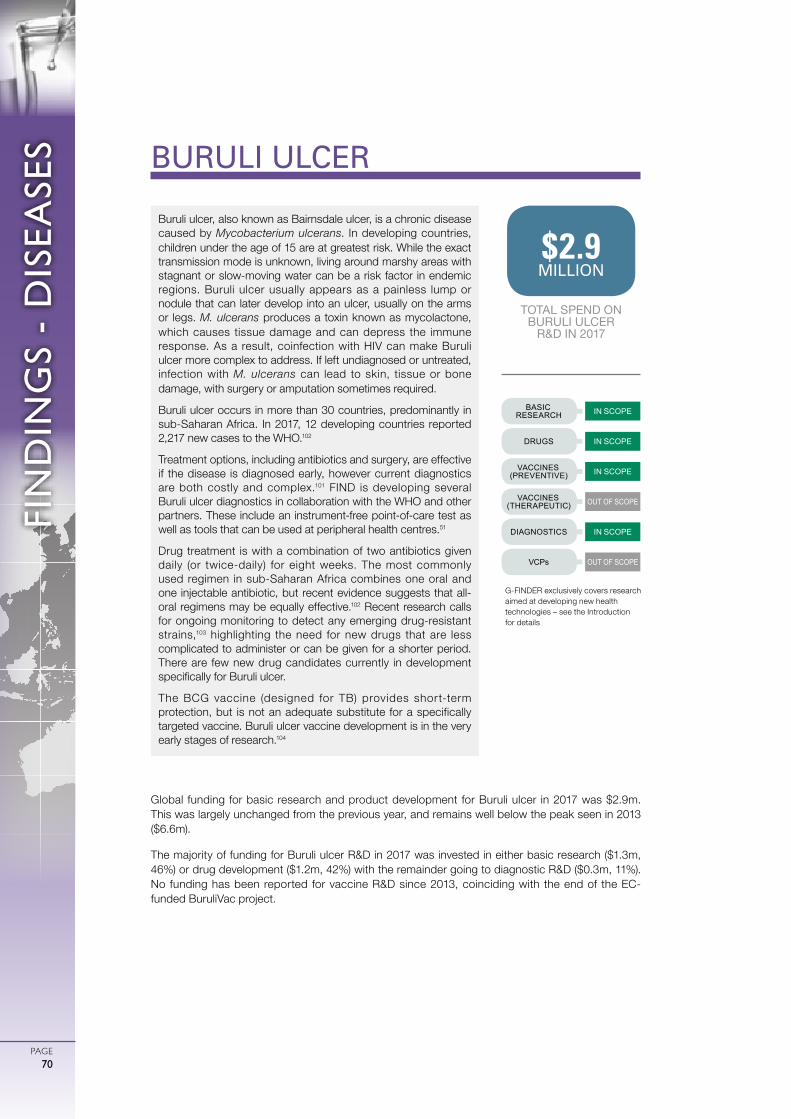
0
ガル図法(赤道縮尺) 1:47,000,000
1000 2000 3000 4000 5000km
75゜
60゜
45゜
30゜
15゜
0゜
15゜
30゜
45゜
60゜
75゜
90゜
180゜ 165゜ 150゜ 135゜ 120゜ 105゜ 90゜ 75゜ 60゜ 45゜ 30゜ 15゜ 15゜ 0゜ 165゜ 150゜ 135゜ 120゜ 105゜ 90゜ 75゜ 60゜ 45゜
FIN
DIN
GS
- D
ISEA
SES
PAGE70
Global funding for basic research and product development for Buruli ulcer in 2017 was $2.9m. This was largely unchanged from the previous year, and remains well below the peak seen in 2013 ($6.6m).
The majority of funding for Buruli ulcer R&D in 2017 was invested in either basic research ($1.3m, 46%) or drug development ($1.2m, 42%) with the remainder going to diagnostic R&D ($0.3m, 11%). No funding has been reported for vaccine R&D since 2013, coinciding with the end of the EC-funded BuruliVac project.
BURULI ULCER
Buruli ulcer, also known as Bairnsdale ulcer, is a chronic disease caused by Mycobacterium ulcerans. In developing countries, children under the age of 15 are at greatest risk. While the exact transmission mode is unknown, living around marshy areas with stagnant or slow-moving water can be a risk factor in endemic regions. Buruli ulcer usually appears as a painless lump or nodule that can later develop into an ulcer, usually on the arms or legs. M. ulcerans produces a toxin known as mycolactone, which causes tissue damage and can depress the immune response. As a result, coinfection with HIV can make Buruli ulcer more complex to address. If left undiagnosed or untreated, infection with M. ulcerans can lead to skin, tissue or bone damage, with surgery or amputation sometimes required.
Buruli ulcer occurs in more than 30 countries, predominantly in sub-Saharan Africa. In 2017, 12 developing countries reported 2,217 new cases to the WHO.102
Treatment options, including antibiotics and surgery, are effective if the disease is diagnosed early, however current diagnostics are both costly and complex.101 FIND is developing several Buruli ulcer diagnostics in collaboration with the WHO and other partners. These include an instrument-free point-of-care test as well as tools that can be used at peripheral health centres.51
Drug treatment is with a combination of two antibiotics given daily (or twice-daily) for eight weeks. The most commonly used regimen in sub-Saharan Africa combines one oral and one injectable antibiotic, but recent evidence suggests that all-oral regimens may be equally effective.102 Recent research calls for ongoing monitoring to detect any emerging drug-resistant strains,103 highlighting the need for new drugs that are less complicated to administer or can be given for a shorter period. There are few new drug candidates currently in development specifically for Buruli ulcer.
The BCG vaccine (designed for TB) provides short-term protection, but is not an adequate substitute for a specifically targeted vaccine. Buruli ulcer vaccine development is in the very early stages of research.104
IN SCOPE
OUT OF SCOPE
OUT OF SCOPE
IN SCOPE
IN SCOPE
IN SCOPE
BASIC RESEARCH
DRUGS
VACCINES (PREVENTIVE)
VACCINES (THERAPEUTIC)
DIAGNOSTICS
VCPs
TOTAL SPEND ON BURULI ULCER
R&D IN 2017
$2.9 MILLION
G-FINDER exclusively covers research aimed at developing new health technologies – see the Introduction for details
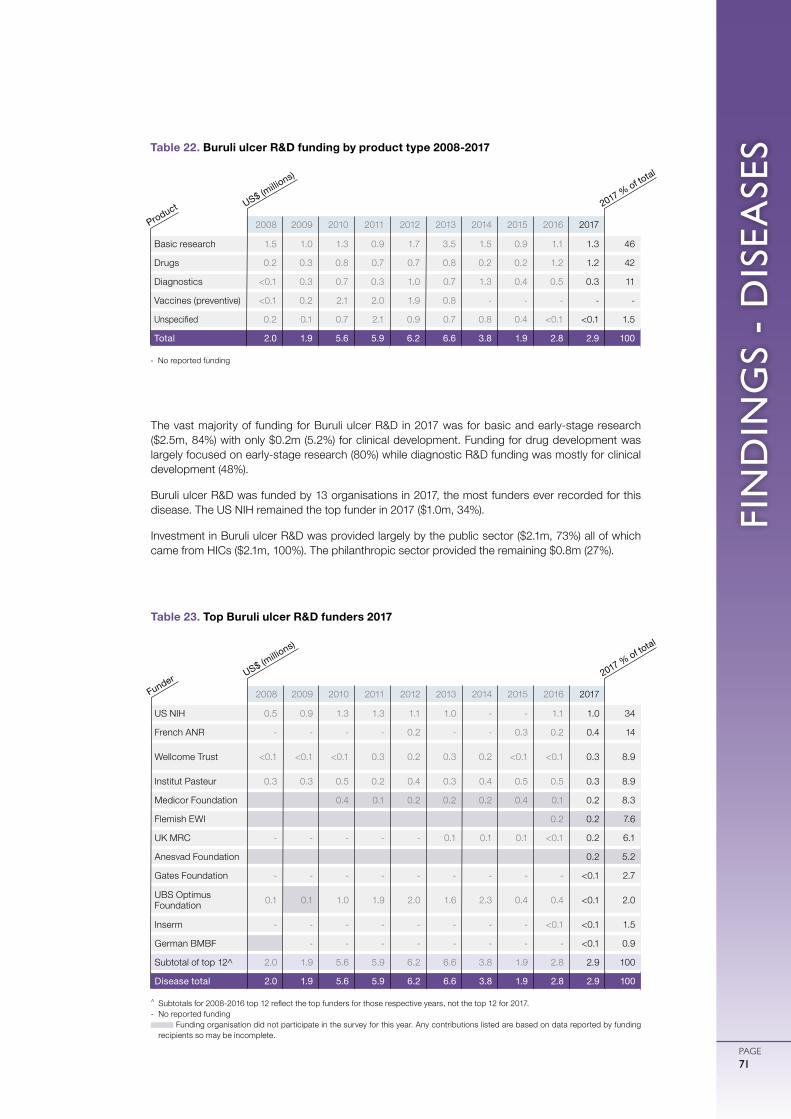
FIN
DIN
GS
- D
ISEA
SES
PAGE71
The vast majority of funding for Buruli ulcer R&D in 2017 was for basic and early-stage research ($2.5m, 84%) with only $0.2m (5.2%) for clinical development. Funding for drug development was largely focused on early-stage research (80%) while diagnostic R&D funding was mostly for clinical development (48%).
Buruli ulcer R&D was funded by 13 organisations in 2017, the most funders ever recorded for this disease. The US NIH remained the top funder in 2017 ($1.0m, 34%).
Investment in Buruli ulcer R&D was provided largely by the public sector ($2.1m, 73%) all of which came from HICs ($2.1m, 100%). The philanthropic sector provided the remaining $0.8m (27%).
- No reported funding
2008 2009 2010 2011 2012 2013 2014 2015 2016 2017
Basic research 1.5 1.0 1.3 0.9 1.7 3.5 1.5 0.9 1.1 1.3 46
Drugs 0.2 0.3 0.8 0.7 0.7 0.8 0.2 0.2 1.2 1.2 42
Diagnostics <0.1 0.3 0.7 0.3 1.0 0.7 1.3 0.4 0.5 0.3 11
Vaccines (preventive) <0.1 0.2 2.1 2.0 1.9 0.8 - - - - -
Unspecified 0.2 0.1 0.7 2.1 0.9 0.7 0.8 0.4 <0.1 <0.1 1.5
Total 2.0 1.9 5.6 5.9 6.2 6.6 3.8 1.9 2.8 2.9 100
Table 22. Buruli ulcer R&D funding by product type 2008-2017
^ Subtotals for 2008-2016 top 12 reflect the top funders for those respective years, not the top 12 for 2017.- No reported funding
Funding organisation did not participate in the survey for this year. Any contributions listed are based on data reported by funding recipients so may be incomplete.
2008 2009 2010 2011 2012 2013 2014 2015 2016 2017
US NIH 0.5 0.9 1.3 1.3 1.1 1.0 - - 1.1 1.0 34
French ANR - - - - 0.2 - - 0.3 0.2 0.4 14
Wellcome Trust <0.1 <0.1 <0.1 0.3 0.2 0.3 0.2 <0.1 <0.1 0.3 8.9
Institut Pasteur 0.3 0.3 0.5 0.2 0.4 0.3 0.4 0.5 0.5 0.3 8.9
Medicor Foundation 0.4 0.1 0.2 0.2 0.2 0.4 0.1 0.2 8.3
Flemish EWI 0.2 0.2 7.6
UK MRC - - - - - 0.1 0.1 0.1 <0.1 0.2 6.1
Anesvad Foundation 0.2 5.2
Gates Foundation - - - - - - - - - <0.1 2.7
UBS Optimus Foundation 0.1 0.1 1.0 1.9 2.0 1.6 2.3 0.4 0.4 <0.1 2.0
Inserm - - - - - - - - <0.1 <0.1 1.5
German BMBF - - - - - - - - <0.1 0.9
Subtotal of top 12^ 2.0 1.9 5.6 5.9 6.2 6.6 3.8 1.9 2.8 2.9 100
Disease total 2.0 1.9 5.6 5.9 6.2 6.6 3.8 1.9 2.8 2.9 100
Table 23. Top Buruli ulcer R&D funders 2017
US$ (millio
ns)
Product 2017 % of total
US$ (millio
ns)
Funder 2017 % of total
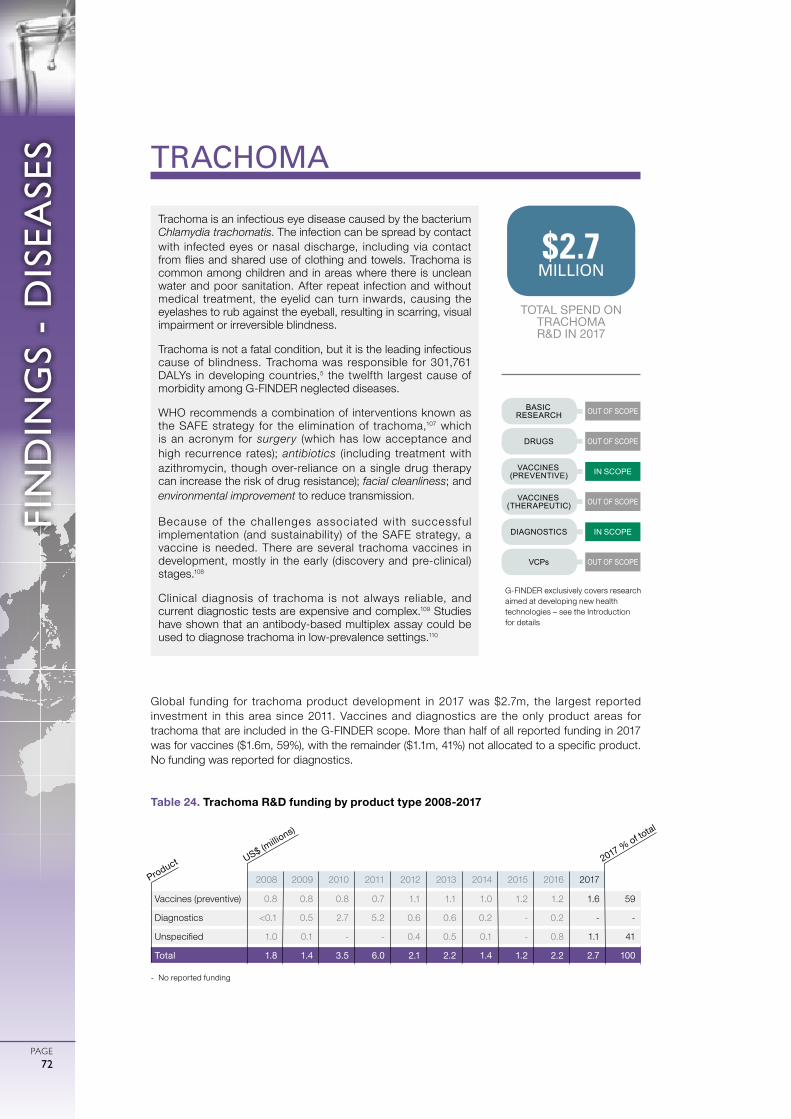
0
ガル図法(赤道縮尺) 1:47,000,000
1000 2000 3000 4000 5000km
75゜
60゜
45゜
30゜
15゜
0゜
15゜
30゜
45゜
60゜
75゜
90゜
180゜ 165゜ 150゜ 135゜ 120゜ 105゜ 90゜ 75゜ 60゜ 45゜ 30゜ 15゜ 15゜ 0゜ 165゜ 150゜ 135゜ 120゜ 105゜ 90゜ 75゜ 60゜ 45゜
FIN
DIN
GS
- D
ISEA
SES
PAGE72
Global funding for trachoma product development in 2017 was $2.7m, the largest reported investment in this area since 2011. Vaccines and diagnostics are the only product areas for trachoma that are included in the G-FINDER scope. More than half of all reported funding in 2017 was for vaccines ($1.6m, 59%), with the remainder ($1.1m, 41%) not allocated to a specific product. No funding was reported for diagnostics.
TRACHOMA
Trachoma is an infectious eye disease caused by the bacterium Chlamydia trachomatis. The infection can be spread by contact with infected eyes or nasal discharge, including via contact from flies and shared use of clothing and towels. Trachoma is common among children and in areas where there is unclean water and poor sanitation. After repeat infection and without medical treatment, the eyelid can turn inwards, causing the eyelashes to rub against the eyeball, resulting in scarring, visual impairment or irreversible blindness.
Trachoma is not a fatal condition, but it is the leading infectious cause of blindness. Trachoma was responsible for 301,761 DALYs in developing countries,5 the twelfth largest cause of morbidity among G-FINDER neglected diseases.
WHO recommends a combination of interventions known as the SAFE strategy for the elimination of trachoma,107 which is an acronym for surgery (which has low acceptance and high recurrence rates); antibiotics (including treatment with azithromycin, though over-reliance on a single drug therapy can increase the risk of drug resistance); facial cleanliness; and environmental improvement to reduce transmission.
Because of the chal lenges associated with successful implementation (and sustainability) of the SAFE strategy, a vaccine is needed. There are several trachoma vaccines in development, mostly in the early (discovery and pre-clinical) stages.108
Clinical diagnosis of trachoma is not always reliable, and current diagnostic tests are expensive and complex.109 Studies have shown that an antibody-based multiplex assay could be used to diagnose trachoma in low-prevalence settings.110
IN SCOPE
OUT OF SCOPE
OUT OF SCOPE
OUT OF SCOPE
OUT OF SCOPE
IN SCOPE
BASIC RESEARCH
DRUGS
VACCINES (PREVENTIVE)
VACCINES (THERAPEUTIC)
DIAGNOSTICS
VCPs
TOTAL SPEND ON TRACHOMA R&D IN 2017
$2.7MILLION
G-FINDER exclusively covers research aimed at developing new health technologies – see the Introduction for details
- No reported funding
2008 2009 2010 2011 2012 2013 2014 2015 2016 2017
Vaccines (preventive) 0.8 0.8 0.8 0.7 1.1 1.1 1.0 1.2 1.2 1.6 59
Diagnostics <0.1 0.5 2.7 5.2 0.6 0.6 0.2 - 0.2 - -
Unspecified 1.0 0.1 - - 0.4 0.5 0.1 - 0.8 1.1 41
Total 1.8 1.4 3.5 6.0 2.1 2.2 1.4 1.2 2.2 2.7 100
Table 24. Trachoma R&D funding by product type 2008-2017
US$ (millio
ns)
Product 2017 % of total
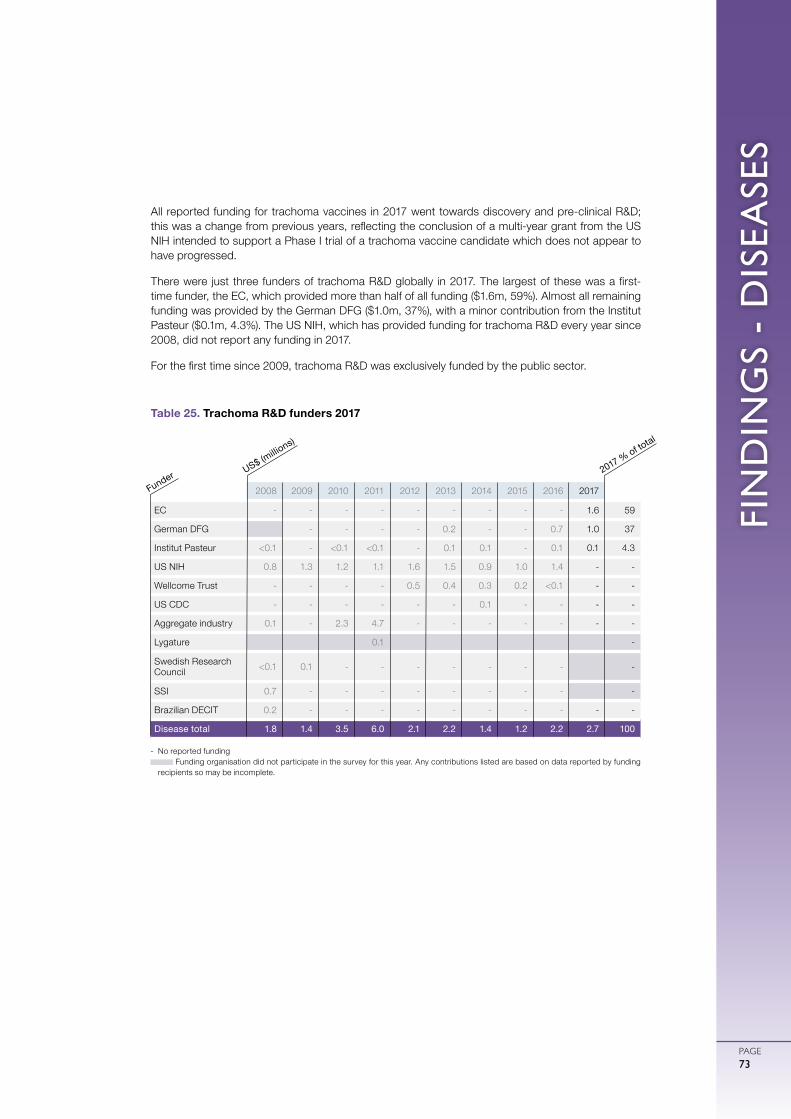
FIN
DIN
GS
- D
ISEA
SES
PAGE73
All reported funding for trachoma vaccines in 2017 went towards discovery and pre-clinical R&D; this was a change from previous years, reflecting the conclusion of a multi-year grant from the US NIH intended to support a Phase I trial of a trachoma vaccine candidate which does not appear to have progressed.
There were just three funders of trachoma R&D globally in 2017. The largest of these was a first-time funder, the EC, which provided more than half of all funding ($1.6m, 59%). Almost all remaining funding was provided by the German DFG ($1.0m, 37%), with a minor contribution from the Institut Pasteur ($0.1m, 4.3%). The US NIH, which has provided funding for trachoma R&D every year since 2008, did not report any funding in 2017.
For the first time since 2009, trachoma R&D was exclusively funded by the public sector.
- No reported funding Funding organisation did not participate in the survey for this year. Any contributions listed are based on data reported by funding
recipients so may be incomplete.
2008 2009 2010 2011 2012 2013 2014 2015 2016 2017
EC - - - - - - - - - 1.6 59
German DFG - - - - 0.2 - - 0.7 1.0 37
Institut Pasteur <0.1 - <0.1 <0.1 - 0.1 0.1 - 0.1 0.1 4.3
US NIH 0.8 1.3 1.2 1.1 1.6 1.5 0.9 1.0 1.4 - -
Wellcome Trust - - - - 0.5 0.4 0.3 0.2 <0.1 - -
US CDC - - - - - - 0.1 - - - -
Aggregate industry 0.1 - 2.3 4.7 - - - - - - -
Lygature 0.1 -
Swedish Research Council <0.1 0.1 - - - - - - - -
SSI 0.7 - - - - - - - - -
Brazilian DECIT 0.2 - - - - - - - - - -
Disease total 1.8 1.4 3.5 6.0 2.1 2.2 1.4 1.2 2.2 2.7 100
Table 25. Trachoma R&D funders 2017
US$ (millio
ns)
Funder 2017 % of total
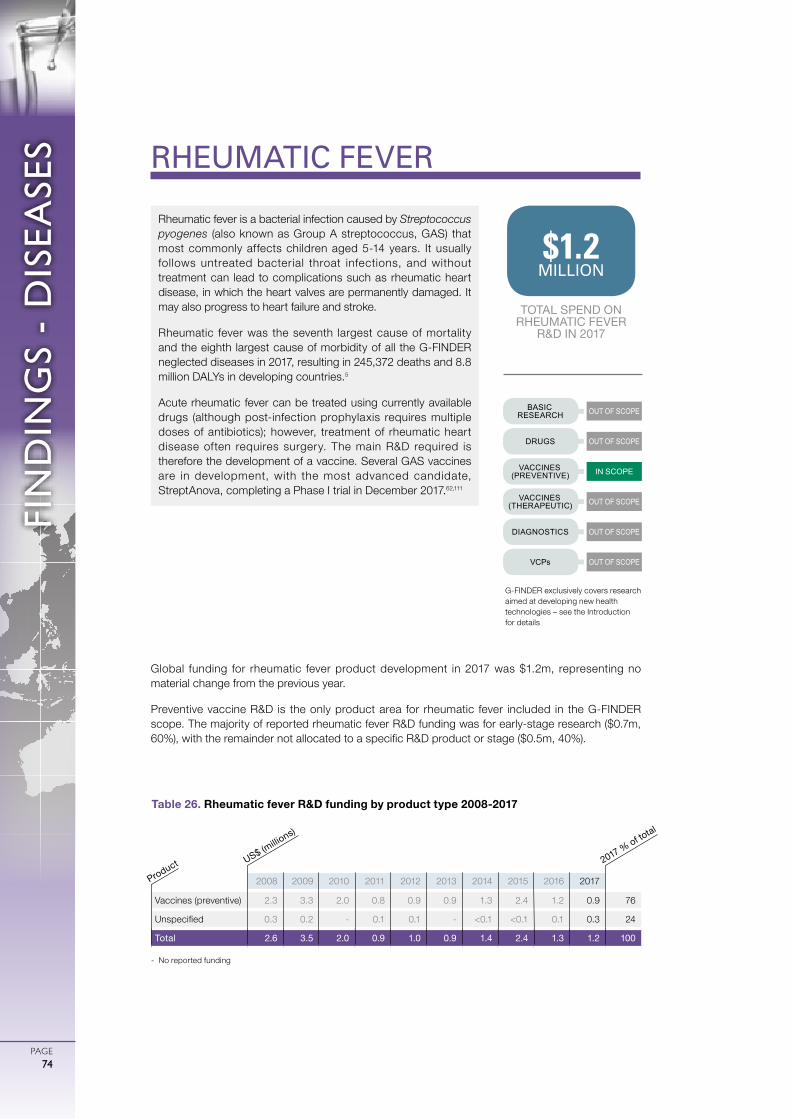
0
ガル図法(赤道縮尺) 1:47,000,000
1000 2000 3000 4000 5000km
75゜
60゜
45゜
30゜
15゜
0゜
15゜
30゜
45゜
60゜
75゜
90゜
180゜ 165゜ 150゜ 135゜ 120゜ 105゜ 90゜ 75゜ 60゜ 45゜ 30゜ 15゜ 15゜ 0゜ 165゜ 150゜ 135゜ 120゜ 105゜ 90゜ 75゜ 60゜ 45゜
FIN
DIN
GS
- D
ISEA
SES
PAGE74
Global funding for rheumatic fever product development in 2017 was $1.2m, representing no material change from the previous year.
Preventive vaccine R&D is the only product area for rheumatic fever included in the G-FINDER scope. The majority of reported rheumatic fever R&D funding was for early-stage research ($0.7m, 60%), with the remainder not allocated to a specific R&D product or stage ($0.5m, 40%).
RHEUMATIC FEVER
Rheumatic fever is a bacterial infection caused by Streptococcus pyogenes (also known as Group A streptococcus, GAS) that most commonly affects children aged 5-14 years. It usually follows untreated bacterial throat infections, and without treatment can lead to complications such as rheumatic heart disease, in which the heart valves are permanently damaged. It may also progress to heart failure and stroke.
Rheumatic fever was the seventh largest cause of mortality and the eighth largest cause of morbidity of all the G-FINDER neglected diseases in 2017, resulting in 245,372 deaths and 8.8 million DALYs in developing countries.5
Acute rheumatic fever can be treated using currently available drugs (although post-infection prophylaxis requires multiple doses of antibiotics); however, treatment of rheumatic heart disease often requires surgery. The main R&D required is therefore the development of a vaccine. Several GAS vaccines are in development, with the most advanced candidate, StreptAnova, completing a Phase I trial in December 2017.62,111
IN SCOPE
OUT OF SCOPE
OUT OF SCOPE
OUT OF SCOPE
OUT OF SCOPE
OUT OF SCOPE
BASIC RESEARCH
DRUGS
VACCINES (PREVENTIVE)
VACCINES (THERAPEUTIC)
DIAGNOSTICS
VCPs
TOTAL SPEND ON RHEUMATIC FEVER
R&D IN 2017
$1.2 MILLION
G-FINDER exclusively covers research aimed at developing new health technologies – see the Introduction for details
- No reported funding
2008 2009 2010 2011 2012 2013 2014 2015 2016 2017
Vaccines (preventive) 2.3 3.3 2.0 0.8 0.9 0.9 1.3 2.4 1.2 0.9 76
Unspecified 0.3 0.2 - 0.1 0.1 - <0.1 <0.1 0.1 0.3 24
Total 2.6 3.5 2.0 0.9 1.0 0.9 1.4 2.4 1.3 1.2 100
Table 26. Rheumatic fever R&D funding by product type 2008-2017
US$ (millio
ns)
Product 2017 % of total
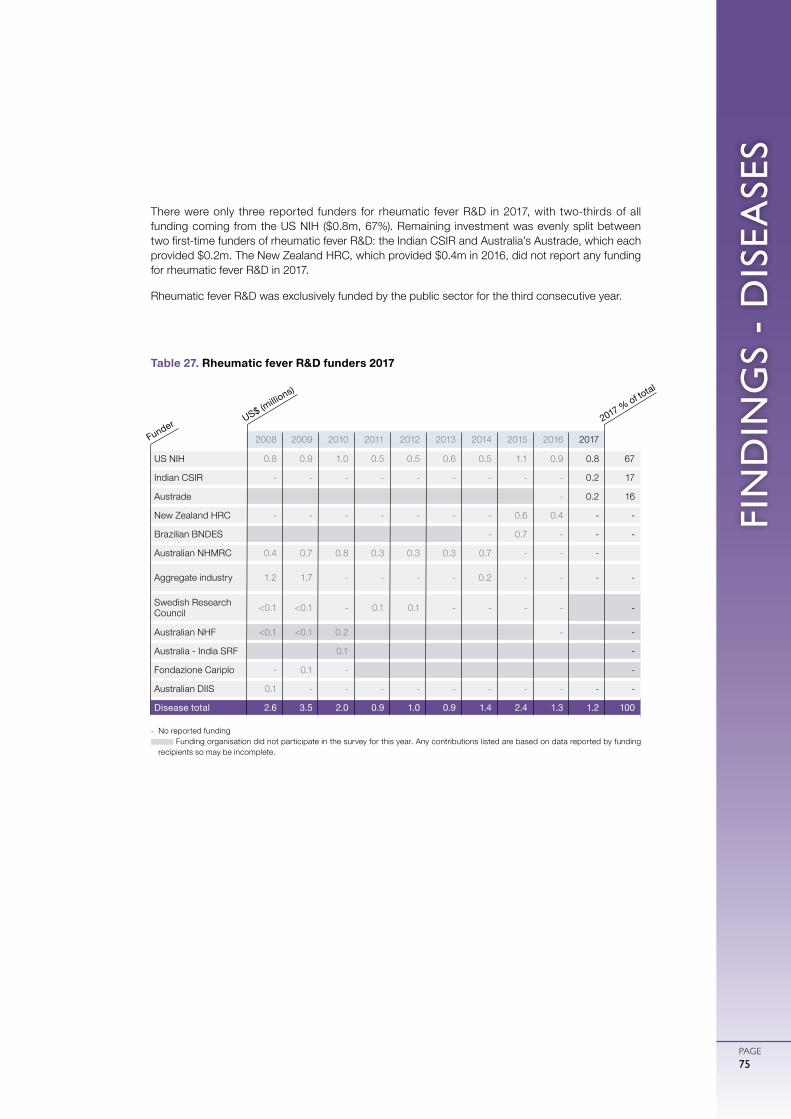
FIN
DIN
GS
- D
ISEA
SES
PAGE75
There were only three reported funders for rheumatic fever R&D in 2017, with two-thirds of all funding coming from the US NIH ($0.8m, 67%). Remaining investment was evenly split between two first-time funders of rheumatic fever R&D: the Indian CSIR and Australia’s Austrade, which each provided $0.2m. The New Zealand HRC, which provided $0.4m in 2016, did not report any funding for rheumatic fever R&D in 2017.
Rheumatic fever R&D was exclusively funded by the public sector for the third consecutive year.
- No reported funding Funding organisation did not participate in the survey for this year. Any contributions listed are based on data reported by funding
recipients so may be incomplete.
2008 2009 2010 2011 2012 2013 2014 2015 2016 2017
US NIH 0.8 0.9 1.0 0.5 0.5 0.6 0.5 1.1 0.9 0.8 67
Indian CSIR - - - - - - - - - 0.2 17
Austrade - 0.2 16
New Zealand HRC - - - - - - - 0.6 0.4 - -
Brazilian BNDES - 0.7 - - -
Australian NHMRC 0.4 0.7 0.8 0.3 0.3 0.3 0.7 - - -
Aggregate industry 1.2 1.7 - - - - 0.2 - - - -
Swedish Research Council <0.1 <0.1 - 0.1 0.1 - - - - -
Australian NHF <0.1 <0.1 0.2 - -
Australia - India SRF 0.1 -
Fondazione Cariplo - 0.1 - -
Australian DIIS 0.1 - - - - - - - - - -
Disease total 2.6 3.5 2.0 0.9 1.0 0.9 1.4 2.4 1.3 1.2 100
Table 27. Rheumatic fever R&D funders 2017
US$ (millio
ns)
Funder 2017 % of total
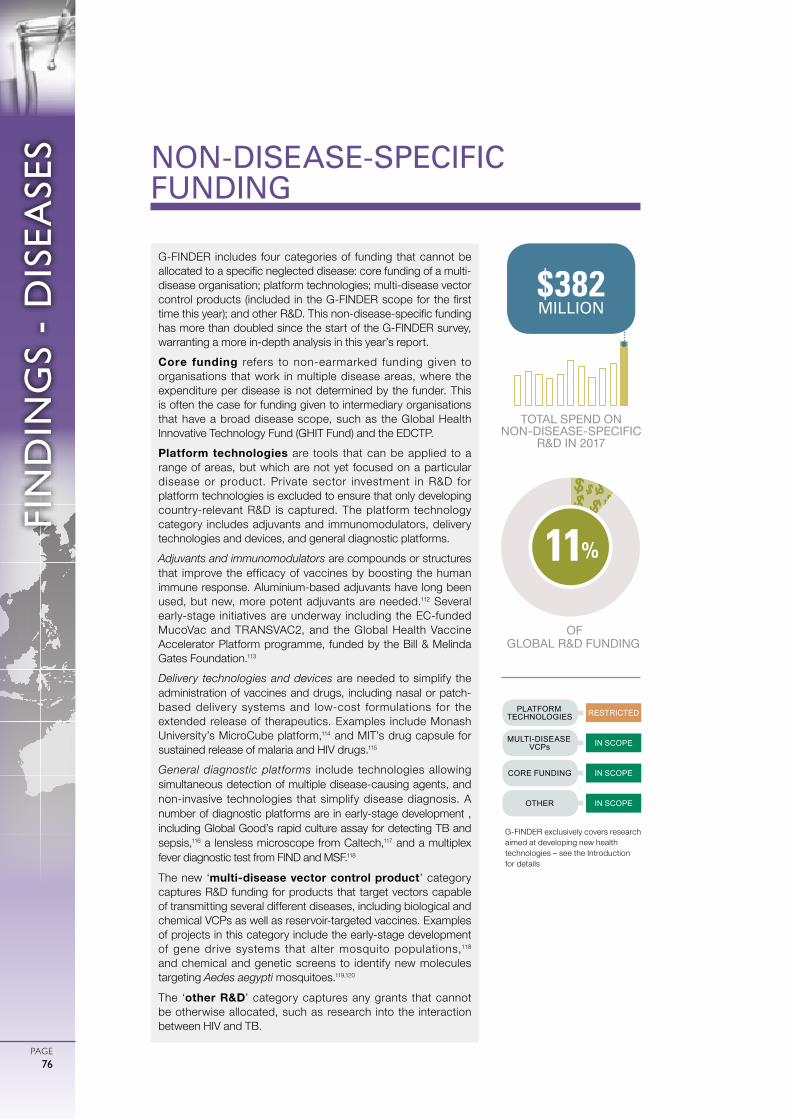
0
ガル図法(赤道縮尺) 1:47,000,000
1000 2000 3000 4000 5000km
75゜
60゜
45゜
30゜
15゜
0゜
15゜
30゜
45゜
60゜
75゜
90゜
180゜ 165゜ 150゜ 135゜ 120゜ 105゜ 90゜ 75゜ 60゜ 45゜ 30゜ 15゜ 15゜ 0゜ 165゜ 150゜ 135゜ 120゜ 105゜ 90゜ 75゜ 60゜ 45゜
FIN
DIN
GS
- D
ISEA
SES
PAGE76
NON-DISEASE-SPECIFIC FUNDING
IN SCOPE
IN SCOPE
IN SCOPE
RESTRICTEDPLATFORM TECHNOLOGIES
MULTI-DISEASE VCPs
CORE FUNDING
OTHER
G-FINDER includes four categories of funding that cannot be allocated to a specific neglected disease: core funding of a multi-disease organisation; platform technologies; multi-disease vector control products (included in the G-FINDER scope for the first time this year); and other R&D. This non-disease-specific funding has more than doubled since the start of the G-FINDER survey, warranting a more in-depth analysis in this year’s report. Core funding refers to non-earmarked funding given to organisations that work in multiple disease areas, where the expenditure per disease is not determined by the funder. This is often the case for funding given to intermediary organisations that have a broad disease scope, such as the Global Health Innovative Technology Fund (GHIT Fund) and the EDCTP.Platform technologies are tools that can be applied to a range of areas, but which are not yet focused on a particular disease or product. Private sector investment in R&D for platform technologies is excluded to ensure that only developing country-relevant R&D is captured. The platform technology category includes adjuvants and immunomodulators, delivery technologies and devices, and general diagnostic platforms. Adjuvants and immunomodulators are compounds or structures that improve the efficacy of vaccines by boosting the human immune response. Aluminium-based adjuvants have long been used, but new, more potent adjuvants are needed.112 Several early-stage initiatives are underway including the EC-funded MucoVac and TRANSVAC2, and the Global Health Vaccine Accelerator Platform programme, funded by the Bill & Melinda Gates Foundation.113
Delivery technologies and devices are needed to simplify the administration of vaccines and drugs, including nasal or patch-based delivery systems and low-cost formulations for the extended release of therapeutics. Examples include Monash University’s MicroCube platform,114 and MIT’s drug capsule for sustained release of malaria and HIV drugs.115
General diagnostic platforms include technologies allowing simultaneous detection of multiple disease-causing agents, and non-invasive technologies that simplify disease diagnosis. A number of diagnostic platforms are in early-stage development , including Global Good’s rapid culture assay for detecting TB and sepsis,116 a lensless microscope from Caltech,117 and a multiplex fever diagnostic test from FIND and MSF.118
The new ‘multi-disease vector control product’ category captures R&D funding for products that target vectors capable of transmitting several different diseases, including biological and chemical VCPs as well as reservoir-targeted vaccines. Examples of projects in this category include the early-stage development of gene drive systems that alter mosquito populations,118
and chemical and genetic screens to identify new molecules targeting Aedes aegypti mosquitoes.119,120
The ‘other R&D’ category captures any grants that cannot be otherwise allocated, such as research into the interaction between HIV and TB.
TOTAL SPEND ON NON-DISEASE-SPECIFIC
R&D IN 2017
$382 MILLION
OF GLOBAL R&D FUNDING
32%11%
G-FINDER exclusively covers research aimed at developing new health technologies – see the Introduction for details
FIN
DIN
GS
- D
ISEA
SES
PAGE77
This year’s G-FINDER scope was expanded to include funding intended to support research applicable to both neglected diseases and emerging infectious diseases (EIDs). Funding for R&D targeted exclusively at EIDs continues to be excluded from G-FINDER.
More than 1 dollar in every 10 invested in neglected disease basic research and product development in 2017 was not targeted at a specific disease; non-disease-specific funding totalled $382m, or 11% of all neglected disease R&D funding. This was both the most funding and the largest share of total funding that was not disease-specific since the start of the G-FINDER survey, even after accounting for the inclusion in 2017 of projects relevant to both neglected diseases and EIDs.
Almost all non-disease-specific funding was for projects only relevant to neglected diseases ($366m, 88%), with the remainder ($45m, 12%) going to projects relevant to both neglected disease and EID research. Essentially all (99%) of the funding relevant to both neglected diseases and EIDs was for either multi-disease vector control products, general diagnostics or other unspecified R&D.
CORE FUNDING OF MULTI-DISEASE ORGANISATIONS
Core funding of multi-disease organisations accounted for the vast majority of all non-disease-specific investment in 2017, receiving more than a quarter of a billion dollars ($277m, 7.8% of total global funding for neglected disease R&D). This was a significant increase from the previous year (up $118m, 75%), and the most funding this area has received in the history of the G-FINDER survey. Half of the increase was due to sharply higher funding of the EDCTP from the EC (up $47m, 571%) and the UK DHSC (which provided $22m under a new ODA funding stream). The remaining growth was due to a more than doubling of core funding from the Gates Foundation (up $33m, 132%) – reflecting both $19m in new funding to the Bill & Melinda Gates Medical Research Institute and a cyclical increase in funding to PATH (up $15m, from a low base in 2016) – as well as an increase from the Wellcome Trust (up $11m, 30%), due to new investment in its international research programmes in sub-Saharan Africa, and growth in industry funding for the Global Health Innovative Technology Fund (GHIT, up $5.4m, 71%).
The top 12 funders provided 94% of all core funding in 2017. The top three – the Gates Foundation, the EC and the Wellcome Trust – collectively accounted for more than half ($163m, 59%), and each contributed their highest level of core funding ever recorded in G-FINDER.
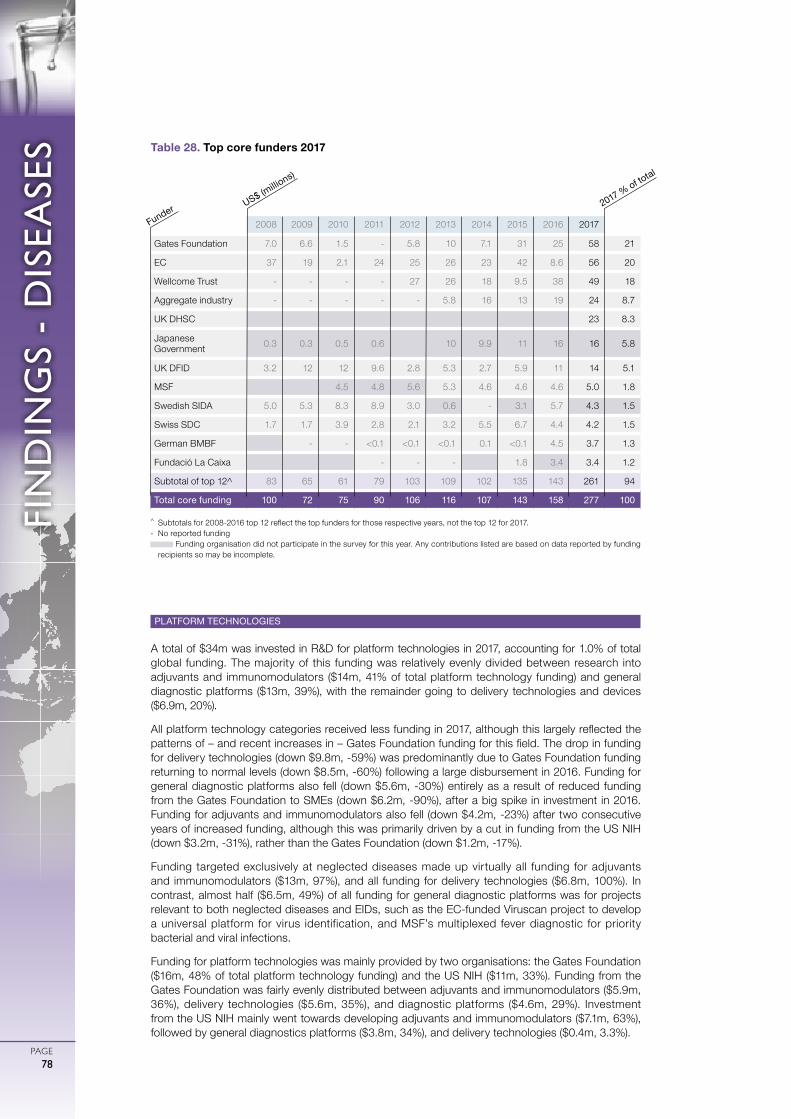
0
ガル図法(赤道縮尺) 1:47,000,000
1000 2000 3000 4000 5000km
75゜
60゜
45゜
30゜
15゜
0゜
15゜
30゜
45゜
60゜
75゜
90゜
180゜ 165゜ 150゜ 135゜ 120゜ 105゜ 90゜ 75゜ 60゜ 45゜ 30゜ 15゜ 15゜ 0゜ 165゜ 150゜ 135゜ 120゜ 105゜ 90゜ 75゜ 60゜ 45゜
FIN
DIN
GS
- D
ISEA
SES
PAGE78
PLATFORM TECHNOLOGIES
A total of $34m was invested in R&D for platform technologies in 2017, accounting for 1.0% of total global funding. The majority of this funding was relatively evenly divided between research into adjuvants and immunomodulators ($14m, 41% of total platform technology funding) and general diagnostic platforms ($13m, 39%), with the remainder going to delivery technologies and devices ($6.9m, 20%).
All platform technology categories received less funding in 2017, although this largely reflected the patterns of – and recent increases in – Gates Foundation funding for this field. The drop in funding for delivery technologies (down $9.8m, -59%) was predominantly due to Gates Foundation funding returning to normal levels (down $8.5m, -60%) following a large disbursement in 2016. Funding for general diagnostic platforms also fell (down $5.6m, -30%) entirely as a result of reduced funding from the Gates Foundation to SMEs (down $6.2m, -90%), after a big spike in investment in 2016. Funding for adjuvants and immunomodulators also fell (down $4.2m, -23%) after two consecutive years of increased funding, although this was primarily driven by a cut in funding from the US NIH (down $3.2m, -31%), rather than the Gates Foundation (down $1.2m, -17%).
Funding targeted exclusively at neglected diseases made up virtually all funding for adjuvants and immunomodulators ($13m, 97%), and all funding for delivery technologies ($6.8m, 100%). In contrast, almost half ($6.5m, 49%) of all funding for general diagnostic platforms was for projects relevant to both neglected diseases and EIDs, such as the EC-funded Viruscan project to develop a universal platform for virus identification, and MSF’s multiplexed fever diagnostic for priority bacterial and viral infections.
Funding for platform technologies was mainly provided by two organisations: the Gates Foundation ($16m, 48% of total platform technology funding) and the US NIH ($11m, 33%). Funding from the Gates Foundation was fairly evenly distributed between adjuvants and immunomodulators ($5.9m, 36%), delivery technologies ($5.6m, 35%), and diagnostic platforms ($4.6m, 29%). Investment from the US NIH mainly went towards developing adjuvants and immunomodulators ($7.1m, 63%), followed by general diagnostics platforms ($3.8m, 34%), and delivery technologies ($0.4m, 3.3%).
^ Subtotals for 2008-2016 top 12 reflect the top funders for those respective years, not the top 12 for 2017.- No reported funding
Funding organisation did not participate in the survey for this year. Any contributions listed are based on data reported by funding recipients so may be incomplete.
2008 2009 2010 2011 2012 2013 2014 2015 2016 2017
Gates Foundation 7.0 6.6 1.5 - 5.8 10 7.1 31 25 58 21
EC 37 19 2.1 24 25 26 23 42 8.6 56 20
Wellcome Trust - - - - 27 26 18 9.5 38 49 18
Aggregate industry - - - - - 5.8 16 13 19 24 8.7
UK DHSC 23 8.3
Japanese Government 0.3 0.3 0.5 0.6 10 9.9 11 16 16 5.8
UK DFID 3.2 12 12 9.6 2.8 5.3 2.7 5.9 11 14 5.1
MSF 4.5 4.8 5.6 5.3 4.6 4.6 4.6 5.0 1.8
Swedish SIDA 5.0 5.3 8.3 8.9 3.0 0.6 - 3.1 5.7 4.3 1.5
Swiss SDC 1.7 1.7 3.9 2.8 2.1 3.2 5.5 6.7 4.4 4.2 1.5
German BMBF - - <0.1 <0.1 <0.1 0.1 <0.1 4.5 3.7 1.3
Fundació La Caixa - - - 1.8 3.4 3.4 1.2
Subtotal of top 12^ 83 65 61 79 103 109 102 135 143 261 94
Total core funding 100 72 75 90 106 116 107 143 158 277 100
Table 28. Top core funders 2017
US$ (millio
ns)
Funder 2017 % of total
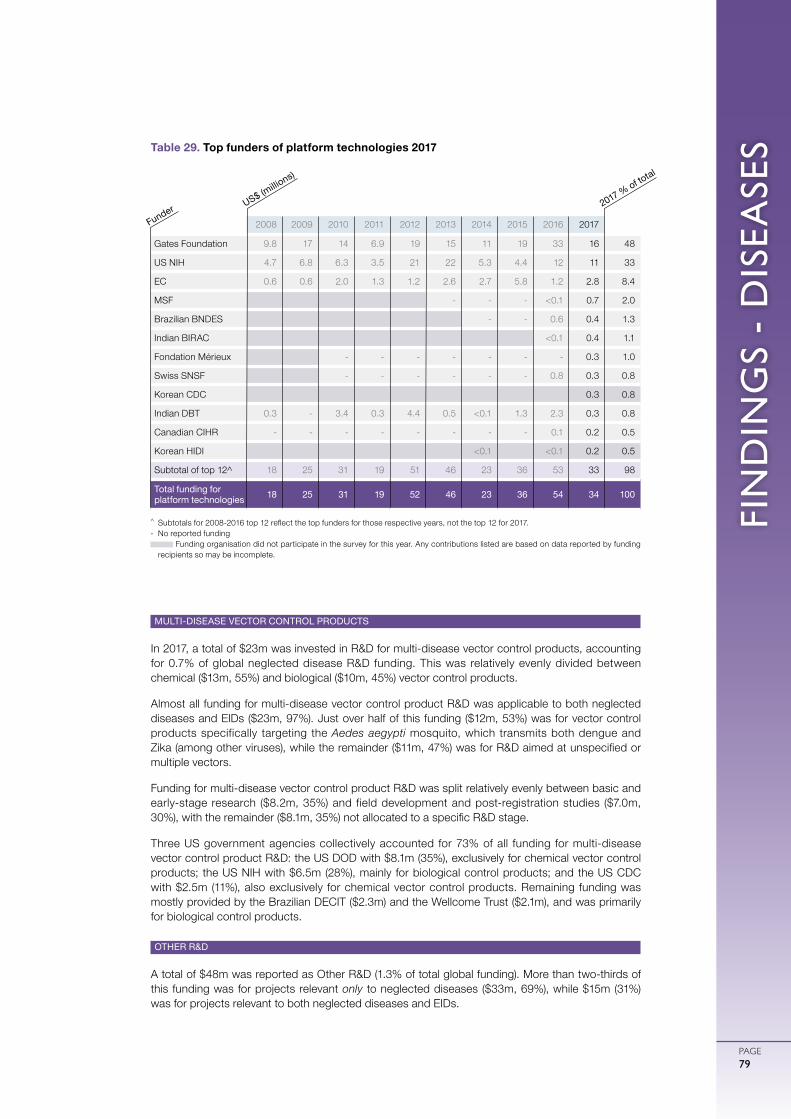
FIN
DIN
GS
- D
ISEA
SES
PAGE79
MULTI-DISEASE VECTOR CONTROL PRODUCTS
In 2017, a total of $23m was invested in R&D for multi-disease vector control products, accounting for 0.7% of global neglected disease R&D funding. This was relatively evenly divided between chemical ($13m, 55%) and biological ($10m, 45%) vector control products.
Almost all funding for multi-disease vector control product R&D was applicable to both neglected diseases and EIDs ($23m, 97%). Just over half of this funding ($12m, 53%) was for vector control products specifically targeting the Aedes aegypti mosquito, which transmits both dengue and Zika (among other viruses), while the remainder ($11m, 47%) was for R&D aimed at unspecified or multiple vectors.
Funding for multi-disease vector control product R&D was split relatively evenly between basic and early-stage research ($8.2m, 35%) and field development and post-registration studies ($7.0m, 30%), with the remainder ($8.1m, 35%) not allocated to a specific R&D stage.
Three US government agencies collectively accounted for 73% of all funding for multi-disease vector control product R&D: the US DOD with $8.1m (35%), exclusively for chemical vector control products; the US NIH with $6.5m (28%), mainly for biological control products; and the US CDC with $2.5m (11%), also exclusively for chemical vector control products. Remaining funding was mostly provided by the Brazilian DECIT ($2.3m) and the Wellcome Trust ($2.1m), and was primarily for biological control products.
OTHER R&D
A total of $48m was reported as Other R&D (1.3% of total global funding). More than two-thirds of this funding was for projects relevant only to neglected diseases ($33m, 69%), while $15m (31%) was for projects relevant to both neglected diseases and EIDs.
^ Subtotals for 2008-2016 top 12 reflect the top funders for those respective years, not the top 12 for 2017.- No reported funding
Funding organisation did not participate in the survey for this year. Any contributions listed are based on data reported by funding recipients so may be incomplete.
2008 2009 2010 2011 2012 2013 2014 2015 2016 2017
Gates Foundation 9.8 17 14 6.9 19 15 11 19 33 16 48
US NIH 4.7 6.8 6.3 3.5 21 22 5.3 4.4 12 11 33
EC 0.6 0.6 2.0 1.3 1.2 2.6 2.7 5.8 1.2 2.8 8.4
MSF - - - <0.1 0.7 2.0
Brazilian BNDES - - 0.6 0.4 1.3
Indian BIRAC <0.1 0.4 1.1
Fondation Mérieux - - - - - - - 0.3 1.0
Swiss SNSF - - - - - - 0.8 0.3 0.8
Korean CDC 0.3 0.8
Indian DBT 0.3 - 3.4 0.3 4.4 0.5 <0.1 1.3 2.3 0.3 0.8
Canadian CIHR - - - - - - - - 0.1 0.2 0.5
Korean HIDI <0.1 <0.1 0.2 0.5
Subtotal of top 12^ 18 25 31 19 51 46 23 36 53 33 98
Total funding for platform technologies 18 25 31 19 52 46 23 36 54 34 100
Table 29. Top funders of platform technologies 2017
US$ (millio
ns)
Funder 2017 % of total
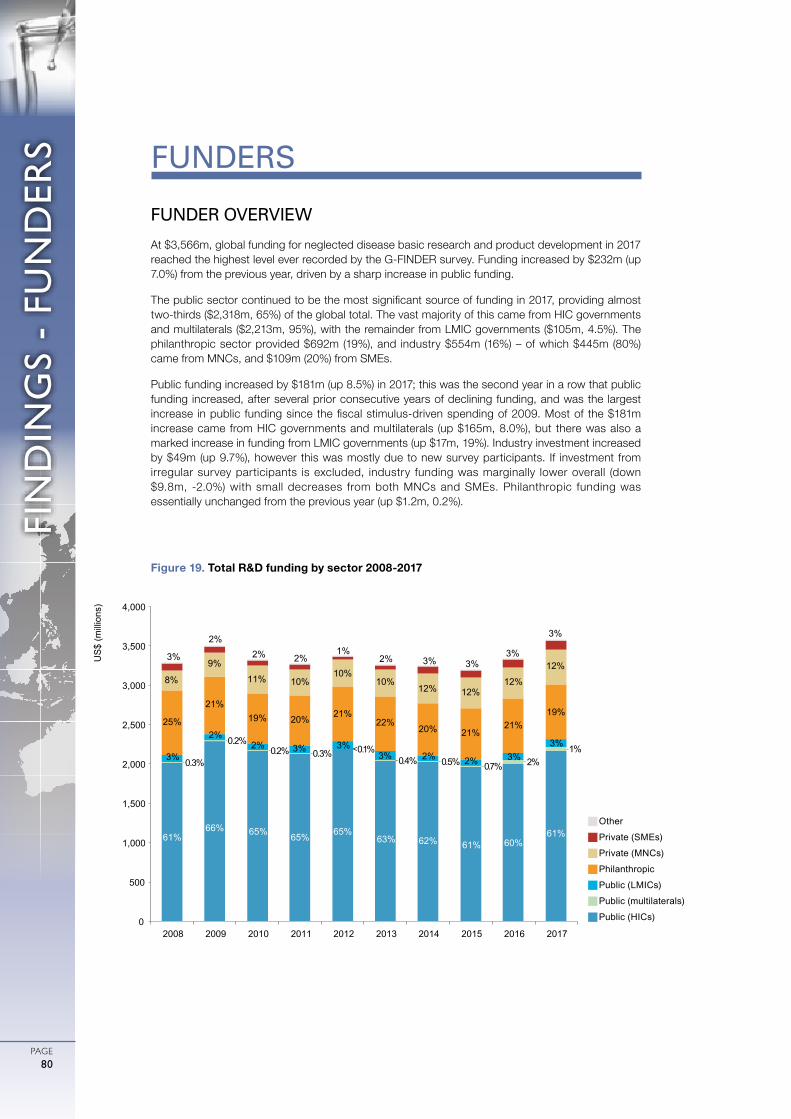
0
ガル図法(赤道縮尺) 1:47,000,000
1000 2000 3000 4000 5000km
75゜
60゜
45゜
30゜
15゜
0゜
15゜
30゜
45゜
60゜
75゜
90゜
180゜ 165゜ 150゜ 135゜ 120゜ 105゜ 90゜ 75゜ 60゜ 45゜ 30゜ 15゜ 15゜ 0゜ 165゜ 150゜ 135゜ 120゜ 105゜ 90゜ 75゜ 60゜ 45゜
FIN
DIN
GS
- FU
ND
ERS
PAGE80
FUNDER OVERVIEW
At $3,566m, global funding for neglected disease basic research and product development in 2017 reached the highest level ever recorded by the G-FINDER survey. Funding increased by $232m (up 7.0%) from the previous year, driven by a sharp increase in public funding.
The public sector continued to be the most significant source of funding in 2017, providing almost two-thirds ($2,318m, 65%) of the global total. The vast majority of this came from HIC governments and multilaterals ($2,213m, 95%), with the remainder from LMIC governments ($105m, 4.5%). The philanthropic sector provided $692m (19%), and industry $554m (16%) – of which $445m (80%) came from MNCs, and $109m (20%) from SMEs.
Public funding increased by $181m (up 8.5%) in 2017; this was the second year in a row that public funding increased, after several prior consecutive years of declining funding, and was the largest increase in public funding since the fiscal stimulus-driven spending of 2009. Most of the $181m increase came from HIC governments and multilaterals (up $165m, 8.0%), but there was also a marked increase in funding from LMIC governments (up $17m, 19%). Industry investment increased by $49m (up 9.7%), however this was mostly due to new survey participants. If investment from irregular survey participants is excluded, industry funding was marginally lower overall (down $9.8m, -2.0%) with small decreases from both MNCs and SMEs. Philanthropic funding was essentially unchanged from the previous year (up $1.2m, 0.2%).
FUNDERS
gOther
gPrivate (SMEs)
gPrivate (MNCs)
gPhilanthropic
gPublic (LMICs)
gPublic (multilaterals)
gPublic (HICs)
Figure 19. Total R&D funding by sector 2008-2017
61% 66% 65% 65% 65%
63% 62% 61% 60% 61%
0.3%
0.2% 0.2% 0.3% <0.1%
0.4% 0.5% 0.7% 2% 1%
3%
2% 2% 3% 3%
3% 2% 2% 3% 3%
25%
21% 19% 20% 21%
22% 20% 21%
21% 19%
8%
9%
11% 10% 10%
10% 12% 12%
12%
12% 3%
2% 2% 2%
1% 2% 3% 3%
3%
3%
0
500
1,000
1,500
2,000
2,500
3,000
3,500
4,000
2008 2009 2010 2011 2012 2013 2014 2015 2016 2017
US
$ (m
illio
ns)
FIN
DIN
GS
- FU
ND
ERS
PAGE81
PUBLIC FUNDERS
Globally, the public sector invested $2,318m in neglected disease basic research and product development in 2017. This was significantly higher than the previous year (up $181m, 8.5%), representing the largest annual increase in public funding seen since 2009, with almost all public funders either markedly increasing their funding or keeping investment relatively stable.
The US government was once again the largest funder, providing more than two-thirds ($1,595m, 69%) of all public funding for neglected disease R&D in 2017, followed by the UK ($186m, 8.0%) and the EC ($119m, 5.2%). This was down from the three-quarters of public funding that the US provided in 2016, as the slight increase in US government funding (up $23m, 1.5%) was half that of the EC (up $40m, 50%), and almost a quarter of that of the UK government (up $87m, 89%). This led to the smallest ever share of public funding provided by the US, and the largest ever share provided by another public funder – a dramatic reversal from 2016, when the gap between the US and the next largest public funder reached a four year high.
The growth in UK government funding was driven in roughly equal proportions by a sharp increase in funding from DFID (up $46m, 83%, following a strategic review of its research portfolio), and a new ODA funding stream managed by the Department of Health and Social Care (UK DHSC), which disbursed $40m in 2017. The increase from the EC was the result of a nearly seven-fold increase in its funding to the EDCTP (up $47m, 571%). Although this was partly due to abnormally low funding in 2016 related to the scheduling of payments, it was also a record disbursement to EDCTP, reflecting the significantly increased budget of EDCTP2. The slight US increase came in equal parts from the US DOD (up $12m, 15%), USAID (up $12m, 16%) and the US CDC (up $10m, 77%, returning towards normal levels), which offset a small drop in US NIH funding (down $12m, -0.8%). Other large increases came from India (up $21m, 38%), driven by increased investment from ICMR (up $23m, 52%); and Germany (up $18m, 39%), primarily due to additional funding from the BMBF (up $12m, 40%) as well as the DFG (up $5.2m, 44%). Canada (up $6.2m, 89%) and South Africa (up $2.7m, 24%) both re-entered the top 12.
Public funding from low- and middle-income countries (LMICs) reached $105m (up $17m, 19%), representing its highest share of public funding (4.5%) since 2013. India was responsible for the lion’s share of both the total LMIC public funding (accounting for 72%) and the increase in LMIC public funding, while South Africa provided its highest ever level of government funding. This higher share for LMICs was achieved despite a large decrease in Brazilian funding (down $6.6m, -42%, dropping out of the top 12 in 2017) in the face of deep cuts to overall public spending.
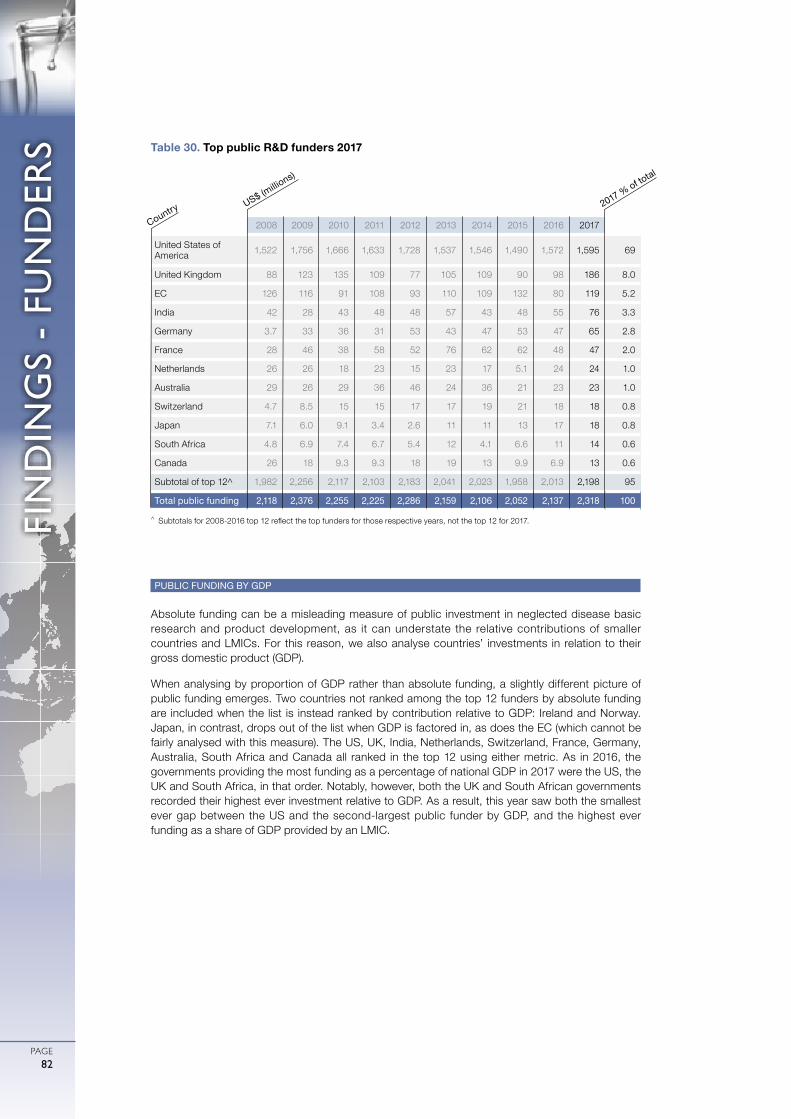
0
ガル図法(赤道縮尺) 1:47,000,000
1000 2000 3000 4000 5000km
75゜
60゜
45゜
30゜
15゜
0゜
15゜
30゜
45゜
60゜
75゜
90゜
180゜ 165゜ 150゜ 135゜ 120゜ 105゜ 90゜ 75゜ 60゜ 45゜ 30゜ 15゜ 15゜ 0゜ 165゜ 150゜ 135゜ 120゜ 105゜ 90゜ 75゜ 60゜ 45゜
FIN
DIN
GS
- FU
ND
ERS
PAGE82
PUBLIC FUNDING BY GDP
Absolute funding can be a misleading measure of public investment in neglected disease basic research and product development, as it can understate the relative contributions of smaller countries and LMICs. For this reason, we also analyse countries’ investments in relation to their gross domestic product (GDP).
When analysing by proportion of GDP rather than absolute funding, a slightly different picture of public funding emerges. Two countries not ranked among the top 12 funders by absolute funding are included when the list is instead ranked by contribution relative to GDP: Ireland and Norway. Japan, in contrast, drops out of the list when GDP is factored in, as does the EC (which cannot be fairly analysed with this measure). The US, UK, India, Netherlands, Switzerland, France, Germany, Australia, South Africa and Canada all ranked in the top 12 using either metric. As in 2016, the governments providing the most funding as a percentage of national GDP in 2017 were the US, the UK and South Africa, in that order. Notably, however, both the UK and South African governments recorded their highest ever investment relative to GDP. As a result, this year saw both the smallest ever gap between the US and the second-largest public funder by GDP, and the highest ever funding as a share of GDP provided by an LMIC.
2008 2009 2010 2011 2012 2013 2014 2015 2016 2017
United States of America 1,522 1,756 1,666 1,633 1,728 1,537 1,546 1,490 1,572 1,595 69
United Kingdom 88 123 135 109 77 105 109 90 98 186 8.0
EC 126 116 91 108 93 110 109 132 80 119 5.2
India 42 28 43 48 48 57 43 48 55 76 3.3
Germany 3.7 33 36 31 53 43 47 53 47 65 2.8
France 28 46 38 58 52 76 62 62 48 47 2.0
Netherlands 26 26 18 23 15 23 17 5.1 24 24 1.0
Australia 29 26 29 36 46 24 36 21 23 23 1.0
Switzerland 4.7 8.5 15 15 17 17 19 21 18 18 0.8
Japan 7.1 6.0 9.1 3.4 2.6 11 11 13 17 18 0.8
South Africa 4.8 6.9 7.4 6.7 5.4 12 4.1 6.6 11 14 0.6
Canada 26 18 9.3 9.3 18 19 13 9.9 6.9 13 0.6
Subtotal of top 12^ 1,982 2,256 2,117 2,103 2,183 2,041 2,023 1,958 2,013 2,198 95
Total public funding 2,118 2,376 2,255 2,225 2,286 2,159 2,106 2,052 2,137 2,318 100
Table 30. Top public R&D funders 2017
^ Subtotals for 2008-2016 top 12 reflect the top funders for those respective years, not the top 12 for 2017.
US$ (millio
ns)
Country2017 % of to
tal
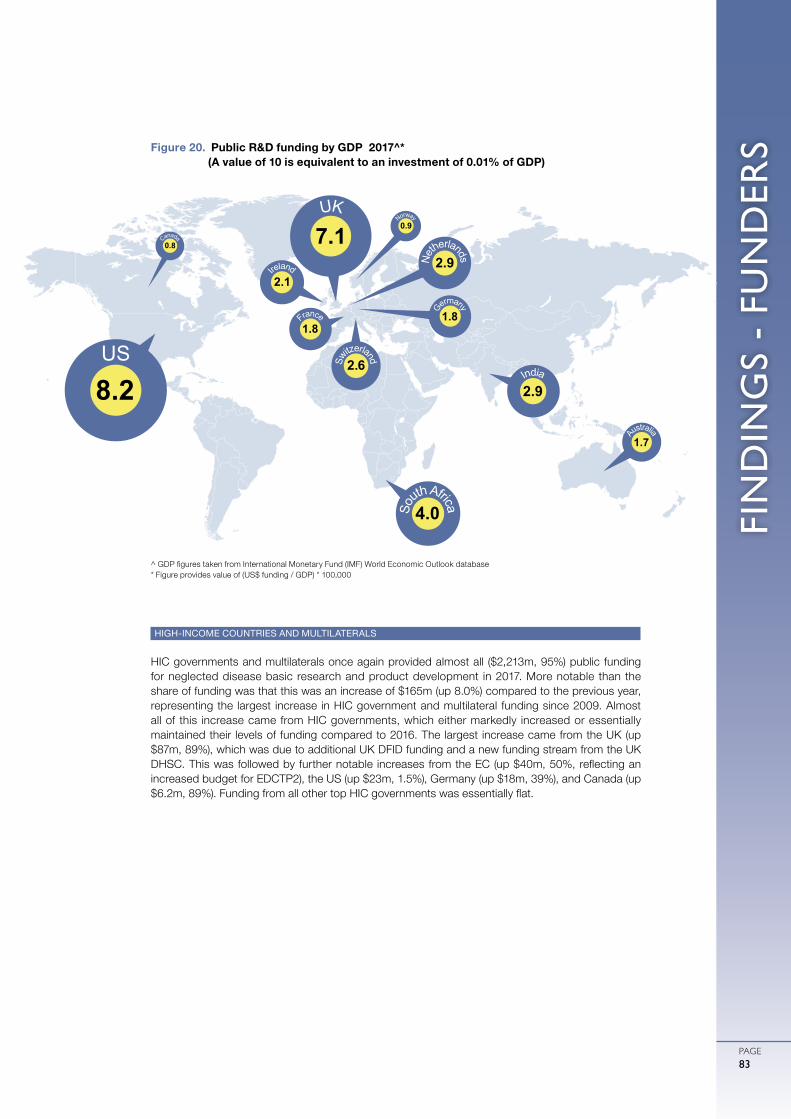
FIN
DIN
GS
- FU
ND
ERS
PAGE83
HIGH-INCOME COUNTRIES AND MULTILATERALS
HIC governments and multilaterals once again provided almost all ($2,213m, 95%) public funding for neglected disease basic research and product development in 2017. More notable than the share of funding was that this was an increase of $165m (up 8.0%) compared to the previous year, representing the largest increase in HIC government and multilateral funding since 2009. Almost all of this increase came from HIC governments, which either markedly increased or essentially maintained their levels of funding compared to 2016. The largest increase came from the UK (up $87m, 89%), which was due to additional UK DFID funding and a new funding stream from the UK DHSC. This was followed by further notable increases from the EC (up $40m, 50%, reflecting an increased budget for EDCTP2), the US (up $23m, 1.5%), Germany (up $18m, 39%), and Canada (up $6.2m, 89%). Funding from all other top HIC governments was essentially flat.
Figure 20. Public R&D funding by GDP 2017^* (A value of 10 is equivalent to an investment of 0.01% of GDP)
^ GDP figures taken from International Monetary Fund (IMF) World Economic Outlook database* Figure provides value of (US$ funding / GDP) * 100,000
US
8.2
UK
7.1
So
uth Africa
4.0
France
1.8Sw
itzerland
2.6
Ne
therlands
2.9
Norway
0.9
India
2.9
Canada
0.8
Ireland
2.1
Australia
1.7Ge
rmany1.8
0
ガル図法(赤道縮尺) 1:47,000,000
1000 2000 3000 4000 5000km
75゜
60゜
45゜
30゜
15゜
0゜
15゜
30゜
45゜
60゜
75゜
90゜
180゜ 165゜ 150゜ 135゜ 120゜ 105゜ 90゜ 75゜ 60゜ 45゜ 30゜ 15゜ 15゜ 0゜ 165゜ 150゜ 135゜ 120゜ 105゜ 90゜ 75゜ 60゜ 45゜
FIN
DIN
GS
- FU
ND
ERS
PAGE84
Multilaterals invested a total of $52m in neglected disease R&D in 2017, representing 2.2% of public funding and 1.4% of total global funding. Although only a marginal increase from 2016 (up $1.8m, 3.6%), this set a record for the largest contribution from this sector for the fifth year running. Once again, almost all multilateral investment came from Unitaid ($49m, 95% of multilateral funding).
As in previous years, funding from HIC governments and multilaterals was concentrated on HIV/AIDS, TB and malaria, which collectively received three-quarters ($1,666m, 75%) of all funding from this sector in 2017. Funding increased for all three of these diseases. The largest increase was for malaria (up $46m, 16%), about half of which came from UK DFID. This was followed by HIV/AIDS (up $22m, 2.4%), with an additional $43m in funding from Unitaid and USAID compensating for a $24m drop in funding from the US NIH, and then by TB (up $15m, 4.2%), which in contrast was driven by increased US NIH funding (up $22m, 10%). These three diseases collectively accounted for just over half of the overall increase in HIC and multilateral funding. Other diseases that saw an increase in funding included helminth infections (up $12m, 27%), driven by the US NIH and German BMBF; diarrhoeal diseases (up $8.4m, 15%), mostly to rotavirus and cholera; kinetoplastid diseases (up $8.3m, 9.0%); and cryptococcal meningitis (up $4.7m, 83%).
The most notable falls in HIC government and multilateral funding were for dengue (down $16m, -23%), Salmonella infections (down $12m, -23%) – both largely due to reversions in US NIH basic research funding to long-run average levels – and hepatitis C (down $11m, -61%), mostly caused by a cyclical drop in Unitaid funding.
More than half ($1,165m, 53%) of all HIC government and multilateral funding for neglected disease R&D in 2017 was for basic and early-stage research. Less than a third ($644m, 29%) was explicitly directed to clinical development and post-registration studies, although of the remaining $404m (18% of total funding) which was not allocated to a specific R&D stage, just over half went to PDPs and the EDCTP, which focus on clinical development.
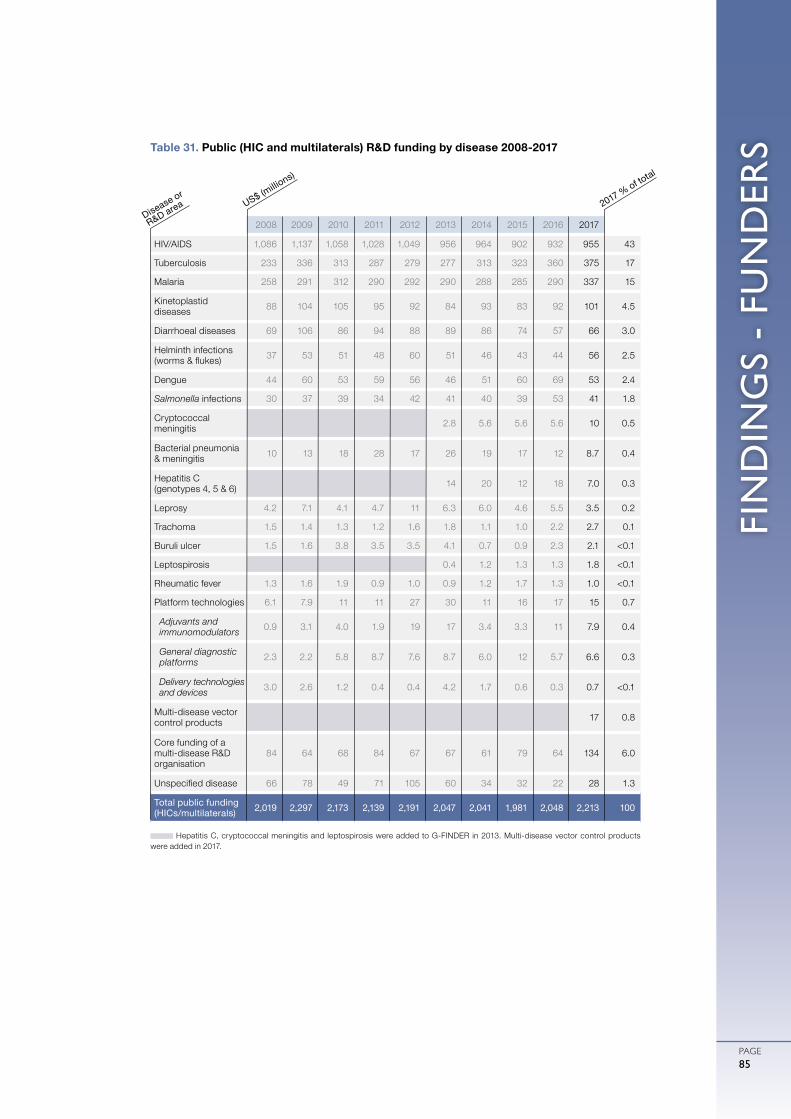
FIN
DIN
GS
- FU
ND
ERS
PAGE85
2008 2009 2010 2011 2012 2013 2014 2015 2016 2017
HIV/AIDS 1,086 1,137 1,058 1,028 1,049 956 964 902 932 955 43
Tuberculosis 233 336 313 287 279 277 313 323 360 375 17
Malaria 258 291 312 290 292 290 288 285 290 337 15
Kinetoplastid diseases 88 104 105 95 92 84 93 83 92 101 4.5
Diarrhoeal diseases 69 106 86 94 88 89 86 74 57 66 3.0
Helminth infections (worms & flukes) 37 53 51 48 60 51 46 43 44 56 2.5
Dengue 44 60 53 59 56 46 51 60 69 53 2.4
Salmonella infections 30 37 39 34 42 41 40 39 53 41 1.8
Cryptococcal meningitis 2.8 5.6 5.6 5.6 10 0.5
Bacterial pneumonia & meningitis 10 13 18 28 17 26 19 17 12 8.7 0.4
Hepatitis C (genotypes 4, 5 & 6) 14 20 12 18 7.0 0.3
Leprosy 4.2 7.1 4.1 4.7 11 6.3 6.0 4.6 5.5 3.5 0.2
Trachoma 1.5 1.4 1.3 1.2 1.6 1.8 1.1 1.0 2.2 2.7 0.1
Buruli ulcer 1.5 1.6 3.8 3.5 3.5 4.1 0.7 0.9 2.3 2.1 <0.1
Leptospirosis 0.4 1.2 1.3 1.3 1.8 <0.1
Rheumatic fever 1.3 1.6 1.9 0.9 1.0 0.9 1.2 1.7 1.3 1.0 <0.1
Platform technologies 6.1 7.9 11 11 27 30 11 16 17 15 0.7
Adjuvants and immunomodulators 0.9 3.1 4.0 1.9 19 17 3.4 3.3 11 7.9 0.4
General diagnostic platforms 2.3 2.2 5.8 8.7 7.6 8.7 6.0 12 5.7 6.6 0.3
Delivery technologies and devices 3.0 2.6 1.2 0.4 0.4 4.2 1.7 0.6 0.3 0.7 <0.1
Multi-disease vector control products 17 0.8
Core funding of a multi-disease R&D organisation
84 64 68 84 67 67 61 79 64 134 6.0
Unspecified disease 66 78 49 71 105 60 34 32 22 28 1.3
Total public funding (HICs/multilaterals) 2,019 2,297 2,173 2,139 2,191 2,047 2,041 1,981 2,048 2,213 100
Table 31. Public (HIC and multilaterals) R&D funding by disease 2008-2017
Hepatitis C, cryptococcal meningitis and leptospirosis were added to G-FINDER in 2013. Multi-disease vector control products were added in 2017.
US$ (millio
ns)
Disease or
R&D area 2017 % of total
0
ガル図法(赤道縮尺) 1:47,000,000
1000 2000 3000 4000 5000km
75゜
60゜
45゜
30゜
15゜
0゜
15゜
30゜
45゜
60゜
75゜
90゜
180゜ 165゜ 150゜ 135゜ 120゜ 105゜ 90゜ 75゜ 60゜ 45゜ 30゜ 15゜ 15゜ 0゜ 165゜ 150゜ 135゜ 120゜ 105゜ 90゜ 75゜ 60゜ 45゜
FIN
DIN
GS
- FU
ND
ERS
PAGE86
LOW- AND MIDDLE-INCOME COUNTRIES
Public funders in LMICs invested a total of $105m in neglected disease product development and basic research in 2017, representing 4.5% of all global public funding for neglected disease R&D. This was an increase of $17m (up 19%) from the previous year, marking the third consecutive year of growth and the second-largest LMIC public investment on record (behind only 2013).
Once again, the vast majority ($99m, 95%) of all LMIC public funding for neglected disease R&D in 2017 came from just three innovative developing countries (IDCs): India ($76m, 72%), South Africa ($14m, 13%) and Brazil ($9.2m, 8.8%). That LMIC public funding increased despite the introduction of a cap on public spending in Brazil was due to a large increase Indian government investment (up $21m, 38%), which was in turn entirely due to additional funding from the Indian ICMR (up $23m, 52%). South African public funding increased by a quarter (up $2.7m, 24%), due in equal part to increased funding from the South African DST and the South African Medical Research Council. However it was primarily the drop in Brazilian public funding (down $6.6m, -42%) that saw the government of South Africa investing more than that of Brazil for the first time. The drop in Brazilian public funding was driven by the Brazilian Development Bank (BNDES, down $4.8m, -72%) and FAPESP (down $4.4m, -67%), with Brazil’s Department of Science and Technology (DECIT) reporting increased funding (up $2.8m, albeit from a low base) despite the spending cap. The only two other LMIC governments to report more than $1.0m in funding in 2017 were Mexico ($2.1m) and Argentina ($1.2m).
Funding from LMIC governments remained focused on TB, malaria and kinetoplastid R&D, which once again collectively received more than half of all LMIC funding ($60m, 58%). Increased investment by the Indian ICMR was the driving force behind the increases in LMIC government funding for malaria (up $6.2m, 42%) and TB (up $5.7m, 24%), and meant that the overall decrease in LMIC public funding for kinetoplastid R&D (down $2.3m, -19%) was much smaller than it otherwise would have been given the Brazilian funding cuts.
LMIC public funding for most other neglected diseases increased in 2017: HIV/AIDS investment doubled (up $4.9m, 107%), driven by the South African MRC (up $2.8m, 377%) and Indian ICMR (up $1.7m, after not having reported HIV/AIDS investment in 2016); leprosy funding increased by $2.0m (up 47%), entirely driven by the Indian ICMR (up $1.9m, 47%); funding for helminth infections rose by $1.5m (up 81%); and dengue investment increased by $1.4m (up 24%). Funding for diarrhoeal disease R&D dropped (down $1.3m, -15%), as the Brazilian BNDES, a major funder in 2016, did not report any funding for this disease group in 2017.
A lack of detailed reporting makes analysis of LMIC public funding by R&D stage difficult, with two-thirds ($66m, 63%) of LMIC funding in 2017 not allocated to a specific product or R&D stage. Where funding was allocated a specific R&D stage, it was largely for basic and early-stage research ($26m, 25% of total LMIC public funding) rather than clinical development and post-registration studies ($7.6m, 7.2%).
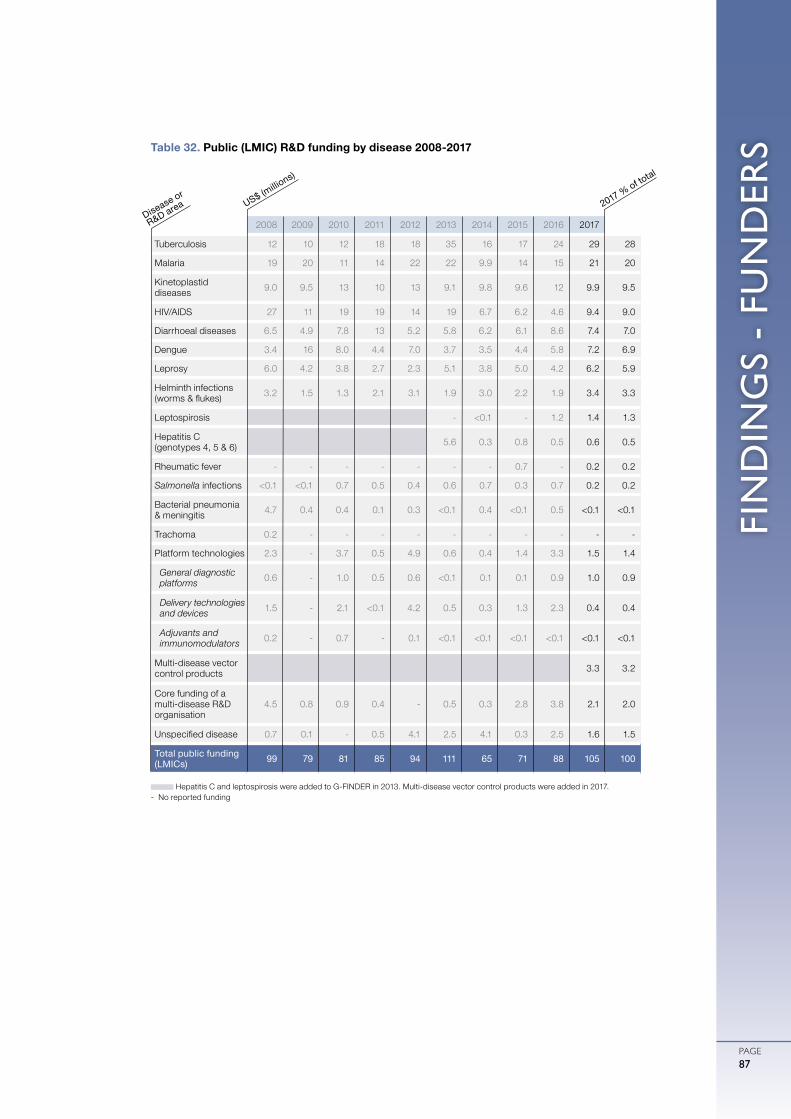
FIN
DIN
GS
- FU
ND
ERS
PAGE87
2008 2009 2010 2011 2012 2013 2014 2015 2016 2017
Tuberculosis 12 10 12 18 18 35 16 17 24 29 28
Malaria 19 20 11 14 22 22 9.9 14 15 21 20
Kinetoplastid diseases 9.0 9.5 13 10 13 9.1 9.8 9.6 12 9.9 9.5
HIV/AIDS 27 11 19 19 14 19 6.7 6.2 4.6 9.4 9.0
Diarrhoeal diseases 6.5 4.9 7.8 13 5.2 5.8 6.2 6.1 8.6 7.4 7.0
Dengue 3.4 16 8.0 4.4 7.0 3.7 3.5 4.4 5.8 7.2 6.9
Leprosy 6.0 4.2 3.8 2.7 2.3 5.1 3.8 5.0 4.2 6.2 5.9
Helminth infections (worms & flukes) 3.2 1.5 1.3 2.1 3.1 1.9 3.0 2.2 1.9 3.4 3.3
Leptospirosis - <0.1 - 1.2 1.4 1.3
Hepatitis C (genotypes 4, 5 & 6) 5.6 0.3 0.8 0.5 0.6 0.5
Rheumatic fever - - - - - - - 0.7 - 0.2 0.2
Salmonella infections <0.1 <0.1 0.7 0.5 0.4 0.6 0.7 0.3 0.7 0.2 0.2
Bacterial pneumonia & meningitis 4.7 0.4 0.4 0.1 0.3 <0.1 0.4 <0.1 0.5 <0.1 <0.1
Trachoma 0.2 - - - - - - - - - -
Platform technologies 2.3 - 3.7 0.5 4.9 0.6 0.4 1.4 3.3 1.5 1.4
General diagnostic platforms 0.6 - 1.0 0.5 0.6 <0.1 0.1 0.1 0.9 1.0 0.9
Delivery technologies and devices 1.5 - 2.1 <0.1 4.2 0.5 0.3 1.3 2.3 0.4 0.4
Adjuvants and immunomodulators 0.2 - 0.7 - 0.1 <0.1 <0.1 <0.1 <0.1 <0.1 <0.1
Multi-disease vector control products 3.3 3.2
Core funding of a multi-disease R&D organisation
4.5 0.8 0.9 0.4 - 0.5 0.3 2.8 3.8 2.1 2.0
Unspecified disease 0.7 0.1 - 0.5 4.1 2.5 4.1 0.3 2.5 1.6 1.5
Total public funding (LMICs) 99 79 81 85 94 111 65 71 88 105 100
Table 32. Public (LMIC) R&D funding by disease 2008-2017
Hepatitis C and leptospirosis were added to G-FINDER in 2013. Multi-disease vector control products were added in 2017.- No reported funding
US$ (millio
ns)
Disease or
R&D area 2017 % of total
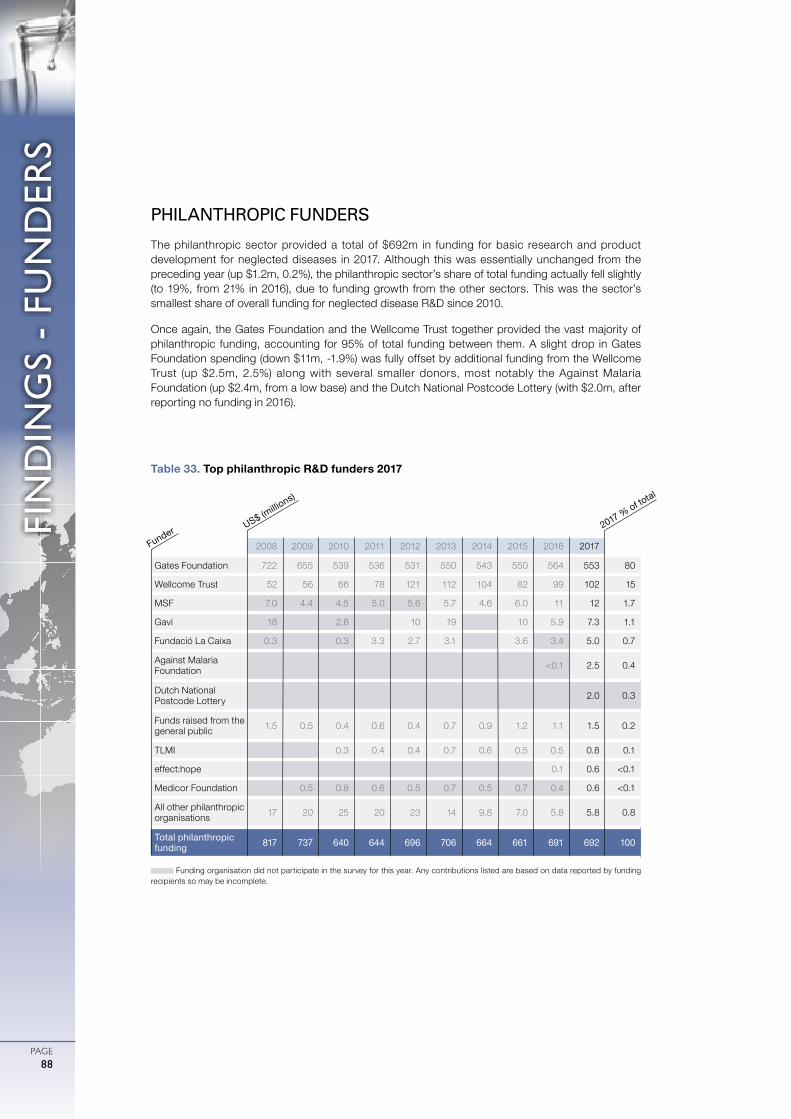
0
ガル図法(赤道縮尺) 1:47,000,000
1000 2000 3000 4000 5000km
75゜
60゜
45゜
30゜
15゜
0゜
15゜
30゜
45゜
60゜
75゜
90゜
180゜ 165゜ 150゜ 135゜ 120゜ 105゜ 90゜ 75゜ 60゜ 45゜ 30゜ 15゜ 15゜ 0゜ 165゜ 150゜ 135゜ 120゜ 105゜ 90゜ 75゜ 60゜ 45゜
FIN
DIN
GS
- FU
ND
ERS
PAGE88
PHILANTHROPIC FUNDERS
The philanthropic sector provided a total of $692m in funding for basic research and product development for neglected diseases in 2017. Although this was essentially unchanged from the preceding year (up $1.2m, 0.2%), the philanthropic sector’s share of total funding actually fell slightly (to 19%, from 21% in 2016), due to funding growth from the other sectors. This was the sector’s smallest share of overall funding for neglected disease R&D since 2010.
Once again, the Gates Foundation and the Wellcome Trust together provided the vast majority of philanthropic funding, accounting for 95% of total funding between them. A slight drop in Gates Foundation spending (down $11m, -1.9%) was fully offset by additional funding from the Wellcome Trust (up $2.5m, 2.5%) along with several smaller donors, most notably the Against Malaria Foundation (up $2.4m, from a low base) and the Dutch National Postcode Lottery (with $2.0m, after reporting no funding in 2016).
2008 2009 2010 2011 2012 2013 2014 2015 2016 2017
Gates Foundation 722 655 539 536 531 550 543 550 564 553 80
Wellcome Trust 52 56 66 78 121 112 104 82 99 102 15
MSF 7.0 4.4 4.5 5.0 5.6 5.7 4.6 6.0 11 12 1.7
Gavi 18 2.6 10 19 10 5.9 7.3 1.1
Fundació La Caixa 0.3 0.3 3.3 2.7 3.1 3.6 3.4 5.0 0.7
Against Malaria Foundation <0.1 2.5 0.4
Dutch National Postcode Lottery 2.0 0.3
Funds raised from the general public 1.5 0.5 0.4 0.6 0.4 0.7 0.9 1.2 1.1 1.5 0.2
TLMI 0.3 0.4 0.4 0.7 0.6 0.5 0.5 0.8 0.1
effect:hope 0.1 0.6 <0.1
Medicor Foundation 0.5 0.8 0.6 0.5 0.7 0.5 0.7 0.4 0.6 <0.1
All other philanthropic organisations 17 20 25 20 23 14 9.8 7.0 5.8 5.8 0.8
Total philanthropic funding 817 737 640 644 696 706 664 661 691 692 100
Table 33. Top philanthropic R&D funders 2017
Funding organisation did not participate in the survey for this year. Any contributions listed are based on data reported by funding recipients so may be incomplete.
US$ (millio
ns)
Funder 2017 % of total
FIN
DIN
GS
- FU
ND
ERS
PAGE89
HIV/AIDS, malaria and TB continued to receive the majority ($385m, 56%) of all philanthropic funding for neglected disease R&D in 2017, although this was down from 58% ($402m) in 2016. This was partly due to reduced investment in each of malaria (down $11m, -7.8%), TB (down $3.4m, -3.0%) and HIV/AIDS (down $1.6m, -1.1%), but also to a large increase in the share of philanthropic funding not allocated to a specific neglected disease (up $29m, 24%).
Non-disease-specific funding represented nearly a quarter ($153m, 22%) of all philanthropic funding for neglected disease R&D in 2017, more than the sector allocated to any individual disease. The $33m increase in non-disease-specific funding in 2017 continued a six year period of growth, during which the share of philanthropic funding for this area has increased tenfold. The increase was entirely due to growth in core funding to multi-disease R&D organisations (up $45m, 63%). This was partially offset by a drop in funding for platform technologies (down $16m, -48%), which returned to normal levels following a spike in 2016.
As with most changes in philanthropic funding, the 2017 increase in core funding for multi-disease R&D organisations was driven by the Gates Foundation (up $33m, 132%) and the Wellcome Trust (up $11m, 30%). In addition to a cyclical increase in core funding for PATH (up $15m, from a low base), the Gates Foundation’s additional multi-disease core funding was mostly due to an initial disbursement of $19m to the Bill & Melinda Gates Medical Research Institute, which will ultimately have an annual operating budget of approximately $100m.122 The bulk of the Wellcome Trust’s increase in core funding was related to a new investment stream to the Africa Health Research Institute (AHRI), which was formed in 2016 following the amalgamation of the KwaZulu-Natal Research Institute for TB-HIV and the Africa Centre for Population Health, and received $12m in Trust funding in 2017. The Trust’s additional core funding to multi-disease R&D organisations whose remit includes HIV/AIDS likely helped to offset its reduced HIV/AIDS-specific funding (down $7.1m, -64%).
In 2017, 38% of philanthropic R&D funding ($263m) was directed to basic and early-stage research, while clinical development and post-registration studies continued to receive around a quarter ($181m, 26%). Remaining funding was divided roughly equally between core funding for multi-disease organisations ($117m, 17%) – split between researchers and research institutes (72% of core funding), PDPs (18%) and other intermediaries (10%) – and grants not specifying a specific product or R&D stage ($114m, 17%), with platform technologies receiving the remainder ($17m, 2.5%).
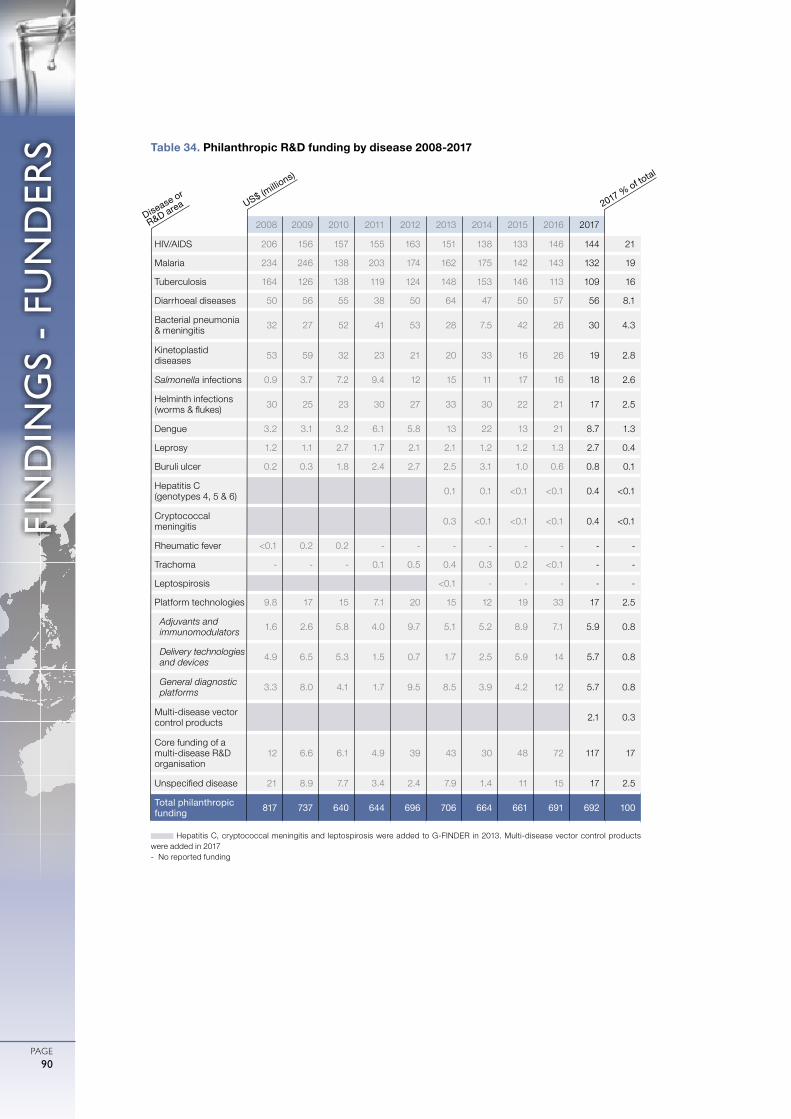
0
ガル図法(赤道縮尺) 1:47,000,000
1000 2000 3000 4000 5000km
75゜
60゜
45゜
30゜
15゜
0゜
15゜
30゜
45゜
60゜
75゜
90゜
180゜ 165゜ 150゜ 135゜ 120゜ 105゜ 90゜ 75゜ 60゜ 45゜ 30゜ 15゜ 15゜ 0゜ 165゜ 150゜ 135゜ 120゜ 105゜ 90゜ 75゜ 60゜ 45゜
FIN
DIN
GS
- FU
ND
ERS
PAGE90
2008 2009 2010 2011 2012 2013 2014 2015 2016 2017
HIV/AIDS 206 156 157 155 163 151 138 133 146 144 21
Malaria 234 246 138 203 174 162 175 142 143 132 19
Tuberculosis 164 126 138 119 124 148 153 146 113 109 16
Diarrhoeal diseases 50 56 55 38 50 64 47 50 57 56 8.1
Bacterial pneumonia & meningitis 32 27 52 41 53 28 7.5 42 26 30 4.3
Kinetoplastid diseases 53 59 32 23 21 20 33 16 26 19 2.8
Salmonella infections 0.9 3.7 7.2 9.4 12 15 11 17 16 18 2.6
Helminth infections (worms & flukes) 30 25 23 30 27 33 30 22 21 17 2.5
Dengue 3.2 3.1 3.2 6.1 5.8 13 22 13 21 8.7 1.3
Leprosy 1.2 1.1 2.7 1.7 2.1 2.1 1.2 1.2 1.3 2.7 0.4
Buruli ulcer 0.2 0.3 1.8 2.4 2.7 2.5 3.1 1.0 0.6 0.8 0.1
Hepatitis C (genotypes 4, 5 & 6) 0.1 0.1 <0.1 <0.1 0.4 <0.1
Cryptococcal meningitis 0.3 <0.1 <0.1 <0.1 0.4 <0.1
Rheumatic fever <0.1 0.2 0.2 - - - - - - - -
Trachoma - - - 0.1 0.5 0.4 0.3 0.2 <0.1 - -
Leptospirosis <0.1 - - - - -
Platform technologies 9.8 17 15 7.1 20 15 12 19 33 17 2.5
Adjuvants and immunomodulators 1.6 2.6 5.8 4.0 9.7 5.1 5.2 8.9 7.1 5.9 0.8
Delivery technologies and devices 4.9 6.5 5.3 1.5 0.7 1.7 2.5 5.9 14 5.7 0.8
General diagnostic platforms 3.3 8.0 4.1 1.7 9.5 8.5 3.9 4.2 12 5.7 0.8
Multi-disease vector control products 2.1 0.3
Core funding of a multi-disease R&D organisation
12 6.6 6.1 4.9 39 43 30 48 72 117 17
Unspecified disease 21 8.9 7.7 3.4 2.4 7.9 1.4 11 15 17 2.5
Total philanthropic funding 817 737 640 644 696 706 664 661 691 692 100
Table 34. Philanthropic R&D funding by disease 2008-2017
Hepatitis C, cryptococcal meningitis and leptospirosis were added to G-FINDER in 2013. Multi-disease vector control products were added in 2017- No reported funding
US$ (millio
ns)
Disease or
R&D area 2017 % of total
FIN
DIN
GS
- FU
ND
ERS
PAGE91
PRIVATE SECTOR FUNDERS
The private sector invested a total of $554m in neglected disease R&D in 2017, accounting for 16% of total global funding. As usual, multinational pharmaceutical companies (MNCs) provided the majority of this investment ($445m, 80%), with small pharmaceutical and biotechnology firms (SMEs) contributing the remainder ($109m, 20%).
Total reported private sector investment increased by $49m (up 9.7%) from 2016, but this was entirely due to significant investment by new survey participants. If funding from all irregular survey participants is excluded, industry investment was actually marginally lower in 2017 (down $9.8m, -2.0%).
MULTINATIONAL PHARMACEUTICAL COMPANIES
MNCs invested $445m in neglected disease R&D in 2017, accounting for 80% of total industry investment. Although this was a marked increase from 2016 (up $45m, 11%), this was entirely due to the inclusion of a new participant in the G-FINDER survey; investment from regularly reporting MNCs was in fact slightly lower (down $5.9m, -1.5%).
Multinational pharmaceutical companies continued to focus their investment on HIV/AIDS, malaria and TB, with these three diseases once again accounting for more than three-quarters ($351m, 79%) of all MNC investment. Importantly, this remains the case even without the effect of changes in survey participation, which were the main driver of the apparent increase in HIV/AIDS investment by MNCs (up $55m, 70%). Without this effect, MNC investment in HIV/AIDS R&D remained relatively steady, as it did for both malaria and TB. The other notable (and real) increase in MNC investment was for diarrhoeal disease R&D (up $11m, 80%), which rebounded after three years of declining spending, on the back of new investment in vaccines for shigellosis (up $7.3m, 132%) and rotavirus (up $3.1m, 58%). The largest decrease in MNC investment was for bacterial pneumonia & meningitis (down $19m, -91%), which fell steeply following the registration of vaccines for both Neisseria meningitides and Streptococcus pneumoniae. MNC investment in dengue R&D also fell (down $5.8m, -39%).
Clinical development and post-registration studies – essentially all for drugs and preventive vaccines – made up 61% ($270m) of MNC investment in neglected disease R&D. A further 28% ($127m) was for early-stage research, almost all for discovery and pre-clinical R&D activities. Remaining MNC investment ($49m, 11%) was not allocated to a specific product or R&D stage, for example core funding provided to the GHIT Fund.
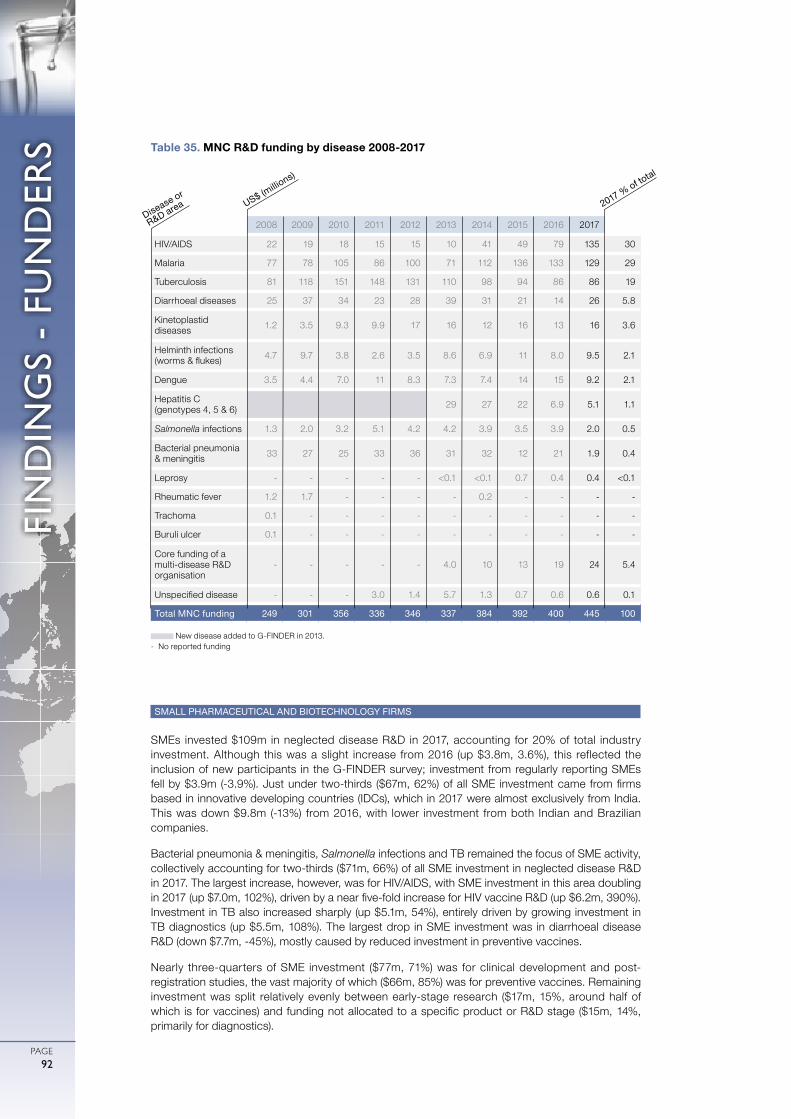
0
ガル図法(赤道縮尺) 1:47,000,000
1000 2000 3000 4000 5000km
75゜
60゜
45゜
30゜
15゜
0゜
15゜
30゜
45゜
60゜
75゜
90゜
180゜ 165゜ 150゜ 135゜ 120゜ 105゜ 90゜ 75゜ 60゜ 45゜ 30゜ 15゜ 15゜ 0゜ 165゜ 150゜ 135゜ 120゜ 105゜ 90゜ 75゜ 60゜ 45゜
FIN
DIN
GS
- FU
ND
ERS
PAGE92
SMALL PHARMACEUTICAL AND BIOTECHNOLOGY FIRMS
SMEs invested $109m in neglected disease R&D in 2017, accounting for 20% of total industry investment. Although this was a slight increase from 2016 (up $3.8m, 3.6%), this reflected the inclusion of new participants in the G-FINDER survey; investment from regularly reporting SMEs fell by $3.9m (-3.9%). Just under two-thirds ($67m, 62%) of all SME investment came from firms based in innovative developing countries (IDCs), which in 2017 were almost exclusively from India. This was down $9.8m (-13%) from 2016, with lower investment from both Indian and Brazilian companies.
Bacterial pneumonia & meningitis, Salmonella infections and TB remained the focus of SME activity, collectively accounting for two-thirds ($71m, 66%) of all SME investment in neglected disease R&D in 2017. The largest increase, however, was for HIV/AIDS, with SME investment in this area doubling in 2017 (up $7.0m, 102%), driven by a near five-fold increase for HIV vaccine R&D (up $6.2m, 390%). Investment in TB also increased sharply (up $5.1m, 54%), entirely driven by growing investment in TB diagnostics (up $5.5m, 108%). The largest drop in SME investment was in diarrhoeal disease R&D (down $7.7m, -45%), mostly caused by reduced investment in preventive vaccines.
Nearly three-quarters of SME investment ($77m, 71%) was for clinical development and post-registration studies, the vast majority of which ($66m, 85%) was for preventive vaccines. Remaining investment was split relatively evenly between early-stage research ($17m, 15%, around half of which is for vaccines) and funding not allocated to a specific product or R&D stage ($15m, 14%, primarily for diagnostics).
2008 2009 2010 2011 2012 2013 2014 2015 2016 2017
HIV/AIDS 22 19 18 15 15 10 41 49 79 135 30
Malaria 77 78 105 86 100 71 112 136 133 129 29
Tuberculosis 81 118 151 148 131 110 98 94 86 86 19
Diarrhoeal diseases 25 37 34 23 28 39 31 21 14 26 5.8
Kinetoplastid diseases 1.2 3.5 9.3 9.9 17 16 12 16 13 16 3.6
Helminth infections (worms & flukes) 4.7 9.7 3.8 2.6 3.5 8.6 6.9 11 8.0 9.5 2.1
Dengue 3.5 4.4 7.0 11 8.3 7.3 7.4 14 15 9.2 2.1
Hepatitis C (genotypes 4, 5 & 6) 29 27 22 6.9 5.1 1.1
Salmonella infections 1.3 2.0 3.2 5.1 4.2 4.2 3.9 3.5 3.9 2.0 0.5
Bacterial pneumonia & meningitis 33 27 25 33 36 31 32 12 21 1.9 0.4
Leprosy - - - - - <0.1 <0.1 0.7 0.4 0.4 <0.1
Rheumatic fever 1.2 1.7 - - - - 0.2 - - - -
Trachoma 0.1 - - - - - - - - - -
Buruli ulcer 0.1 - - - - - - - - - -
Core funding of a multi-disease R&D organisation
- - - - - 4.0 10 13 19 24 5.4
Unspecified disease - - - 3.0 1.4 5.7 1.3 0.7 0.6 0.6 0.1
Total MNC funding 249 301 356 336 346 337 384 392 400 445 100
Table 35. MNC R&D funding by disease 2008-2017
New disease added to G-FINDER in 2013.- No reported funding
US$ (millio
ns)
Disease or
R&D area 2017 % of total
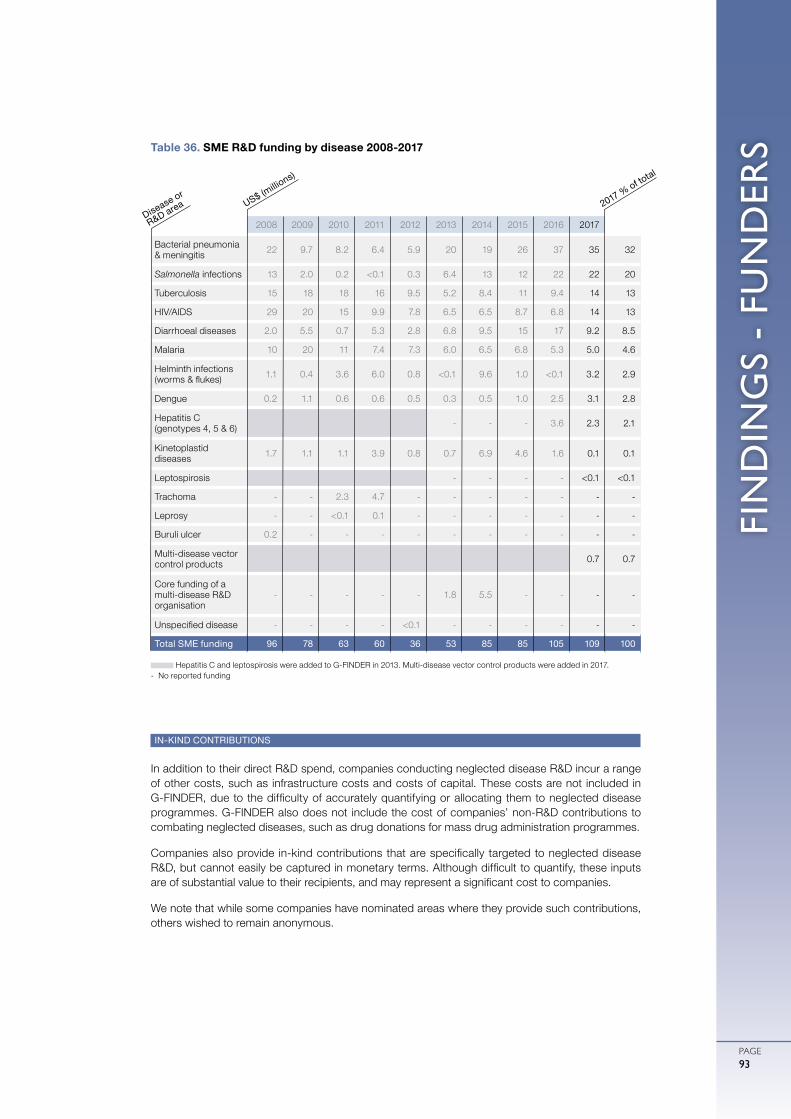
FIN
DIN
GS
- FU
ND
ERS
PAGE93
IN-KIND CONTRIBUTIONS
In addition to their direct R&D spend, companies conducting neglected disease R&D incur a range of other costs, such as infrastructure costs and costs of capital. These costs are not included in G-FINDER, due to the difficulty of accurately quantifying or allocating them to neglected disease programmes. G-FINDER also does not include the cost of companies’ non-R&D contributions to combating neglected diseases, such as drug donations for mass drug administration programmes.
Companies also provide in-kind contributions that are specifically targeted to neglected disease R&D, but cannot easily be captured in monetary terms. Although difficult to quantify, these inputs are of substantial value to their recipients, and may represent a significant cost to companies.
We note that while some companies have nominated areas where they provide such contributions, others wished to remain anonymous.
2008 2009 2010 2011 2012 2013 2014 2015 2016 2017
Bacterial pneumonia & meningitis 22 9.7 8.2 6.4 5.9 20 19 26 37 35 32
Salmonella infections 13 2.0 0.2 <0.1 0.3 6.4 13 12 22 22 20
Tuberculosis 15 18 18 16 9.5 5.2 8.4 11 9.4 14 13
HIV/AIDS 29 20 15 9.9 7.8 6.5 6.5 8.7 6.8 14 13
Diarrhoeal diseases 2.0 5.5 0.7 5.3 2.8 6.8 9.5 15 17 9.2 8.5
Malaria 10 20 11 7.4 7.3 6.0 6.5 6.8 5.3 5.0 4.6
Helminth infections (worms & flukes) 1.1 0.4 3.6 6.0 0.8 <0.1 9.6 1.0 <0.1 3.2 2.9
Dengue 0.2 1.1 0.6 0.6 0.5 0.3 0.5 1.0 2.5 3.1 2.8
Hepatitis C (genotypes 4, 5 & 6) - - - 3.6 2.3 2.1
Kinetoplastid diseases 1.7 1.1 1.1 3.9 0.8 0.7 6.9 4.6 1.6 0.1 0.1
Leptospirosis - - - - <0.1 <0.1
Trachoma - - 2.3 4.7 - - - - - - -
Leprosy - - <0.1 0.1 - - - - - - -
Buruli ulcer 0.2 - - - - - - - - - -
Multi-disease vector control products 0.7 0.7
Core funding of a multi-disease R&D organisation
- - - - - 1.8 5.5 - - - -
Unspecified disease - - - - <0.1 - - - - - -
Total SME funding 96 78 63 60 36 53 85 85 105 109 100
Table 36. SME R&D funding by disease 2008-2017
Hepatitis C and leptospirosis were added to G-FINDER in 2013. Multi-disease vector control products were added in 2017.- No reported funding
US$ (millio
ns)
Disease or
R&D area 2017 % of total
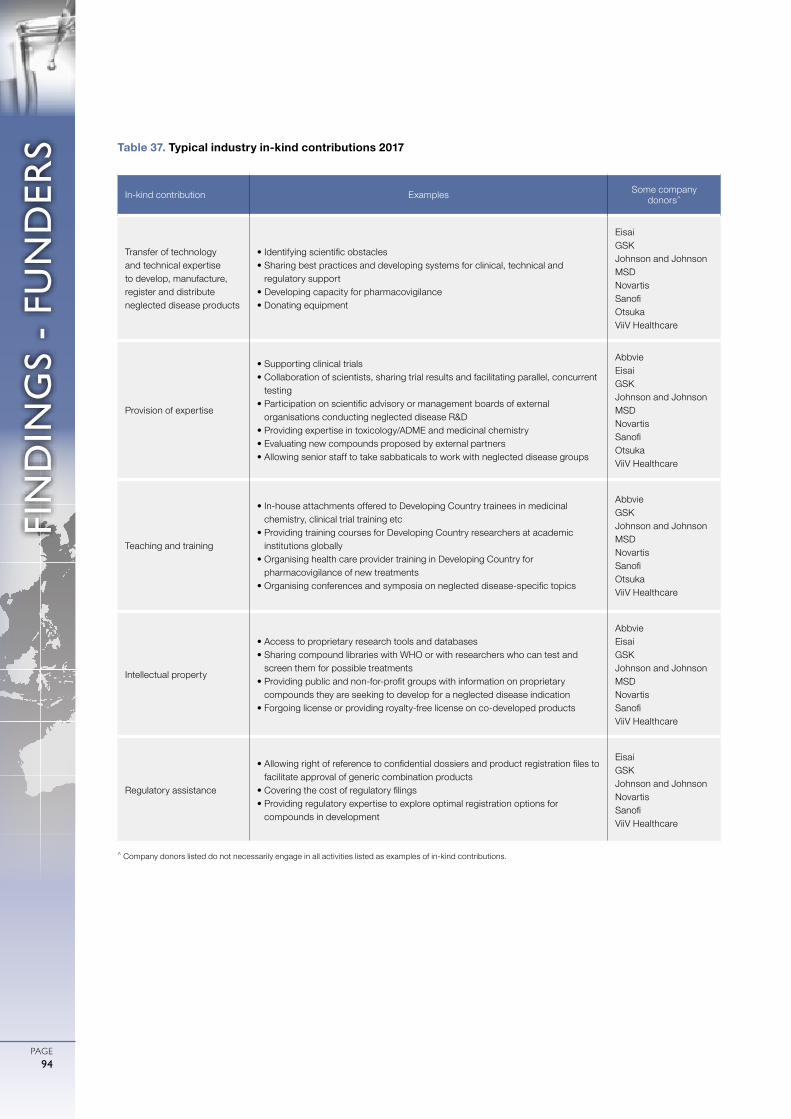
0
ガル図法(赤道縮尺) 1:47,000,000
1000 2000 3000 4000 5000km
75゜
60゜
45゜
30゜
15゜
0゜
15゜
30゜
45゜
60゜
75゜
90゜
180゜ 165゜ 150゜ 135゜ 120゜ 105゜ 90゜ 75゜ 60゜ 45゜ 30゜ 15゜ 15゜ 0゜ 165゜ 150゜ 135゜ 120゜ 105゜ 90゜ 75゜ 60゜ 45゜
FIN
DIN
GS
- FU
ND
ERS
PAGE94
^ Company donors listed do not necessarily engage in all activities listed as examples of in-kind contributions.
In-kind contribution Examples Some company donors^
Transfer of technology and technical expertise to develop, manufacture, register and distribute neglected disease products
• Identifying scientific obstacles• Sharing best practices and developing systems for clinical, technical and
regulatory support• Developing capacity for pharmacovigilance• Donating equipment
EisaiGSKJohnson and JohnsonMSDNovartisSanofiOtsukaViiV Healthcare
Provision of expertise
• Supporting clinical trials• Collaboration of scientists, sharing trial results and facilitating parallel, concurrent
testing• Participation on scientific advisory or management boards of external
organisations conducting neglected disease R&D• Providing expertise in toxicology/ADME and medicinal chemistry• Evaluating new compounds proposed by external partners• Allowing senior staff to take sabbaticals to work with neglected disease groups
AbbvieEisaiGSKJohnson and JohnsonMSDNovartisSanofiOtsukaViiV Healthcare
Teaching and training
• In-house attachments offered to Developing Country trainees in medicinal chemistry, clinical trial training etc
• Providing training courses for Developing Country researchers at academic institutions globally
• Organising health care provider training in Developing Country for pharmacovigilance of new treatments
• Organising conferences and symposia on neglected disease-specific topics
AbbvieGSKJohnson and JohnsonMSDNovartisSanofiOtsukaViiV Healthcare
Intellectual property
• Access to proprietary research tools and databases• Sharing compound libraries with WHO or with researchers who can test and
screen them for possible treatments• Providing public and non-for-profit groups with information on proprietary
compounds they are seeking to develop for a neglected disease indication• Forgoing license or providing royalty-free license on co-developed products
AbbvieEisaiGSKJohnson and JohnsonMSDNovartisSanofiViiV Healthcare
Regulatory assistance
• Allowing right of reference to confidential dossiers and product registration files to facilitate approval of generic combination products
• Covering the cost of regulatory filings• Providing regulatory expertise to explore optimal registration options for
compounds in development
EisaiGSKJohnson and JohnsonNovartisSanofiViiV Healthcare
Table 37. Typical industry in-kind contributions 2017
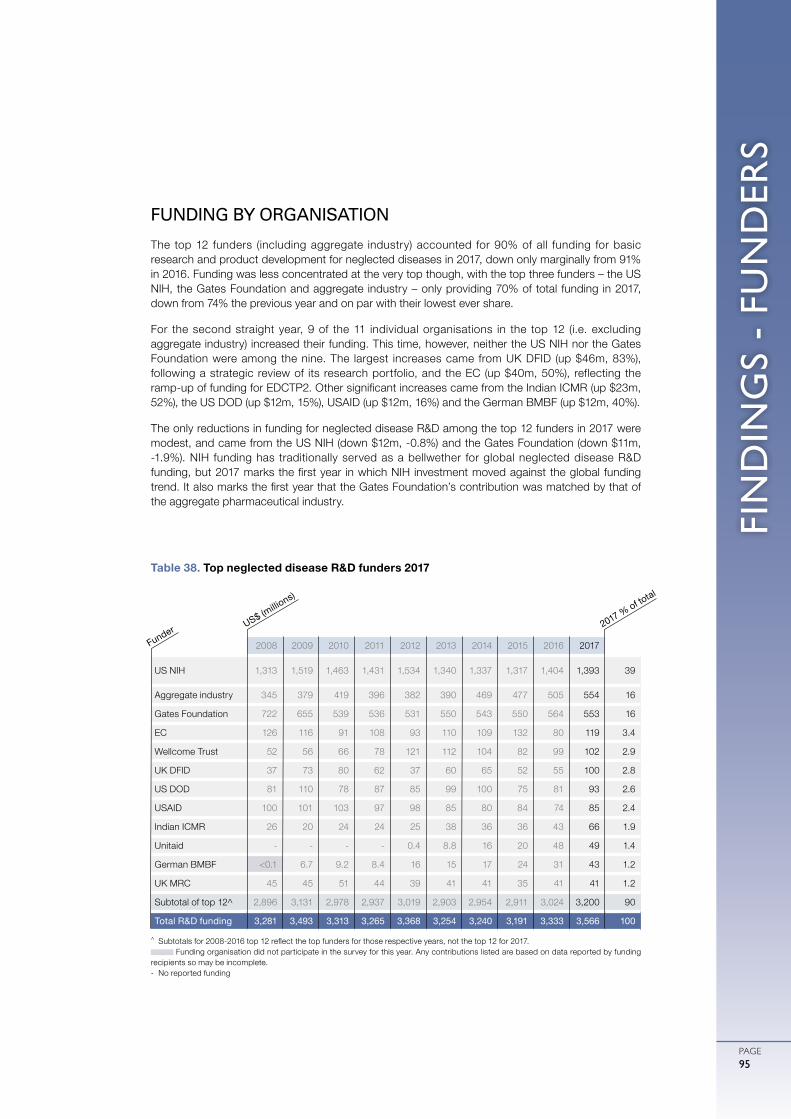
FIN
DIN
GS
- FU
ND
ERS
PAGE95
FUNDING BY ORGANISATION
The top 12 funders (including aggregate industry) accounted for 90% of all funding for basic research and product development for neglected diseases in 2017, down only marginally from 91% in 2016. Funding was less concentrated at the very top though, with the top three funders – the US NIH, the Gates Foundation and aggregate industry – only providing 70% of total funding in 2017, down from 74% the previous year and on par with their lowest ever share.
For the second straight year, 9 of the 11 individual organisations in the top 12 (i.e. excluding aggregate industry) increased their funding. This time, however, neither the US NIH nor the Gates Foundation were among the nine. The largest increases came from UK DFID (up $46m, 83%), following a strategic review of its research portfolio, and the EC (up $40m, 50%), reflecting the ramp-up of funding for EDCTP2. Other significant increases came from the Indian ICMR (up $23m, 52%), the US DOD (up $12m, 15%), USAID (up $12m, 16%) and the German BMBF (up $12m, 40%).
The only reductions in funding for neglected disease R&D among the top 12 funders in 2017 were modest, and came from the US NIH (down $12m, -0.8%) and the Gates Foundation (down $11m, -1.9%). NIH funding has traditionally served as a bellwether for global neglected disease R&D funding, but 2017 marks the first year in which NIH investment moved against the global funding trend. It also marks the first year that the Gates Foundation’s contribution was matched by that of the aggregate pharmaceutical industry.
2008 2009 2010 2011 2012 2013 2014 2015 2016 2017
US NIH 1,313 1,519 1,463 1,431 1,534 1,340 1,337 1,317 1,404 1,393 39
Aggregate industry 345 379 419 396 382 390 469 477 505 554 16
Gates Foundation 722 655 539 536 531 550 543 550 564 553 16
EC 126 116 91 108 93 110 109 132 80 119 3.4
Wellcome Trust 52 56 66 78 121 112 104 82 99 102 2.9
UK DFID 37 73 80 62 37 60 65 52 55 100 2.8
US DOD 81 110 78 87 85 99 100 75 81 93 2.6
USAID 100 101 103 97 98 85 80 84 74 85 2.4
Indian ICMR 26 20 24 24 25 38 36 36 43 66 1.9
Unitaid - - - - 0.4 8.8 16 20 48 49 1.4
German BMBF <0.1 6.7 9.2 8.4 16 15 17 24 31 43 1.2
UK MRC 45 45 51 44 39 41 41 35 41 41 1.2
Subtotal of top 12^ 2,896 3,131 2,978 2,937 3,019 2,903 2,954 2,911 3,024 3,200 90
Total R&D funding 3,281 3,493 3,313 3,265 3,368 3,254 3,240 3,191 3,333 3,566 100
Table 38. Top neglected disease R&D funders 2017
^ Subtotals for 2008-2016 top 12 reflect the top funders for those respective years, not the top 12 for 2017. Funding organisation did not participate in the survey for this year. Any contributions listed are based on data reported by funding
recipients so may be incomplete.- No reported funding
US$ (millio
ns)
Funder 2017 % of total
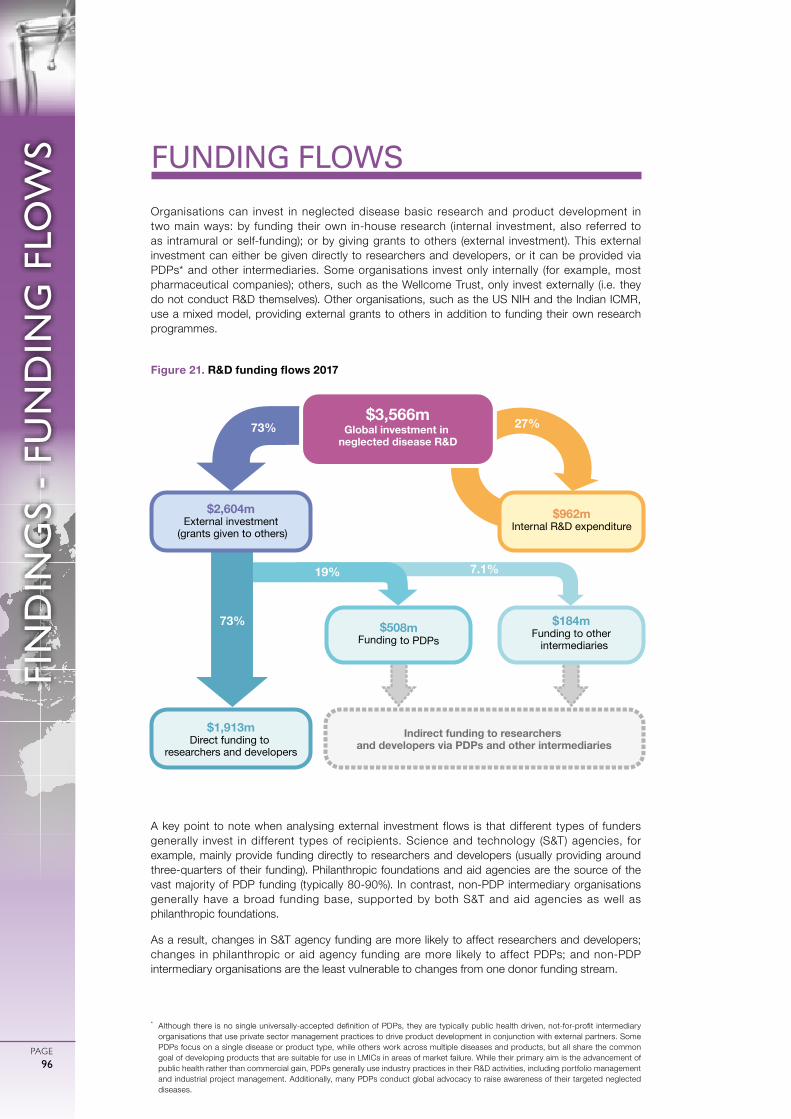
0
ガル図法(赤道縮尺) 1:47,000,000
1000 2000 3000 4000 5000km
75゜
60゜
45゜
30゜
15゜
0゜
15゜
30゜
45゜
60゜
75゜
90゜
180゜ 165゜ 150゜ 135゜ 120゜ 105゜ 90゜ 75゜ 60゜ 45゜ 30゜ 15゜ 15゜ 0゜ 165゜ 150゜ 135゜ 120゜ 105゜ 90゜ 75゜ 60゜ 45゜
PAGE96
FIN
DIN
GS
- FU
ND
ING
FLO
WS
* Although there is no single universally-accepted definition of PDPs, they are typically public health driven, not-for-profit intermediary organisations that use private sector management practices to drive product development in conjunction with external partners. Some PDPs focus on a single disease or product type, while others work across multiple diseases and products, but all share the common goal of developing products that are suitable for use in LMICs in areas of market failure. While their primary aim is the advancement of public health rather than commercial gain, PDPs generally use industry practices in their R&D activities, including portfolio management and industrial project management. Additionally, many PDPs conduct global advocacy to raise awareness of their targeted neglected diseases.
Organisations can invest in neglected disease basic research and product development in two main ways: by funding their own in-house research (internal investment, also referred to as intramural or self-funding); or by giving grants to others (external investment). This external investment can either be given directly to researchers and developers, or it can be provided via PDPs* and other intermediaries. Some organisations invest only internally (for example, most pharmaceutical companies); others, such as the Wellcome Trust, only invest externally (i.e. they do not conduct R&D themselves). Other organisations, such as the US NIH and the Indian ICMR, use a mixed model, providing external grants to others in addition to funding their own research programmes.
FUNDING FLOWS
Figure 21. R&D funding flows 2017
A key point to note when analysing external investment flows is that different types of funders generally invest in different types of recipients. Science and technology (S&T) agencies, for example, mainly provide funding directly to researchers and developers (usually providing around three-quarters of their funding). Philanthropic foundations and aid agencies are the source of the vast majority of PDP funding (typically 80-90%). In contrast, non-PDP intermediary organisations generally have a broad funding base, supported by both S&T and aid agencies as well as philanthropic foundations.
As a result, changes in S&T agency funding are more likely to affect researchers and developers; changes in philanthropic or aid agency funding are more likely to affect PDPs; and non-PDP intermediary organisations are the least vulnerable to changes from one donor funding stream.
$3,566mGlobal investment in
neglected disease R&D
$962mInternal R&D expenditure
$2,604mExternal investment
(grants given to others)
$1,913mDirect funding to
researchers and developers
$184mFunding to other intermediaries
$508mFunding to PDPs
Indirect funding to researchers and developers via PDPs and other intermediaries
73% 27%
19%
73%
7.1%
PAGE97
FIN
DIN
GS
- FU
ND
ING
FLO
WS
FUNDING FLOW TRENDS
Once again, just under three-quarters ($2,604m, 73%) of all funding for neglected disease basic research and product development in 2017 was given externally in the form of grants or contracts, with internal investments ($962m, 27%) making up the remainder. External funding increased for the second year in a row (up $149m, 6.1%), this time driven by increased funding from the EC and the UK government to fund managers (PDPs and intermediaries). Self-funding also increased in 2017 (up $84m, 9.5%), continuing its steady growth since the start of the G-FINDER survey. However, the scale of this headline increase was heavily influenced by new industry survey participants; when this effect is excluded, the increase in self-funding was more modest (up $23m, 2.8%), and entirely driven by government agencies.
Almost three-quarters ($1,913m, 73%) of all external funding disbursed in 2017 was given directly to researchers and developers, down from 78% in 2016. This reduced share was entirely due to an increase in investments made to fund managers, as funding to researchers and developers in fact remained stable (up $5.6m, 0.3%), with an increase from philanthropic organisations (up $34m, 7.9%) offsetting a decrease from HIC S&T agencies (down $29m, -2.1%). The increase in funding from philanthropic organisations was driven by the Gates Foundation (up $22m, 6.9%), whose funding to researchers and developers reached its highest level in the history of the G-FINDER survey ($343m). The overall decrease in spending by HIC S&T agencies was mostly due to reduced funding from the US NIH (down $30m, -2.5%), following a large increase in 2016.
A little over a quarter ($691m, 27%) of all external funding disbursed in 2017 was given to fund managers, which then either pass this funding on to researchers and developers, or invest it in their own internal R&D activities. This was the largest investment in fund managers (in both absolute terms and as a share of total external funding) since 2008. The increase in share (up from 22% in 2016) was driven by a doubling of funding to non-PDP intermediaries (up $91m, 99%), as well as a sharp increase in funding to PDPs (up $52m, 11%).
A total of $508m (19% of all external investment) was channelled through PDPs in 2017. The growth in funding to PDPs came after an historic low in 2016, and benefitted the majority of PDPs. It was driven by increased investment by UK and US government agencies, including UK DFID (up $44m, 89%), the US NIH (up $20m, 98%) and USAID (up $17m, 36%), as well as new ODA funding via UK DHSC ($14m in 2017). These increases were collectively more than enough to offset markedly lower funding from the Gates Foundation (down $38m, -16%) and Unitaid (down $12m, -69%).
The doubling of funding from the previous year meant that funding for other (i.e. non-PDP) intermediaries reached an unprecedented level in 2017, at $184m, although this still represented only 7.1% of all external investment. Additional funding for the EDCTP (up $75m, 318%) accounted for most of this increase, reflecting the significantly increased budget of EDCTP2 compared to EDCTP1. Another intermediary, the Clinton Health Access Initiative (CHAI), received funding for neglected disease product R&D for the first time in 2017, through a $12m grant from Unitaid.
A more in-depth analysis of funding for PDPs and other intermediaries is presented on the following pages.
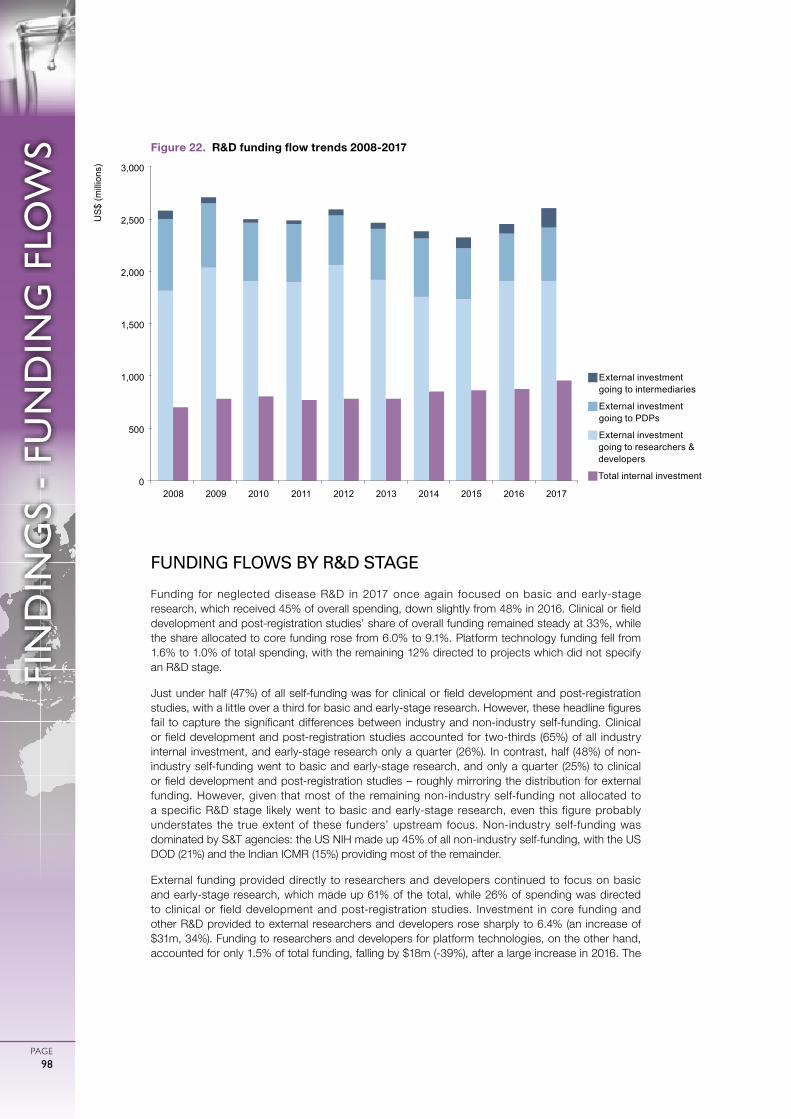
0
ガル図法(赤道縮尺) 1:47,000,000
1000 2000 3000 4000 5000km
75゜
60゜
45゜
30゜
15゜
0゜
15゜
30゜
45゜
60゜
75゜
90゜
180゜ 165゜ 150゜ 135゜ 120゜ 105゜ 90゜ 75゜ 60゜ 45゜ 30゜ 15゜ 15゜ 0゜ 165゜ 150゜ 135゜ 120゜ 105゜ 90゜ 75゜ 60゜ 45゜
PAGE98
FIN
DIN
GS
- FU
ND
ING
FLO
WS Figure 22. R&D funding flow trends 2008-2017
FUNDING FLOWS BY R&D STAGE
Funding for neglected disease R&D in 2017 once again focused on basic and early-stage research, which received 45% of overall spending, down slightly from 48% in 2016. Clinical or field development and post-registration studies’ share of overall funding remained steady at 33%, while the share allocated to core funding rose from 6.0% to 9.1%. Platform technology funding fell from 1.6% to 1.0% of total spending, with the remaining 12% directed to projects which did not specify an R&D stage.
Just under half (47%) of all self-funding was for clinical or field development and post-registration studies, with a little over a third for basic and early-stage research. However, these headline figures fail to capture the significant differences between industry and non-industry self-funding. Clinical or field development and post-registration studies accounted for two-thirds (65%) of all industry internal investment, and early-stage research only a quarter (26%). In contrast, half (48%) of non-industry self-funding went to basic and early-stage research, and only a quarter (25%) to clinical or field development and post-registration studies – roughly mirroring the distribution for external funding. However, given that most of the remaining non-industry self-funding not allocated to a specific R&D stage likely went to basic and early-stage research, even this figure probably understates the true extent of these funders’ upstream focus. Non-industry self-funding was dominated by S&T agencies: the US NIH made up 45% of all non-industry self-funding, with the US DOD (21%) and the Indian ICMR (15%) providing most of the remainder.
External funding provided directly to researchers and developers continued to focus on basic and early-stage research, which made up 61% of the total, while 26% of spending was directed to clinical or field development and post-registration studies. Investment in core funding and other R&D provided to external researchers and developers rose sharply to 6.4% (an increase of $31m, 34%). Funding to researchers and developers for platform technologies, on the other hand, accounted for only 1.5% of total funding, falling by $18m (-39%), after a large increase in 2016. The
g�External investment going to intermediaries
g�External investment going to PDPs
gExternal investment going to researchers & developers
gTotal internal investment0
500
1,000
1,500
2,000
2,500
3,000
2008 2009 2010 2011 2012 2013 2014 2015 2016 2017
US
$ (m
illio
ns)
PAGE99
FIN
DIN
GS
- FU
ND
ING
FLO
WS
remaining 5.4% of funding for researchers and developers did not specify an R&D stage.
Funding given to PDPs focused on clinical or field development and post-registration studies (41% of PDP funding), rather than basic and early-stage research (16%). The remainder (34%) was not allocated to a specific R&D stage, although unlike non-industry self-funding, in the case of PDPs this unspecified amount generally represents portfolio-based investment that covers both early-stage and clinical development efforts.
Three-quarters (75%) of all funding to non-PDP intermediaries was core funding and other R&D, and therefore not allocated to a specific R&D stage. This was heavily influenced by funding to the European and Developing Countries Clinical Trials Partnership – it received more than half (54%) of all funding to non-PDP intermediaries, 93% of which was core funding and other R&D – suggesting that a large proportion of funding in this category was ultimately devoted to clinical development.
FUNDING FOR PRODUCT DEVELOPMENT PARTNERSHIPS
PDPs received $508m in 2017, accounting for 14% of all neglected disease basic research and product development funding, and 19% of all external investment. Funding to PDPs increased by $52m in 2017 (up 11%), reflecting increased investments from HIC government agencies, after historically low levels of funding in 2016. Annual changes in funding to PDPs should often be interpreted with caution, given the highly cyclical nature of this funding, especially from the Gates Foundation, but the broad-based increase in public funding for PDPs in 2017 is notable.
As always, the role of PDPs is somewhat obscured by the US NIH, which is the largest funder of neglected disease R&D, but allocates only a small proportion of its funding to PDPs. If the US NIH is excluded, PDPs collectively managed one-third (33%) of all non-NIH external grant funding for neglected disease R&D in 2017.
The three highest-funded PDPs in any given year regularly receive between 40% and 50% of total annual PDP funding. In 2017 (just as in 2016), these three PDPs were the International AIDS Vaccine Initiative (IAVI), Medicines for Malaria Venture (MMV) and PATH, which collectively received a little under half ($225m, 44%) of all PDP funding.
Government agencies in HICs were behind many of the most significant increases in PDP funding. The largest increase was for FHI360 (up $21m, 164%), due to additional US NIH investment in the HIV Prevention Trials Network. This was followed by IPM (up $17m, 85%), primarily the result of increased funding from USAID and from a number of European government agencies, and MMV (up $15m, 24%) driven by increased funding from the UK’s DHSC and DFID (which also contributed to the smaller increases to TB Alliance and DNDi). PATH (up $17m, 34%) was the only PDP whose increase in funding came primarily from the Gates Foundation, while the absence of any disbursements from the Gates Foundation in 2017 was also behind the decrease in funding to IVCC (down $22m, -67%).
Once again, more than three-quarters of all funding to PDPs in 2017 ($388m, 76%) was invested in the three diseases that received the most funding overall: $174m for HIV/AIDS, $119m for malaria, and $95m for TB.
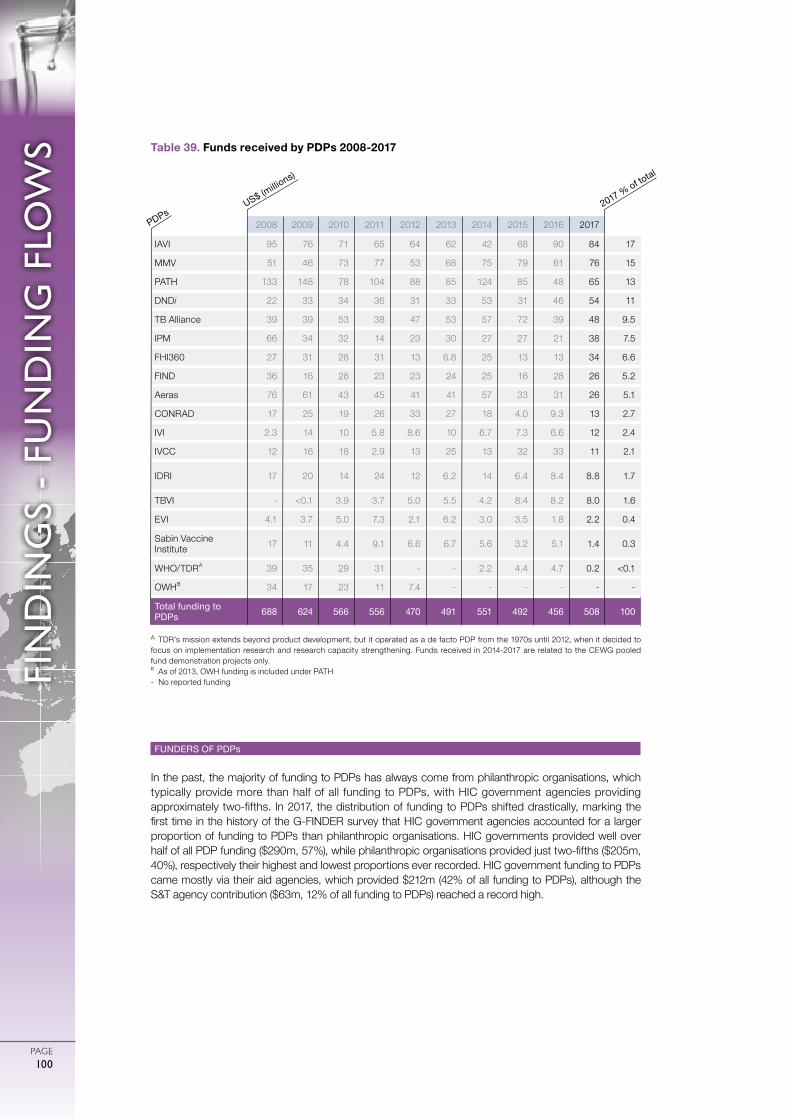
0
ガル図法(赤道縮尺) 1:47,000,000
1000 2000 3000 4000 5000km
75゜
60゜
45゜
30゜
15゜
0゜
15゜
30゜
45゜
60゜
75゜
90゜
180゜ 165゜ 150゜ 135゜ 120゜ 105゜ 90゜ 75゜ 60゜ 45゜ 30゜ 15゜ 15゜ 0゜ 165゜ 150゜ 135゜ 120゜ 105゜ 90゜ 75゜ 60゜ 45゜
PAGE100
FIN
DIN
GS
- FU
ND
ING
FLO
WS
FUNDERS OF PDPs
In the past, the majority of funding to PDPs has always come from philanthropic organisations, which typically provide more than half of all funding to PDPs, with HIC government agencies providing approximately two-fifths. In 2017, the distribution of funding to PDPs shifted drastically, marking the first time in the history of the G-FINDER survey that HIC government agencies accounted for a larger proportion of funding to PDPs than philanthropic organisations. HIC governments provided well over half of all PDP funding ($290m, 57%), while philanthropic organisations provided just two-fifths ($205m, 40%), respectively their highest and lowest proportions ever recorded. HIC government funding to PDPs came mostly via their aid agencies, which provided $212m (42% of all funding to PDPs), although the S&T agency contribution ($63m, 12% of all funding to PDPs) reached a record high.
Table 39. Funds received by PDPs 2008-2017
A TDR’s mission extends beyond product development, but it operated as a de facto PDP from the 1970s until 2012, when it decided to focus on implementation research and research capacity strengthening. Funds received in 2014-2017 are related to the CEWG pooled fund demonstration projects only.B As of 2013, OWH funding is included under PATH - No reported funding
2008 2009 2010 2011 2012 2013 2014 2015 2016 2017
IAVI 95 76 71 65 64 62 42 68 90 84 17
MMV 51 46 73 77 53 68 75 79 61 76 15
PATH 133 148 78 104 88 85 124 85 48 65 13
DNDi 22 33 34 36 31 33 53 31 46 54 11
TB Alliance 39 39 53 38 47 53 57 72 39 48 9.5
IPM 66 34 32 14 23 30 27 27 21 38 7.5
FHI360 27 31 28 31 13 6.8 25 13 13 34 6.6
FIND 36 16 28 23 23 24 25 16 28 26 5.2
Aeras 76 61 43 45 41 41 57 33 31 26 5.1
CONRAD 17 25 19 26 33 27 18 4.0 9.3 13 2.7
IVI 2.3 14 10 5.8 8.6 10 6.7 7.3 6.6 12 2.4
IVCC 12 16 18 2.9 13 25 13 32 33 11 2.1
IDRI 17 20 14 24 12 6.2 14 6.4 8.4 8.8 1.7
TBVI - <0.1 3.9 3.7 5.0 5.5 4.2 8.4 8.2 8.0 1.6
EVI 4.1 3.7 5.0 7.3 2.1 6.2 3.0 3.5 1.8 2.2 0.4
Sabin Vaccine Institute 17 11 4.4 9.1 6.6 6.7 5.6 3.2 5.1 1.4 0.3
WHO/TDRA 39 35 29 31 - - 2.2 4.4 4.7 0.2 <0.1
OWHB 34 17 23 11 7.4 - - - - - -
Total funding to PDPs 688 624 566 556 470 491 551 492 456 508 100
US$ (millio
ns)
PDPs2017 % of to
tal
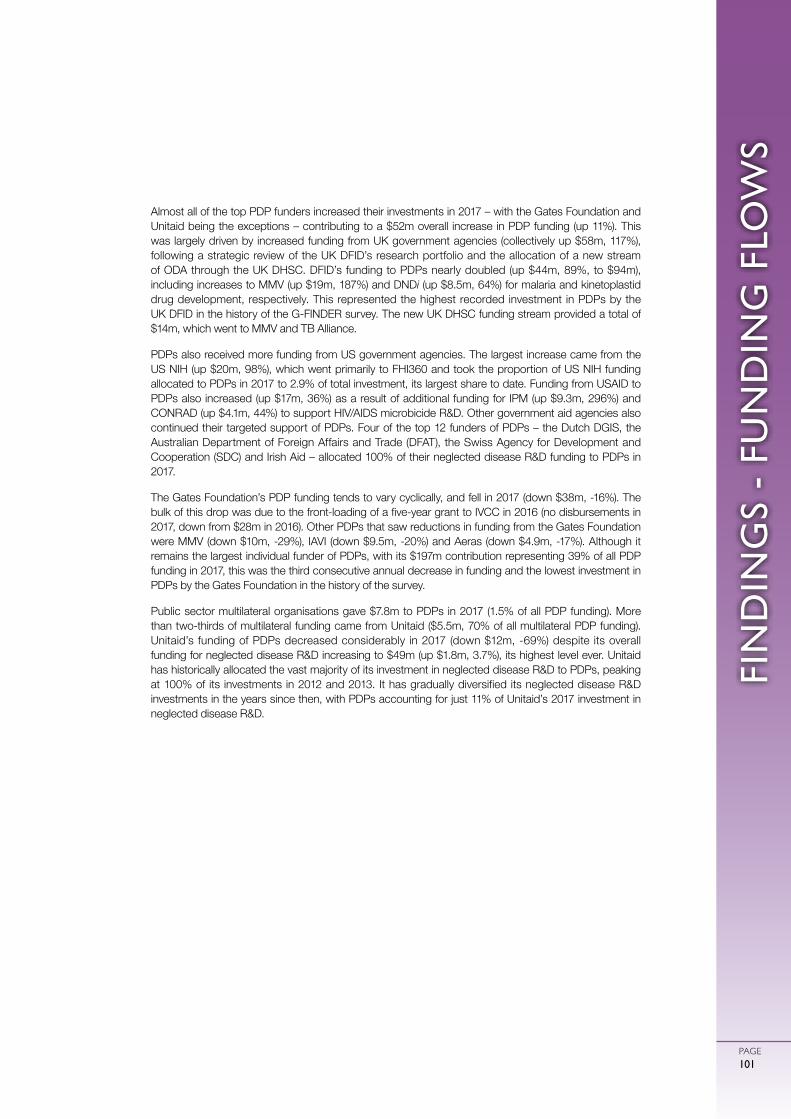
PAGE101
FIN
DIN
GS
- FU
ND
ING
FLO
WS
Almost all of the top PDP funders increased their investments in 2017 – with the Gates Foundation and Unitaid being the exceptions – contributing to a $52m overall increase in PDP funding (up 11%). This was largely driven by increased funding from UK government agencies (collectively up $58m, 117%), following a strategic review of the UK DFID’s research portfolio and the allocation of a new stream of ODA through the UK DHSC. DFID’s funding to PDPs nearly doubled (up $44m, 89%, to $94m), including increases to MMV (up $19m, 187%) and DNDi (up $8.5m, 64%) for malaria and kinetoplastid drug development, respectively. This represented the highest recorded investment in PDPs by the UK DFID in the history of the G-FINDER survey. The new UK DHSC funding stream provided a total of $14m, which went to MMV and TB Alliance.
PDPs also received more funding from US government agencies. The largest increase came from the US NIH (up $20m, 98%), which went primarily to FHI360 and took the proportion of US NIH funding allocated to PDPs in 2017 to 2.9% of total investment, its largest share to date. Funding from USAID to PDPs also increased (up $17m, 36%) as a result of additional funding for IPM (up $9.3m, 296%) and CONRAD (up $4.1m, 44%) to support HIV/AIDS microbicide R&D. Other government aid agencies also continued their targeted support of PDPs. Four of the top 12 funders of PDPs – the Dutch DGIS, the Australian Department of Foreign Affairs and Trade (DFAT), the Swiss Agency for Development and Cooperation (SDC) and Irish Aid – allocated 100% of their neglected disease R&D funding to PDPs in 2017.
The Gates Foundation’s PDP funding tends to vary cyclically, and fell in 2017 (down $38m, -16%). The bulk of this drop was due to the front-loading of a five-year grant to IVCC in 2016 (no disbursements in 2017, down from $28m in 2016). Other PDPs that saw reductions in funding from the Gates Foundation were MMV (down $10m, -29%), IAVI (down $9.5m, -20%) and Aeras (down $4.9m, -17%). Although it remains the largest individual funder of PDPs, with its $197m contribution representing 39% of all PDP funding in 2017, this was the third consecutive annual decrease in funding and the lowest investment in PDPs by the Gates Foundation in the history of the survey.
Public sector multilateral organisations gave $7.8m to PDPs in 2017 (1.5% of all PDP funding). More than two-thirds of multilateral funding came from Unitaid ($5.5m, 70% of all multilateral PDP funding). Unitaid’s funding of PDPs decreased considerably in 2017 (down $12m, -69%) despite its overall funding for neglected disease R&D increasing to $49m (up $1.8m, 3.7%), its highest level ever. Unitaid has historically allocated the vast majority of its investment in neglected disease R&D to PDPs, peaking at 100% of its investments in 2012 and 2013. It has gradually diversified its neglected disease R&D investments in the years since then, with PDPs accounting for just 11% of Unitaid’s 2017 investment in neglected disease R&D.
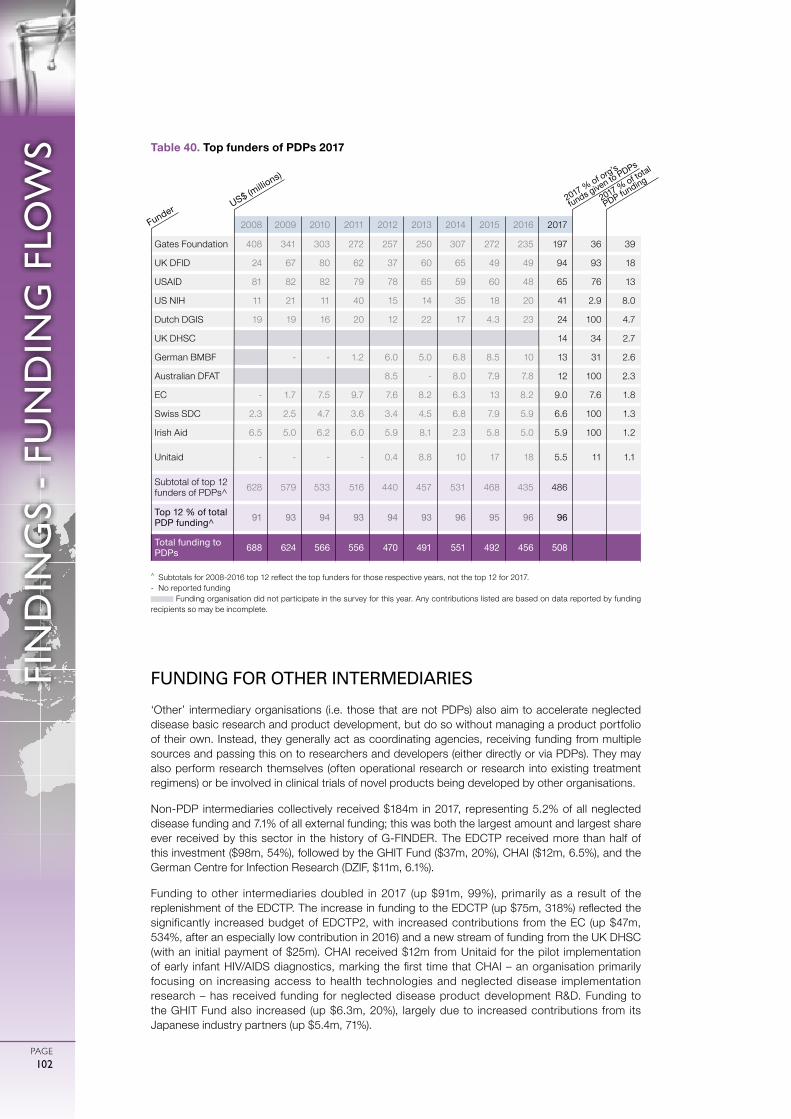
0
ガル図法(赤道縮尺) 1:47,000,000
1000 2000 3000 4000 5000km
75゜
60゜
45゜
30゜
15゜
0゜
15゜
30゜
45゜
60゜
75゜
90゜
180゜ 165゜ 150゜ 135゜ 120゜ 105゜ 90゜ 75゜ 60゜ 45゜ 30゜ 15゜ 15゜ 0゜ 165゜ 150゜ 135゜ 120゜ 105゜ 90゜ 75゜ 60゜ 45゜
PAGE102
FIN
DIN
GS
- FU
ND
ING
FLO
WS
FUNDING FOR OTHER INTERMEDIARIES
‘Other’ intermediary organisations (i.e. those that are not PDPs) also aim to accelerate neglected disease basic research and product development, but do so without managing a product portfolio of their own. Instead, they generally act as coordinating agencies, receiving funding from multiple sources and passing this on to researchers and developers (either directly or via PDPs). They may also perform research themselves (often operational research or research into existing treatment regimens) or be involved in clinical trials of novel products being developed by other organisations.
Non-PDP intermediaries collectively received $184m in 2017, representing 5.2% of all neglected disease funding and 7.1% of all external funding; this was both the largest amount and largest share ever received by this sector in the history of G-FINDER. The EDCTP received more than half of this investment ($98m, 54%), followed by the GHIT Fund ($37m, 20%), CHAI ($12m, 6.5%), and the German Centre for Infection Research (DZIF, $11m, 6.1%).
Funding to other intermediaries doubled in 2017 (up $91m, 99%), primarily as a result of the replenishment of the EDCTP. The increase in funding to the EDCTP (up $75m, 318%) reflected the significantly increased budget of EDCTP2, with increased contributions from the EC (up $47m, 534%, after an especially low contribution in 2016) and a new stream of funding from the UK DHSC (with an initial payment of $25m). CHAI received $12m from Unitaid for the pilot implementation of early infant HIV/AIDS diagnostics, marking the first time that CHAI – an organisation primarily focusing on increasing access to health technologies and neglected disease implementation research – has received funding for neglected disease product development R&D. Funding to the GHIT Fund also increased (up $6.3m, 20%), largely due to increased contributions from its Japanese industry partners (up $5.4m, 71%).
^ Subtotals for 2008-2016 top 12 reflect the top funders for those respective years, not the top 12 for 2017.- No reported funding
Funding organisation did not participate in the survey for this year. Any contributions listed are based on data reported by funding recipients so may be incomplete.
Table 40. Top funders of PDPs 2017
2008 2009 2010 2011 2012 2013 2014 2015 2016 2017
Gates Foundation 408 341 303 272 257 250 307 272 235 197 36 39
UK DFID 24 67 80 62 37 60 65 49 49 94 93 18
USAID 81 82 82 79 78 65 59 60 48 65 76 13
US NIH 11 21 11 40 15 14 35 18 20 41 2.9 8.0
Dutch DGIS 19 19 16 20 12 22 17 4.3 23 24 100 4.7
UK DHSC 14 34 2.7
German BMBF - - 1.2 6.0 5.0 6.8 8.5 10 13 31 2.6
Australian DFAT 8.5 - 8.0 7.9 7.8 12 100 2.3
EC - 1.7 7.5 9.7 7.6 8.2 6.3 13 8.2 9.0 7.6 1.8
Swiss SDC 2.3 2.5 4.7 3.6 3.4 4.5 6.8 7.9 5.9 6.6 100 1.3
Irish Aid 6.5 5.0 6.2 6.0 5.9 8.1 2.3 5.8 5.0 5.9 100 1.2
Unitaid - - - - 0.4 8.8 10 17 18 5.5 11 1.1
Subtotal of top 12 funders of PDPs^ 628 579 533 516 440 457 531 468 435 486
Top 12 % of total PDP funding^ 91 93 94 93 94 93 96 95 96 96
Total funding to PDPs 688 624 566 556 470 491 551 492 456 508
US$ (millio
ns)
Funder2017 % of org’s
funds given to PDPs
2017 % of total
PDP funding
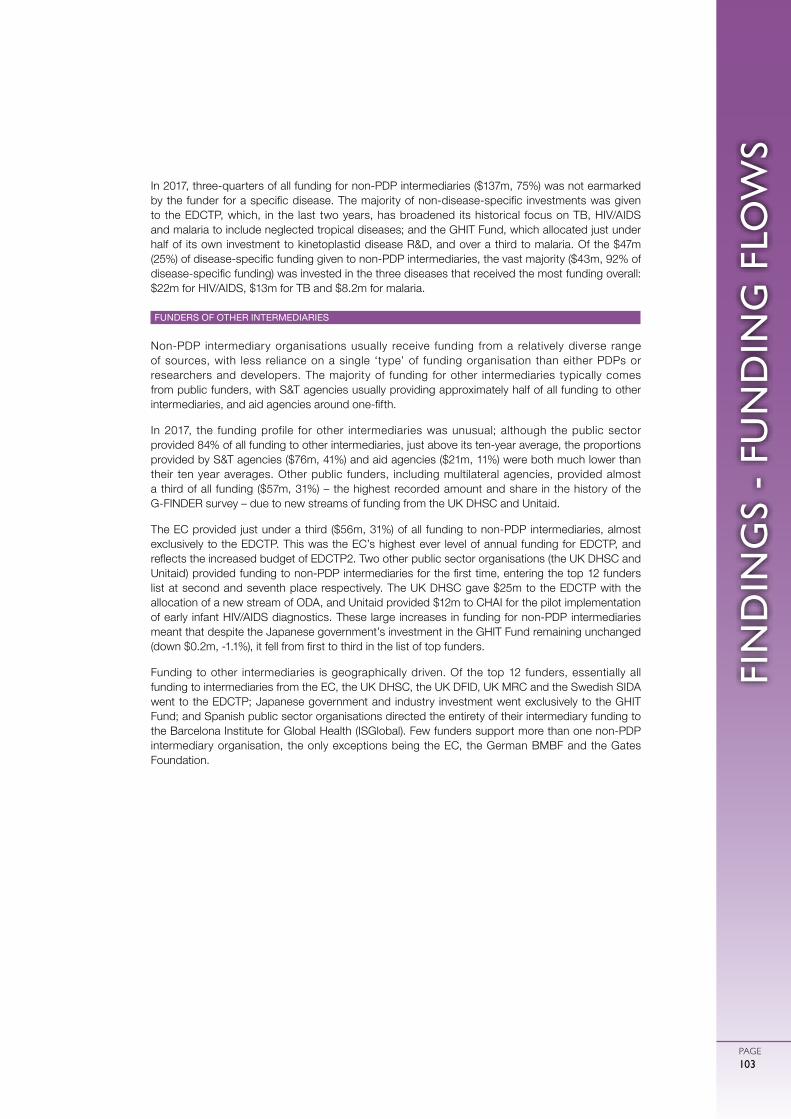
PAGE103
FIN
DIN
GS
- FU
ND
ING
FLO
WS
In 2017, three-quarters of all funding for non-PDP intermediaries ($137m, 75%) was not earmarked by the funder for a specific disease. The majority of non-disease-specific investments was given to the EDCTP, which, in the last two years, has broadened its historical focus on TB, HIV/AIDS and malaria to include neglected tropical diseases; and the GHIT Fund, which allocated just under half of its own investment to kinetoplastid disease R&D, and over a third to malaria. Of the $47m (25%) of disease-specific funding given to non-PDP intermediaries, the vast majority ($43m, 92% of disease-specific funding) was invested in the three diseases that received the most funding overall: $22m for HIV/AIDS, $13m for TB and $8.2m for malaria.
FUNDERS OF OTHER INTERMEDIARIES
Non-PDP intermediary organisations usually receive funding from a relatively diverse range of sources, with less reliance on a single ‘type’ of funding organisation than either PDPs or researchers and developers. The majority of funding for other intermediaries typically comes from public funders, with S&T agencies usually providing approximately half of all funding to other intermediaries, and aid agencies around one-fifth.
In 2017, the funding profile for other intermediaries was unusual; although the public sector provided 84% of all funding to other intermediaries, just above its ten-year average, the proportions provided by S&T agencies ($76m, 41%) and aid agencies ($21m, 11%) were both much lower than their ten year averages. Other public funders, including multilateral agencies, provided almost a third of all funding ($57m, 31%) – the highest recorded amount and share in the history of the G-FINDER survey – due to new streams of funding from the UK DHSC and Unitaid.
The EC provided just under a third ($56m, 31%) of all funding to non-PDP intermediaries, almost exclusively to the EDCTP. This was the EC’s highest ever level of annual funding for EDCTP, and reflects the increased budget of EDCTP2. Two other public sector organisations (the UK DHSC and Unitaid) provided funding to non-PDP intermediaries for the first time, entering the top 12 funders list at second and seventh place respectively. The UK DHSC gave $25m to the EDCTP with the allocation of a new stream of ODA, and Unitaid provided $12m to CHAI for the pilot implementation of early infant HIV/AIDS diagnostics. These large increases in funding for non-PDP intermediaries meant that despite the Japanese government’s investment in the GHIT Fund remaining unchanged (down $0.2m, -1.1%), it fell from first to third in the list of top funders.
Funding to other intermediaries is geographically driven. Of the top 12 funders, essentially all funding to intermediaries from the EC, the UK DHSC, the UK DFID, UK MRC and the Swedish SIDA went to the EDCTP; Japanese government and industry investment went exclusively to the GHIT Fund; and Spanish public sector organisations directed the entirety of their intermediary funding to the Barcelona Institute for Global Health (ISGlobal). Few funders support more than one non-PDP intermediary organisation, the only exceptions being the EC, the German BMBF and the Gates Foundation.
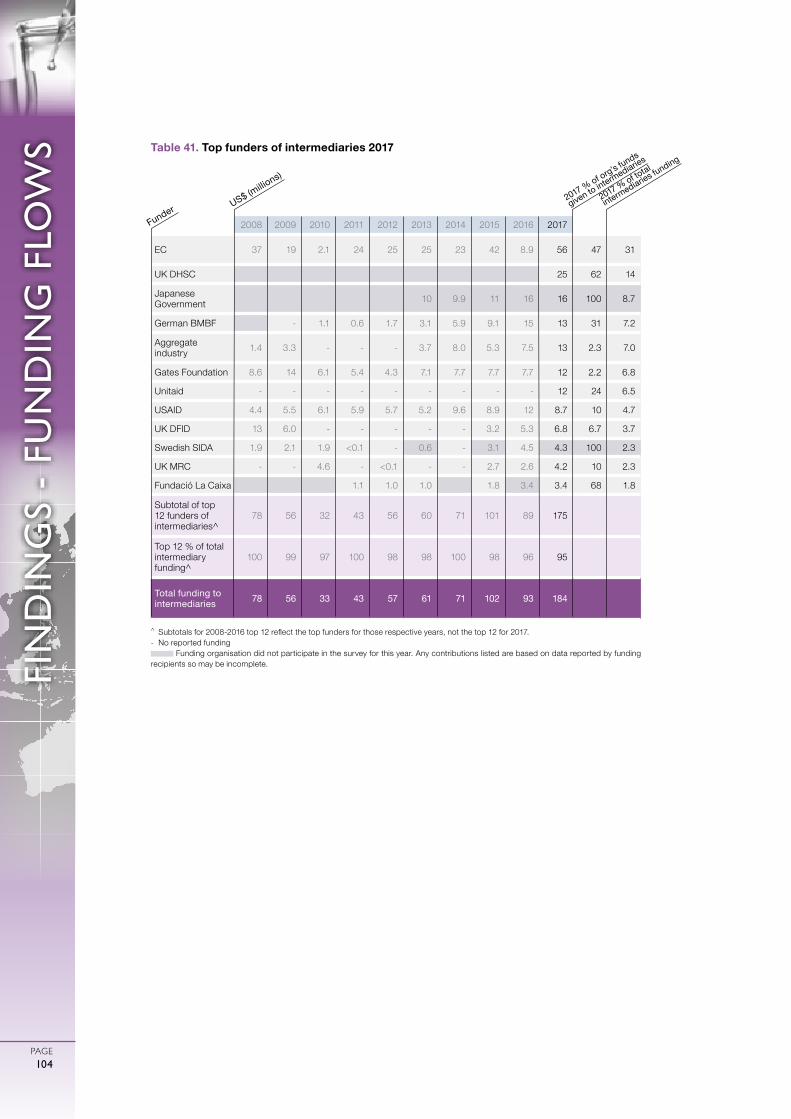
0
ガル図法(赤道縮尺) 1:47,000,000
1000 2000 3000 4000 5000km
75゜
60゜
45゜
30゜
15゜
0゜
15゜
30゜
45゜
60゜
75゜
90゜
180゜ 165゜ 150゜ 135゜ 120゜ 105゜ 90゜ 75゜ 60゜ 45゜ 30゜ 15゜ 15゜ 0゜ 165゜ 150゜ 135゜ 120゜ 105゜ 90゜ 75゜ 60゜ 45゜
PAGE104
FIN
DIN
GS
- FU
ND
ING
FLO
WS
^ Subtotals for 2008-2016 top 12 reflect the top funders for those respective years, not the top 12 for 2017.- No reported funding
Funding organisation did not participate in the survey for this year. Any contributions listed are based on data reported by funding recipients so may be incomplete.
Table 41. Top funders of intermediaries 2017
2008 2009 2010 2011 2012 2013 2014 2015 2016 2017
EC 37 19 2.1 24 25 25 23 42 8.9 56 47 31
UK DHSC 25 62 14
Japanese Government 10 9.9 11 16 16 100 8.7
German BMBF - 1.1 0.6 1.7 3.1 5.9 9.1 15 13 31 7.2
Aggregate industry 1.4 3.3 - - - 3.7 8.0 5.3 7.5 13 2.3 7.0
Gates Foundation 8.6 14 6.1 5.4 4.3 7.1 7.7 7.7 7.7 12 2.2 6.8
Unitaid - - - - - - - - - 12 24 6.5
USAID 4.4 5.5 6.1 5.9 5.7 5.2 9.6 8.9 12 8.7 10 4.7
UK DFID 13 6.0 - - - - - 3.2 5.3 6.8 6.7 3.7
Swedish SIDA 1.9 2.1 1.9 <0.1 - 0.6 - 3.1 4.5 4.3 100 2.3
UK MRC - - 4.6 - <0.1 - - 2.7 2.6 4.2 10 2.3
Fundació La Caixa 1.1 1.0 1.0 1.8 3.4 3.4 68 1.8
Subtotal of top 12 funders of intermediaries^
78 56 32 43 56 60 71 101 89 175
Top 12 % of total intermediary funding^
100 99 97 100 98 98 100 98 96 95
Total funding to intermediaries 78 56 33 43 57 61 71 102 93 184
US$ (millio
ns)
Funder2017 % of org’s funds
given to intermediaries
2017 % of total
intermediaries funding
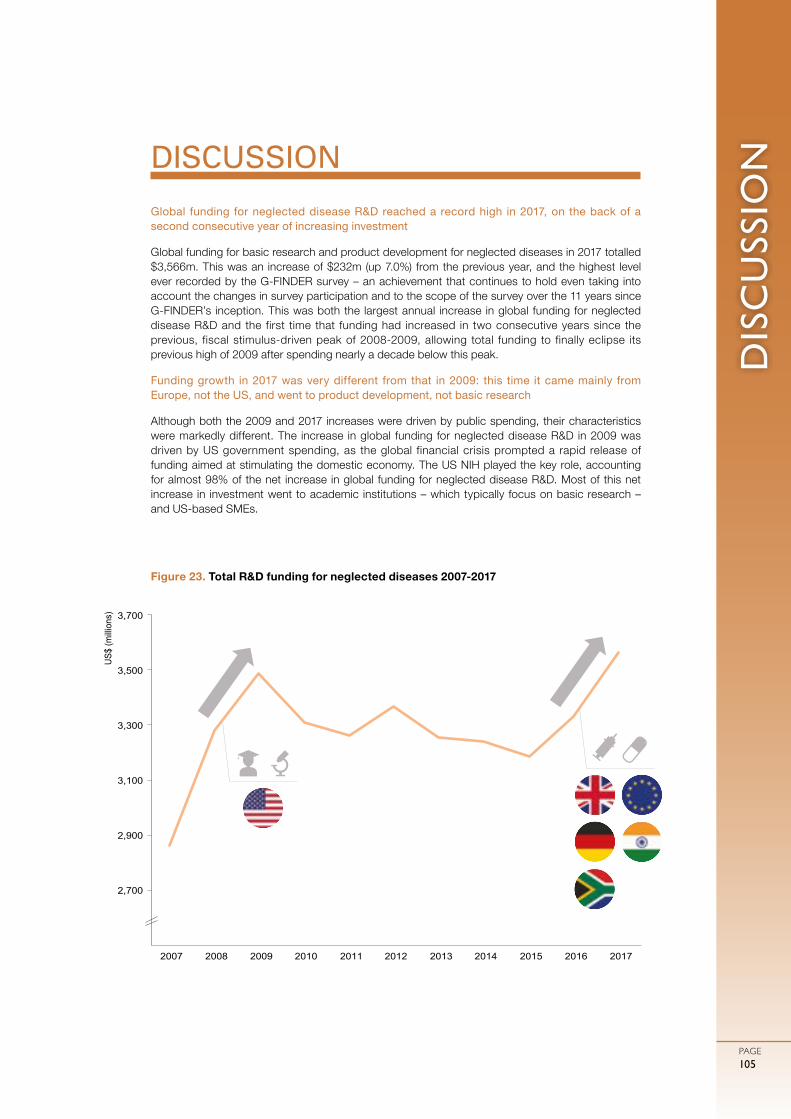
DIS
CU
SSIO
N
PAGE105
Global funding for neglected disease R&D reached a record high in 2017, on the back of a second consecutive year of increasing investment
Global funding for basic research and product development for neglected diseases in 2017 totalled $3,566m. This was an increase of $232m (up 7.0%) from the previous year, and the highest level ever recorded by the G-FINDER survey – an achievement that continues to hold even taking into account the changes in survey participation and to the scope of the survey over the 11 years since G-FINDER’s inception. This was both the largest annual increase in global funding for neglected disease R&D and the first time that funding had increased in two consecutive years since the previous, fiscal stimulus-driven peak of 2008-2009, allowing total funding to finally eclipse its previous high of 2009 after spending nearly a decade below this peak.
Funding growth in 2017 was very different from that in 2009: this time it came mainly from Europe, not the US, and went to product development, not basic research
Although both the 2009 and 2017 increases were driven by public spending, their characteristics were markedly different. The increase in global funding for neglected disease R&D in 2009 was driven by US government spending, as the global financial crisis prompted a rapid release of funding aimed at stimulating the domestic economy. The US NIH played the key role, accounting for almost 98% of the net increase in global funding for neglected disease R&D. Most of this net increase in investment went to academic institutions – which typically focus on basic research – and US-based SMEs.
DISCUSSION
2,700
2,900
3,100
3,300
3,500
3,700
2007 2008 2009 2010 2011 2012 2013 2014 2015 2016 2017
US$
(milli
ons)
Figure 23. Total R&D funding for neglected diseases 2007-2017
0
ガル図法(赤道縮尺) 1:47,000,000
1000 2000 3000 4000 5000km
75゜
60゜
45゜
30゜
15゜
0゜
15゜
30゜
45゜
60゜
75゜
90゜
180゜ 165゜ 150゜ 135゜ 120゜ 105゜ 90゜ 75゜ 60゜ 45゜ 30゜ 15゜ 15゜ 0゜ 165゜ 150゜ 135゜ 120゜ 105゜ 90゜ 75゜ 60゜ 45゜
DIS
CU
SSIO
N
PAGE106
The 2017 increase also came from the public sector, but this time it was primarily driven by the UK government – on the back of a strategic review and additional ODA funding – and the European Commission – via increased funding for the EDCTP – alongside the governments of India and Germany. The 2017 increase was also primarily directed towards PDPs and intermediaries – organisations that focus on clinical trials and product development – with 90% of the new investment going to either core funding or clinical development.
The combined effect of these changes was twofold. Firstly, the gap between the share of funding coming from the US government and that from the second-largest public funder shrank to its lowest level on record. And secondly, 2017 marked the first time ever that PDPs received more of their funding from governments than they did from philanthropic organisations. It also marked the first time on record that overall funding increased despite decreases from both the NIH and the Gates Foundation, normally the bellwethers for global funding.
Funders outside of the traditional top three or four continued to increase their commitment to neglected disease R&D
Last year’s G-FINDER report recognised important increases in funding from a range of emerging funders, including Unitaid, Médecins Sans Frontières, Gavi, and the governments of Japan, India and Brazil. With the exception of Brazil, where a cap on public spending led to large reductions in R&D funding, every one of these funders increased their investment in 2017.
In addition to the emerging funders called out in last year’s report, German government funding for neglected disease R&D also increased significantly in 2017. This eclipsed its previous high (set in 2012) by 24%, clearly establishing Germany’s position as the most significant European public funder after the UK and EC. Two of the three largest LMIC public funders also increased their funding for neglected disease R&D: as noted above, the Indian government sharply increased its funding (up $21m, 38%), remaining the fourth-largest public funder overall, and providing the highest reported level of public funding from an LMIC. South Africa’s government also increased its contribution (up $2.7m, 24%), resulting in the largest ever investment as a share of gross domestic product (GDP) provided by an LMIC.
A half decade of consecutive yearly increases in industry investment has come to an end, but this is not necessarily cause for alarm
Industry funding provided by regular survey participants was down slightly in 2017, for both MNCs and SMEs, bringing to an end five consecutive years of growth. While any further decline would be worth monitoring closely, this slight fall should be viewed in the context of the recent strong and consistent growth in industry investment in neglected disease R&D, and of the potential for real increases in investment from new survey participants; if historical data was available for these organisations, it may have shown that overall industry investment in 2017 did indeed increase for a sixth consecutive year.
Changes in industry investment are also driven by the state of the product pipeline. The recent rise and fall of industry investment in malaria drug development, for example, reflected the progression of tafenoquine through late-stage trials and to successful registration. A similar pattern was seen for pneumococcal vaccines, with a steady rise and subsequent fall in MNC investment aligned with the late-stage development, approval and introduction of the new conjugate vaccines Synflorix and Prevnar.
DIS
CU
SSIO
N
PAGE107
Industry’s investment in neglected disease R&D is also less concentrated than either public or philanthropic funding, each of which is dominated by two or three organisations. Since the inception of the G-FINDER survey, the top three industry funders in any given year have accounted for an average of only 55% of all industry funding, compared to 73% for the top three public funders and 97% for the top three philanthropic organisations – a pattern that continued to hold in 2017. Similarly, the ranking of industry funders within the top 12 shows more year-to-year variation than either philanthropic or public funding, as industry investment follows the progression of candidates through the R&D pipeline. As long as it is maintained, this diversity should help guard against any precipitous decline in industry investment, which should in fact continue to grow as a healthy pipeline of early-stage neglected disease product candidates proceeds to late-stage clinical trials. But ongoing industry investment in neglected disease R&D can only be guaranteed if there is sustained public and philanthropic commitment.
We are seeing the impact of sustained investment in neglected disease R&D, but we are still falling short of where we need to be
This year alone saw several significant new product approvals: fexinidazole, the first all-oral, short course treatment for both stages of sleeping sickness; moxidectin, the first new onchocerciasis treatment in 20 years; tafenoquine, the first single-dose radical cure for P. vivax malaria; Typbar TCV, the first conjugate typhoid vaccine; and ROTASIIL, a heat-stable rotavirus vaccine designed for developing country use.
But despite the positive stories of new product approvals and global funding for neglected disease R&D reaching a record high in 2017, we are still falling short of where we should be, and where we need to be. Not a single country government in 2017 met the recommendation of the WHO Global Strategy and Plan of Action on Public Health, Innovation and Intellectual Property (GSPOA) that member states dedicate at least 0.01% of their GDP to research into the health needs of developing countries. In fact, over the 11 year history of the G-FINDER report, only the United States has ever met this target (which it did between 2007 and 2012). Only two countries – the United States with 0.0082% and the UK with 0.0071% – were even close to the target in 2017, with no other country even half way there.
The gap is narrowing between the two largest funders of neglected disease R&D (the US government and the Gates Foundation) and the rest of the world. This follows record investments by many members of the next tier of funders, including the UK, India, Germany and Unitaid; along with close-to-historic highs from the EC, the Wellcome Trust, and the pharmaceutical industry. This is unequivocally a positive development, but it also means that continuing to deliver the impact we’ve seen recently will require these funders to either sustain or further increase their current level of investment in neglected disease R&D. And despite this progress, public and philanthropic funding for neglected disease R&D is still too reliant on a handful of organisations. The Gates Foundation and the Wellcome Trust together accounted for 95% of all philanthropic funding in 2017, while the top three public funders – the US, the EC and the UK – jointly made up 82% of public funding. Even with the diversification of funding we saw in 2017, the largest single funder, the US NIH, still provided 39% of all neglected disease R&D funding: more than the Gates Foundation, EC, Wellcome Trust and the entire industry sector combined.
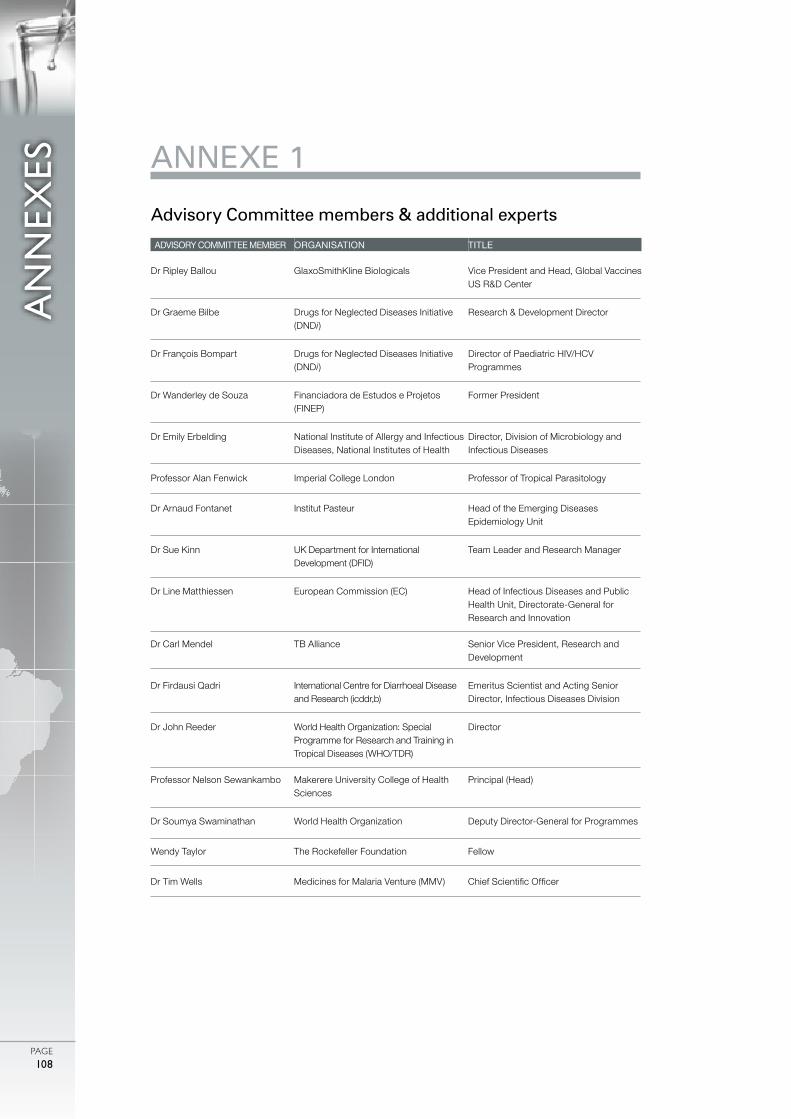
0
ガル図法(赤道縮尺) 1:47,000,000
1000 2000 3000 4000 5000km
75゜
60゜
45゜
30゜
15゜
0゜
15゜
30゜
45゜
60゜
75゜
90゜
180゜ 165゜ 150゜ 135゜ 120゜ 105゜ 90゜ 75゜ 60゜ 45゜ 30゜ 15゜ 15゜ 0゜ 165゜ 150゜ 135゜ 120゜ 105゜ 90゜ 75゜ 60゜ 45゜
AN
NEX
ES
PAGE108
ANNEXE 1
Advisory Committee members & additional experts
ADVISORY COMMITTEE MEMBER ORGANISATION TITLE
Dr Ripley Ballou GlaxoSmithKline Biologicals Vice President and Head, Global Vaccines US R&D Center
Dr Graeme Bilbe Drugs for Neglected Diseases Initiative (DNDi)
Research & Development Director
Dr François Bompart Drugs for Neglected Diseases Initiative (DNDi)
Director of Paediatric HIV/HCV Programmes
Dr Wanderley de Souza Financiadora de Estudos e Projetos (FINEP)
Former President
Dr Emily Erbelding National Institute of Allergy and Infectious Diseases, National Institutes of Health
Director, Division of Microbiology and Infectious Diseases
Professor Alan Fenwick Imperial College London Professor of Tropical Parasitology
Dr Arnaud Fontanet Institut Pasteur Head of the Emerging Diseases Epidemiology Unit
Dr Sue Kinn UK Department for International Development (DFID)
Team Leader and Research Manager
Dr Line Matthiessen European Commission (EC) Head of Infectious Diseases and Public Health Unit, Directorate-General for Research and Innovation
Dr Carl Mendel TB Alliance Senior Vice President, Research and Development
Dr Firdausi Qadri International Centre for Diarrhoeal Disease and Research (icddr,b)
Emeritus Scientist and Acting Senior Director, Infectious Diseases Division
Dr John Reeder World Health Organization: Special Programme for Research and Training in Tropical Diseases (WHO/TDR)
Director
Professor Nelson Sewankambo Makerere University College of Health Sciences
Principal (Head)
Dr Soumya Swaminathan World Health Organization Deputy Director-General for Programmes
Wendy Taylor The Rockefeller Foundation Fellow
Dr Tim Wells Medicines for Malaria Venture (MMV) Chief Scientific Officer
AN
NEX
ES
PAGE109
Professor Simon Croft London School of Hygiene and Tropical Medicine (LSHTM)
Professor of Parasitology, Faculty of Infectious and Tropical Diseases
Professor Janet Hemingway Liverpool School of Tropical Medicine (LSTM)
Director; Chair in Insect Molecular Biology
Dr Stephanie James Foundation for the National Institutes of Health
Director of Science
Dr Patrick Lammie The Task Force for Global Health Chief Scientist, Neglected Tropical Diseases Support Center (NTD-SC)
Professor Marshall Lightowlers University of Melbourne Melbourne Laureate Professor
Professor Rosanna Peeling London School of Hygiene and Tropical Medicine (LSHTM)
Professor and Chair of Diagnostics Research, and Director of the International Diagnostics Centre (IDC)
Dr Sarah Rees Innovative Vector Control Consortium (IVCC)
Public Health Portfolio Manager
Professor Thomas W. Scott University of California, Davis Distinguished Professor, Department of Entomology and Nematology
Dr Joaquim Segalés Foundation for Research in Animal Health (Centre de Recerca en Sanitat Animal) (CReSA)
Director
ADDITIONAL EXPERT ORGANISATION TITLE
0
ガル図法(赤道縮尺) 1:47,000,000
1000 2000 3000 4000 5000km
75゜
60゜
45゜
30゜
15゜
0゜
15゜
30゜
45゜
60゜
75゜
90゜
180゜ 165゜ 150゜ 135゜ 120゜ 105゜ 90゜ 75゜ 60゜ 45゜ 30゜ 15゜ 15゜ 0゜ 165゜ 150゜ 135゜ 120゜ 105゜ 90゜ 75゜ 60゜ 45゜
AN
NEX
ES
PAGE110
ANNEXE 2
Survey respondentsORGANISATION NAME
• AbbVie
• Aeras
• Against Malaria Foundation
• Aidsfonds*
• American Leprosy Missions (ALM)
• amfAR, The Foundation for AIDS Research*
• Apopo
• Argentinian Ministry of Science, Technology and
Productive Innovation (MINCYT)
• Argentinian National Council for Scientific and
Technical Research (CONICET)
• Arisan Therapeutics
• Austrade
• Australian Commonwealth Scientific and Industrial
Research Organisation (CSIRO)
• Australian Department of Foreign Affairs and Trade
(DFAT)
• Australian Department of Industry, Innovation and
Science (DIIS)
• Australian National Health and Medical Research
Council (NHMRC)
• Australian Research Council (ARC)
• Austrian Leprosy Relief Association (ALRA)
• Barcelona Institute for Global Health (ISGlobal)
including Clinic Foundation for Biomedical Research
(FCRB), Barcelona Centre for International Health
Research (CRESIB), and Centre for Research in
Environmental Epidemiology (CREAL)
• BASF
• Bayer CropScience
• Baylor College of Medicine
• Becton, Dickinson and Company (BD)
• Belgian Ministry of Foreign Affairs, Foreign Trade and
Development Cooperation (DGDC)
• Bernhard Nocht Institute for Tropical Medicine (BNI)
• Bill & Melinda Gates Foundation
• BioCryst Pharmaceuticals
• Biological E
• Biotechnology Industry Research Assistance Council
(BIRAC)
• Brazilian Araucária Support Foundation for Scientific
and Technological Development in the State of
Paraná (FAPPR)
• Brazilian Development Bank (BNDES)
• Brazilian Innovation Agency (FINEP)
• Brazilian Ministry of Health: Department of Science
and Technology (DECIT)
• Brazilian Research Support Foundation of the State
of Bahia (FAPESB)
• Brazilian Research Support Foundation of the State
of Minas Gerais (FAPEMIG)
• Brazilian Support Foundation for Research in the
State of Alagoas (FAPEAL)
• Brazilian Support Foundation for Research in the
State of Amapá (FAPEAP)
• Brazilian Support Foundation for Research in the
State of São Paulo (FAPESP)
• Brazilian Support Foundation for the Development of
Education, Science and Technology in the State of
Mato Grosso do Sul (FUNDECT)
• Burnet Institute
• California Institute for Regenerative Medicine (CIRM)*
• Campbell Foundation*
• Canadian Foundation for AIDS Research (CANFAR)*
• Canadian Institutes of Health Research (CIHR)
• Cebu Leprosy and Tuberculosis Research
Foundation (CLTRF)
• Centre for Research in Animal Health, Centre de
Recerca en Sanitat Animal (CReSA)
• Cepheid
• Chiang Mai University
• Chilean National Commission for Scientific and
Technological Research (CONICYT)
• Chilean National Fund for Scientific and
Technological Development (FONDECYT)
* Denotes organisations where funding data was only received via the Resource Tracking for HIV Prevention Research and Development Working Group
AN
NEX
ES
PAGE111
* Denotes organisations where funding data was only received via the Resource Tracking for HIV Prevention Research and Development Working Group
# Denotes organisations where funding data was taken from publicly available sources
• Coalition for Epidemic Preparedness Innovations
(CEPI)
• Colombian Department for Science, Technology and
Innovation (Colciencias)
• Cuban Center for Genetic Engineering and
Biotechnology (CIGB)*
• Daiichi-Sankyo
• Damien Foundation (DFB)
• Danish Ministry of Foreign Affairs and the Danish
International Development Agency (DANIDA)
• DesignMedix
• Drugs for Neglected Diseases initiative (DNDi)
• Dutch Ministry of Foreign Affairs - Directorate General
of Development Cooperation (DGIS)
• effect:hope (The Leprosy Mission Canada)
• Egyptian Academy of Scientific Research and
Technology (ASRT)
• Eisai
• Elton John AIDS Foundation*
• Emergent Biosolutions
• European & Developing Countries Clinical Trials
Partnership (EDCTP)
• European Commission (Directorate-General for
Research and Innovation)#
• European Vaccine Initiative (EVI)
• FAIRMED
• FHI 360
• Fontilles
• Foundation for Innovative New Diagnostics (FIND)
• French National Agency for Research on AIDS and
Viral Hepatitis (ANRS)
• French National Institute of Health and Medical
Research (Inserm)
• French National Research Agency (ANR)
• French Research Institute for Development (IRD)
• Fund to Support Scientific Research (FWF)
• Fundació La Caixa
• Gavi, The Vaccine Alliance
• GeoVax
• German Federal Ministry for Economic Cooperation
and Development (BMZ)
• German Federal Ministry of Education and Research
(BMBF)
• German Federal Ministry of Health (BMG)
• German Leprosy and TB Relief Association (DAHW)
• German Research Foundation (DFG)
• GlaxoSmithKline (GSK)
• Global Affairs Canada
• Global Good
• Global Health Innovative Technology Fund (GHIT
Fund)
• GSK Bio
• Hawaii Biotech
• Health Research Council of New Zealand (HRC)
• Hebron
• Hospital Vall d’Hebron
• Ibero-American Program of Science and Technology
for Development (CYTED)
• Indian Council of Medical Research (ICMR)
• Indian Council of Scientific and Industrial Research
(CSIR)
• Indian Department of Biotechnology, Ministry of
Science and Technology (DBT)
• Indian Department of Health Research, Union
Ministry of Health and Family Welfare
• Indian Department of Science and Technology (DST)
• Innovate UK#
• Innovative Medicines Initiative (IMI)#
• Innovative Vector Control Consortium (IVCC)
• Institut Pasteur
• Institute of Tropical Medicine Antwerp (ITM)
• Integral Molecular
• International AIDS Vaccine Initiative (IAVI)
• International Centre for Genetic Engineering and
Biotechnology (ICGEB)
• International Partnership for Microbicides (IPM)*
0
ガル図法(赤道縮尺) 1:47,000,000
1000 2000 3000 4000 5000km
75゜
60゜
45゜
30゜
15゜
0゜
15゜
30゜
45゜
60゜
75゜
90゜
180゜ 165゜ 150゜ 135゜ 120゜ 105゜ 90゜ 75゜ 60゜ 45゜ 30゜ 15゜ 15゜ 0゜ 165゜ 150゜ 135゜ 120゜ 105゜ 90゜ 75゜ 60゜ 45゜
AN
NEX
ES
PAGE112
• International Union Against Tuberculosis and Lung
Disease
• International Vaccine Institute (IVI)
• Irish Aid
• Italian Association Amici di Raoul Follerau (AIFO)
• Italian National Institute of Health (ISS)*
• James Cook University including the Australian
Institute of Tropical Health and Medicine (AITHM)
• Japanese National Institute of Infectious Diseases
(NIID)*
• Johnson & Johnson
• KNCV Tuberculosis Foundation
• Korean Institute of Tuberculosis
• Leadiant Biosciences
• Lepra including Lepra India - Blue Peter Public
Health & Research Centre (BPHRC)
• Leprosy Relief Canada (SLC)
• Leprosy Research Initiative (LRI)
• Life Assay
• Liverpool School of Tropical Medicine (LSTM)
• Mapp Biopharmaceutical
• Max Planck Institute for Infection Biology (MPIIB)
• Médecins Sans Frontières (MSF)
• Medicines Development
• Medicines for Malaria Venture (MMV)
• Medicor Foundation
• Melbourne Children’s Campus
• Meningitis Research Foundation (MRF)
• Mérieux Foundation
• Mexican National Council of Science and Technology
(CONACYT)
• Mexican National Institute of Public Health (INSP)
• Mologen
• MSD / Merck
• Mundo Sano Foundation
• Mymetics
• Netherlands Leprosy Relief (NLR)
• Novartis
• Otsuka
• PATH including the Malaria Vaccine Initiative (MVI)
• Pharmaceutical Laboratory of the State of
Pernambuco (LAFEPE)
• Population Council
• Public Health Agency of Canada (PHAC)*
• Public Health England (PHE)
• Research Centre Borstel
• Research Council of Norway
• Royal Norwegian Ministry of Foreign Affairs and the
Norwegian Agency for Development Cooperation
(NORAD)
• Royal Society of New Zealand (RSNZ)
• Sabin Vaccine Institute
• San Raffaele Scientific Institute (IRCCS)*
• Sanofi
• Sasakawa Memorial Health Foundation (SMHF)
• Science Foundation Ireland (SFI)
• Serum Institute of India
• Sidaction*
• South Africa Medical Research Council (MRC)
• South African Department of Science and
Technology (DST)
• Spanish Ministry of Foreign Affairs and Cooperation
for Development (MAEC)
• Sumagen*
• Swiss Agency for Development and Cooperation
(SDC)
• Swiss National Science Foundation (SNSF)
• Swiss State Secretariat for Education, Research and
Innovation (SERI)
• Swiss Tropical & Public Health Institute (Swiss TPH)
• Synstar Japan
• Sysmex
• Takeda Pharmaceutical Company
• TB Alliance
• Thai Government Pharmaceutical Organisation (GPO)
• Thai Red Cross AIDS Research Center (TRC-ARC)*
* Denotes organisations where funding data was only received via the Resource Tracking for HIV Prevention Research and Development Working Group
AN
NEX
ES
PAGE113
• Thai National Science and Technology Development
Agency (NSTDA)
• The Leprosy Mission International (TLMI)
• The Peter Doherty Institute for Infection and Immunity
• The Wellcome Trust
• TuBerculosis Vaccine Initiative (TBVI)
• Turing Foundation
• UBS Optimus Foundation
• UK Department for International Development (DFID)
• UK Department of Health and Social Care (DHSC)
• UK Medical Research Council (MRC)
• Unitaid
• University Hospital of Bonn (UKB)
• University of Buea
• University of Georgia
• University of Nebraska Medical Center
• University of Pittsburgh
• US Agency for International Development (USAID)
• US Centers for Disease Control and Prevention (CDC)
• US Department of Defense (DOD) including Defense
Advanced Research Projects Agency (DARPA),
US Army Medical Research Institute of Infectious
Diseases (USAMRIID), the US Naval Medical
Research Center (NMRC), Defense Threat Reduction
Agency (DTRA) and the Walter Reed Army Institute of
Research (WRAIR)#
• US National Institutes of Health (NIH) including the
US National Institute of Allergy and Infectious Disease
(NIAID)#
• Vaccitech
• Vestergaard
• ViiV Healthcare
• Volkswagen Foundation
• World Bank
• World Health Organization: Special Programme for
Research and Training in Tropical Diseases (WHO /
TDR)
# Denotes organisations where funding data was taken from publicly available sources
0
ガル図法(赤道縮尺) 1:47,000,000
1000 2000 3000 4000 5000km
75゜
60゜
45゜
30゜
15゜
0゜
15゜
30゜
45゜
60゜
75゜
90゜
180゜ 165゜ 150゜ 135゜ 120゜ 105゜ 90゜ 75゜ 60゜ 45゜ 30゜ 15゜ 15゜ 0゜ 165゜ 150゜ 135゜ 120゜ 105゜ 90゜ 75゜ 60゜ 45゜
AN
NEX
ES
PAGE114
1. World Health Organization (WHO). Global strategy and plan of action on public health, innovation and intellectual property: report by the Director-General [Internet]. 2018 Mar [cited 2018 Apr 18]. (Seventy-first World Health Assembly). Report No.: A71/13. Available from: http://apps.who.int/gb/ebwha/pdf_files/WHA71/A71_13-en.pdf
2. World Health Organization (WHO). Addressing the global shortage of, and access to, medicines and vaccines: report by the Director-General [Internet]. 2018 Mar. (Seventy-first World Health Assembly). Report No.: A71/12. Available from: http://apps.who.int/gb/ebwha/pdf_files/WHA71/A71_12-en.pdf
3. World Bank. Data: country and lending groups [Internet]. 2017 [cited 2018 Apr 12]. Available from: https://datahelpdesk.worldbank.org/knowledgebase/articles/906519-world-bank-country-and-lending-groups
4. Vasconcellos AG, Fonseca B de PF e, Morel CM. Revisiting the concept of Innovative Developing Countries (IDCs) for its relevance to health innovation and neglected tropical diseases and for the prevention and control of epidemics. PLoS Negl Trop Dis. 2018 Jul 12;12(7):e0006469.
5. Institute for Health Metrics and Evaluation (IHME). Global Health Data Exchange (GHDx) [Internet]. GBD Results Tool. 2018 [cited 2018 Apr 11]. Available from: http://www.healthdata.org/institute-health-metrics-and-evaluation
6. WHO and IHME collaborate to improve health data globally [Internet]. 2018 [cited 2018 Nov 14]. Available from: http://www.healthdata.org/news-release/who-and-ihme-collaborate-improve-health-data-globally
7. GBD 2017 Mortality and Causes of Death Collaborators. Global, regional, and national age-sex-specific mortality and life expectancy, 1950–2017: a systematic analysis for the Global Burden of Disease Study 2017. Lancet [Internet]. 2018 Nov 10 [cited 2018 Nov 14];392. Available from: https://www.thelancet.com/journals/lancet/article/PIIS0140-6736(18)31891-9/fulltext#seccestitle70
8. Rerks-Ngarm S, Pitisuttithum P, Nitayaphan S, Kaewkungwal J, Chiu J, Paris R, et al. Vaccination with ALVAC and AIDSVAX to prevent HIV-1 infection in Thailand. N Engl J Med. 2009;361:2209–20.
9. National Institutes of Health (NIH). NIH and partners launch HIV vaccine efficacy study [Internet]. 2017 [cited 2018 Sep 25]. Available from: https://www.nih.gov/news-events/news-releases/nih-partners-launch-hiv-vaccine-efficacy-study
10. National Institute of Allergy and Infectious Diseases (NIAID). First new HIV vaccine efficacy study in seven years has begun [Internet]. National Institutes of Health (NIH). 2016 [cited 2018 Jun 1]. Available from: https://www.nih.gov/news-events/news-releases/first-new-hiv-vaccine-efficacy-study-seven-years-has-begun
11. AVAC: Global Advocacy for HIV Prevention. HVTN 703/HPTN 081 (the AMP study) [Internet]. AVAC. 2016 [cited 2018 Jun 1]. Available from: http://www.avac.org/trial/hvtn-703hptn-081-amp-study
12. Vieillard V, Gharakhanian S, Lucar O, Katlama C, Launay O, Autran B, et al. Perspectives for immunotherapy: which applications might achieve an HIV functional cure? Oncotarget. 2016 Feb 29;7(25):38946–58.
13. Pantaleo G, Levy Y. Therapeutic vaccines and immunological intervention in HIV infection: a paradigm change. Curr Opin HIV AIDS. 2016 Nov 1;11(6):576–84.
14. Treatment Action Group. Pipeline report 2018: the research toward a cure and immune-based therapies pipeline [Internet]. 2018 [cited 2018 Sep 25]. Available from: http://pipelinereport.org/sites/default/files/pipeline_2018_cure_ibt_rj_web3.pdf
15. Drugs for Neglected Diseases initiative (DNDi). DNDi 2017 annual report [Internet]. 2017 [cited 2018 Sep 25]. Available from: https://www.dndi.org/annualreport2017/
16. Treatment Action Group. The HIV PrEP and microbicides pipeline [Internet]. 2018 [cited 2018 Sep 25]. Available from: http://www.pipelinereport.org/2018/hiv-prep-and-microbicides-pipeline
17. International Partnership for Microbicides (IPM). IPM’s application for dapivirine vaginal ring for reducing HIV risk in women now under review by European Medicines Agency [Internet]. 2017 [cited 2018 Sep 18]. Available from: http://www.ipmglobal.org/content/ipm%E2%80%99s-application-dapivirine-vaginal-ring-reducing-hiv-risk-women-now-under-review-european
18. World Health Organization (WHO). WHO list of prequalified in vitro diagnostic products [Internet]. 2017 [cited 2018 Jun 1]. Available from: http://www.who.int/diagnostics_laboratory/evaluations/PQ_list/en/
19. World Health Organization (WHO). Novel POC tools for early infant diagnosis of HIV [Internet]. Department of HIV/AIDS; 2017 [cited 2018 Sep 25]. Available from: http://apps.who.int/iris/bitstream/handle/10665/255857/WHO-HIV-2017.16-eng.pdf;jsessionid=39BC01C168F25FCC93C2FBC4B73C10C7?sequence=1
20. Roser M, Ritchie H. Malaria [Internet]. Our world in data. 2018 [cited 2018 Oct 6]. Available from: https://ourworldindata.org/malaria
ANNEXE 3
REFERENCES
AN
NEX
ES
PAGE115
21. World Health Organization (WHO). Malaria vaccine implementation programme (MVIP) [Internet]. [cited 2018 Sep 25]. Available from: http://www.who.int/immunization/sage/meetings/2018/april/2_WHO_MalariaMVIPupdate_SAGE_Apr2018.pdf?ua=1
22. Malaria Vaccine Funders Group. Malaria vaccine technology roadmap [Internet]. Malaria Vaccine Initiative. 2013 [cited 2018 Jun 1]. Available from: http://www.malariavaccine.org/malaria-and-vaccines/malaria-vaccine-roadmap
23. World Health Organization (WHO). WHO vaccine pipeline tracker [Internet]. WHO. 2018 [cited 2018 Oct 6]. Available from: http://www.who.int/immunization/research/vaccine_pipeline_tracker_spreadsheet/en/
24. Medicines for Malaria Venture. Interactive R&D portfolio [Internet]. 2017 [cited 2018 Jun 1]. Available from: http://www.mmv.org/research-development/interactive-rd-portfolio
25. Medicines for Malaria Venture. Pyramax [Internet]. 2017 [cited 2018 Jun 1]. Available from: http://www.mmv.org/about-us/achievements-challenges/achievements/pyramax
26. GSK. GSK submits US regulatory application for single-dose tafenoquine for Plasmodium vivax malaria [Internet]. 2017 [cited 2018 Jun 1]. Available from: http://www-origin.gsk.com/en-gb/media/press-releases/gsk-submits-us-regulatory-application-for-single-dose-tafenoquine-for-plasmodium-vivax-malaria/
27. Medicines for Malaria Venture. Annual report 2017 [Internet]. 2017 [cited 2018 Sep 25]. Available from: https://www.mmv.org/sites/default/files/uploads/docs/publications/MMV_AnnualReport2017.pdf
28. PATH. From pipeline to product: malaria R&D funding needs into the next decade [Internet]. 2013 [cited 2016 Sep 16]. Available from: http://www.path.org/publications/files/MVI_pipeline_to_product_r-d_rpt.pdf
29. World Health Organization (WHO). False-negative RDT results and implications of new reports of P. falciparum histidine-rich protein 2/3 gene deletions [Internet]. 2017 Sep [cited 2018 May 29]. Report No.: WHO/HTM/GMP/2017.18. Available from: http://www.who.int/malaria/publications/atoz/information-note-hrp2-based-rdt/en/
30. World Health Organization (WHO). Malaria: progress of the active applications in the prequalification of IVDs assessment pipeline [Internet]. 2018 [cited 2018 Sep 25]. Available from: http://www.who.int/diagnostics_laboratory/180710_malaria.pdf?ua=1
31. PATH. PATH and Mologic advance a new diagnostic test to support malaria elimination [Internet]. 2018 [cited 2018 Sep 25]. Available from: https://www.path.org/media-center/path-and-mologic-advance-a-new-diagnostic-test-to-support-malaria-elimination/
32. World Health Organization (WHO). List of WHO prequalified vector control products [Internet]. 2018 [cited 2018 Oct 6]. Available from: http://www.who.int/pq-vector-control/prequalified-lists/PQT_VC_17July2018.pdf?ua=1
33. Innovative Vector Control Consortium (IVCC). Annual report 2016-2017 [Internet]. 2017 [cited 2018 Oct 6]. Available from: http://www.ivcc.com/about/governance/annual-reports
34. James S, Collins FH, Welkhoff PA, Emerson C, Godfray HCJ, Gottlieb M, et al. Pathway to deployment of gene drive mosquitoes as a potential biocontrol tool for elimination of malaria in Sub-Saharan Africa: recommendations of a Scientific Working Group. Am J Trop Med Hyg. 2018 Jun 7;98(6_Suppl):1–49.
35. TB Alliance. Child-friendly medicines [Internet]. TB Alliance. 2017 [cited 2018 Jun 1]. Available from: https://www.tballiance.org/child-friendly-medicines
36. World Health Organization (WHO). Rapid communication: key changes to treatment of multidrug- and rifampicin-resistant tuberculosis (MDR/RR-TB) [Internet]. 2018 [cited 2018 Oct 6]. Report No.: WHO/CDS/TB/2018.18. Available from: http://www.who.int/tb/publications/2018/rapid_communications_MDR/en/
37. World Health Organization (WHO). Global tuberculosis report 2018 [Internet]. 2018 [cited 2018 Oct 6]. Available from: http://www.who.int/tb/publications/global_report/en/
38. World Health Organization (WHO). BCG vaccine [Internet]. [cited 2018 Jun 1]. Available from: http://www.who.int/biologicals/areas/vaccines/bcg/en
39. Van Der Meeren O, Hatherill M, Nduba V, Wilkinson RJ, Muyoyeta M, Van Brakel E, et al. Phase 2b controlled trial of M72/AS01 vaccine to prevent tuberculosis. N Engl J Med [Internet]. 2018 Sep 25 [cited 2018 Sep 26]; Available from: http://www.nejm.org/doi/10.1056/NEJMoa1803484
40. ClinicalTrials.gov. VAXCHORA pediatric study [Internet]. 2018 [cited 2018 Oct 7]. Available from: https://clinicaltrials.gov/ct2/show/NCT03220737
41. World Health Organization (WHO). WHO prequalified vaccines [Internet]. 2018 [cited 2018 Oct 7]. Available from: https://extranet.who.int/gavi/PQ_Web/Browse.aspx?nav=3
REFERENCES
0
ガル図法(赤道縮尺) 1:47,000,000
1000 2000 3000 4000 5000km
75゜
60゜
45゜
30゜
15゜
0゜
15゜
30゜
45゜
60゜
75゜
90゜
180゜ 165゜ 150゜ 135゜ 120゜ 105゜ 90゜ 75゜ 60゜ 45゜ 30゜ 15゜ 15゜ 0゜ 165゜ 150゜ 135゜ 120゜ 105゜ 90゜ 75゜ 60゜ 45゜
AN
NEX
ES
PAGE116
42. World Health Organization (WHO). WHO prequalifies a thermostable rotavirus vaccine from India [Internet]. WHO. [cited 2018 Oct 7]. Available from: http://www.who.int/immunization/newsroom/news_WHO_prequalifies_thermostable_rotavirus_vaccine/en/
43. World Health Organization (WHO). Third Global Vaccine and Immunization Research Forum (GVIRF) [Internet]. WHO. 2018 [cited 2018 Oct 7]. Available from: http://www.who.int/immunization/research/forums_and_initiatives/gvirf/forum_2018/en/
44. Steele D, Kirkwood C, Ma L-F. Next generation rotavirus vaccines. WHO Product Development for Vaccines Advisory Committee (PDVAC) meeting 2018; 2018 Jun 26.
45. World Health Organization (WHO). WHO Product Development for Vaccines Advisory Committee (PDVAC) meeting 2018 [Internet]. WHO. 2018 [cited 2018 Oct 7]. Available from: http://www.who.int/immunization/research/meetings_workshops/pdvac_june18/en/
46. PATH. DefeatDD - drug development [Internet]. 2017 [cited 2018 Jun 1]. Available from: https://www.defeatdd.org/solution/drug-development
47. PATH. Reducing deadly diarrhea [Internet]. [cited 2017 Sep 21]. Available from: http://www.path.org/projects/edd.php
48. Centers for Disease Control and Prevention (CDC). American trypanosomiasis (also known as Chagas disease) [Internet]. 2016 [cited 2018 Jun 1]. Available from: https://www.cdc.gov/parasites/chagas/index.html
49. Gillespie PM, Beaumier CM, Strych U, Hayward T, Hotez PJ, Bottazzi ME. Status of vaccine research and development of vaccines for leishmaniasis. Vaccine. 2016 Jun 3;34(26):2992–5.
50. ClinicalTrials.gov. Topical liposomal amphotericin B gel treatment for cutaneous leishmaniasis [Internet]. 2017 [cited 2018 Jun 1]. Available from: https://clinicaltrials.gov/ct2/show/NCT02656797
51. FIND. Dx pipeline [Internet]. 2018 [cited 2018 Oct 7]. Available from: https://www.finddx.org/dx-pipeline-status/
52. Drugs for Neglected Diseases initiative (DNDi). Human African trypanosomiasis fact sheet [Internet]. 2016 [cited 2017 Jul 23]. Available from: https://www.dndi.org/wp-content/uploads/2017/08/Factsheet_2016_HAT.pdf
53. Keenan JD, Hotez PJ, Amza A, Stoller NE, Gaynor BD, Porco TC, et al. Elimination and eradication of neglected tropical diseases with mass drug administrations: a survey of experts. PLoS Negl Trop Dis. 2013 Dec 5;7(12):e2562.
54. TDR Disease Reference Group on Helminth Infections. Research priorities for helminth infections [Internet]. 2012 [cited 2017 Nov 18]. (WHO Technical Report Series on Helminth Infections). Report No.: 972. Available from: http://apps.who.int/iris/bitstream/10665/75922/1/WHO_TRS_972_eng.pdf
55. ClinicalTrials.gov. Study of safety and immune responses of the Sm14 vaccine in adults of endemic regions [Internet]. 2017 [cited 2018 Sep 26]. Available from: https://clinicaltrials.gov/ct2/show/NCT03041766
56. The Onchocerciasis Vaccine for Africa (TOVA) Initiative. The vaccine [Internet]. 2018 [cited 2018 Oct 7]. Available from: https://www.riverblindnessvaccinetova.org/vaccine
57. Pediatric Praziquantel Consortium. First patient dosed in Phase II clinical trial [Internet]. 2016 [cited 2018 Jun 1]. Available from: http://www.pediatricpraziquantelconsortium.org/news-events/first-patient-dosed-phase-ii-clinical-trial
58. PATH. Game-changing diagnostics for two neglected tropical diseases [Internet]. 2018 [cited 2018 Oct 7]. Available from: https://www.path.org/articles/game-changing-diagnostics-two-neglected-tropical-diseases/
59. Knopp S, Corstjens PLAM, Koukounari A, Cercamondi CI, Ame SM, Ali SM, et al. Sensitivity and specificity of a urine circulating anodic antigen test for the diagnosis of schistosoma haematobium in low endemic settings. PLoS Negl Trop Dis. 2015;9(5):e0003752.
60. World Health Organization Western Pacific Region (WPRO). Expert consultation to accelerate control of foodborne trematode infections, taeniasis and cysticercosis [Internet]. 2017. Available from: http://iris.wpro.who.int/bitstream/handle/10665.1/13962/RS-2017-GE-35-KOR-eng.pdf
61. Wong VK, Baker S, Pickard DJ, Parkhill J, Page AJ, Feasey NA, et al. Phylogeographical analysis of the dominant multidrug-resistant H58 clade of Salmonella Typhi identifies inter- and intracontinental transmission events. Nat Genet N Y. 2015 Jun;47(6):632-639B.
62. World Health Organization (WHO). Typbar TCV from Bharat Biotech, world’s first typhoid conjugate vaccine prequalif ied by WHO [Internet]. 2018 [cited 2018 Sep 26]. Available from: http://www.who.int/medicines/news/2017/Bharat-Biotech-TypbarTCV-WHO-PQ-Press-Release-Global-Final.pdf
63. World Health Organization (WHO). Typhoid vaccines: WHO position paper – March 2018 [Internet]. 2018 Mar [cited
REFERENCES
AN
NEX
ES
PAGE117
2018 Sep 26]. Available from: http://apps.who.int/iris/bitstream/handle/10665/272272/WER9313.pdf?ua=1
64. Gavi, the Vaccine Alliance. New typhoid vaccine to receive Gavi support [Internet]. 2018 [cited 2018 Sep 26]. Available from: https://www.gavi.org/library/news/statements/2018/new-typhoid-vaccine-to-receive-gavi-support/
65. Martin LB, Simon R, MacLennan CA, Tennant SM, Sahastrabuddhe S, Khan MI. Status of paratyphoid fever vaccine research and development. Vaccine. 2016;34(26):2900–2.
66. Shuan Ju Teh C, Heng Chua K, Lin Thong K. Paratyphoid fever: splicing the global analyses. Int J Med Sci. 2014;11(7):732–41.
67. Tennant SM, MacLennan CA, Simon R, Martin LB, Khan MI. Nontyphoidal salmonella disease: current status of vaccine research and development. Vaccine. 2016 Jun 3;34(26):2907–10.
68. World Health Organization (WHO). Dengue and severe dengue fact sheet [Internet]. 2017 [cited 2017 Nov 10]. Available from: http://www.who.int/mediacentre/factsheets/fs117/en/
69. Hilgenfeld R, Vasudevan SG. Dengue and Zika: control and antiviral treatment strategies [Internet]. Springer Singapore; 2018. (Advances in Experimental Medicine and Biology; vol. 1062). Available from: https://www.springer.com/gp/book/9789811087264
70. Hunsperger EA, Yoksan S, Buchy P, Nguyen VC, Sekaran SD, Enria DA, et al. Evaluation of commercially available diagnostic tests for the detection of dengue virus NS1 antigen and anti-dengue virus IgM antibody. PLoS Negl Trop Dis. 2014 Oct 16;8(10):e3171.
71. Waggoner JJ, Abeynayake J, Sahoo MK, Gresh L, Tellez Y, Gonzalez K, et al. Comparison of the FDA-approved CDC DENV-1-4 real-time reverse transcription-PCR with a laboratory-developed assay for dengue virus detection and serotyping. J Clin Microbiol. 2013 Oct;51(10):3418–20.
72. Murtagh MM. Flavivirus diagnostic landscape - focusing on dengue and Zika flavivirus diagnostics [Internet]. Workshop on new and innovative approaches to laboratory diagnosis of Zika, dengue and other arboviruses; 2017 May 2 [cited 2018 Sep 26]; Veyrier-du-Lac, France. Available from: http://www.controldengue.org/wp-content/uploads/2017/06/maurine-murtagh.pdf
73. Dauner AL, Mitra I, Gilliland T, Seales S, Pal S, Yang S-C, et al. Development of a pan-serotype reverse transcription loop-mediated isothermal amplification assay for the detection of dengue virus. Diagn Microbiol Infect Dis. 2015 Sep;83(1):30–6.
74. World Health Organization (WHO). Overview of product classes and prototype/products under Vector Control Advisory Group (VCAG) review for assessment of public health value [Internet]. 2018. Available from: http://apps.who.int/iris/bitstream/handle/10665/274451/WHO-CDS-VCAG-2018.03-eng.pdf?ua=1
75. World Health Organization (WHO). Meningococcal meningitis fact sheet [Internet]. World Health Organization. 2018 [cited 2018 Jul 10]. Available from: http://www.who.int/news-room/fact-sheets/detail/meningococcal-meningitis
76. World Health Organization (WHO). Pneumococcal vaccines WHO position paper 2012 [Internet]. 2012 Jun [cited 2017 Jul 23]. Available from: http://www.who.int/wer/2012/wer8714.pdf?ua=1
77. Alderson MR. Status of research and development of pediatric vaccines for Streptococcus pneumoniae. Vaccine. 2016 Jun 3;34(26):2959–61.
78. Pichichero ME. Pneumococcal whole-cell and protein-based vaccines: changing the paradigm. Expert Rev Vaccines. 2017 Dec 2;16(12):1181–90.
79. UNICEF Supply Division. Meningitis vaccine market supply update [Internet]. UNICEF; 2015 [cited 2017 Nov 18]. Available from: https://www.unicef.org/supply/index_vaccines.html
80. ClinicalTrials.gov. Clinical study of meningococcal ACYWX conjugate vaccine, in 12-16 month olds [Internet]. 2017 [cited 2018 Jun 1]. Available from: https://clinicaltrials.gov/ct2/show/NCT03295318
81. World Health Organization (WHO). Hepatitis C fact sheet [Internet]. World Health Organisation. 2018 [cited 2018 Jul 11]. Available from: http://www.who.int/news-room/fact-sheets/detail/hepatitis-c
82. Messina J, Humphreys I, Flaxman A, Brown A, Cooke G, Pybus O, et al. Global distribution and prevalence of hepatitis C virus genotypes. Hepatology. 2015 Jan;61(1):77–87.
83. World Health Organization (WHO). Guidelines for the care and treatment of persons diagnosed with chronic hepatitis C virus infection [Internet]. 2018 [cited 2018 Oct 7]. Available from: http://www.who.int/hepatitis/publications/hepatitis-c-guidelines-2018/en/
REFERENCES
0
ガル図法(赤道縮尺) 1:47,000,000
1000 2000 3000 4000 5000km
75゜
60゜
45゜
30゜
15゜
0゜
15゜
30゜
45゜
60゜
75゜
90゜
180゜ 165゜ 150゜ 135゜ 120゜ 105゜ 90゜ 75゜ 60゜ 45゜ 30゜ 15゜ 15゜ 0゜ 165゜ 150゜ 135゜ 120゜ 105゜ 90゜ 75゜ 60゜ 45゜
AN
NEX
ES
PAGE118
REFERENCES
84. World Health Organization (WHO). Progress report on access to hepatitis C treatment [Internet]. 2018 Mar [cited 2018 Oct 7]. Report No.: WHO/CDS/HIV/18.4. Available from: http://www.who.int/hepatitis/publications/hep-c-access-report-2018/en/
85. World Health Organization (WHO). Public reports of WHO prequalified IVDs [Internet]. 2018 [cited 2018 Oct 7]. Available from: http://www.who.int/diagnostics_laboratory/evaluations/pq-list/hcv/public_report/en/
86. Burnet Institute. HCV vaccine [Internet]. 2017 [cited 2018 Jun 1]. Available from: https://www.burnet.edu.au/projects/14_hcv_vaccine
87. World Health Organization (WHO). Guidelines for the diagnosis, treatment and prevention of leprosy - Executive summary [Internet]. 2018 [cited 2018 Oct 7]. Available from: http://www.searo.who.int/entity/global_leprosy_programme/approved-guidelines-leprosy-executives-summary.pdf?ua=1
88. World Health Organization (WHO). Global leprosy strategy 2016-2020 [Internet]. WHO. 2016 [cited 2018 Jun 20]. Available from: http://www.who.int/lep/resources/9789290225096/en/
89. Hotez P, Pecoul B. “Manifesto” for advancing the control and elimination of neglected tropical diseases. PLoS Negl Trop Dis. 2010;4(5):e718.
90. Gelber R, Andries K, Paredes RMD, Andaya CES, Burgos J. The diarylquinoline R207910 Is bactericidal against mycobacterium leprae in mice at low dose and administered intermittently. Antimicrob Agents Chemother. 2009 Sep;53(9):3989–3991.
91. Bahmanyar E, Smith WC, Brennan P, Cummings R, Duthie M, Richardus JH, et al. Leprosy diagnostic test development as a prerequisite towards elimination: requirements from the user’s perspective. PLoS Negl Trop Dis. 2016;10(2):e0004331.
92. Infectious Disease Research Institute (IDRI). Our products [Internet]. 2017 [cited 2018 Jun 1]. Available from: http://www.idri.org/products/pipeline/
93. Williamson PR, Jarvis JN, Panackal AA, Fisher MC, Molloy SF, Loyse A, et al. Cryptococcal meningitis: epidemiology, immunology, diagnosis and therapy. Nat Rev Neurol. 2017 Jan;13(1):13–24.
94. Rajasingham R, Smith RM, Park BJ, Jarvis JN, Govender NP, Chiller TM, et al. Global burden of disease of HIV-associated cryptococcal meningitis: an updated analysis. Lancet Infect Dis [Internet]. 2017 May 5 [cited 2017 Jun 22];0(0). Available from: http://www.thelancet.com/journals/laninf/article/PIIS1473-3099(17)30243-8/abstract
95. Park B, Wannemuehler K, Marston B, Govender N, Chiller T. Estimation of the global burden of cryptococcal meningitis among persons living with HIV/AIDS. AIDS. 2009;23(4):525–30.
96. Centers for Disease Control and Prevention (CDC). Preventing deaths from cryptococcal meningitis [Internet]. 2017 [cited 2018 Jun 1]. Available from: https://www.cdc.gov/fungal/global/cryptococcal-meningitis.html
97. Sloan D, Parris V. Cryptococcal meningitis: epidemiology and therapeutic options. Clin Epidemiol. 2014 May;13(6):169–82.
98. National Institutes of Health (NIH). Development of the novel antifungal VT-1129 for cryptococcal meningitis [Internet]. National Center for Advancing Translational Sciences. 2015 [cited 2018 Oct 7]. Available from: https://ncats.nih.gov/trnd/projects/complete/antifungal-vt1129-cryptococcal-meningitis
99. Loyse A, Thangaraj H, Easterbrook P, Ford N, Roy M, Chiller T, et al. Cryptococcal meningitis: improving access to essential antifungal medicines in resource-poor countries. Lancet Infect Dis. 2013 Jul;13(7):629–37.
100. Torgerson PR, Hagan JE, Costa F, Calcagno J, Kane M, Martinez-Silveira MS, et al. Global burden of leptospirosis: estimated in terms of Disability Adjusted Life Years. PLoS Negl Trop Dis [Internet]. 2015 Oct 2 [cited 2017 Apr 21];9(10). Available from: http://www.ncbi.nlm.nih.gov/pmc/articles/PMC4591975/
101. Dittrich S, Boutthasavong L, Keokhamhoung D, Phuklia W, Craig SB, Tulsiani SM, et al. A prospective hospital study to evaluate the diagnostic accuracy of rapid diagnostic tests for the early detection of leptospirosis in Laos. Am J Trop Med Hyg. 2018 Apr;98(4):1056.
102. World Health Organization (WHO). Buruli ulcer, number of new reported cases. Data by country [Internet]. WHO Global Health Observatory. 2018 [cited 2018 Nov 14]. Available from: http://apps.who.int/gho/data/node.main.A1631
103. Sakyi SA, Aboagye SY, Darko Otchere I, Yeboah-Manu D. Clinical and laboratory diagnosis of buruli ulcer disease: a systematic review. Can J Infect Dis Med Microbiol J Can Mal Infect Microbiol Médicale [Internet]. 2016 [cited 2017 Nov 18];2016. Available from: https://www.ncbi.nlm.nih.gov/pmc/articles/PMC4931084/
AN
NEX
ES
PAGE119
REFERENCES
104. Yotsu RR, Richardson M, Ishii N. Drugs for treating Buruli ulcer (Mycobacterium ulcerans disease). Cochrane Database Syst Rev [Internet]. 2018 [cited 2018 Oct 15];(8). Available from: https://www.cochranelibrary.com/cdsr/doi/10.1002/14651858.CD012118.pub2/abstract
105. Owusu E, Newman MJ, Kotey NK, Akumwena A, Bannerman E. Susceptibility profiles of Mycobacterium ulcerans isolates to streptomycin and rifampicin in two districts of the eastern region of Ghana. Int J Microbiol. 2016;2016:8304524.
106. Roupie V, Pidot SJ, Einarsdottir T, Poel CVD, Jurion F, Stinear TP, et al. Analysis of the vaccine potential of plasmid DNA encoding nine mycolactone polyketide synthase domains in mycobacterium ulcerans infected mice. PLoS Negl Trop Dis. 2014 Jan 2;8(1):e2604.
107. World Health Organization (WHO). Trachoma fact sheet [Internet]. World Health Organization. 2018 [cited 2018 Jun 12]. Available from: http://www.who.int/news-room/fact-sheets/detail/trachoma
108. Inic-Kanada A, Stojanovic M, Schlacher S, Stein E, Belij-Rammerstorfer S, Marinkovic E, et al. Delivery of a chlamydial adhesin N-PmpC subunit vaccine to the ocular mucosa using particulate carriers. PLoS One San Franc. 2015 Dec;10(12):e0144380.
109. Goodhew EB, Priest JW, Moss DM, Zhong G, Munoz B, Mkocha H, et al. CT694 and pgp3 as serological tools for monitoring trachoma programs. PLoS Negl Trop Dis. 2012 Jan 11;6(11):e1873.
110. Migchelsen SJ, Martin DL, Southisombath K, Turyaguma P, Heggen A, Rubangakene PP, et al. Defining seropositivity thresholds for use in trachoma elimination studies. PLoS Negl Trop Dis. 2017 Jan 18;11(1):e0005230.
111. ClinicalTrials.gov. A controlled study to evaluate the safety and immunogenicity of StreptAnova in healthy adults [Internet]. 2017 [cited 2018 Sep 27]. Available from: https://clinicaltrials.gov/ct2/show/NCT02564237
112. Oyston P, Robinson K. The current challenges for vaccine development. J Med Microbiol. 2012 Jul;61(Pt 7):889–94.
113. National Institute of Allergy and Infectious Diseases (NIAID). NIAID role in vaccine adjuvant research [Internet]. [cited 2018 Oct 10]. Available from: https://www.niaid.nih.gov/research/vaccine-adjuvant-research-niaid-role
114. Grand Challenges. Microcubes as vaccines for the developing world [Internet]. 2009 [cited 2018 Oct 11]. Available from: https://gcgh.grandchallenges.org/grant/microcubes-vaccines-developing-world
115. Trafton A. New capsule achieves long-term drug delivery [Internet]. MIT News. 2018 [cited 2018 Oct 11]. Available from: http://news.mit.edu/2016/new-capsule-long-term-drug-delivery-malaria-1116
116. Global Good [Internet]. Intellectual Ventures. [cited 2018 Nov 1]. Available from: http://www.intellectualventures.com/globalgood
117. Lensless microscope for diagnostics [Internet]. Global Grand Challenges. 2009 [cited 2018 Oct 10]. Available from: https://gcgh.grandchallenges.org/grant/lensless-microscope-diagnostics
118. Unitaid. New testing technologies save children’s lives while fighting antimicrobial resistance [Internet]. Unitaid. 2018 [cited 2018 Oct 10]. Available from: https://unitaid.org/news-blog/new-testing-technologies-save-childrens-lives-fighting-antimicrobial-resistance/
119. Esvelt KM. Gene drives [Internet]. 2018 [cited 2018 Oct 10]. Available from: http://www.sculptingevolution.org/genedrives
120. Kupferschmidt K, Science magazine. After 40 years, the most important weapon against mosquitoes may be failing [Internet]. Science. 2016 [cited 2018 Oct 10]. Available from: https://www.sciencemag.org/news/2016/10/after-40-years-most-important-weapon-against-mosquitoes-may-be-failing
121. Hapairai LK, Mysore K, Chen Y, Harper EI, Scheel MP, Lesnik AM, et al. Lure-and-kill yeast interfering RNA larvicides targeting neural genes in the human disease vector mosquito Ades aegypti. Sci Rep. 2017 Oct 16;7(1):13223.
122. The Bill and Melinda Gates Foundation. The Bill & Melinda Gates Medical Research Institute [Internet]. The Bill and Melinda Gates Foundation. 2017 [cited 2018 Nov 5]. Available from: https://www.gatesfoundation.org/~/media/gfo/media-center/gates-mri-overview-26may2017.pdf?la=en
POLICY CURES RESEARCHwww.policycuresresearch.org
FOR FURTHER COPIES PLEASE CONTACT
55 Brisbane Street Surry Hills NSW 2010
Australia Tel: +61 (2) 8218 2109
Published by Policy Cures Research
January 2019
This report was prepared by Policy Cures Research through a project supported by the Bill & Melinda Gates Foundation.
The views expressed are those of the authors.

POLIC
Y CU
RES RESEARC
HG
-FIND
ER 2018 N
EGLEC
TED D
ISEASE RESEA
RCH
& DEVELO
PMEN
T : REACH
ING
NEW
HEIG
HTS