NEESPI current status and its objectives within north...
60
Northern Eurasia Earth Science Partnership NEESPI current status and its objectives within northwestern Eurasia http://neespi.org Recognition Pavel Groisman, NEESPI Project Scientist UCAR at the NOAA National Climatic Data Center, Asheville, North Carolina, USA
Transcript of NEESPI current status and its objectives within north...

Northern Eurasia Earth Science Partnership
NEESPI current status and its objectives within northwestern Eurasia
http://neespi.org
Recognition
Pavel Groisman, NEESPI Project Scientist
UCAR at the NOAA National Climatic Data Center,
Asheville, North Carolina, USA
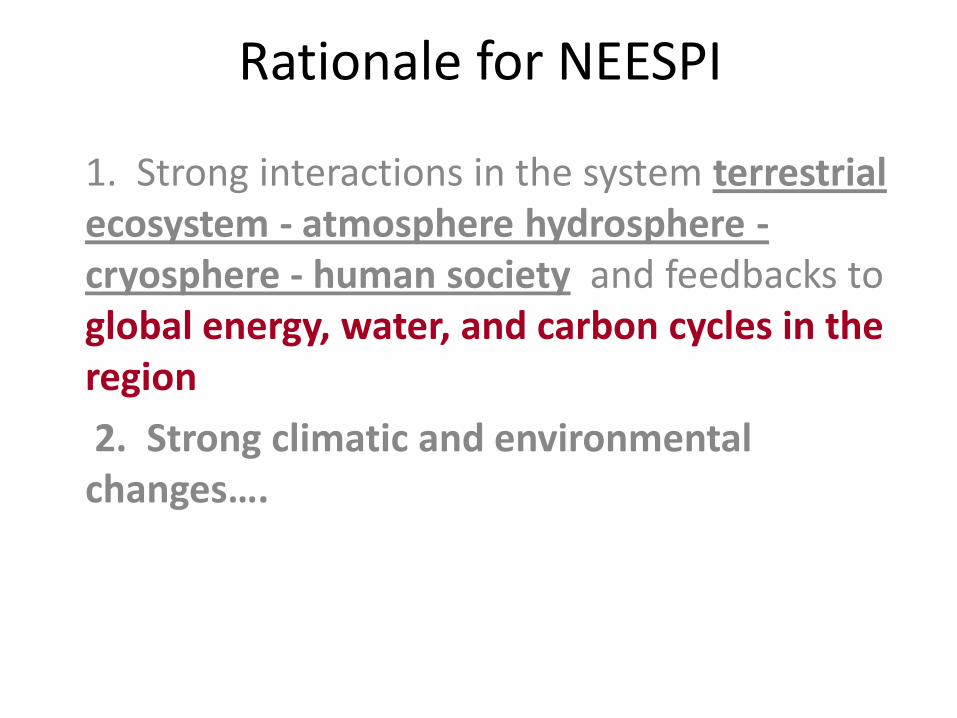
Rationale for NEESPI
1. Strong interactions in the system terrestrial ecosystem - atmosphere hydrosphere -cryosphere - human society and feedbacks to global energy, water, and carbon cycles in the region
2. Strong climatic and environmental changes….

The
NEESPI
Study
Area

NEESPI Study Area includes: Former Soviet
Union, Northern China, Mongolia,
Fennoscandia, & Eastern Europe
NEESPI is an interdisciplinary
program of internationally-
supported Earth systems and
science research that addresses
large-scale and long-term
manifestations of climate and
environmental change.
NEESPI duration ~ 10 years (started in 2004)

The NEESPI Science Plan (available on
http://neespi.org) has elements that address
concerns of WCRP, IGBP, IHDP, and
DIVERSITAS Programs
NEESPI and the actions to develop
its Science Plan were initially
promoted by NASA and Russian
Academy of Sciences (2003-2004).
RAS
Since early 2005, the NEESPI community
has worked to make NEESPI inter-agency
(in the U.S.) and international.
NEESPI AND ITS PAST

• How do Northern Eurasia’s terrestrial ecosystems dynamics interact with and alter the biosphere, atmosphere, cryosphere, and hydrosphere of the Earth?
This question can be reformulated in a pragmatic way as:
• How do we develop our predictive capability of terrestrial ecosystems dynamics over Northern Eurasia for the 21st century to support global projections as well as informed decision making and numerous practical applications in the region?
Our concern is that the changes in this region have the potential to affect the entire Earth System and may already be doing so.
The overarching NEESPI science question:

NEESPI Science plan major focuses• Focus on transient zones that are most vulnerable in
the future changes– Coastal zone– Tundra-forest– Forest-steppe– Steppe-desert– Mountains
• and on “Boundaries”• Focus on feedbacks that make the projection of the
future changes uncertain– Biogeochemical feedbacks– Biogeophysical feedbacks– Human activity

Major concern:
Ecosystems and climate interactions
in the region are very strong.
But, various biogeochemical and
biogeophysical feedbacks are poorly
understood and are difficult to
project.

• In a warmer climate, there will be an intensification of bioproductivity, B+B, and thus a sequestration of some fraction of the anthropogenic CO2 will occur.
• For example, boreal forest located in the regions of greatest warming and a general surface heat deficit is a primary candidate for this negative feedback. But, what if ...
Example: Classical biogeochemical
feedback

… the area of the boreal forests changes?
... the rate of release of methane and CO2
from soil increase?
The above may generate a potential
runaway scenario of a strong
positive biogeochemical feedback.
• Plus, there are several other “if”…
But, what if…
“Uncertainty” is the answer…

Example of hydrology-vegetation feedback.
Net Ecosystem Exchange [positive CO2 flux stands for
source to the atmosphere]. The sign of annual NEE
depends upon weather conditions
Date
Ac
cu
mu
late
d C
O2 f
lux
(N
EE
,mo
l m
-2)
-12
-8
-4
0
4
31.0
3
10.0
4
20.0
4
30.0
4
10.0
5
20.0
5
30.0
5
9.0
6
19.0
6
29.0
6
9.0
7
19.0
7
29.0
7
8.0
8
18.0
8
28.0
8
7.0
9
17.0
9
27.0
9
7.1
0
17.1
0
27.1
0
Wet spruce forest , CFR, Tv er region
2000
2001
1999
2002
CO 2-source
CO 2-sink
1998
C
Dry years
From
the
Archive
of the
Euro-
Siberian
Carbon-
flux
Project.

to have in ~10 years• A suite of process –oriented models for each major
terrestrial process in all its interactions • A suite of global and regional models that
seamlessly incorporate all regionally specific feedbacks associated with terrestrial processes
• An integrated observational knowledge data base for environmental studies
• To bring the Earth System research in the region to the level it deserves
NEESPI Deliverables:

Current NEESPI Statistics (April 2010):
More than 560 scientists from more than
200 institutions of 30 countries are working
on more than 130 individual funded
projects under the Initiative umbrella (with
annual budget ~$15M), several more
projects are in the process of joining
NEESPI. Four major sponsors of NEESPI
remain: the United States, Russia,
European Union, and Japan.
Additionally, NEESPI receives in kind assistance from EU,
US, Russian, Chinese, Japanese, Ukrainian and
International Agencies and Institutions.
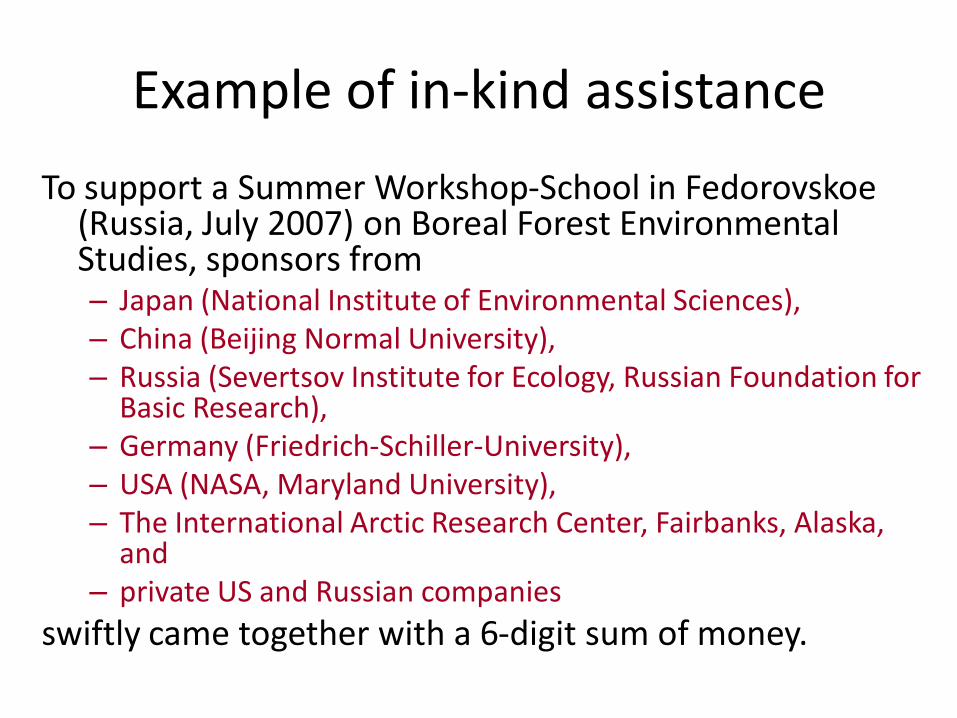
Example of in-kind assistance
To support a Summer Workshop-School in Fedorovskoe (Russia, July 2007) on Boreal Forest Environmental Studies, sponsors from– Japan (National Institute of Environmental Sciences),– China (Beijing Normal University), – Russia (Severtsov Institute for Ecology, Russian Foundation for
Basic Research), – Germany (Friedrich-Schiller-University),– USA (NASA, Maryland University), – The International Arctic Research Center, Fairbanks, Alaska,
and – private US and Russian companies
swiftly came together with a 6-digit sum of money.

Two modes of NEESPI expansion• Dedicated Calls (recent NASA and RAS and perspective in
the NIS, EU, and China)
• Freely joined projects
• Benefits of the NEESPI membership
– Improved links to collaborators in Northern Eurasia and to US and EU scientists working on similar problems
– Exchange of ideas, datasets, and knowledge with other team members working on similar problems
– Synergistic approach in working on complex problems
– Priority access to remote sensing and in situ data collected over Northern Eurasia
– Education: student exchange, doctoral and post-doc positions sharing among the Team Institutions

Last 15 months of NEESPI Meetings, Workshops, Sessions
1. 4-6 March 2009, St. Petersburg, Russia. Programmatic Workshop “Hydrological application of changes in land cover/use, water management and climate across Northern Eurasia”
2. 20-23 April, 2009, Vienna, Austria. Session at the EGU General Assembly
3. 24 April 2009, Sopron, Hungary. First Consultative Workshop of the Regional NEESPI Research Center for Non-boreal Southeast Europe
4. 14-15 July, 2009, Krasnoyarsk, Russia. Regional NEESPI Workshop devoted to Siberia
5. 9-15 Sept., 2009, Bishkek, Kyrgyzstan. Regional Event devoted to High Elevation Studies (summer school, and two workshops)
6. 16-17 December 2009, San-Francisco, USA. Session at the Annual Fall AGU Meeting
7. 2-9 May, 2010, Vienna, Austria. Session at the Annual EGU General Assembly
• 14-18 June, 2010, Miedzyzdroje, Poland: This conference6th BALTEX Science Conference

Future Meeting Plans• 5 -11 July, 2010, Tomsk, Russia:
ENVIROMIS Event• 25-28 August Tartu, Estonia :
Joint LCLUC, GOFC, & NEESPI Workshop• 8-10 Sept. 2010, Lanzhou, China:
3rd Int. Symp. on Arid Climate Change• 13-17 December 2010, San-Francisco:
NEESPI Session at the next AGU Meeting• Summer 2011, St. Petersburg, Russia:
School on Regional Climate Modeling

During the past 3 years, ~25 dedicated NEESPI Workshops
and 6 NEESPI Open Science Sessions at the International
Meetings were convened and more than 350 papers and books
were published (the total number of publications exceeds 500).
NEESPI Outreach, http://neespi.org
In April 2007: 1st Special NEESPI issue (13 papers) in Global and Planetary
Change
In December 2007: 2nd NEESPI Special issue in Environmental Research
Letters (15 papers)
In April 2009: Book "Regional Aspects of Climate-Terrestrial-Hydrologic
Interactions in Non-boreal Eastern Europe" Groisman and Ivanov (Eds.)
published by Springer Verlag.
In May 2009: An overview NEESPI paper in Bull. Amer. Meteorol. Soc.
In October 2009 through March 2010: the 3rd NEESPI Special issue in
Environmental Research Letters (34 papers)
Current situation:
- Two books are in press and scheduled for the first half of 2010.
Both of them are devoted to Eurasian Arctic (land and sea shelf)
- Book “Environmental Changes in Siberia: Regional Changes and
their Global Consequences” is in preparation
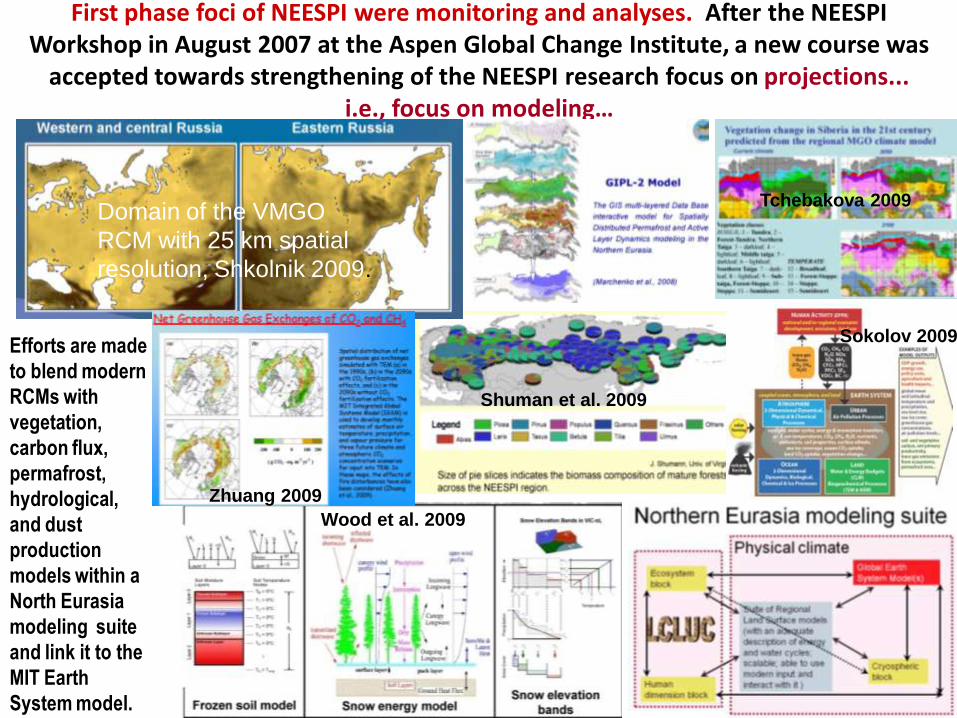
First phase foci of NEESPI were monitoring and analyses. After the NEESPI Workshop in August 2007 at the Aspen Global Change Institute, a new course was
accepted towards strengthening of the NEESPI research focus on projections... i.e., focus on modeling…
Efforts are made
to blend modern
RCMs with
vegetation,
carbon flux,
permafrost,
hydrological,
and dust
production
models within a
North Eurasia
modeling suite
and link it to the
MIT Earth
System model.
Domain of the VMGO
RCM with 25 km spatial
resolution, Shkolnik 2009.
Zhuang 2009
Wood et al. 2009
Shuman et al. 2009
Tchebakova 2009
Sokolov 2009

Northern Eurasia Earth Science Partnership Initiative
FOR MORE INFORMATION SEE THE NEESPI WEB SITE:
http://neespi.org
Side Note:
“NEESPI” is pronounced
approximately like the
Russian phrase for
“Don’t sleep “

Part 2. Ongoing climatic changes in Northern Eurasia: Why they force us
to be expedient in our research
and what are specific concerns of the NEESPI studies in the northwestern part
of its domain

Global Surface Air Temperature Anomalies, °C
Rates of increase of
annual temperature
for the “globe” (60S
to 90N) and
Northern Eurasia are
0.86 C/129 yr and
1.4 C/129 yr
respectively. (Lugina
et al 2007, updated). -3.5
-2.5
-1.5
-0.5
0.5
1.5
2.5
3.5
1860 1880 1900 1920 1940 1960 1980 2000 2020
Tem
per
atu
re a
no
mal
ies,
K
Years
Globe Northern Eurasia, north of 40N
-0.4
-0.2
0
0.2
0.4
0.6
0.8
1
1955 1960 1965 1970 1975 1980 1985 1990 1995 2000 2005 2010
2009

dT/dt = 1.28°C/100yrs; R² = 0.43-2
-1.5
-1
-0.5
0
0.5
1
1.5
2
2.5
1880 1900 1920 1940 1960 1980 2000 2020
Annual surface air temperature anomalies area-averaged over the 60°N - 90°N latitudinal zone

Decrease in surface air temperature meridional gradients
over the Northern Hemisphere estimated as a difference of
tropical mean zonal temperature (zone 0- 30N) and polar
mean zonal temperature (zone 60N - 90N).
For Northern Eurasia climate, zonal heat and water
vapor transport are of critical importance.
Winter

Autumn - Winter

Archive of Lugina et al. 2007, updated
dT/dt = 1.7°C/100yrs; R² = 0.20-5
-4
-3
-2
-1
0
1
2
3
4
5
1860 1880 1900 1920 1940 1960 1980 2000 2020
Tem
pera
ture
an
om
alies,
°C
Winter
Northern Eurasia, north of 40°NTemperature anomalies for the past 129 years
1951-1975 reference period

Changes in
January surface
air temperature.
The Arctic
becomes warmer
by up to 40 C
but the latitudinal
belt south of
60N becomes
colder by up to
8C. Newson 1973;
Nature, 241, 39-40
One of the first UCMO GCM sensitivity experiments
with polar ice replaced by water at 0C

Autumn sea ice extent changes (%)
Source: http://nsidc.org/data/seaice_index/
Terra-MODIS RGB, July-Sept 2008, 250 m resolution. Cloud free composite. (Trishchenko et al 2009). Please, note large areas of ice-free water in the Arctic during this three-months-long season.
Arctic Sea Ice Extent Anomalies, Sept. (%)

Autumn sea ice extent changes (%)
Source: http://nsidc.org/data/seaice_index/

Over Northern Canada and Alaska, negative trends in maximun snow depth were documented (Ross Brown, 2009, Personal Communication)
Number of days with deep snow cover on the ground ( > 20 cm). Linear trends for the 1951-2006 period; [days/10yr].
Bulygina et al. 2009.

Linear trend estimates , days/10yr (Groisman et al. 2003).
Changes in the days with winter thaw during the 1950-2000 period

(Groisman et al. 2009)
Changes in the days with winter thaw over Fennoscandia

-70
-60
-50
-40
-30
-20
-10
0
10
20
30
1945
1948
1951
1954
1957
1960
1963
1966
1969
1972
1975
1978
1981
1984
1987
1990
1993
1996
1999
2002
2005
2008
дни
Anomalies (days) of the spring dates of daily surface
air temperature transition through 0°С from the
mean long-term values in central Belarus
Elena V. Komarovskaya, 2009; Personal
communication
Two months earlier!!!

Dates of the spring onset over Russia
D - a spring date when mean daily temperature stably passes
5C (here it is area-averaged over the entire Russia)
Date when mean daily temperature stably passes -5C did not change.
Over the Baltic Sea Basin of Russia, the rate of change is twice as high.

Vorkuta Region (Oberman, 2007)
Slide is a courtecy of Prof.
V. Romanovsky
Annual top of the
permafrost temperatures
in the northeastern part of
European Russia

Significant changes in surface air temperature, Arctic sea ice extent, atmospheric circulation, maximum
snow depth and snow water equivalent, and even the state of
the remnants of permafrost lead to “unstable” cold season over
Northern Europe and, in particular, in the Baltic Sea Basin

Spring

Spring temperature changes over North Eurasia
Temperature anomalies (°C) from the mean for the 1951-1975 reference period. Archive of Lugina et al. 2007, updated
dT/dt 1.6°C/(100yr); R² = 0.30-5
-4
-3
-2
-1
0
1
2
3
4
5
1880 1900 1920 1940 1960 1980 2000 2020
Eurasia north of 40°N
dT/dt = 1.7°C/(100yr) ; R² = 0.19-5
-4
-3
-2
-1
0
1
2
3
4
5
1880 1900 1920 1940 1960 1980 2000 2020
Eurasia, north of 60°N

Snow cover duration over the
former USSR (dashed lines) and
Russia (solid lines) from satellite
(red and blue lines) and in situ
observations (black lines)
(Groisman et al. 2006).
April-May snow cover duration over the former
USSR and Russia
April snow cover extent anomalies over Eurasia
Snow cover extent from NOAA
satellites for 1966-2009. NOAA NCDC
2009: State of the Climate
Global Analysis April 2009. [ Avail. at http://www.ncdc.noaa.gov/sotc/index.php
?report=global&year=2009&month=apr ]

Pan-Arctic Ocean Drainage

Runoff changes in the deltas of three major Siberian rivers. Observations and future projections
Lammers and Shiklomanov (2009)
Slide is a courtecy of
Dr. A. Shiklomanov

Summer

July total net irradiance
(solar net + thermal infrared net)
The 22 year average from the NASA/GEWEX Surface Radiation Budget project.
Courtesy of Paul Stackhouse Jr. and Colleen Mikovitz, NASA Langley Research Center

Archive of Lugina et al. 2007, updated
dT/dt = 0.65°C/129yrs; R² = 0.20
-5
-4
-3
-2
-1
0
1
2
3
4
5
1860 1880 1900 1920 1940 1960 1980 2000 2020
Tem
pera
ture
an
om
alies,
°C
Summer
Northern Eurasia, north of 40°NTemperature anomalies for the past 129 years;
1951-1975 reference period

More humid conditions (blue),
more dry conditions (red),
more agricultural droughts (circled),
more prolonged dry episodes (rectangled).
Changes in the surface water cycle over Northern Eurasia
that have been statistically significant in the 20th century
Groisman et al 2009 (Bull. Amer. Meteorol. Soc.)

DYNAMICS OF FIRES NUMBERS AND BURNED AREA (PROTECTED TERRITORY OF RUSSIA)
Korovin and Zukkert 2003, updated

Intense fire in a Pinus sylvestris forest, resulting in a likely conversion to steppe
• Left, no regeneration after several years; right, no regeneration after 20 years (Siberia)
Tchebakova et al. (2009)

Landscape after forest fires
• Thawing of ice-rich permafrost, triggered by forest fire in Central Yakutia, transforms boreal forest into steppe-like habitats (photo by Vladimir Romanovsky)
Why we have to be expedient in our research in Northern Eurasia?
The changes are already here and they have been large!

Changes of the northern boundaries of forest and steppe zones along the 39E (past 13x103 years) (Kozharinov
and Puzachenko 2005)
…and large changes are projected…
... were large in the past...

Water (0),Tundra (1), forest-tundra (2), darkleaf taiga (3) and lightleaf taiga
(4), forest-steppe (5), steppe (6), semidesert (7), and polar desert (8).
Biome distribution over n. Eurasia east of 60°E
in current (a) and 2090 (b) climates (Vygodskaya et al. 2007)

In addition to large climatic and environmental changes,
we are facing a non-linearity in environmental and climatic
changes in Northern Eurasia right now due to
– Dramatic retreat of the Arctic sea Ice that is causing
• rampaged coastal erosion (up to 10 m yr-1)
• release of carbon (both, methane and CO2) stored in the frozen shelf and coast (Shakhova et al. 2009), and
• additional source of heat and moisture in early winter
– Impact on the World Ocean thermohaline circulation due to changes in the fresh water inflow into the Arctic Ocean
– Feedbacks to the global carbon budget & climate due to• Permafrost thaw
• Wetlands transformation
• Land cover changes and
• Ecosystems shift

Example 2:
Land use dynamics in the
past 60 years in the Volga
River Basin show that 13
Mln Ha of agricultural land
(or ~20%) have been
replaced by forest (10 Mln)
and reservoirs (3 Mln)
[Golubev, Speranskaya &
Tsitsenko 2003]
… as well as by the changes
caused by human activity:
Example 1:
More than 90% of steppe
and forest-steppe zones in
Northern Eurasia is
currently cropland (orange
areas in the map)
[Rozenzweig et al. 2003]

Source: Shiklomanov (1976)
Update: Shiklomanov and Georgievsky (2003)
-30
-29
-28
-27
-26
-25
-24
1880 1890 1900 1910 1920 1930 1940 1950 1960 1970 1980 1990
m b
elo
w W
orl
d O
ce
an
le
ve
l Real Natural
Example 3. Observed and “natural” changes in
the level of the largest in the world lake are
significant and of similar magnitudes
Caspian Sea Level changes
observed
2 m
Natural would be changes

E.g., …the Aral Sea …
1989 2003
… up to the extreme cases that
lead to ecological disasters

=> A synergetic approach to projections of the future changes is a core of the NEESPI
Thus, it looks like within Northern
Eurasia we have to study:
Human activity changes
Climate system changes
Greenhouse gases changes
Ecosystems’ changes
and
their interactions
Problem was not the large changes
themselves but understanding of their
causes and timely projections

Research foci in the northwestern part of the NEESPI domain
• Cold season: In the future
we may not see it as we
used to see
• Hydrological cycle
changes:
• Human impact on the Baltic Sea Environment
• Changes in extremes (see next slide)

Regions with disproportionate changes in heavy and very heavy precipitation during the past decades
compared to the change in the annual and/or seasonal precipitation
Easterling et al. 2000, substantially updated from Groisman et al. 2005, Zhai et al. 2005, Roy and Balling 2004, Aguilar et al. 2005, Brunetti et al. 2004, Cavazos 2008, and Zolina et al. 2010. Thresholds used to define “heavy” and “very heavy” precipitation vary by season and region.
+
++

Northern Eurasia Earth Science Partnership Initiative
FOR MORE INFORMATION SEE THE NEESPI WEB SITE:
http://neespi.org
Side Note:
“NEESPI” is pronounced
approximately like the
Russian phrase for
“Don’t sleep “