
NEAR REAL TIME DETECTION OF BURNED SCARAREA USING LANDSAT...
40
NEAR REAL TIME DETECTION OF BURNED SCAR AREA USING LANDSAT-8 IMAGERIES Danang Surya Candra Kustiyo - Indonesian National Institute of Aeronautics and Space (LAPAN) -
-
Upload
nguyendiep -
Category
Documents
-
view
216 -
download
0
Transcript of NEAR REAL TIME DETECTION OF BURNED SCARAREA USING LANDSAT...
NEAR REAL TIME DETECTION OF
BURNED SCAR AREA
USING LANDSAT-8 IMAGERIES
Danang Surya Candra
Kustiyo
- Indonesian National Institute of Aeronautics and Space (LAPAN) -
Outline
INTRODUCTION:Background, Problems, Purpose and Hypothesis
METHODOLOGY:1. Near Real Time of• Firespot Detection• Fire Burnt Area Detection• Burned Scar Area Detection2. Assessment
RESULTS AND DISCUSSION
CONCLUSION
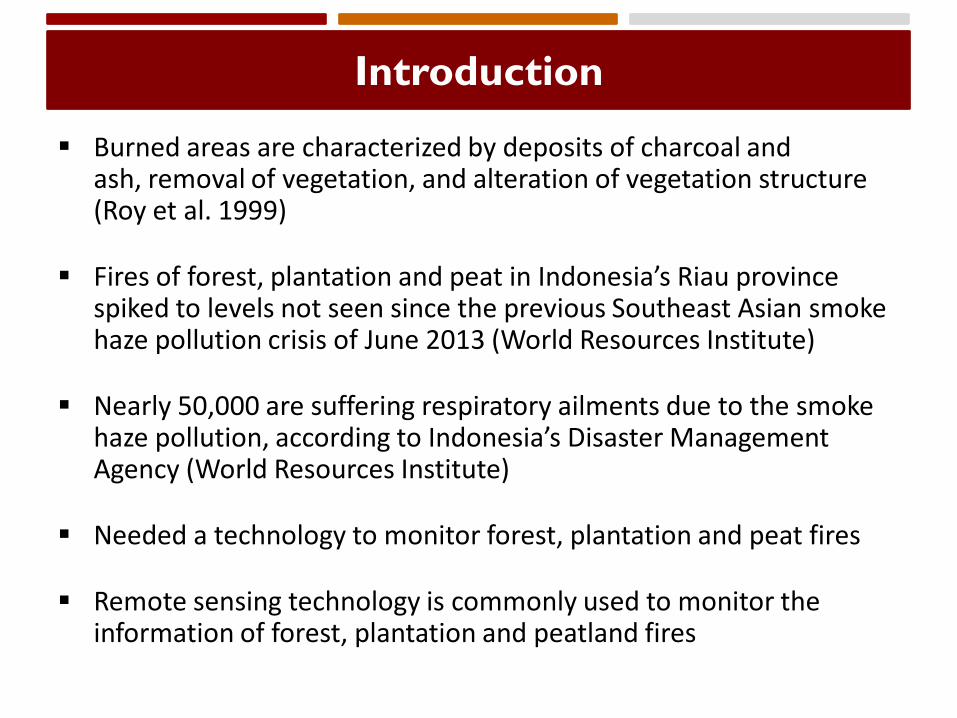
Burned areas are characterized by deposits of charcoal and ash, removal of vegetation, and alteration of vegetation structure (Roy et al. 1999)
Fires of forest, plantation and peat in Indonesia’s Riau province spiked to levels not seen since the previous Southeast Asian smoke haze pollution crisis of June 2013 (World Resources Institute)
Nearly 50,000 are suffering respiratory ailments due to the smoke haze pollution, according to Indonesia’s Disaster Management Agency (World Resources Institute)
Needed a technology to monitor forest, plantation and peat fires
Remote sensing technology is commonly used to monitor the information of forest, plantation and peatland fires
Introduction
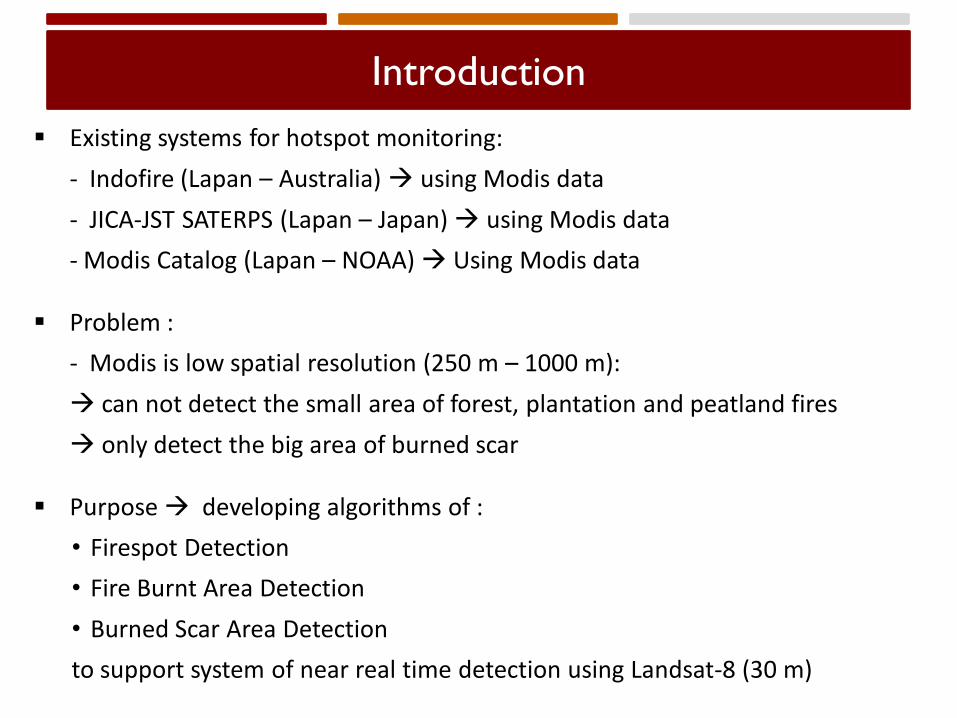
Existing systems for hotspot monitoring:
- Indofire (Lapan – Australia) using Modis data
- JICA-JST SATERPS (Lapan – Japan) using Modis data
- Modis Catalog (Lapan – NOAA) Using Modis data
Problem :
- Modis is low spatial resolution (250 m – 1000 m):
can not detect the small area of forest, plantation and peatland fires
only detect the big area of burned scar
Purpose developing algorithms of :
• Firespot Detection
• Fire Burnt Area Detection
• Burned Scar Area Detection
to support system of near real time detection using Landsat-8 (30 m)
Introduction
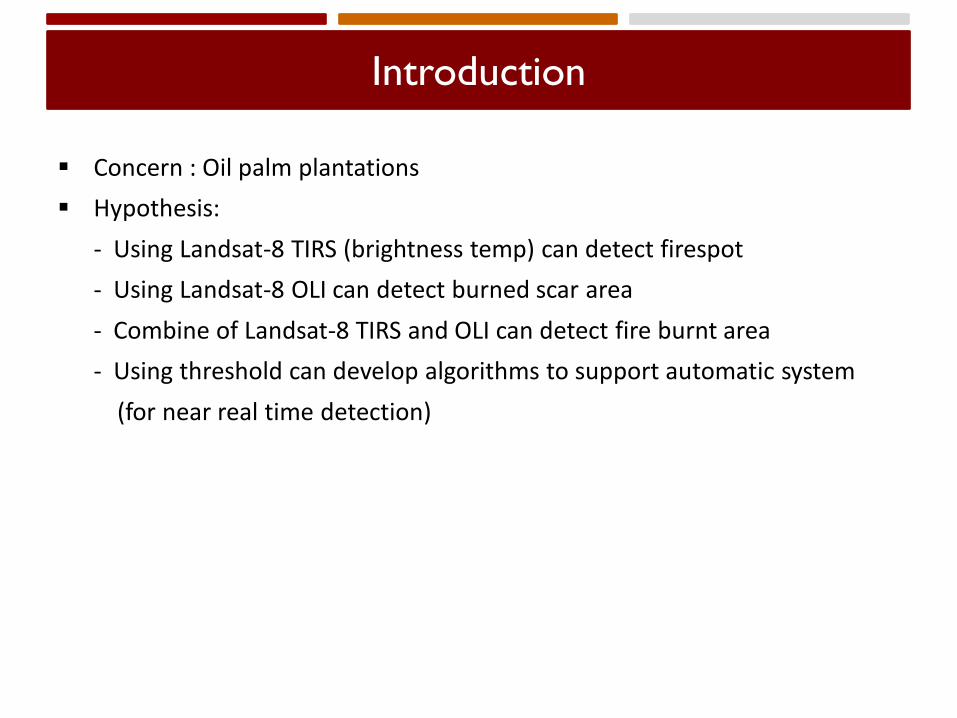
Concern : Oil palm plantations
Hypothesis:
- Using Landsat-8 TIRS (brightness temp) can detect firespot
- Using Landsat-8 OLI can detect burned scar area
- Combine of Landsat-8 TIRS and OLI can detect fire burnt area
- Using threshold can develop algorithms to support automatic system
(for near real time detection)
Introduction
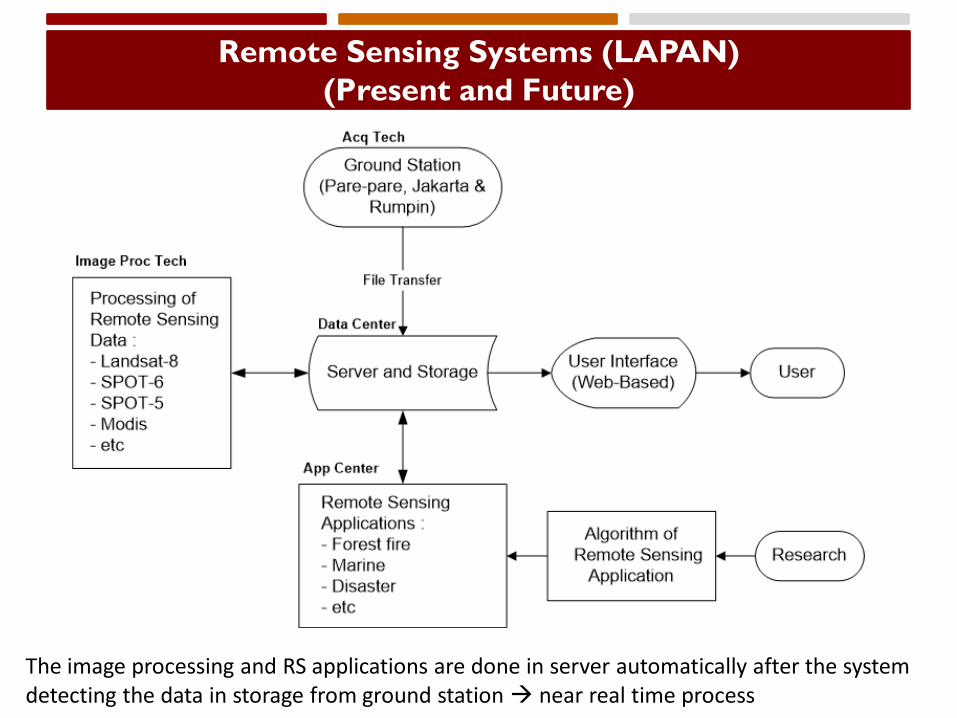
Remote Sensing Systems (LAPAN)
(Present and Future)
The image processing and RS applications are done in server automatically after the system detecting the data in storage from ground station near real time process
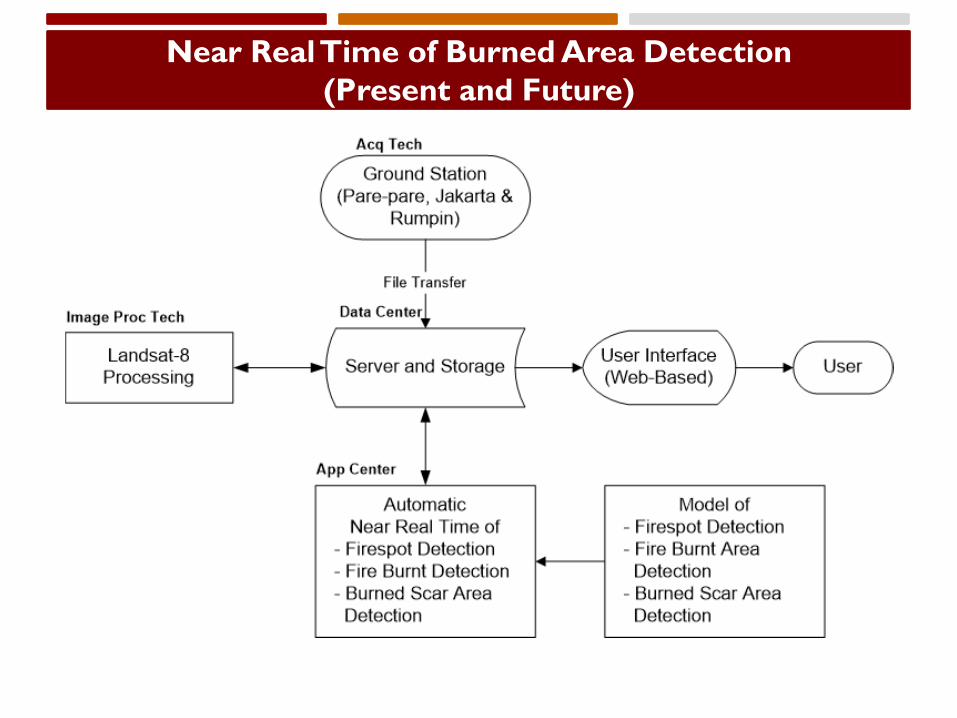
Near Real Time of Burned Area Detection
(Present and Future)
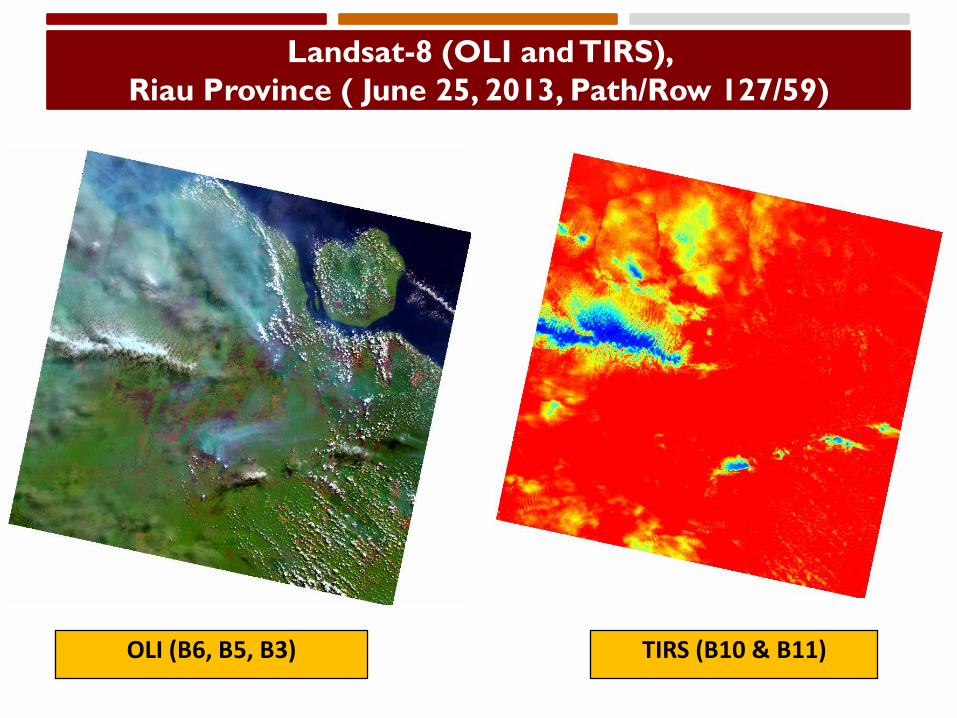
Landsat-8 (OLI and TIRS),
Riau Province ( June 25, 2013, Path/Row 127/59)
OLI (B6, B5, B3) TIRS (B10 & B11)
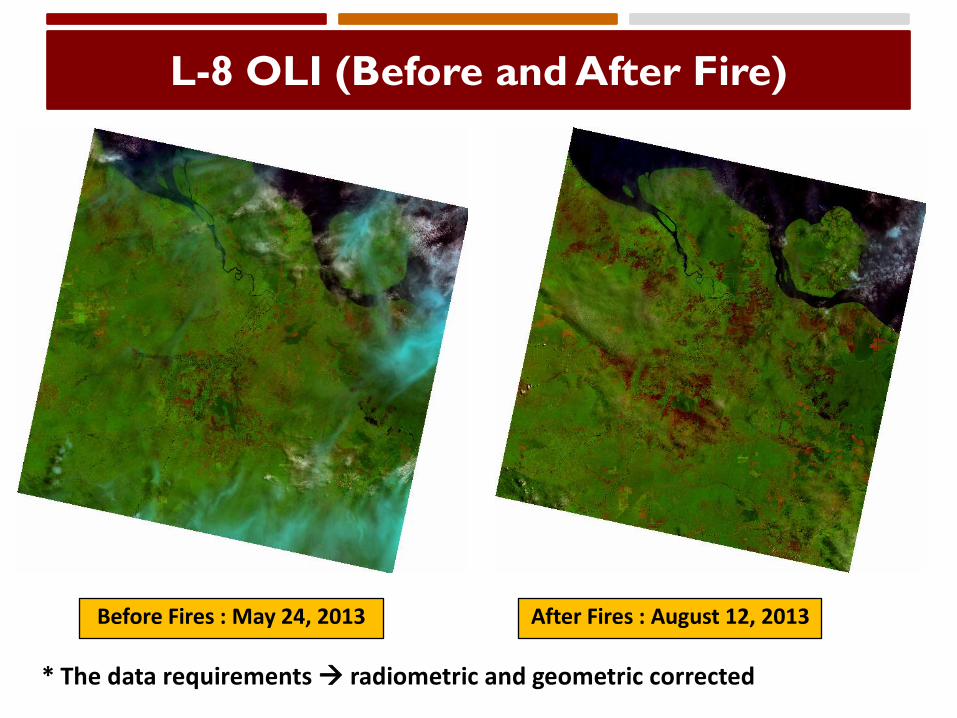
L-8 OLI (Before and After Fire)
Before Fires : May 24, 2013 After Fires : August 12, 2013
* The data requirements radiometric and geometric corrected
FIRESPOT DETECTION
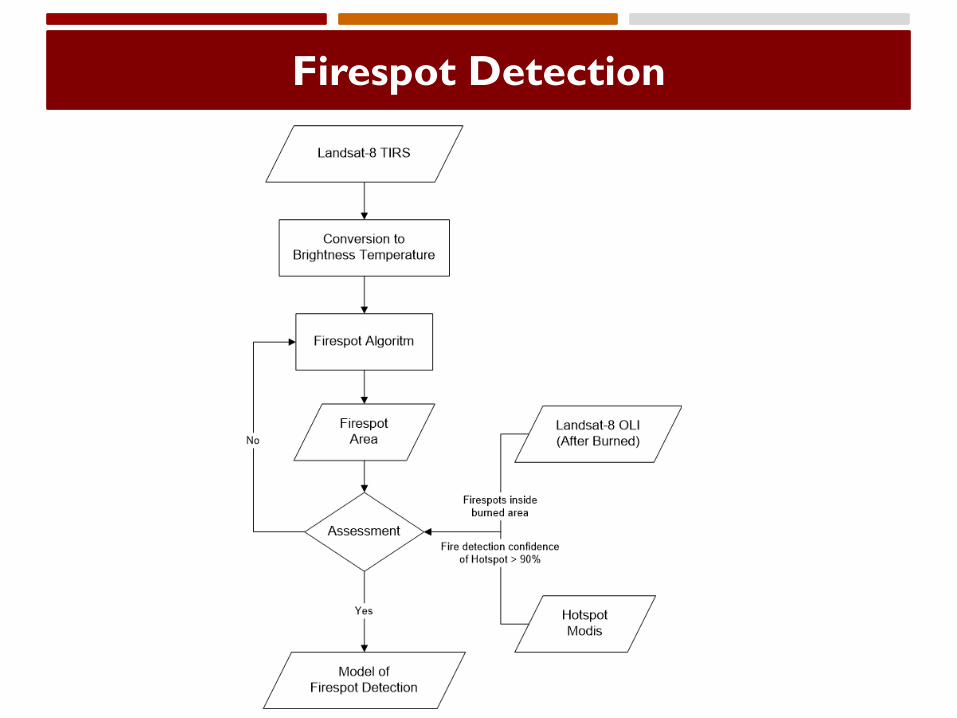
Firespot Detection
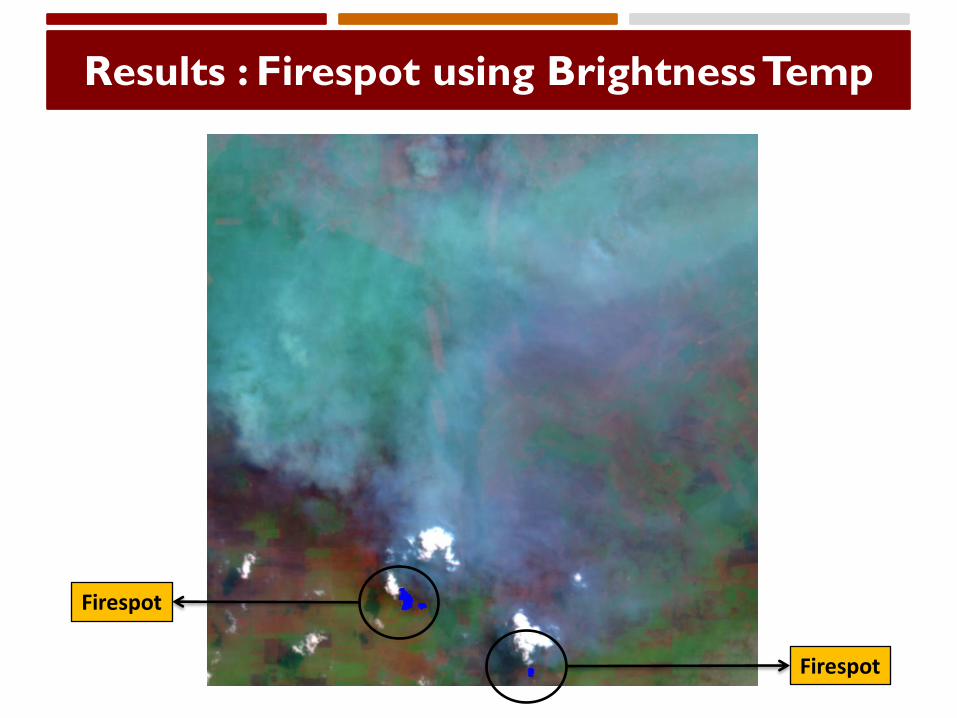
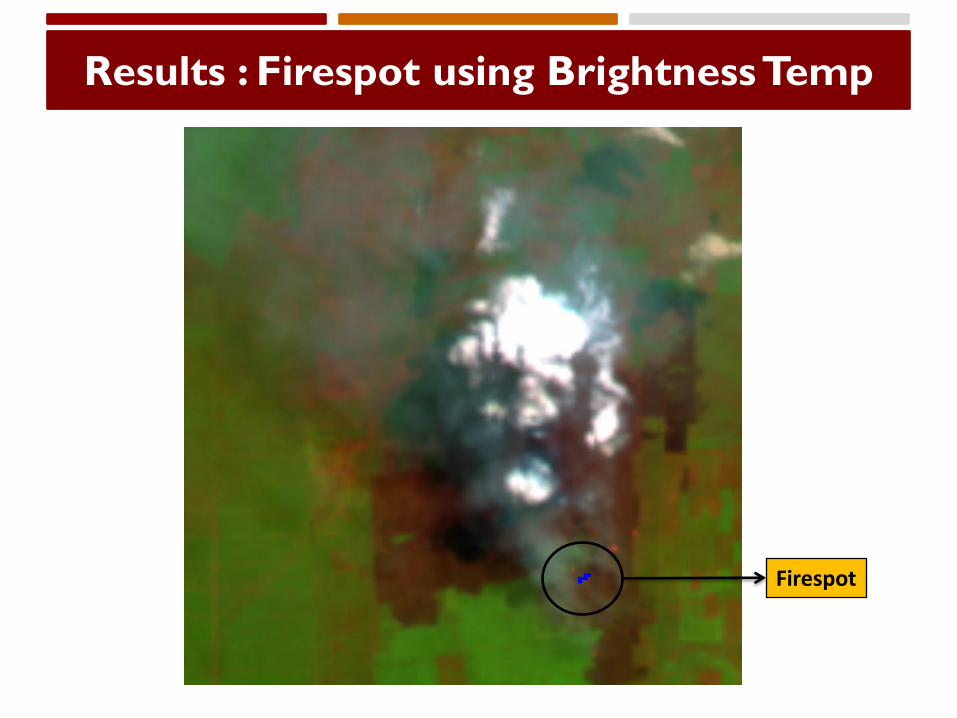
Results : Firespot using Brightness Temp
Firespot
Firespot
Results : Firespot using Brightness Temp
Firespot
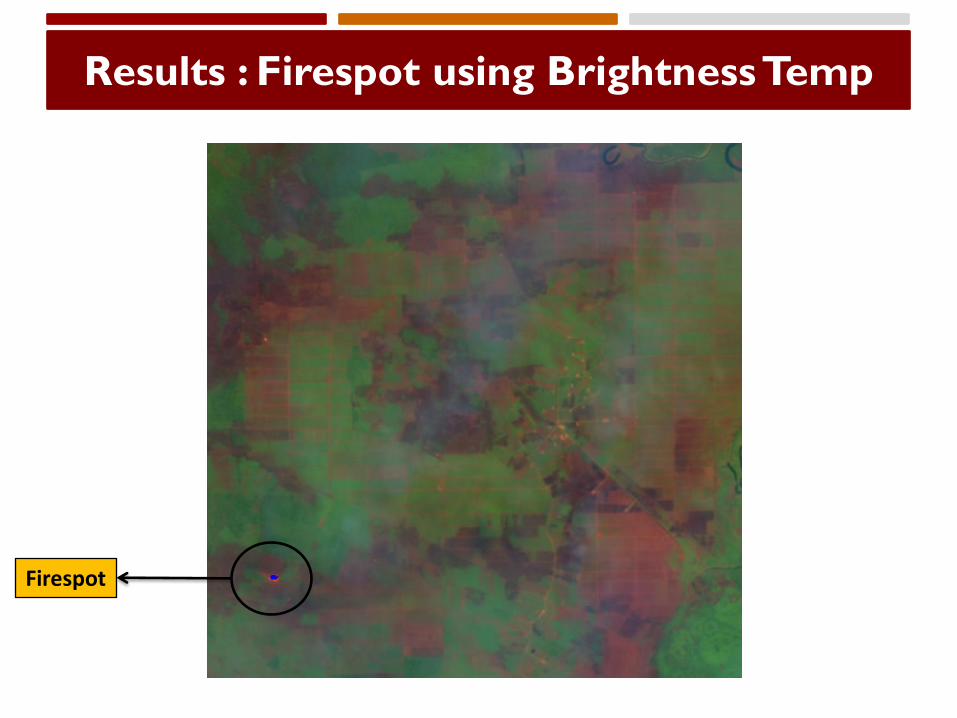
Results : Firespot using Brightness Temp
Firespot
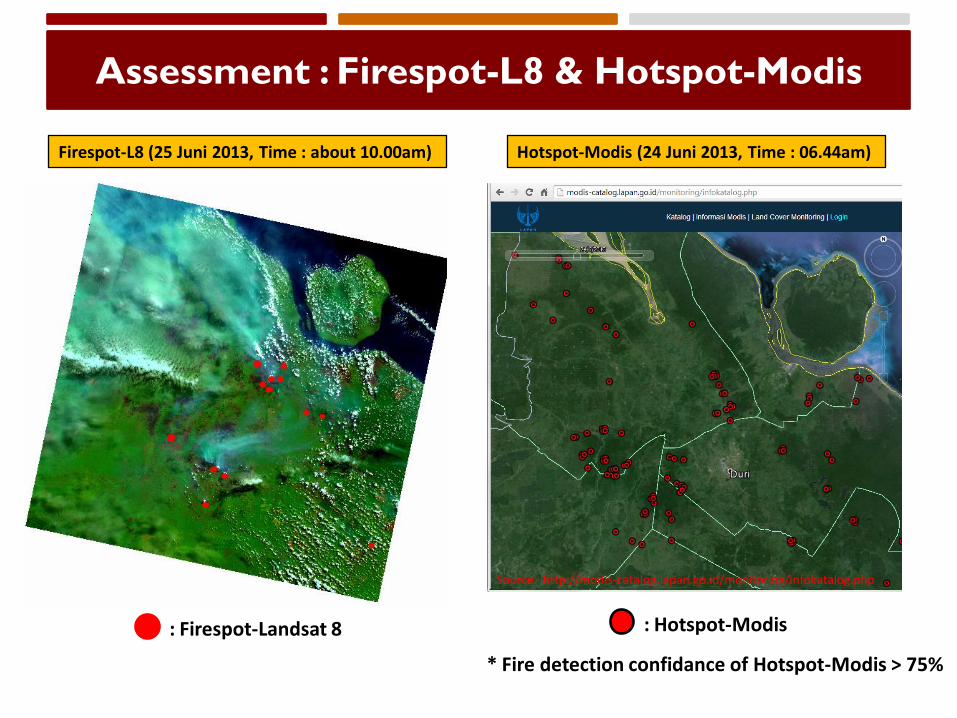
Assessment : Firespot-L8 & Hotspot-Modis
Firespot-L8 (25 Juni 2013, Time : about 10.00am) Hotspot-Modis (24 Juni 2013, Time : 06.44am)
* Fire detection confidance of Hotspot-Modis > 75%
: Firespot-Landsat 8 : Hotspot-Modis
Source: http://modis-catalog.lapan.go.id/monitoring/infokatalog.php
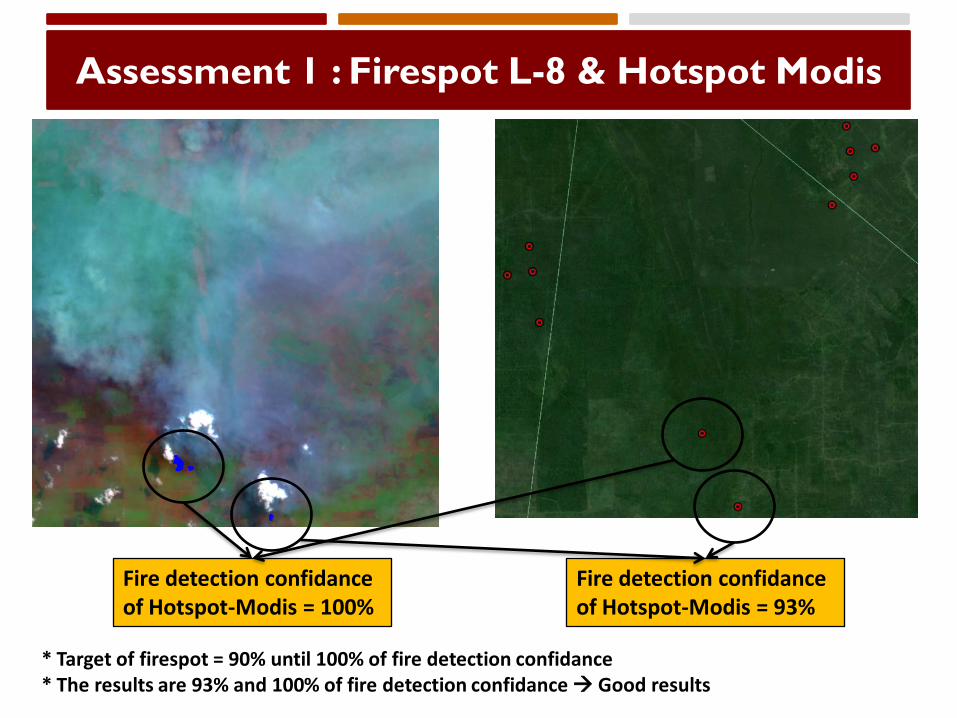
Assessment 1 : Firespot L-8 & Hotspot Modis
Fire detection confidance of Hotspot-Modis = 100%
Fire detection confidance of Hotspot-Modis = 93%
* Target of firespot = 90% until 100% of fire detection confidance* The results are 93% and 100% of fire detection confidance Good results
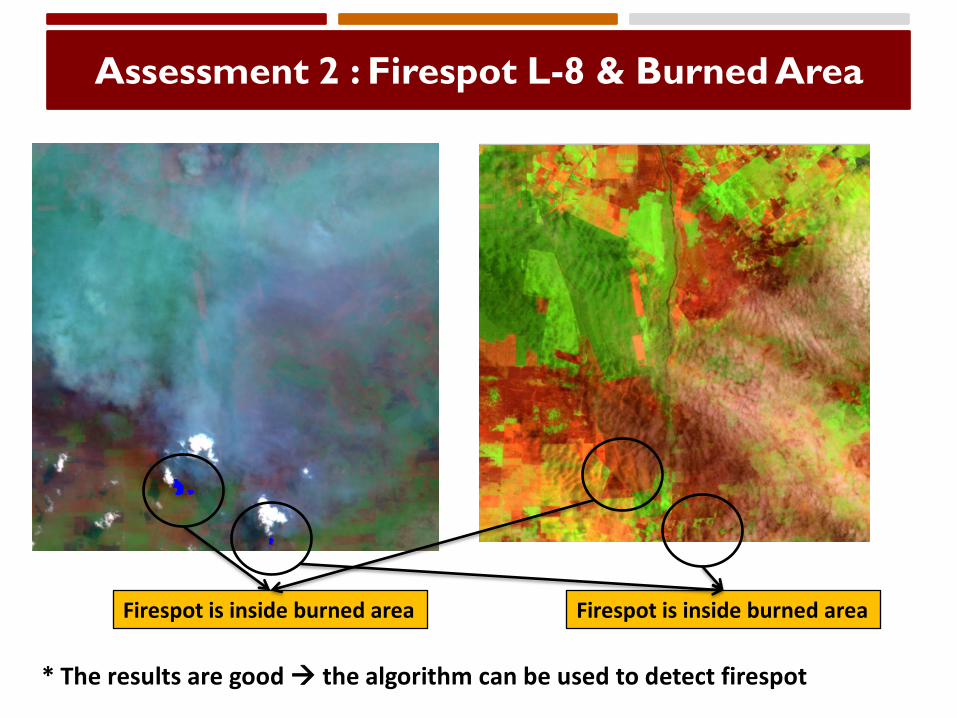
Assessment 2 : Firespot L-8 & Burned Area
Firespot is inside burned area Firespot is inside burned area
* The results are good the algorithm can be used to detect firespot
FIRE BURNT AREA DETECTION
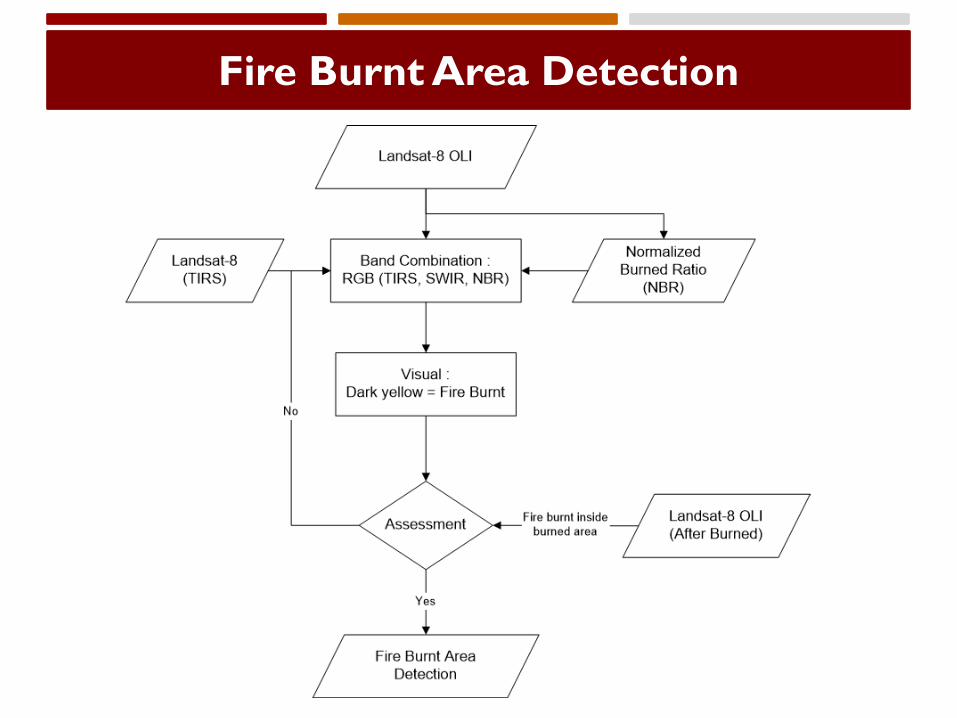
Fire Burnt Area Detection
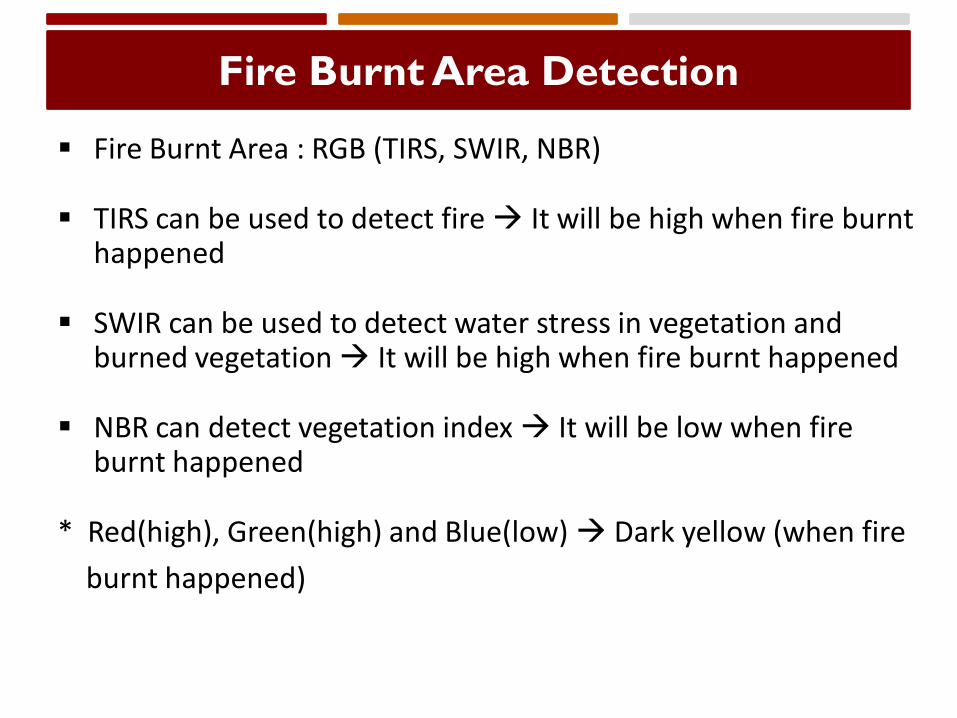
Fire Burnt Area : RGB (TIRS, SWIR, NBR)
TIRS can be used to detect fire It will be high when fire burnt happened
SWIR can be used to detect water stress in vegetation and burned vegetation It will be high when fire burnt happened
NBR can detect vegetation index It will be low when fire burnt happened
* Red(high), Green(high) and Blue(low) Dark yellow (when fire
burnt happened)
Fire Burnt Area Detection
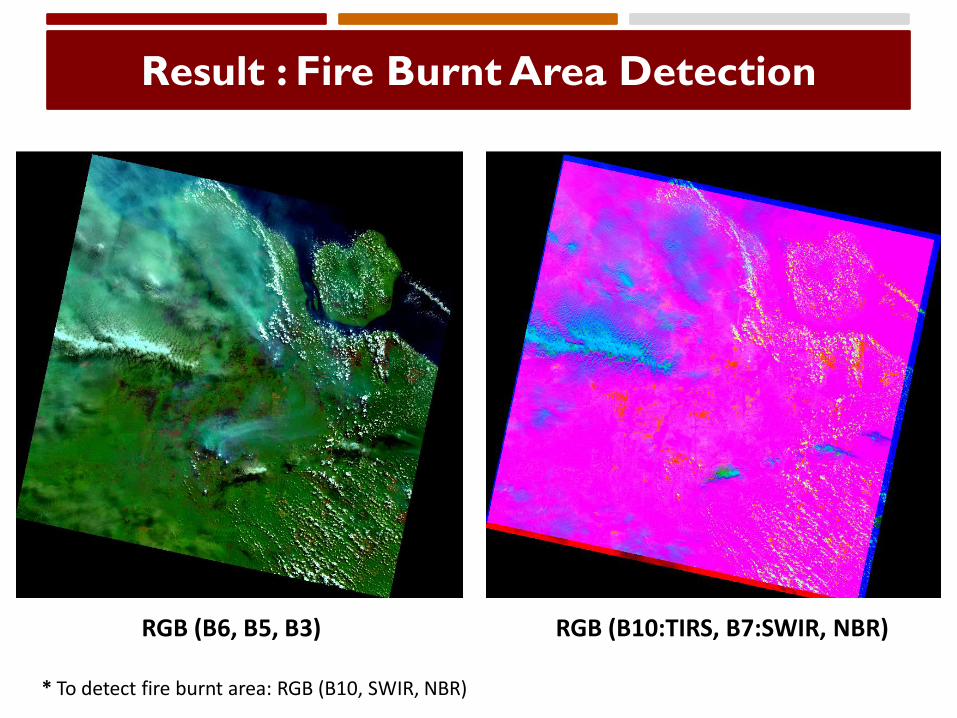
Result : Fire Burnt Area Detection
RGB (B6, B5, B3) RGB (B10:TIRS, B7:SWIR, NBR)
* To detect fire burnt area: RGB (B10, SWIR, NBR)
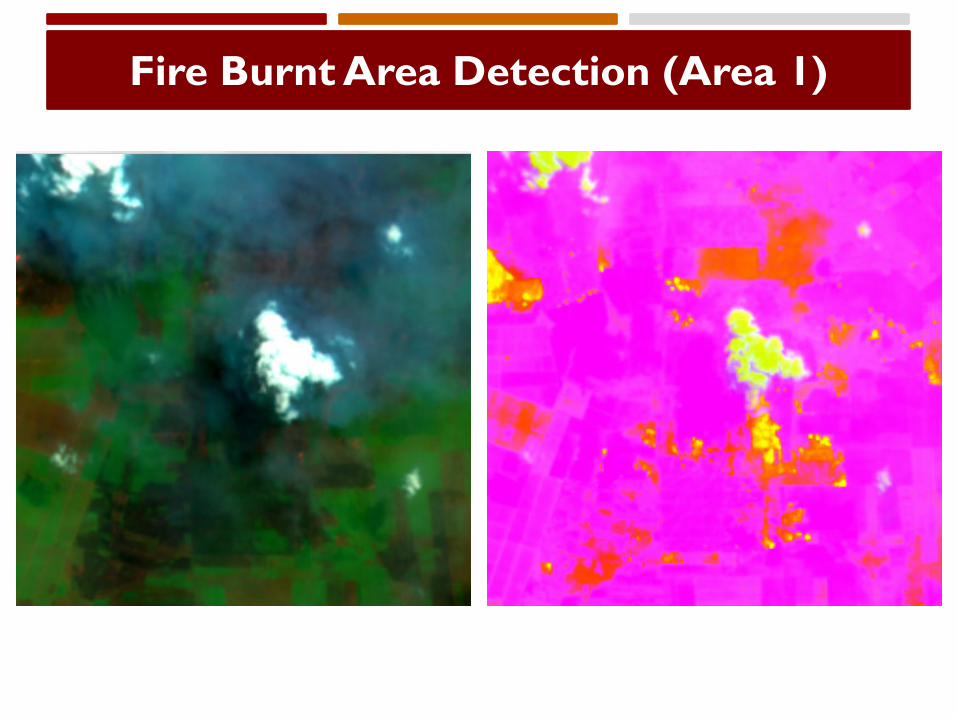
Fire Burnt Area Detection (Area 1)
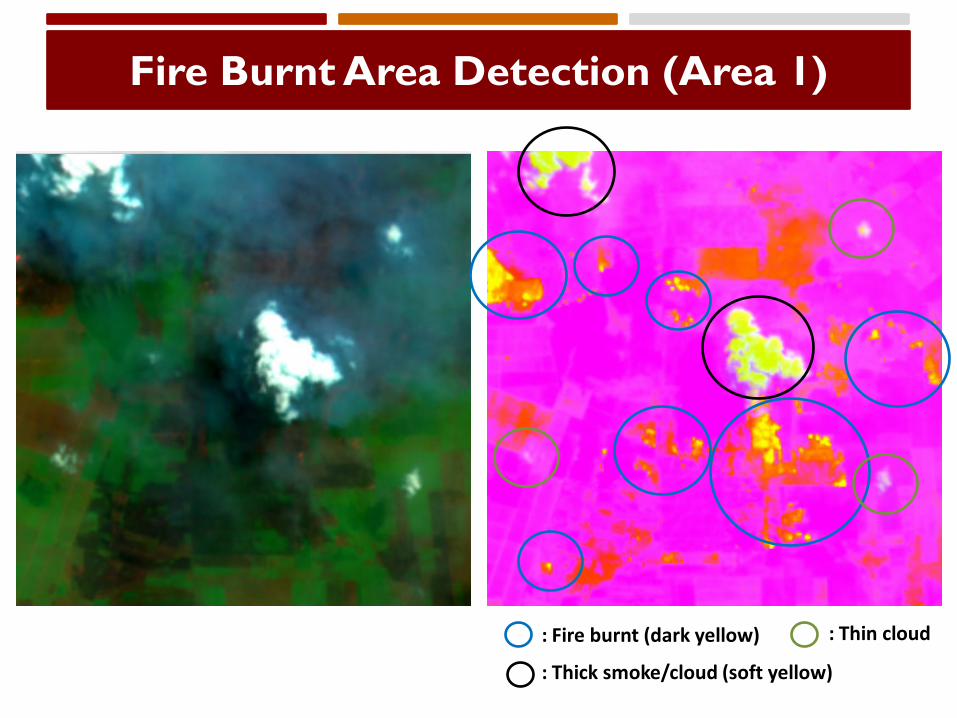
Fire Burnt Area Detection (Area 1)
: Fire burnt (dark yellow)
: Thick smoke/cloud (soft yellow)
: Thin cloud
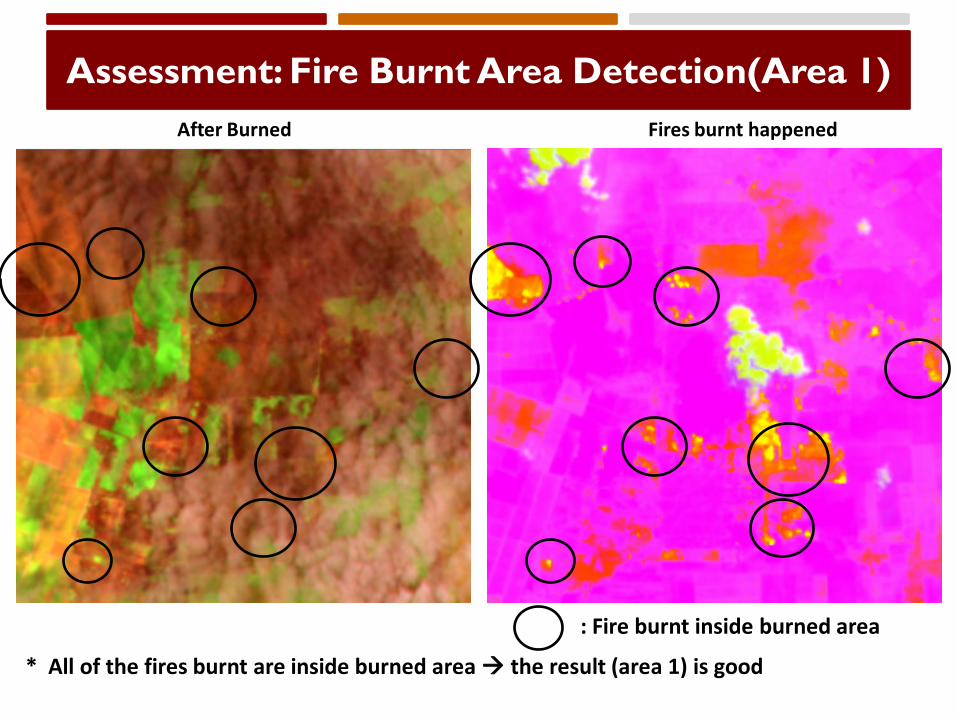
Assessment: Fire Burnt Area Detection(Area 1)
Fires burnt happenedAfter Burned
: Fire burnt inside burned area
* All of the fires burnt are inside burned area the result (area 1) is good
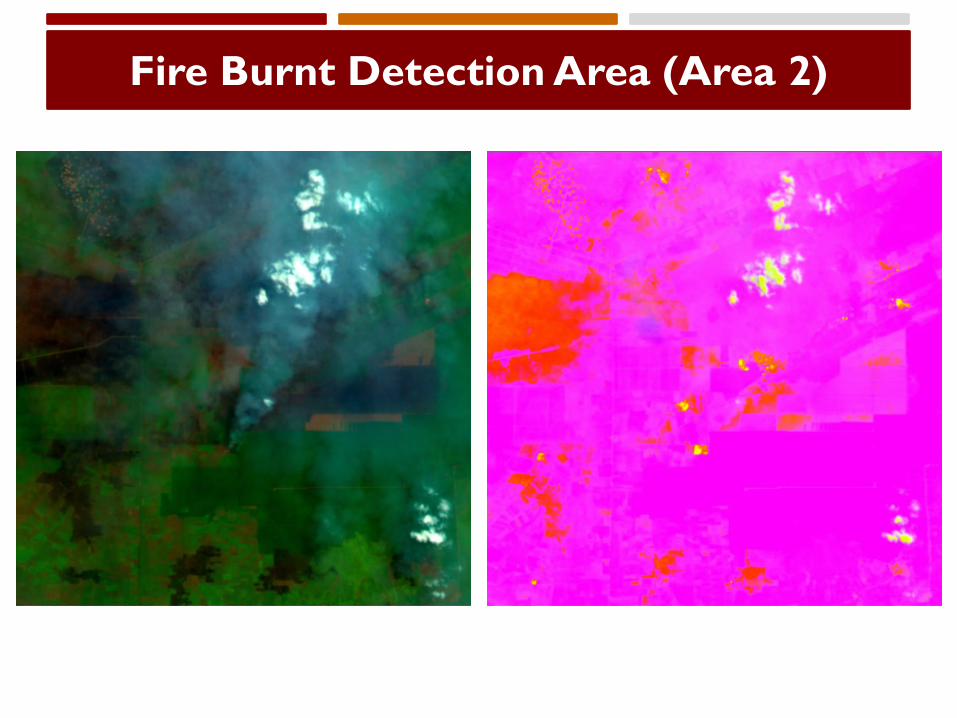
Fire Burnt Detection Area (Area 2)
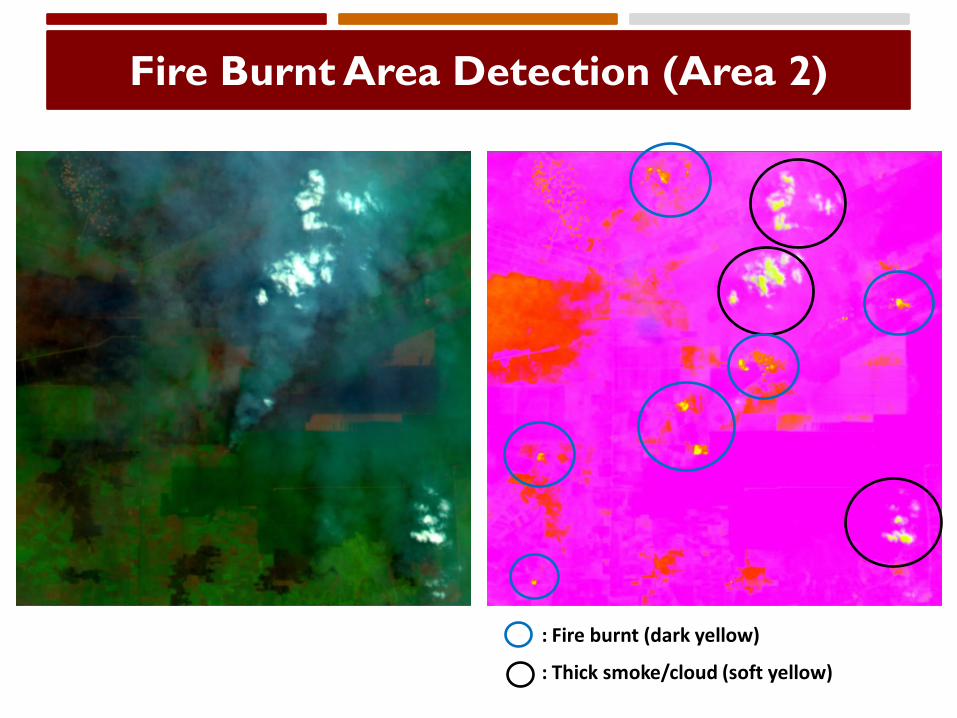
Fire Burnt Area Detection (Area 2)
: Fire burnt (dark yellow)
: Thick smoke/cloud (soft yellow)
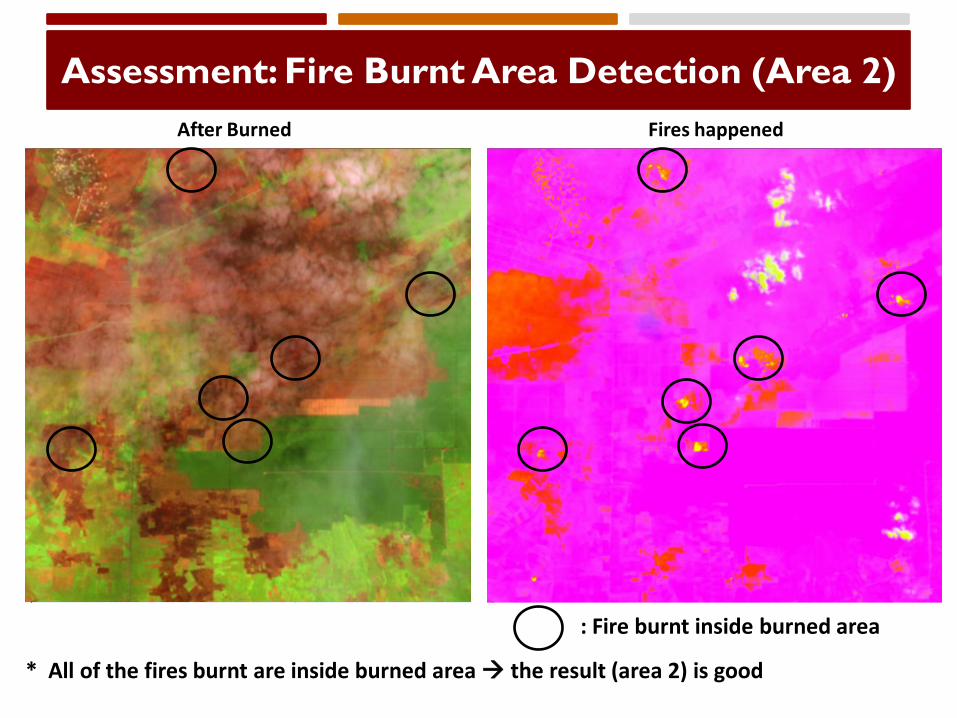
Assessment: Fire Burnt Area Detection (Area 2)
Fires happenedAfter Burned
: Fire burnt inside burned area
* All of the fires burnt are inside burned area the result (area 2) is good
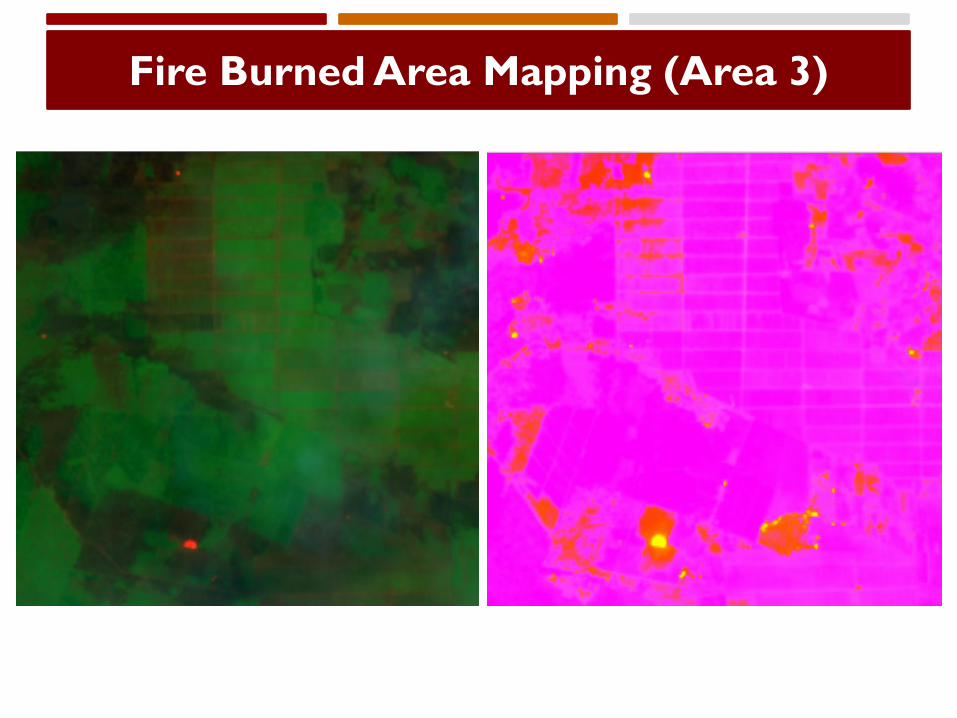
Fire Burned Area Mapping (Area 3)

Fire Burnt Area Detection (Area 3)
: Fire burnt (dark yellow)
: Thick smoke/cloud (soft yellow)
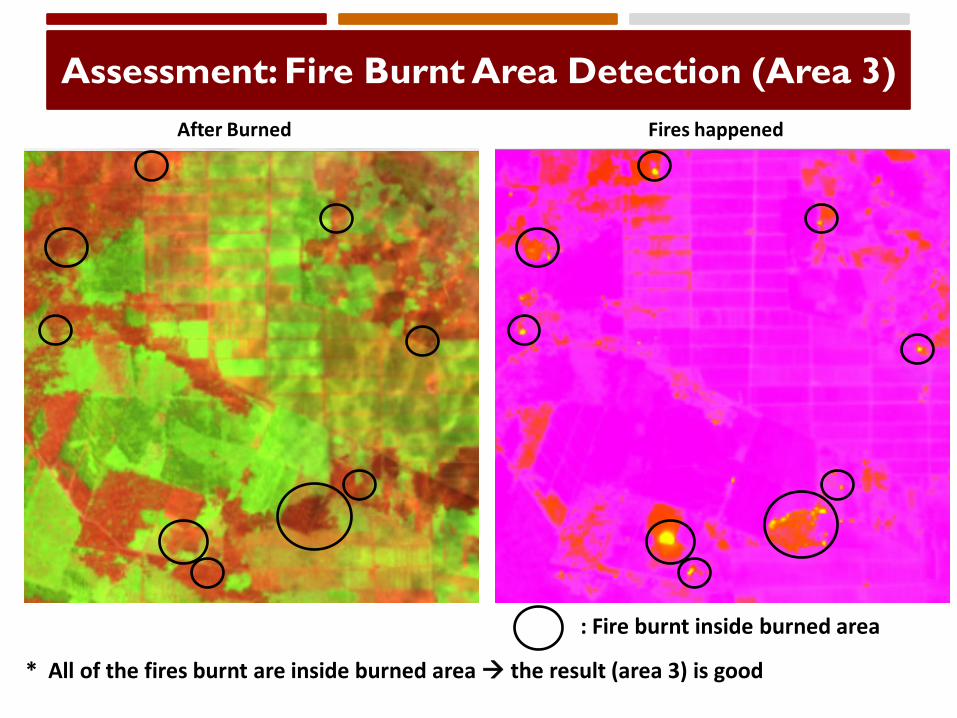
Assessment: Fire Burnt Area Detection (Area 3)
: Fire burnt inside burned area
Fires happenedAfter Burned
* All of the fires burnt are inside burned area the result (area 3) is good
All of the results (area 1, area 2 and area 3) are good the algorithm can be used to detect fire burnt area detection
Assessment: Fire Burnt Area Detection
BURNED SCAR AREA DETECTION
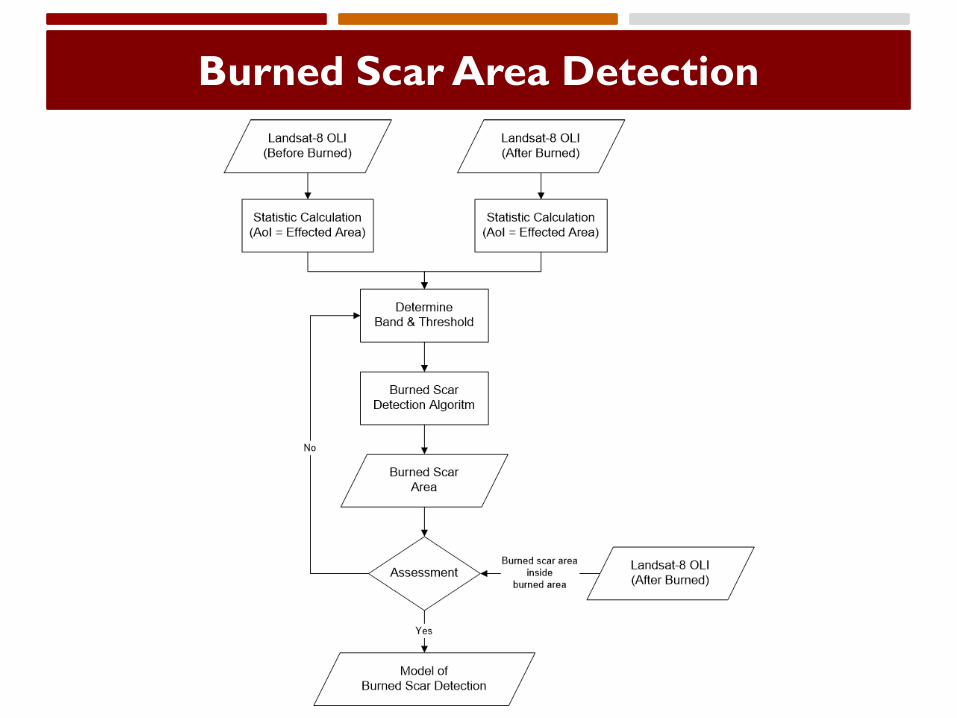
Burned Scar Area Detection
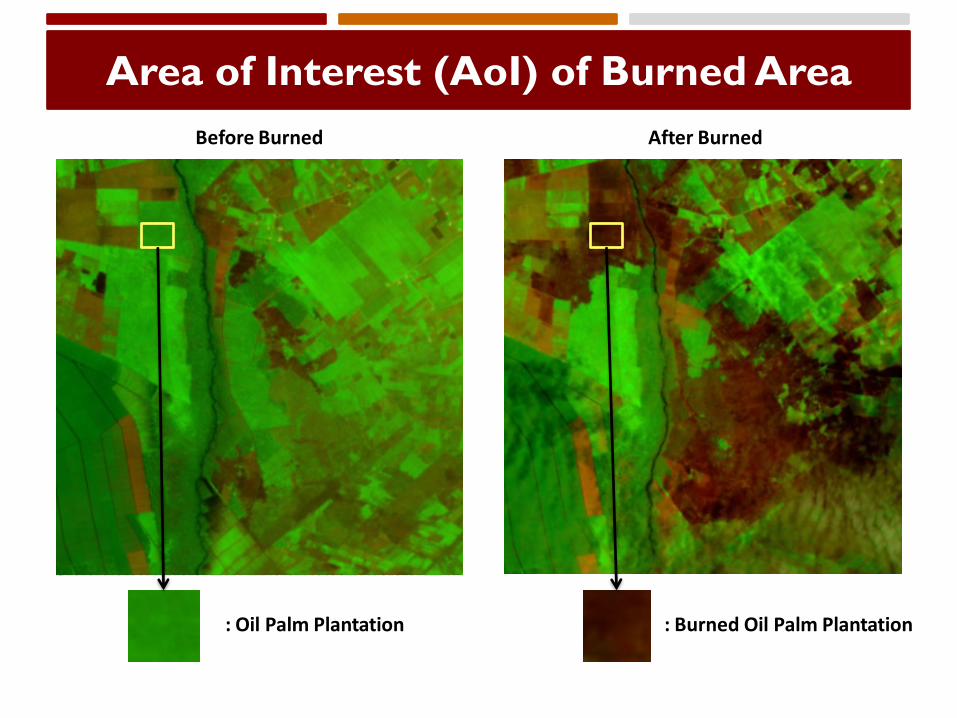
Area of Interest (AoI) of Burned Area
Before Burned After Burned
: Oil Palm Plantation : Burned Oil Palm Plantation

Statistic Overview of Burned Area
AoI
LANDSAT-8 SPECTRAL BAND
Band 1 Band 2 Band 3 Band 4 Band 5 Band 7
0.43 - 0.45 μm 0.45 - 0.52 μm 0.53 -0.60 μm 0.63 -0.68 μm 0.85 - 0.89 μm 2.10 – 2.30 μm
Vegetation before fire 0,134 0,111 0,092 0,066 0,308 0,052
Vegetation after fire 0,125 0,104 0,078 0,071 0,128 0,12
* The difference value of mean at band 5 and band 7 are bigger than others. band 5 and band 7 can be used to detect burned scar area on oil palm plantations
* NBR = (B5 – B7)/ (B5 + B7) To enhance the spectral response of fires affected oil palm plantations
0
0,05
0,1
0,15
0,2
0,25
0,3
0,35
0 1 2 3 4 5 6 7
Ref
lect
ance
Band
Mean of AoI
Vegetation before fire
Vegetation after fire
Band 1 Band 2 Band 3 Band 4 Band 5 Band 7
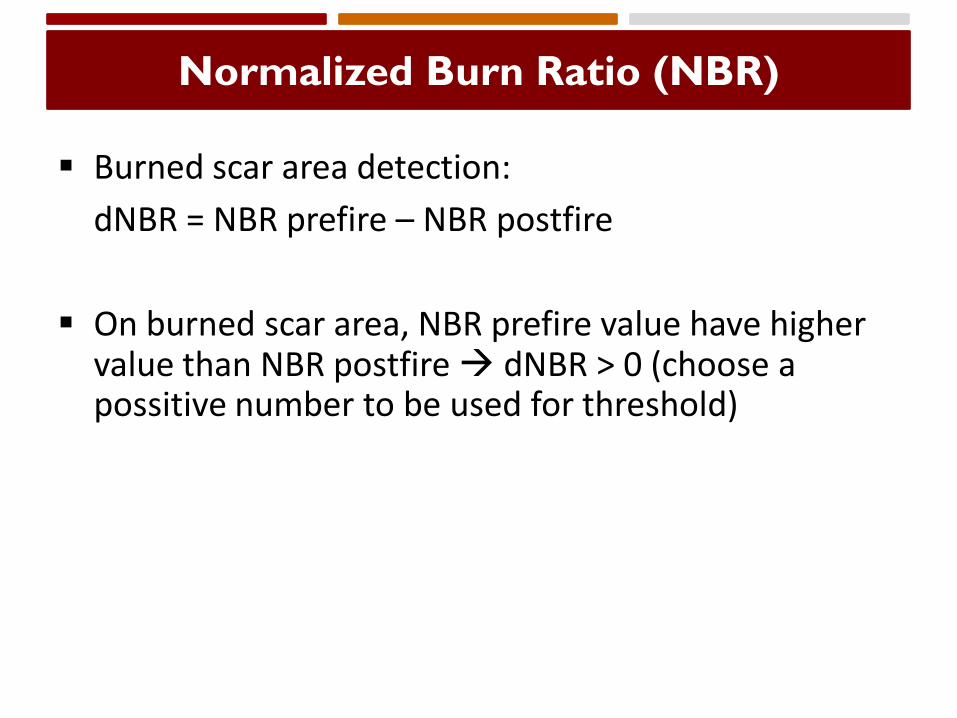
Burned scar area detection:
dNBR = NBR prefire – NBR postfire
On burned scar area, NBR prefire value have higher value than NBR postfire dNBR > 0 (choose a possitive number to be used for threshold)
Normalized Burn Ratio (NBR)
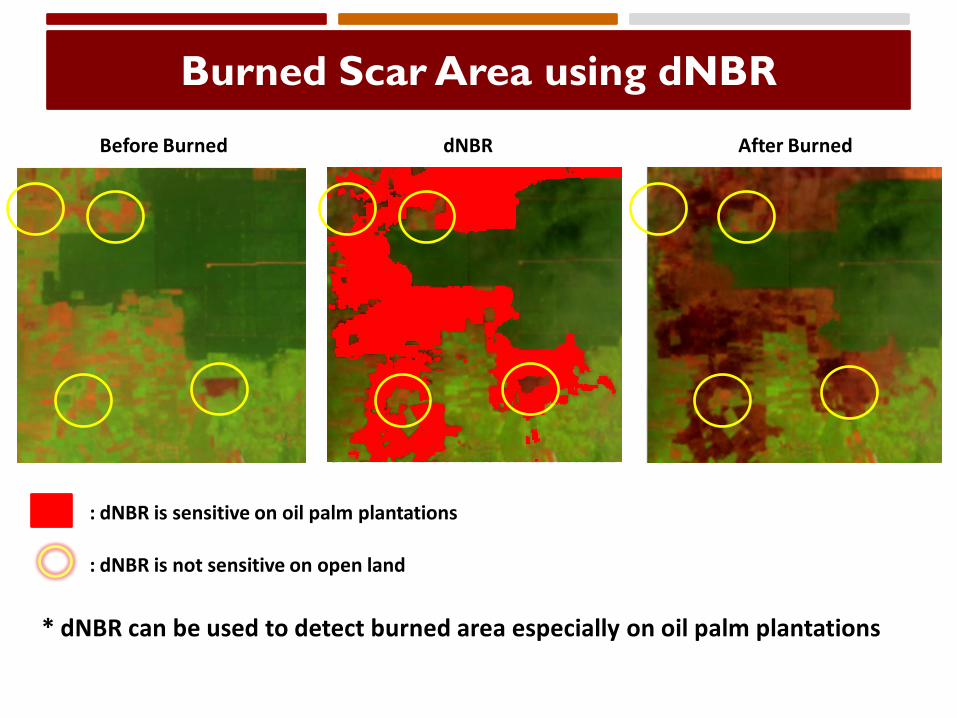
Burned Scar Area using dNBR
Before Burned dNBR After Burned
: dNBR is not sensitive on open land
: dNBR is sensitive on oil palm plantations
* dNBR can be used to detect burned area especially on oil palm plantations
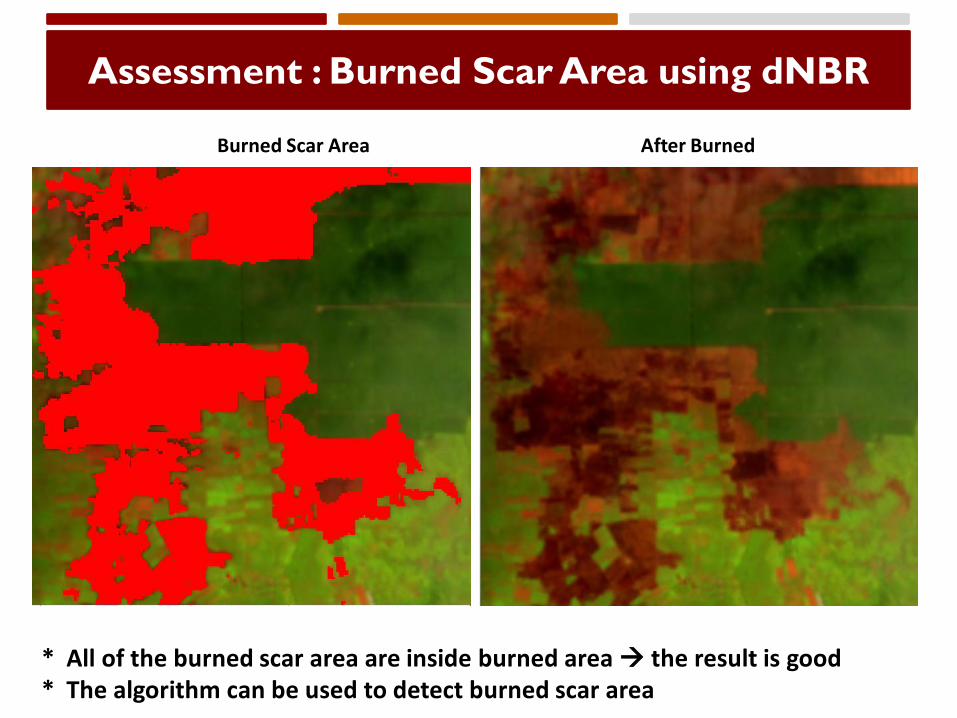
Assessment : Burned Scar Area using dNBR
Burned Scar Area After Burned
* All of the burned scar area are inside burned area the result is good* The algorithm can be used to detect burned scar area
Conclusion
1. Brightness Temperature can be used to detect firespot
2. Band combination of RGB (TIRS, SWIR,NBR) can be used to detect fire burnt area (no need to classify (takes a long time) the remote sensing data to detect fire burnt area)
3. dNBR :
Sensitive to burned oil palm plantations (vegetation)
Not sensitive to burned open land/soil
Can be used to detect burned area especially on oil palm plantations