No. 1 2011No. 1 • 2011 Published by Umeå University & The Royal Skyttean Society Umeå 2011

Umeå University Medical Dissertations, New Series No 1466
Near infrared and skin impedance spectroscopic in vivo measurements on human skin Development of a diagnostic tool for skin cancer
Ida Bodén
Department of Surgical and Perioperative Sciences, Surgery Umeå 2012

Responsible publisher under Swedish law: the Dean of the Medical Faculty This work is protected by Swedish Copyright Legislation (Act 1960:729) ISBN: 978-91-7459-335-8 ISSN: 0346-6612 Omslagsbild: Background: the combined probe head. Foreground: PCA score plot of different clark classifications of malignant melanoma, Ida Bodén Elektronisk version tillgänglig på http://umu.diva-portal.org/ Tryck/Printed by: Arkitektkopia Umeå, Sweden 2011

Till Felix, Ellen, Annie och Algot Inget är mer än själva livet.


i
Table of Contents
Table of Contents i Abstract iii Abbreviations v Notations v Medical glossary vi Populärvetenskaplig sammanfattning (summary in Swedish) viii Original papers x 1 Introduction 1
1.1 The human skin 1 1.2 Skin cancer 2 1.3 Near infrared and impedance spectroscopy as non-invasive tools for diagnosis 3 1.4 Coffee and alcohol effects on skin 4
2 Aims of the studies 5 3 Instrumentation and techniques 6
3.1 Near Infrared Spectroscopy, NIR 7 3.2 Skin impedance 8 3.3 Human subjects 10
4 Data Analysis 12 4.1 Data pre-processing 12 4.2 Multivariate Data Analysis 13 4.2.1 Principal Component Analysis, PCA 13 4.2.2 Partial least square regression, PLS 14 4.3 Scatter values 15 4.4 Intra-model distances 16 4.5 Simple manual planar discriminant analysis 17
5 Results 18 5.1 Diagnosing skin tumours 18 5.1.1 Separating different skin lesions from each other 19 5.1.2 Sensitivity and specificity 21 5.2 Factors that might affect the results 22 5.2.1 Body location, age and gender 22 5.2.2 The lack of measurable influence of coffee and alcohol consumption on skin characteristics 26 5.2.3 Differences in measurements over time, or due to season 28 5.3 Separating skin tumours from healthy reference skin 29 5.3.1 Subtraction of background information 30 5.4 Combining NIR and impedance spectroscopic data 31
6 Discussion 34 6.1 Measurement techniques and methods 34

ii
6.2 Diagnosing skin tumours 35 6.3 Individual differences have little or no impact on the spectra of diseased skin 37 6.3.1 Skin characteristics related to body location, age, gender, coffee or alcohol intake, and time 37 6.4 Combining NIR and impedance spectroscopic data 39 6.5 The challenge of the Black Box 40
7 Concluding remarks 43 8 References 44 9 Acknowledgements 50 Papers I-IV 52
iii
Abstract
Every year approximately 2800 Swedes are diagnosed with malignant melanoma, the form of cancer that is most rapidly increasing in incidence in the Western world. The earlier we can identify and diagnose a malignant melanoma, the better is the prognosis. In Sweden, 155 000 benign naevi, harmless skin tumours or moles, are surgically excised each year, many of them because melanoma cannot be dismissed by non-invasive methods. The excisions result in substantial medical costs and cause unrest and suffering of the individual patient. For untrained physicians, it is often difficult to make an accurate diagnosis of melanoma, thus a tool that could help to strengthen the diagnosis of suspected melanomas would be highly valuable. This thesis describes the development and assessment of a non-invasive method for early skin cancer detection. Using near infrared (NIR) and skin impedance spectroscopy, healthy and diseased skin of various subjects was examined to develop a new instrument for detecting malignant melanoma. Due to the complex nature of skin and the numerous variables involved, the spectroscopic data were analysed multivariately using Principal Component Analysis (PCA) and partial leas square discriminant analysis (PLS-DA). The reproducibility of the measurements was determined by calculating Scatter Values (SVs), and the significance of separations between overlapping groups in score plots was determined by calculating intra-model distances.
The studies indicate that combining skin impedance and NIR spectroscopy measurements adds value, therefore a new probe-head for simultaneous NIR and skin impedance measurements was introduced. Using both spectroscopic techniques it was possible to separate healthy skin at one body location from healthy skin at another location due to the differences in skin characteristics at various body locations. In addition, statistically significant differences between overlapping groups of both age and gender in score plots were detected. However, the differences in skin characteristics at different body locations had stronger effects on the measurements than both age and gender. Intake of coffee and alcohol prior to measurement did not significantly influence the outcome data. Measurements on dysplastic naevi were significantly separated in a score plot and the influence of diseased skin was stronger than that of body location. This was confirmed in a study where measurements were performed on 12 malignant melanomas, 19 dysplastic naevi and 19 benign naevi. The malignant melanomas were significantly separated from both dysplastic naevi and benign naevi.
Overall, the presented findings show that the instrument we have developed provides fast, reproducible measurements, capable of distinguishing

iv
malignant melanoma from dysplastic naevi and benign naevi non-invasively with 83% sensitivity and 95% specificity. Thus, the results are highly promising and the instrument appears to have high potential diagnostic utility.
v
Abbreviations BCC Basal Cell Carcinoma DF Dermatofibroma DN Dysplastic Naevus DNS Dysplastic Naevi Syndrome IMP Impedance LM Lentigo Maligna LMM Lentigo Malignant Melanoma Mis Melanoma in situ MM Malignant melanoma N Benign naevus NIR Near InfraRed NIRIMP Combined Near InfraRed and IMPedance PC Principal Component PCA Principal Component Analysis PLS Partial Least Square Regression PLS-DA Partial Least Square Discriminant Analysis SCC Squamous Cell Carcinoma SK Serborrheic Keratosis SNV Standard Normal Variate SSM Superficial Spreading Melanoma SV Scatter Value
Notations A Number of components a=1,…, A
f Frequency
I Distance between centroid and measurement point in a score plot
ImZ Imaginary impedance
IZI Magnitude of frequency
K Number of variables, k=1,…, K
N Number of calibration observations, n=1,…, N
pa Loading vector for component a in X
q Intra-model distance
ReZ Real impedance
ta Score vector for component a in X
X Data matrix [NxK]

vi
Y Response matrix
ya Response vector for component a in Y
Ф Phase shift of frequency
Z Impedance
Medical glossary Acral peripheral or apex
Apoptosis induced cell death
Basal cell carcinoma non-melanoma skin cancer
Benign harmless, not dangerous
Benign naevus harmless pigmented lesion of the skin often referred to as a “mole”
Cirrhosis chronic liver disease
Dermatofibroma benign, chiefly fibroblastic nodule of the skin found especially on the extremities of adults
Diabetes syndrome with insufficient insulin excretion
Dysplastic naevi syndrome
familiar history of multiple dysplastic naevi
Dysplastic naevus atypical benign naevi
Erythema abnormal redness of the skin
in vivo "in a living organism"
Lentigo malignant melanoma
type of malignant melanoma that shows primarily on chronically sun-damaged skins
Lentigo melanoma precursor for Lentigo malignant melanoma
Malign harmful, dangerous, cancerous tumour that might metastasise
Malignant melanoma most lethal form of skin cancer
Melanin skin pigment, produced by melanocytes in the skin, which provides protection against ultraviolet radiation

vii
Melanoma in situ non-invasive precursor to malignant melanoma
Microcirculation blood circulation in the microvascular system
Neuropathy degenerative state of the nerves
Neurotransmitter a substance that transmits nerve impulses across synapses
Nodular malignant melanoma
less common type of melanoma that shows rapid vertical growth
Non-invasive not tending to invade healthy tissue/not involving entry into the living body
Oxygenate supply with oxygen
Psoriasis chronic skin disease characterised by circumscribed red patches covered with white scales
Rosacea a chronic inflammatory disorder of the skin
Seborrheic keratoses benign hyperkeratotic tumours that occur singly or in clusters on the surface of the skin, usually light to dark brown or black in colour, typically having a warty texture, often with a waxy appearance
Squamous cell carcinoma
non-melanoma skin cancer
Stratum corneum outermost skin layer
Superficial spreading melanoma
type of malignant melanoma that spreads in a horizontal direction but can enter a vertical phase; the most common form of malignant melanoma.
Vasodilation increase in calibre of blood vessels
viii
Populärvetenskaplig sammanfattning (summary in Swedish) Swedish title: Nära infrarött ljus- och hudimpedans-spektroskopi mätningar in vivo på mänsklig hud - ett diagnostiskt instrument för upptäckt av hudcancer.
Malignt melanom är den cancerform som ökar snabbast i västvärlden och bara i Sverige upptäcks drygt 2 800 nya fall varje år. Ju tidigare man kan hitta ett elakartat melanom, desto större är sannolikheten att bli botad.
Samtidigt tas det i Sverige bort ca 155 000 ofarliga märken på huden, s.k. naevi, varje år. Detta eftersom behandlande läkare inte alltid kan utesluta att det rör sig om ett melanom. Detta leder till höga kostnader för sjukvården och orsakar i onödan lidande och oro för många patienter.
För oerfarna läkare kan det vara svårt att ställa en korrekt diagnos på melanom. Behovet av ett instrument som kan hjälpa till att stärka bedömningen av misstänkta melanom är därför stor. Vi har utvecklat ett instrument som är helt utanpåliggande som med 83 procents sensibilitet och 95 procents specificitet kan identifiera maligna melanom. Sensibiliteten är ett mått på hur många av alla melanom som identifieras och specificiteten är med vilken säkerhet detta görs.
Genom att mäta med Nära infrarött ljus (NIR) och med hudimpedans (en svag ström) på ett misstänkt märke får vi en bild av hur cellerna och de utrymmen som finns mellan cellerna är uppbyggda. Cancerceller skiljer sig markant från friska och normala celler och detta avspeglar sig därför i mätningarna.
NIR-spektroskopi innebär att man lyser på hudmärket med nära infrarött ljus. Detta orsakar att olika molekyler kring och i cellerna börjar vibrera. Beroende på hur molekylerna är uppbyggda, kommer olika våglängder av det infraröda ljuset att starta vibrationer. Dessa blir synliga i ett s.k. absorbtionsspektra.
Hudimpedans innebär att man skickar en svag växelström, med varierande frekvens, mellan två guldelektroder som placeras på huden. Strömmen rör sig sedan igenom och runt cellerna och beroende på hur strömmen rör sig får man information om cellstrukturen. Detta är beroende av frekvensen. Vid höga frekvenser går den mesta av strömmen rakt igenom cellerna och vid

ix
låga frekvenser går strömmen mellan cellerna. Hur den rör sig vid de olika frekvenserna synliggörs i ett s.k impedansspektrum.
De erhållna NIR- och impedans-spektra läggs sedan samman och analyseras med multivariata dataanalysmetoder som Principal komponent analys (PCA) eller Partial least square diskriminant analys (PLS-DA). Dessa analysmetoder innebär att man reducerar de stora datamängder som fås med NIR- och hudimpedansspektroskopin och åskådliggör dem. Med PCA och PLS-DA får man därigenom bilder av hur olika mätningar grupperar sig, eller skiljer sig, från varandra i s.k. Score plots.
Genom att applicera dessa metoder på de data som vårt instrument genererar kan vi med relativt god precision särskilja maligna melanom från ofarliga hudmärken.
Hud på olika delar av kroppen grupperar sig olika och hudmätningar grupperar sig även beroende på kön och ålder. Däremot kan vi inte visa att ett intag av kaffe eller alkohol har betydelse för mätningen trots att de eventuellt kan påverka hudens cellulära karaktär. Detta innebär att vi inte behöver ta hänsyn till om en patient har druckit kaffe eller alkohol innan han eller hon kommer till en mottagning för att få ett misstänkt melanom diagnostiserat. Patientens ålder, kön och på vilken plats på kroppen som märket är lokaliserat är också av mindre betydelse för en korrekt diagnos av ett misstänkt melanom.

x
Original papers
This thesis is based on the following papers, which are referred to in the text by the corresponding Roman numerals and the studies reported therein are referred to as Studies I-IV, respectively:
I. Bodén I., Nilsson D., Naredi P., and Lindholm-Sethson B. Characterization of healthy skin using near infrared spectroscopy and skin impedance. Medical & Biological Engineering & Computing 2008, 46:985-995
II. Bodén I., Larsson W., Nilsson D., Forssell E., Naredi P., Lindholm-Sethson B. In vivo measurements with a novel probe head for simultaneous skin impedance and near infrared spectroscopy. Skin Research and Technology 2011, 17: 494-504
III. Bodén I., Nyström J., Geladi P., Naredi P., and Lindholm-Sethson B. NIR and skin impedance spectroscopic measurements for studying (a) the effect of coffee and alcohol on skin, and (b) dysplastic naevi. Skin Research and Technology. In press
IV. Bodén I., Nyström J., Lundskog B., Zazo V., Geladi P., Lindholm-Sethson B., and Naredi P. Non-invasive identification of melanoma with near infrared and skin impedance spectroscopy. Submitted to Experimental Dermatology
Reprints are presented with permission of the publishers.

1
1 Introduction
1.1 The human skin
The skin is the largest organ in the human body and performs many specialised functions. It consists of three major layers – the epidermis, dermis and hypodermis. The skin acts as a barrier between the body and the environment and provides immunological protection against harmful environmental pathogens. The uppermost layer of the epidermis, the stratum corneum, provides a water-impermeable barrier that prevents dehydration of the body. In the hypodermis fatty cells act as insulation to prevent heat loss. Hair follicles and sweat glands in the dermis are also important for thermoregulation of the body. The skin has neurosensory functions and also produces vitamin D. The thickness of the skin varies in thickness, depending on its location, from ca. half a millimetre on the eyelids to up to a centimetre on the heels (1-3).
Figure1Cross‐sectionofthehumanskin
The skin has high regenerative capacity. The bottom layer of the epidermis, the stratum basale, contains stem cells that renew the epidermis every 30 days. The stratum basale also contains melanin producing cells, called melanocytes. Melanin gives the skin its colour and protects the nuclei of skin cells from UV-damage. A mole, or a benign naevus (N), is a cluster of melanocytes in the skin. (1-3)

2
1.2 Skin cancer
Skin cancers as a group are the most commonly forms of human cancer (3-5). The Caucasian population is the most susceptible due to the low content of protective melanin (6).
Skin cancers are divided into two groups of tumours: melanoma skin tumours, i.e. malignant melanoma (MM), and non-melanoma skin tumours. Of the non-melanoma skin tumours the main types are basal cell carcinoma (BCC) and squamous cell carcinoma (SCC). Although the latter are the most common skin cancers, MMs account for 80% of all deaths due to skin cancers (3, 7, 8). In Sweden in 2009 MM represented 10.4% of all cancer cases and during the last decade it has been one of the most rapidly increasing types of malignant tumour. The average increases per year in the last 10 years have been 4.1% for males and 4.2% for females. (9)
The melanoma skin tumours are sub-divided into Superficial spreading melanoma (SSM), Nodular malignant melanoma (nodMM), Lentigo malignant melanoma (LMM), and Acral Lentiginous melanoma. Forty per cent of SSMs originate from a Dysplastic Naevus (DN), vide infra, and about 5% of LMMs originate from premalignant Lentigo Maligna (LM). Melanoma in situ (Mis), the earliest stage of MM, is not invasive and only affects the top layer of the skin. Similarly as naevi, the DN and LM are benign skin tumours. Other benign skin tumours include Seborrheic Keratoses (SK) and Dermatofibromas (DF) (10).
The subjective ABCDE algorithm is a helpful tool for the detection of melanoma, where the A stands for asymmetry, B for border irregularity, C for colour variation, D for diameter greater than 6 mm and E for evolution (7). The stage of melanoma is based on histopatholocic characteristics such as Clark level of invasion, Breslow thickness, presence of ulceration, metastatic nodes, and mitotic rate, which are negative prognostic factors (11). In Sweden the five-year survival rate for patients with non-ulcerated MMs of a Breslow thickness ≤1 mm is 98.1% while patients with an ulcerated MM of a Breslow thickness >4 mm have a 55.5% five-year survival rate (12). For malignant melanoma early detection and proper treatment is therefore important for cure (8, 13).
A family history of melanoma is also a strong risk factor for melanoma and a familial atypical multiple-mole syndrome (FAMMM), or Dysplastic Naevus syndrome (DNS), is thought to account for 10% of all melanoma cases. The presence of DN increases the risk of developing melanoma, which
3
demonstrates that these lesions, aside from being precursors to melanoma skin tumours, also are important risk markers (8).
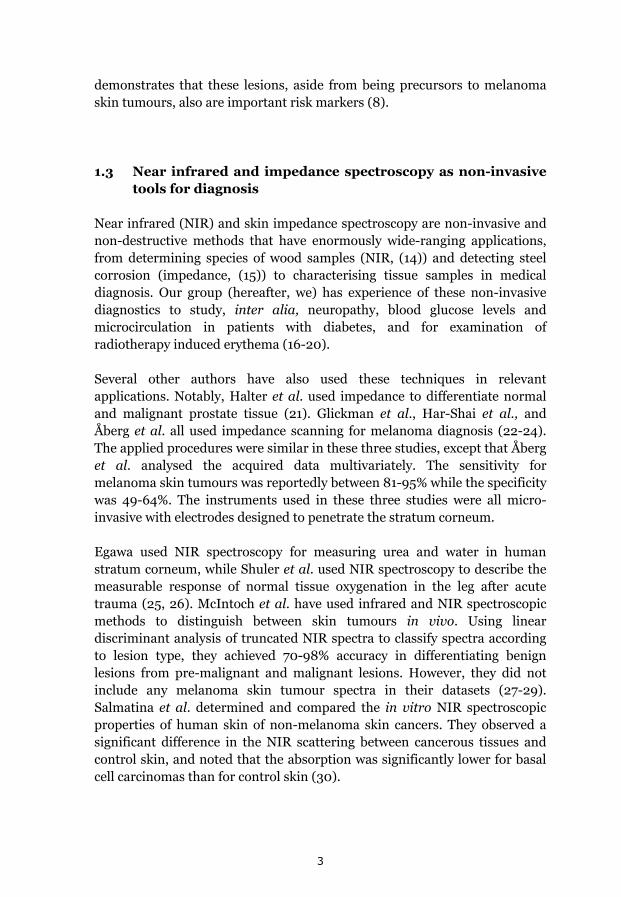
1.3 Near infrared and impedance spectroscopy as non-invasive tools for diagnosis
Near infrared (NIR) and skin impedance spectroscopy are non-invasive and non-destructive methods that have enormously wide-ranging applications, from determining species of wood samples (NIR, (14)) and detecting steel corrosion (impedance, (15)) to characterising tissue samples in medical diagnosis. Our group (hereafter, we) has experience of these non-invasive diagnostics to study, inter alia, neuropathy, blood glucose levels and microcirculation in patients with diabetes, and for examination of radiotherapy induced erythema (16-20).
Several other authors have also used these techniques in relevant applications. Notably, Halter et al. used impedance to differentiate normal and malignant prostate tissue (21). Glickman et al., Har-Shai et al., and Åberg et al. all used impedance scanning for melanoma diagnosis (22-24). The applied procedures were similar in these three studies, except that Åberg et al. analysed the acquired data multivariately. The sensitivity for melanoma skin tumours was reportedly between 81-95% while the specificity was 49-64%. The instruments used in these three studies were all micro-invasive with electrodes designed to penetrate the stratum corneum.
Egawa used NIR spectroscopy for measuring urea and water in human stratum corneum, while Shuler et al. used NIR spectroscopy to describe the measurable response of normal tissue oxygenation in the leg after acute trauma (25, 26). McIntoch et al. have used infrared and NIR spectroscopic methods to distinguish between skin tumours in vivo. Using linear discriminant analysis of truncated NIR spectra to classify spectra according to lesion type, they achieved 70-98% accuracy in differentiating benign lesions from pre-malignant and malignant lesions. However, they did not include any melanoma skin tumour spectra in their datasets (27-29). Salmatina et al. determined and compared the in vitro NIR spectroscopic properties of human skin of non-melanoma skin cancers. They observed a significant difference in the NIR scattering between cancerous tissues and control skin, and noted that the absorption was significantly lower for basal cell carcinomas than for control skin (30).

4
1.4 Coffee and alcohol effects on skin
Ridder and co-workers used diffuse reflectance NIR spectroscopy as a non-invasive tool for measuring alcohol levels in human tissue (31). Ten people with a blood alcohol level of ca. 120 mg/dl were tested. The acquired spectra were then compared to calibration spectra, which made it possible to measure alcohol content in skin. Many of the associations between alcohol misuse and skin diseases, such as psoriasis, rosacea and post-adolescent acne, have not been fully elucidated. However, cirrhosis, vascular effects, and immunodysfunctions due to alcohol misuse are suggested triggers of these skin diseases. Acute alcohol consumption is associated with vasodilation in the skin, thereby increasing blood flow and skin temperature (32-34).
Acute responses in skin characteristics resulting from drinking coffee have not been reported in the literature. However, Tagliabue et al. found that drinking coffee can increase skin temperature (35). Other reported health effects of coffee consumption that might affect skin characteristics are increases in blood pressure and reductions in vasodilation (36-38). Daily intake of coffee or other caffeinated beverages also reduces the risk of non-melanoma skin cancer (39). This can be explained by caffeine’s effects on DNA-damage responses, which promote apoptosis in cells damaged by UVB radiation, thus preventing them from becoming malignant (40).
5
2 Aims of the studies
The overall aim of the studies in this thesis is to develop a non-invasive diagnostic tool for fast and reliable diagnosis of skin cancer using NIR and skin impedance spectroscopic techniques, and to improve methods for analysing the acquired data.
Specific aims of the individual studies were:
I. to investigate whether impedance and NIR spectroscopy can differentiate between skin at various locations and to assess the potential value of combining data collected using the two techniques.
II. to develop a combined impedance and NIR spectroscopy probe head for simultaneous measurements and assess its sensitivity and robustness. Explore how the calculation and analysis of intra-model distances can be used to decide whether a statistically significant difference is present between overlapping groups in a PCA score space.
III. to investigate whether coffee or alcohol influence NIR and impedance spectroscopic measurements of normal skin. We also aimed to determine whether repeated measurements of the same dysplastic naevi remain constant for more than a year.
IV. to separate suspect melanoma skin tumours from naevi or dysplastic naevi using NIR and skin impedance spectroscopic methods.
6
3 Instrumentation and techniques
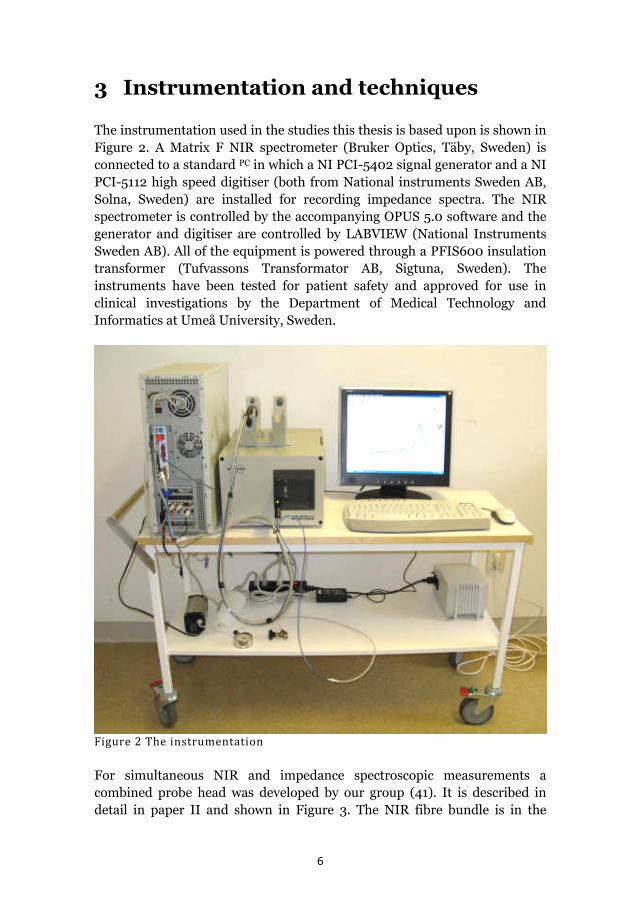
The instrumentation used in the studies this thesis is based upon is shown in Figure 2. A Matrix F NIR spectrometer (Bruker Optics, Täby, Sweden) is connected to a standard PC in which a NI PCI-5402 signal generator and a NI PCI-5112 high speed digitiser (both from National instruments Sweden AB, Solna, Sweden) are installed for recording impedance spectra. The NIR spectrometer is controlled by the accompanying OPUS 5.0 software and the generator and digitiser are controlled by LABVIEW (National Instruments Sweden AB). All of the equipment is powered through a PFIS600 insulation transformer (Tufvassons Transformator AB, Sigtuna, Sweden). The instruments have been tested for patient safety and approved for use in clinical investigations by the Department of Medical Technology and Informatics at Umeå University, Sweden.
Figure2Theinstrumentation
For simultaneous NIR and impedance spectroscopic measurements a combined probe head was developed by our group (41). It is described in detail in paper II and shown in Figure 3. The NIR fibre bundle is in the

7
middle of the probe with two gold electrodes on each side. The NIR fibre bundle and the impedance electrodes are surrounded with a circular cavity connected to a vacuum pump to ensure reproducible pressure against the skin during measurements.
Figure3ThecombinedprobeheadforsimultaneousNIRandskinimpedancemeasurements
This probe was used in Study II onwards. In Study I two separate probes were used: a fibre-optic reflectance probe for NIR measurements, and a probe with flat circular gold electrodes arranged on a plane in a hexagonal pattern for impedance measurements.
3.1 Near Infrared Spectroscopy, NIR
Infrared (IR) light is electromagnetic radiation in the wavenumber range 12820 cm-1 to 330 cm-1, or wavelength (λ) range 780 to 30300 nm. The IR range is partitioned into three regions, designated near, mid, and far IR. Molecules absorb IR at different frequencies and begin to vibrate at characteristic frequencies, yielding a characteristic spectrum, that depend on their nature, in terms of their bonds, mass and environment. By studying the frequencies at which a molecule starts to vibrate, information on the functional groups present in it can be obtained.
NIR spectroscopy technique measures transmitted or reflected light in wavelengths between 780 and 2500 nm (12820 cm-1 and 4000 cm-1). The absorption of NIR light is due to overtones and combinations of overtones of
8
the vibration that occurs for the bonds between hydrogen and the atoms oxygen, carbon and nitrogen.(42)
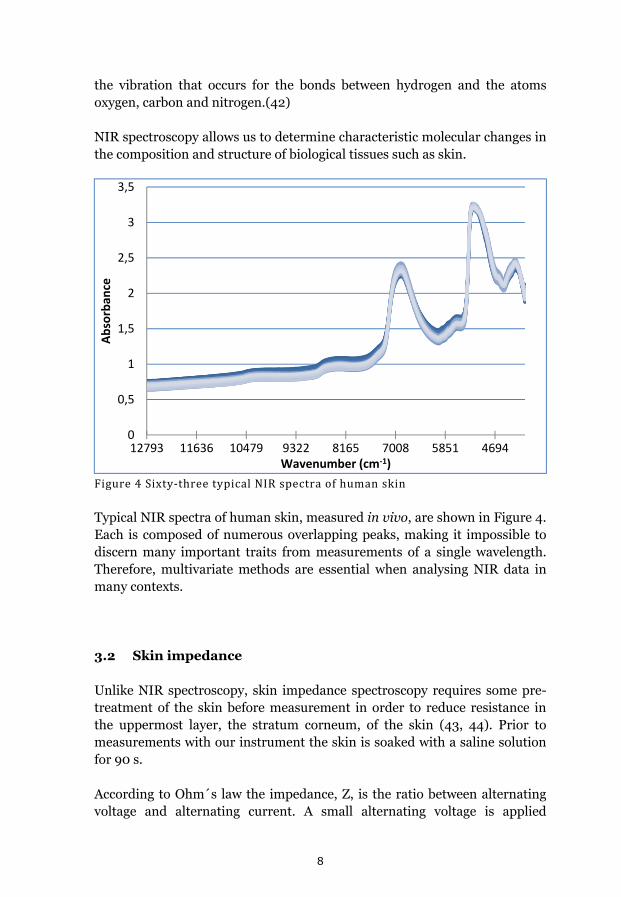
NIR spectroscopy allows us to determine characteristic molecular changes in the composition and structure of biological tissues such as skin.
Figure4Sixty‐threetypicalNIRspectraofhumanskin
Typical NIR spectra of human skin, measured in vivo, are shown in Figure 4. Each is composed of numerous overlapping peaks, making it impossible to discern many important traits from measurements of a single wavelength. Therefore, multivariate methods are essential when analysing NIR data in many contexts.
3.2 Skin impedance
Unlike NIR spectroscopy, skin impedance spectroscopy requires some pre-treatment of the skin before measurement in order to reduce resistance in the uppermost layer, the stratum corneum, of the skin (43, 44). Prior to measurements with our instrument the skin is soaked with a saline solution for 90 s.
According to Ohm´s law the impedance, Z, is the ratio between alternating voltage and alternating current. A small alternating voltage is applied
0
0,5
1
1,5
2
2,5
3
3,5
12793 11636 10479 9322 8165 7008 5851 4694
Absorban
ce
Wavenumber (cm‐1)

9
between two gold electrodes and the resulting alternating current is measured. The voltage is phase-shifted between 0° and -90° compared to the current due to the resistive and capacitive properties of the material the gold electrodes are positioned on, in our case skin. Thus, phase shift (Ф) and the magnitude, |Z|, describe the impedance according to equation 1.
| | Ф (1)
Impedance can also be expressed in the complex impedance plane according to equation 2.
ReZ ImZ (2)
where ReZ and and ImZ are the real and imaginary components of Z, respectively.
In Studies I to III complex impedance was used when analysing the acquired data. In Study IV we aimed to subtract background data from measurements on diseased skin. In order to compensate for a difference in the high frequency resistance due to different degrees of soaking a simple series RC-circuit was assumed where:
ReZ/ ImZ 2 fRC 1 (3)
in the high frequency limit. This ratio was calculated for all frequencies (f). The mean value of the ratio for the three highest frequencies was then used as a divider for all ratios for all the remaining frequencies. Hence the parameters obtained at the highest frequencies have values close to unity and lower frequencies describe the deviation from an ideal circuit (45, 46).
The extracellular and intracellular electrochemical properties of a biological tissue, such as skin, vary depending on its characteristics. Different frequency regions are affected by the properties of the tissue (47). In bio-impedance spectra three major dispersions can be identified: the α-, β-, and γ-dispersion. The α-dispersion (Hz to tens of kHz) reflects the extracellular ionic polarisation of the cells, β-dispersion (kHz to hundreds of MHz) is affected by structural membrane changes such as oedema or changes in membrane thickness, while the γ-dispersion (more than hundreds of MHz) reflects the relaxation of water and other small molecules (48). In our analyses of human skin, impedance was measured at frequencies logarithmically distributed between 100 Hz and 10 MHz, providing information on the α- and β- dispersions.
10
Impedance data are often interpreted using Cole-Cole approximation of the measurements in the complex impedance plane, i.e. ReZ is plotted against ImZ in a Nyquist plot, giving a semi-circle arc that displays deviations from an ideal circuit. Another interpretation method is to compare the relative permittivity and conductivity for each measurement. These methods require different theoretical, and sometimes erroneous, assumptions (43, 49) and will in the end still provide multivariate data sets. This is because the penetration depth of the currents in skin is correlated, among other factors, with the frequency. As described vide infra the skin has several layers and at different frequencies the different layers, each with a specific molecular characteristic, will be measured and analysed. Therefore, interpretation of impedance data using multivariate data analysis is more straightforward and does not require theoretical assumptions.
3.3 Human subjects
All studies that this thesis is based upon were approved by the Regional Ethical Review Board in Umeå, Sweden. In the first study however, no ethical approval was needed. The ratios of men/women among the subjects and their ages are shown in Table 1.
Table1Numbers,agesandgendersofparticipantsineachofthestudies 18‐31 years 32‐64 years ≥65 years
Study Presented in women men women men women men
Body location Paper I 8*
Age/gender Paper II 8 7 9 9
Coffee/alcohol Paper III 8 7
DNS Paper III 1 3 1
Skin tumour Paper IV 7 4 17 11 3 3
This thesis 7 5 21 16 7 6
*15 to 19 years old
Persons to the first three studies listed in Table 1 volunteered to participate in response to advertisements on local billboards at Umeå University, Umeå, Sweden. Patients in the DNS study volunteered after being selected by a medical doctor at the Department of Dermatology and Venereology, Umeå University Hospital, Sweden. The patients included in the skin tumour study were enrolled at three clinical sites: the Department of Surgery, the

11
Department of Dermatology and Venereology, and the Department of Hand and Plastic Surgery at the Umeå University Hospital, Sweden. As in all of the studies, participation in the skin tumour study was voluntary.
12
4 Data Analysis
In order to combine and analyse both NIR spectral data and impedance spectral data a matrix was constructed for each data set. The variances for the two matrices were calculated, and then combined into an NIRIMP matrix, after scaling the variance to give variations in the NIR and impedance data the same weight in the resulting models.
Before any data pre-processing, each data set was briefly analysed by principal component analysis (PCA) to identify, and remove, outliers. Outliers were defined as observations falling outside a 95% Hotelling’s T2 area in the score plot and/or those exceeding the critical distance (95%) in a distance-to-model plot, which shows the distances from the observations to the corresponding model (50).
When appropriate, the number of measurements was reduced by averaging values of replicates. Where relevant, this was done before any other data pre-processing.
4.1 Data pre-processing
Pre-processing of spectroscopic data is sometimes necessary since the baseline of the spectra might shift or the spectra might contain noise. The pre-processing most appropriate for particular data is evaluated by trial and error. A specific pre-processing method is suitable if it enhances separation/grouping of measurement scores in a score plot.
In Study I each impedance spectrum was normalised with respect to the corresponding mean impedance spectrum by means of point-by-point division, to acquire unit-less spectra with less dependence on between-individual variations. In Study II the NIR spectra were Standard Normal Variate (SNV)-corrected to diminish the effect of gender.
SNV-correction is a pre-processing method that reduces scatter effects such as slope and baseline shifts in spectral data. The SNV-correction transformation is applied to individual spectra, centring each spectrum and then scaling it by its own standard deviation according to the formula:
,,
i 1, 2, 3, ……… , I (4)
13
where YSNV are the SNV spectral values calculated from the initial spectral values, Yold, at each wavenumber (51), and SD is the standard deviation. SNV-correction works well only if all spectra in the data set are uniform, i.e. all spectra have been acquired from similar material.
4.2 Multivariate Data Analysis
Principal component analysis (PCA) and partial least square discriminant analysis (PLS-DA) are multivariate data analysis techniques that are widely used to explore correlations and groupings in complex data sets obtained using techniques such as NIR and skin impedance spectrometry (50, 52-54).
4.2.1 Principal Component Analysis, PCA
In PCA, each of N measurements, or ‘objects’, of K variables are arranged in a matrix, X, in a K-dimensional space. Since it is not generally easy to display more than three-dimensional data in a single plot PCA generates new “latent” variables, which are not directly observed but inferred by modelling from the observed variables, called principal components PC´s. The first component, PC1, lies in the direction that explains most of the variance in the data. The next component, PC2, is drawn orthogonal to the first in the direction that explains the greatest amount of the remaining variance and so on. Figure 5 presents a schematic diagram of PCA components in a multivariate space. Each component is comprised of a score vector, ta, and a loading vector, pa. The score vector describes the new coordinates of the objects projected onto the components, while the loading vectors describe the directions of the components. Grouping patterns of the objects are seen in score plots in which two or three loading vectors are plotted against each other. By plotting loading vectors against each other a loading plot is obtained, which can be used to investigate the importance of individual variables for the observed patterns. For spectral data, such as NIR and skin impedance spectra, loading line plots are often shown to aid the interpretation of the importance of the variables (50, 52-54).

14
Figure5.SchematicdiagramofthefirsttwoPCAcomponents,PC1andPC2, ina multivariate space described by three variables, K1, K2 and K3. Themultivariatespacecouldconsistofanynumberofvariables.
4.2.2 Partial least square regression, PLS
PLS is a regression method used to find the relationship between two data matrices, e.g. a predictor matrix, X, used in PCA and a response matrix, Y. PLS can only be validly used it is possible to obtain a model capable of robustly predicting Y from X. A variant, PLS-Discriminant Analysis (PLS-DA) can be used if the Y matrix consists of dummy variables defining classes of the objects in X. PLS-DA rotates the latent variables, variables to maximise the separation of classes of the objects. A common purpose of this procedure is to predict the probable classes of new/unknown observations. Observations that are not used to construct the original PLS-DA model can be predicted into the model, either to test the robustness of the model or to predict the classes of those objects (50, 52-54).

15
4.3 Scatter values
Scatter values (SV) were introduced in Paper I to enable the evaluation of reproducibility of data from NIR and skin impedance measurements. The distance between replicates of measurements that are analysed and visualised in a PCA score space depend on the reproducibility of the measurement method. The replicates are less scattered if the reproducibility of the method is high and vice versa. Thus, by calculating scatter values we can compare the reproducibility of two or more measuring methods if the data are analysed by the same PCA model. How the SVs are calculated is described in detail in Paper I and shown in Figure 6.
Figure 6 Visualization of the calculation of scatter values (SV). The ym and zm valueswerecalculatedusingthesameformulaasforxm.Thecentroid(blackcircle)isthemid‐pointoftheobservationpoints(bluecircles),henceitscoordinatesare(0,0,0)inathree‐dimensionalscoreplot.TheSVofaspecificgroup isameasureof thedeviationof thedistances,I,betweenthecentroidandtheobservationpointsofthatgroup.
The significance differences between two SVs can be determined by comparing the Euclidian distances, I, using Student´s t-test for normally distributed data or a Mann-Whitney test for data with a non-Gaussian distribution.

16
4.4 Intra-model distances
It is sometime difficult, if not impossible, to interpret the significance of the separation between two overlapping groups in a score plot. Therefore, inter-model distances were introduced in Paper II. By calculating intra-model distances, q, for each measurement/object in a group and comparing the q values of the groups, the significance of these separations can be determined by a Student´s t-test for normally distributed data or a Mann-Whitney test for data with a non-Gaussian distribution. How intra-model distances are calculated is described in detail in Paper II and shown in Figure 7.
Figure7Scoreplotillustratingintra‐modeldistances.A,centroidforgroup1(triangles);B,centroidforgroup2(circles);C,oneofthepointsofbothgroups1and2.Theintra‐modeldistance,q,iscalculatedbythecosineformula:a2=b2+c2‐2bc*cos(α),wherecos(α)=q/b
In Studies II-IV and in the present thesis inter-model distances is used to determine the statistical significance of separation or differences between overlapping groups in score plots. In section 5.3.1, and in Study IV, a non-paired NOPAPROD is used together with inter-model distances to determine the statistical significance. NOPAPROD is earlier described by Nyström et al. (55).

17
4.5 Simple manual planar discriminant analysis
A classification rate can be determined using simple manual planar discriminant analysis. In this procedure, a line or plane is drawn though a score space, depending on its dimensions, between groups of measurements. In cases with overlapping groups the line or plane is tilted to obtain an equal number of scores with a wrong classification at each side of the line/plane. By this means a classification rate can be calculated, where 100% correct classification means no overlap of groups and 50% classification means a total overlap between the groups. This method was used in Studies I and II to determine and compare the classification rates of different models (16).
18
5 Results
The overall aim of the studies this thesis is based upon was to develop non-invasive NIR and skin impedance spectroscopic techniques with high specificity and sensitivity capable of providing quick, early and accurate diagnoses of suspected melanoma skin tumours. To achieve this goal we first compared the spectra of various melanoma skin tumours and non-melanoma skin tumours, and the spectral relationships of non-melanoma skin tumours to one another. Secondly, various artefacts in skin characteristics that might influence the spectra were examined. Thirdly, the spectral characteristics of melanoma skin tumours, dysplastic naevi and naevi were compared to those of healthy reference skin. Finally, the value of combining NIR and impedance spectroscopy for these purposes was assessed.
5.1 Diagnosing skin tumours
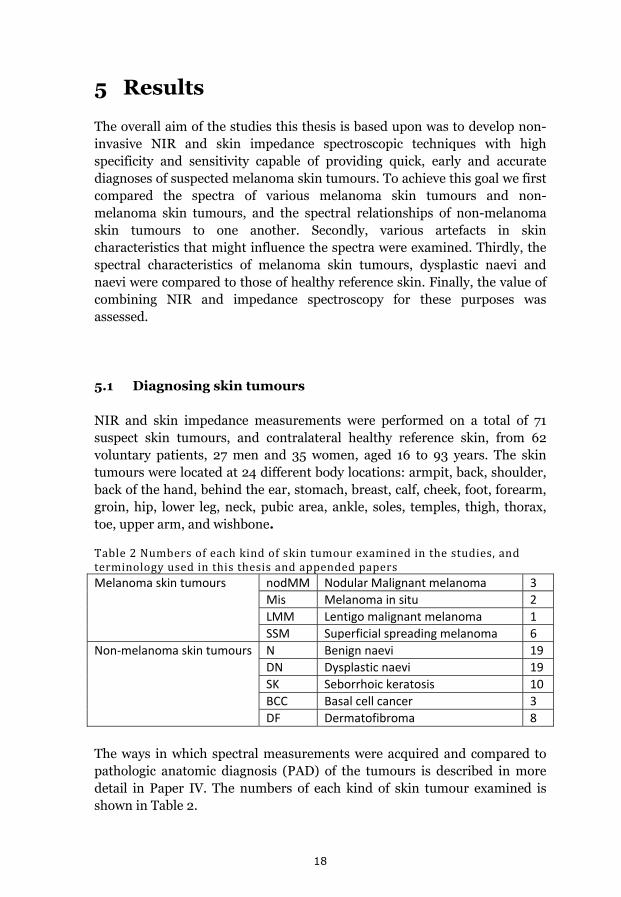
NIR and skin impedance measurements were performed on a total of 71 suspect skin tumours, and contralateral healthy reference skin, from 62 voluntary patients, 27 men and 35 women, aged 16 to 93 years. The skin tumours were located at 24 different body locations: armpit, back, shoulder, back of the hand, behind the ear, stomach, breast, calf, cheek, foot, forearm, groin, hip, lower leg, neck, pubic area, ankle, soles, temples, thigh, thorax, toe, upper arm, and wishbone. Table2Numbersofeachkindofskintumourexaminedinthestudies,andterminologyusedinthisthesisandappendedpapersMelanoma skin tumours nodMM Nodular Malignant melanoma 3
Mis Melanoma in situ 2
LMM Lentigo malignant melanoma 1
SSM Superficial spreading melanoma 6
Non‐melanoma skin tumours N Benign naevi 19
DN Dysplastic naevi 19
SK Seborrhoic keratosis 10
BCC Basal cell cancer 3
DF Dermatofibroma 8
The ways in which spectral measurements were acquired and compared to pathologic anatomic diagnosis (PAD) of the tumours is described in more detail in Paper IV. The numbers of each kind of skin tumour examined is shown in Table 2.
19
5.1.1 Separating different skin lesions from each other
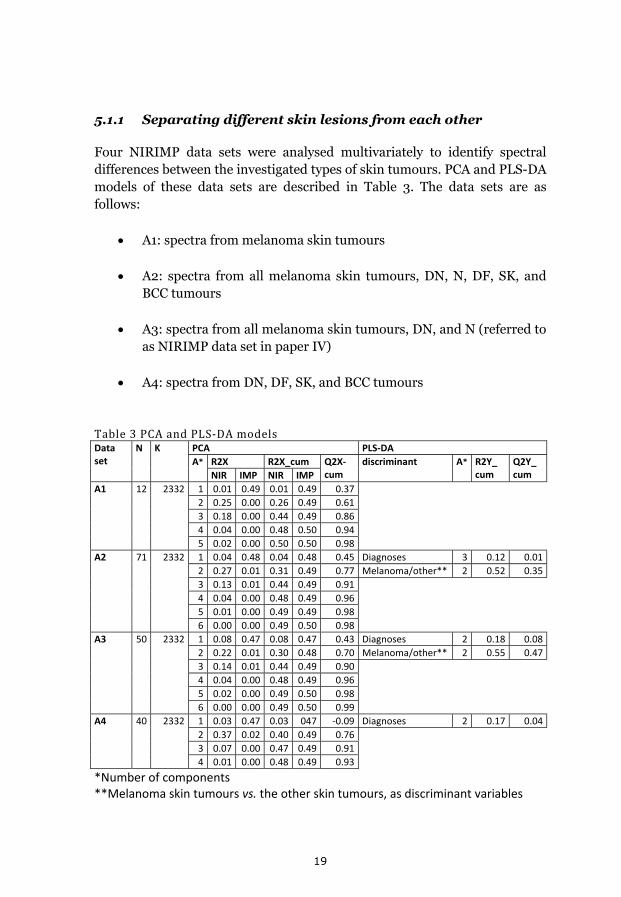
Four NIRIMP data sets were analysed multivariately to identify spectral differences between the investigated types of skin tumours. PCA and PLS-DA models of these data sets are described in Table 3. The data sets are as follows:
A1: spectra from melanoma skin tumours
A2: spectra from all melanoma skin tumours, DN, N, DF, SK, and BCC tumours
A3: spectra from all melanoma skin tumours, DN, and N (referred to as NIRIMP data set in paper IV)
A4: spectra from DN, DF, SK, and BCC tumours
Table3PCAandPLS‐DAmodelsData set
N K PCA PLS‐DA
A* R2X R2X_cum Q2X‐cum
discriminant A* R2Y_ cum
Q2Y_ cum NIR IMP NIR IMP
A1 12 2332 1 0.01 0.49 0.01 0.49 0.37
2 0.25 0.00 0.26 0.49 0.61
3 0.18 0.00 0.44 0.49 0.86
4 0.04 0.00 0.48 0.50 0.94
5 0.02 0.00 0.50 0.50 0.98
A2 71 2332 1 0.04 0.48 0.04 0.48 0.45 Diagnoses 3 0.12 0.01
2 0.27 0.01 0.31 0.49 0.77 Melanoma/other** 2 0.52 0.35
3 0.13 0.01 0.44 0.49 0.91
4 0.04 0.00 0.48 0.49 0.96
5 0.01 0.00 0.49 0.49 0.98
6 0.00 0.00 0.49 0.50 0.98
A3 50 2332 1 0.08 0.47 0.08 0.47 0.43 Diagnoses 2 0.18 0.08
2 0.22 0.01 0.30 0.48 0.70 Melanoma/other** 2 0.55 0.47
3 0.14 0.01 0.44 0.49 0.90
4 0.04 0.00 0.48 0.49 0.96
5 0.02 0.00 0.49 0.50 0.98
6 0.00 0.00 0.49 0.50 0.99
A4 40 2332 1 0.03 0.47 0.03 047 ‐0.09 Diagnoses 2 0.17 0.04
2 0.37 0.02 0.40 0.49 0.76
3 0.07 0.00 0.47 0.49 0.91
4 0.01 0.00 0.48 0.49 0.93
*Number of components **Melanoma skin tumours vs. the other skin tumours, as discriminant variables
20
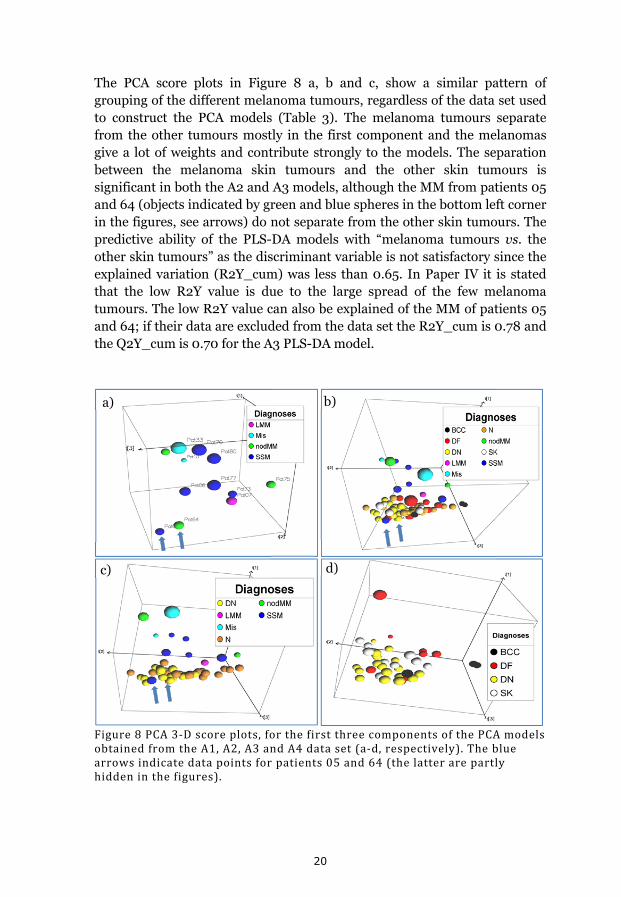
The PCA score plots in Figure 8 a, b and c, show a similar pattern of grouping of the different melanoma tumours, regardless of the data set used to construct the PCA models (Table 3). The melanoma tumours separate from the other tumours mostly in the first component and the melanomas give a lot of weights and contribute strongly to the models. The separation between the melanoma skin tumours and the other skin tumours is significant in both the A2 and A3 models, although the MM from patients 05 and 64 (objects indicated by green and blue spheres in the bottom left corner in the figures, see arrows) do not separate from the other skin tumours. The predictive ability of the PLS-DA models with “melanoma tumours vs. the other skin tumours” as the discriminant variable is not satisfactory since the explained variation (R2Y_cum) was less than 0.65. In Paper IV it is stated that the low R2Y value is due to the large spread of the few melanoma tumours. The low R2Y value can also be explained of the MM of patients 05 and 64; if their data are excluded from the data set the R2Y_cum is 0.78 and the Q2Y_cum is 0.70 for the A3 PLS-DA model.
Figure8PCA3‐Dscoreplots,forthefirstthreecomponentsofthePCAmodelsobtainedfromtheA1,A2,A3andA4dataset(a‐d,respectively).Thebluearrowsindicatedatapointsforpatients05and64(thelatterarepartlyhiddeninthefigures).
a) b)
c) d)

21
When excluding the melanoma skin tumours and Ns from the data set, as in the A4 data set, significant separations between DN – SK and DN – DF can be seen (Figure 8d). As there were only three BCCs, their separation from other tumours could not be validly tested. The explained R2Y_cum (amount of explained variance) values of the PLS-DA models indicated that none on them provided robust predictions of “diagnoses” when this was used as the discriminant variable (Table 3). The groups of skin tumours tested in each PLS-DA model, with “diagnoses” as the discriminant variable, are shown in the figure legends in Figure 8.
In Study IV the spread of the different groups was examined in terms of scatter values (SVs). As shown in Figure 8, the melanoma tumours scatter more in the PCA score plots than the other groups of skin tumours. In addition, the distances between the measurement points and the corresponding centroids in the model show that the melanoma tumours scatter significantly more than DN and N and the N scatters significantly more than the DN (Table 4).
Table4ScattervaluesofthegroupedskintumoursintheA3PCAscoreplotandp‐valuesofthedifferencesbetweenthem
SV Melanoma tumours 16
DN 4
N 7
p‐value* Melanoma tumours vs. DN 2*10‐5
Melanoma tumours vs. N 2*10‐4
DN vs. N 2*10‐2
*p‐value indicating the significance of the difference between the scatter values of
the tumour types, obtained from a Mann‐Whitney test of the differences in the
distances, “I”, to their respective centroids
5.1.2 Sensitivity and specificity
The sensitivity and specificity of the applied techniques were determined by a PLS-DA, with data acquired from malignant tumours and benign tumours as Y-variables of the A3 data set (Paper IV). In a PLS-DA some objects are excluded and their classes are predicted to test the predictive power of the model. Generally, if the calculated Y-value for an object is <0.5 it is predicted as a “0”-class member (here “malignant tumour”), and if its calculated Y-value is >0.5 it is predicted as a “1”-class member (here “benign tumour”).
22
However, since the melanoma skin tumours had higher SVs and thus greater variation than DN and N tumours, the cut-off value was changed from 0.5 to 0.67 in order to include more of the objects in the “malignant tumour” class. Using full cross-validation, i.e. excluding one object at a time from the modelling then predicting its Y-value, 10 of the 12 malignant tumours were found to be true positives and 36 of the 38 benign tumours to be true negatives. This gives a sensitivity of 83% and a specificity of 95%. The two false negatives were from patients 05 and 64. If the standard Y=0.5 cut-off was used the sensitivity was 75% and specificity 100%.
5.2 Factors that might affect the results
There is always a risk of incorrectly interpreting results of any kind of MM analyses due to potentially confounding effects on skin characteristics of factors such as age, gender and intake of coffee or alcohol. Results may also be affected by differences in time of analyses, especially if measurements are taken over timeframes of a year or more. Therefore, we examined the feasibility of using NIR and impedance spectroscopy to identify differences in skin characteristics due to such factors, and the possibility that they may affect the diagnostic outcome.
5.2.1 Body location, age and gender
NIRIMP spectra acquired from the skin of three groups of people were analysed and compared using multivariate methods with respect to body location, age and gender. These groups were:
B1, a very homogeneous group of eight young women aged 15 to 19 (referred to as NIRIMPred data set in Paper I). In this data set the values of replicates were not averaged.
B2, a heterogeneous group of 33 people of both genders and from two different age groups: ≤31 years old and ≥65 years old (referred to as NIRIMP_A data set, Table 1 in Paper II). The NIR sub-set of this data set was SNV-corrected.
B3, the most heterogeneous group, consisted of 27 men and 41 women aged 16 to 93 years, divided into three age groups: ≤31, 32-64 and ≥65 years old. The people included in this third group were

23
the same as those in A2, except for three who were found to be outliers in a PCA score plot. Here though, only the measurements from healthy reference skin were included in a new model, not described earlier. The B3 PCA model consists of 68 objects and 2383 variables. The NIR data were SNV-corrected. R2X-values for the first three components of the B3 PCA model were 0.43, 0.31 and 0.18, respectively.
Body location: In Studies I and II five body locations were chosen to benchmark the spectral characteristics of healthy skin: the cheek, inside upper arm and back of the hand (areas of thin skin), the calf (skin of medium thickness) and the back (thick skin). PCA-models of the three different data sets are shown in Figure 9. Groupings of the five skin locations are shown in score plots from multivariate models of the B1 and B2 data sets. The B3 data set contains measurements taken from 24 body locations, and its PCA score plot does not show any specific groupings related to body location (Figure 9 c).
Figure9PCAmodelsofthea)B1,b)B2andc)B3datasets.Eachcolourrepresentsaspecificbodylocation.Thecolourcodeforaandbis:Backofthehand(green),Innerupperarm(darkblue),Back(Yellow),Calf(lightblue),andCheek(purple).
a) b)
c)

24
After PLS-DA modelling of the three data sets, the B1 model had the highest explained variance (R2Y_cum) and predictive power (Q2Y_cum) values, while the B3 model had the lowest values (Table 5) when “Body location” was used as the discriminant variable.
Table5SummarystatisticsofthePLS‐DAmodelsoftheB1,B2,andB3datasetsDiscriminant PLS‐DA model R2Y_cum Q2Y_cum Comp*
Body location
B1 0.54 0.27 8
B2 0.46 0.39 5
B3 0.06 0.005 2
Age group B2 0.71 0.61 6
B3 0.17 0.04 3
Gender B2 0.32 0.10 6
B3 0.11 ‐0.10 2
*The number of significant components for each model.
The classification rate was determined by simple manual planar discriminant analysis of the PLS-DA score plots for the body locations represented in the B1 and B2 data sets. Correct classification rates for these data sets were 89% (90% if values for replicates were averaged, see Paper I) and 88% (Paper II), respectively
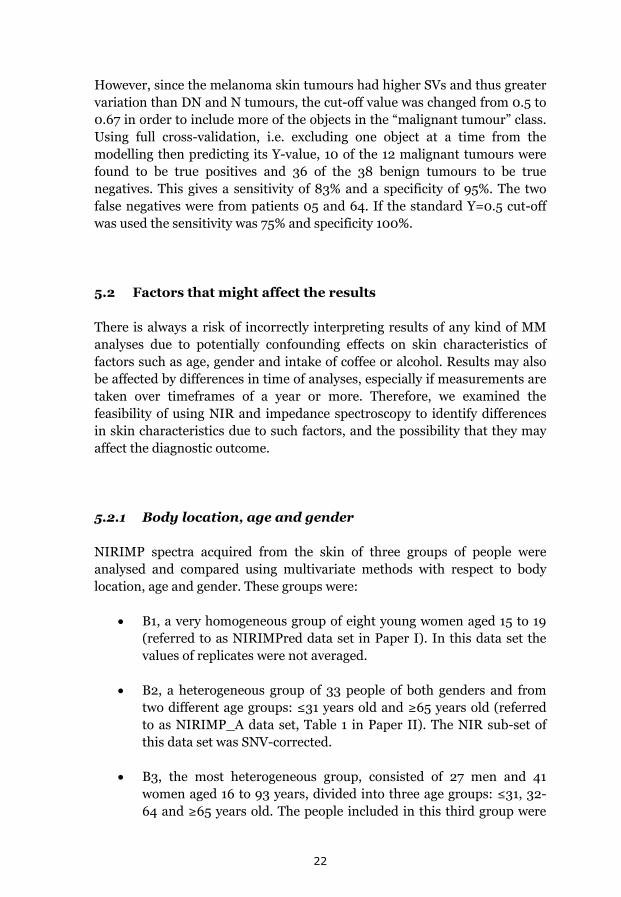
Age: In the B1, B2 and B3 data sets, one, two and three age groups were represented, respectively. PCA score plots of the B2 and B3 models revealed significant separation between the ≤31 and ≥65 years old (Figure 10) and between the ≤31 and 32 - 64 years old age groups for B3. However, the middle age group, 32 - 64 years old, overlapped with both of the other two age groups in the B3 model, giving a very poor PLS-DA model compared with B2 when age group was used as a discriminant variable (Table 5).
The reproducibility of the measurements was the same for age groups ≤31 and ≥65 years old, i.e. there was no significant difference in the SVs for these groups (Table 4 in paper II).
25
Figure10PCAscoreplotsshowingagegroupsofsubjects(≤31yearsold,green;32‐64yearsold,yellow;≥65yearsold,blue)forthea)B2andb)B3datasets.
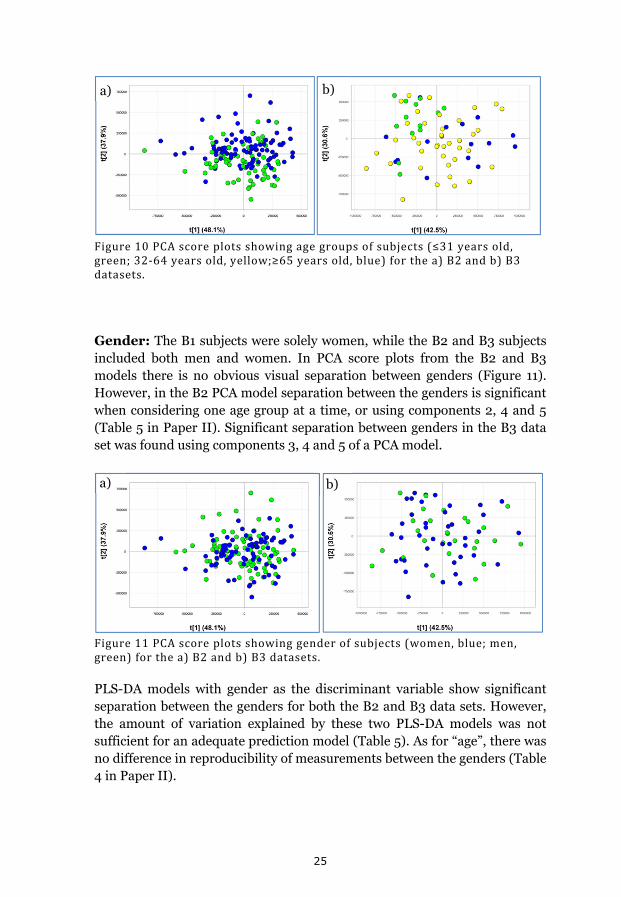
Gender: The B1 subjects were solely women, while the B2 and B3 subjects included both men and women. In PCA score plots from the B2 and B3 models there is no obvious visual separation between genders (Figure 11). However, in the B2 PCA model separation between the genders is significant when considering one age group at a time, or using components 2, 4 and 5 (Table 5 in Paper II). Significant separation between genders in the B3 data set was found using components 3, 4 and 5 of a PCA model.
Figure11PCAscoreplotsshowinggenderofsubjects(women,blue;men,green)forthea)B2andb)B3datasets.
PLS-DA models with gender as the discriminant variable show significant separation between the genders for both the B2 and B3 data sets. However, the amount of variation explained by these two PLS-DA models was not sufficient for an adequate prediction model (Table 5). As for “age”, there was no difference in reproducibility of measurements between the genders (Table 4 in Paper II).
a) b)
a) b)

26
5.2.2 The lack of measurable influence of coffee and alcohol consumption on skin characteristics
Using the same methods and protocols two parallel studies were performed to decide whether it is possible to measure coffee- or alcohol-induced changes in skin characteristics using NIR and impedance spectroscopy. The first study is described in Paper III and focused on people aged 18 to 31 years. NIR and skin impedance measurements were performed on eight women and seven men, prior to and after drinking 500 ml of strong brewed coffee or 50 ml of a 40% alcoholic beverage on two separate days. After drinking, measurements were repeated every 15 minutes for two hours. The measurements prior to intake were taken from five standard body locations (back of the hand, back, calf, inside upper arm and cheek) while the measurements repeated after intake were taken from only the back of the hand and the back. As a control the test persons came one additional day where measurements were repeated, but this time without drinking alcohol or coffee. The second, parallel study included people aged 65 to 80 years. Here NIR and skin impedance measurements were taken from nine women and nine men, prior to and after drinking 250 ml of strong brewed coffee on one occasion only. Measurements were repeated twice, at 15 and 30 minutes after intake. The second study gave a relatively small NIRIMP-data set of 54 objects and 2383 variables after averaging of replicates since only measurements taken from the back of the hand were included.
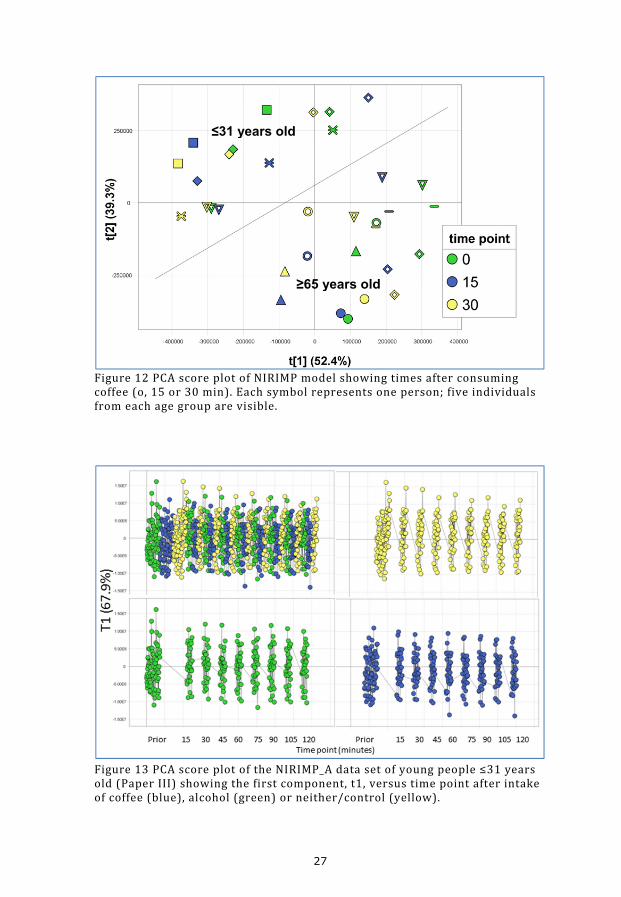
To compare results of the two studies with respect to age differences, the data from the back of the hand measurements in the coffee-part of the first study and the back of hand measurements in the second study were combined. This gave an NIRIMP data set with 99 objects and 2383 variables. Generally there was no significant difference between the outcomes of the two studies, although there was a clear separation of the two age groups (Figure 12). SVs were calculated from the first three components in a PCA model (R2X values for these components were 0.52, 0.39 and 0.04, respectively) showing that there was no significant difference in reproducibility of measurements between the two age groups after coffee intake. Nor was there a significant difference between the distances “prior – 15 min” and “prior – 30 min” of the two age groups in a PCA score plot (Figure 12).
27
Figure12PCAscoreplotofNIRIMPmodelshowingtimesafterconsumingcoffee(o,15or30min).Eachsymbolrepresentsoneperson;fiveindividualsfromeachagegrouparevisible.
Figure13PCAscoreplotoftheNIRIMP_Adatasetofyoungpeople≤31yearsold(PaperIII)showingthefirstcomponent,t1,versustimepointafterintakeofcoffee(blue),alcohol(green)orneither/control(yellow).
≤31 years old
≥65 years old

28
The first of these studies, described in Paper III, gave no indications of differences in variations of score values; neither before vs. after drinking coffee or alcohol, nor between the different treatments, i.e. alcohol consumption, coffee consumption, and control (Figure 13). The spread of the score values in the first component was the same for all time points, regardless of treatment. This is also valid for the following components in the PCA model of the NIRIMP_A data set (Paper III). A shift of the score values for any time point compared with the controls would indicate an effect on skin characteristics due to the intake of coffee or alcohol. However, no such shift was detected.
Minor effects of both coffee and alcohol could be seen 15 minutes after intake when comparing the arithmetic distances between time points before and after intake. After 30 minutes this effect had disappeared (Paper III).
5.2.3 Differences in measurements over time, or due to season
In a longitudinal DNS-study, every three to four months for nearly two years NIR and impedance measurements were made of five DN and healthy reference skin of each of five patients diagnosed with dysplastic naevi syndrome (DNS). This resulted in two data sets: NIRIMP_DNS1 and NIRIMP_DNS2 (Paper III). The NIRIMP_DNS1 data set includes measurements for all patients while the NIRIMP_DNS2 data set includes measurements on Patient B solely.
In Study III intra-individual shifts were observed in measurements acquired on three different days. Day to day differences were also seen for the DNS patients. However, the repeated DN measurements remained constant over time (Figure 14a, and Paper III). Since these patients came to the clinic every three to four months the intra-individual shifts were thought to be due to seasonal changes. However, no effect of season was detected in either a PCA or a PLS-DA model (Figure 14b). The grouping of scores, seen in Figure 14b, was due to intra-individual differences at the measurement occasions rather than differences in environmental conditions at those occasions. The explained variation of a PLS-DA model with “season” as discriminant variable was just 0.07, showing it to have negligible predictive power.
29
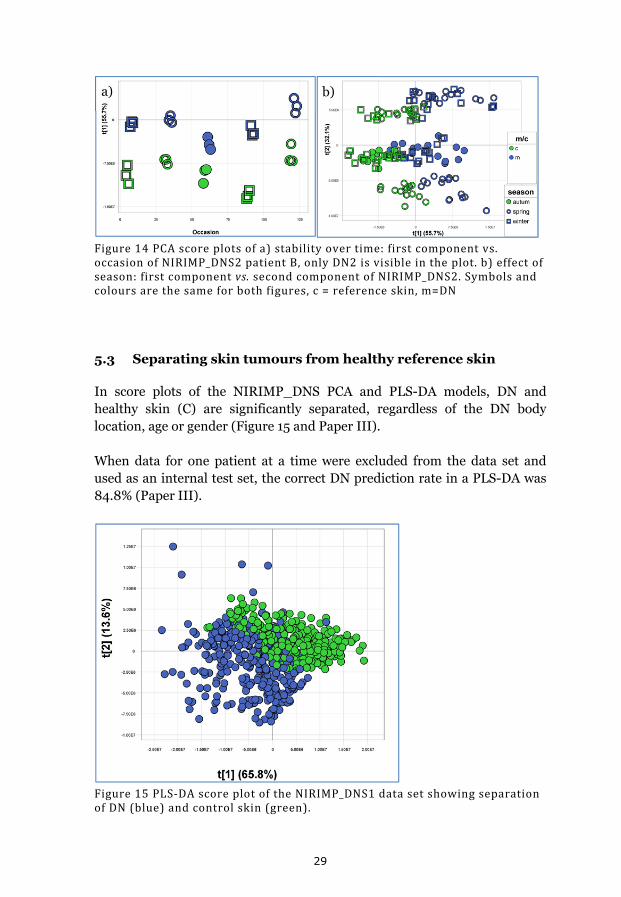
Figure14PCAscoreplotsofa)stabilityovertime:firstcomponentvs.occasionofNIRIMP_DNS2patientB,onlyDN2isvisibleintheplot.b)effectofseason:firstcomponentvs.secondcomponentofNIRIMP_DNS2.Symbolsandcoloursarethesameforbothfigures,c=referenceskin,m=DN
5.3 Separating skin tumours from healthy reference skin
In score plots of the NIRIMP_DNS PCA and PLS-DA models, DN and healthy skin (C) are significantly separated, regardless of the DN body location, age or gender (Figure 15 and Paper III).
When data for one patient at a time were excluded from the data set and used as an internal test set, the correct DN prediction rate in a PLS-DA was 84.8% (Paper III).
Figure15PLS‐DAscoreplotoftheNIRIMP_DNS1datasetshowingseparationofDN(blue)andcontrolskin(green).
a) b)
30
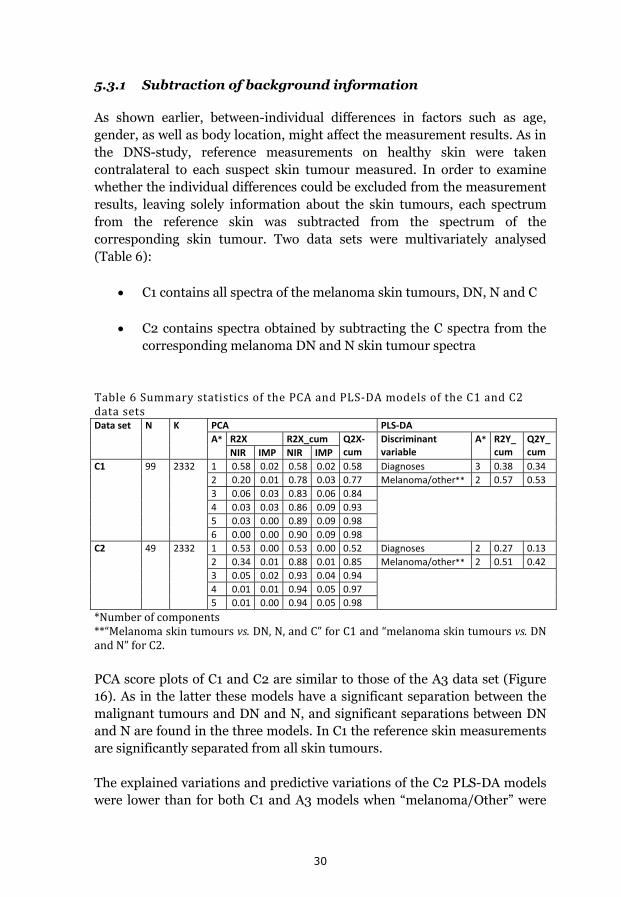
5.3.1 Subtraction of background information
As shown earlier, between-individual differences in factors such as age, gender, as well as body location, might affect the measurement results. As in the DNS-study, reference measurements on healthy skin were taken contralateral to each suspect skin tumour measured. In order to examine whether the individual differences could be excluded from the measurement results, leaving solely information about the skin tumours, each spectrum from the reference skin was subtracted from the spectrum of the corresponding skin tumour. Two data sets were multivariately analysed (Table 6):
C1 contains all spectra of the melanoma skin tumours, DN, N and C
C2 contains spectra obtained by subtracting the C spectra from the corresponding melanoma DN and N skin tumour spectra
Table6SummarystatisticsofthePCAandPLS‐DAmodelsoftheC1andC2datasetsData set N K PCA PLS‐DA
A* R2X R2X_cum Q2X‐cum
Discriminantvariable
A* R2Y_cum
Q2Y_cum NIR IMP NIR IMP
C1 99 2332 1 0.58 0.02 0.58 0.02 0.58 Diagnoses 3 0.38 0.34
2 0.20 0.01 0.78 0.03 0.77 Melanoma/other** 2 0.57 0.53
3 0.06 0.03 0.83 0.06 0.84
4 0.03 0.03 0.86 0.09 0.93
5 0.03 0.00 0.89 0.09 0.98
6 0.00 0.00 0.90 0.09 0.98
C2 49 2332 1 0.53 0.00 0.53 0.00 0.52 Diagnoses 2 0.27 0.13
2 0.34 0.01 0.88 0.01 0.85 Melanoma/other** 2 0.51 0.42
3 0.05 0.02 0.93 0.04 0.94
4 0.01 0.01 0.94 0.05 0.97
5 0.01 0.00 0.94 0.05 0.98
*Numberofcomponents**“Melanomaskintumoursvs.DN,N,andC”forC1and“melanomaskintumoursvs.DNandN”forC2.
PCA score plots of C1 and C2 are similar to those of the A3 data set (Figure 16). As in the latter these models have a significant separation between the malignant tumours and DN and N, and significant separations between DN and N are found in the three models. In C1 the reference skin measurements are significantly separated from all skin tumours.
The explained variations and predictive variations of the C2 PLS-DA models were lower than for both C1 and A3 models when “melanoma/Other” were

31
set as discriminant variables (Table 3 and Table 6) In addition, the C2 model showed lower sensitivity to melanoma skin tumours; 45%, compared to 75% and 67% for the A3 and C1 models, respectively. The specificity for all three models was 100%. If the calculated Y cut-off value was raised to 0.67, instead of 0.5, the sensitivity to melanoma became the same for all three data sets, 83%, while the specificity became marginally higher, 97%, for the C1 and C2 models compared with 95% for the A3 model.
Figure16a)PCAscoreplotofC1withb)correspondingloadingplot.c)PCAscoreplotofC2withd)correspondingloadingplot
5.4 Combining NIR and impedance spectroscopic data
In Study I we found that there was less overlap between groups of body locations in a PLS-DA score space of the combined NIRIMP model than in corresponding plots of the separate impedance and NIR models (Figure 17). Thus, the classification capacity, using simple manual planar discriminant analysis, was improved from 88% to 93% correct classification when combining the two techniques.
a) b)
c) d)

32
Figure17Three‐dimensionalscoreplotsofPLS‐DAmodelsforthea)IMPredmodel,b)NIRredmodelandc)combinedNIRIMPredmodel.Eachcolourrepresentsmeasurementsfromaspecificbodylocation:backofthehand(green),innerupperarm(darkblue),back(yellow),calf(lightblue),cheek(purple).d)loadingplotoftheNIRIMPredPLS‐DAmodel.
Data for each person (one at a time) in the study were excluded from the data sets, used as a test set for the PLS-DA models, and the predictability of body locations was found to be improved by combining the impedance (IMPred) and NIRred data sets. (Paper I and Table 5).
Table7PLS‐DA‐predictedBodylocationsintheNIRIMPredandNIRreddatasets. Body location hand arm back calf cheek All
No. predicted 40 39 40 39 39 197
NIRIMP No. correct pred 39 30 33 11 30 143
% correct pred 98 77 83 28 77 73
NIR No. correct pred 38 34 35 2 33 142
% correct pred 95 87 88 5 85 72
a) b)
c) d)

33
Most PLS-DA models of the combined NIRIMP-data sets mentioned in this thesis had higher explained variation (R2Y_cum) and predicted variation (Q2Y_cum) values than the non-combined NIR and IMP data sets. As examples, summary statistics of the NIRIMP C1, NIR C1 and impedance C1 PLS-DA models are shown Table 8. The discriminant variable for these PLS-DA models was “Melanoma skin tumours vs. DN, N and C”. Further, in cases where the R2Y_cum of the combined (NIRIMP) PLS-DA model was not higher than those of the non-combined NIR or impedance models, it still yielded higher classification rates. An example is the NIRmIMPm model presented in Paper I.
Table8SummarystatisticsofPLS‐DAmodelswith“Melanomaskintumoursvs.benignskintumours(DN,NandC)”asthediscriminantvariableData set No. components R2Y_cum Q2Y_cum N K
C1 (NIRIMP) 2 0.57 0.53 99 2332
IMP C1 2 0.29 0.19 99 51
NIR C1 2 0.49 0.46 99 2281

34
6 Discussion
This thesis is based on investigations of the feasibility and utility of combining NIR and skin impedance spectroscopy techniques for in vivo, non-invasive measurements on human skin to diagnose disorders such as skin cancer. In this section the first discussion is about the analytical techniques and methods applied, the second on ways in which they can be used to diagnose skin tumours, and potentially confounding factors that may affect the measurement results. Finally, the challenges associated with the “Black Box” nature of the techniques are discussed.
6.1 Measurement techniques and methods
Development of an instrument for clinical use is a challenging task. Not only must the theory behind the instrument be accurate, but the instrument itself has to be manageable and the results it provides have to be easy to interpret. Basically, the results should be reliable whoever uses the instrument.
In attempts to fulfil these requirements, a probe head for simultaneous NIR and skin impedance measurements was developed by our group (Paper II and (41)). This novel probe head enabled us to perform simultaneous measurements at precisely the same spots on subjects’ skin. A vacuum pump connected to the probe provided constant pressure against the skin during all measurements. It also ensured close contact with the skin, even if the probe was tilted during measurements. Several parameters such as soaking time and temperature, pressure, winding of the fibre optic cables and tilting of the probe were tested (data not shown) and a standardised measurement method was recommended in Paper II.
Spectroscopic data often contain a lot of noise and systematic disorders. In order to deal with the noise and to improve multivariate models based on the data, genetic algorithms (56) or orthogonal projections to latent structures (OPLS) (57) or many other tricks can be used. All multivariate methods are noise reduction methods. There is, however, a difference between methods for noise reduction, linearization, and easier interpretation of spectral data. Genetic algorithms and spectral transformations (pre-processing techniques) are linearization of data, while OPLS is interpretation. Since we did not know, a priori, the spectroscopic characteristics of skin tumours, and a diagnostic method should be as straightforward as possible, we chose to use PCA and PLS-DA in our investigations, together with a minimum of pre-

35
processing techniques and other noise reduction methods. However, various data pre-processing techniques, such as base-line correction, derivativisation, Multiplicative Scatter Correction, SNV-correction and Savitzky-Golay filtration (42), were tested on the NIR sub-set of the spectra by trial and error. When the pre-processing techniques did enhance the results they were used, but otherwise they were omitted. In the studies presented in this thesis, the only consistently result-improving pre-processing technique tested was SNV-correction. In Study II the NIR spectra were SNV-corrected to diminish the spectral differences between men and women, and thereby enhance the differences between body locations in a PCA score plot. In Study IV no pre-processing was used since neither of the methods tested enhanced the separation between malignant and benign skin tumours. However, the melanoma skin tumour data set then available (and at the time of writing) was relatively small and a robust prediction model for melanoma skin tumours remains to be developed.
6.2 Diagnosing skin tumours
Development of a non-invasive diagnostic method for early, fast and reliable detection of suspect melanoma skin tumours is crucial (13). However, despite numerous attempts, no methods developed as yet have provided adequate sufficient sensitivity and specificity. A trained dermatologist using a dermatoscope generally achieves a correct prediction rate of 93% for melanomas (4). A non-invasive diagnostic method has to be at least as good as a trained dermatologist for practical application in melanoma diagnostics. Notably, McIntosh and co-workers presented a NIR method that reportedly provided 72% specificity and 92% sensitivity for malignant lesions (29), while using impedance spectrometry Åberg and co-workers achieved a reported sensitivity for malignant melanoma of 95%, although the observed specificity was only 49% (23). By using our combined NIR and skin impedance instrument and methods we obtained a sensitivity of 83% and a specificity of 95% for differentiating between melanoma and benign skin tumours.
In the present study 12 melanoma skin tumours were included (Paper IV). Two of these, the melanoma skin tumours from patients 05 and 64, were characterised by our methods as DN rather than as a melanoma. The melanoma skin tumour of patient 05 was the largest of all, with a diameter of 30 mm. It was also the thinnest of all of the melanoma skin tumours. Large parts of this melanoma had a more dysplastic than melanomic character and it is very likely that measurements were made over such a part of the

36
melanoma. False negatives are unacceptable but difficult to avoid. However, false negatives due to erroneous measurements could be avoided by, for instance, performing several measurements at different locations of large melanomas. If one of the measurements, after averaging replicates, indicates malignancy the lesion should be considered as a melanoma skin tumour.
Adding more melanoma skin tumour, DN, and N measurements to the model, in the same proportions as those currently included, i.e. 3:4:4, would probably improve its predictions and sensitivity for malignancy. Indeed, a partial PLS-DA model (with excluded objects evenly spread in the model for seven rounds) had somewhat lower power than another with twice as many objects classified as “reference skin or benign lesion”, showing that the larger data set provided higher power for discriminating between malignant and benign skin tumours/reference skin. The reference skin or benign skin tumours measurements are key determinants of the model’s accuracy, explaining why increases in their number improve its prediction ability. However, following one-by-one exclusion of the observations from the modelling and their subsequent prediction, the PLS-DA model for the smaller data set became more sensitive to malignancy than that of the larger data set with more reference/benign lesions. Thus, the proportion of melanoma skin tumour/DN/N might also be of importance for prediction models.
We initially hypothesized that ulcerated melanoma skin tumours would be outliers in the multivariate models, since they have a broken stratum corneum, which we expected to affect the NIR light scattering and the impedance measurement circuits. However, this was not the case. Neither did the ulcerated melanoma skin tumours group together in a PCA score plot. Melanoma skin tumours are categorised by depth (Breslow depth) and level of anatomical invasion (Clark level); higher values of either give a poorer prognosis for the skin cancer. Both the depth of the cancer in the skin and the anatomical invasion are factors that could potentially affect NIR or impedance spectra, and could thus theoretically be discerned in a score plot. Considering 12 melanoma skin tumours, as we have in our study, it is always possible to find grouping due to shared classes of Clark level, Breslow depth, ulceration or other variables in a score plot, especially when turning and twisting data in a 3D score plot. It is therefore irrelevant to search for such tendencies in our present data set. A larger data set would give higher statistical accuracy.
37
6.3 Individual differences have little or no impact on the spectra of diseased skin
Results presented in Papers III and IV clearly show that body location and between-individual differences in age and gender have very little or no impact on the spectra of diseased skin. In the analysis presented in Paper III we obtained 84.4% correct classification of DN versus healthy reference skin. Given the heterogeneity of the data set this should be considered a good outcome.
Neither the separation between measurement scores for malignant skin tumours and benign lesions in a PCA score plot, nor the model’s predictive ability for malignant tumours was improved by subtracting spectra of reference skin from the spectra of diseased skin. This was somewhat surprising, but shows that the individual differences considered have little effect on the spectral measurements of diseased skin. We detected differences in spectral characteristics of the skin between individuals, but the information from a skin lesion clearly has greater weight in the modelling than the individual characteristics.
Minor day to day shifts in the data acquired from measurements on the skin of subjects who participated on more than occasion were observed. The reason for these small shifts can only be speculative, but a possibility is that they were due to changes in irrelevant variables, such as normal fluctuations in body temperature or general health.
Taken together, these findings indicate that it would be possible to develop a robust model for diagnosing skin tumours without considering the body location of the skin tumour or individual differences.
6.3.1 Skin characteristics related to body location, age, gender, coffee or alcohol intake, and time
Measurements on three groups of individuals were tested to assess the ability of our methodology to differentiate spectral characteristics of skin related to body location, age or gender. Clearly, the predictive ability of any model in these respects is dependent on the homogeneity of the analysed data set (the more homogeneous the data set, the more information about individuals it will provide). Accordingly, the most heterogeneous data set appeared to contain little readily extractable information related to body location or subjects’ age and gender. Further, clearer grouping of body

38
locations and separation of the groups can be seen in a PCA score plot for a data set with only young women than in a similar plot for a data set including both men and women of two age groups. Nevertheless, the facts that there are significant differences between people ≥65 years old and ≤31 years old in a PCA score plot of a highly heterogeneous data set, and that the incidence of MM increases with age, should be taken into consideration when developing a diagnostic method for melanoma. The predictive ability of a diagnostic model depends on the objects in the model. It is very likely that the majority of the melanomas building the model will come from individuals ≥65 years old which then will direct the locations of the melanoma measurements in a score space. Therefore, a MM on a young person might have a higher probability of a false negative diagnosis since the measurement will locate differently in a score space, compared to measurements on the MMs building the model, if age is not accounted for.
In order to mimic a real diagnostic situation, in which a patient may come to the clinic for an examination of her/his moles and has a cup of coffee or a glass of wine or a beer before the examination, we let a group of test participants drink coffee and alcohol prior to measurements. These measurements were then compared to measurements performed before drinking. Only the volume of coffee and alcohol consumed was controlled, not the relative blood content of alcohol or caffeine. In a real situation a person drinks “a cup of coffee” and the volume is independent of gender, age or body mass index of the person. If a general effect of coffee and alcohol could be seen we should have to ask patients coming for diagnostics to not drink coffee or alcohol before the examination. However, although the alcohol content in the body is measureable using NIR spectroscopic methods (31), we did not detect any reliable changes in the skin’s spectral characteristics related to an acute intake of either alcohol or coffee. We did observe minor effects of drinking these substances after 15 minutes, but they were probably due to a rise in blood flow or the participant moving around for a while before measurements.
Since skin characteristics change with age due to changes, inter alia, in the skin’s barrier function (58, 59), and basal metabolism (60), we tested for differences in the reproducibility of measurements of subjects of two age groups (≥65 and ≤31 years old) after coffee intake. Whether they drank coffee or not, both tested age groups had the same measurement reproducibility, based on estimation of scatter values as described in Paper I.
We found that seasonal changes and long-time intervals did not affect the measurement results, which is important since measurement stability over time is crucial for longitudinal controls of DN on patients diagnosed with

39
DNS. These patients have multiple DN all over the body and each of these DN has a 10% risk of developing into a MM. This means that almost every person diagnosed with DNS will suffer from MM at some time during his/her life. Using our technique it is possible to monitor each DN on a regular basis to detect when a DN develops into a MM. At present, patients diagnosed with DNS have regular check-ups at clinics with trained dermatologists. A trained dermatologist has >95% sensitivity for MM, but often not all DN are examined because of time constraints. With our instrument more DN could be examined at each occasion and the examination could be performed by any trained nursing staff at a health facility.
6.4 Combining NIR and impedance spectroscopic data
As stated earlier in this thesis several attempts have been made to find a non-invasive method for diagnosing skin disorders or for characterising skin in vivo. However, there have been no previous attempts to combine two already successful methods. By combining the NIR and skin impedance techniques it is possible to gather more information about the skin condition than when using only one of the techniques. NIR and skin impedance measures different features in the tissue, in our case skin. After performing a measurement the received NIR and skin impedance spectra are weighted to the same variance and combined to one spectrum. The information received from both techniques will thereby equally contribute to the analysis model. Different parts of the spectrum give information of different features of the tissue characteristics. This means that depending on the physiological structures different variables in the analysis model will contribute more to the explained variation (expressed as R2X in PCA models) than other and thereby have more impact on how objects group/separate in a score space. As can be seen in the tables summarising the PCA models, NIR and skin impedance give different contributions to the explained variation of the various components of the analysis model. In the case of melanoma diagnostics in the first component skin impedance has high leverage on the model while in the second component NIR has the highest leverage (Paper IV). Thus, both techniques provide information about skin characteristics, and combining the measurement results of the two techniques improves the resulting diagnostic models. Which technique has the highest leverage in which component, and how a synergy effect is achieved, depends on the tissue measured. Some of the features measured by each technique are discussed in the next section.

40
However, there are other and maybe more successful methods to weight the NIR and skin impedance data sets together. By giving them the same variance the impedance data might have stronger leverage on the first principal component since there are less skin impedance frequencies than NIR wavenumbers in the respective spectra. This can be further investigated in future studies.
6.5 The challenge of the Black Box
It is crucial to understand the molecular and histological aspects behind the spectra of NIR and skin impedance measurements. It is convenient to interpret obtained data by correlating them to known values, such as a pathologic diagnosis. An adequate training set, or the use of different algorithms, would probably give satisfactory results for the prediction of unknown skin tumours. However, wrongly chosen variables might give distorted results as the training set grows over time. This can be avoided by choosing only the variables important for distinguishing melanoma skin tumours from benign tumours.
A clear gradient related to skin thickness can be seen in the score plots presented in Figure 5 of Paper I. Since the skin layers differ throughout the body the skin characteristics also differ. When comparing skin thickness in multivariate models of more heterogeneous data acquired from measurements of subjects of both genders with a wide age span, no gradients related to skin thickness were detected. In this case many more body locations were represented, each assigned a number from 1 to 5, where 1 indicates very thin skin (<3 mm) and 5 indicates very thick skin, such as on the sole of the foot.
To assess how much information the NIR and impedance techniques provide, we calculated their respective contributions to the amount of explained variation, expressed in R2X, of each significant component of the PCA models. The loading line plots reveal more precisely the parts of the spectra that provide the most important information. When considering the melanoma skin tumour data we see that most of the information in the first component comes from impedance (Paper IV), and the loading plot reveals that the lower frequencies of the impedance spectra give most weight to the model. This is consistent with expectations, since the skin is assumed to act as a component of an ideal RC circuit during the impedance measurements, and the impedance is assumed to be unity at high frequencies, regardless of the measured object. Paper II also shows that most information from the

41
impedance measurements originates from the lower frequencies. This part of the impedance spectra is dominated by the α-dispersion, which provides information about the extracellular ionic polarisation of the cells. Thus, the ionic movements in the extracellular matrix differ in some respect among the different melanoma skin tumours. The precise nature of these differences should be investigated in the future. However, there are differences in the extracellular matrix in a cancerous tumour compared to a corresponding healthy tissue. These differences are different angiogenic factors and matrix metalloproteinases to mention a few (61, 62).
In order to identify the specific skin characteristics that most strongly influence NIR spectra, loading plots or loading line plots can be analysed. The literature reports that at higher wavenumbers, 14700 cm-1 to 9090 cm-1, oxyhemoglobin, deoxyhemoglobin, myoglobin (the heme proteins) and cytochromes contribute most strongly to the NIR spectra. The absorption of these compounds is indicative of regional blood flow and oxygen consumption. At lower wavenumbers, 9090 cm-1 to 4000 cm-1, the absorption results largely from overtones and combination bands of C-H, N-H and O-H groups. This gives information on tissue composition, e.g. lipid, protein and water contents (27, 42). Generally, NIR spectra acquired by our instrument begin at 12793 cm-1. Therefore, most of the information regarding the heme proteins is truncated. In a spectral plot of a data set in which the spectra of the different melanoma skin tumours are averaged, it is clear that the major differences between the melanoma skin tumours are in the higher wavenumber area (Figure 18a). In a loading line plot of the three first components of the corresponding PCA model it seems that all wavenumbers add information to the model. However, the most informative peak is at approximately 7000 cm-1, which corresponds to the first overtone of O-H bonds in water (42) (Figure 18b). The scattering effect of the NIR light also provides information about the different melanoma skin tumours.
Accordingly, application of a scattering reducing pre-processing technique, such as SNV-correction, to the spectra reduces the separation of malignant and benign skin tumours in the PCA model. Differences in the scattering of NIR light are due to surface differences of the measured media, and different skin tumours such as AKs have markedly specific surfaces compared to other skin tumours (10). A skin tumour that has become ulcerated also has a different surface. Thus, the scattering of NIR radiation should not be neglected.
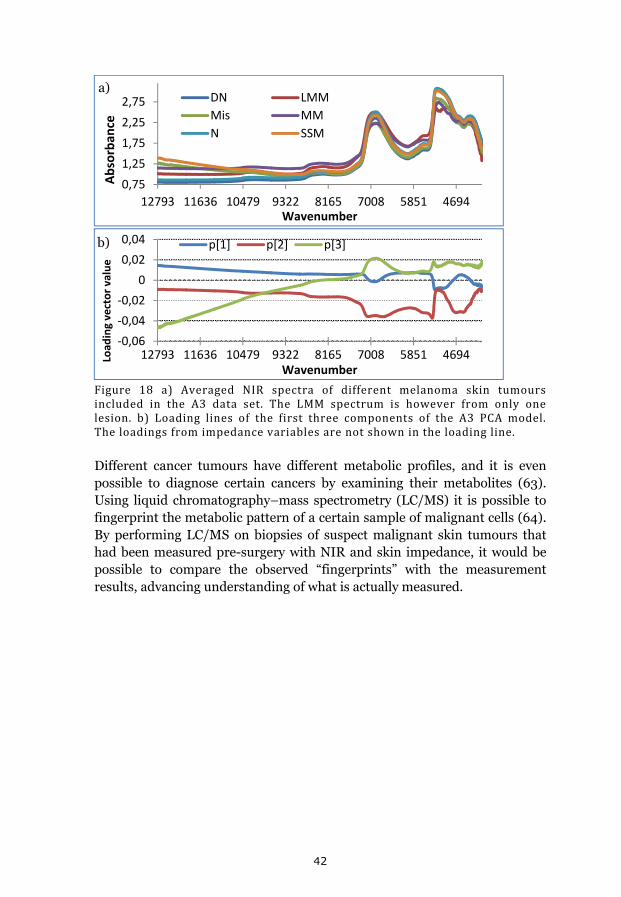
42
Figure 18 a) Averaged NIR spectra of different melanoma skin tumoursincluded in the A3 data set. The LMM spectrum is however from only onelesion. b) Loading lines of the first three components of the A3 PCA model.Theloadingsfromimpedancevariablesarenotshownintheloadingline.
Different cancer tumours have different metabolic profiles, and it is even possible to diagnose certain cancers by examining their metabolites (63). Using liquid chromatography–mass spectrometry (LC/MS) it is possible to fingerprint the metabolic pattern of a certain sample of malignant cells (64). By performing LC/MS on biopsies of suspect malignant skin tumours that had been measured pre-surgery with NIR and skin impedance, it would be possible to compare the observed “fingerprints” with the measurement results, advancing understanding of what is actually measured.
0,75
1,25
1,75
2,25
2,75
12793 11636 10479 9322 8165 7008 5851 4694
Absorban
ce
Wavenumber
DN LMM
Mis MM
N SSM
‐0,06
‐0,04
‐0,02
0
0,02
0,04
12793 11636 10479 9322 8165 7008 5851 4694Load
ing vector value
Wavenumber
p[1] p[2] p[3]
a)
b)
43
7 Concluding remarks
We have shown that it is possible to differentiate healthy skins at various body locations using impedance and NIR spectroscopy, and demonstrated the added value of combining the two methods.
Scatter values (SVs) and intra-model distances have been introduced. By analysing scatter values we have compared the reproducibility of different measurement techniques, and estimated the statistical significance of separations of overlapping groups of measurement scores in score plots by analysing intra-model distances.
A new combined probe head for simultaneous NIR and impedance measurements has been introduced and a measurement protocol developed. Our measurement methods are not sensitive to acute coffee or alcohol-related effects on skin characteristics, and our instrument provides measurements that are stable over time.
Combined NIR and skin impedance spectroscopy of skin, in vivo, measurements appears to be a highly promising tool for diagnosing malignant skin tumours. Our instrument and method provide 83% sensitivity and 95% specificity for malignant skin tumours.

44
8 References
1. Waller JM, Maibach HI. Age and skin structure and function, a quantitative approach (I): blood flow, pH, thickness, and ultrasound echogenicity. Skin Res Technol. 2005: 11(4): 221-35.
2. Madison KC. Barrier function of the skin: "la raison d'etre" of the epidermis. J Invest Dermatol. 2003: 121(2): 231-41.
3. So P-L. Skin Cancer. Bozzone DM, editor. New York: Infobase Publishing, inc.; 2008.
4. Helfand M, Mahon SM, Eden KB, Frame PS, Orleans CT. Screening for skin cancer. Am J Prev Med. 2001: 20(3 Suppl): 47-58.
5. Markovic SN, Erickson LA, Rao RD, Weenig RH, Pockaj BA, Bardia A, et al. Malignant melanoma in the 21st century, part 2: staging, prognosis, and treatment. Mayo Clin Proc. 2007: 82(4): 490-513.
6. Garbe C, Eigentler TK. Diagnosis and treatment of cutaneous melanoma: state of the art 2006. Melanoma Res. 2007: 17(2): 117-27.
7. Netscher DT, Leong M, Orengo I, Yang D, Berg C, Krishnan B. Cutaneous malignancies: melanoma and nonmelanoma types. Plast Reconstr Surg. 2011: 127(3): 37e-56e.
8. Silva JH, de Sa B, Avila AL, Landman G, Duprat Neto JP. Atypical mole syndrome and dysplastic nevi: identification of populations at risk for developing melanoma - review article. Clinics (Sao Paulo). 2011: 66(3): 493-9.
9. Åberg A. Cancer Incidence in Sweden 2009. OFFICIAL STATISTICS OF SWEDEN Statistics – Health and Medical Care. 2010: 1-104.
10. Jeppsson B, Naredi P, Nordenström J, Risberg B. Kirurgi. 3 ed: Studentlitteratur AB, 2010: 931.
11. Balch CM, Gershenwald JE, Soong SJ, Thompson JF, Atkins MB, Byrd DR, et al. Final version of 2009 AJCC melanoma staging and classification. Journal of clinical oncology : official journal of the American Society of Clinical Oncology. 2009: 27(36): 6199-206.
12. Lindholm C, Andersson R, Dufmats M, Hansson J, Ingvar C, Moller T, et al. Invasive cutaneous malignant melanoma in Sweden, 1990-
45
1999. A prospective, population-based study of survival and prognostic factors. Cancer. 2004: 101(9): 2067-78.
13. Halpern AC, Lieb JA. Early melanoma diagnosis: a success story that leaves room for improvement. Curr Opin Oncol. 2007: 19(2): 109-15.
14. Nilsson D, Edlund U, Sjostrom M, Agnemo R. Prediction of thermo mechanical pulp brightness using NIR spectroscopy on wood raw material. Pap Puu-Pap Tim. 2005: 87(2): 102-9.
15. Popova A, Sokolova E, Raicheva S, Christov M. AC and DC study of the temperature effect on mild steel corrosion in acid media in the presence of benzimidazole derivatives. Corrosion Science. 2003: 45(1): 33-58.
16. Nystrom J, Lindholm-Sethson B, Stenberg L, Ollmar S, Eriksson JW, Geladi P. Combined near-infrared spectroscopy and multifrequency bio-impedance investigation of skin alterations in diabetes patients based on multivariate analyses. Med Biol Eng Comput. 2003: 41(3): 324-9.
17. Geladi P, Nystrom J, Eriksson JW, Nilsson A, Lithner F, Lindholm-Sethson B. A multivariate NIR study of skin alterations in diabetic patients as compared to control subjects. J near Infrared Spec. 2000: 8(4): 217-27.
18. Nystrom J, Geladi P, Lindholm-Sethson B, Rattfelt J, Svensk AC, Franzen L. Objective measurements of radiotherapy-induced erythema. Skin Res Technol. 2004: 10(4): 242-50.
19. Nystrom J, Svensk AC, Lindholm-Sethson B, Geladi P, Larson J, Franzen L. Comparison of three instrumental methods for the objective evaluation of radiotherapy induced erythema in breast cancer patients and a study of the effect of skin lotions. Acta Oncol. 2007: 46(7): 893-9.
20. Nystrom J, Geladi P, Lindholm-Sethson B, Larson J, Svensk A-C, Franzen L. Objective measurement of radiation induced erythema by nonparametric hypothesis testing on indices from multivariate data. Chemometr Intell Lab. 2008: 90(1): 43-8.
21. Halter RJ, Schned A, Heaney J, Hartov A, Schutz S, Paulsen KD. Electrical impedance spectroscopy of benign and malignant prostatic tissues. J Urol. 2008: 179(4): 1580-6.

46
22. Har-Shai Y, Glickman YA, Siller G, McLeod R, Topaz M, Howe C, et al. Electrical impedance scanning for melanoma diagnosis: a validation study. Plast Reconstr Surg. 2005: 116(3): 782-90.
23. Aberg P, Birgersson U, Elsner P, Mohr P, Ollmar S. Electrical impedance spectroscopy and the diagnostic accuracy for malignant melanoma. Exp Dermatol. 2011: 20(8): 648-52.
24. Glickman YA, Filo O, David M, Yayon A, Topaz M, Zamir B, et al. Electrical impedance scanning: a new approach to skin cancer diagnosis. Skin Res Technol. 2003: 9(3): 262-8.
25. Egawa M. In vivo simultaneous measurement of urea and water in the human stratum corneum by diffuse-reflectance near-infrared spectroscopy. Skin Res Technol. 2009: 15(2): 195-9.
26. Shuler MS, Reisman WM, Whitesides TE, Kinsey TL, Hammerberg EM, Davila MG, et al. Near-Infrared Spectroscopy in Lower Extremity Trauma. Journal of Bone and Joint Surgery-American Volume. 2009: 91A(6): 1360-8.
27. McIntosh LM, Summers R, Jackson M, Mantsch HH, Mansfield JR, Howlett M, et al. Towards non-invasive screening of skin lesions by near-infrared spectroscopy. J Invest Dermatol. 2001: 116(1): 175-81.
28. McIntosh LM, Jackson M, Mantsch HH, Stranc MF, Pilavdzic D, Crowson AN. Infrared spectra of basal cell carcinomas are distinct from non-tumor-bearing skin components. J Invest Dermatol. 1999: 112(6): 951-6.
29. McIntosh L, Jackson M, Mantsch H, Mansfield J, Crowson A, Toole J. Near-infrared spectroscopy for dermatological applications. Vib Spectrosc. 2002: 28(1): 53-8.
30. Salomatina E, Jiang B, Novak J, Yaroslavsky AN. Optical properties of normal and cancerous human skin in the visible and near-infrared spectral range. J Biomed Opt. 2006: 11(6): 064026.
31. Ridder TD, Hendee SP, Brown CD. Noninvasive alcohol testing using diffuse reflectance near-infrared spectroscopy. Appl Spectrosc. 2005: 59(2): 181-9.
32. Higgins EM, Vivier AWPd. Cutaneous disease and alcohol misuse. Brittish medical bulletin, 1994: 85-98.

47
33. Higgins E, du Vivier A. Alcohol intake and other skin disorders. Clin Dermatol. 1999: 17(4): 437-41.
34. Wolf R, Tuzun B, Tuzun Y. Alcohol ingestion and the cutaneous vasculature. Clin Dermatol. 1999: 17(4): 395-403.
35. Tagliabue A, Terracina D, Cena H, Turconi G, Lanzola E, Montomoli C. Coffee induced thermogenesis and skin temperature. International journal of obesity and related metabolic disorders : journal of the International Association for the Study of Obesity. 1994: 18(8): 537-41.
36. Higdon JV, Frei B. Coffee and health: a review of recent human research. Crit Rev Food Sci Nutr. 2006: 46(2): 101-23.
37. Nawrot P, Jordan S, Eastwood J, Rotstein J, Hugenholtz A, Feeley M. Effects of caffeine on human health. Food Addit Contam A. 2003: 20(1): 1-30.
38. Smits P, Lenders JW, Thien T. Caffeine and theophylline attenuate adenosine-induced vasodilation in humans. Clin Pharmacol Ther. 1990: 48(4): 410-8.
39. Abel EL, Hendrix SO, McNeeley SG, Johnson KC, Rosenberg CA, Mossavar-Rahmani Y, et al. Daily coffee consumption and prevalence of nonmelanoma skin cancer in Caucasian women. European journal of cancer prevention : the official journal of the European Cancer Prevention Organisation. 2007: 16(5): 446-52.
40. Kerzendorfer C, O'Driscoll M. UVB and caffeine: inhibiting the DNA damage response to protect against the adverse effects of UVB. The Journal of investigative dermatology. 2009: 129(7): 1611-3.
41. Forssell E. Development of combination probe for NIR spectroscopy and impedance measurements of the skin. Umeå, Sweden: Department of Physics, Umeå University, 2007: 38.
42. Siesler HW, Ozaki Y, Kawata S, Heise HM. Near-Infrared Spectroscopy Principles, Instruments, Applications. Weinheim: Wiley-VCH verlag GmbH, 2002.
43. Yamamoto T, Yamamoto Y. Electrical-Properties of Epidermal Stratum-Corneum. Medical & Biological Engineering. 1976: 14(2): 151-8.
48
44. Faes TJC, van der Meij HA, de Munck JC, Heethaar RM. The electric resistivity of human tissues (100 Hz-10 MHz): a meta-analysis of review studies. Physiol Meas. 1999: 20(4): R1-R10.
45. Whitehouse C, O'Flanagan R, Lindholm-Sethson B, Movaghar B, Nelson A. Application of electrochemical impedance spectroscopy to the study of dioleoyl phosphatidylcholine monolayers on mercury. Langmuir. 2004: 20(1): 136-44.
46. Lindholm-Sethson B, Nystrom J, Geladi P, Koeppe R, Nelson A, Whitehouse C. Are biosensor arrays in one membrane possible? A combination of multifrequency impedance measurements and chemometrics. Anal Bioanal Chem. 2003: 377(3): 478-85.
47. Miklavčič D, Pavšelj N, Hart FX. Electric Properties of Tissues. Wiley Encyclopedia of Biomedical Engineering: John Wiley & Sons, Inc., 2006.
48. Grimnes S, Martinsen OG. Bioimpedance & Biolelctricity BASICS. London: Academic Press; 2000.
49. Martinsen ØG, Grimnes S. Facts and Myths about Electrical Measurement of Stratum corneum Hydration State. Dermatology. 2001: 202(2): 87-9.
50. Eriksson L, Johansson E, Kettaneh-Wold N, Wold S. Multi- and Megavariate Data Analysis Principles and Applications. Umeå, Sweden: Umetrics AB; 2001.
51. Barnes RJ, Dhanoa MS, Lister SJ. Standard Normal Variate Transformation and De-Trending of near-Infrared Diffuse Reflectance Spectra. Appl Spectrosc. 1989: 43(5): 772-7.
52. Sjostrom M, Wold S, Soderstrom B. PLS discriminant Plots in Pattern Recognition in Practice II. Proceedings of PARC in practice. Amsterdam, Holland: Elsevier Science Publishers B.V., 1986: 461-70.
53. Wold S, Esbensen K, Geladi P. Principal Component Analysis. Chemometr Intell Lab. 1987: 2(1-3): 37-52.
54. Wold S, Sjostrom M, Eriksson L. PLS-regression: a basic tool of chemometrics. Chemometr Intell Lab. 2001: 58(2): 109-30.
55. Nystrom J, Lindholm-Sethson B, Geladi P. NOPAPROD non-parametric testing on projections from multivariate data. Applications to

49
near infrared spectroscopy in clinical studies. J near Infrared Spec. 2009: 17(2): 101-7.
56. Leardi R, Lupiáñez González A. Genetic algorithms applied to feature selection in PLS regression: how and when to use them. Chemometr Intell Lab. 1998: 41(2): 195-207.
57. Trygg J, Wold S. Orthogonal projections to latent structures (O-PLS). J Chemometr. 2002: 16(3): 119-28.
58. Machado M, Hadgraft J, Lane ME. Assessment of the variation of skin barrier function with anatomic site, age, gender and ethnicity. Int J Cosmet Sci. 2010.
59. Roskos KV, Guy RH. Assessment of Skin Barrier Function Using Trans-Epidermal Water-Loss - Effect of Age. Pharm Res. 1989: 6(11): 949-53.
60. Henry CJK. Mechanisms of changes in basal metabolism during ageing. Eur J Clin Nutr. 2000: 54: S77-S91.
61. Kerkelä E, Saarialho-Kere U. Matrix metalloproteinases in tumor progression: focus on basal and squamous cell skin cancer. Exp Dermatol. 2003: 12(2): 109-25.
62. Bodén I. The roles of the plasminogen activator and matrix metalloproteinase systems in ovulation and corpus luteum formation [Licentiate thesis]. Umeå: Umeå University; 2004.
63. Griffin JL, Shockcor JP. Metabolic profiles of cancer cells. Nat Rev Cancer. 2004: 4(7): 551-61.
64. Stolt R, Torgrip RJO, Lindberg J, Csenki L, Kolmert J, Schuppe-Koistinen I, et al. Second-order peak detection for multicomponent high-resolution LC/MS data. Anal Chem. 2006: 78(4): 975-83.

50
9 Acknowledgements
In times of closure and renewal I now want to take this opportunity to than all the people that crossed my way during my time as PhD student.
I specially want to thank:
My three supervisors: Peter Naredi, Britta Lindholm-Sethson and Paul Geladi. Thanks for all the support and for believing in me! When you took me in, I didn´t know that there were any “good guys” left. I´m so happy you proved me wrong.
David Nilsson and William Larsson, you two are the best! Thank you for having so much patience with my questions and for all the practical as well as intellectual help I have got from you.
Josefina Nyström, without you there was nothing! Thank you for listening to my complains, for pointing out the directions when I was lost and for making sure that I´ll keep up with the latest in economics, politics, rosti bowls, and in “true blood”! Our story is not over yet, it has just begun!!
Maria Bergman, Erik Forssell, Camilla Wikström and Mea Sethson for working in the project with me and for making my days at the university even more interesting!
Virginia Zazo and Bertil Lundskog, thank you for a good cooperation in the melanoma project! Vera Horova and Anders Nilsson and all of you other doctors who helped me recruit patients to my studies.
Anna Lundgren, Katarina Westerlund and Marjo Andersson and everyone else at the surgery department. Marjo, thanks for helping me with measurements, good luck in the future.
Siri Bäckström and all other personnel at “hud- och STD-mottagningen”. Thank you for making me feel “at home” working with you.
Everyone at the department of chemistry, especially you people in the part of the department former known as “biofysikalisk kemi” and at the part former known as “Biokemi”. None mentioned and none forgotten. Thanks for all the interesting discussions in the lunchroom, and for all the fikas. Good luck to all of you, I wish you all the very best in the future!

51
Tack min stora och brokiga familj för allt stöd under de här åren. Mamma, pappa, Sara, David, Fredrik, Lydiah, Sandra, Isabell, Ingela, Svante, Ann-Jeanette, Jessica, Ann, Erik, Daniel, Desireé, Lukas, Samuel, Axel, Signe, Thilda, Lilly, Liv, Sara, Stefan, Magnus och Bibban.
Mina älskade barn Felix, Ellen, Annie och Algot. Tack vare er lyser solen, tindrar stjärnorna och faller regnet. Jag är så tacksam för att få älska er, ni är mitt allt. Tack för att ni finns!
Min make Tobias, tack för att du är här när dagen är slut. Jag vet hur hårt detta varit för dig och jag kommer aldrig att kunna visa dig rättmätigt den tacksamhet jag känner för det du gjort för oss. Jag älskar dig.

52
Papers I-IV