Near-Infrared Analysis and Process Control of ...
219
Duquesne University Duquesne Scholarship Collection Electronic eses and Dissertations Fall 2009 Near-Infrared Analysis and Process Control of Pharmaceutical Pelletization Processes David J. Wargo Follow this and additional works at: hps://dsc.duq.edu/etd is Immediate Access is brought to you for free and open access by Duquesne Scholarship Collection. It has been accepted for inclusion in Electronic eses and Dissertations by an authorized administrator of Duquesne Scholarship Collection. For more information, please contact [email protected]. Recommended Citation Wargo, D. (2009). Near-Infrared Analysis and Process Control of Pharmaceutical Pelletization Processes (Doctoral dissertation, Duquesne University). Retrieved from hps://dsc.duq.edu/etd/1340
Transcript of Near-Infrared Analysis and Process Control of ...
Duquesne UniversityDuquesne Scholarship Collection
Electronic Theses and Dissertations
Fall 2009
Near-Infrared Analysis and Process Control ofPharmaceutical Pelletization ProcessesDavid J. Wargo
Follow this and additional works at: https://dsc.duq.edu/etd
This Immediate Access is brought to you for free and open access by Duquesne Scholarship Collection. It has been accepted for inclusion in ElectronicTheses and Dissertations by an authorized administrator of Duquesne Scholarship Collection. For more information, please [email protected].
Recommended CitationWargo, D. (2009). Near-Infrared Analysis and Process Control of Pharmaceutical Pelletization Processes (Doctoral dissertation,Duquesne University). Retrieved from https://dsc.duq.edu/etd/1340
NEAR-INFRARED ANALYSIS AND PROCESS CONTROL
OF PHARMACEUTICAL PELLETIZATION PROCESSES
A Dissertation
Submitted to the Graduate School of Pharmaceutical Sciences
Duquesne University
In partial fulfillment of the requirements for
the degree of Doctor of Philosophy
By
David J. Wargo
December 2009

Copyright by
David J. Wargo
2009
iii
NEAR-INFRARED ANALYSIS AND PROCESS CONTROL
OF PHARMACEUTICAL PELLETIZATION PROCESSES
By
David J. Wargo
Approved June 21, 2005 _________________________________ _________________________________ James K. Drennen, III, Ph.D. Lawrence H. Block, Ph.D. Associate Professor of Pharmaceutics Professor of Pharmaceutics Associate Dean for Graduate Programs & Research Graduate School of Pharmaceutical Sciences Mylan School of Pharmacy (Committee Member) (Committee Chair) _________________________________ _________________________________ Carl A. Anderson, Ph.D. Peter Wildfong, Ph.D. Associate Professor of Pharmaceutics Assistant Professor of Pharmaceutics Graduate School of Pharmaceutical Sciences Graduate School of Pharmaceutical Sciences (Committee Member) (Committee Member) _________________________________ _________________________________ Mitchell E. Johnson, Ph.D. David A. Johnson, Ph.D. Associate Professor of Chemistry Director of Graduate Studies Bayer School of Natural & Environmental Associate Professor of Pharmacology-Toxicology Sciences Graduate School of Pharmaceutical Sciences (Committee Member) _________________________________ J. Douglas Bricker, Ph.D. Dean, Mylan School of Pharmacy and the Graduate School of Pharmaceutical Sciences
iv
ABSTRACT
NEAR-INFRARED ANALYSIS AND PROCESS CONTROL
OF PHARMACEUTICAL PELLETIZATION PROCESSES
By
David J. Wargo
December 2009
Dissertation supervised by James K. Drennen, III, Ph.D.
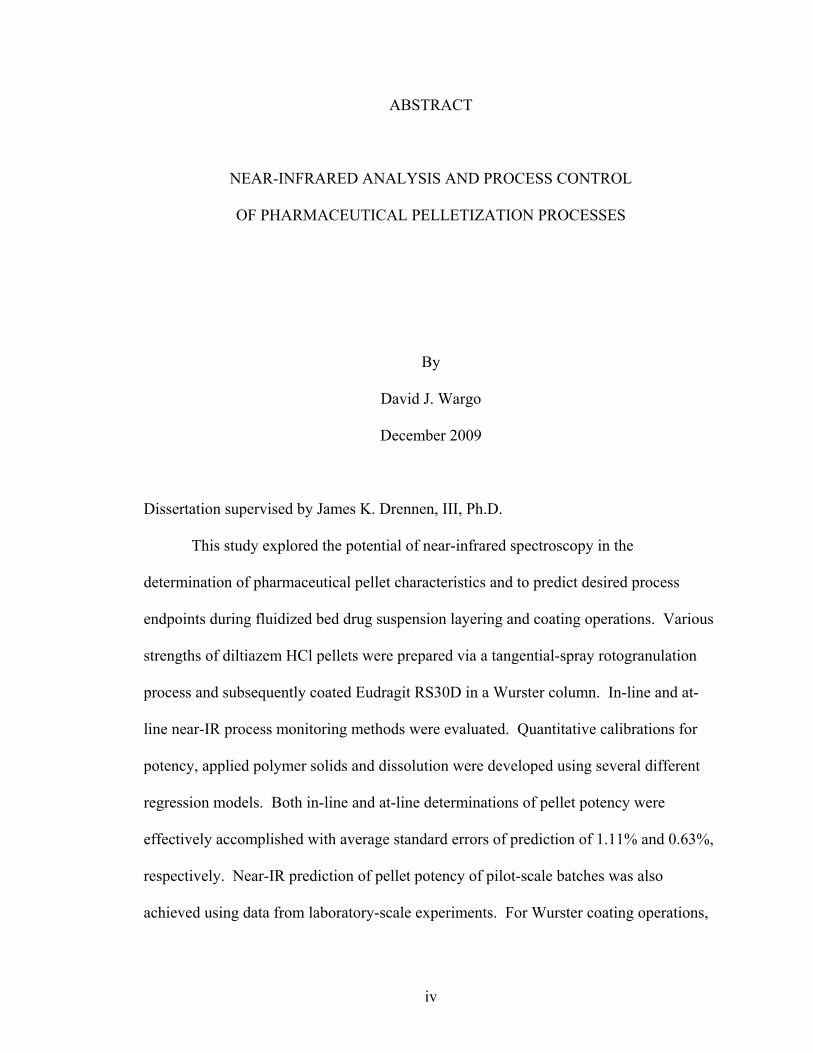
This study explored the potential of near-infrared spectroscopy in the
determination of pharmaceutical pellet characteristics and to predict desired process
endpoints during fluidized bed drug suspension layering and coating operations. Various
strengths of diltiazem HCl pellets were prepared via a tangential-spray rotogranulation
process and subsequently coated Eudragit RS30D in a Wurster column. In-line and at-
line near-IR process monitoring methods were evaluated. Quantitative calibrations for
potency, applied polymer solids and dissolution were developed using several different
regression models. Both in-line and at-line determinations of pellet potency were
effectively accomplished with average standard errors of prediction of 1.11% and 0.63%,
respectively. Near-IR prediction of pellet potency of pilot-scale batches was also
achieved using data from laboratory-scale experiments. For Wurster coating operations,
v
in-line and at-line near-IR regression models for predicting applied polymer solids were
developed which demonstrated R2 values of 0.98 or greater and standard errors of
calibration less than 0.6%. Prediction of a t50% dissolution metric within 7 minutes of
actual values was possible for pellets exhibiting 8 to 12 hour release characteristics.
Qualitative assessment of applied polymer solids was also accomplished using
Mahalanobis distance and bootstrap pattern recognition algorithms. This study has
demonstrated the potential of near-IR spectroscopy in quantitative and qualitative
assessment of pelletized pharmaceutical product characteristics and in the identification
of process endpoints. Future implementation of these techniques could potentially reduce
production cycle-times associated with the acquisition of laboratory test results and
ensure product quality compliance throughout various stages pellet manufacturing.

vi
DEDICATION
To my wife, my parents, and all those who have supported and believed in me

vii
ACKNOWLEDGEMENT
I would like to acknowledge many people for helping me during my doctoral
work. I would especially like to thank my advisor, Jim Drennen, for his generous time,
flexibility, understanding and commitment. Throughout my graduate experience, Jim
encouraged me, stimulated my analytical thinking and provided an excellent atmosphere
for doing research. It has been a great pleasure to develop scientific skills under his
guidance. I would also like to thank Dr. Lawrence Block, Dr. Carl Anderson, Dr. Peter
Wildfong, Dr. Mitch Johnson, Dr. David Johnson, and Dean Douglas Bricker for serving
on my defense committee. Special thanks goes to Dr. Block for many enjoyable and
thought provoking scientific discussions and for long ago instilling in me the desire to
pursue graduate education and an industrial pharmacy career.
I would like to thank Mylan Pharmaceuticals and Merck & Co., both which
provided support for my research efforts at Duquesne and for Mylan’s support while I
completed my dissertation.
I would also like to thank John Kirsch, who, as a good friend and colleague, was
always willing to help and give his best suggestions. It would have been a lonely lab
without him.
I wish to thank my parents who always supported and encouraged me in both
personal and professional endeavors. I am also grateful to my children – Jacob, Natalia,
and Liam – for allowing me many hours of seclusion as I completed this manuscript.
Finally, I would like to thank my wife, Debbie, who has always stood by me through
good times and bad. This would not have been possible without her love and support.

viii
TABLE OF CONTENTS
Page
Abstract .............................................................................................................................. iv Dedication .......................................................................................................................... vi Acknowledgement ............................................................................................................ vii List of Tables ................................................................................................................... xiii List of Figures ....................................................................................................................xv 1 Introduction 1
1.1 Statement of the Problem.........................................................................................1
1.2. Literature Review.....................................................................................................3
1.2.1 Pharmaceutical Pellet Dosage Forms.................................................................3
1.2.1.1 Pellet Rationale ............................................................................................3
1.2.1.2 Pelletization Techniques ..............................................................................4
1.2.1.2.1 Fluid Bed Technology............................................................................5
1.2.1.2.2 Drug Layering ..................................................................................6
1.2.1.2.3 Wurster Coating ..................................................................................8
1.2.2 Process Analytical Technology........................................................................11
1.2.2.1 Process Analytical Chemistry – History and Concepts .............................11
1.2.2.2 Near-infrared Spectroscopy .......................................................................12
1.2.2.2.1 Near-IR Theory ................................................................................13
1.2.2.2.2 Diffuse Reflectance..............................................................................15
1.2.2.3 Chemometrics ............................................................................................17
ix
Page
1.2.2.3.1 Spectral Preprocessing .........................................................................18
1.2.2.3.1.1 Linearization ..................................................................................18
1.2.2.3.1.2 Smoothing ......................................................................................21
1.2.2.3.1.3 Multiplicative Scatter Correction...................................................22
1.2.2.3.1.4 Derivatization.................................................................................23
1.2.2.3.2 Principal Component Analysis ............................................................24
1.2.2.3.3 Quantitative Analysis...........................................................................26
1.2.2.3.3.1 Multiple Linear Regression............................................................29
1.2.2.3.3.2 Principal Component Regression...................................................30
1.2.2.3.3.3 Partial Least Squares Regression ...................................................31
1.2.2.3.4 Qualitative Analysis.............................................................................33
1.2.2.3.4.1 Mahalanobis distance.....................................................................34
1.2.2.3.4.2 Soft Independent Modeling of Class Analogies ............................35 1.2.2.3.4.3 Bootstrap Error-Adjusted Single-sample Technique .....................36
1.2.2.4 Pharmaceutical Applications of Near-Infrared Spectroscopy....................38
1.2.2.4.1 Analysis of Coated Dosage Forms.......................................................40
1.2.2.4.2 Analysis of Pelletized Dosage Forms ..................................................43
1.2.2.4.3 Analysis of Moving Solids ..................................................................44
2 Experimental 48
2.1 Laboratory-scale Rotogranulation .........................................................................48
2.1.1 Materials ..........................................................................................................48 2.1.2 Formulation......................................................................................................48
x
Page 2.1.3 Drug Suspension Layering...............................................................................48 2.1.4 Near-IR Methodology......................................................................................57
2.1.4.1 Instrumentation ..........................................................................................57
2.1.4.2 In-line Spectrometry ..................................................................................59
2.1.4.3 At-line Spectrometry..................................................................................62
2.1.4.4 Spectral Preprocessing ...............................................................................62
2.1.5 Diltiazem HCl Reference Assay ......................................................................63
2.1.6 Quantitative Prediction of Pellet Potency ........................................................64
2.2 Pilot-scale Rotogranulation....................................................................................66
2.2.1 Materials ..........................................................................................................66 2.2.2 Formulation......................................................................................................66 2.2.3 Drug Suspension Layering...............................................................................66 2.2.4 Near-IR Methodology......................................................................................72
2.2.4.1 Instrumentation ..........................................................................................72
2.2.4.2 At-line Spectrometry..................................................................................74
2.2.4.3 Spectral Preprocessing ...............................................................................74
2.2.5 Quantitative Prediction of Pellet Potency ........................................................75
2.3 Laboratory-scale Wurster Coating.........................................................................75
2.3.1 Materials ..........................................................................................................75
2.3.2 Formulation......................................................................................................76
2.3.3 Sustained-release Coating................................................................................76
2.3.4 Near-IR Methodology......................................................................................78
xi
Page
2.3.4.1 Instrumentation ..........................................................................................78
2.3.4.2 In-line Spectrometry ..................................................................................82
2.3.4.3 At-line Spectrometry..................................................................................85
2.3.4.4 Spectral Preprocessing ...............................................................................88
2.3.5 Eudragit RS30D Assay ....................................................................................88
2.3.6 Quantitative Prediction of Eudragit RS30D Coating Level.............................93
2.3.7 Qualitative Prediction of Eudragit RS30D Coating Endpoint .........................93
3 Results and Discussion 95
3.1 Quantitative Prediction of Pellet Potency ..............................................................95
3.1.1 In-line Analysis of Pellet Potency....................................................................98
3.1.1.1 Single and Multiple Wavelength Regression.............................................98
3.1.1.2 Principal Component Regression...............................................................99
3.1.1.3 Partial Least Squares Regression .............................................................105
3.1.1.4 Summary of In-line Regression Model Performance ..............................107
3.1.2 At-line Analysis of Pellet Potency.................................................................111
3.1.2.1 Single and Multiple Wavelength Regression...........................................114
3.1.2.2 Principal Component Regression.............................................................115
3.1.2.3 Partial Least Squares Regression .............................................................120
3.1.2.4 Summary of At-line Regression Model Performance..............................120
3.1.3 Comparison of In-line and At-line Near-IR Methods for Monitoring Drug Layering.............................................................................124
3.1.4 Practical Considerations Regarding Near-IR Monitoring of Drug Suspension Layering.............................................................................135
xii
Page
3.1.5 Pilot Plant Applications .................................................................................139
3.2 Quantitative Prediction of Eudragit RS30D Coating Level.................................143
3.2.1 In-line Analysis of Coated Pellets..................................................................145
3.2.1.1 Single and Multiple Wavelength Regression...........................................147
3.2.1.2 Principal Component Regression.............................................................148
3.2.1.3 Partial Least Squares Regression .............................................................153
3.2.1.4 Summary of In-line Regression Model Performance ..............................153
3.2.2 At-line Analysis of Coated Pellets.................................................................157
3.2.3 Comparison of In-line and At-line Near-IR Methods for Monitoring Wurster Coating..........................................................................157
3.2.4 Prediction of Dissolution of Eudragit RS30D Coated Pellets .......................162
3.3 Qualitative Prediction of Eudragit RS30D Coating Level...................................170
4 Conclusions 179
References........................................................................................................................184
Appendices.......................................................................................................................196
xiii
LIST OF TABLES
Page
1. Diltiazem HCl pellet formulations.........................................................................49
2. Processing parameters for laboratory-scale drug suspension layering ..................51
3. Sampling scheme – Laboratory-scale drug suspension layering ...........................58
4. Pilot-scale diltiazem HCl pellet formulation .........................................................67
5. Processing parameters for pilot-scale drug suspension layering ...........................69
6. Sampling scheme – pilot-scale drug suspension layering......................................73
7. Eudragit® RS30D coating system formulation ......................................................77
8. Processing parameters for laboratory-scale Wurster coating.................................79
9. Sampling scheme – Laboratory-scale Wurster coating .........................................81
10. Principal components of in-line diltiazem HCl drug-layered .............................100
11. Principal component regression results for in-line diltiazem HCl drug-layered pellets..............................................................................................104 12. Partial least squares regression results for in-line analysis of diltiazem HCl drug-layered pellets ......................................................................108 13. Summary of regression results for in-line assessment of pellet potency .............109 14. Principal components of at-line diltiazem HCl drug-layered pellet samples ......116
15. Principal component regression results for at-line analysis of diltiazem HCl drug-layered pellets ......................................................................................119 16. Partial least squares regression results for at-line analysis of diltiazem HCl drug-layered pellets ......................................................................................121 17. Summary of regression results for at-line assessment of pellet potency .............122 18. Comparison of in-line and at-line regression model performance for potency prediction................................................................................................125

xiv
Page 19. Theoretical versus actual pellet potency ..............................................................137 20. Processing parameters for drug suspension layering – Laboratory versus pilot scale .............................................................................................................140 21. Principal components of in-line ERS polymer coating onto diltiazem HCl pellets ...........................................................................................................149 22. Principal component regression results for in-at-line analysis of ERS coated diltiazem HCl pellets........................................................................152 23. Partial least squares regression results for in-line ERS polymer coating onto diltiazem HCl drug-layered pellets .................................................154 24. Summary of regression results for in-line assessment of applied ERS polymer........................................................................................................155 25. Summary of regression results for at-line assessment of applied ERS polymer........................................................................................................158 26. Comparison of in-line and at-line regression model performance for applied ERS polymer coating prediction .......................................................160
xv
LIST OF FIGURES Page
1. The rotor processor ..................................................................................................7 2. The Wurster column ..............................................................................................10 3. Process spray rates, 150mg/g diltiazem pellets......................................................52 4. Process spray rates, 300mg/g diltiazem pellets......................................................53 5. Process spray rates, 550mg/g diltiazem pellets......................................................54 6. Diltiazem HCl pellet particle size distribution via sieve analysis..........................56 7. Fiber-optic sampling system for rotogranulation...................................................60 8. Fiber-optic sampling system for rotogranulation...................................................61 9. Standard curve for diltiazem HCl assay by HPLC ................................................65 10. Pilot-scale process spray rates, 550 mg/g diltiazem HCl pellets ...........................70 11. Pilot-scale 550 mg/g diltiazem HCl pellet particle size distribution via sieve analysis .........................................................................................................71 12. Eudragit rs30d spray rates for 300mg/g diltiazem HCl pellets..............................80 13. Effect of Lexan or sapphire on 30% diltiazem HCl pellets coated with 5%, 10%, & 16% Eudragit RS30D........................................................................83 14. In-line calibration for applied polymer solids – Scanning through Lexan ............84 15. Fiber-optic sampling system for Wurster coating..................................................86
16. Fiber-optic sampling system for Wurster coating..................................................87 17. Chemical structures of tropaeolin OOO and ammonio methacrylate copolymer ..............................................................................................................90 18. Standard curve for Eudragit RS30D assay.............................................................92 19. Near-IR spectra of diltiazem HCl pellets, 150mg/g -- 86% to 106% potency...................................................................................................................96
xvi
Page 20. Primary drug-layered pellet components ...............................................................97 21. Loadings spectrum of in-line 150mg/g diltiazem HCl pellets .............................102 22. Loadings spectrum of in-line 550mg/g diltiazem HCl pellets .............................103 23. Potency calibration and prediction - diltiazem HCl 150mg/g pellets in-line analysis .....................................................................................................112 24. 2nd derivative spectra for 300mg/g pellets - RCA vs. probe sampling ...............113 25. Loadings spectrum of at-line 150mg/g diltiazem HCl pellets .............................117 26. Loadings spectrum of at-line 550mg/g diltiazem HCl pellets .............................118 27. Potency calibration and prediction -- diltiazem HCl 150mg/gpellets at-line analysis .....................................................................................................123 28. Potency calibration across all diltiazem HCl pellet strengths..............................128 29. Principal component plot for 15%, 30%, and 55% diltiazem HCl pellets...........130 30. Principal component scores plot for 55% diltiazem HCl pellets .........................131 31. Comparison of 150mg/g diltiazem HCl pellet spectra – RCA versus Smart Probe sampling ..........................................................................................133 32. PC-1 loadings for 15% diltiazem HCl pellets - Analysis via Smart Probe..........134 33. PC-1 loadings for 15% diltiazem HCl pellets - Analysis via rapid content analyzer ...................................................................................................136 34. Pilot-scale potency prediction using laboratory-scale data..................................142
35. 550mg/g diltiazem pellets -- Coated 6% to 16% applied polymer solids............144
36. 550mg/g Diltiazem Pellets Coated with 6% - 16% polymer solids – Truncated spectral region.....................................................................................146 37. First PC loadings for 16% ERS coated pellets – In-line sampling ......................150 38. Second PC loadings for 16% ERS coated pellets – In-line sampling..................151
xvii
Page 39. Applied polymer solids calibration and prediction – Diltiazem HCl 150mg/g Pellets – In-line Analysis ......................................................................156 40. Coating calibration and prediction -- Diltiazem HCl 150mg/g pellets - At-line analysis.......................................................................................159 41. 150mg/g diltiazem + 16% ERS coat – RCA versus Direct Reflectance probe sampling.....................................................................................................163 42. PC-1 loadings for 15% diltiazem HCl pellets + 16% ERS coat – RCA versus Direct Reflectance probe ..........................................................................164 43. PC-2 loadings for 15% diltiazem HCl pellets + 16% ERS coat – RCA versus Direct Reflectance probe .................................................................165 44. Dissolution profile for Eudragit RS30D coated pellets .......................................167 45. Prediction of t50% diltiazem HCl dissolved for Eudragit RS30D coated diltiazem HCl 550 mg/g pellets ...........................................................................169 46. Qualitative prediction of target applied polymer solids – BEAST versus Mahalanobis distance................................................................................172 47. Qualitative prediction of applied polymer solids using the BEAST algorithm. Target 6% coating level.....................................................................175 48. Qualitative prediction of applied polymer solids using the BEAST algorithm. Target 10% coating level...................................................................176 49. Qualitative prediction of applied polymer solids using the BEAST algorithm. Target 14% coating level...................................................................177
1
1 INTRODUCTION 1.1 Statement of the Problem
Multiparticulate drug delivery systems have become increasingly popular due to
their ability to provide unique release profiles and offer potential clinical benefits. A
variety of pelletization technologies have provided the pharmaceutical scientist with
tremendous flexibility during solid oral multiparticulate dosage form development. Of
the technologies available to produce the particles comprising these systems, layering a
suspension or solution of drug onto a seed material can produce pellets that are spherical
in shape, have a smooth surface, and are uniform in size and size distribution. These
characteristics are especially desirable when the pellets will be subsequently coated to
provide some degree of controlled drug release.
The concentration of drug in the core pellet, and the quantity or thickness of the
functional polymeric coating present on controlled release pellets are both critical factors
affecting the physical integrity of these systems as well as drug release rates.
Unfortunately, controlled release pellet production often involves lengthy and expensive
manufacturing operations in which there are no simple in-process methods for accurately
monitoring drug product potency or the extent of applied coating solids. Typically,
researchers and manufacturing personnel must rely on theoretical determinations of
applied solids to predict drug layering and coating process endpoints. An assay of the
2
pellets is necessary prior to encapsulation to determine the fill weight needed to deliver
the desired dose. Additionally, dissolution testing of the final dosage form is essential to
ensure uniformity of the drug release rate. The development of rapid analytical methods
to evaluate pellet core and coating characteristics may reduce production-cycle time
associated with the acquisition of laboratory test results and allow product quality to be
assessed at various stages of processing prior to completing the manufacture of an entire
batch.
The objective of this research was to develop and evaluate new applications of
near-IR analysis for monitoring and controlling pharmaceutical pellet production
operations, and to investigate the practical limits of the applications described. Both at-
line and in-line near-IR spectroscopic methods for evaluating core and coated pellet
characteristics, and predicting desired process endpoints were investigated. At the core
of this research was the quantitative assessment of core pellet potency and applied
polymer solids during rotor drug layering and Wurster coating operations, respectively.
This includes modification of processing equipment and the application of a method to
permit on-line monitoring of drug layering and polymer film coating processes, as well as
the development of a reference technique for the quantification of an ammonio
methacrylate sustained-release polymer. The ability of pattern recognition methods to
qualitatively predict coating process endpoints was also determined. In addition, this
research evaluated the use of near-IR spectroscopy to nondestructively predict drug
release (dissolution) characteristics of controlled release pellets. Finally, the ability to
utilize laboratory-scale data to assess pellet potency during production scale drug
layering operations was investigated, obviating the need to rely on theoretical
3
determinations of applied drug layering suspension solids for process endpoint
identification.
1.2 Literature Review 1.2.1 Pharmaceutical Pellet Dosage Forms
The term “pellet” has been used to define a number of different types of
manufactured agglomerates. Pellet products are used in many industries, but in the
pharmaceutical industry pellets are generally described as granular or spherical drug
containing entities. Pharmaceutical pellets generally range in size from 0.5 to 1.5 mm in
diameter (1).
1.2.1.1 Pelletization Rationale
Pelletized products offer flexibility in dosage from design and development, and
can be utilized to improve safety and efficacy of bioactive agents. Pellets are attractive as
components of dosage forms or as dosage forms themselves. They can be produced by a
number of methods and can be incorporated into a number of different traditional dosage
forms including capsules (2,3), conventional tablets (4,5), rapidly disintegrating tablets
(6), or suspensions (7). Pellets composed of separate drug entities can be blended and
formulated in a single dosage form either for simultaneous drug delivery or for delivery
to different sites along the gastrointestinal tract. Additionally, combinations of pellets
can be utilized to avoid drug substance incompatibilities. Because of their spherical
4
shape and low surface area to volume characteristics, pellets are excellent substrates for
application of immediate or modified release coatings.
Pellets are also advantageous from an in vivo perspective. Because pellets
disperse freely in the gastrointestinal tract, they provide increased surface area for
dissolution and absorption. When coated with modified-release polymers, pellet systems
can reduce peak plasma fluctuations, and minimize potential side effects without
appreciably lowering bioavailability (8). Pellets also reduce variations in gastric
emptying rates and overall transit times thereby minimizing intra- and inter-subject
variability of plasma profiles as compared to single-unit dosage forms (9,10).
Additionally, because a large number of pellets are administered per dose, the likelihood
of dose dumping is dramatically reduced. If several individual pellets were to fail and
“dump” their drug content, only a minimal effect on the overall release characteristics of
the dosage form would be observed.
1.2.1.2 Pelletization Techniques
Pelletization has been defined as an agglomeration process that converts fine
powders or granules of bulk drugs and excipients into small, free-flowing, spherical or
semi-spherical units, referred to as pellets (8). A number of methods are available for the
manufacture of pellets. The most common pelletization processes used in the
pharmaceutical industry are extrusion/spheronization, solution/suspension layering, and
powder layering (11). Other processes may include spray drying, spray congealing, and
compression of dry powders into spherical compacts. “Balling” is another older process
for pelletization in which dry powders are tumbled in a coating pan or drum with
5
simultaneous application of a binding liquid. In 1949, Smith, Kline & French (SKF)
borrowed a process used in the confectionery industry to make pharmaceutical pellets (1).
This process used sugar granules as seed cores for the application of powders upon which
spherical particles were ultimately built. In the confectionary industry, spherical sugar
seeds manufactured by this process, called nonpareils, are still used as decorative
toppings for candies and pastries. This same procedure was adapted by SKF for the
creation of drug containing pellets. Nonpareils themselves were also used as a starting
core in this earliest drug layering technique, a practice still used today.
1.2.1.2.1 Fluid Bed Technology
Fluid bed technology has been used in the pharmaceutical industry for about forty
years. It was first employed as an efficient drying technique, which was a dramatic
improvement over traditional tray drying. Fluid bed processing now includes drying,
granulation, coating and layering. Although pan and fluid bed technology can both be
used to coat either tablets or pellets, modified pan coating is generally reserved for
tablets, and pellets are almost exclusively processed using fluid bed techniques. The
major advantage of these systems over traditional pan coating is enhanced air flow. In
the past twenty years, few changes have been made to fluid bed technology other than the
introduction of tangential drug layering and coating processes (12-14), and the emergence
of fine particle coating techniques (15-17). Unit shape and geometry has, in some
applications, become more specialized (18,19).

6
1.2.1.2.2 Drug Layering
Application of drug and excipients onto a seed material from a solution or
suspension can produce pellets that are spherical in shape, have a smooth surface, and are
uniform in size and size distribution. This process is similar to traditional coating, in that
it involves the application of a dispersed solid onto a core. The dispersion is atomized
using a nozzle that produces droplets that hit and spread over the surface of the core.
Fluidization air, usually warmer than ambient conditions, aids in evaporation of the
dispersion medium which results in deposition of the solid material.
In recent years, tangential-spray pelletization processes have gained considerable
attention. This technology utilizes a fluid bed equipped with a rotating disc in the bottom
of the fluid bed product container. Originally this technology had been conceived for
high-density fluid bed granulation and is now frequently used to produce high-dose
pellets by layering drugs on nuclei. A controlled release film may be subsequently
applied (12-14).
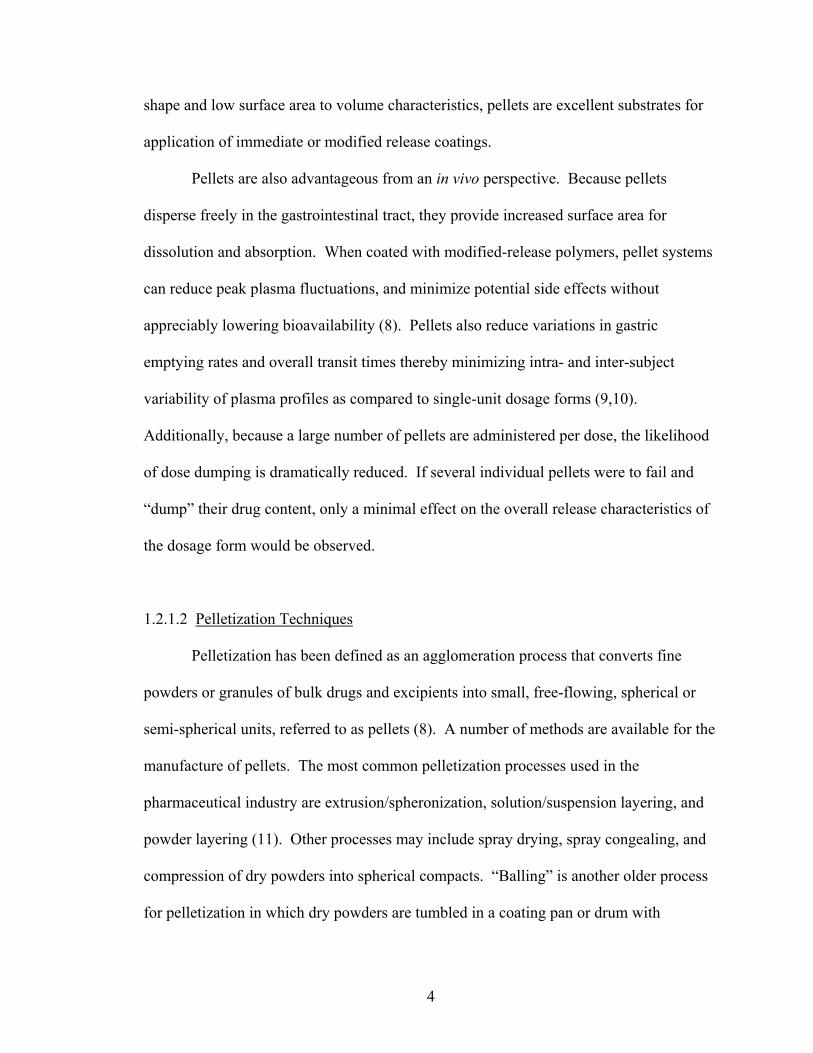
The rotor processor, as depicted in Figure 1, consists of a cylindrically shaped
product bowl and an expansion chamber (20). The rotor disk sits at the base of the
product bowl seated along the circumference of the chamber when not in motion. The
disk is raised during processing to create a slit between the edge of the rotor disk and the
conical bottom of the rotor product bowl. The adjustable disk height allows control of air
volume through the slit, independent of velocity. This key feature permits very low
drying rates for direct pelletization, and pellet growth by powder layering. For coating
applications requiring quick evaporation of a medium, the air volume can be significantly
7
Figure 1. The rotor processor.
Glatt Gmbh. Fluid Bed Coating. http://www.glatt.com /e/01_technologien/ 01_04_08.htm (accessed 09/06/08). part of The Glatt Group. http://www.glatt. com/ (accessed 09/06/08).
8
increased while keeping air velocity constant. This flexibility results in a single unit
processor capable of both layering and coating.
The fluidization pattern in the rotor processor can best be described as a spiraling
helix. Three factors act on the product to create this flow pattern. The rotating disk
provides centrifugal force which forces the pellets toward the wall of the processing
chamber at the periphery of the rotor, while airflow through the slit creates a vertical
force causing the product to become fluidized. The fluidization air pushes the product
upward into the expansion chamber until gravity overcomes the air velocity and the
material falls toward the center of the disk where there is little air movement (12,13).
The cycle is repeated many hundreds of times until the appropriate quantity of solids are
applied to the core substrate. Liquids or powdered solids can be added to the process
through air atomizing nozzles located on the side wall of the product bowl. The nozzles
spray tangentially into the processing chamber in the same direction as the fluidization
pattern. Using this technique, weight gains of up to 400% w/w relative to the initial bowl
charge can be achieved (21-23).
1.2.1.2.3 Wurster Coating
Perhaps one of the most important improvements to fluid bed equipment,
especially for the coating of pellets, was the advent of the bottom spray Wurster column
(24). The Wurster process is an industry recognized coating technique for precision
application of a film coat to particulate materials such as powders, crystals, or granules.
This technology can be used to encapsulate solid materials having diameters ranging
from approximately 50 µm to several centimeters.

9
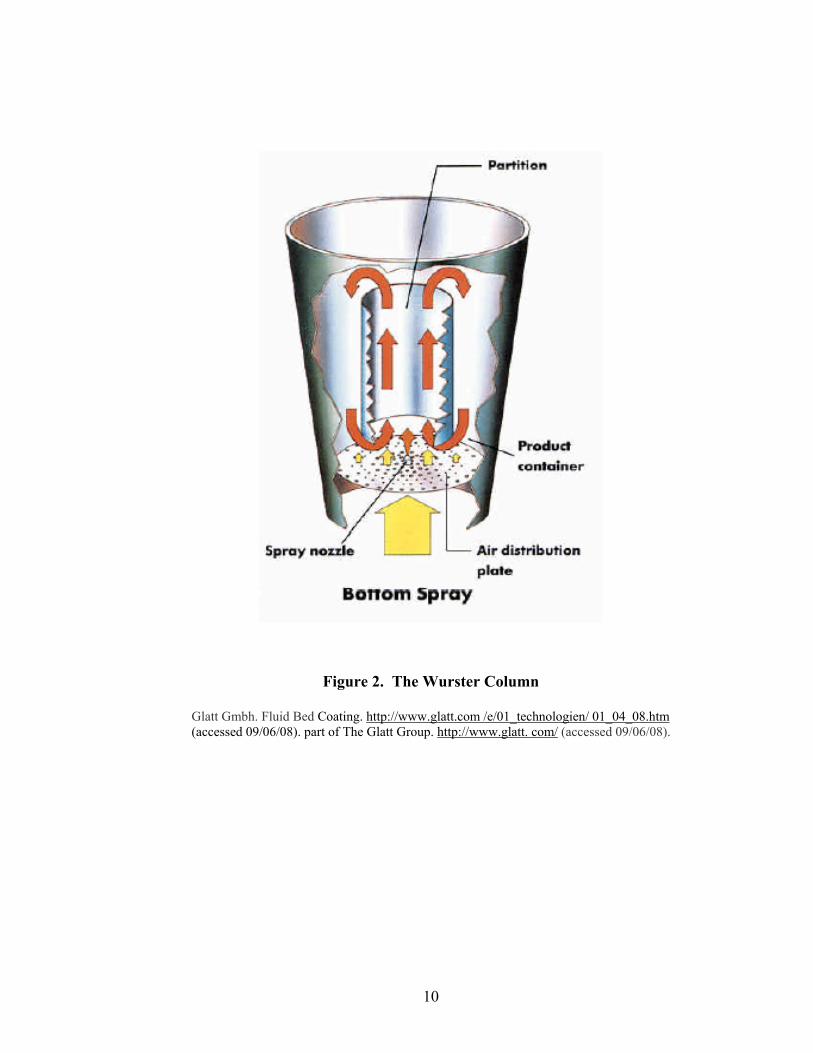
Wurster coating technology, as depicted in Figure 2, is characterized by the
location of a spray nozzle at the bottom of a fluidized bed of solid particles (20). The
particles are suspended in the fluidizing air stream that is designed to induce cyclical flow
of the particles past the spray nozzle which delivers atomized coating solution or
suspension. The process has a greater drying capacity than other coating systems due to a
relatively high fluidizing air velocity. Since the particles actually separate as they are
carried away from the nozzle, it is possible to coat small particles without agglomeration
(15, 16).
During processing, the atomized coating material collides with the particles as
they are carried away from the nozzle. The temperature of the fluidizing air is set
appropriately to evaporate solution or suspension vehicle or solidify the coating material
shortly after impingement on the particles. All coating solids remain on the particles as a
part of the developing film or coating. This process is continued until each particle is
uniformly coated to a desired film thickness.
For coating applications, the Wurster system compares favorably to the
tangential-spray system, since the three main physical criteria are the same: (i) concurrent
spraying, with the nozzle being buried inside the product resulting in minimal droplet
travel distance; (ii) uniform exposure of the particles to the spray mist; and (iii) high
product density in the spraying zone.
10
Figure 2. The Wurster Column
Glatt Gmbh. Fluid Bed Coating. http://www.glatt.com /e/01_technologien/ 01_04_08.htm (accessed 09/06/08). part of The Glatt Group. http://www.glatt. com/ (accessed 09/06/08).
11
1.2.2 Process Analytical Technology
Recently, there has been significant interest in process analytical technology
(PAT) within the pharmaceutical industry following the issuance of an FDA guidance
document on this subject (25). The FDA’s PAT initiative is a push to bring the efficiency
of pharmaceutical manufacturing in line with that of other specialty chemical production
standards (26). PAT can be described as a system for designing, analyzing, and
controlling manufacturing through timely measurements (i.e., during processing) of
critical quality and performance attributes of raw and in-process materials and processes,
with the goal of ensuring final product quality. The term analytical in PAT is broadly
viewed and integrates chemical, physical, microbiological, and production mathematical
risk analyses. Implementation of PAT should provide a means for better understanding
and controlling pharmaceutical manufacturing operations, which is consistent with the
FDA’s perspective on drug quality systems: quality cannot be tested into products; it
should be built-in or should be by design (25).
1.2.2.1 Process Analytical Chemistry – History and Concepts
Pharmaceutical PAT has essentially evolved from the concept of Process
Analytical Chemistry (PAC), which has gained considerable attention since the mid-
1980s because of opportunities presented by technological, methodological, and
chemometric advancements, as well as changing needs within the chemical and allied
products industries (27-30). Although Callis et al. (27) presented a conceptual
framework to describe five areas of PAC, the boundary between it and the usual practice
of laboratory analysis is still somewhat ambiguous. Nevertheless, the terms at-line, in-
12
line, off-line, on-line, and non-invasive are referred to throughout PAC and PAT
literature. At-line analysis refers to manual sampling with local transport to an analyzer
located within a manufacturing area, while in-line methods involve a sample interface
located in the process stream (27). Off-line often refers to manual sampling with
transport to a remote or centralized laboratory, while on-line analysis usually involves
automated sampling and sample transfer to an automated analyzer (27). Callis et al. (27)
also classified non-invasive sampling as a separate PAC area, however, today it is
generally desirable that all process analytical sampling be as non-invasive as possible.
1.2.2.2 Near-infrared Spectroscopy
Although the near-IR region of the electromagnetic spectrum has been studied
since the 1800s (31), it was not recognized for its analytical potential until after the
Second World War. Modern concepts of this technology were developed in the 1950s at
the USDA in an analytical group headed by Karl Norris, who evaluated the potential of
near-IR for rapid quality control of agricultural commodities. This work, which
demonstrated that non-destructive reflectance near-IR spectra of biological samples could
be used for analytical purposes, lead to the widespread use of near-IR in the agricultural
field (32).
Near-infrared spectroscopy (near-IR) has become the method of choice for many
industrial process analytical applications because it is rapid, nondestructive and
noninvasive. The widespread growth of this technology has primarily been the result of
significant advancements in high speed computing. Additional developments in optical
instrumentation, chemometric methods and spectral data analysis software have lead to
13
various applications of this technique in the petrochemical, pulp, paper, biomedical, and
pharmaceutical industries. A number of books (33-35) and review articles (36-39) have
been published on the theoretical aspects of near-IR and its applications. Additional
papers devoted to pharmaceutical applications of near-IR spectroscopy have also been
published (40-45).
1.2.2.2.1 Near-IR Theory
When molecules are irradiated with an external source of energy, they acquire the
potential for energy changes. The electromagnetic spectrum consists of energy vibration
ranging from wavelengths several meters in length to those less than 10-2 nm. The near-
infrared region of the electromagnetic spectrum lies between about 750 – 2600 nm (46).
Murray and Williams (46) have provided an excellent description of near-infrared
energy absorption. When photon energy (energy related to the wavelength at which the
irradiation is emitted) is absorbed by a molecule, the rotational, vibrational, or
electromagnetic energy of the molecule is elevated by a discrete amount that is equivalent
to the energy applied. Molecules can only absorb energy that is coincident with the
characteristic vibrations of the molecule and that can result in the molecule being excited
to a higher energy level. When infrared radiation is absorbed by a molecule, the energy
status of the molecule changes. The vibrational and rotational quantum numbers are
representative of these changes. The magnitude of the rotational energy is lower than
that of vibrational energy, but the energy level of a molecule is the sum of the vibrational
and rotational energies. Most of the molecules in a substance are normally in the lowest
energy level, or ground state, however, when an external source of energy is applied, the
14
molecules absorb photon energy and jump from the ground state to the next highest
vibrational or rotational energy level, constituting the absorption process. Fundamental
absorptions usually occur in the mid-infrared region between 2,500 and 15,000 nm.
Other molecules will absorb enough energy to reach the next second energy level,
represented the first overtone band. Since fewer molecules reach this level, the first
overtone band is generally much weaker in intensity than the fundamental absorption.
Still fewer molecules reach the third energy level, which is the second overtone. First
and second overtones occur at approximately one-half and one-third of the wavelength of
the fundamental. Higher energy levels are available, but fewer and fewer molecules
attain these levels, therefore the third and higher overtones appear as even weaker bands
relative to the fundamental. Deviation in the overtone absorption band frequencies from
theoretical frequencies is due to anharmonicity (deviation from the law of harmonic
vibration) of the chemical bonds involved (46). Vibrational energy changes are usually
accompanied by a larger number of rotational changes and, therefore, appear as bands.
All molecules and parts of molecules have vibrations at characteristics
wavelengths. In each model of vibration, all of the functional groups of atoms of the
same type in a molecule vibrate with the same frequency. The two main modes of
molecular vibrations are stretching and bending (46). Stretching is movement along the
axes, so that the distance between the atoms changes rhythmically. Bending involves
changes in bond angle between atoms. Only vibrations that result in rhythmic changes in
the dipole moment of a molecule can cause absorbance in the infrared (46). Most
fundamental resonant molecular vibrations occur at frequencies outside the near-infrared
region, with bands seen in the near-infrared being the overtones or combinations of the

15
fundamentals, which are usually of higher intensity than the overtones (46). The
intensity of overtone and combination bands depends on the degree of anharmonicity,
and these different modes of vibration give rise to the bands observed in the near-IR
region. The majority of overtone peaks arise from the R -H stretching mode (i.e., C-H,
O-H, N-H, S-H) since vibrations of the hydrogen atom appear to be particularly
susceptible to anharmonicity (46, 47). Therefore, the absorption bands observed in the
near-IR region arise from overtones of stretching vibrations involving functional groups
with hydrogen atoms or combinations involving stretching and bending modes of
vibrations of these groups.
The majority of active pharmaceutical ingredients and excipients possess
functional groups (i.e., -C-H, -O-H, -N-H, etc.) that absorb in the near-infrared region. In
addition, the low molar absorptivity of most of these compounds in the near-IR region
allows samples to be analyzed in their native state, requiring little or no preparation or
dilution prior to analysis. Broad overlapping bands observed using this technique also
provide a means for performing both quantitative and qualitative analyses.
1.2.2.2.2 Diffuse Reflectance
Reflectance spectroscopy measures the light reflected from a sample. The
incident beam of light is divided into two parts: transmitted light and reflected light. The
reflected light is comprised of both specular and diffuse components. The specular
component, described by Fresnel’s law, contains little information about sample chemical
composition, consequently, its contribution to measurements is minimized by adjusting
the detector’s position relative to the sample (48,49). It can be eliminated through
16
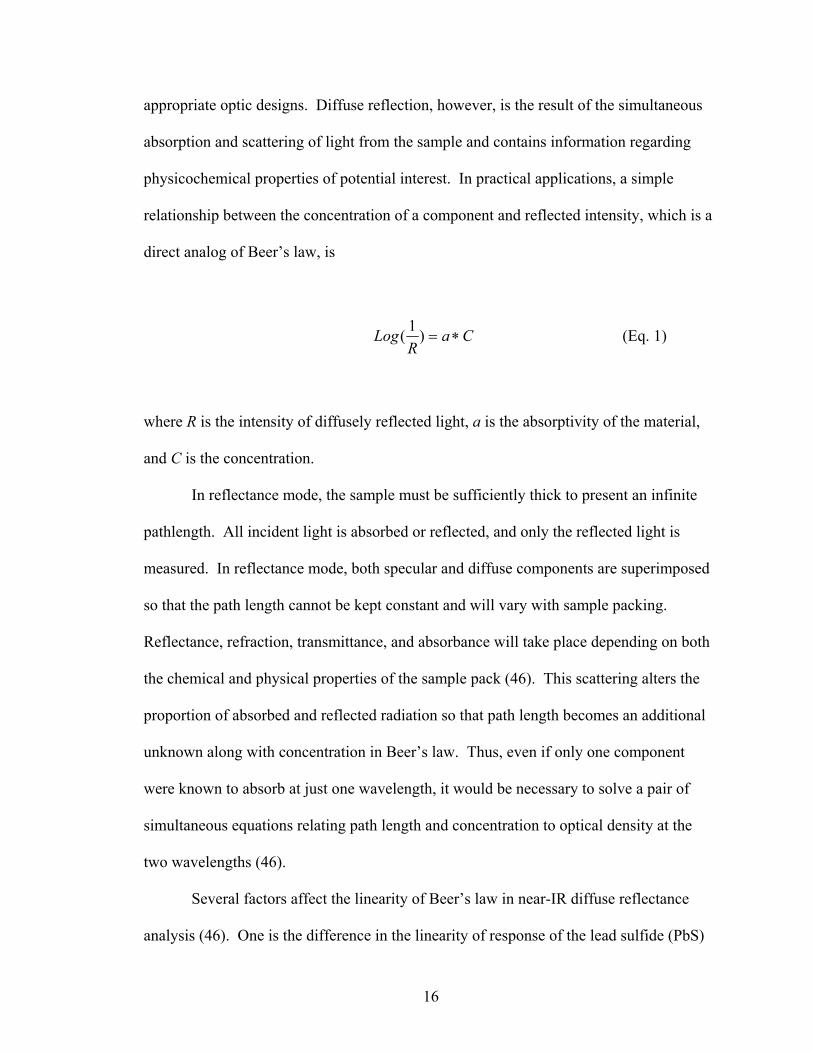
appropriate optic designs. Diffuse reflection, however, is the result of the simultaneous
absorption and scattering of light from the sample and contains information regarding
physicochemical properties of potential interest. In practical applications, a simple
relationship between the concentration of a component and reflected intensity, which is a
direct analog of Beer’s law, is
CaR
Log ∗=)1( (Eq. 1)
where R is the intensity of diffusely reflected light, a is the absorptivity of the material,
and C is the concentration.
In reflectance mode, the sample must be sufficiently thick to present an infinite
pathlength. All incident light is absorbed or reflected, and only the reflected light is
measured. In reflectance mode, both specular and diffuse components are superimposed
so that the path length cannot be kept constant and will vary with sample packing.
Reflectance, refraction, transmittance, and absorbance will take place depending on both
the chemical and physical properties of the sample pack (46). This scattering alters the
proportion of absorbed and reflected radiation so that path length becomes an additional
unknown along with concentration in Beer’s law. Thus, even if only one component
were known to absorb at just one wavelength, it would be necessary to solve a pair of
simultaneous equations relating path length and concentration to optical density at the
two wavelengths (46).
Several factors affect the linearity of Beer’s law in near-IR diffuse reflectance
analysis (46). One is the difference in the linearity of response of the lead sulfide (PbS)
17
detectors that are responsible for making the measurement and differences in path length
caused by particle characteristics. Another factor is the influence of temperature, which
at different wavelengths, can cause shifts to longer or shorter wavelengths, depending on
the temperature and position of the band. Such factors can be compensated for by
instrument design, and residual deviations from linearity are corrected by log 1/R
transformation of the spectra.
1.2.2.3 Chemometrics
Chemometrics is a term used to describe the application of mathematics, statistics,
and logic-based methods to derive meaningful chemical information from complex
samples. The theoretical foundations of many commonly employed chemometric
techniques were developed decades ago. However, the practical application of these
methods has relied on advancements in computer technology and the availability of
chemometric software.
Unlike other more traditional aspects of analytical chemistry, chemometrics is not
associated with any particular instrumental method for measuring chemical data.
Chemometric models have been employed to resolve analytical problems in a variety of
scientific disciplines ranging from organic synthesis to electrical engineering. Although
the breadth of this field makes it difficult to comprehensively review all aspects of
chemometric research, Brown et al. (50) have published an extensive review of this topic.
Review articles discussing chemometric applications to pharmaceutical and biomedical
analysis have been presented by several authors (51,52). The following discussion
18
examines several chemometric techniques commonly employed in the near-infrared
analysis of pharmaceuticals.
1.2.2.3.1 Spectral Preprocessing
Most near-IR instruments measure relative reflectance, R. Relative reflectance is
computed as the ratio Is/Ir, where Is is the intensity of radiation reflected from the sample
and Ir is the intensity of radiation reflected from a reference standard. Reflectance
standards are commonly manufactured as flat disks composed of materials such as
ceramic or PTFE (Spectralon®), both of which are highly reflective to near-IR radiation.
The depth of penetration of near-IR radiation into a sample is dependent on the
absorption and scattering characteristics of the sample matrix. Variations in particle size,
density, and sample positioning, as well ambient temperature and humidity conditions,
may affect subtle changes in measured spectral characteristics. Various mathematical
treatments have been suggested for modeling particle size effects on near-IR spectra (53-
57). In addition, Berntsson et al. (58) evaluated methods for determining minimum
effective sample size for near-IR reflectance analysis. To eliminate undesirable spectral
attributes, several signal preprocessing techniques may be employed.
1.2.2.3.1.1 Linearization
Linearization of reflectance spectra is typically accomplished by either a log (1/R)
or Kubelka-Munk transformation. Log (1/R) values are preferred instead of units of
reflectance because there exists an almost linear relationship between the concentration
of an absorbing component and its contribution to the log (1/R) value at the wavelength
19
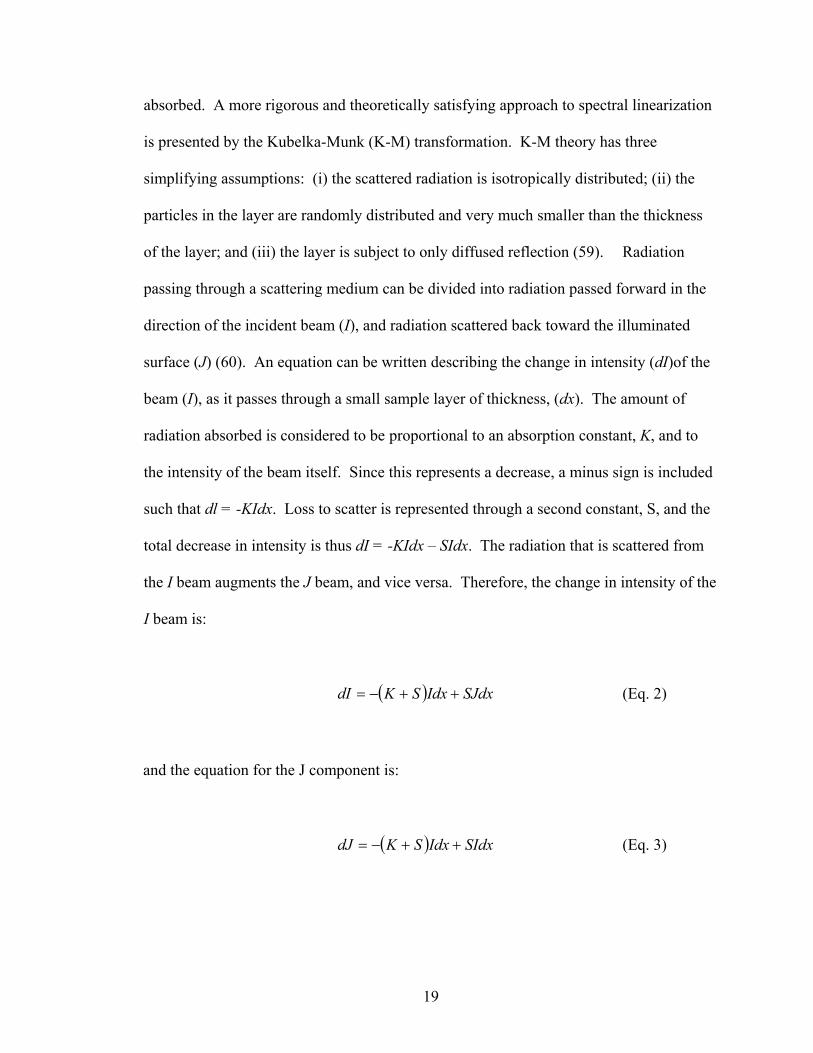
absorbed. A more rigorous and theoretically satisfying approach to spectral linearization
is presented by the Kubelka-Munk (K-M) transformation. K-M theory has three
simplifying assumptions: (i) the scattered radiation is isotropically distributed; (ii) the
particles in the layer are randomly distributed and very much smaller than the thickness
of the layer; and (iii) the layer is subject to only diffused reflection (59). Radiation
passing through a scattering medium can be divided into radiation passed forward in the
direction of the incident beam (I), and radiation scattered back toward the illuminated
surface (J) (60). An equation can be written describing the change in intensity (dI)of the
beam (I), as it passes through a small sample layer of thickness, (dx). The amount of
radiation absorbed is considered to be proportional to an absorption constant, K, and to
the intensity of the beam itself. Since this represents a decrease, a minus sign is included
such that dl = -KIdx. Loss to scatter is represented through a second constant, S, and the
total decrease in intensity is thus dI = -KIdx – SIdx. The radiation that is scattered from
the I beam augments the J beam, and vice versa. Therefore, the change in intensity of the
I beam is:
( ) SJdxIdxSKdI ++−= (Eq. 2)
and the equation for the J component is:
( ) SIdxIdxSKdJ ++−= (Eq. 3)
20
These equations may be solved to obtain expressions for the intensities of the beams I and
J anywhere within the samples as a function of certain boundary conditions, such as on
an ideal black background, on an ideal white background, without backing, etc. The
boundary conditions of the principal interest are I = Io at x = 0 and J = 0 at x = d (60).
The K-M theory treats all beams passing through the layer dx in the general
direction of x=0 as a part of I , and all beams passing through dx in the general direction
of x=0 as part of J, however, their actual path length will be longer unless they are
traveling exactly perpendicular to the surface (60). The deviations are probably due to
the effects of total internal reflection, which tend to increase the path length more for
large angles of incidence, but may also involve factors such as relative refractive index,
particle size, and shape (61). The scattering coefficient, S, is likewise, the result of
complex interaction of many factors (61).
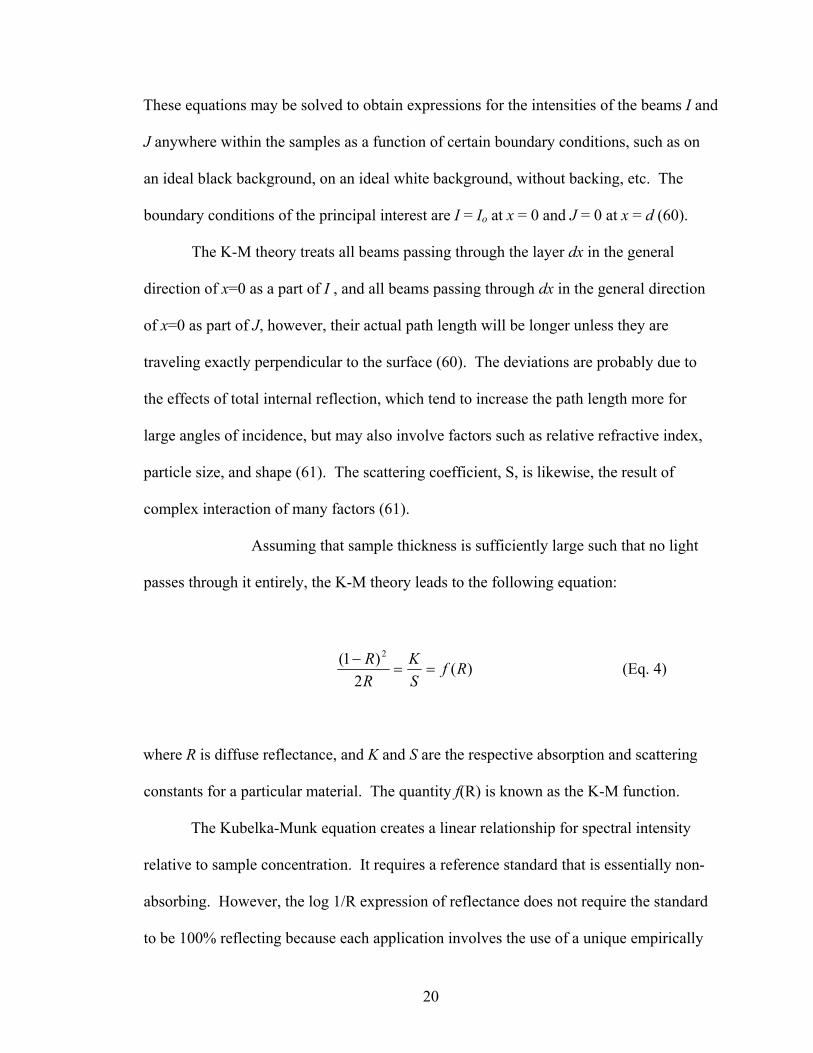
Assuming that sample thickness is sufficiently large such that no light
passes through it entirely, the K-M theory leads to the following equation:
)(2
)1( 2
RfSK
RR
==− (Eq. 4)
where R is diffuse reflectance, and K and S are the respective absorption and scattering
constants for a particular material. The quantity f(R) is known as the K-M function.
The Kubelka-Munk equation creates a linear relationship for spectral intensity
relative to sample concentration. It requires a reference standard that is essentially non-
absorbing. However, the log 1/R expression of reflectance does not require the standard
to be 100% reflecting because each application involves the use of a unique empirically
21
derived equation. The standard, must, however, be stable with time and not affected by
typical environmental changes. Furthermore, the K-M approach assumes an infinite
sample dilution in a non-absorbing matrix, a constant scattering coefficient and an
“infinitely thick” sample layer. The difficult variable to determine in this equation is the
scattering factor, S, which depends on the particle size and shape distribution, and the
packing density of the material (62). For these reasons it is critical that the samples are
packed identically each time. Despite the sophistication the K-M transformation, log 1/R
is more commonly utilized because of its simplicity and broad applicability.
1.2.2.3.1.2 Smoothing
Smoothing is used to remove noise from spectra without altering the important
chemical information present. The most common techniques for smoothing spectra
include boxcar smoothing, polynomial (Savitzky-Golay) smoothing, and Fourier
transformation. Boxcar smoothing begins by defining subsets containing a fixed number
of data points across the spectrum. The center point of each subset is replaced by the
average value of the subset members, and the averages are connected by a smooth curve.
The degree of smoothing can be modified by altering the number of points in the Boxcar
interval. The greater number of points averaged, the greater the degree of smoothing.
Although one advantage of this technique is its ease of computation, an increase in
distortion of the signal and subsequent loss of spectral information may occur if too many
points are averaged in the calculation (63).
Polynomial smoothing involves fitting, by least-squares methods, a polynomial
equation to subsets of data points across a spectrum. From the derived equations, the
22
ikkiiik exbax =+=
center point of each interval is computed. The points are then connected by a smooth
curve (63).
The Fourier Transform (FT) is a mathematical operation for decomposing a time
function into its frequency components (amplitude and phase). This process converts a
raw spectrum (e.g., a time series) into two frequency domain spectra, one which is called
a real spectrum and the other imaginary (this terminology comes from complex numbers)
by performing cosine and sine functions, respectively, on the original data. An inverse
transform then converts the real and imaginary pairs into a real series that is different
from the original spectrum in some desirable way (64). For example, points
corresponding to noise can be eliminated from the Fourier spectrum without altering
essential chemical information. FT is considered to be both a filtering and a noise
reduction technique (65).
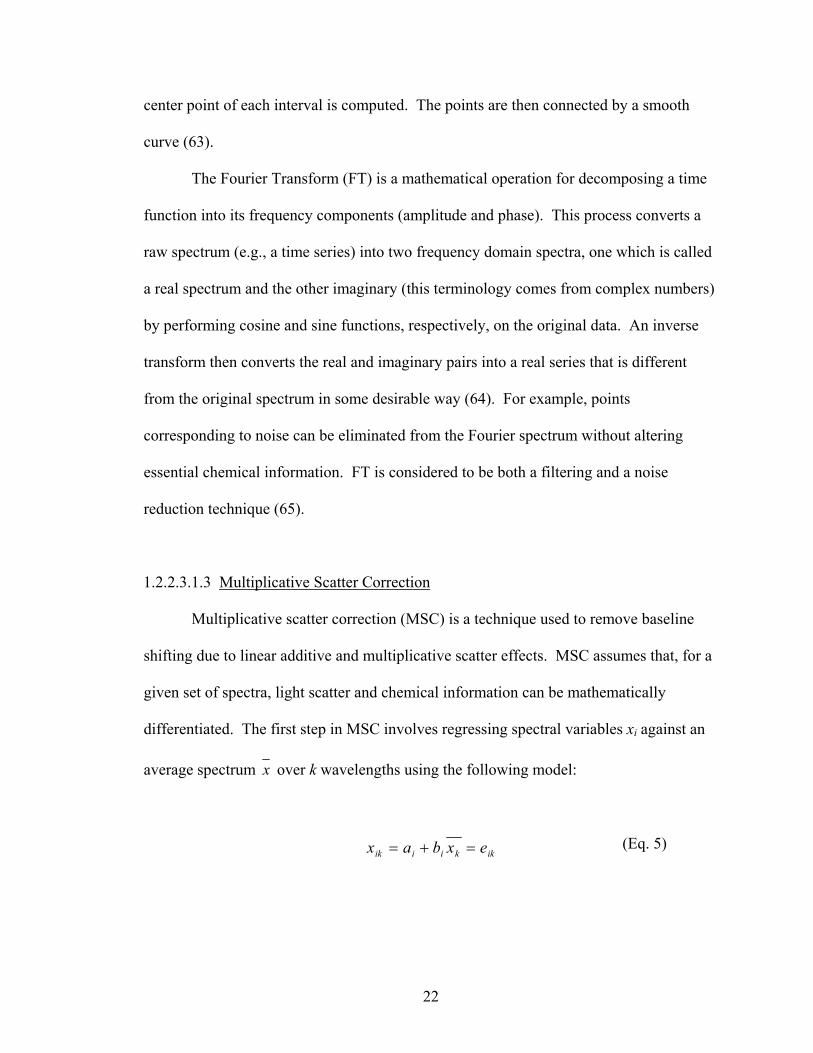
1.2.2.3.1.3 Multiplicative Scatter Correction
Multiplicative scatter correction (MSC) is a technique used to remove baseline
shifting due to linear additive and multiplicative scatter effects. MSC assumes that, for a
given set of spectra, light scatter and chemical information can be mathematically
differentiated. The first step in MSC involves regressing spectral variables xi against an
average spectrum x over k wavelengths using the following model:
(Eq. 5)
23
( ) baxx oldknewk /,, −=
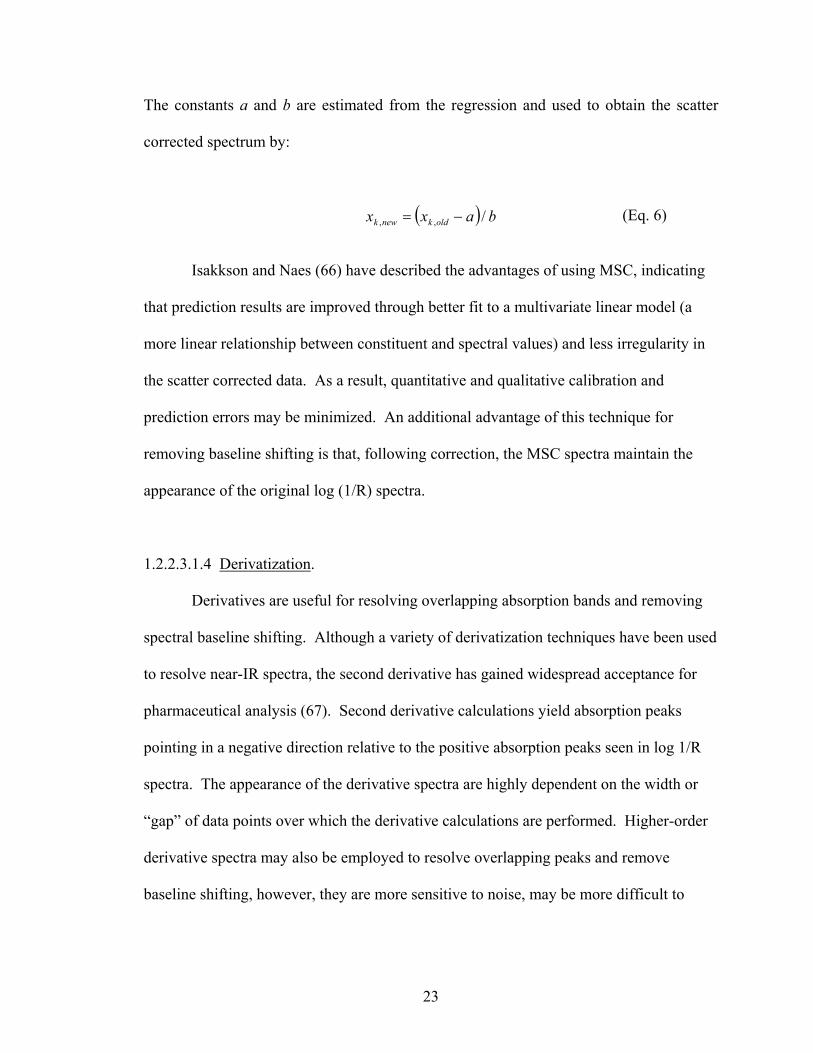
The constants a and b are estimated from the regression and used to obtain the scatter
corrected spectrum by:
(Eq. 6) Isakkson and Naes (66) have described the advantages of using MSC, indicating
that prediction results are improved through better fit to a multivariate linear model (a
more linear relationship between constituent and spectral values) and less irregularity in
the scatter corrected data. As a result, quantitative and qualitative calibration and
prediction errors may be minimized. An additional advantage of this technique for
removing baseline shifting is that, following correction, the MSC spectra maintain the
appearance of the original log (1/R) spectra.
1.2.2.3.1.4 Derivatization.
Derivatives are useful for resolving overlapping absorption bands and removing
spectral baseline shifting. Although a variety of derivatization techniques have been used
to resolve near-IR spectra, the second derivative has gained widespread acceptance for
pharmaceutical analysis (67). Second derivative calculations yield absorption peaks
pointing in a negative direction relative to the positive absorption peaks seen in log 1/R
spectra. The appearance of the derivative spectra are highly dependent on the width or
“gap” of data points over which the derivative calculations are performed. Higher-order
derivative spectra may also be employed to resolve overlapping peaks and remove
baseline shifting, however, they are more sensitive to noise, may be more difficult to
24
interpret, and have, in many instances, not been shown to improve calibration or
prediction results (63).
1.2.2.3.2 Principal Component Analysis
The analysis of complex samples usually requires several measurements in order
to define the different variables that make each sample unique. There are usually many
variables that can influence the spectral data acquired from a sample, and it can be very
difficult to determine what information is necessary in order to produce the correct
correlation for sample classification.
Dimensionality reduction of spectral information should provide a simplistic
representation of the data for visualization and understanding yet retain sufficient detail
for thorough mathematical analysis. If executed properly, it should also encourage the
consideration of meaningful relationships between the variables. Although several
techniques for reducing the dimensionality of large data sets are well documented in the
statistical literature, one such technique, principal component analysis, has gained
widespread acceptance in near-infrared analysis.
Principal component analysis (PCA) involves the rotation of a spectral array of n
points in p-dimensional space to introduce a new set of orthogonal linear coordinates so
that the sample variances of the given points with respect to the derived coordinates are
in decreasing order of magnitude (68). The first principal component is such that
projections of the given points onto it have maximum variance among all possible linear
coordinates; the second principal component has a maximum variance subject to being

25
∑=
+∗+=A
aikakiakik ptxx
1ε
XET =
orthogonal to the first. All subsequent axes are orthogonal to any preceding axes and
follow in order of decreasing variance.
Mathematically, PCA corresponds to the decomposition of the data matrix X,
which contains I = 1, 2, . . ., I spectra of k = 1, 2, . . ., K wavelengths, into means ( kx ),
scores (tia), loadings (pak) and residuals (,ik):
(Eq. 7)
The loadings are an indication of the intra-spectrum variation. The absolute value
of the loading describes how much a certain wavelength contributes to the ath principal
component, whereas the sign provides information as to whether a particular wavelength
is positively or negatively correlated with the principal component. Scores show the
location of the spectral information for spectrum i along the ath principal component and,
hence, describe the inter-spectra variation. Spectra that are similar will, therefore, have a
similar score value.
A simplistic representation of principal axis transformation can be expressed by
the matrix equation:
(Eq. 8) where E is a square matrix of a eigenvectors, each with k loadings elements. The matrix
of new variables, T, is composed of score elements which form column vectors called
principal components. The first principal component describes the largest systematic
variation in the data matrix X, the second principal component the next largest, and so on.
26
One result of the principal axis transformation procedure is that the covariance
between any two new variables for all samples is zero, which may not necessarily be true
for the original variables. This allows the total variance of the spectra to be expressed as
a summation of the variance for each of the new variables. A second result is that the
total variance is now concentrated into the first few principal components. Therefore,
higher order principal components, which primarily account for random spectral noise,
can be easily removed from principal component models without the loss of significant
chemical information (68).
1.2.2.3.3 Quantitative Analysis
Quantitative analysis involves a variety of statistical methods that relate near-IR
absorbance values at specific wavelengths to measurable analyte qualities via Beer's law.
Establishing this relationship by using a set of samples of known composition and a
statistically sound regression technique is referred to as calibration. Global calibrations
utilize full spectral data, while models using only a few selected wavelengths are referred
to as local. The development of a calibration model should involve the following steps:
(i) Prepare a set of standards that will represent the expected range of samples
to be encountered in a typical test environment.
(ii) Determine sampling and reference test errors (a spectral method cannot
correlate to a reference method better than the method correlates to itself).
(iii) Choose a data treatment that provides an acceptable standard error of
calibration (SEC) and acceptable coefficient of correlation (r). The SEC,
27
∑=
−−−
=N
iii yy
kNSEC
1
2)ˆ(1
1
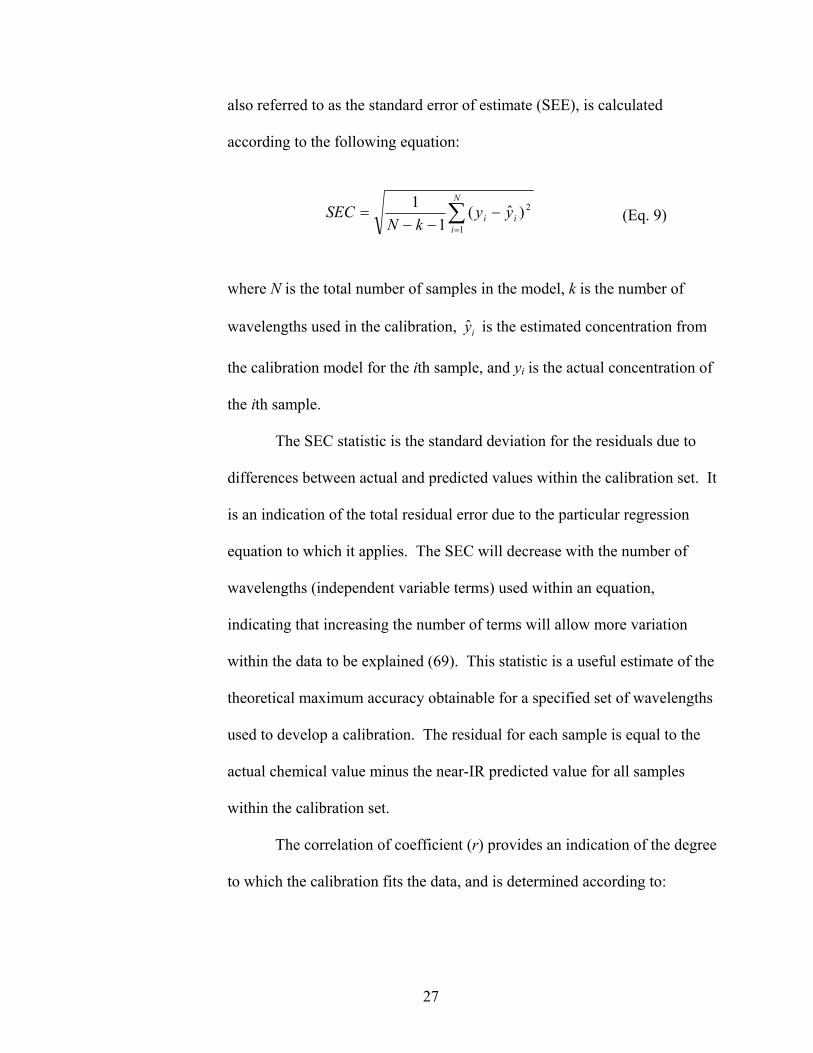
also referred to as the standard error of estimate (SEE), is calculated
according to the following equation:
(Eq. 9)
where N is the total number of samples in the model, k is the number of
wavelengths used in the calibration, iy is the estimated concentration from
the calibration model for the ith sample, and yi is the actual concentration of
the ith sample.
The SEC statistic is the standard deviation for the residuals due to
differences between actual and predicted values within the calibration set. It
is an indication of the total residual error due to the particular regression
equation to which it applies. The SEC will decrease with the number of
wavelengths (independent variable terms) used within an equation,
indicating that increasing the number of terms will allow more variation
within the data to be explained (69). This statistic is a useful estimate of the
theoretical maximum accuracy obtainable for a specified set of wavelengths
used to develop a calibration. The residual for each sample is equal to the
actual chemical value minus the near-IR predicted value for all samples
within the calibration set.
The correlation of coefficient (r) provides an indication of the degree
to which the calibration fits the data, and is determined according to:
28
∑
∑
=
=
−
−−= N
ii
N
iii
yy
yyr
1
2
1
2
)(
)ˆ(1
(Eq. 10)
where y is the average concentration.
(iv) Validate the calibration model and test for overfitting. For example, a
calibration model demonstrating an SEC that is much less than the reference
test error may be the result of too many terms in the calibration regression
(too much random noise fit by the model) or too few samples.
(v) Attempt to understand why the calibration model works, why certain
preprocessing techniques and regression methods provide better results than
others, and why certain factors are included in the model. To gain practical
acceptance, the model must be mathematically and spectroscopically
justifiable.
Following the development of a statistically sound calibration model, the
prediction of unknown sample properties may be accomplished by applying the
calibration model to the near-IR spectra of the test samples. An indication of the
predictive power of the model is provided by a standard error of prediction (SEP)
calculation. This term, also referred to as the standard error of performance, provides a
comparison between reference method results and the near IR predicted values for
samples outside the calibration set used to develop the model. The SEP calculation is
similar to that used in determining SEC, however, SEP has only N -1 degrees of freedom.
29
kk XbXbXbaY ++++= ...2211
^
Although there exist numerous methods for performing quantitative near-infrared
analysis, the following discussion will briefly examine methodologies commonly
employed in pharmaceutical applications of near-infrared spectroscopy.
1.2.2.3.3.1 Multiple Linear Regression
One of the most elementary statistical approaches to quantitative near-infrared
calibration and prediction is multiple linear regression (MLR). This technique uses the
absorbance information at a number of wavelengths to isolate the effect of a single
analyte and to normalize the baseline (63) . MLR is based on the following relationship:
(Eq. 11) where Y is the response variable, bm is the absorptivity at the kth wavelength, and Xk is the
log 1/R value at that wavelength. An entire spectral data array or a selected number of
wavelengths may be used in the estimation of the bk coefficients. Calibrations based on
narrow spectral regions are typically less complicated than global models, however, the
performance of such localized models is highly dependent on the proper choice of
wavelengths. To assist in wavelength selection, procedures such as "step-up" and "step-
down" regression are often employed (70).
Several MLR algorithms have been described by Hruschka (63). The step-up or
forward-stepwise regression procedure picks the wavelength to add as a second variable
in a two-term regression, and so on until some stopping criterion is met. The step-down
procedure starts with a multi-term regression using all available wavelengths and
eliminates variables by some criterion. The all-possible combinations procedure tests all
30
possible linear regressions on all subsets of the available wavelengths and reports the
subsets giving the lowest SEC. This procedure is usually limited to all subsets containing
only two or three wavelengths. As an alternative, each step in the step-up method can be
followed by one step of the step-down method, to check for wavelengths that can be
safely eliminated when a new wavelength is added. Proper selection of subset of
available variables is necessary to avoid overfitting (63). However, with respect to near-
IR, correlation of absorbances of adjacent wavelengths may lead to collinearity, and there
are usually fewer calibration samples available than there are recorded wavelengths of the
log 1/R spectra (71). Consequently, MLR often leads to unstable estimates of b.
Therefore, although the model may fit a calibration set well, an unstable regression vector
may magnify small random errors in future samples and lead to large prediction errors.
1.2.2.3.3.2 Principal Component Regression
Principal component regression (PCR) is a robust technique for developing global
calibrations. PCR utilizes principal component spectra derived from principal axis (PCA)
transformation as previously discussed. Because most of the spectral variation of the
calibration set is usually described by the first few principal components, the number of
regression variables necessary to adequately model the data is dramatically reduced.
Data reduction also allows for sources of spectral variation, other than those related to the
sample attributes being evaluated, to be eliminated from calibration. One weakness of
PCR is that, because chemical information is not included in principal axis
transformation, regression factors are determined solely on the basis of near-IR data.
Therefore, the development of a calibration model using PCR may rely on good
31
correlation between the principal components and the chemical data, which may or may
not exist. In addition, there may also remain y-correlated variance proportions in the
higher order PCs that never get into the PC-regression stage, simply because the
magnitudes of the other X-structure parts (which are irrelevant in an optimal (X,Y)
regression sense) dominate (72).
1.2.2.3.3.3 Partial Least Squares Regression
The partial least squares (PLS) technique, developed by Svante Wold, considers
errors in both independent (spectroscopic data) and dependent (sample analyte
information) variables in the calculation of PLS factors (73). Such factors are analogous
to principal components. Since both spectral and sample analyte variance are taken into
account in determining PLS factors, the significance of the factors with respect to the
analytical problem at hand is increased because the factors are oriented in accordance
with the target analyte. Basically, PLS attempts to explain as much of the variation in the
dependent variable as possible using only relevant factors contained in the spectral data.
The mathematics of PLS are quite rigorous and have been thoroughly described in
the literature (74). For a system of n samples, PLS simultaneously resolves matrices X (n
x k) and Y (n x p), which contain spectral absorbance values recorded at k wavelengths
and the concentrations of the p analytes to be determined. Each matrix is resolved into
the product of a scores and loadings matrix. The loadings for matrix X are determined
from the scores of the dependent variable matrix, and the loadings for matrix Y are
calculated from the scores of the independent variable (spectral data) matrix, X. The

32
∑=
=
=Nn
nnpnp Nyxc
1
'" /
covariance between y, the dependent variable, and the PLS component is maximized for
component p according to:
(Eq. 12)
where ny ' is the centered value of the y sample for n, there are N samples in the dataset
and pnx" is the PLS score of the centered pth component for this sample.
Erbensen (72) has provided a concise comparison of PCR and PLS regression. As
opposed to performing two independent PCA-analyses on two spaces, X and Y, PLS uses
y-variance to guide the decomposition of the X-matrix, so that the outcome constitutes an
optimal validated regression. Instead of performing independent PCA analysis on X and
Y spaces, PLS actively connects these spaces by specifying the u-score vector(s) to act as
the starting points for the t-score vectors in the decomposition of X. Thus the starting
proxy-t1 is actually u1 in the PLS method, thereby letting the Y-data structure directly
guide the decomposition of X. Subsequently, u1 is substituted by t1 later in the algorithm.
By this method, u1 influences the decomposition of X and the calculation of the X-
loadings (w). The X-space t-vectors are then calculated based on the newly determined
w-vector, and are subsequently used in Y-space decomposition. The PLS-algorithm is
specifically designed around these interdependent u1→ t1 and t1→ u1 substitutions in an
interactive way until convergence, at which time a final set of vectors has been calculated
for the current PLS-component for both the X-space and the Y-space. Thus, what first
appears as two sets of independent PCA decompositions is, in fact, based on these
interchanged score vectors (72). In this way, the X- and Y- spaces are interdependently
33
modeled. By balancing both X- and Y- information, PLS reduces the influence of large
X-variations which do not correlate with Y, and thereby removes the problem of the two-
stage PCR weakness (72). Since PLS focuses as much on the Y-variance as well as the
X-variance, and there is particular interest in the co-varying relationship between these
samples, simpler models (those with fewer components) can be developed.
Perhaps, the most critical step involved in PLS calibration involves the selection
of the number of factors used to construct the regression model. Too few factors can
leave important spectral information unmodelled, while too many factors may result in
the inclusion of a significant amount of noise included in the model. Martens and Naes
(75) suggested a cross-validation procedure to determine the optimum number of factors
to be included in the PLS calibration. This technique calculates a root mean square error
of prediction (RMSEP) for a series of PLS calibration models containing 1 to n factors.
The optimal number of factors to be included in the calibration model is determined as
the number of factors after which there is no significant decrease in the RMSEP.
1.2.2.3.4 Qualitative Analysis
In addition to being a powerful tool for quantitative pharmaceutical analysis, near-
IR spectroscopy has gained recognition for its qualitative analysis capabilities.
Qualitative analysis involves classifying samples by comparing their spectral
characteristics to those of a reference group. Unlike quantitative methods, qualitative
spectral analysis does not always rely on the existence of a direct correlation between
spectral characteristics and chemical information.
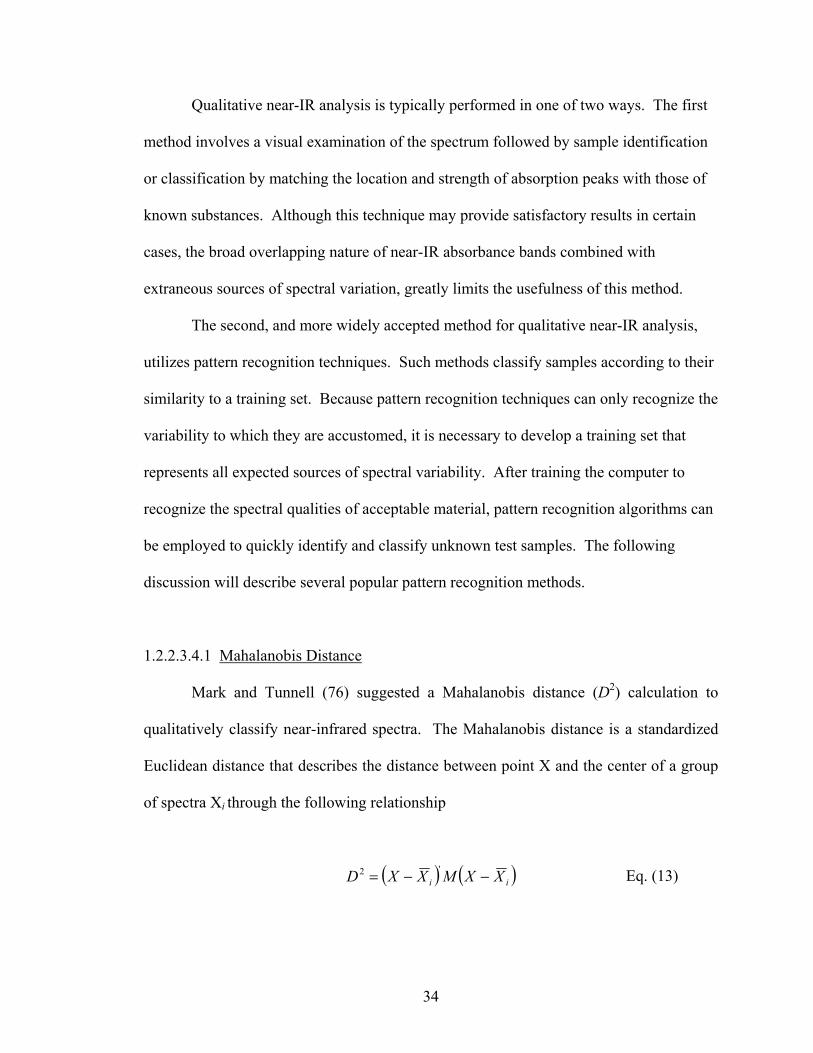
34
( ) ( )ii XXMXXD −−= '2
Qualitative near-IR analysis is typically performed in one of two ways. The first
method involves a visual examination of the spectrum followed by sample identification
or classification by matching the location and strength of absorption peaks with those of
known substances. Although this technique may provide satisfactory results in certain
cases, the broad overlapping nature of near-IR absorbance bands combined with
extraneous sources of spectral variation, greatly limits the usefulness of this method.
The second, and more widely accepted method for qualitative near-IR analysis,
utilizes pattern recognition techniques. Such methods classify samples according to their
similarity to a training set. Because pattern recognition techniques can only recognize the
variability to which they are accustomed, it is necessary to develop a training set that
represents all expected sources of spectral variability. After training the computer to
recognize the spectral qualities of acceptable material, pattern recognition algorithms can
be employed to quickly identify and classify unknown test samples. The following
discussion will describe several popular pattern recognition methods.
1.2.2.3.4.1 Mahalanobis Distance
Mark and Tunnell (76) suggested a Mahalanobis distance (D2) calculation to
qualitatively classify near-infrared spectra. The Mahalanobis distance is a standardized
Euclidean distance that describes the distance between point X and the center of a group
of spectra Xi through the following relationship
Eq. (13)

35
( )∑ −−= 1/220 knss i
where X is the multidimensional vector describing the location of the spectrum X, iX is a
multidimensional vector describing the location of the mean spectrum of the ith group,
( )'iXX − is the transpose of vector ( )iXX − and M is the matrix describing the distance
measures of the multidimensional space involved. A spectrum is typically classified as
“acceptable” if its distance falls inside the 99% probability (less than three standard
deviations) level. Multiple wavelengths or principal component spectra may be used to
calculate D2, however, the use of principal components ensures that all spectral
information is retained for classification.
1.2.2.3.4.2 Soft Independent Modeling of Class Analogies
Soft Independent Modeling of Class Analogies (SIMCA) is a pattern recognition
technique that uses principal component analysis of near-IR spectra to develop
mathematical models for each training set (77). The number of principal components
used determines the dimensionality of the class model and may affect the performance of
the SIMCA calculation.
SIMCA begins by calculating the sum of squares of the difference (si2) between
the original spectrum and the reproduced spectrum according to
:
(Eq. 14)
where aij is the raw absorbance spectrum, aij is the transformed spectrum following PCA,
p is the number of wavelengths and k is the number of significant principal components.
The total variance between samples within a class (s02) is determined by the equation:
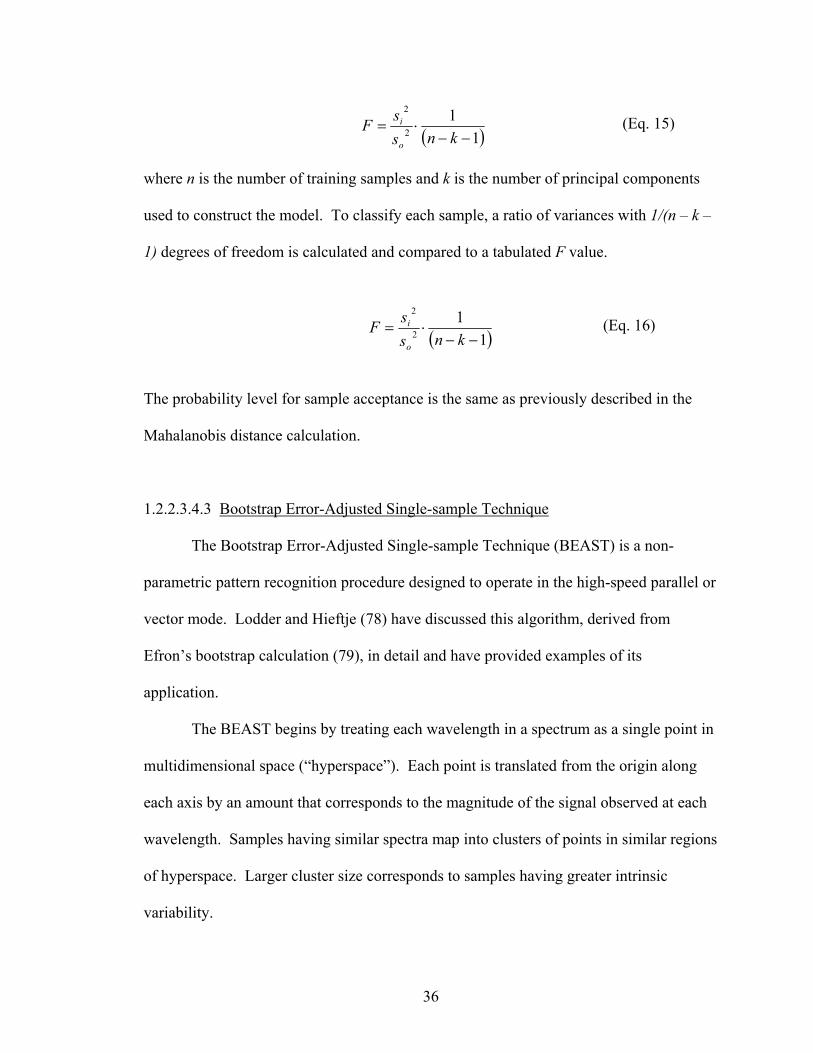
36
( )11
2
2
−−⋅=
knssF
o
i
( )11
2
2
−−⋅=
knssF
o
i
(Eq. 15)
where n is the number of training samples and k is the number of principal components
used to construct the model. To classify each sample, a ratio of variances with 1/(n – k –
1) degrees of freedom is calculated and compared to a tabulated F value.
(Eq. 16)
The probability level for sample acceptance is the same as previously described in the
Mahalanobis distance calculation.
1.2.2.3.4.3 Bootstrap Error-Adjusted Single-sample Technique
The Bootstrap Error-Adjusted Single-sample Technique (BEAST) is a non-
parametric pattern recognition procedure designed to operate in the high-speed parallel or
vector mode. Lodder and Hieftje (78) have discussed this algorithm, derived from
Efron’s bootstrap calculation (79), in detail and have provided examples of its
application.
The BEAST begins by treating each wavelength in a spectrum as a single point in
multidimensional space (“hyperspace”). Each point is translated from the origin along
each axis by an amount that corresponds to the magnitude of the signal observed at each
wavelength. Samples having similar spectra map into clusters of points in similar regions
of hyperspace. Larger cluster size corresponds to samples having greater intrinsic
variability.
37
The BEAST develops an estimate of the total sample population using a small set
of known (training) samples. A predetermined number of randomly selected sample sets
(containing the same number of elements as the training set) is drawn from the training
set, with replacement, to form a bootstrap distribution by Monte Carlo approximation. A
point estimate of the center of this distribution, representing the estimate of the true
population distribution for the sample set, is also calculated. Bootstrap distribution
quantiles are readily converted into confidence intervals and are therefore useful in
defining the boundaries of a training set in the hyperspace of spectral points. Assuming
the parameter of interest is represented by the bootstrap-set center, selecting any two
bootstrap-distribution percentiles gives the corresponding confidence limits for the
center-parameter (e.g., selecting the 16th and 84th percentiles of the bootstrap
distribution produces the central 68% confidence limits).
When a new sample is analyzed, its spectrum is projected into the same
hyperspace as the known samples. A vector is then formed in hyperspace to connect the
center of the population estimate to the new sample spectral point. A hypercylinder is
formed about this vector to contain a number of estimated-population spectral points.
The distances between the center of the hypercylinder and the points within it are sorted
and the upper and lower confidence limits are scaled in accordance with a measure of the
skew of the distribution. The distance from the center to the new sample spectrum is
scaled by a skew-adjusted standard deviation (SD) calculated from the sorted distances
BEAST distances are used to identify sample constituents. Uncorrected BEAST
distances (suitable for unskewed training sets) are calculated as follows:
38
( ) σ2/1
1
2
⎟⎟⎠
⎞⎜⎜⎝
⎛−∑
=
d
jjj xc
(Eq. 17)
where cj is the center of the bootstrap distribution, xj is the test sample spectrum and σ is
a BEAST standard deviation. When a sample spectrum projects to a point within three
standard deviations of the center of a cluster of spectral points from a known substance or
product, the sample is considered to be a sample of the known material. The known
product is either a pure substance or a mixture of components. When the new sample
contains different substances or components in concentrations that differ from the known
product, the new sample spectral point is displaced from the known spectral cluster. The
magnitude of this displacement increases as the difference between the new sample and
the set of known samples increases. Furthermore, the direction of the displacement of the
new sample point corresponds to the spectra of the constituents responsible for the
displacement.
Although the BEAST is primarily utilized for qualitative analysis, this technique
can also be used quantitatively (80,81). Using the estimated BEAST distances within a
training group and their corresponding analyte response variables, a calibration model
may be developed. When an unknown sample is tested, its BEAST distance is calculated
and its analyte response is determined using the calibration model.
1.2.2.4 Pharmaceutical Applications of Near-Infrared Spectroscopy
Near-infrared spectroscopy has gained widespread acceptance in the
pharmaceutical industry as a rapid and non-destructive analytical technique.
39
Applications of this technology can be found throughout many phases of pharmaceutical
manufacturing, from identification and testing of incoming raw materials (54,82), to
analytical control of unit process operations (83,84), and finally analysis of finished
dosage forms (85-93). Recently, a general chapter regarding near-infrared
spectrophotometry has been included in the United States Pharmacopeia (94).
Additionally, the technique has been addressed in a FDA draft guidance for industry
regarding analytical procedures and methods validation (95). Although near-IR is not
specifically addressed in FDA’s guidance document for PAT, it has been reported that
near-infrared applications appeared in 41% of the literature citations in FDA's PAT
Initiative Literature References (26).
Early pharmaceutical applications of near-IR focused on the determination of
active ingredients in formulations after appropriate extraction (96,97). The majority of
work has, however, involved the analysis of a variety of intact pharmaceutical dosage
forms including powders (98-99), blends (99-101), granulations (102-104), tablets (81,
85, 87, 106) capsules (80, 88), creams (89), liquids (90,106), and parenterals (107-108).
Comprehensive review articles regarding the historical development of near-IR
applications have been published by Kirsch and Drennen (45), and by Morisseau and
Rhodes (109). The following discussion highlights some of the major developments in
the use of near-IR spectroscopy for pharmaceutical applications discussed in this
dissertation.
40
1.2.2.4.1 Analysis of Coated Dosage Forms
Coatings are applied to solid dosage forms for a variety of reasons including
aesthetics, taste-masking, stability enhancement, or to provide modified release of active
drug substance (110). Application of a proper amount of coating to a dosage form is
essential to provide desired physicochemical, pharmacological, or cosmetic effects. For
example, insufficient levels of applied rate controlling polymer coating on a sustained
release dosage form may result in faster than desired drug release, while excessive levels
of applied coat may retard drug release to a greater than desired extent. Therefore, it is
important to closely monitor the quantity of coating applied to solid dosage forms during
processing.
For tablets, the amount of applied coating is typically determined by calculating
the difference between the average weight of a coated tablet and the average weight of an
uncoated core. Measurement of coated tablet thickness (111) has been suggested for
monitoring the level of applied coating. This technique, however, is indirect and is based
on measurement of average core and coated tablet weight. Therefore, it provides little
information regarding individual tablet coating weight variation. For pellet processes,
researchers and manufacturing personnel must rely on determinations of applied solids to
predict coating process endpoints. This is usually performed by applying a specified
quantity of coating solution onto a known quantity of core pellet substrate. This
technique, which is primarily theoretical, assumes no loss of core material during
processing with complete application of the applied coat. Therefore, it provides limited
information regarding the actual quantity of coating material present on the core substrate
at any point during processing.
41
Laboratory methods, such as microscopy, have the potential for providing a direct
measurement of coating thickness, but often require laborious sample preparation, and
are, therefore, not feasible for real-time analysis. Microscopy may also have associated
with it a considerable degree of error due to inherent variability in thickness of the
substrate or applied coating. Several thickness measurements per sample must be
obtained to provide an accurate assessment of coating thickness. Direct assessment of the
quantity of polymer applied to tablets has been achieved via a gel permeation
chromatographic methods described by MacLaren and Hollenbeck (112) and Scattergood
et al. (113). Such techniques also require labor-intensive sample preparation and
analyses, and are not suitable for process analysis applications.
One of the first references regarding near-IR analysis of coated dosage forms
involved the quantification of amiodarone content of coated tablets (105). In this
application, the researchers indicated a need to scrape the coating from the tablets prior to
analysis because of spectral interference with the drug substance. In 1995, Kirsch and
Drennen (115) demonstrated that valuable information about core tablet properties of
film coated tablets could be assessed using near-IR spectroscopy. Prediction of core
tablet hardness, drug content, and time to 50% dissolution of ethylcellulose coated
cimetidine tablets was effectively accomplished using principal component regression
using near-IR spectra collected on both grating-based and acousto-optic tunable filter
spectrometers.
Kirsch and Drennen (83) also published a near-IR method for monitoring the
coating of tablets in a Wurster column. In this work, the Wurster column was retrofitted
with a sample thief (115) to allow tablet samples to be withdrawn from the process
42
stream for obtaining near-IR spectra during coating. As coating proceeded, decreasing
absorbance was observed in regions characteristic of the primary core tablet components
while increasing absorbance was noted in regions characteristic of the applied coating.
Principal component analysis of scatter-corrected or second derivative spectra was
employed to predict the quantity of ethylcellulose or hypromellose applied. Over a
coating range of 2% to 30%, SEE and SEP values for applied polymer solids were
approximately 1%.
The use of near-IR spectroscopy to evaluate the quantity of active ingredient
applied to a tablet via a film coating operation was investigated by Buchanan et al. (116).
A partial least squares regression model was developed using scatter corrected near-IR
reflectance data obtained using a NIRSystems Model 6500 spectrometer equipped with a
Rapid Content Sampler. HPLC was employed as reference laboratory method for
determining active drug content contained per tablet. SEP values in the range of 3% to
4% were reported for the model studied.
Another application of near-infrared analysis of coated tablets was reported by
Andersson and coworkers (117), who quantified the amount of coating applied to a dual-
active bilayer tablet. Each half tablet was composed of different granulations containing
different active ingredients. Tablets were coated in a side-vented coating pan and
removed from the process stream prior to near-IR analysis. A PLS model was developed
utilizing spectra obtained from both tablet sides, pretreated with MSC, and ordered into
one object. Characterization of the coating measurements was achieved by calibrating
the spectra versus coating thickness obtained from optical microscopy. Using PCA, the

43
authors estimated the maximum depth in the coating material that returned chemical
information to be approximately 0.1 mm to 0.2 mm.
1.2.2.4.2 Analysis of Pelletized Dosage Forms
The earliest reference to near-infrared analysis of pharmaceutical pellets was in a
1966 paper by Sinsheimer and Keuhnelian (96). This work involved the qualitative
analysis of compressed pellets composed of either a mixture of amine salts and potassium
chloride or amine salts alone. Spectra were collected in the 1050 to 2800 nm region and
analyzed qualitatively using peak assignments. Although no calibrations were developed,
several spectral features of these samples were noted for showing promise in the
quantification of drugs in the solid state.
An on-line near-IR monitoring method for monitoring pellet product uniformity
during encapsulation was described by Duff et al. (118). This study utilized a remote
reflectance fiber optic probe mounted to the feed chute of a commercial encapsulation
machine. Assay calibrations were developed using multiple linear regression and PLS
analysis of second derivative spectra. Both models had correlation coefficients of about
0.98 and standard errors of calibration of better than 0.5% over an assay range of 98% -
100%.
In another study, Andersson et al. (119) described a near-IR method suitable for
analysis of the film coating on pharmaceutical pellets during processing. In this study,
core pellets were sieved to a diameter of 400-500 µm and subsequently coated with a
solution of ethylcellulose and ethanol. During processing, the pellets increased in size by
~30% corresponding to a coating thickness of ~60-75 µm. Near-IR spectra were
44
collected using a sampling device and diffuse reflectance probe positioned inside the
process vessel of an in-house constructed fluid bed processor. The sampling device
utilized was similar to that described by Kirsch and Drennen (83,114,115) from which
samples were withdrawn from the process stream, spectra were acquired, and the samples
were returned for additional processing. A PLS regression model was employed to
predict coating thickness using fluorescence microscopy and image analysis (120) as a
reference method. Using as little as one PLS projection, R2 values of 0.97 and standard
errors of calibration and prediction of 2.2 µm and 2.3 µm, respectively, were achieved.
1.2.2.4.3 Analysis of Moving Solids
Physical sampling and the presentation of a sample to a fiber-optic probe are
essential elements of any process analysis (121). Although a stationary sample
presentation can be obtained by means of an in-line sub-sample (83,114), or by stopping
or removing a sample from the process (83,116,122,123), such a sample-spectrometer
interface may be difficult to develop and may also limit sampling rate. Analysis of
moving samples are essential for various process analytical applications.
For a given sample, there will always be scattering variation due to heterogeneity
with respect to sample characteristics such as powder packing, surface roughness, and
distance from the probe, even if the sample is homogenous with respect to chemical
composition. This is due to the fact that near-IR diffuse reflectance is the result of both
absorption and scattering, where the scattering coefficient is typically an order of
magnitude larger than the absorption coefficient (124,125). Measurement of a moving
45
sample can, therefore, become quite complicated since its signal is likely to have random
variations as the sample moves.
Although near-IR sampling of moving solids is frequently carried out in industry,
the number of publications describing moving sample/spectrometer interfaces has been
somewhat limited. Several patents describing the development of moving sample-
spectrometer interfaces have been granted. In one such patent, Kemeny et al. (126)
described a system where material is moving under an optical window suitable for on-
line near-IR applications. He noted that if particle size was small as compared to the
illuminated surface, the concentration of stationary product could be determined within
acceptable limits. However, if the average diameter was larger and its size distribution
wider, the measurement was only precise if the sample was moving, i.e., if a sufficiently
larger sample was analyzed. Two additional patents (127,128) describe methods for
monitoring moving base materials such as paper, in which near infrared radiation is
directed upon the material.
In a 2001 paper, Berntsson et al. (121) characterized the effect of sample
movement on spectral response using FT-NIR spectroscopic analysis of model samples
such as paper, plastic and fine and coarse powders. The authors found that controlled
movement caused sample artifacts to appear in sample interferograms. They attributed
the origin of these artifacts to variation in the detector signal level caused by sudden
changes in the overall sample reflectance as the sample moves. In this study, it was
shown that these artifacts did not affect the near-IR spectra range, and that spectra
obtained from moving samples could not be distinguished from spectra obtained from
stationary samples.
46
Most recently, Andersson et al. (129) characterized the effect of sample
movement on spectral response during fiber optic probe diffuse reflectance near-IR
spectroscopy sampling. In this study 400 – 500 µm pellets were used to model coarse
powder while microcrystalline cellulose was used as a model fine powder. Controlled
movement of the model samples during fiber optic probe sampling was accomplished
through the construction of a 300 mm rotating disk apparatus. In the initial phase of
study, the probe was placed 1 mm above the rotating disk at a fixed radius from the
center of the disk and rotation speeds ranging from 3 – 61 rpm were investigated. In the
second phase of study, additional measurements were obtained by inserting the probe into
a glass vessel containing a powder sample, which was placed on the rotating disk. The
third phase of this study involved analysis of ethylcellulose coated pellets, containing
between 8% and 120% w/w of applied target coating solids, which were arranged in
monolayers on the rotating disk using double-sided tape. For each test condition,
measurements were performed at 1 and 10 scans per spectrum, and approximately 100
spectra were acquired at each rotational speed. Chemometric routines of MSC, PCA,
PLS and SIMCA were employed in the analysis of the near-IR spectra.
Following chemometric analysis, two spectral artifacts were observed. First, a
baseline offset occurred due to variations in the average distance between the probe and
the samples, different packing, or the presence of cavities in the samples analyzed.
Additional spectral artifacts were also observed that appeared as momentary transitions
between spectra from different materials within the scanned spectrum. A correlation
between the sample speed and the number of transitions was also observed. Such
47
artifacts were difficult to identify by visual inspection, but could be tracked by
multivariate methods such as PCA and PLS.
The reasons for measuring a moving solid sample may, for example, be to obtain
a large effective sample. Similarly, it may simply be impossible to interrupt the process
to obtain a stationary sample. In this case, material inhomogeneities, such as differences
in particle size, inevitably influenced the reflectance spectra. The presented data
demonstrated that by analyzing moving samples, thereby increasing the effective sample
size, such effects could be suppressed because the cumulative sample studied yielded
reproducible average values even if the sample was locally inhomogeneous. However,
local product variations could be hidden when the effective sample size was increased.
Therefore, the number of samples acquired during in-line analysis of process streams
should be carefully considered.
In this study, it was determined that, for monitoring moving solids and
mimicking conditions typically encountered during in-line or on-line process analysis, at
least 20 to 40 consecutive samples should be used to predict an average value with
sufficient precision.
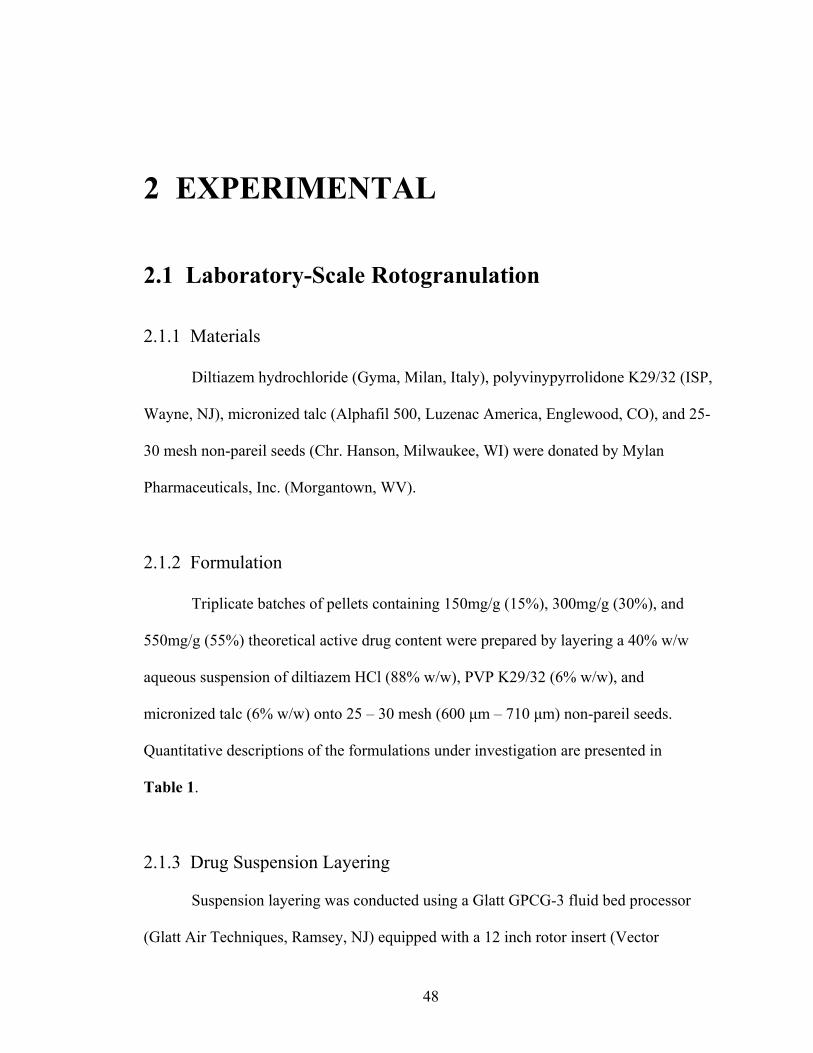
48
2 EXPERIMENTAL 2.1 Laboratory-Scale Rotogranulation 2.1.1 Materials
Diltiazem hydrochloride (Gyma, Milan, Italy), polyvinypyrrolidone K29/32 (ISP,
Wayne, NJ), micronized talc (Alphafil 500, Luzenac America, Englewood, CO), and 25-
30 mesh non-pareil seeds (Chr. Hanson, Milwaukee, WI) were donated by Mylan
Pharmaceuticals, Inc. (Morgantown, WV).
2.1.2 Formulation
Triplicate batches of pellets containing 150mg/g (15%), 300mg/g (30%), and
550mg/g (55%) theoretical active drug content were prepared by layering a 40% w/w
aqueous suspension of diltiazem HCl (88% w/w), PVP K29/32 (6% w/w), and
micronized talc (6% w/w) onto 25 – 30 mesh (600 µm – 710 µm) non-pareil seeds.
Quantitative descriptions of the formulations under investigation are presented in
Table 1.
2.1.3 Drug Suspension Layering
Suspension layering was conducted using a Glatt GPCG-3 fluid bed processor
(Glatt Air Techniques, Ramsey, NJ) equipped with a 12 inch rotor insert (Vector
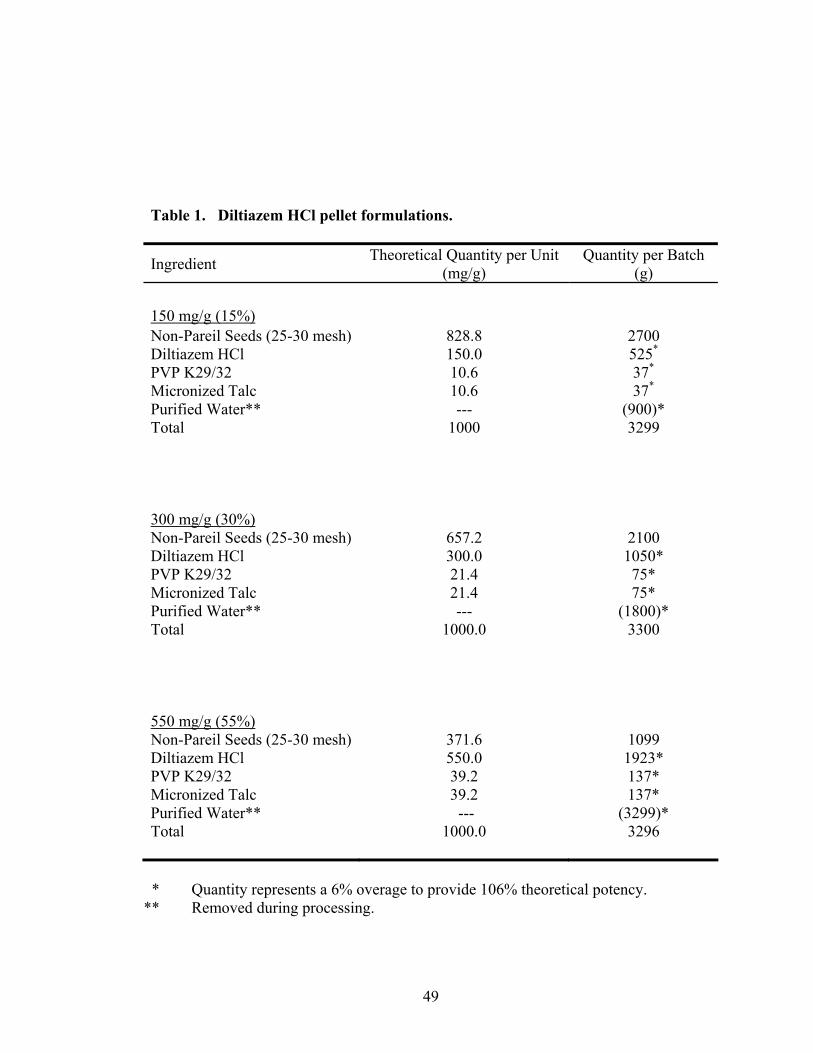
49
Table 1. Diltiazem HCl pellet formulations.
Ingredient Theoretical Quantity per Unit (mg/g)
Quantity per Batch (g)
150 mg/g (15%) Non-Pareil Seeds (25-30 mesh) 828.8 2700 Diltiazem HCl 150.0 525* PVP K29/32 10.6 37* Micronized Talc 10.6 37* Purified Water** --- (900)* Total 1000 3299 300 mg/g (30%) Non-Pareil Seeds (25-30 mesh) 657.2 2100 Diltiazem HCl 300.0 1050* PVP K29/32 21.4 75* Micronized Talc 21.4 75* Purified Water** --- (1800)* Total 1000.0 3300 550 mg/g (55%) Non-Pareil Seeds (25-30 mesh) 371.6 1099 Diltiazem HCl 550.0 1923* PVP K29/32 39.2 137* Micronized Talc 39.2 137* Purified Water** --- (3299)* Total 1000.0 3296
* Quantity represents a 6% overage to provide 106% theoretical potency. ** Removed during processing.

50
Corporation, Cranberry, NJ). Formulations were designed to yield approximately 3300
grams of finished product, in order to achieve 100% rotor capacity at the process
endpoint. Drug suspension was delivered via a Masterflex peristaltic pump (Cole-Parmer
Instrument Co., Chicago, IL) to a tangential spray system equipped with a 1.2 mm nozzle
tip. The spray gun was completely immersed in the rotating product throughout the
layering process. During processing, product temperatures were maintained between
38°C and 42°C, and rotor speeds varied from 525 to 575 rpm. Angular velocity was ~29
ft/sec. Spray rates varied from 10 g/min to 25 g/min while atomizing air pressure was
constant at 40 psi. Processing parameters are presented in Table 2. Of the listed
parameters, inlet air temperature and process spray rate were most critical for maintaining
appropriate temperature control to avoid spray drying or agglomeration. Process spray
rates for the 150mg/g, 300mg/g and 550mg/g formulations are presented in Figures 3, 4,
and 5, respectively, as a function of time.
Suspension spray rates were kept low at early process times to ensure rapid
solvent evaporation following suspension contact with the pellet surface and prevent
agglomeration. As the rotor and the product reached an equilibrium temperature and the
particle size and quantity of the pellets increased during processing, it was possible to
increase spray rates without forming agglomerates. Inlet air temperature and air flow
were adjusted to maintain a product temperature of ~40ºC, which, during initial process
optimization studies, produced few agglomerates (≥16 mesh) or fines (<30 mesh). Spray
rates varied depending on the pellet strength being processed. Smaller diameter pellets,
such as those employed in the 150mg/gram strength, required slightly slower spray rates
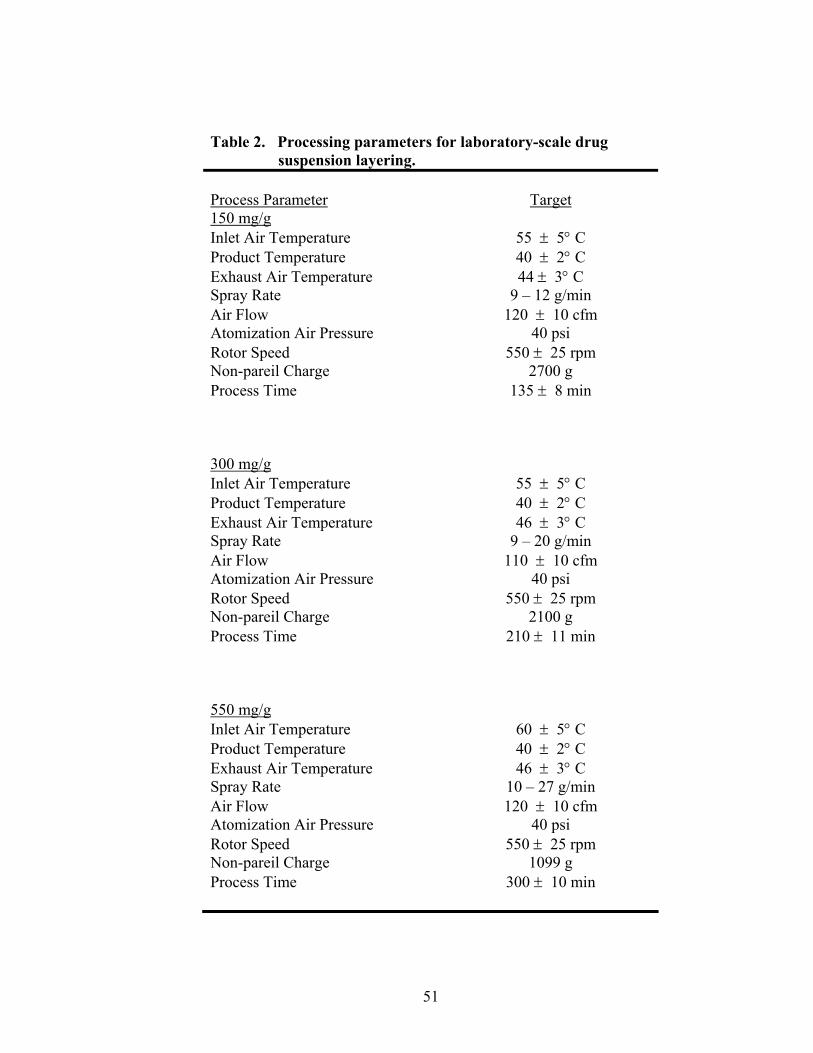
51
Table 2. Processing parameters for laboratory-scale drug suspension layering. Process Parameter Target 150 mg/g Inlet Air Temperature 55 ± 5° C Product Temperature 40 ± 2° C Exhaust Air Temperature 44 ± 3° C Spray Rate 9 – 12 g/min Air Flow 120 ± 10 cfm Atomization Air Pressure 40 psi Rotor Speed 550 ± 25 rpm Non-pareil Charge 2700 g Process Time 135 ± 8 min 300 mg/g Inlet Air Temperature 55 ± 5° C Product Temperature 40 ± 2° C Exhaust Air Temperature 46 ± 3° C Spray Rate 9 – 20 g/min Air Flow 110 ± 10 cfm Atomization Air Pressure 40 psi Rotor Speed 550 ± 25 rpm Non-pareil Charge 2100 g Process Time 210 ± 11 min 550 mg/g Inlet Air Temperature 60 ± 5° C Product Temperature 40 ± 2° C Exhaust Air Temperature 46 ± 3° C Spray Rate 10 – 27 g/min Air Flow 120 ± 10 cfm Atomization Air Pressure 40 psi Rotor Speed 550 ± 25 rpm Non-pareil Charge 1099 g Process Time 300 ± 10 min
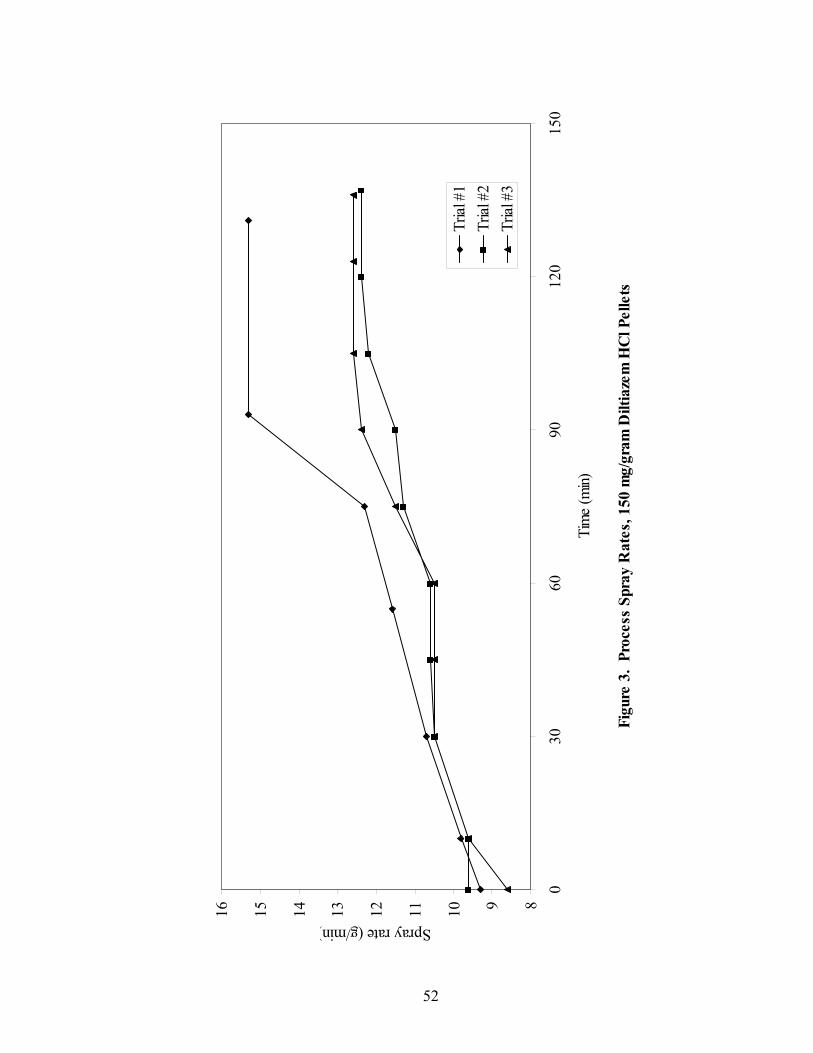
52
Figu
re 3
. Pr
oces
s Sp
ray
Rat
es, 1
50 m
g/gr
am D
iltia
zem
HC
l Pel
lets
8910111213141516
030
6090
120
150
Tim
e (m
in)
Spray rate (g/min)
Trial
#1
Trial
#2
Trial
#3
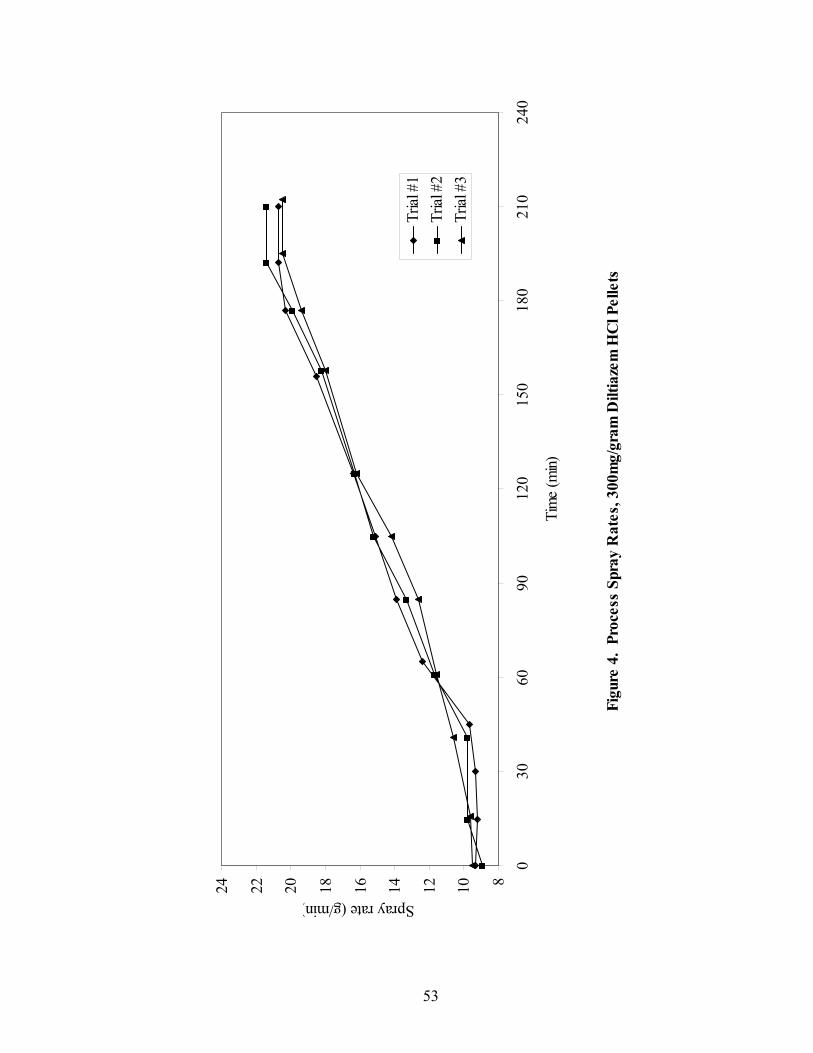
53
Figu
re 4
. Pr
oces
s Sp
ray
Rat
es, 3
00m
g/gr
am D
iltia
zem
HC
l Pel
lets
81012141618202224
030
6090
120
150
180
210
240
Tim
e (m
in)
Spray rate (g/min)
Trial
#1
Trial
#2
Trial
#3
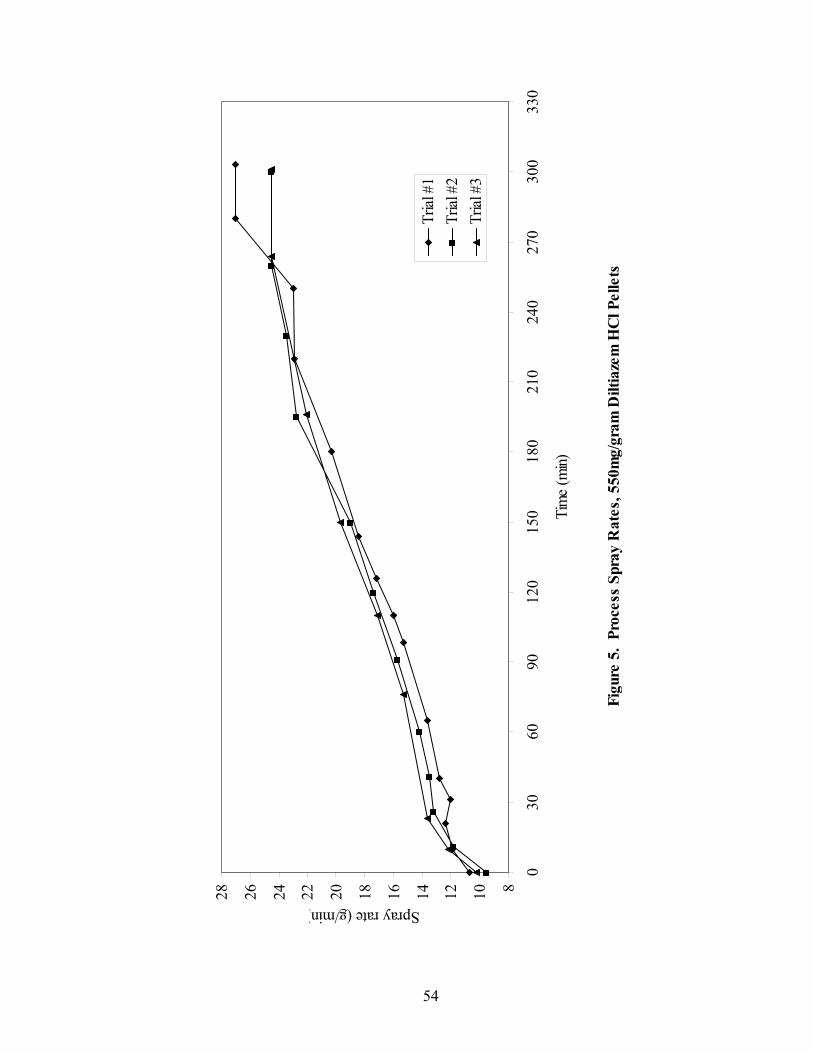
54
Figu
re 5
. Pr
oces
s Sp
ray
Rat
es, 5
50m
g/gr
am D
iltia
zem
HC
l Pel
lets
810121416182022242628
030
6090
120
150
180
210
240
270
300
330
Tim
e (m
in)
Spray rate (g/min)
Trial
#1
Trial
#2
Trial
#3
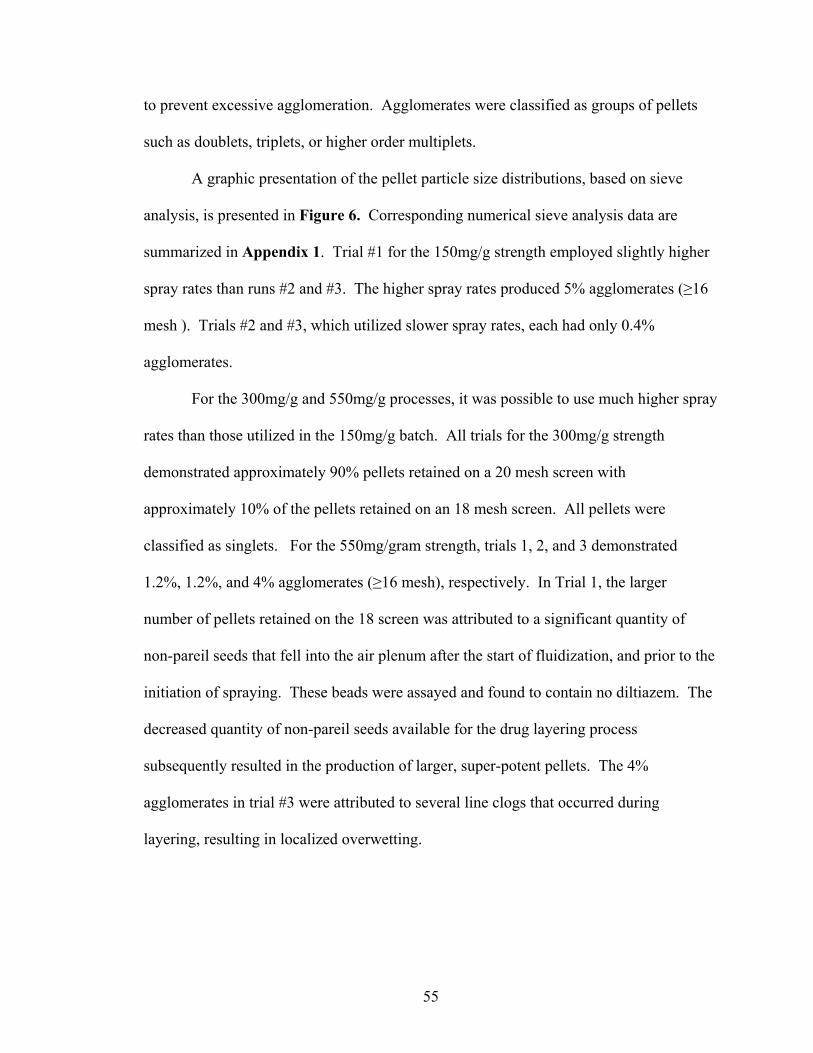
55
to prevent excessive agglomeration. Agglomerates were classified as groups of pellets
such as doublets, triplets, or higher order multiplets.
A graphic presentation of the pellet particle size distributions, based on sieve
analysis, is presented in Figure 6. Corresponding numerical sieve analysis data are
summarized in Appendix 1. Trial #1 for the 150mg/g strength employed slightly higher
spray rates than runs #2 and #3. The higher spray rates produced 5% agglomerates (≥16
mesh ). Trials #2 and #3, which utilized slower spray rates, each had only 0.4%
agglomerates.
For the 300mg/g and 550mg/g processes, it was possible to use much higher spray
rates than those utilized in the 150mg/g batch. All trials for the 300mg/g strength
demonstrated approximately 90% pellets retained on a 20 mesh screen with
approximately 10% of the pellets retained on an 18 mesh screen. All pellets were
classified as singlets. For the 550mg/gram strength, trials 1, 2, and 3 demonstrated
1.2%, 1.2%, and 4% agglomerates (≥16 mesh), respectively. In Trial 1, the larger
number of pellets retained on the 18 screen was attributed to a significant quantity of
non-pareil seeds that fell into the air plenum after the start of fluidization, and prior to the
initiation of spraying. These beads were assayed and found to contain no diltiazem. The
decreased quantity of non-pareil seeds available for the drug layering process
subsequently resulted in the production of larger, super-potent pellets. The 4%
agglomerates in trial #3 were attributed to several line clogs that occurred during
layering, resulting in localized overwetting.
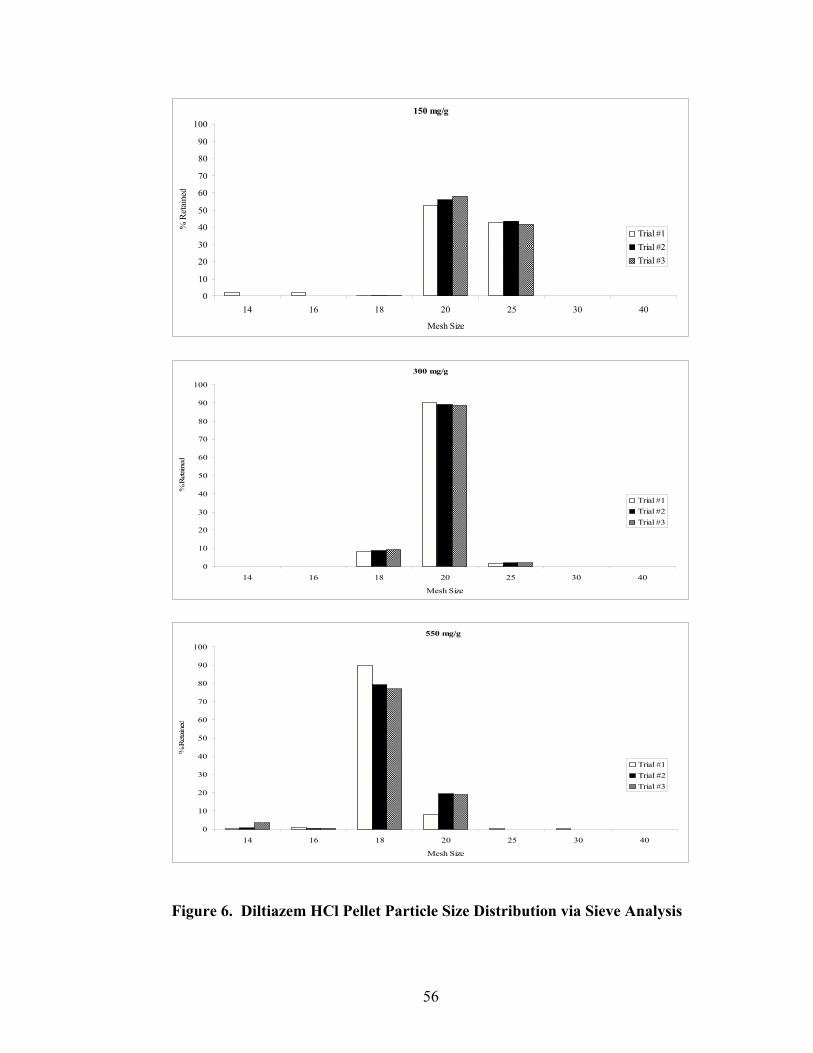
56
150 mg/g
0
10
20
30
40
50
60
70
80
90
100
14 16 18 20 25 30 40
Mesh Size
% R
etai
ned
Trial #1Trial #2Trial #3
300 mg/g
0
10
20
30
40
50
60
70
80
90
100
14 16 18 20 25 30 40
Mesh Size
% R
etai
ned
Trial #1Trial #2Trial #3
550 mg/g
0
10
20
30
40
50
60
70
80
90
100
14 16 18 20 25 30 40
Mesh Size
% R
etai
ned
Trial #1Trial #2Trial #3
Figure 6. Diltiazem HCl Pellet Particle Size Distribution via Sieve Analysis
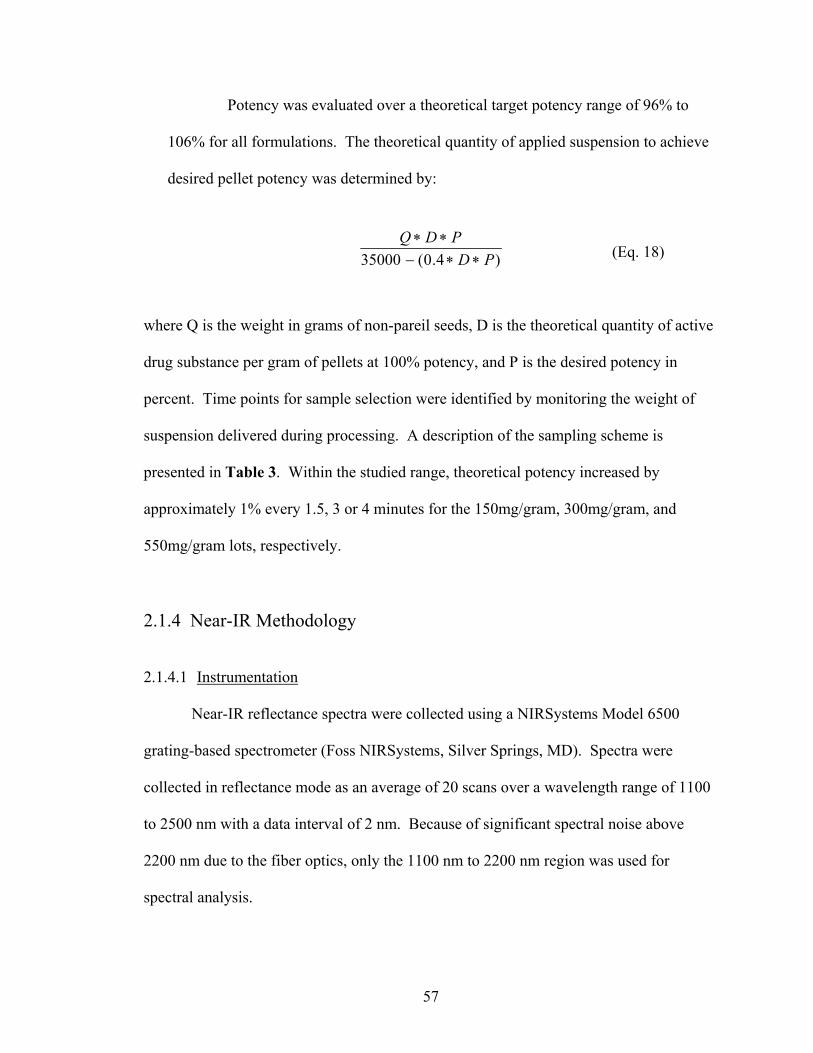
57
)4.0(35000 PDPDQ
∗∗−∗∗
Potency was evaluated over a theoretical target potency range of 96% to
106% for all formulations. The theoretical quantity of applied suspension to achieve
desired pellet potency was determined by:
(Eq. 18)
where Q is the weight in grams of non-pareil seeds, D is the theoretical quantity of active
drug substance per gram of pellets at 100% potency, and P is the desired potency in
percent. Time points for sample selection were identified by monitoring the weight of
suspension delivered during processing. A description of the sampling scheme is
presented in Table 3. Within the studied range, theoretical potency increased by
approximately 1% every 1.5, 3 or 4 minutes for the 150mg/gram, 300mg/gram, and
550mg/gram lots, respectively.
2.1.4 Near-IR Methodology 2.1.4.1 Instrumentation
Near-IR reflectance spectra were collected using a NIRSystems Model 6500
grating-based spectrometer (Foss NIRSystems, Silver Springs, MD). Spectra were
collected in reflectance mode as an average of 20 scans over a wavelength range of 1100
to 2500 nm with a data interval of 2 nm. Because of significant spectral noise above
2200 nm due to the fiber optics, only the 1100 nm to 2200 nm region was used for
spectral analysis.
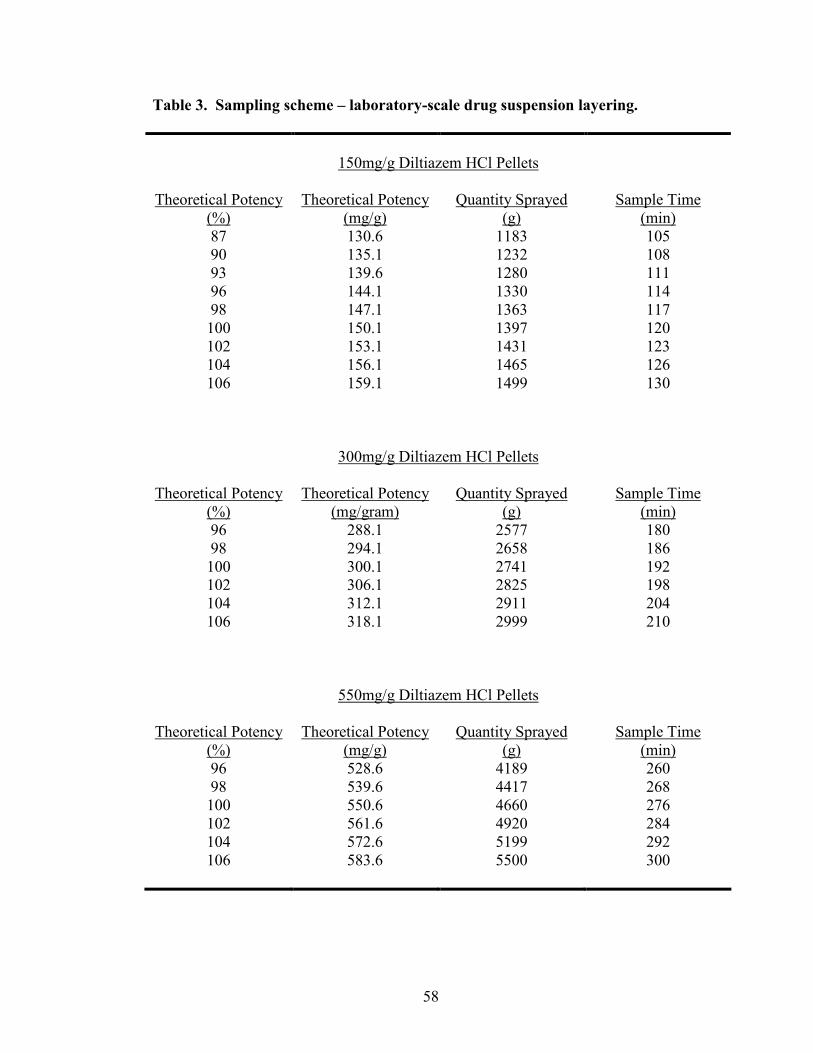
58
Table 3. Sampling scheme – laboratory-scale drug suspension layering.
150mg/g Diltiazem HCl Pellets
Theoretical Potency
(%) Theoretical Potency
(mg/g) Quantity Sprayed
(g) Sample Time
(min) 87 130.6 1183 105 90 135.1 1232 108 93 139.6 1280 111 96 144.1 1330 114 98 147.1 1363 117 100 150.1 1397 120 102 153.1 1431 123 104 156.1 1465 126 106 159.1 1499 130
300mg/g Diltiazem HCl Pellets
Theoretical Potency (%)
Theoretical Potency (mg/gram)
Quantity Sprayed (g)
Sample Time (min)
96 288.1 2577 180 98 294.1 2658 186 100 300.1 2741 192 102 306.1 2825 198 104 312.1 2911 204 106 318.1 2999 210
550mg/g Diltiazem HCl Pellets
Theoretical Potency (%)
Theoretical Potency (mg/g)
Quantity Sprayed (g)
Sample Time (min)
96 528.6 4189 260 98 539.6 4417 268 100 550.6 4660 276 102 561.6 4920 284 104 572.6 5199 292 106 583.6 5500 300
59
2.1.4.2 In-line Spectrometry
To facilitate in-line spectroscopic monitoring of the drug suspension layering
process, the rotor unit was modified to allow the insertion of a 0.5 inch diameter near-IR
fiber-optic probe (Smart-Probe®, Foss/NIRSystems, Silver Spring, MD) directly into the
processing chamber. The probe had a 0.8 cm sapphire window, and consisted of two
collinear fiber optic bundles. Each bundle was 2.5 m long, and was comprised of 210
optic fibers (each 200 µm diameter). One bundle transmitted light from the exit slit of the
monochromator to the sample, while the other bundle returned the reflected light from the
sample to a PbS detector. The fiber-optic-probe was located 180° from the tangential
spray nozzle 2 inches above the rotor disk. This vertical proximity of the probe was
equivalent to approximately ½ of the product bed height. The probe was adjusted such
that its tip was even with the inside wall of the rotor processor, and in direct contact with
the rotating particles. Figure 7 presents a schematic drawing of the in-line sampling
system for rotogranulation. Photographs of the sampling system are shown in Figure 8.
During manufacturing, near-IR spectra of the rotating particles were obtained at
specified theoretical potency intervals by monitoring the weight of suspension delivered.
The time required to obtain one spectrum of 20 averaged scans was 20 seconds. The
number of pellets comprising a monolayer across the surface of the probe’s window was
approximately 77, 58, and 47, for the 150mg/g, 300mg/g, and 550mg/gram strengths,
respectively. Therefore, in the time to obtain one spectrum, between ~950,000
(550mg/g) and ~1.5 million pellets (150mg/g) were scanned.
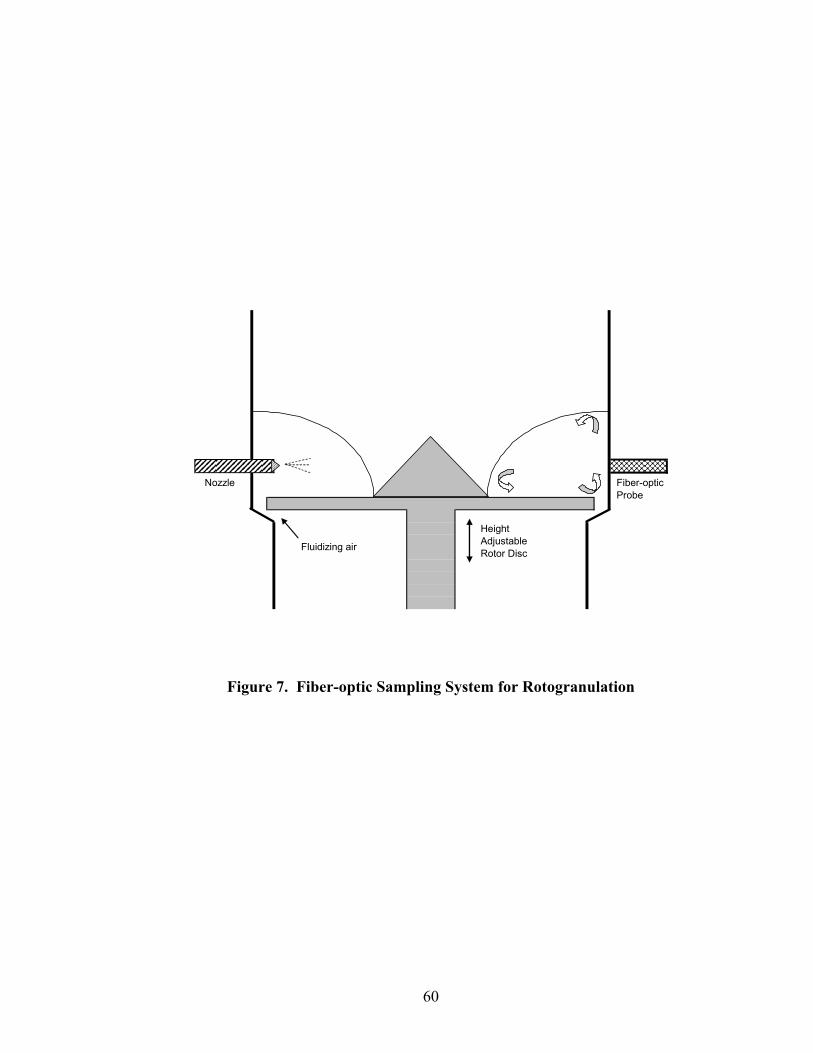
60
HeightAdjustableRotor DiscFluidizing air
Nozzle Fiber-opticProbe
Figure 7. Fiber-optic Sampling System for Rotogranulation
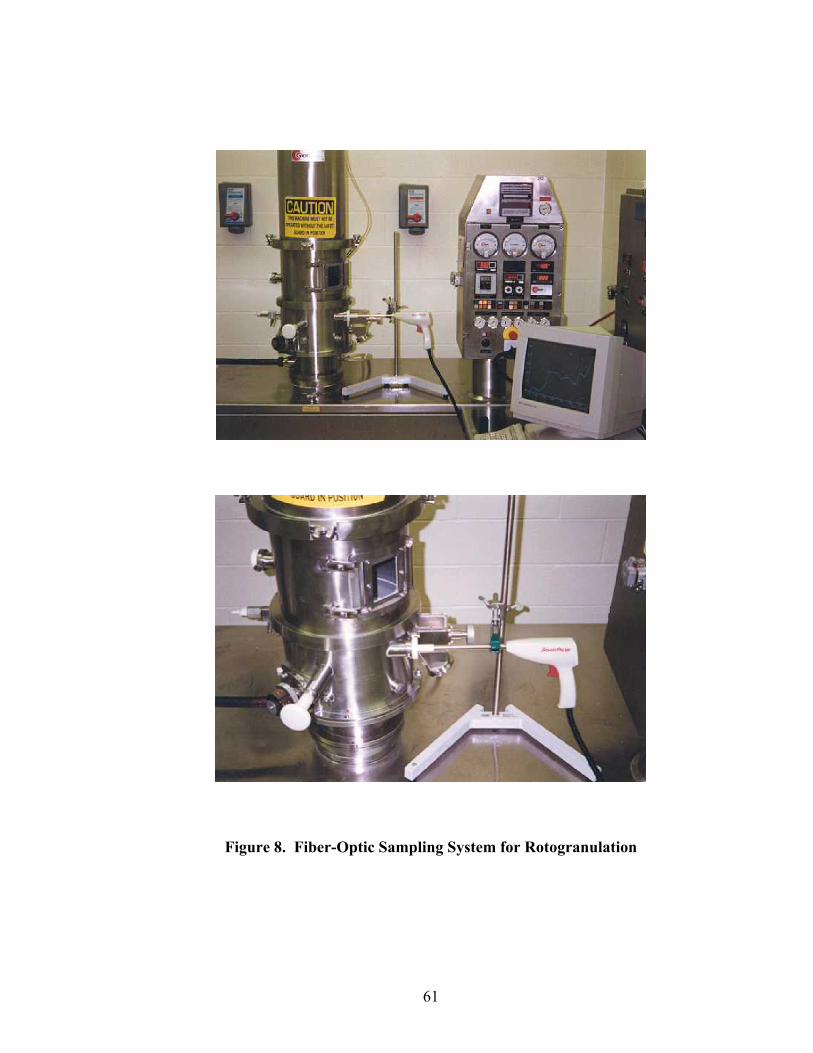
61
Figure 8. Fiber-Optic Sampling System for Rotogranulation
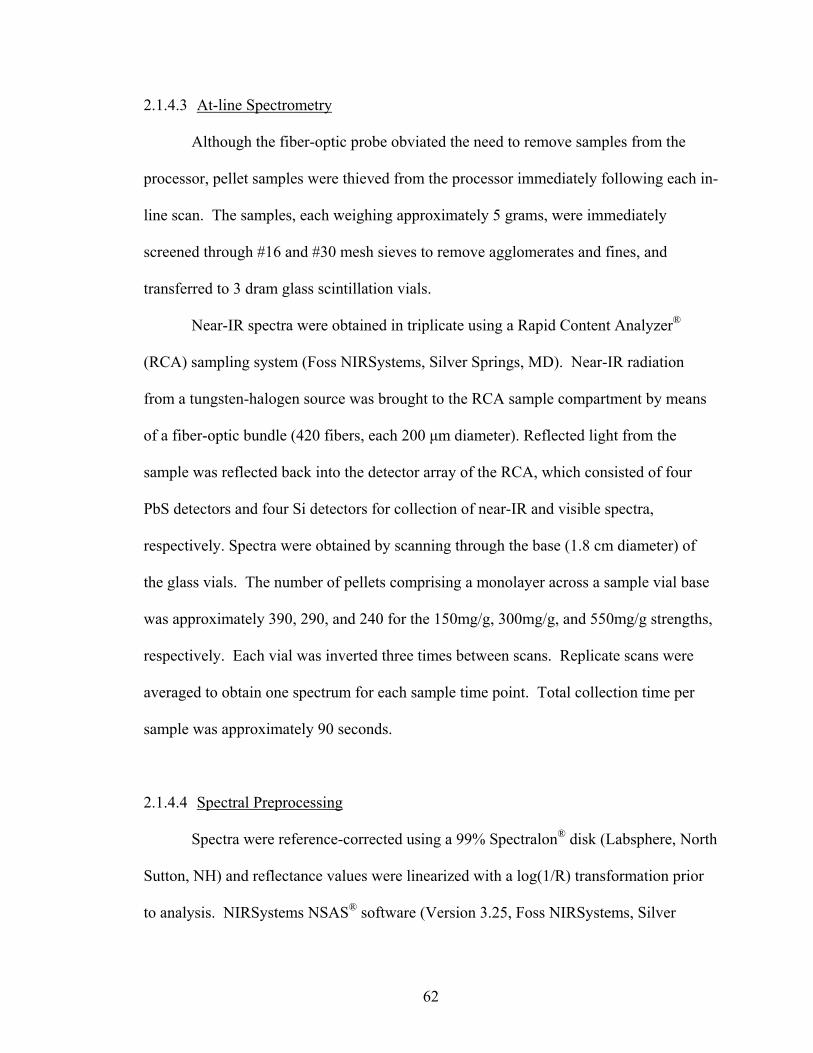
62
2.1.4.3 At-line Spectrometry
Although the fiber-optic probe obviated the need to remove samples from the
processor, pellet samples were thieved from the processor immediately following each in-
line scan. The samples, each weighing approximately 5 grams, were immediately
screened through #16 and #30 mesh sieves to remove agglomerates and fines, and
transferred to 3 dram glass scintillation vials.
Near-IR spectra were obtained in triplicate using a Rapid Content Analyzer®
(RCA) sampling system (Foss NIRSystems, Silver Springs, MD). Near-IR radiation
from a tungsten-halogen source was brought to the RCA sample compartment by means
of a fiber-optic bundle (420 fibers, each 200 µm diameter). Reflected light from the
sample was reflected back into the detector array of the RCA, which consisted of four
PbS detectors and four Si detectors for collection of near-IR and visible spectra,
respectively. Spectra were obtained by scanning through the base (1.8 cm diameter) of
the glass vials. The number of pellets comprising a monolayer across a sample vial base
was approximately 390, 290, and 240 for the 150mg/g, 300mg/g, and 550mg/g strengths,
respectively. Each vial was inverted three times between scans. Replicate scans were
averaged to obtain one spectrum for each sample time point. Total collection time per
sample was approximately 90 seconds.
2.1.4.4 Spectral Preprocessing
Spectra were reference-corrected using a 99% Spectralon® disk (Labsphere, North
Sutton, NH) and reflectance values were linearized with a log(1/R) transformation prior
to analysis. NIRSystems NSAS® software (Version 3.25, Foss NIRSystems, Silver
63
Springs, MD) was used for spectral processing. Chemometric analysis was performed
using proprietary programs written in SPEAKEASY IV EPSILON +® (Speakeasy
Computing Corp., Chicago, IL) and NSAS® software. Multiplicative scatter correction
(MSC) or second derivative (D2) transformation of the spectra was performed prior to
calibration development and at-line or in-line prediction to remove unwanted spectral
variation due to particle size, density, and sample positioning, temperature and humidity
fluctuation.
2.1.5 Diltiazem HCl Reference Assay Diltiazem HCl content of the pellet samples was determined using a validated
HPLC method according to the USP 24 monograph for Diltiazem HCl Extended Release
Beads (130). A stock solution of diltiazem HCl (1 mg/ml) was prepared in methanol.
Subsequently, the stock solution was diluted with 50:50 phosphate buffer:acetonitrile to
obtain standard concentrations of 5, 10, 20, 30, 40, and 50 µg/ml. The samples were
analyzed using a Hewlett-Packard model liquid chromatograph (Model 1050, Palo Alto,
CA) equipped with a diode array detector. A 4.6 mm x 150 mm column (Phenomenex,
Torrance, CA) having 5 µm L7 (C-8) packing was used in the study. A 50:50 v/v
mixture of 0.05M monobasic potassium phosphate pH 3.0 buffer containing 0.05%
triethylamine and acetonitrile was employed as the mobile phase. The mobile phase was
degassed by sparging with helium for 30 minutes and filtered through a 25 mm 0.45 µm
hydrophilic PTFE membrane filter (Millex-LCR®, Millipore, Bedford, MA) prior to use.
The flow rate was 1 ml/min, the detector wavelength was set at 240 nm, and the sample
injection volume was 20 µl. A linear regression was performed between the area-under-

64
the-curve (AUC) and the drug concentration values. Replicate solutions were made for
each concentration over a three day period. Figure 9 displays the standard curve
obtained. The R2 value for the calibration was 0.9999. Triplicate injections of the 30
mcg/ml standard over a three day period demonstrated an RSD of 0.25%.
The diltiazem HCl content of prepared pellet samples was determined by
transferring each pellet sample to a 100 ml volumetric flask and diluting with 60 ml
methanol. The flasks were capped, placed on a mechanical shaker for 30 min, sonicated
for 10 min, and then diluted to volume with methanol. From each flask, a 3 ml aliquot
was obtained, diluted to 100 ml with mobile phase, and mixed. The resulting solution
was passed through a 0.45 µm filter and transferred to HPLC vials for analysis.
2.1.6 Quantitative Prediction of Pellet Potency
Several calibration models were investigated for predicting the diltiazem HCl
content of drug layered pellets. The simplest models assessed single or multiple
wavelength calibration. More complex multivariate techniques such as PCR and PLSR
were also investigated in this study. To assess the significance of spectral preprocessing
on calibration development and performance, separate were developed for MSC and D2
spectra. Single and multiple wavelength calibrations, and PCR were performed using
chemometric routines written in SPEAKEASY®. PLSR was performed using NSAS®
software.
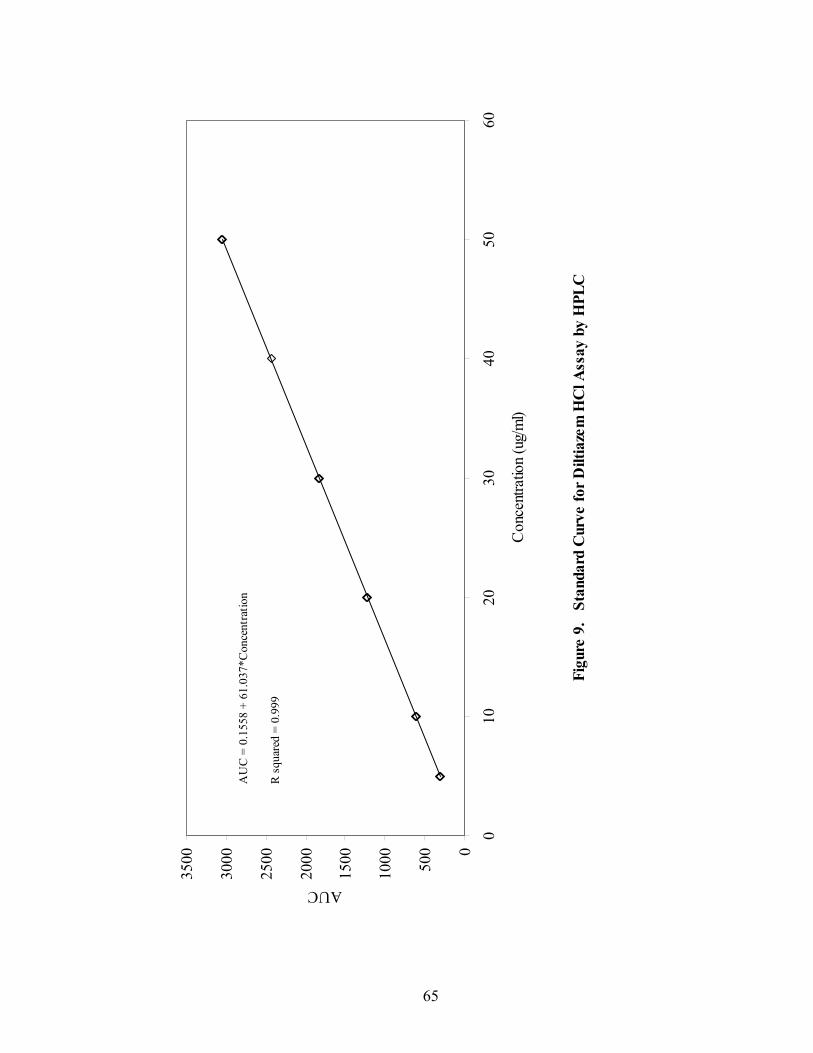
65
Figu
re 9
. S
tand
ard
Cur
ve fo
r Dilt
iaze
m H
Cl A
ssay
by
HPL
C
0
500
1000
1500
2000
2500
3000
3500
010
2030
4050
60
Con
cent
ratio
n (u
g/m
l)
AUC
AU
C =
0.1
558
+ 61
.037
*Con
cent
ratio
n
R s
quar
ed =
0.9
99

66
2.2 Pilot-Scale Rotogranulation
2.2.1 Materials
Diltiazem hydrochloride (Gyma, Milan, Italy), polyvinypyrrolidone K29/32 (ISP,
Wayne, NJ), micronized talc (Alphafil 500, Luzenac America, Englewood, CO), and 25-
30 mesh non-pareil seeds (Chr. Hanson, Milwaukee, WI) were donated by Mylan
Pharmaceuticals, Inc. (Morgantown, WV).
2.2.2 Formulation
Two 75 kg batches of pellets containing 550mg/g (55%) theoretical active drug
content were prepared by layering a 40% w/w aqueous suspension of diltiazem HCl (88%
w/w), PVP K29/32 (6% w/w), and micronized talc (6% w/w) onto 25-30 mesh non-pareil
seeds. Quantitative descriptions of the formulations under investigation are presented in
Table 4.
2.2.3 Drug Suspension Layering
Suspension layering was conducted using a Vector FL-Multi-60 fluid bed
processor (Vector Corporation, Marion, IA) equipped with a 30 inch rotor insert (Vector
Corporation, Marion, IA). Formulations were designed to yield approximately 75 kg of
finished product to achieve 100% rotor capacity at the process endpoint. Drug
suspension was delivered via a peristaltic pump (Model 520DI, Watson Marlow,
Wilmington, MA) to a four-nozzle tangential spray system in which each spray gun was
equipped with a 1.2 mm nozzle tip. The spray gun was completely immersed in the
rotating product throughout the layering process. During processing, product

67
Table 4. Pilot-scale diltiazem HCl pellet formulation.
Ingredient Theoretical Quantity per Unit (mg)
Quantity per Batch (kg)
550 mg/g (55%) Non-Pareil Seeds (25-30 mesh) 371.6 27.9 Diltiazem HCl 550.0 41.3 PVP K29/32 39.2 2.9 Micronized Talc 39.2 2.9 Purified Water* --- (70.7)* Total 1000.0 75.0
* Removed during processing.
68
temperatures were maintained between 38°C and 48°C, and rotor speeds varied from 75
to 90 rpm. Angular velocity was ~12 ft/sec. Spray rates varied from ~240 g/min to ~465
g/min while atomizing air pressure was constant at 50 psi. Processing parameters are
presented in Table 5. Of the listed parameters, inlet air temperature and spray rate were
most critical for maintaining proper product temperature and avoiding spray drying or
agglomeration. Process spray rates, as a function of time, for the pilot-scale formulations
are presented in Figure 10.
Process spray rates were initially low to prevent agglomeration of the pellets
during early process stages. As processing continued and the product and the fluid bed
processor reached equilibrium temperature, spray rates were increased as necessary to
maintain a target bed temperature of ~48°C. A graphic representation of the pellet
particle size distributions, based on sieve analysis, is presented in Figure 11.
Corresponding sieve analysis data are summarized in Appendix 2.
Both pilot-scale batches had approximately 80% of the pellets retained on a #20
mesh screen and approximately 15% of the pellets retained on a #18 mesh screen. All
pellets retained on these screen sizes were classified as singlets. Trial #1 had
approximately 2.4% agglomerates (>18 mesh) and Trial #2 had approximately 4.6%
agglomerates. The slightly higher quantity of agglomerates observed for Trail #2 as
compared to Trail #1 and was attributed to a slightly higher spray rate at early time
points.
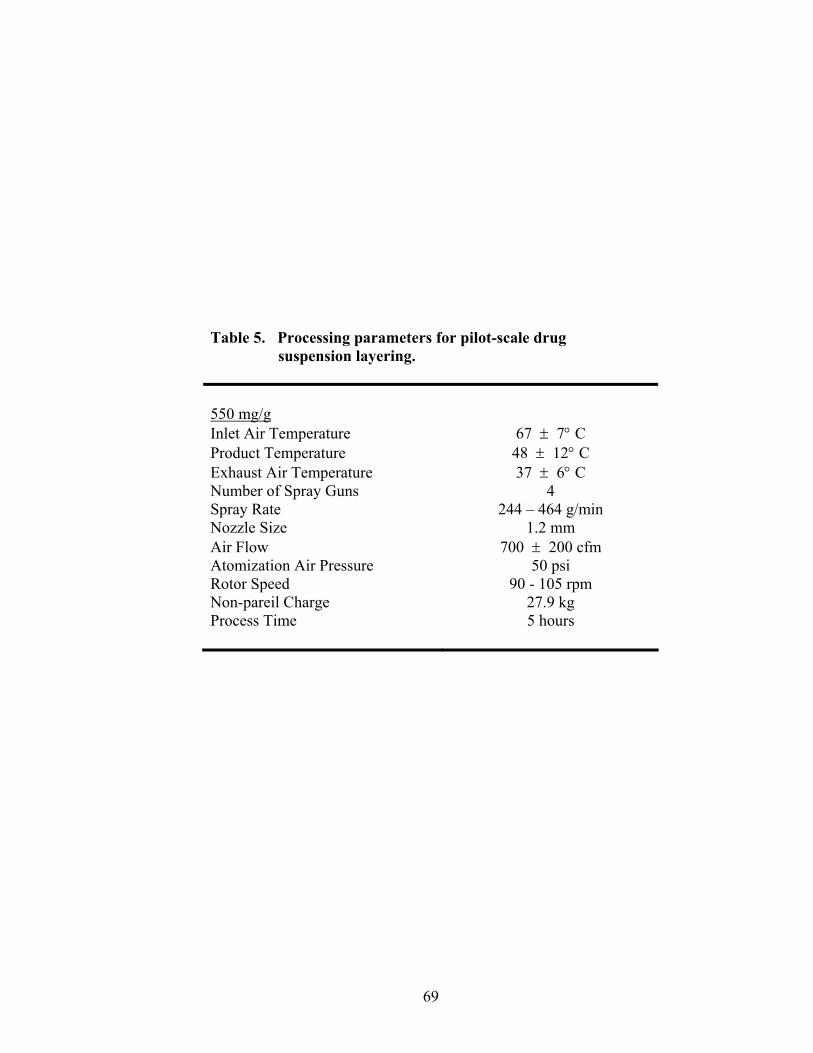
69
Table 5. Processing parameters for pilot-scale drug suspension layering. 550 mg/g Inlet Air Temperature 67 ± 7° C Product Temperature 48 ± 12° C Exhaust Air Temperature 37 ± 6° C Number of Spray Guns 4 Spray Rate 244 – 464 g/min Nozzle Size 1.2 mm Air Flow 700 ± 200 cfm Atomization Air Pressure 50 psi Rotor Speed 90 - 105 rpm Non-pareil Charge 27.9 kg Process Time 5 hours
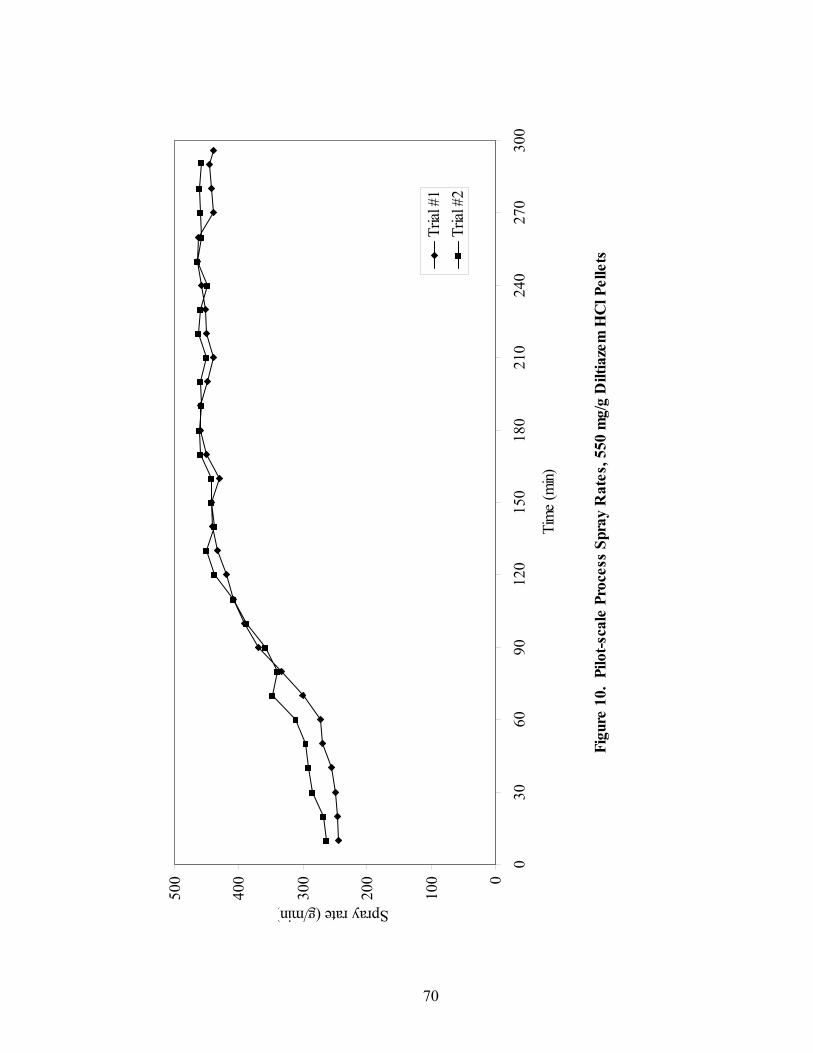
70
Figu
re 1
0. P
ilot-s
cale
Pro
cess
Spr
ay R
ates
, 550
mg/
g D
iltia
zem
HC
l Pel
lets
0
100
200
300
400
500
030
6090
120
150
180
210
240
270
300
Tim
e (m
in)
Spray rate (g/min)
Trial
#1
Trial
#2
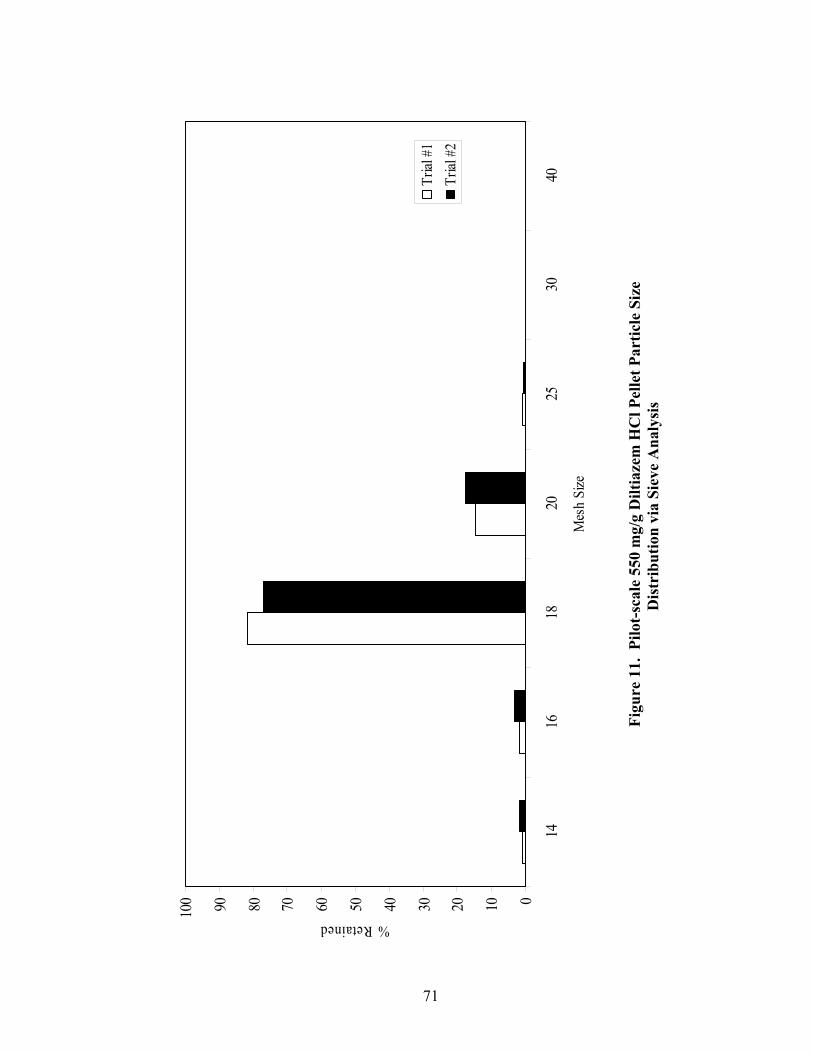
71
0102030405060708090100
1416
1820
2530
40
Mes
h Si
ze
% Retained
Trial
#1
Trial
#2
F
igur
e 11
. Pi
lot-
scal
e 55
0 m
g/g
Dilt
iaze
m H
Cl P
elle
t Par
ticle
Siz
e
D
istr
ibut
ion
via
Siev
e A
naly
sis
72
)4.0(35000 PDPDQ
∗∗−∗∗
Potency was evaluated over a theoretical target potency range of 90% to 100% for
both formulations. The theoretical quantity of applied suspension to achieve desired
pellet potency was determined by:
(Eq. 19)
where Q is the weight in kg of non-pareil seeds, D is the theoretical quantity of active
drug substance per gram of pellets at 100% potency, and P is the desired potency in
percent. Time points for sample selection were identified by monitoring the weight of
suspension delivered during processing. A description of the sampling scheme is
presented in Table 6. Within the studied range, theoretical potency increased by
approximately 1% every 10 minutes.
2.2.4 Near-IR Methodology
2.2.4.1 Instrumentation
Near-IR reflectance spectra were collected using a NIRSystems Model 6500
grating-based spectrometer (Foss NIRSystems, Silver Springs, MD). Spectra were
collected in reflectance mode as an average of 20 scans over a wavelength range of 1100
to 2500 nm with a data interval of 2 nm. Because of significant spectral noise above
2200 nm due to the fiber optics, only the 1100 nm to 2200 nm region was used for
spectral analysis.

73
Table 6. Sampling scheme – pilot-scale drug suspension layering.
Theoretical Potency
(%) Theoretical Potency
(mg/g) Quantity Sprayed
(kg)
90 495 72.3 91 551 75.7 92 506 79.3 93 512 83.1 94 517 87.1 95 523 91.4 96 528 96.0 97 534 101.0 98 539 106.2 99 545 111.9 100 550 117.8
74
2.2.4.2 At-line Spectrometry
Although the fiber-optic probe obviated the need to remove samples from the
processor, pellet samples were thieved from the processor immediately following each in-
line scan. The samples, each weighing approximately 5 grams, were immediately
screened through #18 and #30 mesh sieves to remove agglomerates and fines and
transferred to 3 dram glass scintillation vials.
Near-IR spectra were obtained in triplicate using a Rapid Content Analyzer®
(RCA) sampling system (Foss NIRSystems, Silver Springs, MD). Near-IR radiation
from a tungsten-halogen source was brought to the RCA sample compartment by means
of a fiber-optic bundle (420 fibers, each 200 µm diameter). Reflected light from the
sample was reflected back into the detector array of the RCA, which consisted of four
PbS detectors and four Si detectors for collection of near-IR and visible spectra,
respectively. Spectra were obtained by scanning through the base (1.8 cm diameter) of
the glass vials. Approximately 240 pellets comprised the monolayer across sample vial
base. Each vial was inverted 3 times between scans. Replicate scans were averaged to
obtain one spectrum for each sample time point. Total collection time per sample was
approximately 90 seconds.
2.2.4.3 Spectral Preprocessing
Spectra were reference-corrected using a 99% Spectralon® disk (Labsphere, North
Sutton, NH) and reflectance values were linearized with a log(1/R) transformation prior
to analysis. NIRSystems NSAS® software was used for spectral processing and all
chemometric analysis was performed using proprietary programs written in
75
SPEAKEASY IV EPSILON +® (Speakeasy Computing Corp., Chicago, IL).
Multiplicative scatter correction (MSC) or second derivative (D2) transformation of the
spectra was performed prior to calibration development and at-line or in-line prediction to
remove unwanted spectral variation due to particle size, density, and sample positioning,
temperature and humidity fluctuation
2.2.5 Quantitative Prediction of Pellet Potency
Single wavelength, PCR and PLSR calibration models were investigated for
predicting the diltiazem HCl content of drug layered pellets. To assess the significance
of spectral preprocessing on calibration development and performance, separate
calibrations were developed for MSC and D2 spectra. Single wavelength and PCR
analyses were performed using chemometric routines written in SPEAKEASY®. PLSR
was performed using NSAS® software.
2.3 Laboratory-Scale Wurster Coating 2.3.1 Materials
Eudragit® RS30D (Rohm-Pharma, Darmstadt, Germany), triethyl citrate, NF
(Citroflex®2 NF, Morflex Inc., Greensboro, NC) and micronized talc (Alphafil 500®,
Luzenac America, Englewood, CO) were donated by Mylan Pharmaceuticals, Inc.
(Morgantown, WV).

76
2.3.2 Formulation
The diltiazem HCl pellets prepared in the rotogranulation studies were coated
with a 20% w/w suspension consisting of Eudragit® RS30D, triethyl citrate (18% w/w of
polymer solids), and micronized talc (30% w/w of polymer solids). Triplicate coating
batches were processed for each of the three different potency beads. A quantitative
description of the coating system under evaluation is presented in Table 7.
All coating suspensions were prepared according to the following procedure. The
triethyl citrate (TEC) was dispersed in the water and mixed for 30 min using a laboratory
mixer (Model G3UO5R, Lightnin, Rochester, NY) and 8 mm diameter axial flow
impeller (Model A310, Lightnin, Rochester, NY). The micronized talc was slowly added
to the TEC/water dispersion then mixed for an additional 30 min. The Eudragit® RS30D
was passed through a 40 mesh sieve to remove agglomerates then slowly stirred into the
TEC/talc suspension. The final suspension was mixed a minimum of 60 minutes prior to
application, as per the manufacturer’s recommendation, to ensure proper plasticization of
the mixture.
2.3.3 Sustained-release Coating
Coating was conducted using a Glatt GPCG-3 fluid bed processor (Glatt Air
Techniques, Ramsey, NJ) equipped with a 6 inch Wurster insert. Drug suspension was
delivered via a Masterflex peristaltic pump (Cole-Parmer Instrument Co., Chicago, IL) to
a spray system equipped with a 0.8 mm nozzle tip. During processing, spray rates varied
from 10 g/min to 15 g/min, and atomization air pressure was kept constant at 30 psi.
Airflow was varied between 800 cfm and 850 cfm and the partition height was adjusted
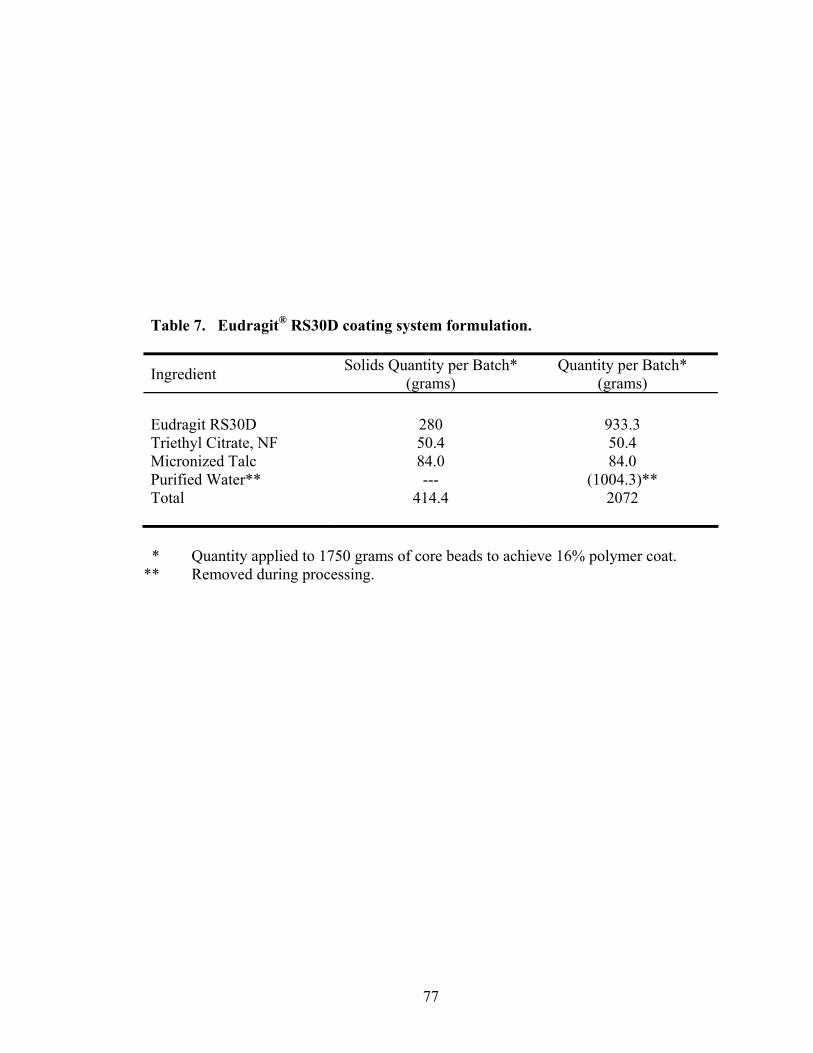
77
Table 7. Eudragit® RS30D coating system formulation.
Ingredient Solids Quantity per Batch* (grams)
Quantity per Batch* (grams)
Eudragit RS30D 280 933.3 Triethyl Citrate, NF 50.4 50.4 Micronized Talc 84.0 84.0 Purified Water** --- (1004.3)** Total 414.4 2072
* Quantity applied to 1750 grams of core beads to achieve 16% polymer coat. ** Removed during processing.
78
as needed to maintain adequate movement of the particulate bed. Inlet air temperature
was varied between 40ºC and 46ºC to maintain product temperatures between 28ºC and
30ºC. Summaries of the coating process parameters and spray rates are presented in
Table 8. Coating application rates for Eudragit® RS30D applied to 300mg/g diltiazem
HCl beads are presented in Figure 12 as a function of time. Spray rates for the 150mg/g
and 550mg/g pellets were similar to those utilized in the 300mg/g trials.
Coating was evaluated over the range of 5% to 16% applied polymer solids.
Sample points were identified by monitoring the weight of coating suspension delivered
during processing. A description of the theoretical sampling scheme is presented in
Table 9. Each minute the quantity of applied polymer increased by 0.11% which
corresponded to a 1% increase in coating level approximately every 9 minutes.
2.3.4 Near-IR Methodology
2.3.4.1 Instrumentation
Near-IR reflectance spectra were collected using a NIRSystems Model 6500
grating-based spectrometer (Foss NIRSystems, Silver Springs, MD). Spectra were
collected in reflectance mode as an average of 20 scans over a wavelength range of 1100
to 2500 nm, with a data interval of 2 nm. Since the Model 6500 spectrometer employs a
fiber optic bundle, which has significant absorbance above 2200 nm, only the 1100 nm to
2200 nm region was used for spectral analysis due to a lower instrumental signal-to-noise
(S/N) ratio within this region.
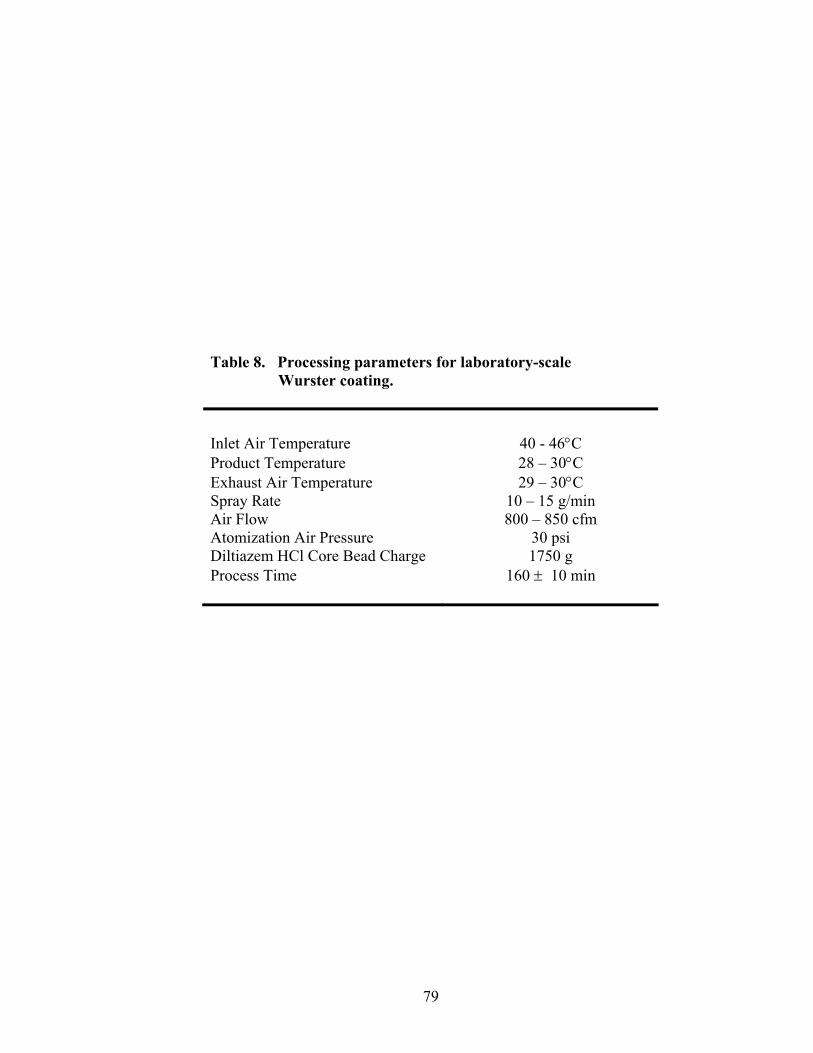
79
Table 8. Processing parameters for laboratory-scale Wurster coating. Inlet Air Temperature 40 - 46°C Product Temperature 28 – 30°C Exhaust Air Temperature 29 – 30°C Spray Rate 10 – 15 g/min Air Flow 800 – 850 cfm Atomization Air Pressure 30 psi Diltiazem HCl Core Bead Charge 1750 g Process Time 160 ± 10 min
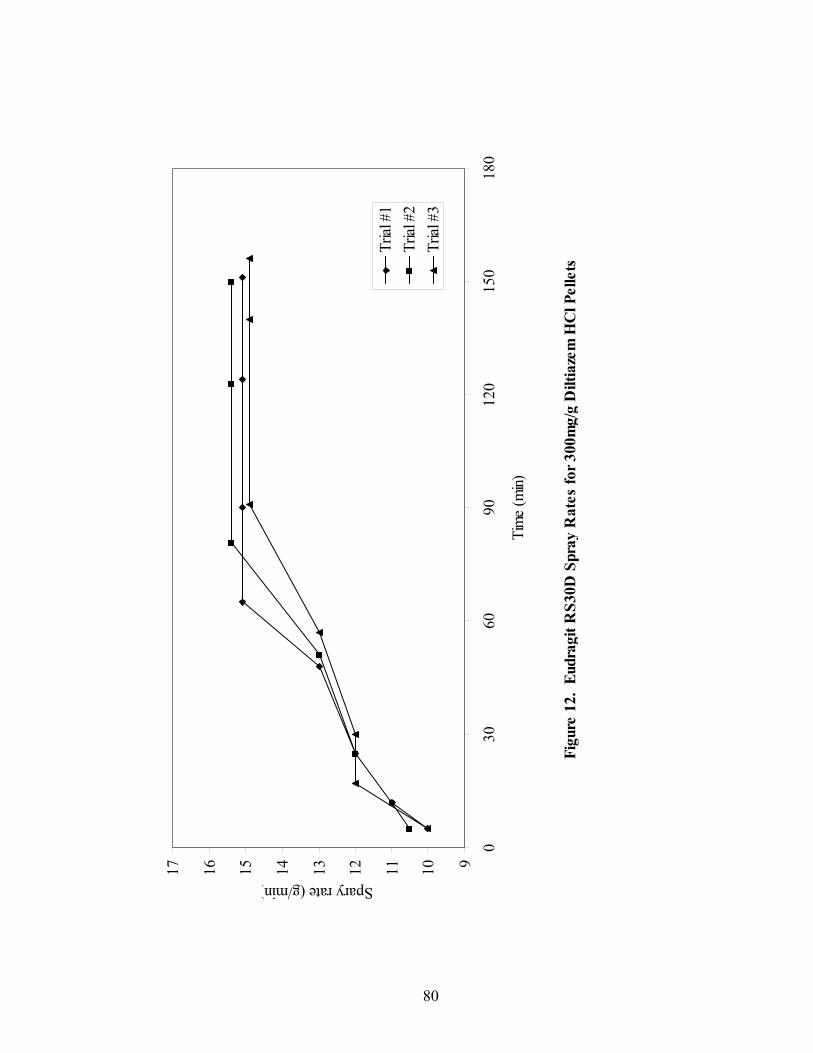
80
Figu
re 1
2. E
udra
git R
S30D
Spr
ay R
ates
for 3
00m
g/g
Dilt
iaze
m H
Cl P
elle
ts
91011121314151617
030
6090
120
150
180
Tim
e (m
in)
Spary rate (g/min)
Trial
#1
Trial
#2
Trial
#3
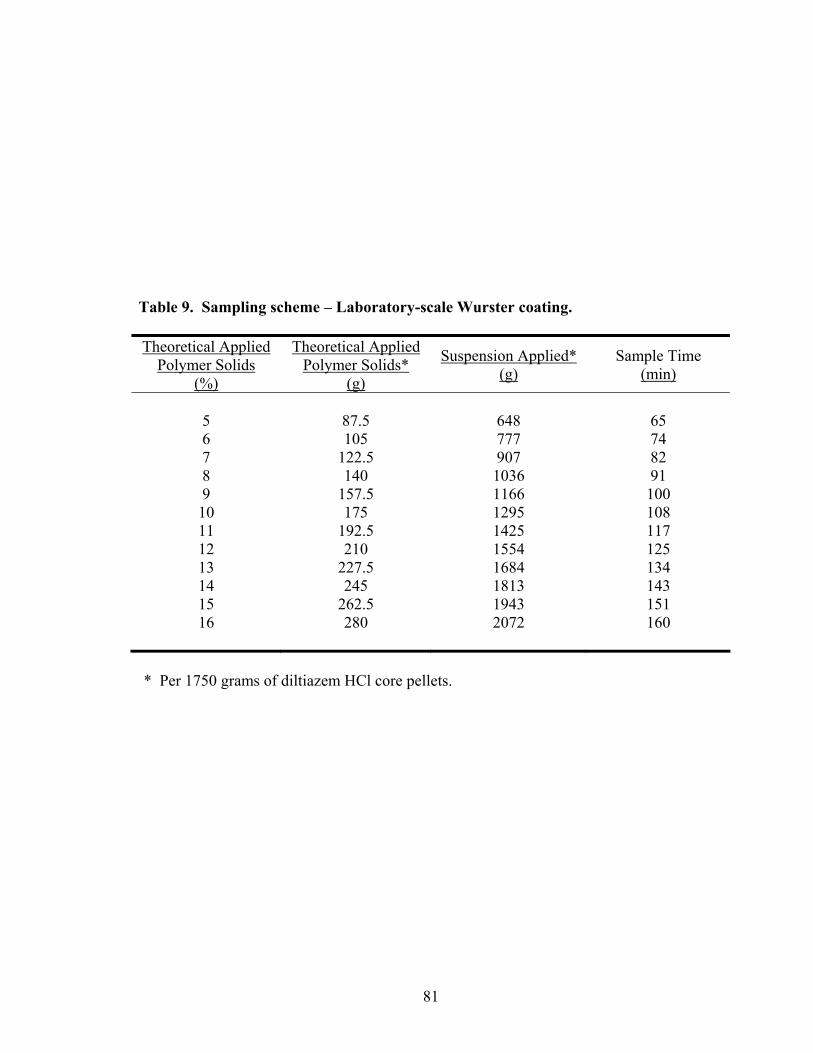
81
Table 9. Sampling scheme – Laboratory-scale Wurster coating. Theoretical Applied
Polymer Solids (%)
Theoretical Applied Polymer Solids*
(g)
Suspension Applied* (g)
Sample Time (min)
5 87.5 648 65 6 105 777 74 7 122.5 907 82 8 140 1036 91 9 157.5 1166 100 10 175 1295 108 11 192.5 1425 117 12 210 1554 125 13 227.5 1684 134 14 245 1813 143 15 262.5 1943 151 16 280 2072 160
* Per 1750 grams of diltiazem HCl core pellets.
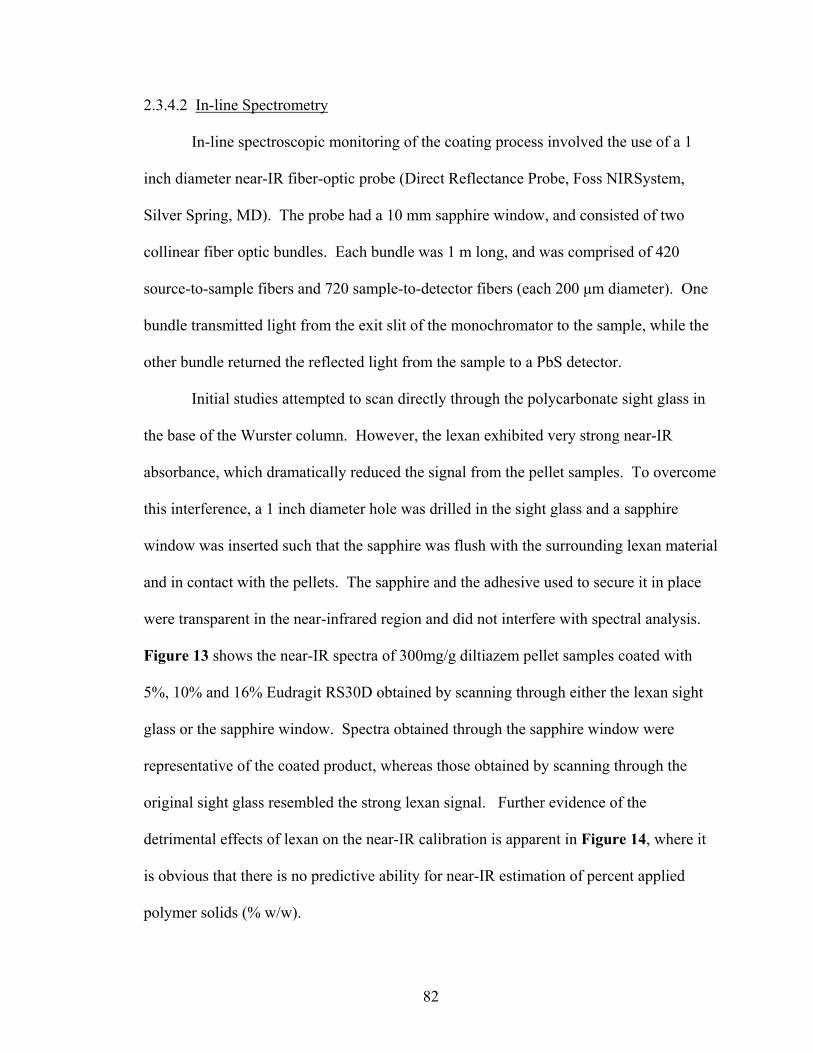
82
2.3.4.2 In-line Spectrometry
In-line spectroscopic monitoring of the coating process involved the use of a 1
inch diameter near-IR fiber-optic probe (Direct Reflectance Probe, Foss NIRSystem,
Silver Spring, MD). The probe had a 10 mm sapphire window, and consisted of two
collinear fiber optic bundles. Each bundle was 1 m long, and was comprised of 420
source-to-sample fibers and 720 sample-to-detector fibers (each 200 µm diameter). One
bundle transmitted light from the exit slit of the monochromator to the sample, while the
other bundle returned the reflected light from the sample to a PbS detector.
Initial studies attempted to scan directly through the polycarbonate sight glass in
the base of the Wurster column. However, the lexan exhibited very strong near-IR
absorbance, which dramatically reduced the signal from the pellet samples. To overcome
this interference, a 1 inch diameter hole was drilled in the sight glass and a sapphire
window was inserted such that the sapphire was flush with the surrounding lexan material
and in contact with the pellets. The sapphire and the adhesive used to secure it in place
were transparent in the near-infrared region and did not interfere with spectral analysis.
Figure 13 shows the near-IR spectra of 300mg/g diltiazem pellet samples coated with
5%, 10% and 16% Eudragit RS30D obtained by scanning through either the lexan sight
glass or the sapphire window. Spectra obtained through the sapphire window were
representative of the coated product, whereas those obtained by scanning through the
original sight glass resembled the strong lexan signal. Further evidence of the
detrimental effects of lexan on the near-IR calibration is apparent in Figure 14, where it
is obvious that there is no predictive ability for near-IR estimation of percent applied
polymer solids (% w/w).
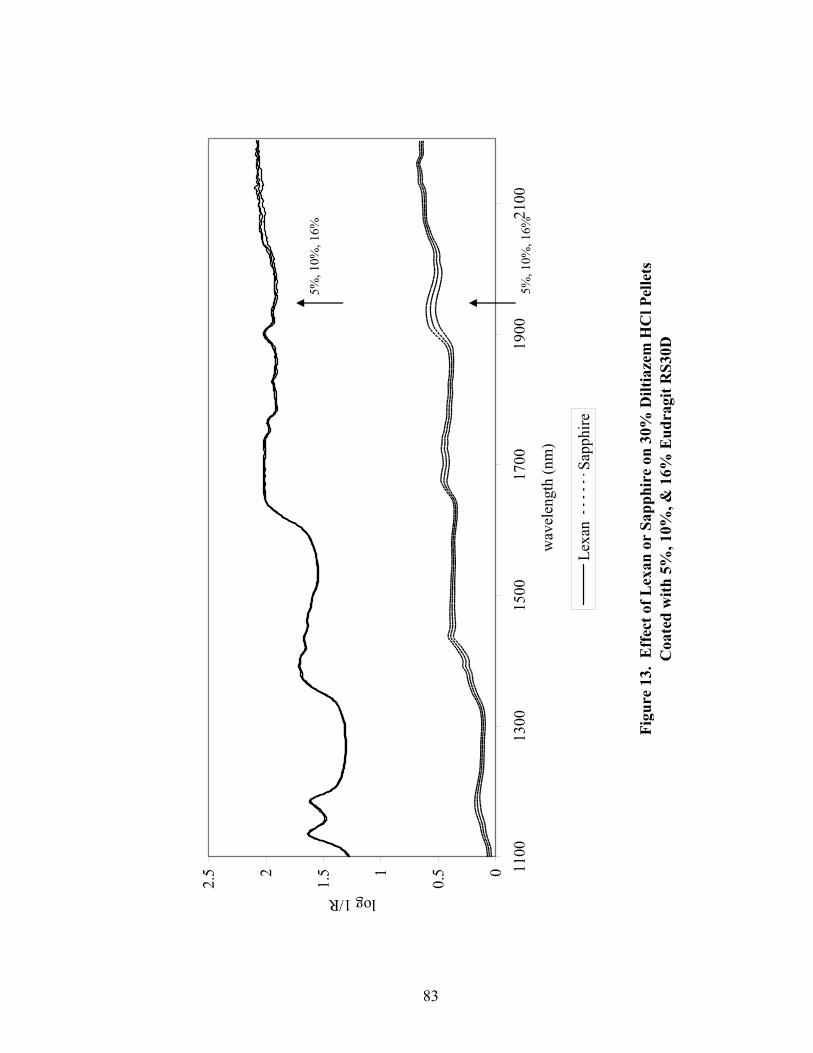
83
Figu
re 1
3. E
ffec
t of L
exan
or
Sapp
hire
on
30%
Dilt
iaze
m H
Cl P
elle
ts
Coa
ted
with
5%
, 10%
, & 1
6% E
udra
git R
S30D
0
0.51
1.52
2.5 11
0013
0015
0017
0019
0021
00
wav
elen
gth
(nm
)
log 1/R
Lexa
nSa
pphi
re
5%, 1
0%, 1
6%
5%, 1
0%, 1
6%
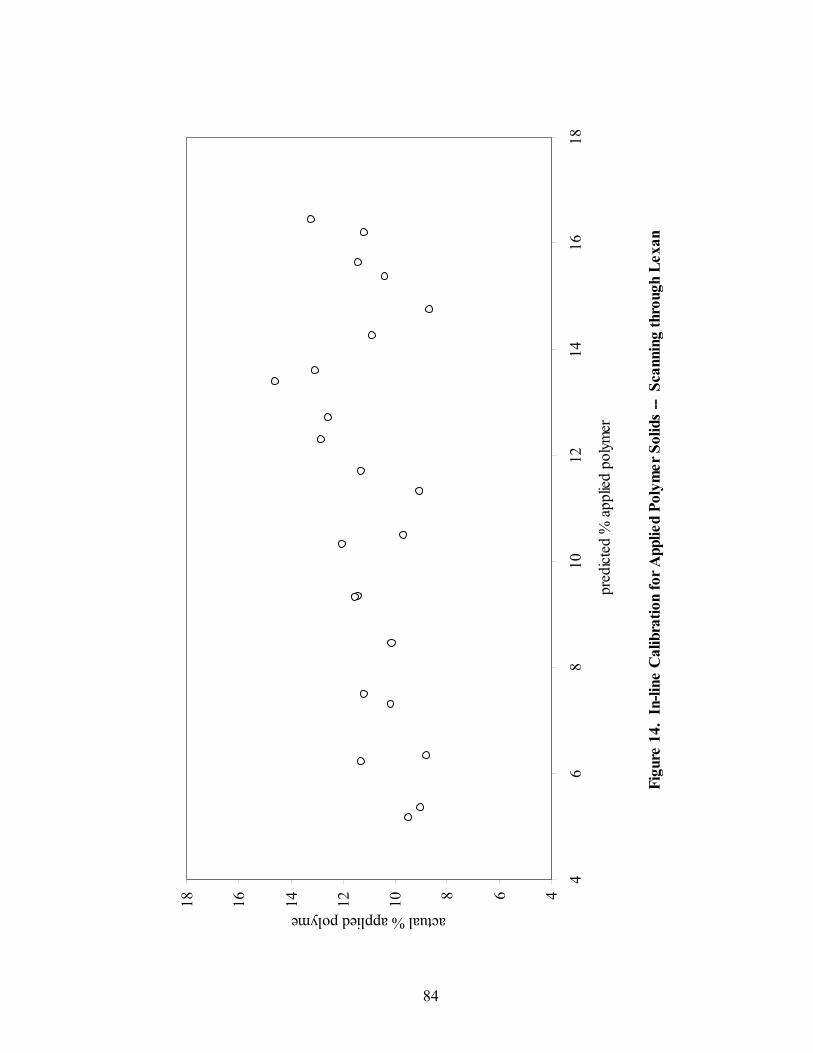
84
Figu
re 1
4. I
n-lin
e C
alib
ratio
n fo
r App
lied
Poly
mer
Sol
ids
-- S
cann
ing
thro
ugh
Lexa
n
4681012141618
46
810
1214
1618
pred
icted
% a
pplie
d po
lymer
actual % applied polyme
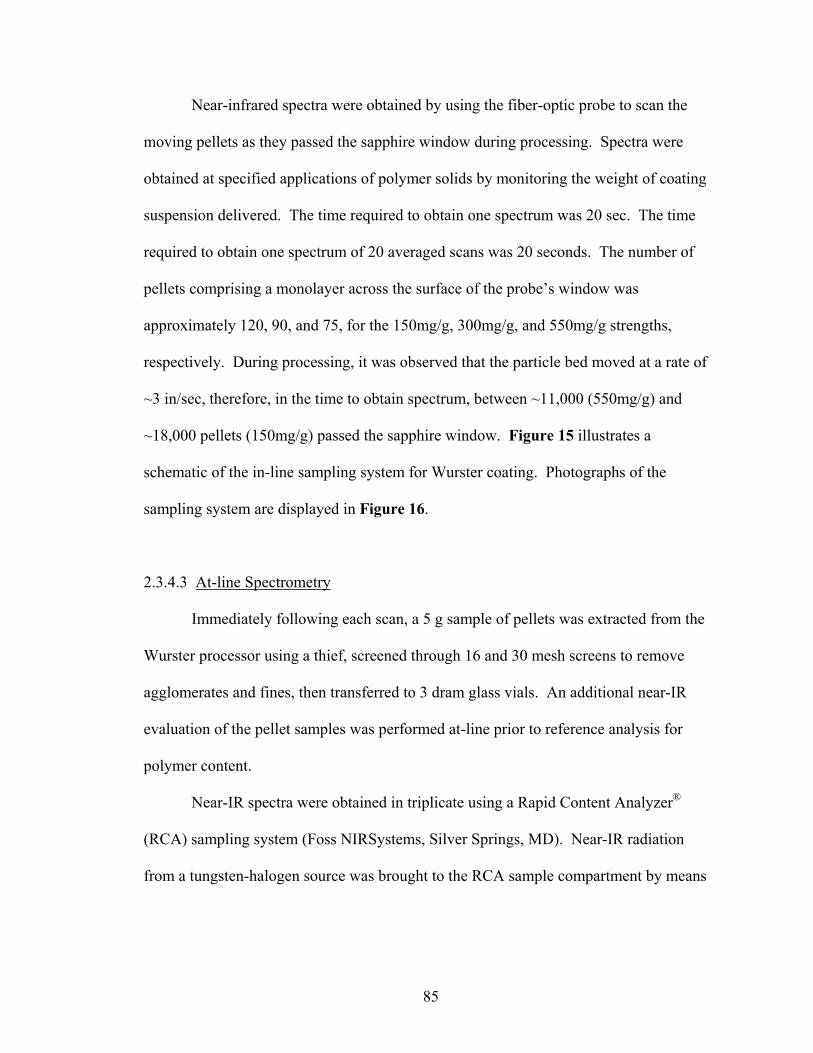
85
Near-infrared spectra were obtained by using the fiber-optic probe to scan the
moving pellets as they passed the sapphire window during processing. Spectra were
obtained at specified applications of polymer solids by monitoring the weight of coating
suspension delivered. The time required to obtain one spectrum was 20 sec. The time
required to obtain one spectrum of 20 averaged scans was 20 seconds. The number of
pellets comprising a monolayer across the surface of the probe’s window was
approximately 120, 90, and 75, for the 150mg/g, 300mg/g, and 550mg/g strengths,
respectively. During processing, it was observed that the particle bed moved at a rate of
~3 in/sec, therefore, in the time to obtain spectrum, between ~11,000 (550mg/g) and
~18,000 pellets (150mg/g) passed the sapphire window. Figure 15 illustrates a
schematic of the in-line sampling system for Wurster coating. Photographs of the
sampling system are displayed in Figure 16.
2.3.4.3 At-line Spectrometry
Immediately following each scan, a 5 g sample of pellets was extracted from the
Wurster processor using a thief, screened through 16 and 30 mesh screens to remove
agglomerates and fines, then transferred to 3 dram glass vials. An additional near-IR
evaluation of the pellet samples was performed at-line prior to reference analysis for
polymer content.
Near-IR spectra were obtained in triplicate using a Rapid Content Analyzer®
(RCA) sampling system (Foss NIRSystems, Silver Springs, MD). Near-IR radiation
from a tungsten-halogen source was brought to the RCA sample compartment by means
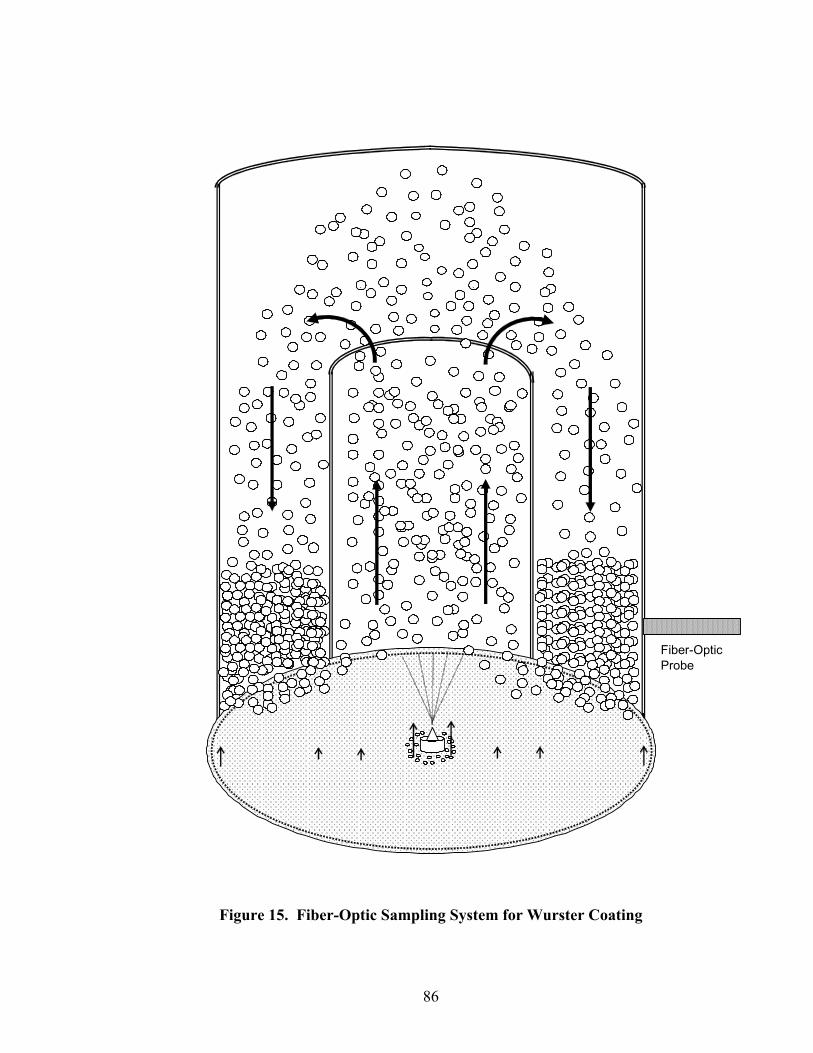
86
Figure 15. Fiber-Optic Sampling System for Wurster Coating
v
v v
v
Fiber-OpticProbe
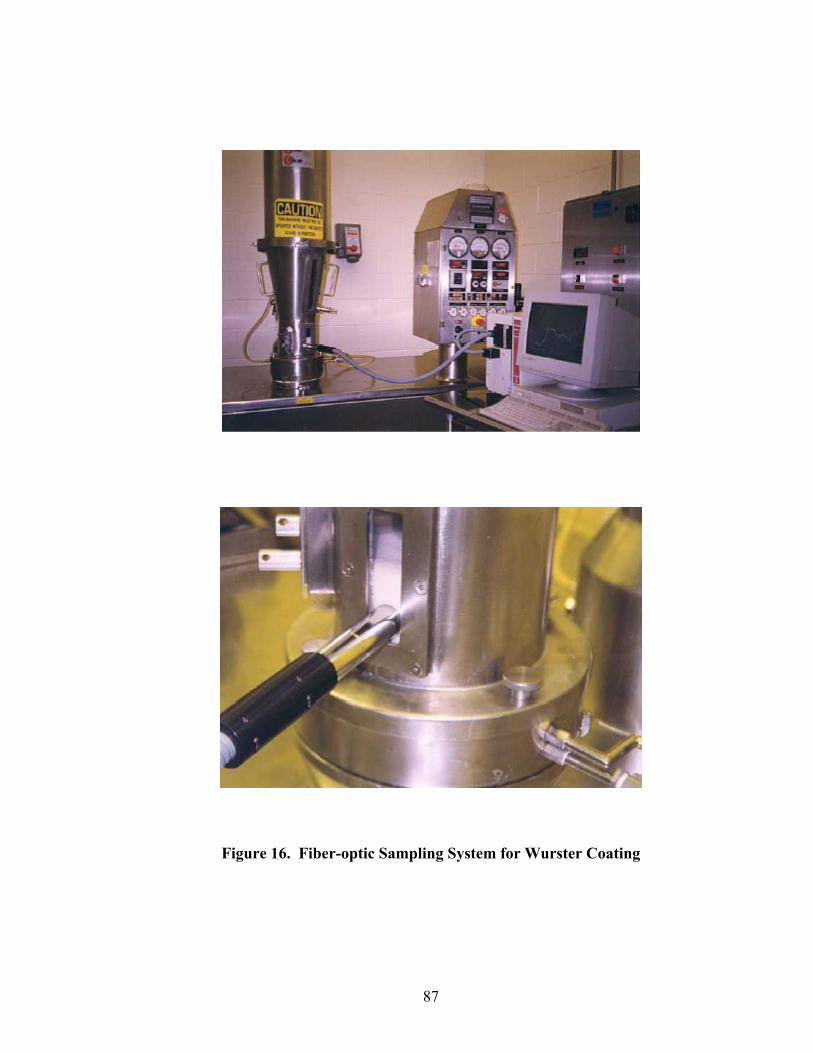
87
Figure 16. Fiber-optic Sampling System for Wurster Coating

88
of a fiber-optic bundle (420 fibers, each 200 µm diameter). Reflected light from the
sample was reflected back into the detector array of the RCA, which consisted of four
PbS detectors and four Si detectors for collection of near-IR and visible spectra,
respectively. Spectra were obtained by scanning through the base (1.8 cm diameter) of
the glass vials.. The number of pellets comprising a monolayer across a sample vial base
was approximately 390, 290, and 240 for the 150mg/g, 300mg/g, and 550mg/g strengths,
respectively. Each vial was inverted three times between scans. Replicate scans were
averaged to obtain one spectrum for each sample time point. Total collection time per
sample was approximately 90 sec.
2.3.4.4 Spectral Preprocessing
Spectra were reference corrected using a 99% Spectralon® disk (Labsphere, North
Sutton, NH) and reflectance values were linearized with a log(1/R) transformation prior
to analysis. NIRSystems NSAS® software was used for spectral preprocessing and all
other chemometric analysis was performed using proprietary programs written in
SPEAKEASY IV EPSILON +® (Speakeasy Computing Corp., Chicago, IL). To assess
the significance of spectral preprocessing on calibration development and performance,
separate calibrations were developed for MSC and D2 spectra.
2.3.5 Eudragit® RS30D Assay
The quantity of Eudragit RS30D (ERS) polymer solids applied to diltiazem HCl
pellets was determined using a modified version of a colorimetric ion-pair complexation
method described by Melia et al. (131). Eudragit RS30D solids were isolated from a
89
stock 30% w/w commercial aqueous latex dispersion by casting polymer films in
polystyrene weigh boats and placing the samples in a 105 ºC laboratory oven for 48 h to
remove water. The prepared films were stored in a desiccator over phosphorous
pentoxide for 24 hours prior to analysis.
Standard solutions of dried ERS in chloroform were prepared over a
concentration range of 0.25 mg/ml to 5 mg/ml. A 0.5 ml aliquot of stock solution was
transferred to a 10 ml glass test tube and diluted with 4 ml chloroform and 5 ml 0.0016 M
tropaeolin 000 in 0.1 M sodium chloride. The test tube was capped and mixed on a
platform vortex mixer for two minutes. Chemical structures of ammonio methacrylate
copolymer, the primary component of ERS, and tropaeolin 000 are presented in Figure
17. Upon mixing, the quaternary ammonium groups of the ERS complexed with the
sulfonic acid functionalities of the anionic tropaeolin 000 dye and formed neutral species
that partitioned into the organic layer. The mixture was then centrifuged for 10 minutes
at 2500 rpm and the organic layer was analyzed by visible spectrometry through 1 cm
quartz cuvettes. The absorption maximum of 485 nm was identical to that of the dye in
the aqueous layer. Absorbance at 485 nm was linearly related to the polymer
concentration of the sample. Absorbance at 485 nm in the chloroform layer was found to
be linearly related to polymer concentration over the range of 0.2 to 1.4 absorbance units
with an R2 of 0.9997.
To determine the ERS content of coated diltiazem HCl pellets, 500 mg of sample
pellets were transferred to 20 ml glass scintillation vials and vortexed for 15 min to
dissolve the polymer. Based on a theoretical range of applied polymer solids of 5% to
16%, the test solutions had theoretical ERS concentrations of 1.25 mg/ml to 80 mg/ml.
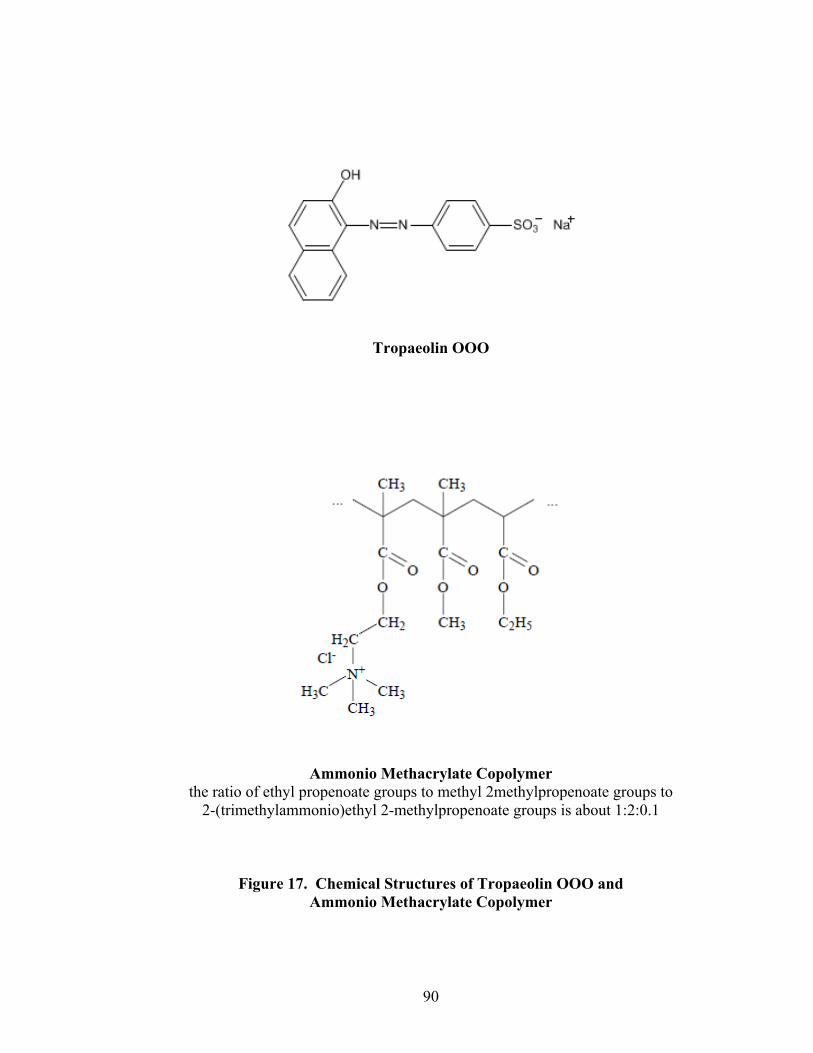
90
Tropaeolin OOO
Ammonio Methacrylate Copolymer the ratio of ethyl propenoate groups to methyl 2methylpropenoate groups to
2-(trimethylammonio)ethyl 2-methylpropenoate groups is about 1:2:0.1
Figure 17. Chemical Structures of Tropaeolin OOO and Ammonio Methacrylate Copolymer
91
These were within the working range of the standard curve. Subsequent dilution steps
mimicked those used in preparation of the standard curve, however, following
centrifugation it was observed that the entire quantity of tropaeolin 000 dye had
partitioned into the organic layer. Upon investigation, it was noted that the pH of the
aqueous orange dye solution was approximately 6.5. At this pH, the tertiary amine group
of the basic diltiazem HCl drug substance, with a pKa of 7.7, would be ionized. This
cationic species would then compete with the positively charged quaternary ammonium
groups on the ERS polymer for anionic binding sites on the tropaeolin 000 dye. This was
confirmed by testing additional samples spiked with varied levels of diltiazem HCl. The
non-pareil seed, povidone, and talc components of the core pellets were determined to be
non-interfering species.
To minimize ionization of the diltiazem HCl drug substance, the initial procedure
was modified such that the stock 0.0016 M tropaeolin 000 in 0.1 M sodium chloride
solution was adjusted to pH 13 with 0.1 N sodium hydroxide. At this pH, the color of the
aqueous dye layer changed from orange to red. However, the chloroform solution
remained orange and there was no detectable shift in wavelength or intensity. This pH
adjustment was performed for all subsequent standard and test preparations. A linear
regression was performed between the absorbance at 485 nm and Eudragit RS30D
concentration values. Replicate solutions were made for each concentration over a three
day period. Figure 18 displays the standard curve obtained. The R2 value for the
calibration was 0.9998. Analysis of a 2.5 mg/ml standard over a three day period
demonstrated an RSD of 0.32%, while analysis of freshly prepared standards over a three
day period demonstrated an RSD of 0.41%.
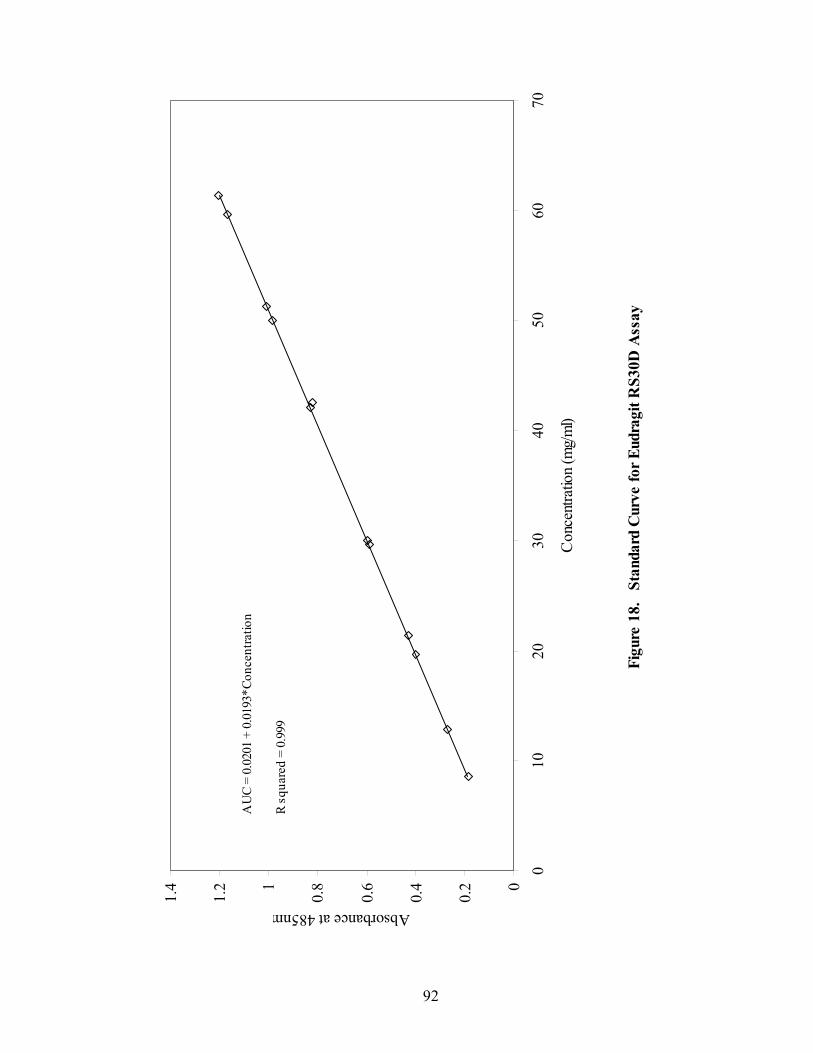
92
Figu
re 1
8.
Stan
dard
Cur
ve fo
r Eud
ragi
t RS3
0D A
ssay
0
0.2
0.4
0.6
0.81
1.2
1.4
010
2030
4050
6070
Con
cent
ratio
n (m
g/m
l)
Absorbance at 485nm
AU
C =
0.02
01 +
0.0
193*
Conc
entra
tion
R sq
uare
d =
0.99
9
93
2.3.6 Quantitative Prediction of Eudragit RS30D Coating Level
Several calibration techniques were investigated for predicting the quantity of
Eudragit RS30D applied to diltiazem HCl core pellets. Single and multiple wavelength
calibrations as well as PCR and PLSR models were developed for both MSC and D2
spectra with the concentration of Eudragit RS30D as the dependent variable and spectral
absorbance values, principal components or PLS factors as independent variables. Single
and multiple wavelength calibration, and PCR were performed using programs written in
SPEAKEASY®. PLSR was performed using commercial NSAS® software.
2.3.7 Qualitative Prediction of Eudragit RS30D Coating Endpoint
The ability of two pattern recognition algorithms to qualitatively predict coating
process endpoints was assessed in this phase of study. The techniques under
investigation included a Mahalanobis Distance (MD) calculation and a Bootstrap Error-
Adjusted Single-sample Technique (BEAST). These methods classify samples according
to their similarity relative to a training set. After training the computer to recognize the
spectral qualities of acceptable material, the pattern recognition algorithms were
employed to identify and classify unknown test samples. All qualitative analyses were
performed using programs written in SPEAKEASY®.
In this study, near-IR spectra from six pellet samples containing a known quantity
of polymer solids were used to develop spectral training sets. The quantity of applied
coat solids was confirmed using the ERS assay previously described. During subsequent
coating trials, samples were collected at various time points corresponding to different
levels of applied coating and their spectral similarity to the training set was assessed via

94
the described pattern recognition techniques. For these analyses, samples within 3 SDs
of the center of the training set cluster were considered to contain the desired level of
Eudragit RS30D while samples with distances greater than 3 SDs were classified as
outliers.
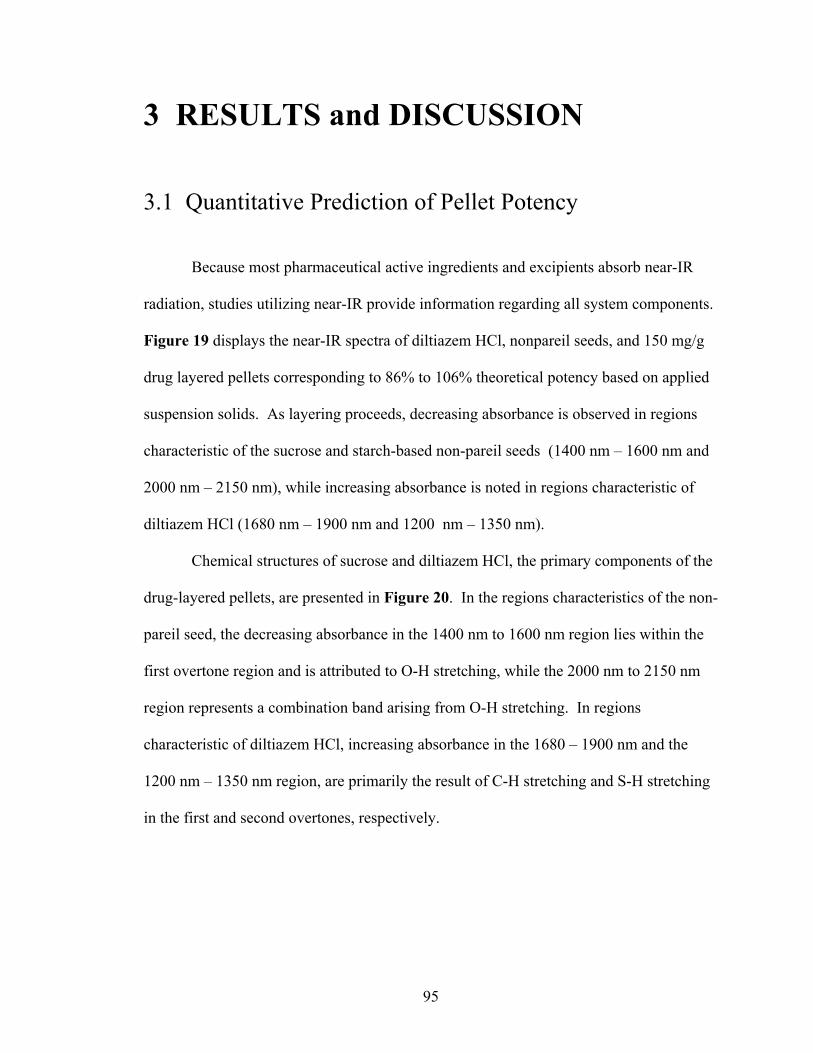
95
3 RESULTS and DISCUSSION 3.1 Quantitative Prediction of Pellet Potency Because most pharmaceutical active ingredients and excipients absorb near-IR
radiation, studies utilizing near-IR provide information regarding all system components.
Figure 19 displays the near-IR spectra of diltiazem HCl, nonpareil seeds, and 150 mg/g
drug layered pellets corresponding to 86% to 106% theoretical potency based on applied
suspension solids. As layering proceeds, decreasing absorbance is observed in regions
characteristic of the sucrose and starch-based non-pareil seeds (1400 nm – 1600 nm and
2000 nm – 2150 nm), while increasing absorbance is noted in regions characteristic of
diltiazem HCl (1680 nm – 1900 nm and 1200 nm – 1350 nm).
Chemical structures of sucrose and diltiazem HCl, the primary components of the
drug-layered pellets, are presented in Figure 20. In the regions characteristics of the non-
pareil seed, the decreasing absorbance in the 1400 nm to 1600 nm region lies within the
first overtone region and is attributed to O-H stretching, while the 2000 nm to 2150 nm
region represents a combination band arising from O-H stretching. In regions
characteristic of diltiazem HCl, increasing absorbance in the 1680 – 1900 nm and the
1200 nm – 1350 nm region, are primarily the result of C-H stretching and S-H stretching
in the first and second overtones, respectively.
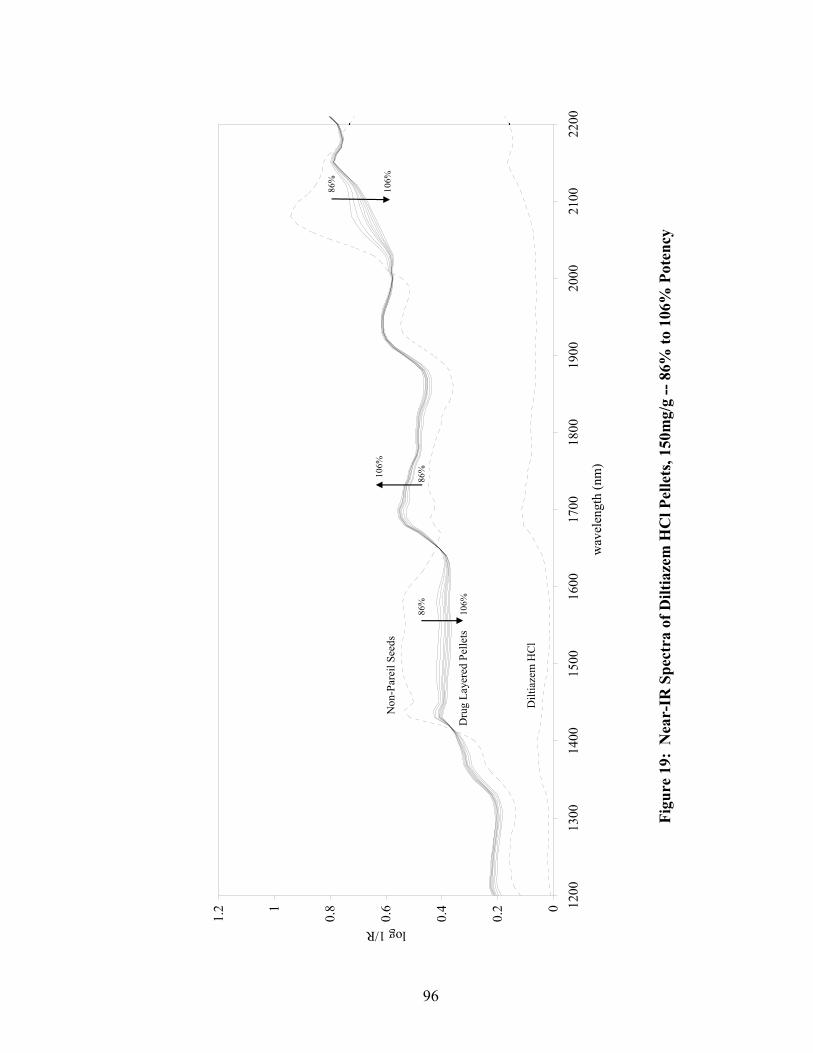
96
0
0.2
0.4
0.6
0.81
1.2 12
0013
0014
0015
0016
0017
0018
0019
0020
0021
0022
00
wav
elen
gth
(nm
)
log 1/R
Non
-Par
eil S
eeds
Dru
g La
yere
d Pe
llets
Dilt
iaze
m H
Cl
86%
106%
86%10
6%
86%
106%
Figu
re 1
9: N
ear-
IR S
pect
ra o
f Dilt
iaze
m H
Cl P
elle
ts, 1
50m
g/g
-- 8
6% to
106
% P
oten
cy

97
OHO
O
OH
CH2OH
HO OOH HO
CH2OH
CH2OH
Sucrose
N
S
O
OCH3
O
NH3C
CH3
OCH3
Diltiazem HCl
Figure 20. Primary Drug-layered Pellet Components
• HCl
98
3.1.1 In-line Analysis of Pellet Potency
Single wavelength, multiple wavelength, and principal component calibrations
were developed using both scatter corrected and second derivative spectra. A PLS
calibration model was also developed using second derivative spectra. The choice of
spectral preprocessing, MSC or D2, was based on the programs used to perform
chemometric analysis. Single wavelength, multiple wavelength, and PCR analyses were
performed on both MSC and D2 using SPEAKEASY® chemometric routines. PLSR
was, however, performed using NSAS® software which offered only derivative-based
spectral preprocessing. Because spectra were collected during processing, calibration
model development was limited to one spectral scan per batch at each time point. Five
batches were processed for each pellet strength. Each batch was processed on a unique
day with a complete set-up and tear-down of the fluid bed processor occurring between
lots. Calibrations were developed using 18 samples within the 96% to 106% theoretical
potency range from three of the five batches for each formulation. Two additional
batches from each formulation were processed to assess the predictive power of the
developed calibrations.
3.1.1.1 Single and Multiple Wavelength Regression
For the single and multiple wavelength models, the most robust calibrations were
developed using wavelengths from spectral regions characteristic of non-pareil seeds or
diltiazem HCl drug substance. A single wavelength calibration was developed using
absorbance values at 1672 nm which was highly correlated with diltiazem HCl. A two-
wavelength model was developed using 1680 nm and 2040 nm, which correlated with
99
diltiazem HCl and non-pareil seeds, respectively. A SPEAKEZ® program provided
preliminary identification of suitable wavelengths for calibration based on least-squares
regression statistics R2 and SEC. Wavelengths to be used for calibration were then
selected based on their correlation to significant absorbance bands for diltiazem or non-
pareil seeds.
For the 150mg/g strength, pellet potency increased by approximately 1% every 90
seconds. Single- and multiple-wavelength models for this strength had R2 values of 0.93
and 0.92, respectively. SEC and SEP were 0.97% and 1.33%, respectively, for the
single-wavelength model, and 0.89% and 1.25%, respectively, for the multiple
wavelength calibration. For the 550mg/g strength, pellet potency increased by
approximately 1% every four minutes. For this strength, both the single- and multiple-
wavelength models provided R2 values of 0.99. SEC and SEP were 0.30% and 1.72%,
respectively, for the single-wavelength model, and 0.57% and 1.61%, respectively, for
the multiple wavelength calibration.
3.1.1.2 Principal Component Regression
Principal component regression was used following an MSC or D2 treatment of
the NIR data. Initially, spectra were transformed into principal component axis space.
Table 10 summarizes the sequences of principal components and their percentages of
contribution to the total variations of spectral data for each pellet strength. The roots
provide information about the magnitudes of variances along with principal component
axes. The first principal component accounts for the largest amount of the total
variations which, for MSC spectra, ranges from about 48% for 150mg/g pellets to about
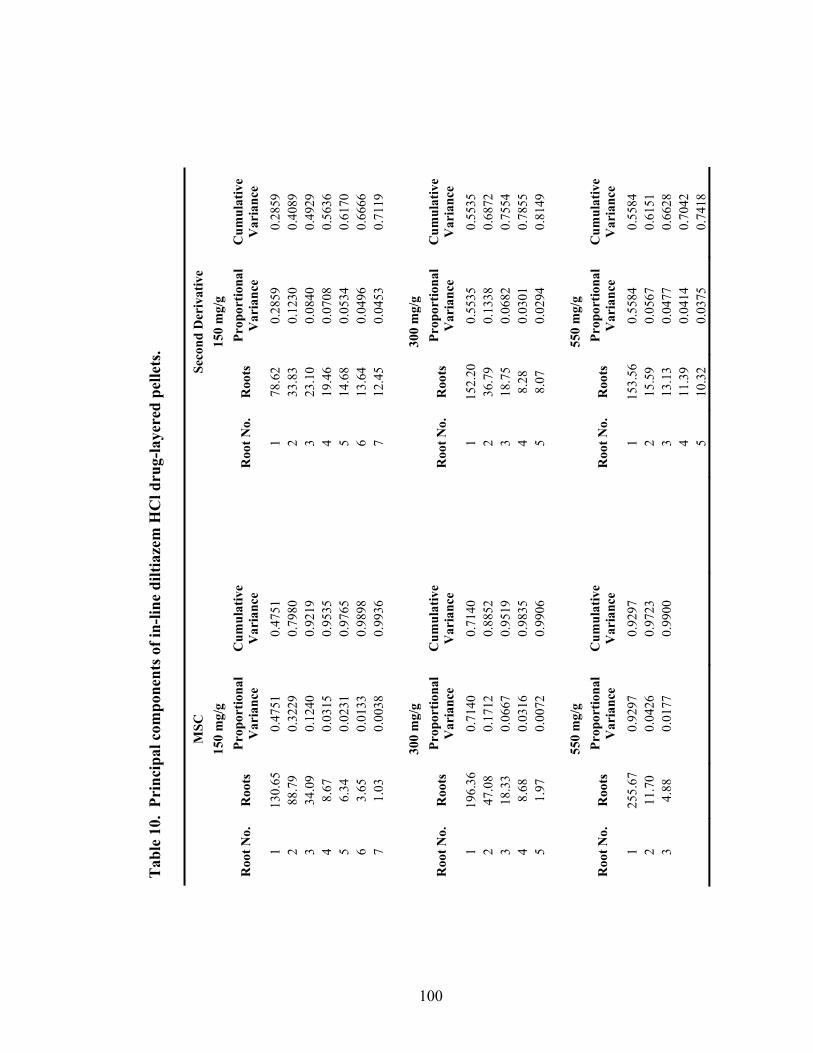
100
Tab
le 1
0. P
rinc
ipal
com
pone
nts o
f in-
line
dilti
azem
HC
l dru
g-la
yere
d pe
llets
.
MSC
Seco
nd D
eriv
ativ
e 15
0 m
g/g
15
0 m
g/g
Roo
t No.
R
oots
Pr
opor
tiona
l V
aria
nce
Cum
ulat
ive
Var
ianc
e
Roo
t No.
R
oots
Pr
opor
tiona
l V
aria
nce
Cum
ulat
ive
Var
ianc
e 1
130.
65
0.47
51
0.47
51
1
78.6
2 0.
2859
0.
2859
2
88.7
9 0.
3229
0.
7980
2 33
.83
0.12
30
0.40
89
3 34
.09
0.12
40
0.92
19
3
23.1
0 0.
0840
0.
4929
4
8.67
0.
0315
0.
9535
4 19
.46
0.07
08
0.56
36
5 6.
34
0.02
31
0.97
65
5
14.6
8 0.
0534
0.
6170
6
3.65
0.
0133
0.
9898
6 13
.64
0.04
96
0.66
66
7 1.
03
0.00
38
0.99
36
7
12.4
5 0.
0453
0.
7119
300
mg/
g
300
mg/
g
Roo
t No.
R
oots
Pr
opor
tiona
l V
aria
nce
Cum
ulat
ive
Var
ianc
e
Roo
t No.
R
oots
Pr
opor
tiona
l V
aria
nce
Cum
ulat
ive
Var
ianc
e 1
196.
36
0.71
40
0.71
40
1
152.
20
0.55
35
0.55
35
2 47
.08
0.17
12
0.88
52
2
36.7
9 0.
1338
0.
6872
3
18.3
3 0.
0667
0.
9519
3 18
.75
0.06
82
0.75
54
4 8.
68
0.03
16
0.98
35
4
8.28
0.
0301
0.
7855
5
1.97
0.
0072
0.
9906
5 8.
07
0.02
94
0.81
49
55
0 m
g/g
55
0 m
g/g
Roo
t No.
R
oots
Pr
opor
tiona
l V
aria
nce
Cum
ulat
ive
Var
ianc
e
Roo
t No.
R
oots
Pr
opor
tiona
l V
aria
nce
Cum
ulat
ive
Var
ianc
e 1
255.
67
0.92
97
0.92
97
1
153.
56
0.55
84
0.55
84
2 11
.70
0.04
26
0.97
23
2
15.5
9 0.
0567
0.
6151
3
4.88
0.
0177
0.
9900
3 13
.13
0.04
77
0.66
28
4
11.3
9 0.
0414
0.
7042
5 10
.32
0.03
75
0.74
18
101
93% for the 550mg/g strength. For D2 spectra, a greater number of PCs were required to
explain the total spectral variation. The correlation of the first two PCs to the non-pareil
seed and diltiazem HCl components of 150 mg/g and 550 mg/g drug layered pellets can
be observed in Figures 21 and 22, respectively, which present the loadings spectrums of
these components for MSC spectra. Although not readily apparent in the graphs, the
correlation of these PCs to certain spectral regions characteristic of the primary pellets
components was confirmed by comparing second derivative spectra of these ingredients
to the loading spectra. Interestingly, a higher degree of noise is observed in 150mg/g
pellets, relative to the 550mg/g strength, which has a much smoother loadings spectrum.
The factors contributing to the increased noise in the 150 mg/g spectra are may be related
to increased scatter from a smaller pellet particle size distribution, and a greater rate of
change in potency occurring over the collection interval.
The principal components used for regression were limited to those that
contributed significantly to the model (t-statistic >3.0). Regression results are
summarized in Table 11. For both MSC and D2 spectra, two PCs were significant for all
pellet strengths, which allowed potency to be predicted within ~1.5% of actual values.
The inclusion of additional PCs was also investigated during calibration development.
Although such models provided lower SEC values, they demonstrated higher SEP values,
indicating potential overfitting of the data. Ideally, robust calibrations should be based
on PCs which provide SEC and SEP values that are similar and as low as possible. The
multivariate calibrations presented here have been optimized in such a manner.
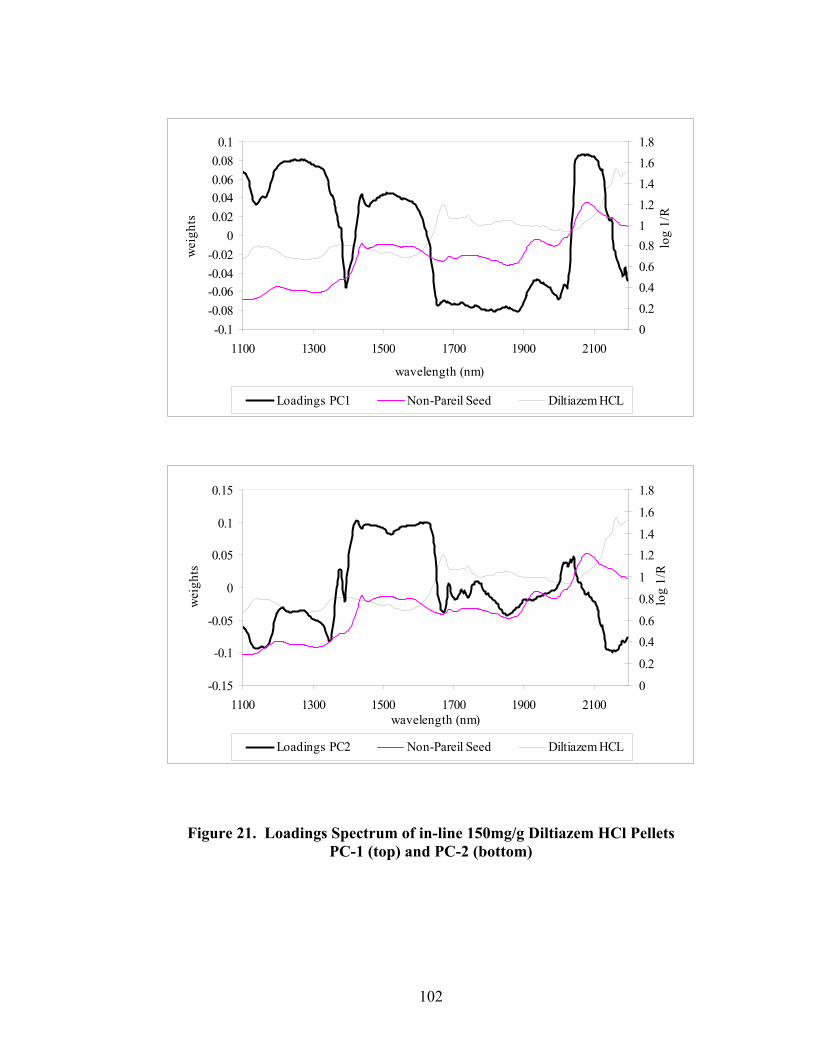
102
Figure 21. Loadings Spectrum of in-line 150mg/g Diltiazem HCl Pellets PC-1 (top) and PC-2 (bottom)
-0.1-0.08-0.06-0.04-0.02
00.020.040.060.080.1
1100 1300 1500 1700 1900 2100
wavelength (nm)
wei
ghts
00.20.40.60.811.21.41.61.8
log
1/R
Loadings PC1 Non-Pareil Seed Diltiazem HCL
-0.15
-0.1
-0.05
0
0.05
0.1
0.15
1100 1300 1500 1700 1900 2100wavelength (nm)
wei
ghts
0
0.2
0.40.6
0.8
1
1.21.4
1.6
1.8
log
1/R
Loadings PC2 Non-Pareil Seed Diltiazem HCL
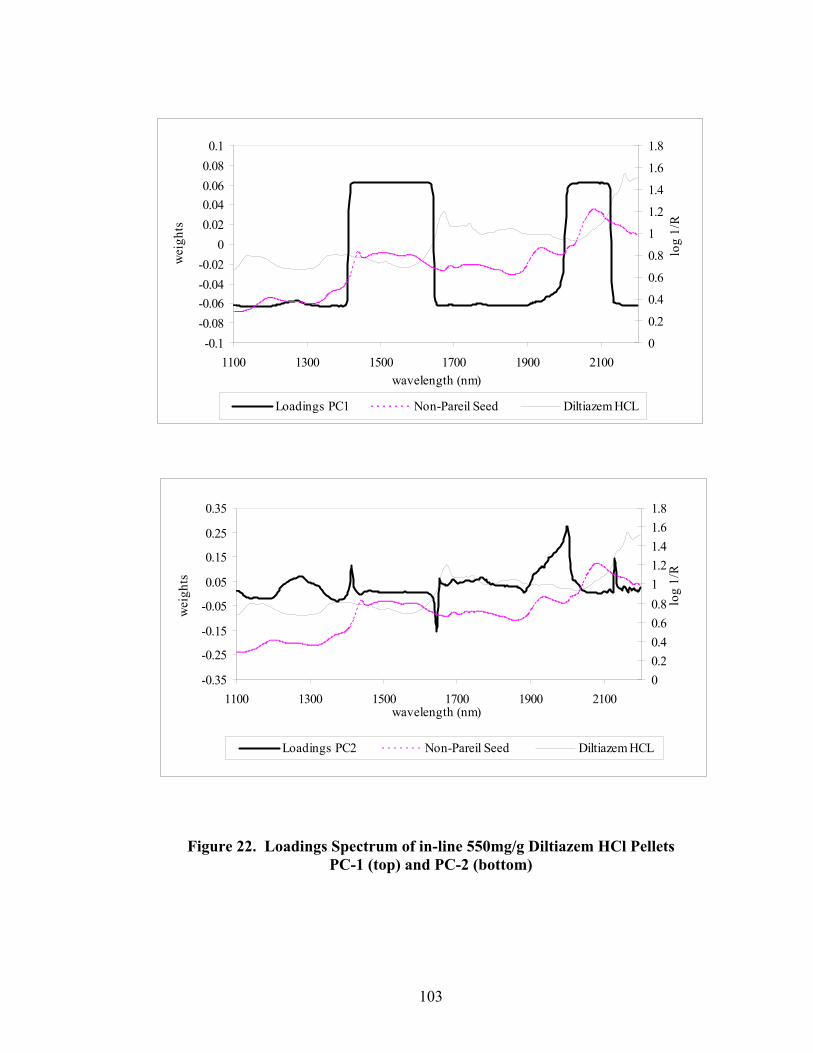
103
Figure 22. Loadings Spectrum of in-line 550mg/g Diltiazem HCl Pellets PC-1 (top) and PC-2 (bottom)
-0.1-0.08-0.06-0.04-0.02
00.020.040.060.080.1
1100 1300 1500 1700 1900 2100wavelength (nm)
wei
ghts
0
0.2
0.4
0.6
0.8
1
1.2
1.4
1.6
1.8
log
1/R
Loadings PC1 Non-Pareil Seed Diltiazem HCL
-0.35
-0.25
-0.15
-0.05
0.05
0.15
0.25
0.35
1100 1300 1500 1700 1900 2100wavelength (nm)
wei
ghts
00.20.40.60.811.21.41.61.8
log
1/R
Loadings PC2 Non-Pareil Seed Diltiazem HCL
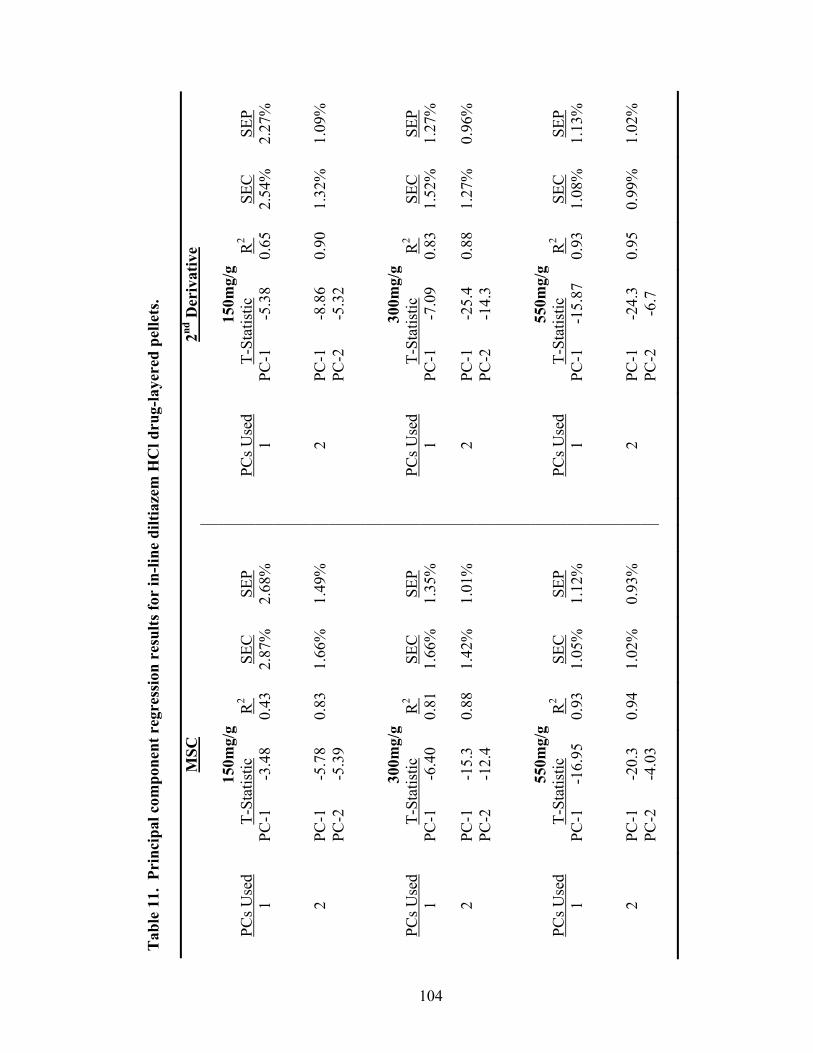
104
Tab
le 1
1. P
rinc
ipal
com
pone
nt r
egre
ssio
n re
sults
for
in-li
ne d
iltia
zem
HC
l dru
g-la
yere
d pe
llets
.
MSC
2nd
Der
ivat
ive
150m
g/g
150m
g/g
PCs U
sed
T-St
atis
tic
R2
SEC
SE
P
PC
s Use
d T-
Stat
istic
R
2 SE
C
SEP
1 PC
-1
-3.4
8 0.
43
2.87
%
2.68
%
1 PC
-1
-5.3
8 0.
65
2.54
%
2.27
%
2 PC
-1
-5.7
8 0.
83
1.66
%
1.49
%
2 PC
-1
-8.8
6 0.
90
1.32
%
1.09
%
PC
-2
-5.3
9
PC
-2
-5.3
2
300m
g/g
300m
g/g
PCs U
sed
T-St
atis
tic
R2
SEC
SE
P
PC
s Use
d T-
Stat
istic
R
2 SE
C
SEP
1 PC
-1
-6.4
0 0.
81
1.66
%
1.35
%
1 PC
-1
-7.0
9 0.
83
1.52
%
1.27
%
2 PC
-1
-15.
3 0.
88
1.42
%
1.01
%
2 PC
-1
-25.
4 0.
88
1.27
%
0.96
%
PC
-2
-12.
4
PC
-2
-14.
3
550m
g/g
550m
g/g
PCs U
sed
T-St
atis
tic
R2
SEC
SE
P
PC
s Use
d T-
Stat
istic
R
2 SE
C
SEP
1 PC
-1
-16.
95
0.93
1.
05%
1.
12%
1
PC-1
-1
5.87
0.
93
1.08
%
1.13
%
2 PC
-1
-20.
3 0.
94
1.02
%
0.93
%
2 PC
-1
-24.
3 0.
95
0.99
%
1.02
%
PC
-2
-4.0
3
PC
-2
-6.7

105
3.1.1.3 Partial Least Squares Regression
Partial least squares regression was performed on D2 spectra using a commercial
software package, NSAS® Version 3.25, that was provided with the NIRSystems Model
6500 spectrometer. As previously described, PLSR is useful with small populations of
samples that contain experimental noise in the near-IR and/or the chemical data. PLS is
similar to PCA, in that the regression factors for both are linear combinations of
wavelengths established from combinations of near-IR spectra. In PCA, principal axis
transformation is performed independently of the calibration regression, and accounts for
the maximum variation in the near-IR data. Under PLS, the principal axis transformation
and the development of the calibration regression are concurrent, where the factors
describe the types of spectral variation that are important for modeling the variables in
the chemical data. A validation process is employed to assess the amount of error due to
variation between the samples in the population and to identify the appropriate number of
factors to provide a robust calibration without overfitting the model.
The cross validation approach employed by the NSAS® software splits the
population into N segments (usually four) then validates the segment as an unknown
against the remaining sections. The selection process designates as a segment, sample 1,
sample 5, sample 9, etc. as the regression moves through the entire population until all
the samples in the population are fully validated. The procedure calculates the mean
square error or cross validation (MSECV) for the population and attempts to determine
the number of factors that will characterize the sample set without overfitting it. The user
is provided the option of comparing a separate test population against the calibration
population to validate the model. For each model, the software determines and reports
106
the minimum MSECV, the ratio of the current MSECV value to the minimum value in
the set, the correlation coefficient, and the standard error. It then recommends an
appropriate number of factors based on the ratio of the current MSECV to the minimum
MSECV in which it recognizes the optimal number of factors as those that provide a ratio
of about 1.25 (132). A “prediction” function allows the user to apply a stored calibration
equation to a spectral data file for prediction of constituent percentages.
The preceding discussion is provided to explain the approach taken in NSAS® for
PLS calibration model development. The preceding explanation of the NSAS® method
for PLS calibration, and the use of this software in the current study is, by no means,
advocating the use of a “black-box” approach to near-IR calibration and analysis. At the
time this work was performed, our laboratory was primarily focused on the development
of PCA regression models for near-IR data. Since PLS was available in the commercial
NSAS® software package that accompanied the spectrometer used to collect spectral data
from drug layering and pellet coating experiments, a logical extension of this work was to
assess the performance of the NSAS® PLS model in predicting pellet potency and applied
polymer solids and compare its performance to PCA methods. When using any type of
commercial software, the relevance of suggested regression factors with respect to the
analyte characteristics under evaluation, should be well understood, and their effect on
model performance and robustness critically assessed.
107
Partial least squares regression results of D2 spectra for all pellet strengths are
summarized in Table 12. The results were similar to those obtained using PCR, with
SEPs less than 1.5% observed for most models. Similar to PCR, the SEC and SEP
observed using PLS regression improved as pellet strength increased. This was attributed
to a slower rate of potency change over the spectral acquisition interval, and potentially
less particle size related scatter associated with the higher strengths. Interestingly, the
NSAS® software use of the ratio of current MSECV value to the minimum value in the
calibration was effective at identifying an ideal number of factors to prevent overfitting.
Although SEC could be improved by adding PLS factors to the model, SEP was observed
to decrease when too many factors were included in the calibration. As previously
reported, a similar phenomenon was observed for PCR regressions when non-statistically
significant PCs were included in the calibration.
3.1.1.4 Summary of In-line Regression Model Performance
A summary of the performance of optimized single wavelength, multiple wavelength,
PCR and PLS models for in-line analysis of all pellet strengths is presented in Table 13.
Similar calibration results were obtained for 150 mg/g, 300mg/g, and 550mg/g drug
layered pellets. Standard error of the laboratory (SEL) (133) for the HPLC reference
method, calculated according to the following equation, was determined to be
approximately 0.46%, which was well within the USP chromatographic system suitability
limit of 2% (134).
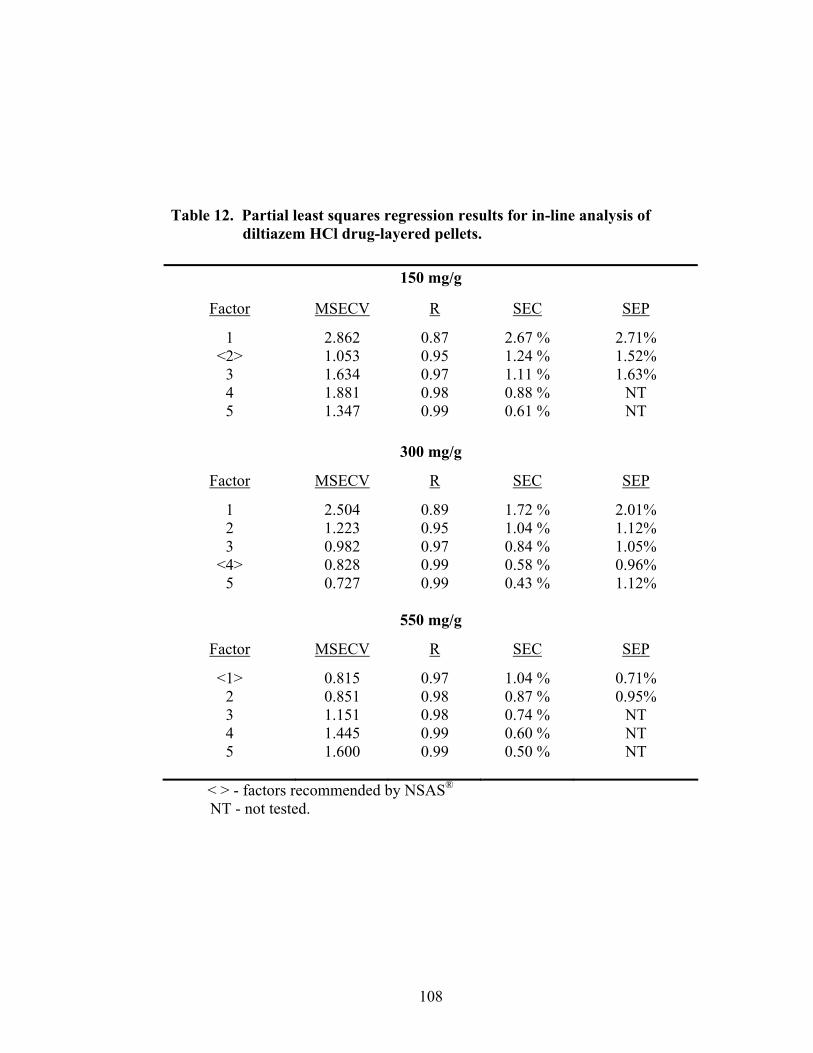
108
Table 12. Partial least squares regression results for in-line analysis of diltiazem HCl drug-layered pellets.
150 mg/g
Factor MSECV R SEC SEP
1 2.862 0.87 2.67 % 2.71% <2> 1.053 0.95 1.24 % 1.52%
3 1.634 0.97 1.11 % 1.63% 4 1.881 0.98 0.88 % NT 5 1.347 0.99 0.61 % NT
300 mg/g
Factor MSECV R SEC SEP
1 2.504 0.89 1.72 % 2.01% 2 1.223 0.95 1.04 % 1.12% 3 0.982 0.97 0.84 % 1.05%
<4> 0.828 0.99 0.58 % 0.96% 5 0.727 0.99 0.43 % 1.12%
550 mg/g
Factor MSECV R SEC SEP
<1> 0.815 0.97 1.04 % 0.71% 2 0.851 0.98 0.87 % 0.95% 3 1.151 0.98 0.74 % NT 4 1.445 0.99 0.60 % NT 5 1.600 0.99 0.50 % NT
< > - factors recommended by NSAS®
NT - not tested.
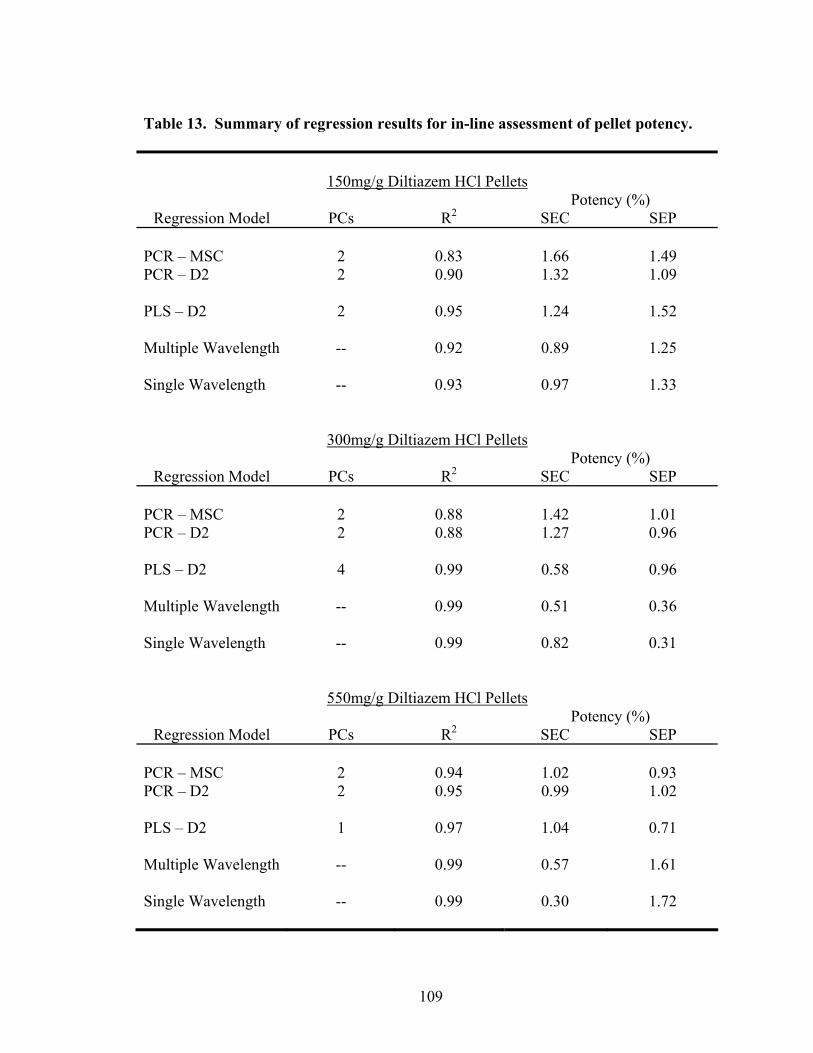
109
Table 13. Summary of regression results for in-line assessment of pellet potency.
150mg/g Diltiazem HCl Pellets
Potency (%) Regression Model PCs R2 SEC SEP
PCR – MSC 2 0.83 1.66 1.49 PCR – D2 2 0.90 1.32 1.09 PLS – D2 2 0.95 1.24 1.52 Multiple Wavelength -- 0.92 0.89 1.25 Single Wavelength -- 0.93 0.97 1.33
300mg/g Diltiazem HCl Pellets Potency (%)
Regression Model PCs R2 SEC SEP PCR – MSC 2 0.88 1.42 1.01 PCR – D2 2 0.88 1.27 0.96 PLS – D2 4 0.99 0.58 0.96 Multiple Wavelength -- 0.99 0.51 0.36 Single Wavelength -- 0.99 0.82 0.31
550mg/g Diltiazem HCl Pellets Potency (%)
Regression Model PCs R2 SEC SEP PCR – MSC 2 0.94 1.02 0.93 PCR – D2 2 0.95 0.99 1.02 PLS – D2 1 0.97 1.04 0.71 Multiple Wavelength -- 0.99 0.57 1.61 Single Wavelength -- 0.99 0.30 1.72
110
⎟⎟⎟⎟
⎠
⎞
⎜⎜⎜⎜
⎝
⎛−
=∑=
m
OpOpSEL
m
i 1
221 )(
(Eq. 20)
In this equation, Op1 and Op2 are reference potency values measured on separate days,
and m is the number of samples analyzed.
All multivariate calibration models, with the exception of the 150mg/g MSC/PCR
model, demonstrated R2 values of 0.88 or greater and standard errors of calibration no
greater than 1.4%. Interestingly, even the simplistic single and multiple wavelength
models demonstrated their ability to predict pellet potency within 2% of HPLC values.
Such results indicate that it may be possible to employ inexpensive single filter
instruments for on-line monitoring of drug layering operations. However, there are
numerous advantages to full-spectrum methods, including: the ability to reduce noise by
averaging data over both wavelengths and spectra; noise reduction by rejecting the higher
factors, into which the noise is preferentially placed; the advantages inherent in the use of
orthogonal variables; and the avoidance of the time-consuming step of performing the
wavelength selection process. On the other hand, when a condition of differential non-
linearity exists in the data, traditional wavelength selection (i.e., MLR) might be capable
of creating more accurate models than full wavelength methods, since, almost be
definition, this approach will find the wavelength(s) where the effect of non-linearity are
minimal, which full-spectrum methods (PCS and PLS) may not do (134).

111
Of the three drug levels investigated, the 150mg/g pellets demonstrated the most
rapid rate of potency change within the studied range. Pellet potency increased by
approximately 1% every 90 seconds. Figure 23 shows a plot of both the calibration and
prediction results obtained by principal component regression of second derivative
spectra for 150mg/g pellets. Despite the rapidly changing drug content of the pellets,
potency could be accurately predicted using in-line near-IR analysis. The calibration
model provided an R2 value of 0.90 and a SEC of 1.32%. Although SEP and SEC values
below 2% would be acceptable for most rotogranulation operations, the calibration
performance of the 150mg/g strength could possibly be improved by slowing down the
application rate or decreasing the solids content of the drug layering suspension.
3.1.2 At-line Analysis of Pellet Potency
Frequently, the physical modification of processing equipment to allow in-line
process monitoring is not feasible. In such instances, at-line process monitoring may be a
viable alternative. In this study, an at-line near-IR analysis of pellet samples was
conducted prior to HPLC potency analysis. At-line spectra of unit-dose samples were
obtained in triplicate by scanning through the base of the glass sample vials using a
NIRSystems Rapid Content Analyzer and model 6500 spectrometer.
Figure 24 compares second derivative spectra of 300mg/g diltiazem HCl pellets
collected in-line using the fiber-optic probe, or at-line using the rapid content
analyzer. The spectral features of both samples are similar. Such spectral similarity may
be attributed to the fact that both in-line and at-line samples are representative of the
batch at specified sample time points, and that both instruments utilize similar optical
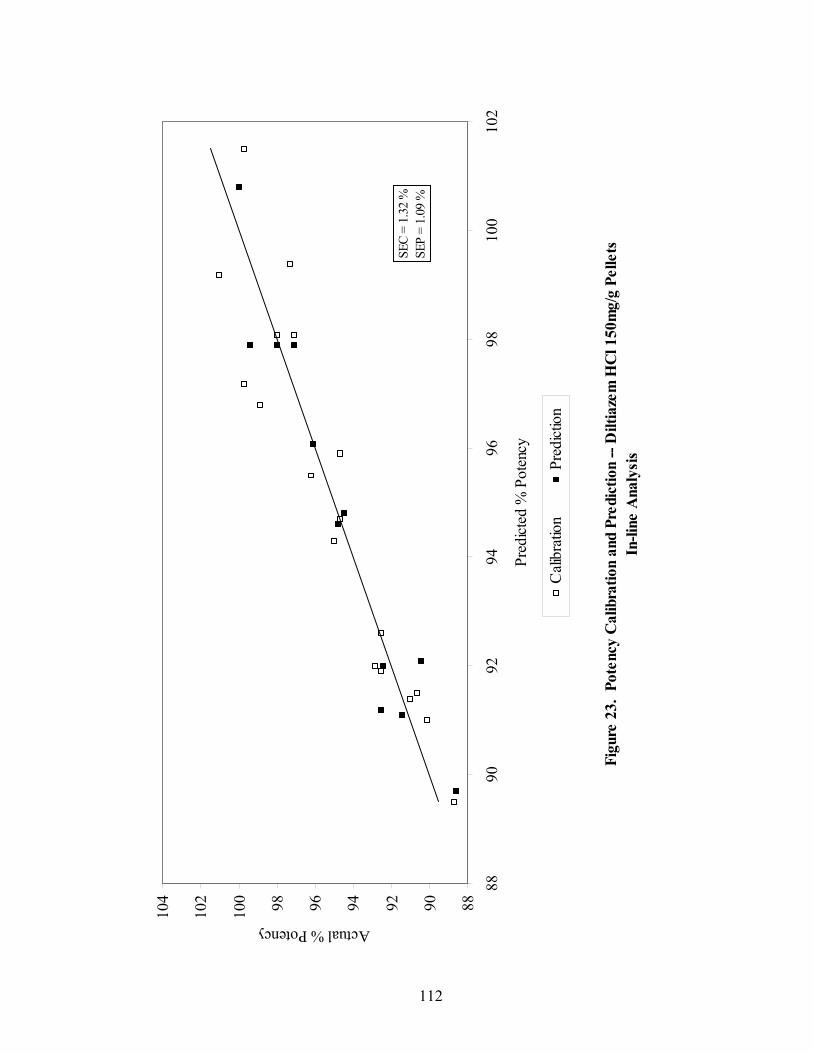
112
Figu
re 2
3. P
oten
cy C
alib
ratio
n an
d Pr
edic
tion
-- D
iltia
zem
HC
l 150
mg/
g Pe
llets
In-li
ne A
naly
sis
889092949698100
102
104
8890
9294
9698
100
102
Pred
icted
% P
oten
cy
Actual % Potency
Cali
brat
ion
Pred
ictio
n
SEC
= 1.
32 %
SEP
= 1.
09 %
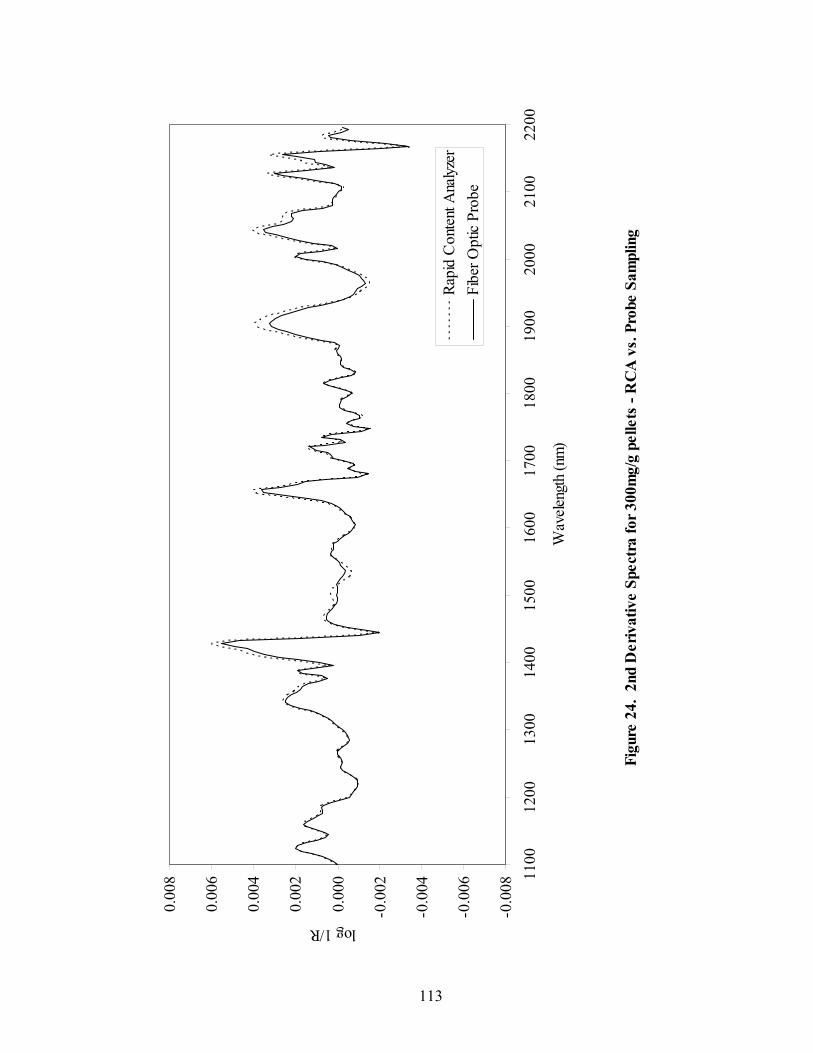
113
Figu
re 2
4. 2
nd D
eriv
ativ
e Sp
ectr
a fo
r 300
mg/
g pe
llets
- R
CA
vs.
Pro
be S
ampl
ing
-0.0
08
-0.0
06
-0.0
04
-0.0
02
0.00
0
0.00
2
0.00
4
0.00
6
0.00
8 1100
1200
1300
1400
1500
1600
1700
1800
1900
2000
2100
2200
Wav
eleng
th (n
m)
log 1/R
Rapi
d C
onte
nt A
nalyz
erFi
ber O
ptic
Prob
e
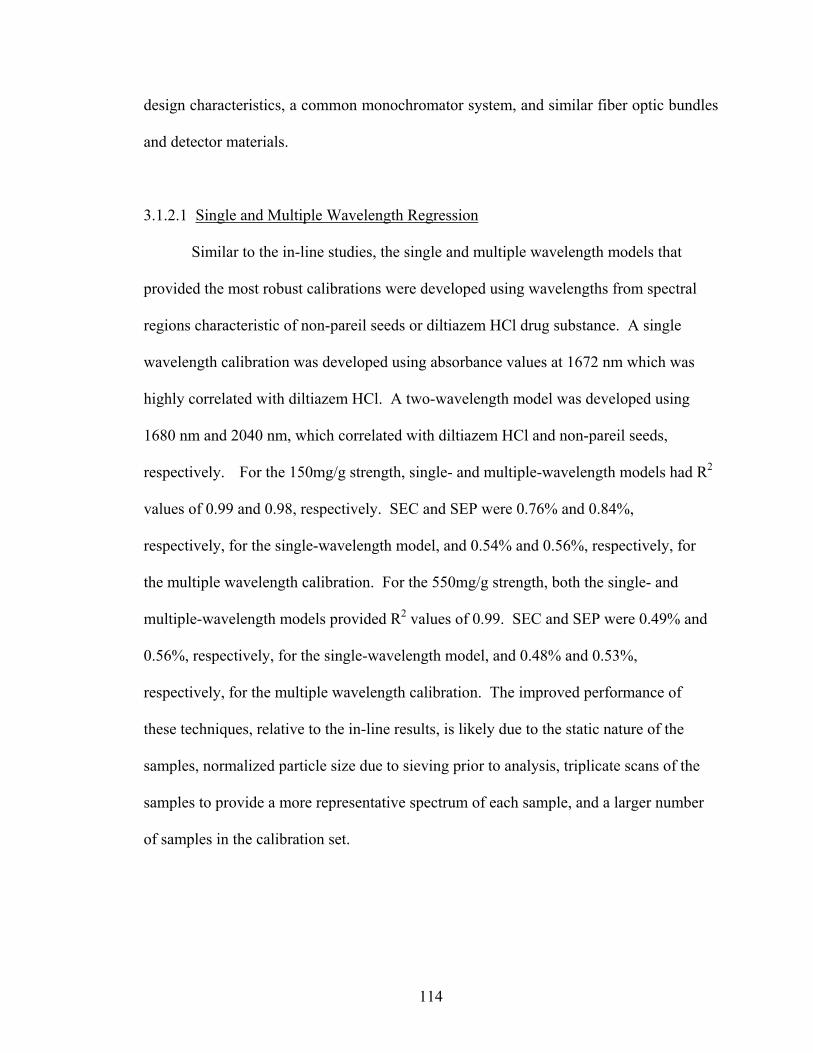
114
design characteristics, a common monochromator system, and similar fiber optic bundles
and detector materials.
3.1.2.1 Single and Multiple Wavelength Regression
Similar to the in-line studies, the single and multiple wavelength models that
provided the most robust calibrations were developed using wavelengths from spectral
regions characteristic of non-pareil seeds or diltiazem HCl drug substance. A single
wavelength calibration was developed using absorbance values at 1672 nm which was
highly correlated with diltiazem HCl. A two-wavelength model was developed using
1680 nm and 2040 nm, which correlated with diltiazem HCl and non-pareil seeds,
respectively. For the 150mg/g strength, single- and multiple-wavelength models had R2
values of 0.99 and 0.98, respectively. SEC and SEP were 0.76% and 0.84%,
respectively, for the single-wavelength model, and 0.54% and 0.56%, respectively, for
the multiple wavelength calibration. For the 550mg/g strength, both the single- and
multiple-wavelength models provided R2 values of 0.99. SEC and SEP were 0.49% and
0.56%, respectively, for the single-wavelength model, and 0.48% and 0.53%,
respectively, for the multiple wavelength calibration. The improved performance of
these techniques, relative to the in-line results, is likely due to the static nature of the
samples, normalized particle size due to sieving prior to analysis, triplicate scans of the
samples to provide a more representative spectrum of each sample, and a larger number
of samples in the calibration set.
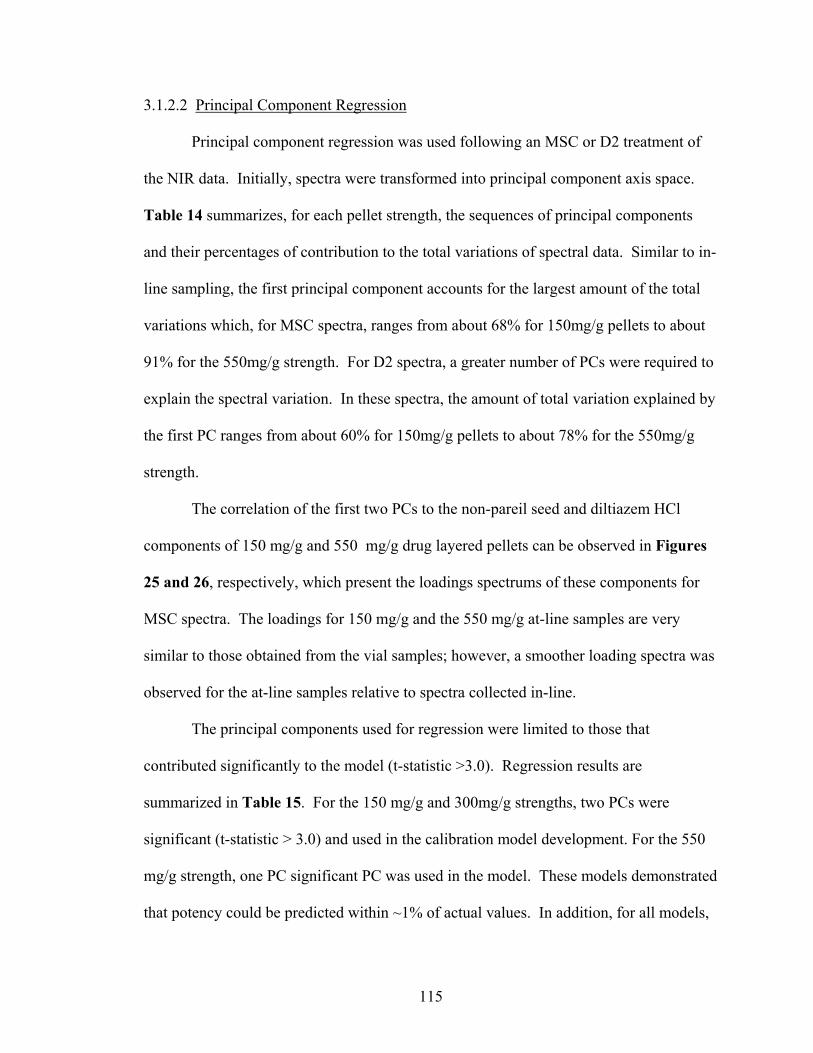
115
3.1.2.2 Principal Component Regression
Principal component regression was used following an MSC or D2 treatment of
the NIR data. Initially, spectra were transformed into principal component axis space.
Table 14 summarizes, for each pellet strength, the sequences of principal components
and their percentages of contribution to the total variations of spectral data. Similar to in-
line sampling, the first principal component accounts for the largest amount of the total
variations which, for MSC spectra, ranges from about 68% for 150mg/g pellets to about
91% for the 550mg/g strength. For D2 spectra, a greater number of PCs were required to
explain the spectral variation. In these spectra, the amount of total variation explained by
the first PC ranges from about 60% for 150mg/g pellets to about 78% for the 550mg/g
strength.
The correlation of the first two PCs to the non-pareil seed and diltiazem HCl
components of 150 mg/g and 550 mg/g drug layered pellets can be observed in Figures
25 and 26, respectively, which present the loadings spectrums of these components for
MSC spectra. The loadings for 150 mg/g and the 550 mg/g at-line samples are very
similar to those obtained from the vial samples; however, a smoother loading spectra was
observed for the at-line samples relative to spectra collected in-line.
The principal components used for regression were limited to those that
contributed significantly to the model (t-statistic >3.0). Regression results are
summarized in Table 15. For the 150 mg/g and 300mg/g strengths, two PCs were
significant (t-statistic > 3.0) and used in the calibration model development. For the 550
mg/g strength, one PC significant PC was used in the model. These models demonstrated
that potency could be predicted within ~1% of actual values. In addition, for all models,
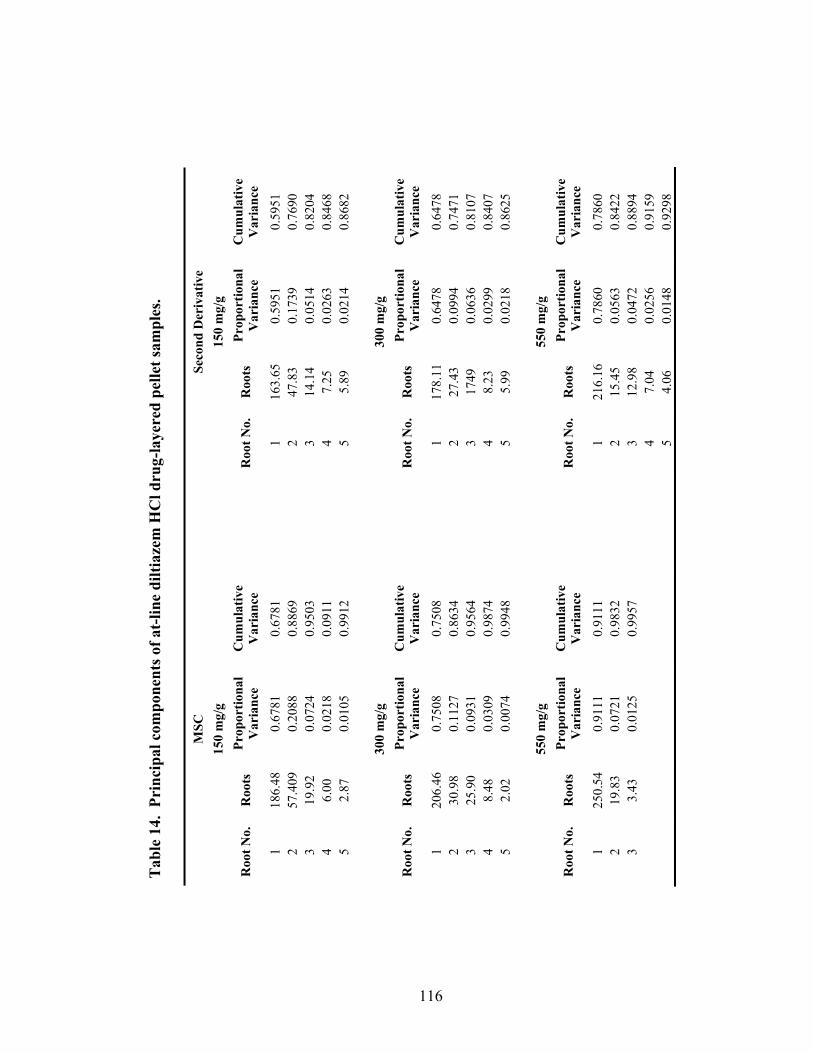
116
Tab
le 1
4. P
rinc
ipal
com
pone
nts o
f at-
line
dilti
azem
HC
l dru
g-la
yere
d pe
llet s
ampl
es.
MSC
Seco
nd D
eriv
ativ
e 15
0 m
g/g
15
0 m
g/g
Roo
t No.
R
oots
Pr
opor
tiona
l V
aria
nce
Cum
ulat
ive
Var
ianc
e
Roo
t No.
R
oots
Pr
opor
tiona
l V
aria
nce
Cum
ulat
ive
Var
ianc
e 1
186.
48
0.67
81
0.67
81
1
163.
65
0.59
51
0.59
51
2 57
.409
0.
2088
0.
8869
2 47
.83
0.17
39
0.76
90
3 19
.92
0.07
24
0.95
03
3
14.1
4 0.
0514
0.
8204
4
6.00
0.
0218
0.
0911
4 7.
25
0.02
63
0.84
68
5 2.
87
0.01
05
0.99
12
5
5.89
0.
0214
0.
8682
300
mg/
g
300
mg/
g
Roo
t No.
R
oots
Pr
opor
tiona
l V
aria
nce
Cum
ulat
ive
Var
ianc
e
Roo
t No.
R
oots
Pr
opor
tiona
l V
aria
nce
Cum
ulat
ive
Var
ianc
e 1
206.
46
0.75
08
0.75
08
1
178.
11
0.64
78
0.64
78
2 30
.98
0.11
27
0.86
34
2
27.4
3 0.
0994
0.
7471
3
25.9
0 0.
0931
0.
9564
3 17
49
0.06
36
0.81
07
4 8.
48
0.03
09
0.98
74
4
8.23
0.
0299
0.
8407
5
2.02
0.
0074
0.
9948
5 5.
99
0.02
18
0.86
25
55
0 m
g/g
55
0 m
g/g
Roo
t No.
R
oots
Pr
opor
tiona
l V
aria
nce
Cum
ulat
ive
Var
ianc
e
Roo
t No.
R
oots
Pr
opor
tiona
l V
aria
nce
Cum
ulat
ive
Var
ianc
e 1
250.
54
0.91
11
0.91
11
1
216.
16
0.78
60
0.78
60
2 19
.83
0.07
21
0.98
32
2
15.4
5 0.
0563
0.
8422
3
3.43
0.
0125
0.
9957
3 12
.98
0.04
72
0.88
94
4
7.04
0.
0256
0.
9159
5 4.
06
0.01
48
0.92
98
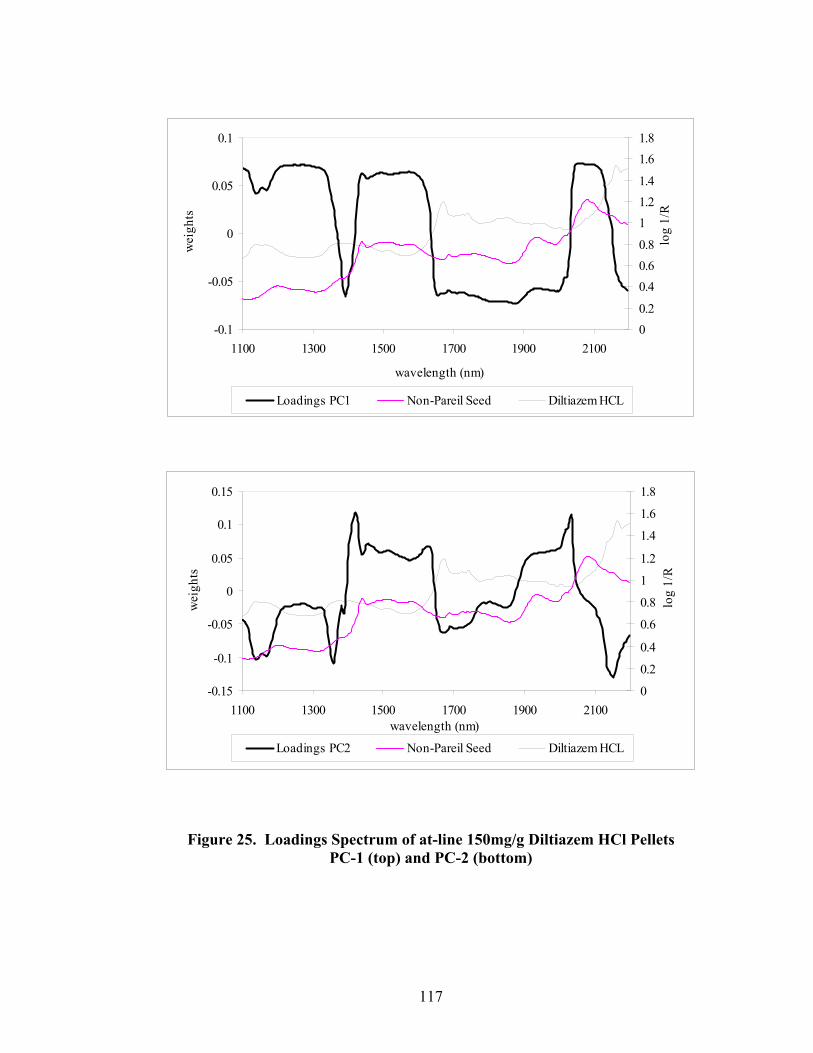
117
Figure 25. Loadings Spectrum of at-line 150mg/g Diltiazem HCl Pellets PC-1 (top) and PC-2 (bottom)
-0.1
-0.05
0
0.05
0.1
1100 1300 1500 1700 1900 2100
wavelength (nm)
wei
ghts
00.2
0.40.60.8
11.21.4
1.61.8
log
1/R
Loadings PC1 Non-Pareil Seed Diltiazem HCL
-0.15
-0.1
-0.05
0
0.05
0.1
0.15
1100 1300 1500 1700 1900 2100wavelength (nm)
wei
ghts
0
0.2
0.4
0.6
0.8
1
1.2
1.4
1.6
1.8
log
1/R
Loadings PC2 Non-Pareil Seed Diltiazem HCL
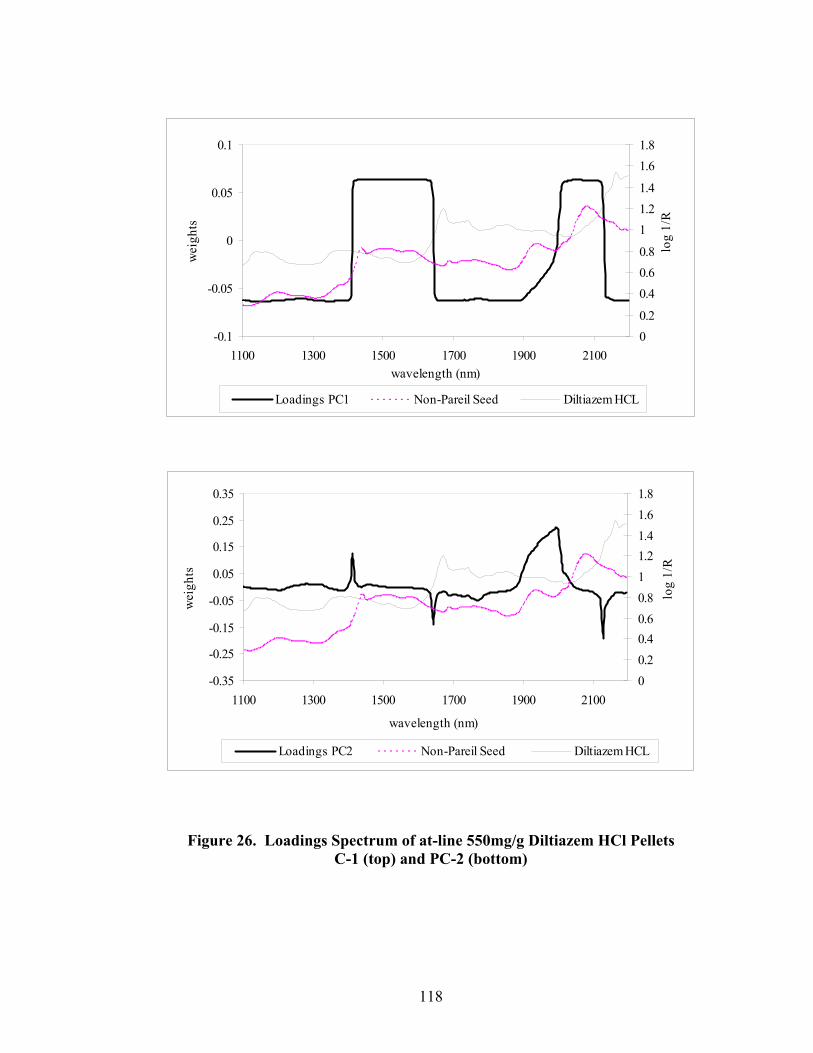
118
Figure 26. Loadings Spectrum of at-line 550mg/g Diltiazem HCl Pellets C-1 (top) and PC-2 (bottom)
-0.1
-0.05
0
0.05
0.1
1100 1300 1500 1700 1900 2100wavelength (nm)
wei
ghts
00.2
0.40.60.8
11.21.4
1.61.8
log
1/R
Loadings PC1 Non-Pareil Seed Diltiazem HCL
-0.35
-0.25
-0.15
-0.05
0.05
0.15
0.25
0.35
1100 1300 1500 1700 1900 2100
wavelength (nm)
wei
ghts
00.20.40.60.811.21.41.61.8
log
1/R
Loadings PC2 Non-Pareil Seed Diltiazem HCL
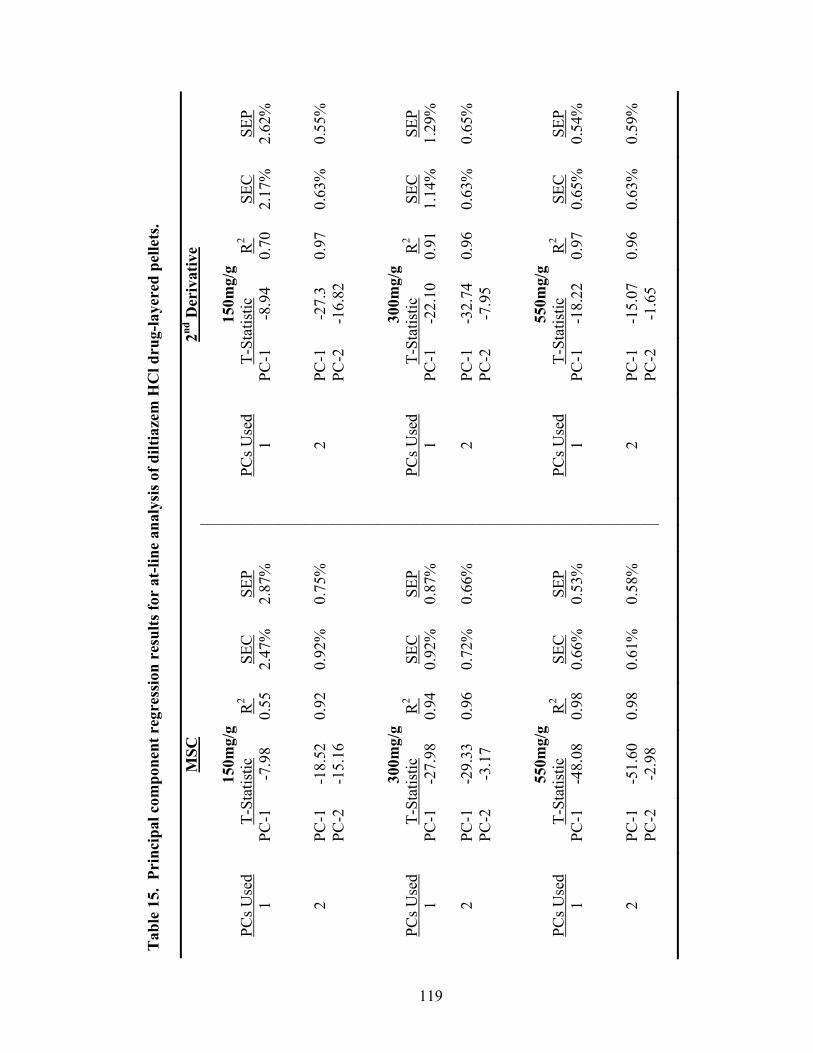
119
Tab
le 1
5. P
rinc
ipal
com
pone
nt r
egre
ssio
n re
sults
for
at-li
ne a
naly
sis o
f dilt
iaze
m H
Cl d
rug-
laye
red
pelle
ts.
M
SC
2nd D
eriv
ativ
e
15
0mg/
g
15
0mg/
g PC
s Use
d T-
Stat
istic
R
2 SE
C
SEP
PCs U
sed
T-St
atis
tic
R2
SEC
SE
P 1
PC-1
-7
.98
0.55
2.
47%
2.
87%
1
PC-1
-8
.94
0.70
2.
17%
2.
62%
2
PC-1
-1
8.52
0.
92
0.92
%
0.75
%
2 PC
-1
-27.
3 0.
97
0.63
%
0.55
%
PC
-2
-15.
16
PC-2
-1
6.82
300m
g/g
300m
g/g
PCs U
sed
T-St
atis
tic
R2
SEC
SE
P
PC
s Use
d T-
Stat
istic
R
2 SE
C
SEP
1 PC
-1
-27.
98
0.94
0.
92%
0.
87%
1
PC-1
-2
2.10
0.
91
1.14
%
1.29
%
2 PC
-1
-29.
33
0.96
0.
72%
0.
66%
2
PC-1
-3
2.74
0.
96
0.63
%
0.65
%
PC
-2
-3.1
7
PC
-2
-7.9
5
550m
g/g
550m
g/g
PCs U
sed
T-St
atis
tic
R2
SEC
SE
P
PC
s Use
d T-
Stat
istic
R
2 SE
C
SEP
1 PC
-1
-48.
08
0.98
0.
66%
0.
53%
1
PC-1
-1
8.22
0.
97
0.65
%
0.54
%
2 PC
-1
-51.
60
0.98
0.
61%
0.
58%
2
PC-1
-1
5.07
0.
96
0.63
%
0.59
%
PC
-2
-2.9
8
PC
-2
-1.6
5
120
SEC and SEP were inversely related to pellet strength. In general at-line analysis had
SEC and SEP values about 0.5% lower than those obtained from in-line methods. A
detailed discussion of the factors contributing to the observed differences in calibration
and prediction errors between in-line and at-line analyses is provided later in this
manuscript.
3.1.2.3 Partial Least Squares Regression
Partial least squares regression results of D2 spectra for all pellet strengths are
summarized in Table 16. The results were similar to those obtained using PCR, with
SEPs less than 1% achieved, and an inverse relationship between pellet strength and SEP
observed In general, the PLS models used one additional regression factor as compared
to PCR, which may be attributed to inclusion of sources of analyte error in the model.
The addition of such information may have allowed slightly lower SEPs to be achieved
without overfitting. The ratio of current MSECV value to the minimum value in the
calibration was again effective at identifying an ideal number of factors to prevent
overfitting.
3.1.2.4 Summary of At-Line Regression Model Performance
A summary of the performance of optimized single wavelength, multiple
wavelength, PCR and PLS models for at-line analysis of all pellet strengths is presented
in Table 17. In addition, a plot of both the calibration and prediction results obtained by
principal component regression of second derivative spectra for 150mg/g pellets is
presented in Figure 27. Similar calibration results were obtained for 150mg/g, 300mg/g,
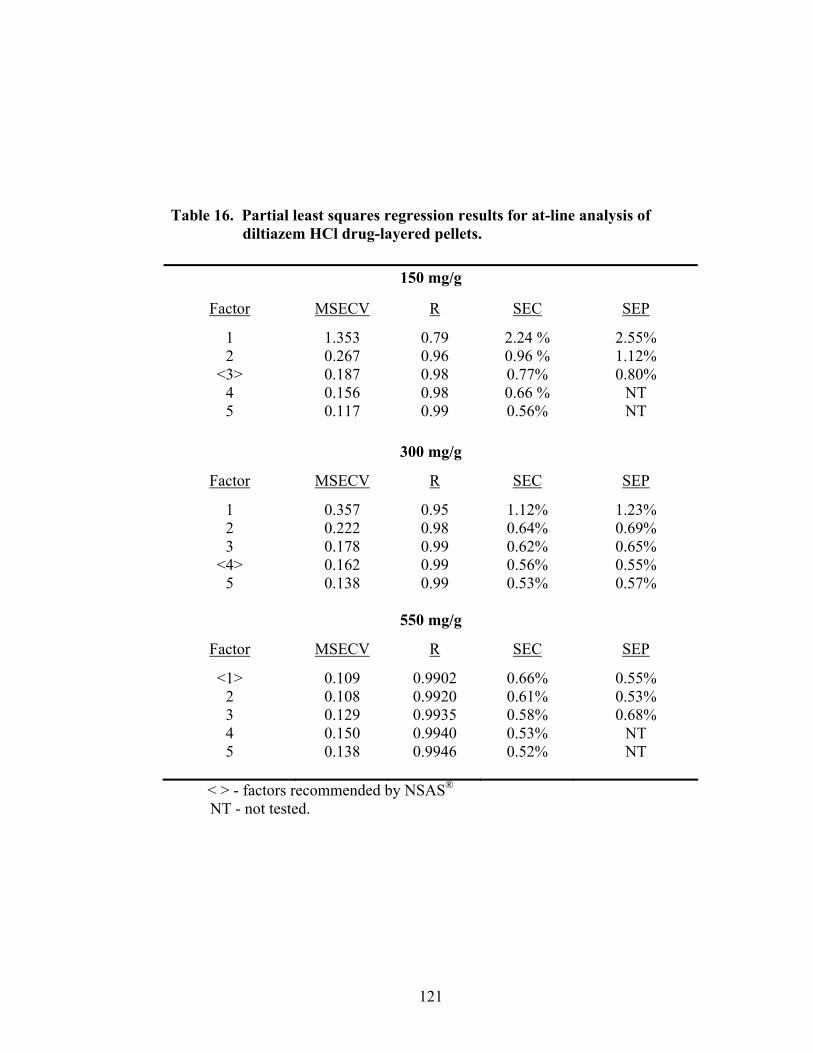
121
Table 16. Partial least squares regression results for at-line analysis of diltiazem HCl drug-layered pellets.
150 mg/g
Factor MSECV R SEC SEP
1 1.353 0.79 2.24 % 2.55% 2 0.267 0.96 0.96 % 1.12%
<3> 0.187 0.98 0.77% 0.80% 4 0.156 0.98 0.66 % NT 5 0.117 0.99 0.56% NT
300 mg/g
Factor MSECV R SEC SEP
1 0.357 0.95 1.12% 1.23% 2 0.222 0.98 0.64% 0.69% 3 0.178 0.99 0.62% 0.65%
<4> 0.162 0.99 0.56% 0.55% 5 0.138 0.99 0.53% 0.57%
550 mg/g
Factor MSECV R SEC SEP
<1> 0.109 0.9902 0.66% 0.55% 2 0.108 0.9920 0.61% 0.53% 3 0.129 0.9935 0.58% 0.68% 4 0.150 0.9940 0.53% NT 5 0.138 0.9946 0.52% NT
< > - factors recommended by NSAS®
NT - not tested.

122
Table 17. Summary of regression results for at-line assessment of pellet potency.
150mg/g Diltiazem HCl Pellets
Potency (%) Regression Model PCs R2 SEC SEP
PCR – MSC 2 0.92 0.92 0.75 PCR – D2 2 0.97 0.63 0.55 PLS – D2 3 0.98 0.77 0.80 Multiple Wavelength -- 0.99 0.54 0.56 Single Wavelength -- 0.98 0.76 0.84
300mg/g Diltiazem HCl Pellets Potency (%)
Regression Model PCs R2 SEC SEP PCR – MSC 2 0.96 0.72 0.66 PCR – D2 2 0.96 0.63 0.65 PLS – D2 4 0.99 0.56 0.55 Multiple Wavelength -- 0.98 0.70 0.78 Single Wavelength -- 0.99 0.55 0.52
550mg/g Diltiazem HCl Pellets Potency (%)
Regression Model PCs R2 SEC SEP PCR – MSC 1 0.98 0.66 0.53 PCR – D2 1 0.97 0.65 0.54 PLS – D2 1 0.99 0.66 0.55 Multiple Wavelength -- 0.99 0.48 0.53 Single Wavelength -- 0.99 0.49 0.56
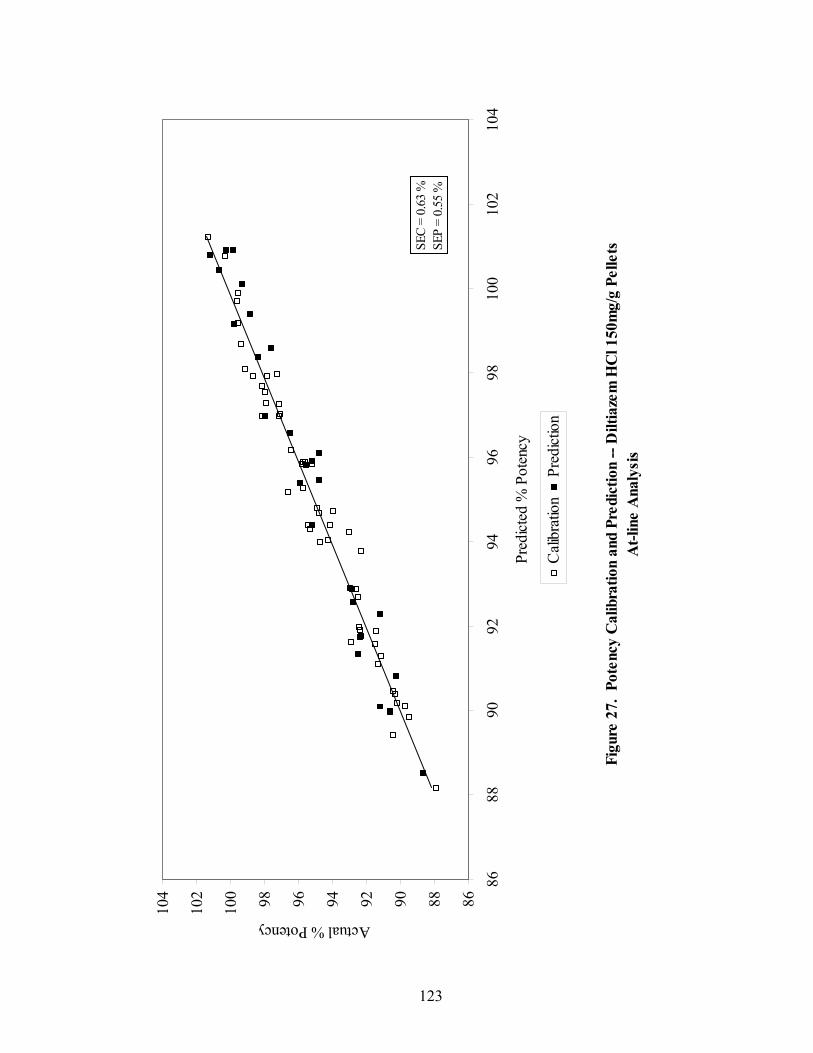
123
Figu
re 2
7. P
oten
cy C
alib
ratio
n an
d Pr
edic
tion
-- D
iltia
zem
HC
l 150
mg/
g Pe
llets
At-l
ine
Ana
lysi
s
86889092949698100
102
104
8688
9092
9496
9810
010
210
4
Pred
icted
% P
oten
cy
Actual % Potency
Cali
brat
ion
Pred
ictio
n
SEC
= 0.
63 %
SEP
= 0.
55 %
124
and 550mg/g drug layered pellets. At-line analysis produced significantly better
calibration and prediction results than the in-line system. All multivariate calibration
models demonstrated R2 values of 0.94 or greater and standard errors of calibration no
greater than 1.0%. The simplistic single and multiple wavelength models also
demonstrated their ability to predict pellet potency within 1% of actual HPLC values. As
previously discussed, such results indicate that it may be possible to employ inexpensive
single filter instruments for on-line monitoring of drug layering operations. However, the
numerous advantages of full-spectrum methods should be strongly considered during
near-IR method development.
3.1.3 Comparison of In-line and At-line Near-IR Methods for Monitoring Drug Layering
A comparison between in-line and at-line calibration model prediction errors is
presented in Table 18. Using PCR or PLS, the average in-line and at-line SEPs for pellet
potency were 1.11% and 0.63%, respectively, with a maximum SEP exhibited by the
150mg/g strength PLS-D2 in-line model. The use of single or multiple wavelength
models allowed potency prediction with average SEPs of 1.09% and 0.63%, for in-line
and at-line analyses, with a maximum value of 1.72% exhibited in the 500mg/g in-line
model. Such results are reasonable in terms of the ability to control the drug loading
process, and acceptable with respect to the 0.46% SEL value of the reference method.
Overall, at-line analyses demonstrated lower calibration and prediction errors than
in-line methods. Several contributing factors to the robust performance of the at-line
method may include: (i) the stationary nature of the sample; (ii) normalized particle size
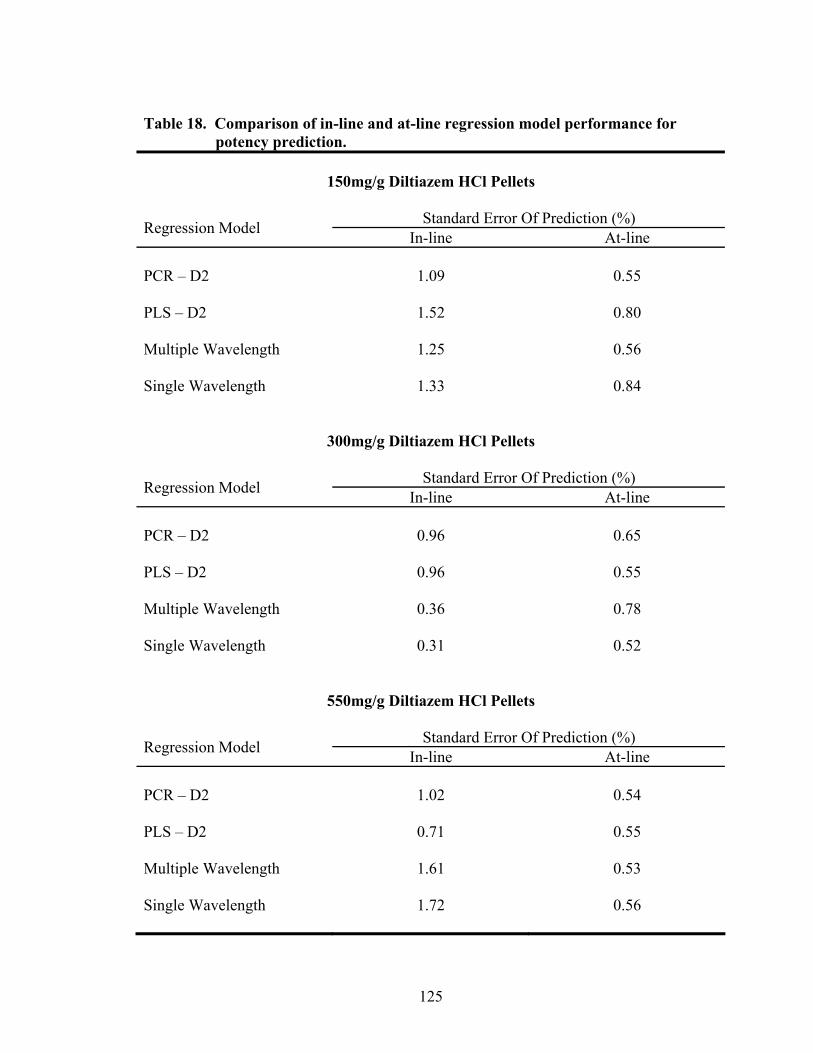
125
Table 18. Comparison of in-line and at-line regression model performance for potency prediction.
150mg/g Diltiazem HCl Pellets
Standard Error Of Prediction (%) Regression Model In-line At-line PCR – D2
1.09 0.55
PLS – D2
1.52 0.80
Multiple Wavelength
1.25 0.56
Single Wavelength
1.33 0.84
300mg/g Diltiazem HCl Pellets
Standard Error Of Prediction (%) Regression Model In-line At-line
PCR – D2
0.96 0.65
PLS – D2
0.96 0.55
Multiple Wavelength
0.36 0.78
Single Wavelength
0.31 0.52
550mg/g Diltiazem HCl Pellets
Standard Error Of Prediction (%) Regression Model In-line At-line
PCR – D2
1.02 0.54
PLS – D2
0.71 0.55
Multiple Wavelength
1.61 0.53
Single Wavelength
1.72 0.56

126
and morphology due to removal of pellets from the process stream and sieving prior to
analysis; (iii) the use of a larger number of samples for calibration development to
encompass inherent variability in the sample pellet population; and (iv) differences
between the spectral acquisition systems.
The number of samples for calibration development and prediction for the in-line
system was unavoidable given the rate of potency change during processing and the
operations that needed to be performed between each sample point. Within the potency
range used for calibration development, theoretical potency increased by approximately
1% every 1.5, 3 or 4 min for the 150mg/g, 300mg/g, and 550mg/g lots, respectively. The
following operations, which required approximately 65 – 70 sec to complete, were
performed between the acquisition of each sample: (i) obtain a 20 scan spectrum [~30
seconds]; (ii) thief pellet sample from processor for reference potency analysis and at-line
analysis [~10 sec]; (iii) sieve pellet sample through upper and lower sieve to remove
agglomerates [~15 sec]; (iv) transfer pellet sample to labeled sample vial [~10 sec].
For the 300mg/g and 550mg/g strengths, the relative non-active time available
between sample time points was approximately 1.5 and 2.5 min, respectively. For
150mg/g pellet processing, there was only about 20 sec of non-active time. Additional
samples were not obtained because the sampling scheme was designed to assess samples
at predefined process points corresponding to theoretical coating levels based on
traditional weight gain monitoring methods. If the study were to be repeated, a larger
number of samples in the calibration set would be investigated by both increasing the
potency range being investigated, and increasing the number of batches to be included in
the calibration set.
127
To investigate the effect of increasing both the calibration range and the number
of samples in the calibration set, a regression model was developed using 162 spectra
collected at-line from a total of nine rotogranulation batches (3 lots per strength) for
150mg/g, 300mg/g, and 550mg/g pellets. In order to develop the calibration across all
pellet strengths, potency values were converted to percentage of diltiazem HCl content
per pellet sample, 15%, 30%, 55%, respectively. A scatter plot of the calibration
obtained following principal component regression of MSC spectra is presented in
Figure 28. To test the calibration, the drug content of 108 samples from six additional
batches (2 lots per strength) was assessed. Using two principal components an R2 value
of 0.998, an SEC of 0.66%, and an SEP of 0.71% were achieved.
Although it was possible to develop a single calibration across the studied range
of pellet strengths, differences in slope between individual pellet strength categories can
be seen in Figure 28. These deviations are a manifestation of non-linearity between the
response of the near-IR method and drug concentration across the broad range of the
single calibration model. Such non-linearity may result in erroneous estimation of pellet
potency, and could adversely affect the ability to validate such a method for routine use.
Therefore, the development of individual potency calibrations within specific pellet
strength categories, as conducted in this study, is preferred. An additional limitation of
this model is the time required to perform the processing steps described above relative to
the rate of potency change occurring during processing. In such cases, unique calibration
models with a reduced number of scans would be required. Alternatively, though not
preferred due to increased cost and process inefficiency, the drug layering suspension
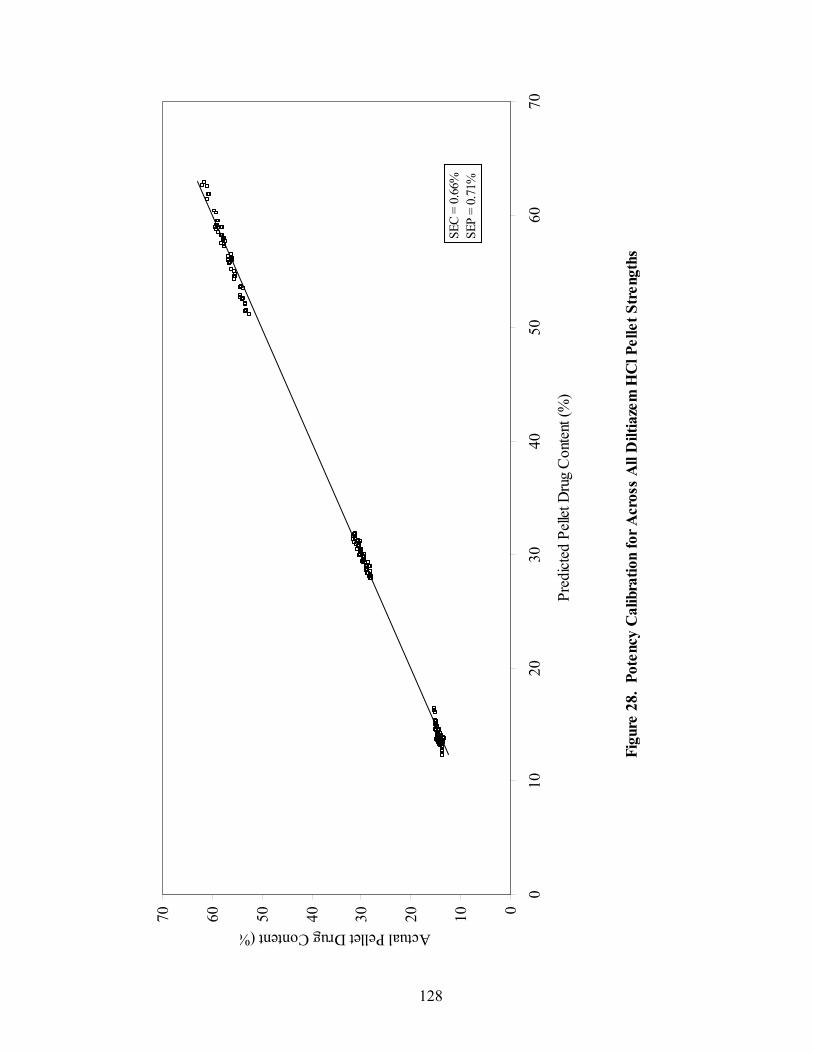
128
Figu
re 2
8. P
oten
cy C
alib
ratio
n fo
r Acr
oss
All
Dilt
iaze
m H
Cl P
elle
t Str
engt
hs
010203040506070
010
2030
4050
6070
Pred
icted
Pell
et D
rug
Con
tent
(%)
Actual Pellet Drug Content (%
SEC
= 0.
66%
SEP
= 0.
71%
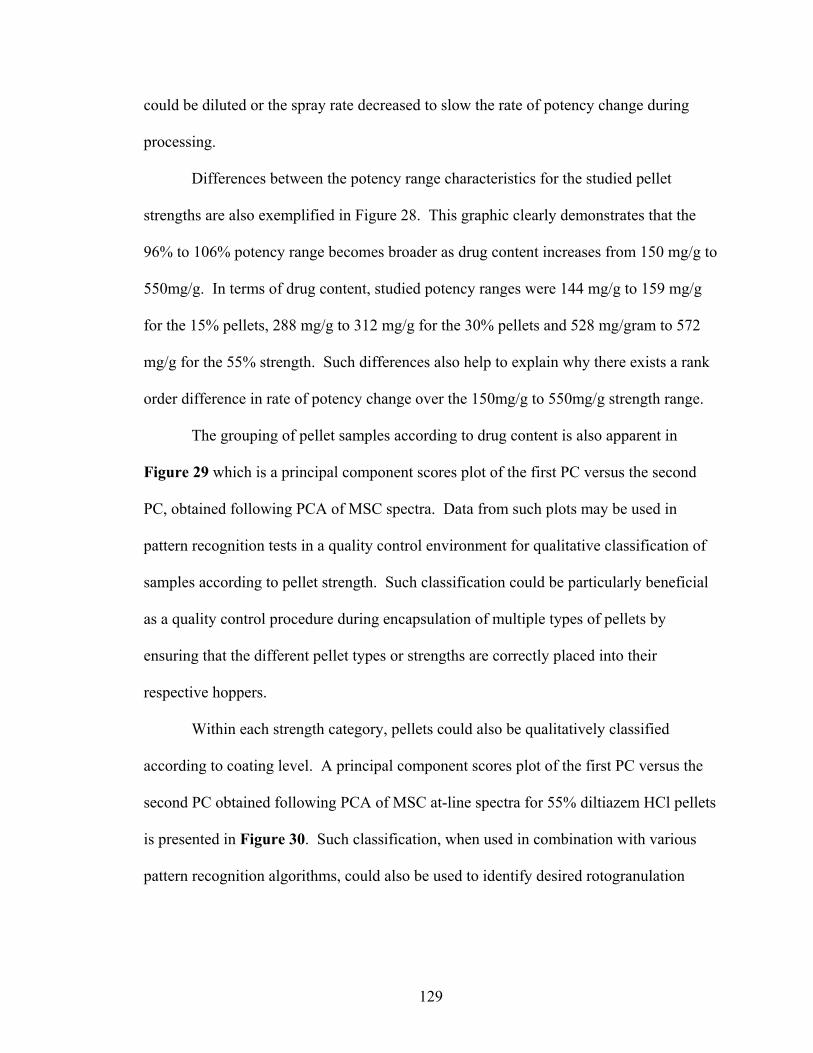
129
could be diluted or the spray rate decreased to slow the rate of potency change during
processing.
Differences between the potency range characteristics for the studied pellet
strengths are also exemplified in Figure 28. This graphic clearly demonstrates that the
96% to 106% potency range becomes broader as drug content increases from 150 mg/g to
550mg/g. In terms of drug content, studied potency ranges were 144 mg/g to 159 mg/g
for the 15% pellets, 288 mg/g to 312 mg/g for the 30% pellets and 528 mg/gram to 572
mg/g for the 55% strength. Such differences also help to explain why there exists a rank
order difference in rate of potency change over the 150mg/g to 550mg/g strength range.
The grouping of pellet samples according to drug content is also apparent in
Figure 29 which is a principal component scores plot of the first PC versus the second
PC, obtained following PCA of MSC spectra. Data from such plots may be used in
pattern recognition tests in a quality control environment for qualitative classification of
samples according to pellet strength. Such classification could be particularly beneficial
as a quality control procedure during encapsulation of multiple types of pellets by
ensuring that the different pellet types or strengths are correctly placed into their
respective hoppers.
Within each strength category, pellets could also be qualitatively classified
according to coating level. A principal component scores plot of the first PC versus the
second PC obtained following PCA of MSC at-line spectra for 55% diltiazem HCl pellets
is presented in Figure 30. Such classification, when used in combination with various
pattern recognition algorithms, could also be used to identify desired rotogranulation
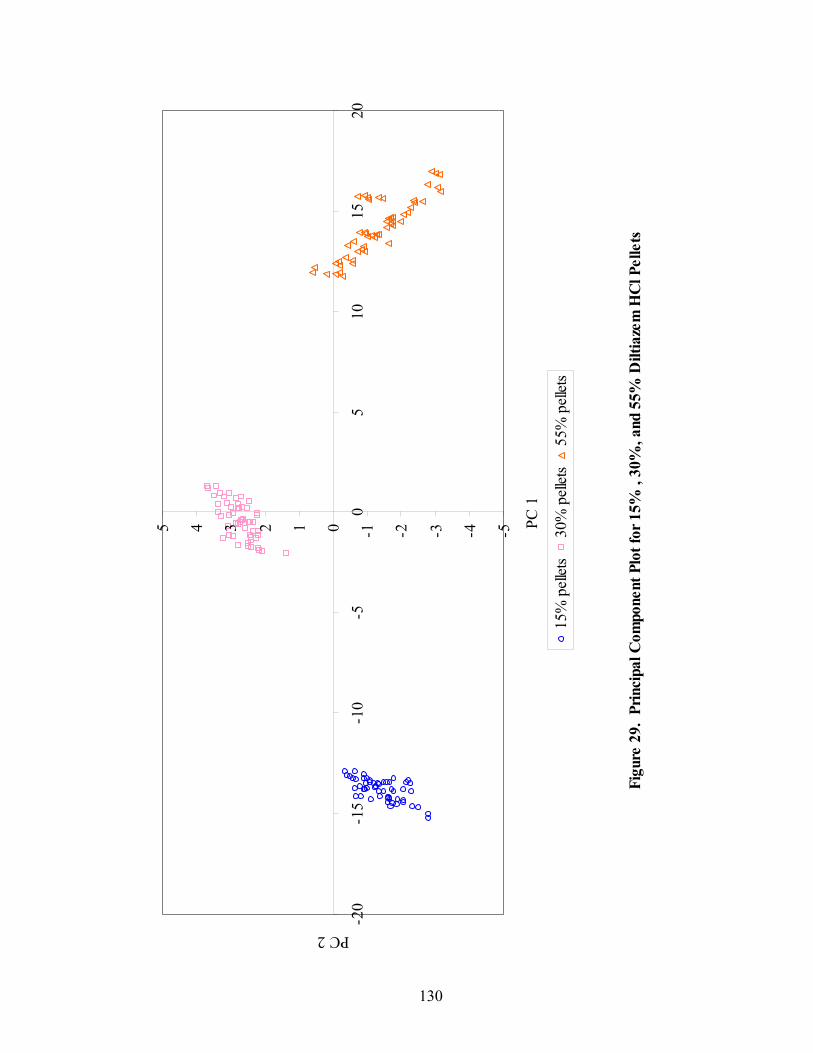
130
Figu
re 2
9. P
rinci
pal C
ompo
nent
Plo
t for
15%
, 30
%, a
nd 5
5% D
iltia
zem
HC
l Pel
lets
-5-4-3-2-1012345
-20
-15
-10
-50
510
1520
PC 1
PC 2
15%
pell
ets
30%
pell
ets
55%
pell
ets
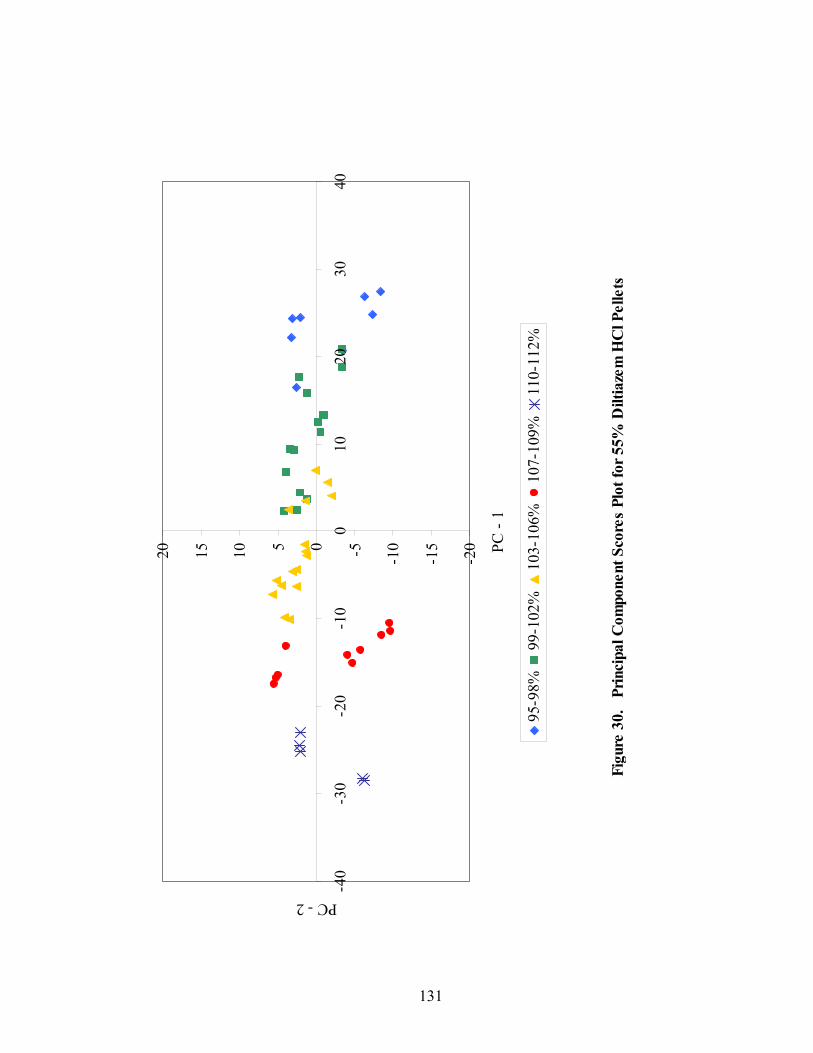
131
Figu
re 3
0.
Prin
cipa
l Com
pone
nt S
core
s Pl
ot fo
r 55%
Dilt
iaze
m H
Cl P
elle
ts
-20
-15
-10-505101520
-40
-30
-20
-10
010
2030
40
PC -
1
PC - 2
95-9
8%99
-102
%10
3-10
6%10
7-10
9%11
0-11
2%
132
process endpoints. An example of this type of application is discussed later in this
manuscript.
Another significant factor governing the robust performance of the at-line method
for assessing pellet potency is the configuration of spectral data collection systems. For
at-line analysis, a NIRSystems Rapid Content Analyzer® module was used for spectral
collection, while in-line analysis utilized a NIRSystems fiber optic Smart Probe®.
Although both the Rapid Content Analyzer and the Smart Probe utilize fiber bundles for
transmitting excitation light to the sample, there are significant differences in their bundle
configurations. The RCA utilizes 420 fibers to transmit near-IR excitation energy from
the source to the sample over a distance of 10 in. The Smart Probe, which is also
composed of 420 fibers, however, utilizes 210 fibers to transmit excitation energy to the
sample and 210 fibers to return reflected light to the detector over a distance of 5 ft.
Since the Smart Probe, as compared to the RCA, utilizes fewer fibers to carry
light to and from the sample and the distance the energy must travel is much greater,
significant energy loss over the length of the fiber occurs. This energy
loss translates to lower absorbance values for spectra collected using the probe. This
difference is exemplified in Figure 31, which depicts spectra of 100% potent
150mg/g diltiazem HCl pellets collected using either the RCA or the SmartProbe. Such
absorption differences are likely to translate to a lower signal to noise ratio for the
SmartProbe, which may contribute to the higher and more variable SEC and SEP results
obtained during in-line assessment of pellet potency. This increase in noise can be
observed in Figure 32, which shows the loadings spectrum for PC-1 following PCA
analysis of MSC spectra for a 150mg/g rotogranulation trial analyzed using the Smart

133
Figu
re 3
1. C
ompa
rison
of 1
50m
g/g
Dilt
iaze
m H
Cl P
elle
t Spe
ctra
RC
A v
ersu
s Sm
artP
robe
Sam
plin
g
0
0.2
0.4
0.6
0.81
1.2 11
0013
0015
0017
0019
0021
00
wav
eleng
th (n
m)
log 1/R
RCA
Prob
e

134
Figu
re 3
2. P
C-1
Loa
ding
s fo
r 15%
Dilt
iaze
m H
Cl P
elle
ts -
Ana
lysi
s vi
a Sm
art P
robe
-0.1
-0.0
8
-0.0
6
-0.0
4
-0.0
20
0.02
0.04
0.06
0.080.
1 1100
1300
1500
1700
1900
2100
Wav
eleng
th (n
m)
weights
00.2
0.4
0.6
0.8
11.2
1.4
log 1/R
Load
ings P
C1
Non
-Par
eil S
eed
Dilti
azem
HC
L

135
Probe. A much smoother loadings spectrum for the same samples analyzed using the
RCA is shown Figure 33.
Two additional factors that may have contributed to increased noise in the in-line
spectra are sample presentation and pellet morphology and size distribution. In-line
analysis assessed the characteristics of moving particles, whereas the at-line technique
involved analysis of stationary samples. Prior to at-line analysis, agglomerates and fines
were removed from the sample via a simple sieving process. During in-line analysis,
however, there was no opportunity to remove out-of-specification particles from the
batch.
3.1.4. Practical Considerations Regarding Near-infrared Monitoring of Drug Layering Numerous processing and formulation factors such as rotor speed, inlet air
temperature, process airflow, atomization air pressure, dew point, solids content of
layering suspension, binder level, and drug solubility characteristics can dramatically
affect the potency and morphology of pellets produced via rotogranulation. Although
typical drug layering processes utilize lengthy and expensive manufacturing schemes,
operations typically rely on theoretical determinations of applied solids to indirectly
predict drug layering endpoints.
During this study, the accuracy of the theoretical applied solids method for
assessing pellet potency was evaluated. Table 19 is a summary of the theoretical (based
on applied suspension solids) versus actual potency (as determined by HPLC) for
150mg/g, 300mg/g, and 550mg/g diltiazem HCl pellets. These data demonstrate that
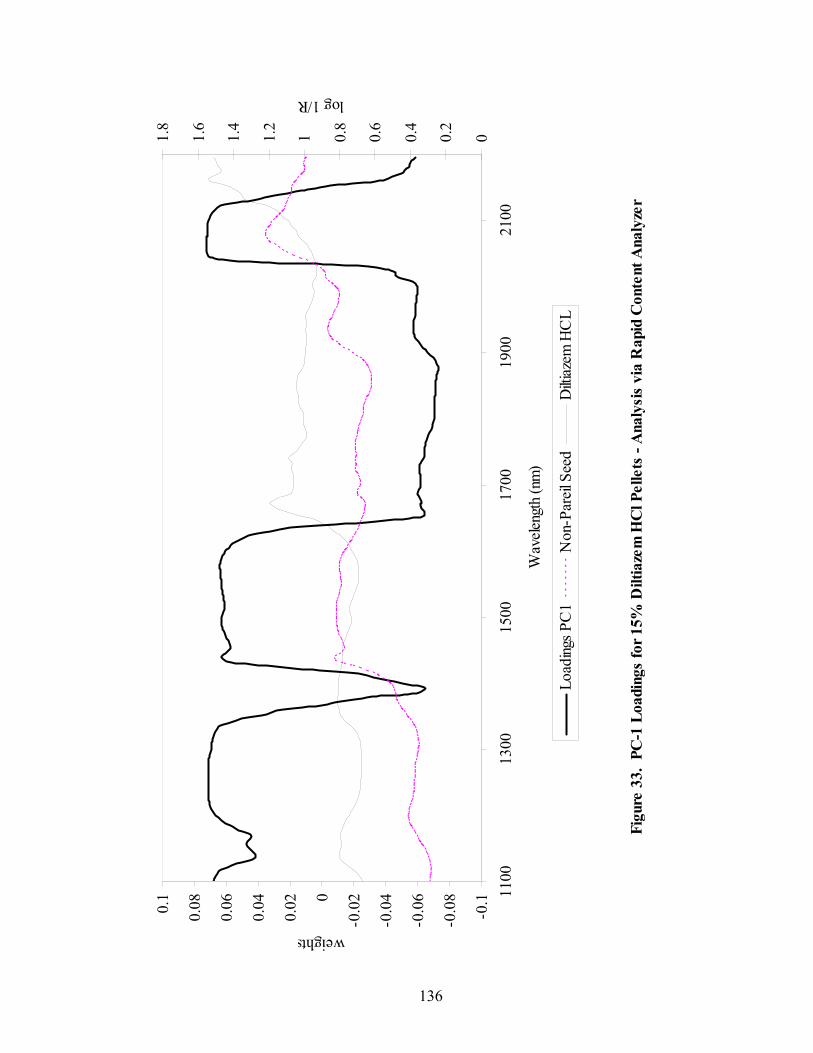
136
Figu
re 3
3. P
C-1
Loa
ding
s fo
r 15%
Dilt
iaze
m H
Cl P
elle
ts -
Ana
lysi
s vi
a R
apid
Con
tent
Ana
lyze
r
-0.1
-0.0
8
-0.0
6
-0.0
4
-0.0
20
0.02
0.04
0.06
0.080.
1 1100
1300
1500
1700
1900
2100
Wav
eleng
th (n
m)
weights
00.2
0.4
0.6
0.8
11.2
1.4
1.6
1.8
log 1/R
Load
ings P
C1
Non
-Par
eil S
eed
Dilti
azem
HC
L
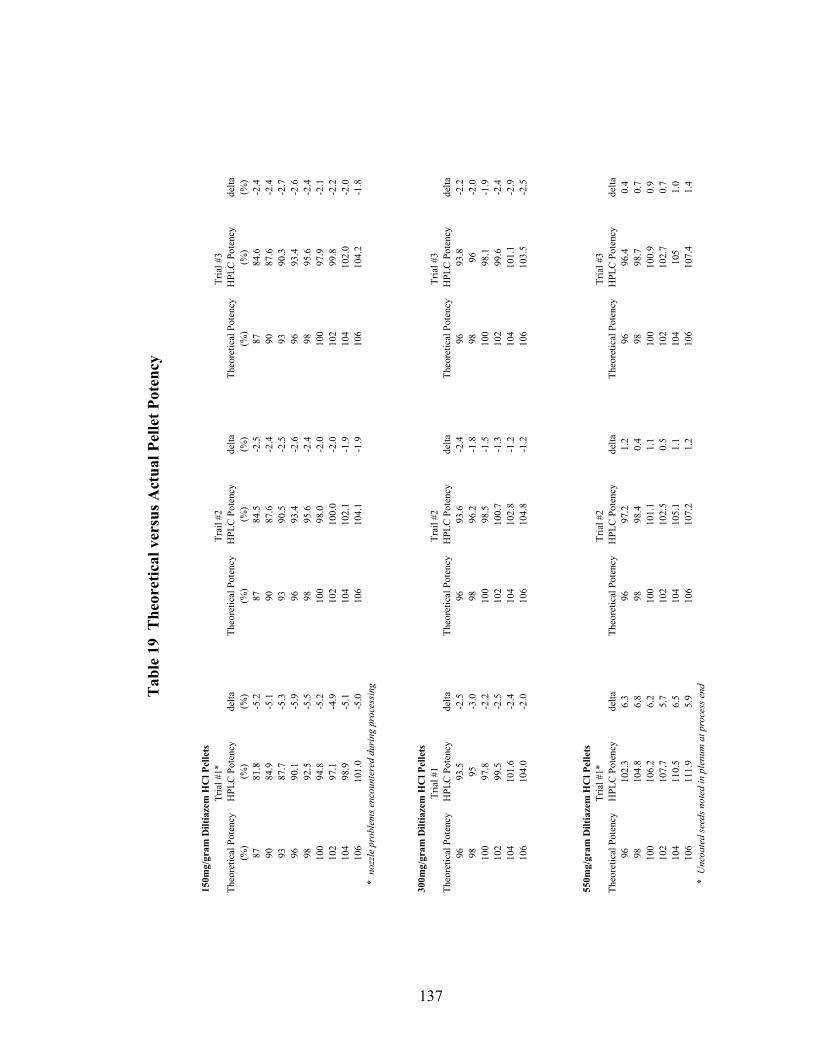
137
Tab
le 1
9 T
heor
etic
al v
ersu
s Act
ual P
elle
t Pot
ency
150m
g/gr
am D
iltia
zem
HC
l Pel
lets
Theo
retic
al P
oten
cyH
PLC
Pot
ency
delta
Theo
retic
al P
oten
cyH
PLC
Pot
ency
delta
Theo
retic
al P
oten
cyH
PLC
Pot
ency
delta
(%)
(%)
(%)
(%)
(%)
(%)
(%)
(%)
(%)
8781
.8-5
.287
84.5
-2.5
8784
.6-2
.490
84.9
-5.1
9087
.6-2
.490
87.6
-2.4
9387
.7-5
.393
90.5
-2.5
9390
.3-2
.796
90.1
-5.9
9693
.4-2
.696
93.4
-2.6
9892
.5-5
.598
95.6
-2.4
9895
.6-2
.410
094
.8-5
.210
098
.0-2
.010
097
.9-2
.110
297
.1-4
.910
210
0.0
-2.0
102
99.8
-2.2
104
98.9
-5.1
104
102.
1-1
.910
410
2.0
-2.0
106
101.
0-5
.010
610
4.1
-1.9
106
104.
2-1
.8
300m
g/gr
am D
iltia
zem
HC
l Pel
lets
Theo
retic
al P
oten
cyH
PLC
Pot
ency
delta
Theo
retic
al P
oten
cyH
PLC
Pot
ency
delta
Theo
retic
al P
oten
cyH
PLC
Pot
ency
delta
9693
.5-2
.596
93.6
-2.4
9693
.8-2
.298
95-3
.098
96.2
-1.8
9896
-2.0
100
97.8
-2.2
100
98.5
-1.5
100
98.1
-1.9
102
99.5
-2.5
102
100.
7-1
.310
299
.6-2
.410
410
1.6
-2.4
104
102.
8-1
.210
410
1.1
-2.9
106
104.
0-2
.010
610
4.8
-1.2
106
103.
5-2
.5
55
0mg/
gram
Dilt
iaze
m H
Cl P
elle
ts
Theo
retic
al P
oten
cyH
PLC
Pot
ency
delta
Theo
retic
al P
oten
cyH
PLC
Pot
ency
delta
Theo
retic
al P
oten
cyH
PLC
Pot
ency
delta
9610
2.3
6.3
9697
.21.
296
96.4
0.4
9810
4.8
6.8
9898
.40.
498
98.7
0.7
100
106.
26.
210
010
1.1
1.1
100
100.
90.
910
210
7.7
5.7
102
102.
50.
510
210
2.7
0.7
104
110.
56.
510
410
5.1
1.1
104
105
1.0
106
111.
95.
910
610
7.2
1.2
106
107.
41.
4
* n
ozzl
e pr
oble
ms e
ncou
nter
ed d
urin
g pr
oces
sing
* U
ncoa
ted
seed
s not
ed in
ple
num
at p
roce
ss e
nd
Tria
l #1*
Tria
l #1
Trai
l #2
Tria
l #3
Tria
l #2
Tria
l #3
Tria
l #1*
Trai
l #2
Tria
l #3

138
there was an approximate 2% difference between theoretical and actual pellet potency,
with actual potency being less than theoretical values in most instances. For this type of
unit operation, such losses are expected, and would be addressed by adjusting the capsule
fill weight to compensate for the loss. However, during this study, trial #1 of the
150mg/g strength and trial #1 of the 550mg/g strength pellets demonstrated -5% and +6%
deviations from theoretical potency. These deviations were attributed to assignable
processing issues, which are not uncommon in routine pharmaceutical manufacturing
operations.
For the 150mg/g batch, several nozzle clogs during processing caused localized
over-wetting and generated approximately 10% agglomerates (>16 mesh) within the
batch. The agglomerates were subsequently removed from the batch via the screening
process. The screened pellets, although sub-potent, would conform to USP assay
specifications of 90.0% - 110% at the theoretical target process endpoint (100%
theoretical potency). Since actual HPLC potency values, not theoretical values, are used
in the development of calibration models, inclusion of these data in the model was
deemed acceptable.
For the 550mg/g batch, a significant quantity of non-pareil seeds was observed in
the air plenum below the rotor after processing. The beads were assayed and found to
contain no diltiazem. The absence of drug substance on the beads indicates that the beads
fell into the plenum during start-up which can occur with this rotogranulation operation.
This resulting decrease in the quantity of non-pareil seeds available for drug layering
subsequently resulted in the production of super-potent beads. These beads, were also
deemed acceptable for use in the development of calibration models.
139
The data summarized in the table above demonstrates that traditional methods of
monitoring applied coating suspension solids during rotogranulation are neither optimal
nor reliable. True batch potency, as measured by HPLC, and weight gain methods
differed by as much as 7% due to potential systematic problems that occurred during
processing, i.e., nozzle clogs or pellet loss to the plenum during start-up. Even when no
process anomalies were encountered, pellet potency as determined by weight gain
differed from HPLC values by an average of 3%. Hence, there is a need for an in-line
method to monitor such pelletization processes.
Because near-IR methods for determining pellet potency are less affected by
changes in processing conditions than traditional weight gain monitoring techniques,
such methods can provide a higher degree of confidence in identifying process endpoints.
With such methods in place, the development of near-IR in-process release specifications
could reduce production cycle-time by allowing subsequent batch processing to proceed
prior to receiving analytical laboratory results, or prevent the loss of an entire batch due
to an unexpected process anomaly.
3.1.5 Pilot Plant Applications
Because of the favorable results obtained in the laboratory scale study, an
experiment was conducted to assess the ability to predict the potency of pilot scale pellets
using data obtained from experiments performed in the laboratory. A comparison of
laboratory versus pilot-scale processing parameters, including rationale for scale-up
parameter selection is presented in Table 20. Although quantitatively identical
laboratory and pilot-scale 550mg/ml formulations were evaluated in this study,
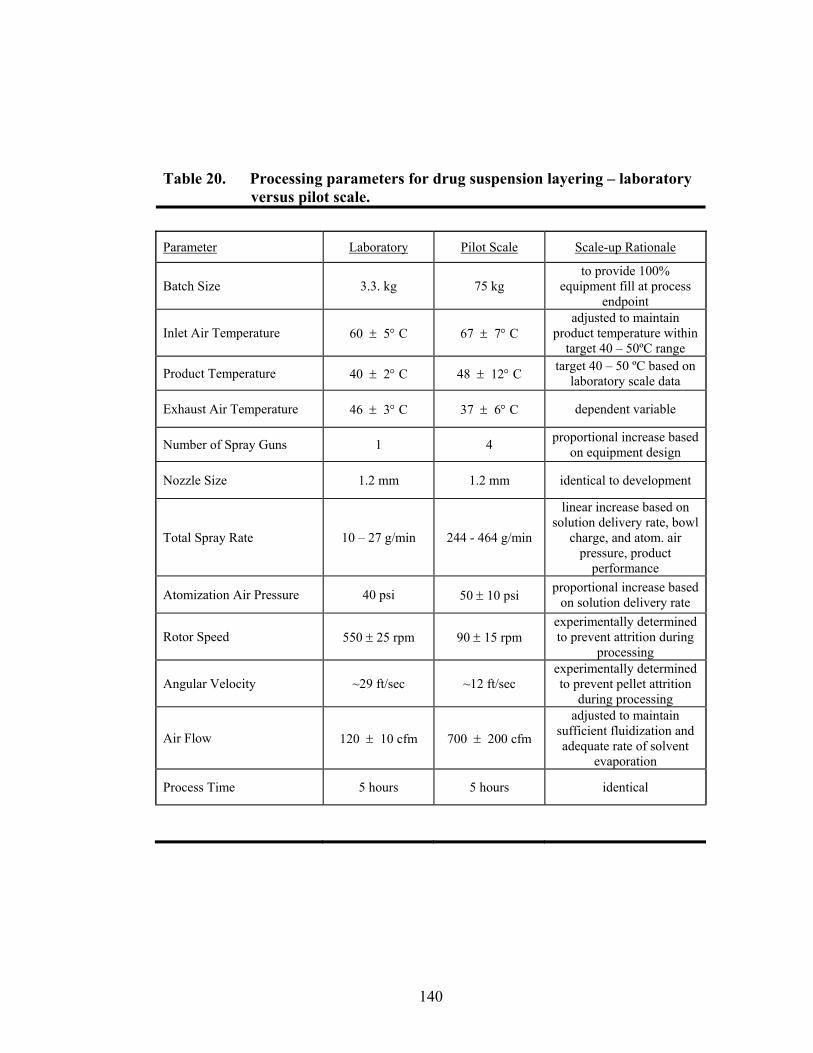
140
Table 20. Processing parameters for drug suspension layering – laboratory versus pilot scale. Parameter Laboratory Pilot Scale Scale-up Rationale
Batch Size 3.3. kg 75 kg to provide 100%
equipment fill at process endpoint
Inlet Air Temperature 60 ± 5° C 67 ± 7° C adjusted to maintain
product temperature within target 40 – 50ºC range
Product Temperature 40 ± 2° C 48 ± 12° C target 40 – 50 ºC based on laboratory scale data
Exhaust Air Temperature 46 ± 3° C 37 ± 6° C dependent variable
Number of Spray Guns 1 4 proportional increase based on equipment design
Nozzle Size 1.2 mm 1.2 mm identical to development
Total Spray Rate 10 – 27 g/min 244 - 464 g/min
linear increase based on solution delivery rate, bowl
charge, and atom. air pressure, product
performance
Atomization Air Pressure 40 psi 50 ± 10 psi proportional increase based on solution delivery rate
Rotor Speed 550 ± 25 rpm 90 ± 15 rpm experimentally determined to prevent attrition during
processing
Angular Velocity ~29 ft/sec ~12 ft/sec experimentally determined to prevent pellet attrition
during processing
Air Flow 120 ± 10 cfm 700 ± 200 cfm
adjusted to maintain sufficient fluidization and adequate rate of solvent
evaporation
Process Time 5 hours 5 hours identical
141
theoretically determined process parameters were adjusted, as necessary, to provide a
finished product with desirable physical (narrow particle size distribution, minimal
agglomerates and fines, smooth surface) and chemical (assay, content uniformity)
characteristics. Near-IR analyses were conducted once final process parameters were
defined.
The MSC/PCR calibration developed for the 550mg/g laboratory scale pellets was
used to predict the potency of a 75 kg pilot scale batch. Figure 34 shows a plot of
predicted versus actual potency. The prediction error for this study, 1.04%, although
acceptable, was slightly higher than in the laboratory study. This error may be attributed
to differences in pellet surface characteristics and density differences between laboratory
and pilot scale pellets.
The application of near-IR for predicting the endpoint of clinical or production
scale batches based on calibration models developed in the laboratory may prove to be
very important to the pharmaceutical manufacturer. When drug layering or polymer
coating efficiencies vary, as they do, from lab scale equipment to larger equipment used
for manufacturing, the availability of a rapid on-line or at-line measurement for
prediction of process endpoints may potentially save millions of dollars in time and
materials. Although the standard error of prediction may not match the values obtained
when calibration and validation data arise from product manufactured on the same
equipment, the results may be good enough to prevent loss from the initial batches of
clinical production lots of product while saving valuable time.
An additional study was conducted to assess the ability to monitor clinical batch
pellet production and predict pellet potency. From each of the initial 75 kg batches,

142
Figu
re 3
4. P
ilot-S
cale
Pot
ency
Pre
dict
ion
usin
g La
bora
tory
-sca
le D
ata
75 k
g B
atch
Size
86889092949698100
102
104
8688
9092
9496
9810
010
210
4
Pred
icted
% P
oten
cy
Actual % Potency
Cali
brat
ion
Pred
ictio
n
SEC
= 0
.60%
SEP
= 1
.04%
143
eighteen samples ranging from 90% to 100% theoretical potency were analyzed
according to previously described at-line methods, and used to develop potency
calibrations. Samples from two additional 75 kg pilot-scale batches, processed using
similar conditions to those used for calibration, were used to test the model. The
regression results for PCR, PLS, and single wavelength calibration provided SEP values
ranging from 0.32% to 0.53% which were similar to those observed in laboratory-scale
at-line analysis. Such results are not surprising since both the training samples and the
test samples were processed under the same conditions, handled similarly, and tested via
the same at-line procedures. Because these batches were part of a clinical batch
manufacturing campaign, it was not possible to conduct in-line analysis due to cGMP
concerns. However, the at-line results clearly demonstrate that near-IR analysis can be
an efficient tool for accurately monitoring the potency of drug layered beads in a
production environment.
3.2 Quantitative Prediction of Eudragit RS30D Coating Level
Wurster coating studies utilized diltiazem HCl pellets from each potency class
prepared during initial rotogranulation studies. The pellets were coated with an aqueous
dispersion of Eudragit RS30D (ERS) which was plasticized with triethyl citrate and
contained talc as an anti-tacking agent. Figure 35 (baselines off-set for clarity) shows
the spectra of a core 550mg/g diltiazem pellet, a cast ERS film, and coated pellets
containing 5% to 16% theoretical applied polymer solids. Although the spectra appear to

144
Figu
re 3
5. 5
50m
g/g
Dilt
iaze
m P
elle
ts --
Coa
ted
6% to
16%
App
lied
Poly
mer
Sol
ids
0
0.2
0.4
0.6
0.81
1.2
1.4 11
0013
0015
0017
0019
0021
0023
0025
00
wav
eleng
th (n
m)
log 1/R
RS30
D
55%
Cor
es
Coat
ed P
elle
ts
145
be very similar, minor spectral changes can be observed in regions characteristic of the
Eudragit RS30D polymer and core pellets. Chemical structures of the primary coating
system and core pellet components were presented in Figure 17 and Figure 20,
respectively.
Truncated regions of the coated bead spectra, presented in Figure 36, demonstrate
that absorbance increases with applied coating in regions characteristics of the coating
material, while absorbance decreases in regions characteristic of the core pellet. The
increasing absorbance in the 1680 to 1700 nm is attributed to C-H stretching in the first
overtone region due to the influence of the poly(ethylacrylate, methylmethacrylate)
trimethyl-ammonio-ethylmethacrylate chloride polymer, the primary component of the
ERS system. The decreasing absorbance observed in a region characteristic of the core
pellet, 2156 nm to 2180 nm, are likely the result of a combination bands arising from
amine stretching associated with diltiazem HCl.
3.2.1 In-Line Analysis of Coated Pellets
Duplicate coating batches were processed for each of the three different potency
types of diltiazem HCl core beads. The same calibration techniques used to build models
for the prediction of pellet potency were employed to develop an in-line near-IR method
for determining applied ERS solids during Wurster coating.
Single wavelength, multiple wavelength, and principal component calibrations
were developed using both scatter corrected and second derivative spectra. A PLS
calibration model was also developed using second derivative spectra. The choice of
spectral preprocessing, MSC or D2, was based on the programs used to perform
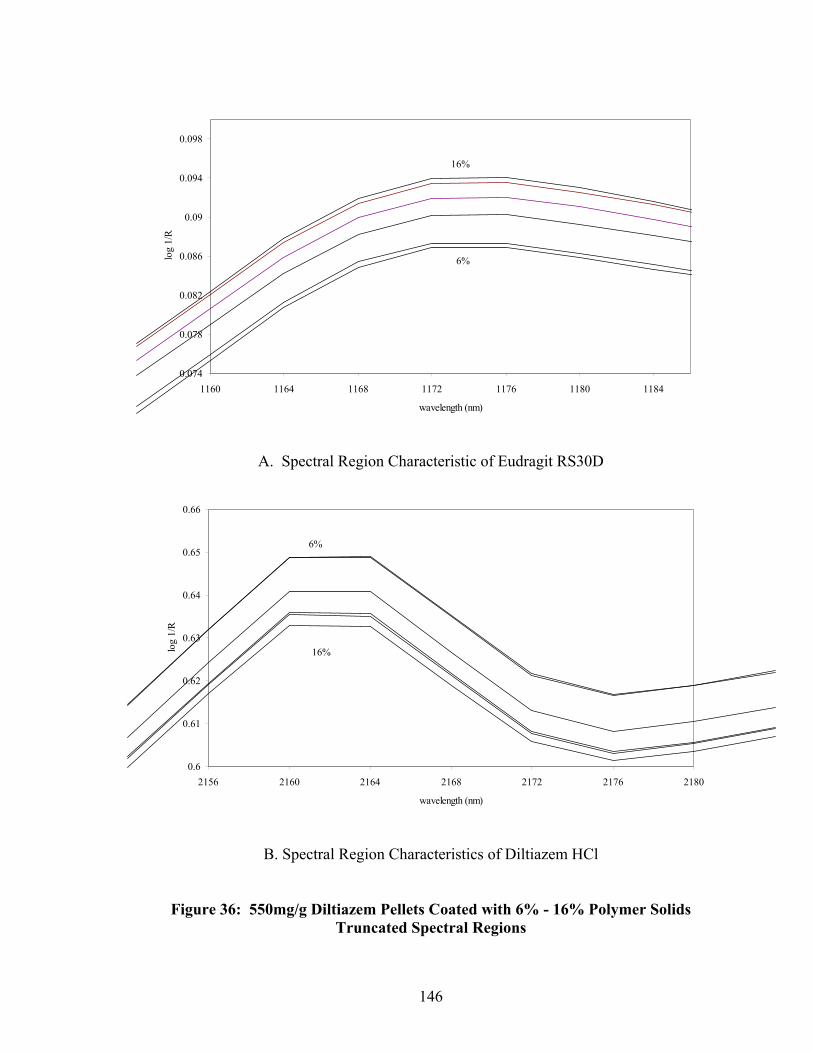
146
A. Spectral Region Characteristic of Eudragit RS30D
B. Spectral Region Characteristics of Diltiazem HCl
Figure 36: 550mg/g Diltiazem Pellets Coated with 6% - 16% Polymer Solids Truncated Spectral Regions
0.074
0.078
0.082
0.086
0.09
0.094
0.098
1160 1164 1168 1172 1176 1180 1184
wavelength (nm)
log
1/R
16%
6%
0.6
0.61
0.62
0.63
0.64
0.65
0.66
2156 2160 2164 2168 2172 2176 2180
wavelength (nm)
log
1/R
6%
16%

147
chemometric analysis. Single wavelength, multiple wavelength, and PCR analyses were
performed on both MSC and D2 using SPEAKEASY® chemometric routines. PLSR
was, however, performed using NSAS® software which offered only derivative-based
spectral preprocessing. Because spectra were collected during processing, calibration
model development was limited to one spectral scan per batch at each time point.
A total of 4 batches were processed for each pellet strength. Two batches were
processed per day with complete set-up and tear-down of the fluid bed processor
occurring between lots. Calibrations were developed using 24 samples within the 5% to
16% theoretical applied polymer solids range from two of the four batches for each
formulation. Two batches from each formulation were processed to assess the predictive
power of the developed calibrations.
3.2.1.1 Single and Multiple Wavelength Regression
For the single and multiple wavelength models, the most robust calibrations were
developed using wavelengths from spectral regions characteristic of the ERS polymer or
the drug-layered pellet. A single wavelength calibration was developed using absorbance
values at 1616 nm which was highly correlated with ERS. A two-wavelength model was
developed using 1616 nm and 2086 nm, which correlated with ERS and drug-layered
pellets, respectively. For all strengths, both single- and multiple-wavelength models had
R2 values of 0.99, and SEC and SEP values of <0.5% were achieved.
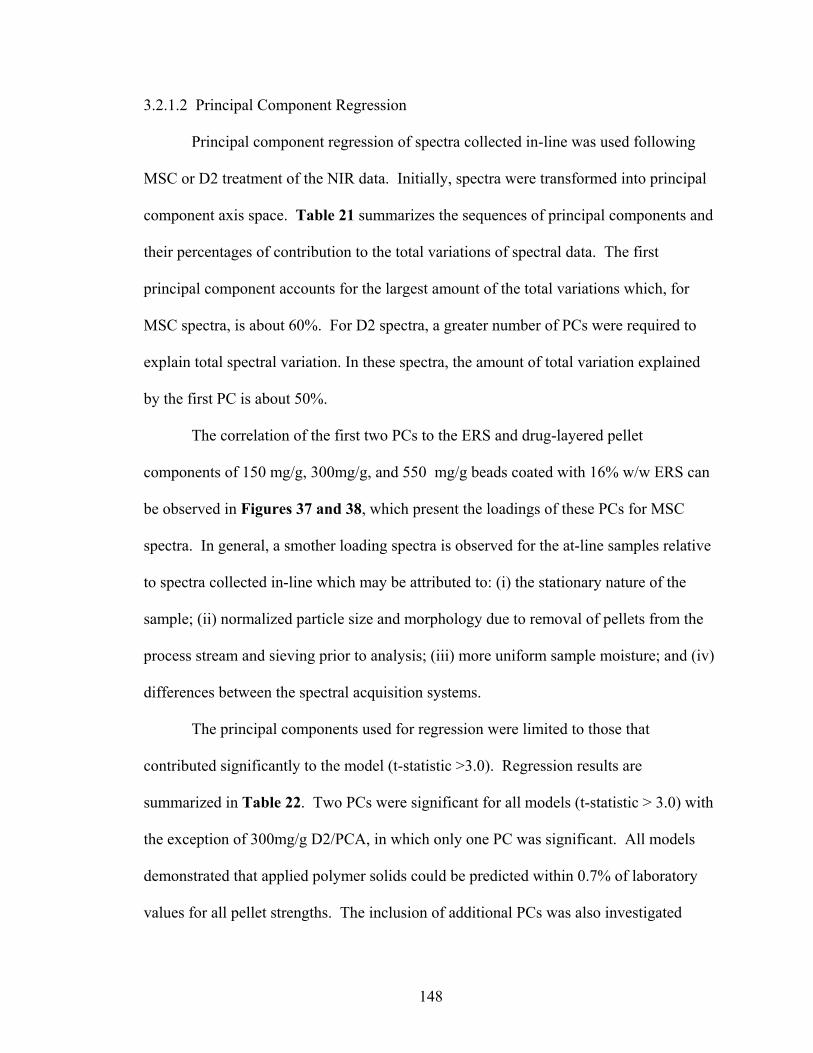
148
3.2.1.2 Principal Component Regression
Principal component regression of spectra collected in-line was used following
MSC or D2 treatment of the NIR data. Initially, spectra were transformed into principal
component axis space. Table 21 summarizes the sequences of principal components and
their percentages of contribution to the total variations of spectral data. The first
principal component accounts for the largest amount of the total variations which, for
MSC spectra, is about 60%. For D2 spectra, a greater number of PCs were required to
explain total spectral variation. In these spectra, the amount of total variation explained
by the first PC is about 50%.
The correlation of the first two PCs to the ERS and drug-layered pellet
components of 150 mg/g, 300mg/g, and 550 mg/g beads coated with 16% w/w ERS can
be observed in Figures 37 and 38, which present the loadings of these PCs for MSC
spectra. In general, a smother loading spectra is observed for the at-line samples relative
to spectra collected in-line which may be attributed to: (i) the stationary nature of the
sample; (ii) normalized particle size and morphology due to removal of pellets from the
process stream and sieving prior to analysis; (iii) more uniform sample moisture; and (iv)
differences between the spectral acquisition systems.
The principal components used for regression were limited to those that
contributed significantly to the model (t-statistic >3.0). Regression results are
summarized in Table 22. Two PCs were significant for all models (t-statistic > 3.0) with
the exception of 300mg/g D2/PCA, in which only one PC was significant. All models
demonstrated that applied polymer solids could be predicted within 0.7% of laboratory
values for all pellet strengths. The inclusion of additional PCs was also investigated
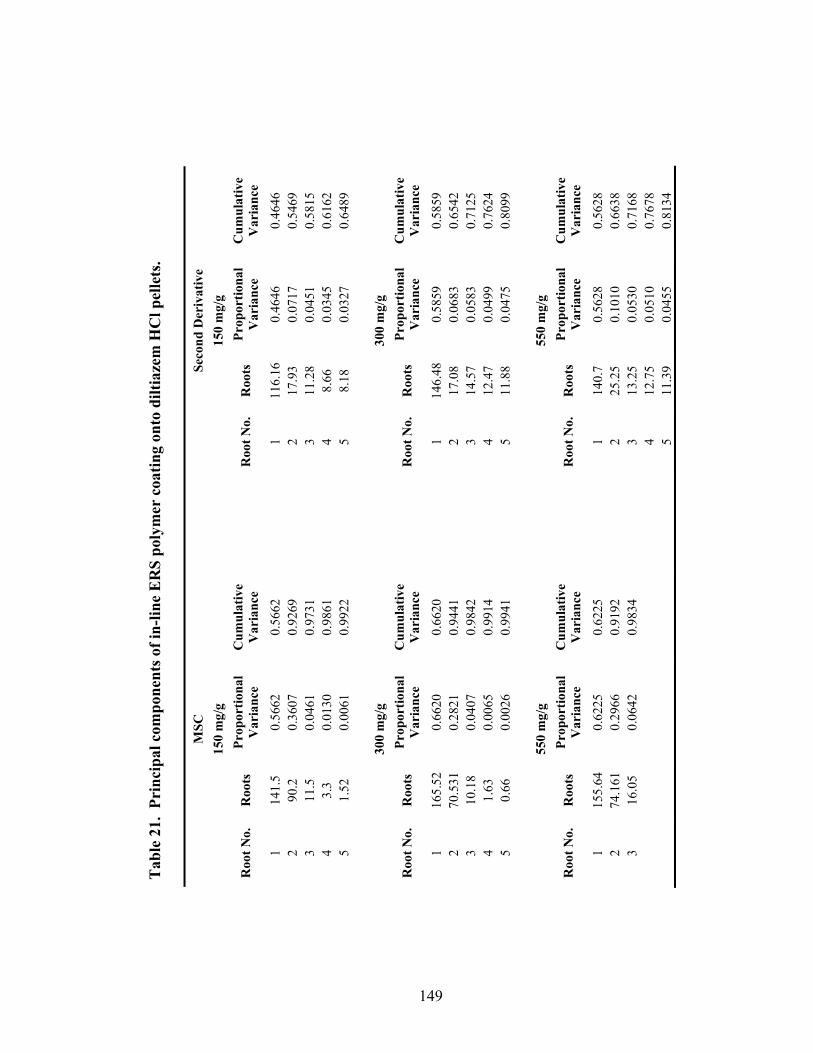
149
Tab
le 2
1. P
rinc
ipal
com
pone
nts o
f in-
line
ER
S po
lym
er c
oatin
g on
to d
iltia
zem
HC
l pel
lets
.
MSC
Seco
nd D
eriv
ativ
e 15
0 m
g/g
15
0 m
g/g
Roo
t No.
R
oots
Pr
opor
tiona
l V
aria
nce
Cum
ulat
ive
Var
ianc
e
Roo
t No.
R
oots
Pr
opor
tiona
l V
aria
nce
Cum
ulat
ive
Var
ianc
e 1
141.
5 0.
5662
0.
5662
1 11
6.16
0.
4646
0.
4646
2
90.2
0.
3607
0.
9269
2 17
.93
0.07
17
0.54
69
3 11
.5
0.04
61
0.97
31
3
11.2
8 0.
0451
0.
5815
4
3.3
0.01
30
0.98
61
4
8.66
0.
0345
0.
6162
5
1.52
0.
0061
0.
9922
5 8.
18
0.03
27
0.64
89
30
0 m
g/g
30
0 m
g/g
Roo
t No.
R
oots
Pr
opor
tiona
l V
aria
nce
Cum
ulat
ive
Var
ianc
e
Roo
t No.
R
oots
Pr
opor
tiona
l V
aria
nce
Cum
ulat
ive
Var
ianc
e 1
165.
52
0.66
20
0.66
20
1
146.
48
0.58
59
0.58
59
2 70
.531
0.
2821
0.
9441
2 17
.08
0.06
83
0.65
42
3 10
.18
0.04
07
0.98
42
3
14.5
7 0.
0583
0.
7125
4
1.63
0.
0065
0.
9914
4 12
.47
0.04
99
0.76
24
5 0.
66
0.00
26
0.99
41
5
11.8
8 0.
0475
0.
8099
550
mg/
g
550
mg/
g
Roo
t No.
R
oots
Pr
opor
tiona
l V
aria
nce
Cum
ulat
ive
Var
ianc
e
Roo
t No.
R
oots
Pr
opor
tiona
l V
aria
nce
Cum
ulat
ive
Var
ianc
e 1
155.
64
0.62
25
0.62
25
1
140.
7 0.
5628
0.
5628
2
74.1
61
0.29
66
0.91
92
2
25.2
5 0.
1010
0.
6638
3
16.0
5 0.
0642
0.
9834
3 13
.25
0.05
30
0.71
68
4
12.7
5 0.
0510
0.
7678
5 11
.39
0.04
55
0.81
34
150
-0.1
-0.08
-0.06
-0.04
-0.02
0
0.02
0.04
0.06
0.08
0.1
1100 1200 1300 1400 1500 1600 1700 1800 1900 2000 2100
wavelength (nm)
wei
ghts
0
0.2
0.4
0.6
0.8
1
1.2
log
1/R
PC-1 ERS 15% Core
-0.1
-0.08
-0.06
-0.04
-0.02
0
0.02
0.04
0.06
0.08
0.1
1100 1200 1300 1400 1500 1600 1700 1800 1900 2000 2100
wavelength (nm)
wei
ghts
0
0.2
0.4
0.6
0.8
1
1.2
log
1/R
PC-1 ERS 30% Core
-0.1
-0.08
-0.06
-0.04
-0.02
0
0.02
0.04
0.06
0.08
0.1
1100 1200 1300 1400 1500 1600 1700 1800 1900 2000 2100
wavelength (nm)
wei
ghts
0
0.1
0.2
0.3
0.4
0.5
0.6
0.7
0.8
0.9
1
log
1/R
PC-1 ERS 55% Core
Figure 37. First PC Loadings for 16% ERS Coated Pellets – in-line sampling 150mg/g (top), 300mg/g (middle), 550mg/g (bottom)
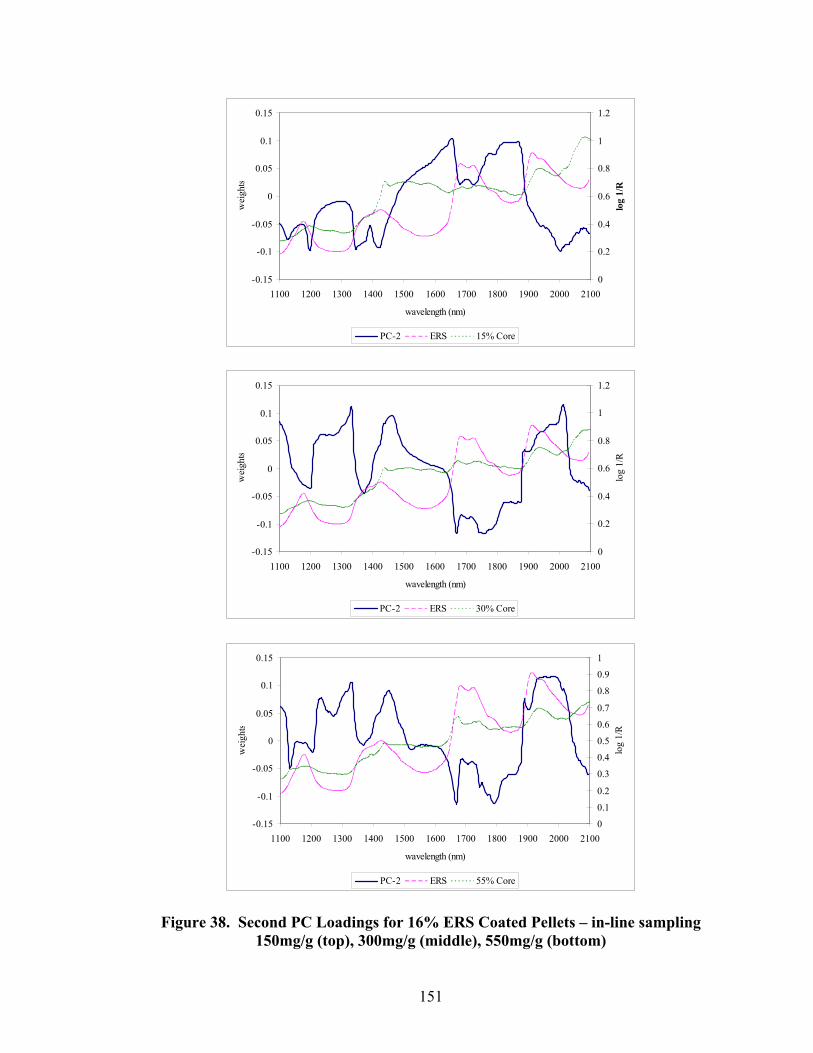
151
-0.15
-0.1
-0.05
0
0.05
0.1
0.15
1100 1200 1300 1400 1500 1600 1700 1800 1900 2000 2100
wavelength (nm)
wei
ghts
0
0.2
0.4
0.6
0.8
1
1.2
log
1/R
PC-2 ERS 15% Core
-0.15
-0.1
-0.05
0
0.05
0.1
0.15
1100 1200 1300 1400 1500 1600 1700 1800 1900 2000 2100
wavelength (nm)
wei
ghts
0
0.2
0.4
0.6
0.8
1
1.2
log
1/R
PC-2 ERS 30% Core
-0.15
-0.1
-0.05
0
0.05
0.1
0.15
1100 1200 1300 1400 1500 1600 1700 1800 1900 2000 2100
wavelength (nm)
wei
ghts
0
0.1
0.2
0.3
0.4
0.5
0.6
0.7
0.8
0.9
1
log
1/R
PC-2 ERS 55% Core
Figure 38. Second PC Loadings for 16% ERS Coated Pellets – in-line sampling 150mg/g (top), 300mg/g (middle), 550mg/g (bottom)
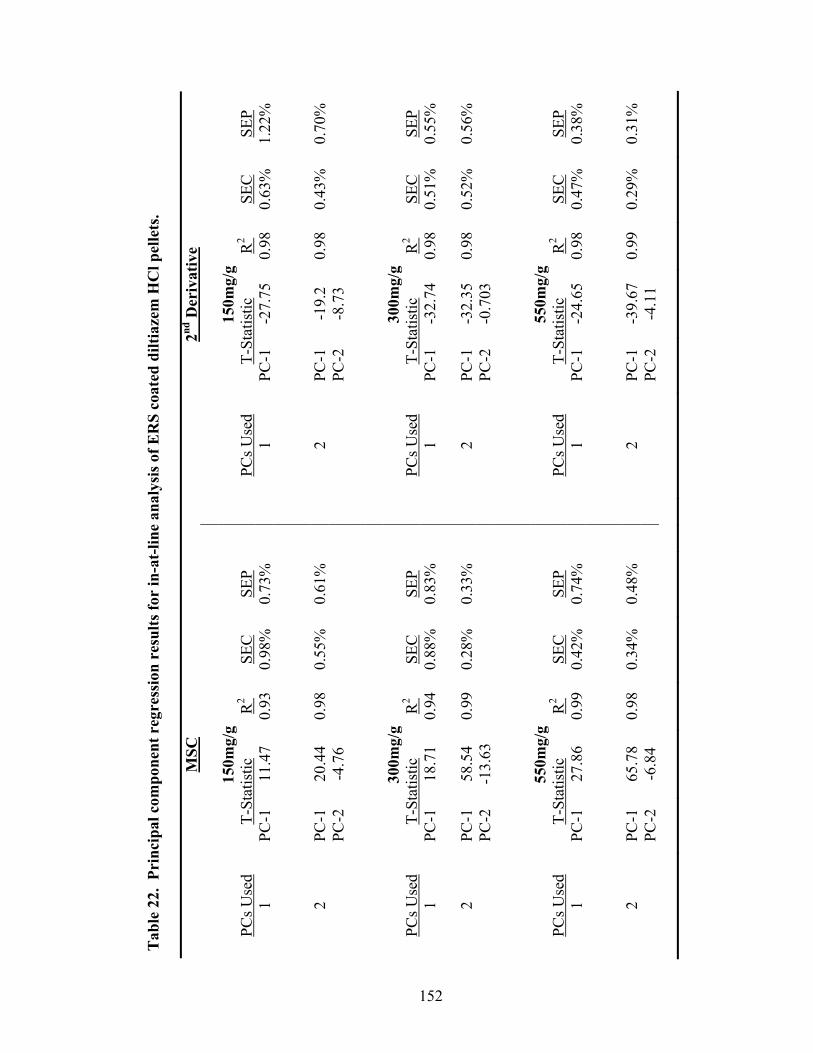
152
Tab
le 2
2. P
rinc
ipal
com
pone
nt r
egre
ssio
n re
sults
for
in-a
t-lin
e an
alys
is o
f ER
S co
ated
dilt
iaze
m H
Cl p
elle
ts.
M
SC
2nd D
eriv
ativ
e
15
0mg/
g
15
0mg/
g PC
s Use
d T-
Stat
istic
R
2 SE
C
SEP
PCs U
sed
T-St
atis
tic
R2
SEC
SE
P 1
PC-1
11
.47
0.93
0.
98%
0.
73%
1
PC-1
-2
7.75
0.
98
0.63
%
1.22
%
2 PC
-1
20.4
4 0.
98
0.55
%
0.61
%
2 PC
-1
-19.
2 0.
98
0.43
%
0.70
%
PC
-2
-4.7
6
PC
-2
-8.7
3
300m
g/g
300m
g/g
PCs U
sed
T-St
atis
tic
R2
SEC
SE
P
PC
s Use
d T-
Stat
istic
R
2 SE
C
SEP
1 PC
-1
18.7
1 0.
94
0.88
%
0.83
%
1 PC
-1
-32.
74
0.98
0.
51%
0.
55%
2
PC-1
58
.54
0.99
0.
28%
0.
33%
2
PC-1
-3
2.35
0.
98
0.52
%
0.56
%
PC
-2
-13.
63
PC-2
-0
.703
550m
g/g
550m
g/g
PCs U
sed
T-St
atis
tic
R2
SEC
SE
P
PC
s Use
d T-
Stat
istic
R
2 SE
C
SEP
1 PC
-1
27.8
6 0.
99
0.42
%
0.74
%
1 PC
-1
-24.
65
0.98
0.
47%
0.
38%
2
PC-1
65
.78
0.98
0.
34%
0.
48%
2
PC-1
-3
9.67
0.
99
0.29
%
0.31
%
PC
-2
-6.8
4
PC
-2
-4.1
1
153
during calibration development. Although such models provided lower SEC values, they
demonstrated higher SEP values, which may indicate overfitting of the data. The
calibrations utilized in this study were based on PCs which provided SEC and SEP values
that were similar and as low as possible, thus maximizing the model robustness.
3.2.1.3 Partial Least Squares Regression
Partial least squares regression results of D2 spectra for all pellet strengths are
summarized in Table 23. Performance of the PLSR was similar or slighlty better than
PCR, with SEPs of less than ~0.5% achieved for all pellet strengths. In some instances,
SEP values were lower than SEC. Since only a limited number of samples were available
for model development, such behavior was not unexpected.
3.2.1.4 Summary of In-Line Regression Model Performance
A summary of the performance of optimized single wavelength, multiple
wavelength, PCR and PLS models for in-line analysis of applied polymer solids during
Wurster coating is presented in Table 24. Similar calibration results were obtained for
150 mg/g, 300mg/g, and 550mg/g drug layered pellets. All calibration models
demonstrated R2 values of 0.98 or greater and standard errors of calibration less than
0.70%. A scatter plot of the calibration and prediction results obtained by D2/PCR
regression of second derivative 150mg/g pellet spectra pellets is presented in Figure 39.
This model demonstrated an R2 value of 0.98, an SEC of 0.63%, and an SEP of 0.35%.
Standard error of the laboratory (SEL) for the reference method, as previously reported,
was approximately 0.47%.
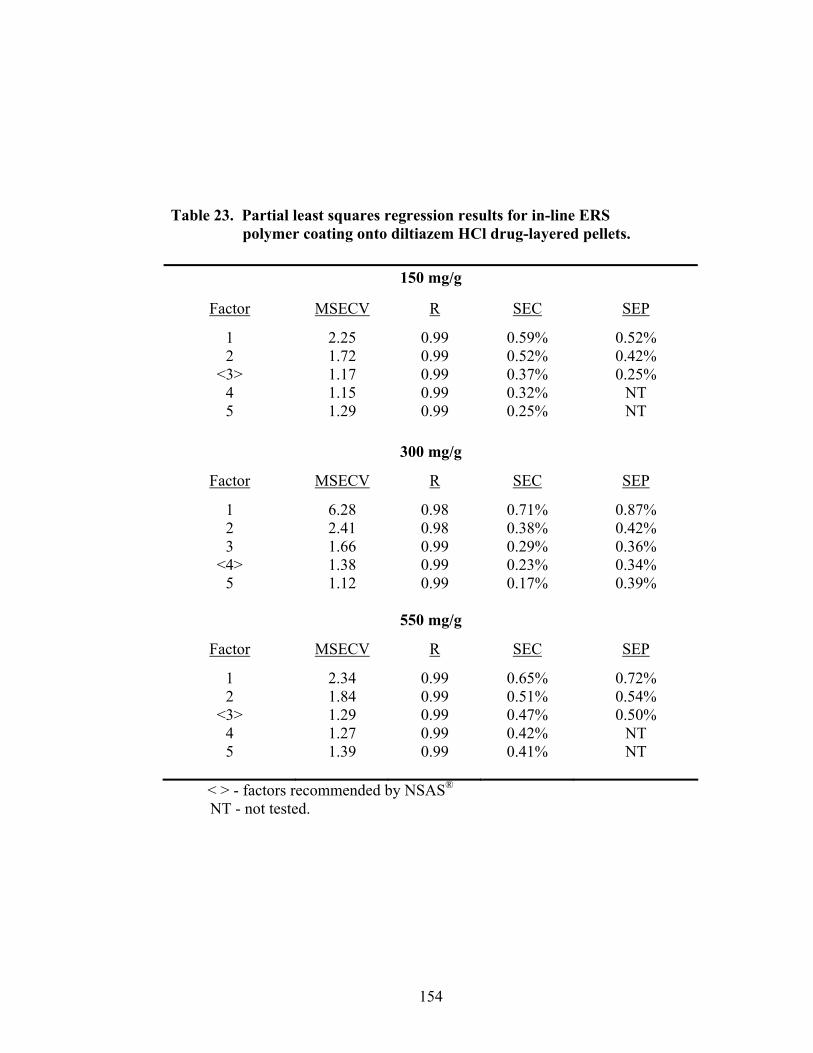
154
Table 23. Partial least squares regression results for in-line ERS polymer coating onto diltiazem HCl drug-layered pellets.
150 mg/g
Factor MSECV R SEC SEP
1 2.25 0.99 0.59% 0.52% 2 1.72 0.99 0.52% 0.42%
<3> 1.17 0.99 0.37% 0.25% 4 1.15 0.99 0.32% NT 5 1.29 0.99 0.25% NT
300 mg/g
Factor MSECV R SEC SEP
1 6.28 0.98 0.71% 0.87% 2 2.41 0.98 0.38% 0.42% 3 1.66 0.99 0.29% 0.36%
<4> 1.38 0.99 0.23% 0.34% 5 1.12 0.99 0.17% 0.39%
550 mg/g
Factor MSECV R SEC SEP
1 2.34 0.99 0.65% 0.72% 2 1.84 0.99 0.51% 0.54%
<3> 1.29 0.99 0.47% 0.50% 4 1.27 0.99 0.42% NT 5 1.39 0.99 0.41% NT
< > - factors recommended by NSAS®
NT - not tested.
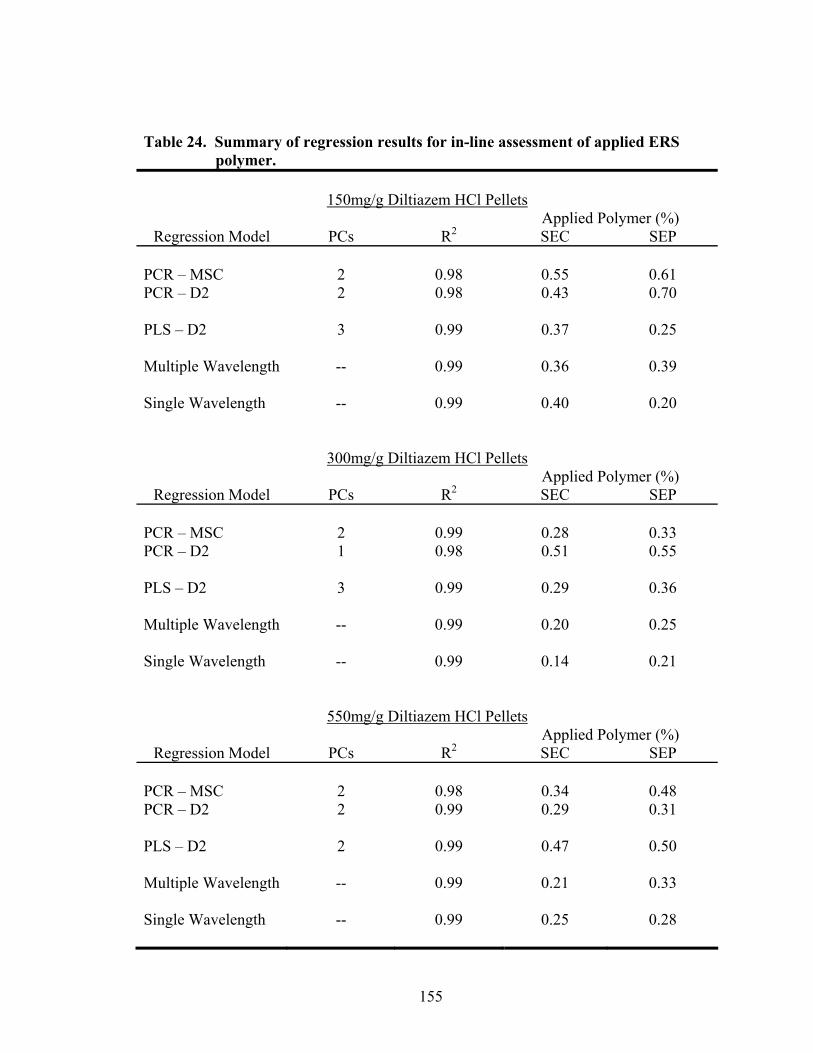
155
Table 24. Summary of regression results for in-line assessment of applied ERS polymer.
150mg/g Diltiazem HCl Pellets
Applied Polymer (%) Regression Model PCs R2 SEC SEP
PCR – MSC 2 0.98 0.55 0.61 PCR – D2 2 0.98 0.43 0.70 PLS – D2 3 0.99 0.37 0.25 Multiple Wavelength -- 0.99 0.36 0.39 Single Wavelength -- 0.99 0.40 0.20
300mg/g Diltiazem HCl Pellets Applied Polymer (%)
Regression Model PCs R2 SEC SEP PCR – MSC 2 0.99 0.28 0.33 PCR – D2 1 0.98 0.51 0.55 PLS – D2 3 0.99 0.29 0.36 Multiple Wavelength -- 0.99 0.20 0.25 Single Wavelength -- 0.99 0.14 0.21
550mg/g Diltiazem HCl Pellets Applied Polymer (%)
Regression Model PCs R2 SEC SEP PCR – MSC 2 0.98 0.34 0.48 PCR – D2 2 0.99 0.29 0.31 PLS – D2 2 0.99 0.47 0.50 Multiple Wavelength -- 0.99 0.21 0.33 Single Wavelength -- 0.99 0.25 0.28
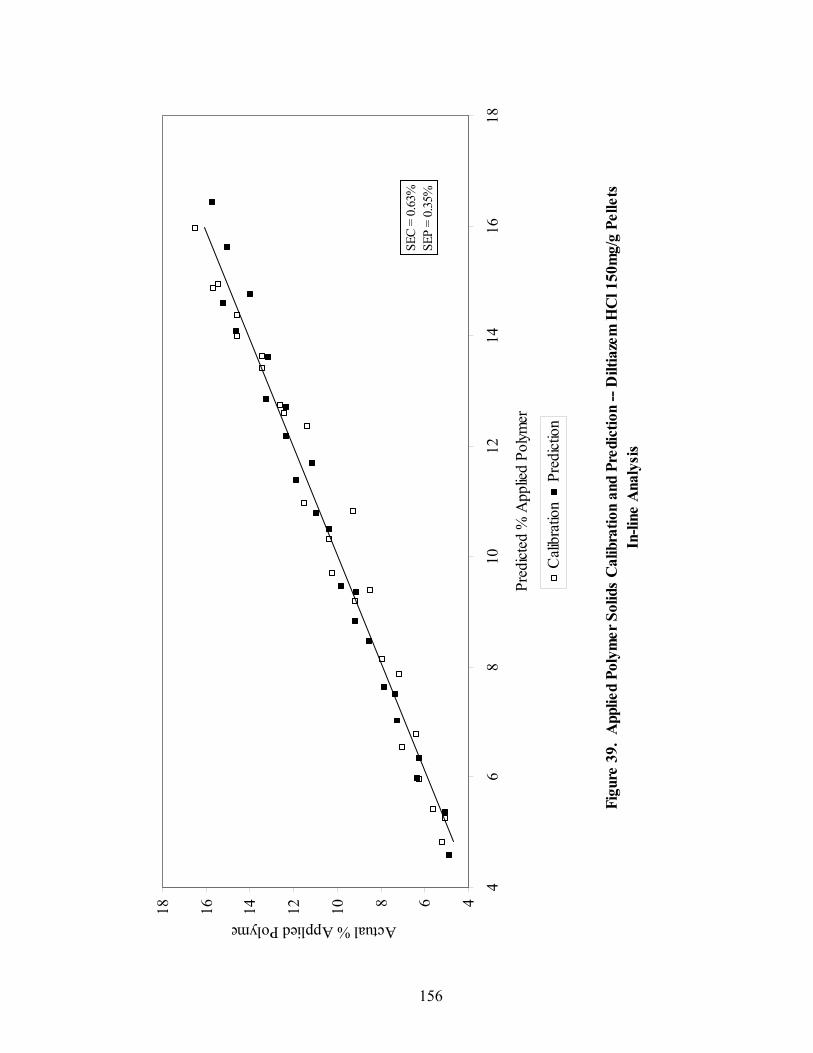
156
Figu
re 3
9. A
pplie
d Po
lym
er S
olid
s C
alib
ratio
n an
d Pr
edic
tion
-- D
iltia
zem
HC
l 150
mg/
g Pe
llets
In-li
ne A
naly
sis
4681012141618
46
810
1214
1618
Pred
icted
% A
pplie
d Po
lymer
Actual % Applied Polyme
Cali
brat
ion
Pred
ictio
n
SEC
= 0.
63%
SEP
= 0.
35%
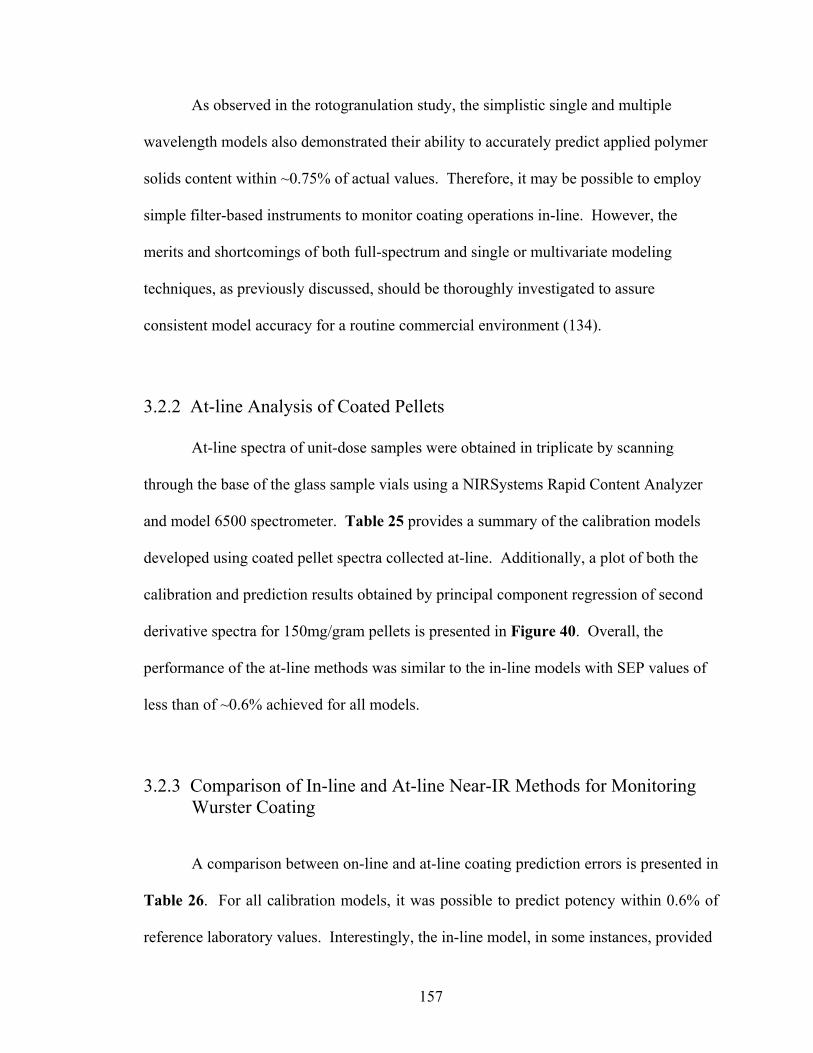
157
As observed in the rotogranulation study, the simplistic single and multiple
wavelength models also demonstrated their ability to accurately predict applied polymer
solids content within ~0.75% of actual values. Therefore, it may be possible to employ
simple filter-based instruments to monitor coating operations in-line. However, the
merits and shortcomings of both full-spectrum and single or multivariate modeling
techniques, as previously discussed, should be thoroughly investigated to assure
consistent model accuracy for a routine commercial environment (134).
3.2.2 At-line Analysis of Coated Pellets
At-line spectra of unit-dose samples were obtained in triplicate by scanning
through the base of the glass sample vials using a NIRSystems Rapid Content Analyzer
and model 6500 spectrometer. Table 25 provides a summary of the calibration models
developed using coated pellet spectra collected at-line. Additionally, a plot of both the
calibration and prediction results obtained by principal component regression of second
derivative spectra for 150mg/gram pellets is presented in Figure 40. Overall, the
performance of the at-line methods was similar to the in-line models with SEP values of
less than of ~0.6% achieved for all models.
3.2.3 Comparison of In-line and At-line Near-IR Methods for Monitoring Wurster Coating
A comparison between on-line and at-line coating prediction errors is presented in
Table 26. For all calibration models, it was possible to predict potency within 0.6% of
reference laboratory values. Interestingly, the in-line model, in some instances, provided
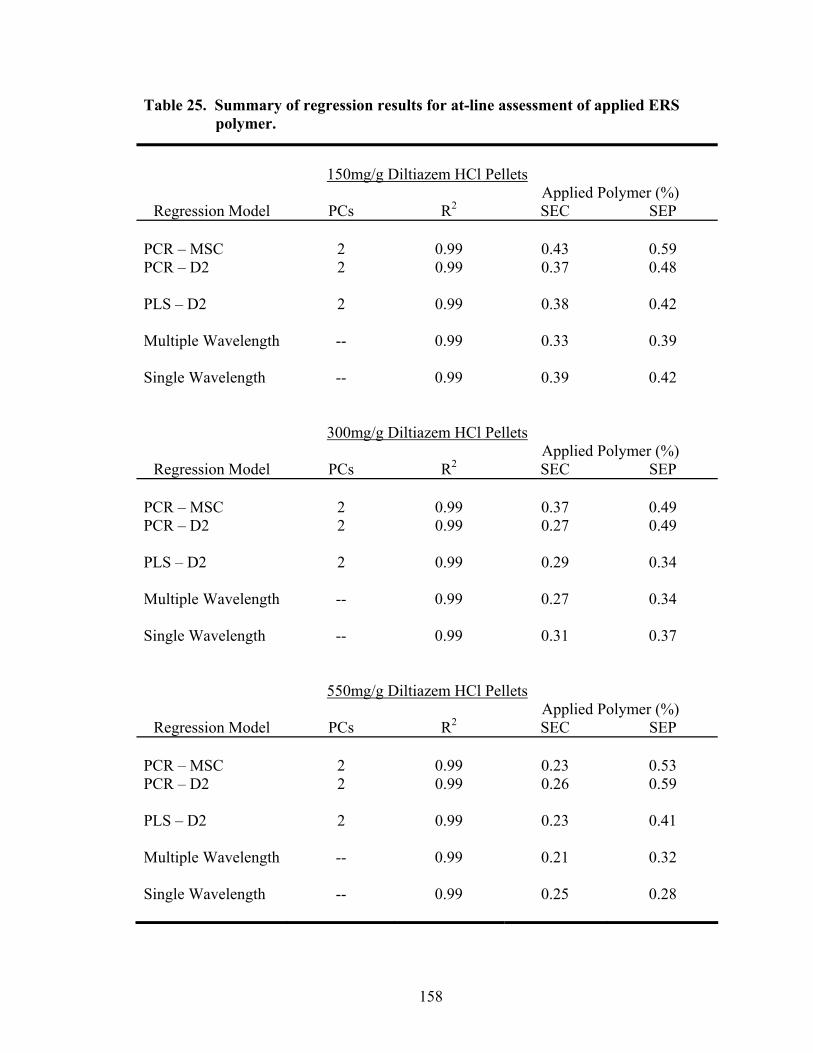
158
Table 25. Summary of regression results for at-line assessment of applied ERS polymer.
150mg/g Diltiazem HCl Pellets
Applied Polymer (%) Regression Model PCs R2 SEC SEP
PCR – MSC 2 0.99 0.43 0.59 PCR – D2 2 0.99 0.37 0.48 PLS – D2 2 0.99 0.38 0.42 Multiple Wavelength -- 0.99 0.33 0.39 Single Wavelength -- 0.99 0.39 0.42
300mg/g Diltiazem HCl Pellets Applied Polymer (%)
Regression Model PCs R2 SEC SEP PCR – MSC 2 0.99 0.37 0.49 PCR – D2 2 0.99 0.27 0.49 PLS – D2 2 0.99 0.29 0.34 Multiple Wavelength -- 0.99 0.27 0.34 Single Wavelength -- 0.99 0.31 0.37
550mg/g Diltiazem HCl Pellets Applied Polymer (%)
Regression Model PCs R2 SEC SEP PCR – MSC 2 0.99 0.23 0.53 PCR – D2 2 0.99 0.26 0.59 PLS – D2 2 0.99 0.23 0.41 Multiple Wavelength -- 0.99 0.21 0.32 Single Wavelength -- 0.99 0.25 0.28
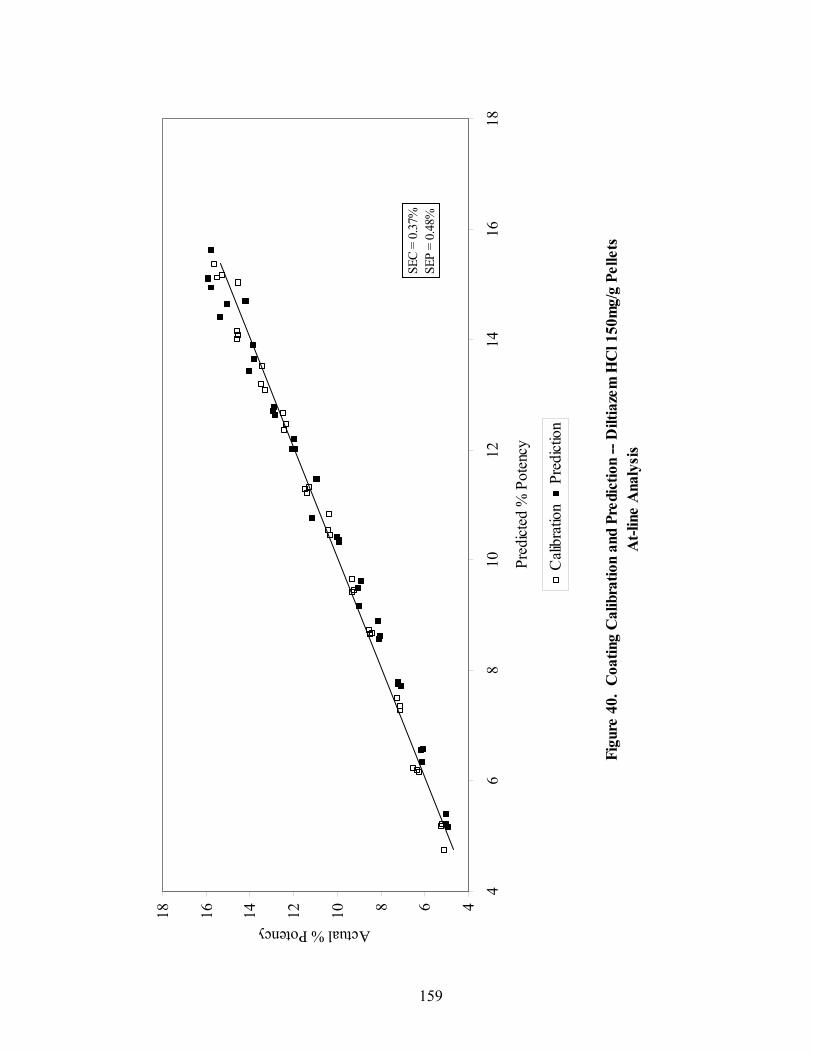
159
Figu
re 4
0. C
oatin
g C
alib
ratio
n an
d Pr
edic
tion
-- D
iltia
zem
HC
l 150
mg/
g Pe
llets
At-l
ine
Ana
lysi
s
4681012141618
46
810
1214
1618
Pred
icted
% P
oten
cy
Actual % Potency
Cali
brat
ion
Pred
ictio
n
SEC
= 0.
37%
SEP
= 0.
48%
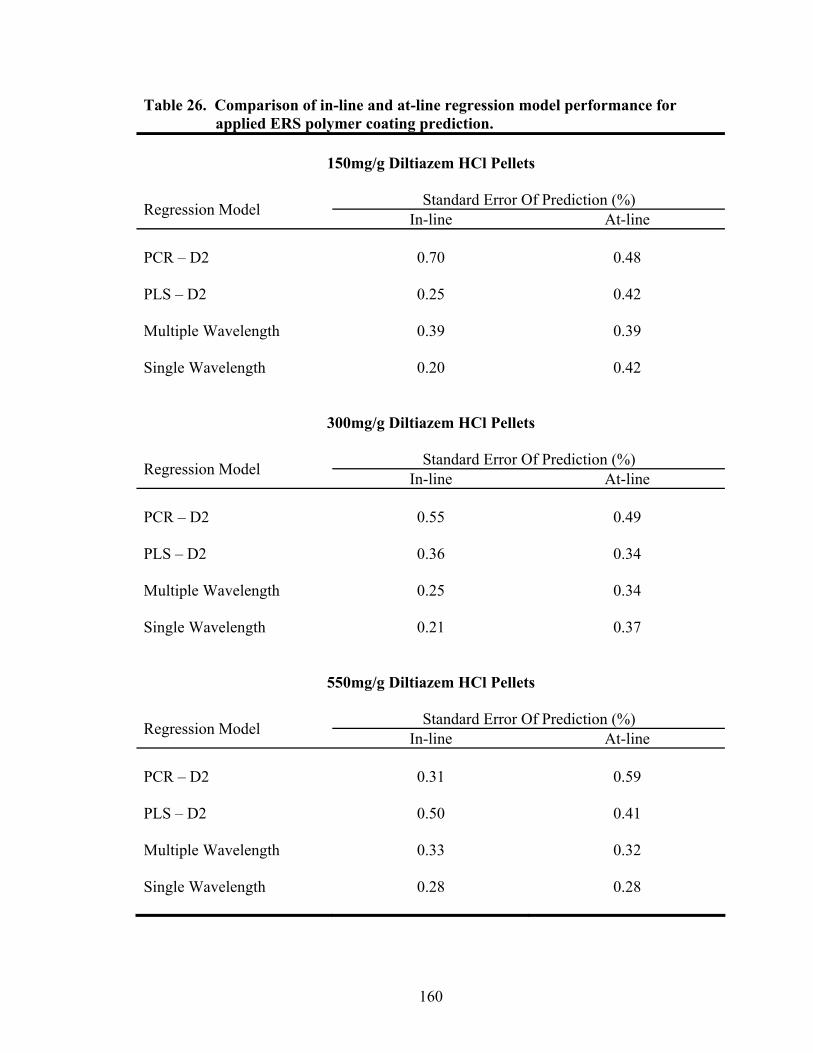
160
Table 26. Comparison of in-line and at-line regression model performance for applied ERS polymer coating prediction.
150mg/g Diltiazem HCl Pellets
Standard Error Of Prediction (%) Regression Model In-line At-line PCR – D2
0.70 0.48
PLS – D2
0.25 0.42
Multiple Wavelength
0.39 0.39
Single Wavelength
0.20 0.42
300mg/g Diltiazem HCl Pellets
Standard Error Of Prediction (%) Regression Model In-line At-line
PCR – D2
0.55 0.49
PLS – D2
0.36 0.34
Multiple Wavelength
0.25 0.34
Single Wavelength
0.21 0.37
550mg/g Diltiazem HCl Pellets
Standard Error Of Prediction (%) Regression Model In-line At-line
PCR – D2
0.31 0.59
PLS – D2
0.50 0.41
Multiple Wavelength
0.33 0.32
Single Wavelength
0.28 0.28

161
better prediction results than did the at-line method. This may be attributed to the fact
that in-line spectra were obtained by scanning through a
stationary sapphire window which is transparent in the near-IR region. During at-line
analysis, error may be introduced from variations in sample packing, sample
repositioning, and variability in the base of the glass vial through which spectra are
collected. Such results are reasonable in terms of the ability to control the drug loading
process, and acceptable with respect to the 0.41% SEL of the reference method.
With respect to sample presentation, Yoon et al., (135) in their analysis of sample
presentation effect on the spectra of pharmaceutical excipients, demonstrated that sample
thickness and sample presentation diameter had considerable effects on near-IR spectral
characteristics while spectral changes associated with sample packing was less
pronounced. In the current study, the depth of the pellets in the sample vials and the
depth of the pellets moving past the direct reflectance in the in-line method were similar
(~5 cm). Since the beads analyzed in this study are free-flowing, have a relatively narrow
particle size distribution, and do not considerably consolidate when tapped, variations in
packing differences were also not likely significantly contribute to at-line measurement
error. However, to mitigate risk associated with packing differences and the potential for
sample segregation to occur, each vial was inverted 3 times between scans and replicate
scans were averaged to obtain one composite spectrum for each sample time point.
One aspect of the sampling that potentially contributed to better prediction results
for the in-line method, as compared to at-line analysis was sample presentation diameter.
The sapphire window in direct reflectance probe used for in-line analysis had a diameter
of 10 mm, while the base diameter of the sample vials used for at-line analysis was
162
18 mm. In addition, both the Direct Reflectance Probe and the RCA utilize 420 fibers
(200 µm diameter) to carry near-IR radiation to the sample. Therefore, since the sapphire
window diameter in the direct reflectance probe is smaller than the base of the sample
vials, and the distance the near-IR radiation travels through the fibers in the probe is
significantly greater than for the RCA, lower absorbance values for the in-line samples
would be expected. However, as seen in Figure 41, which depicts spectra of 150mg/g
diltiazem HCl pellets coated with 16% ERS collected using either the RCA or the fiber
optic probe, higher absorbance values were associated with the probe sampling system.
Such absorption differences are likely to translate to a lower signal to noise ratio for the
RCA, which may contribute to the higher and more variable SEC and SEP results
obtained during at-line assessment of pellet potency. In addition, the loadings spectra for
PC-1 and PC-2 of MSC spectra for 150mg/g diltiazem HCl pellets coated with 6% to
16% ERS, presented in Figure 42 and Figure 43, demonstrate good correlation to
spectral features of interest in predicting coating level. Despite minor performance
differences between the in-line and at-line systems, both were quite effective in providing
a non-invasive technique for monitoring the Wurster coating process.
3.2.4 Prediction of Dissolution of Eudragit RS30D Coated Pellets
Prior to final blending or encapsulation, intermediate pellets lots are often tested
to ensure that they meet product specifications such as potency and dissolution. Since the
production of most extended-release pellet products usually involves time consuming and
expensive manufacturing operations, in-house quality control mechanisms are commonly
employed to prevent the combination of sub-standard intermediates with acceptable
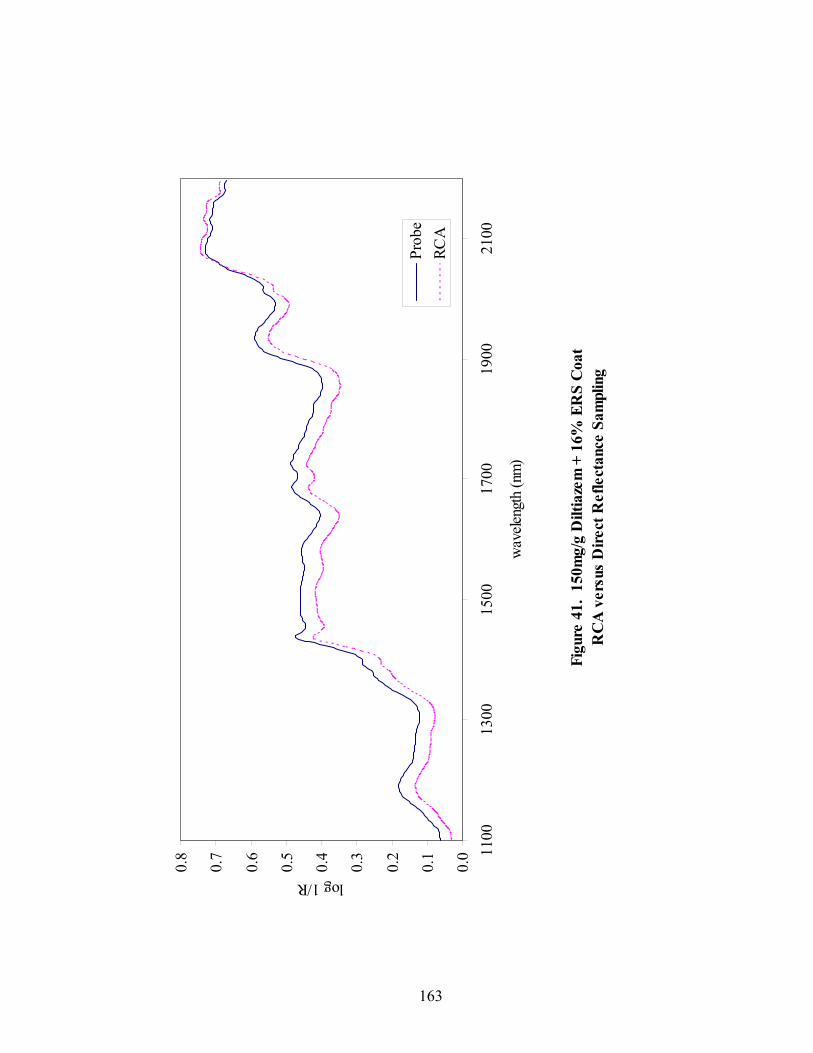
163
Figu
re 4
1. 1
50m
g/g
Dilt
iaze
m +
16%
ER
S C
oat
RC
A v
ersu
s D
irect
Ref
lect
ance
Sam
plin
g
0.0
0.1
0.2
0.3
0.4
0.5
0.6
0.7
0.8 11
0013
0015
0017
0019
0021
00
wav
eleng
th (n
m)
log 1/R
Prob
eRC
A
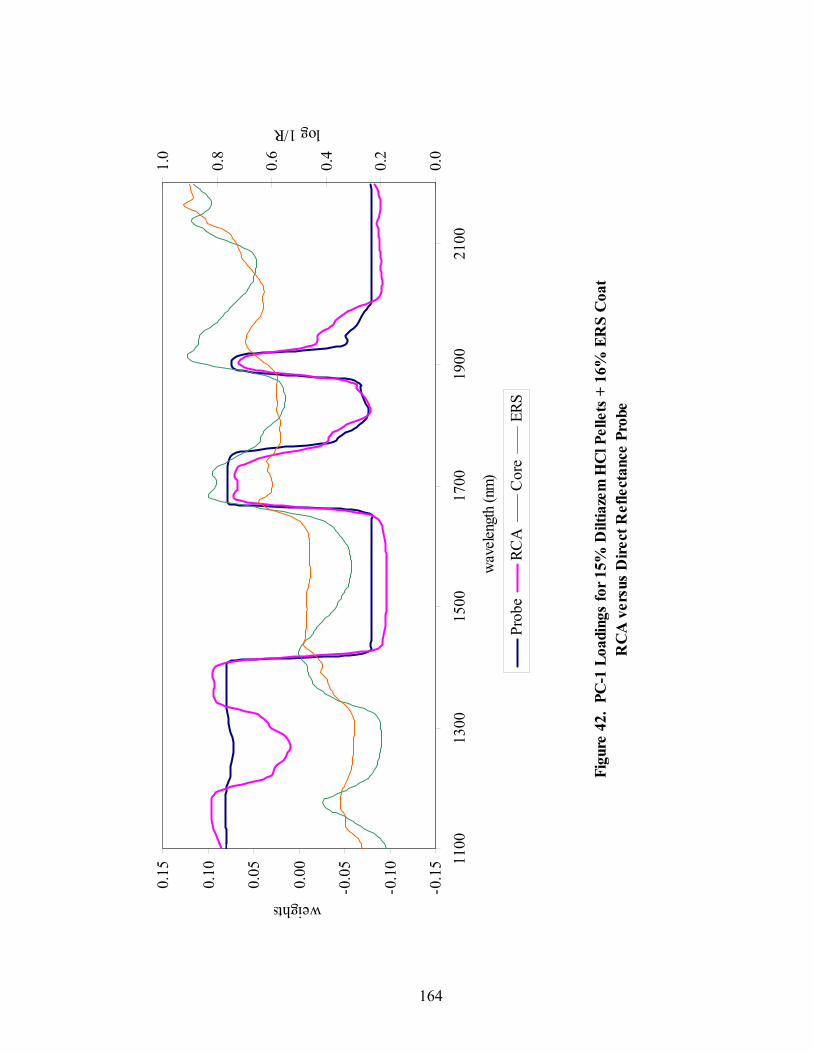
164
Figu
re 4
2. P
C-1
Loa
ding
s fo
r 15%
Dilt
iaze
m H
Cl P
elle
ts +
16%
ER
S C
oat
RC
A v
ersu
s D
irect
Ref
lect
ance
Pro
be
-0.1
5
-0.1
0
-0.0
5
0.00
0.05
0.10
0.15
1100
1300
1500
1700
1900
2100
wav
eleng
th (n
m)
weights
0.0
0.2
0.4
0.6
0.8
1.0
log 1/R
Prob
eRC
AC
ore
ERS
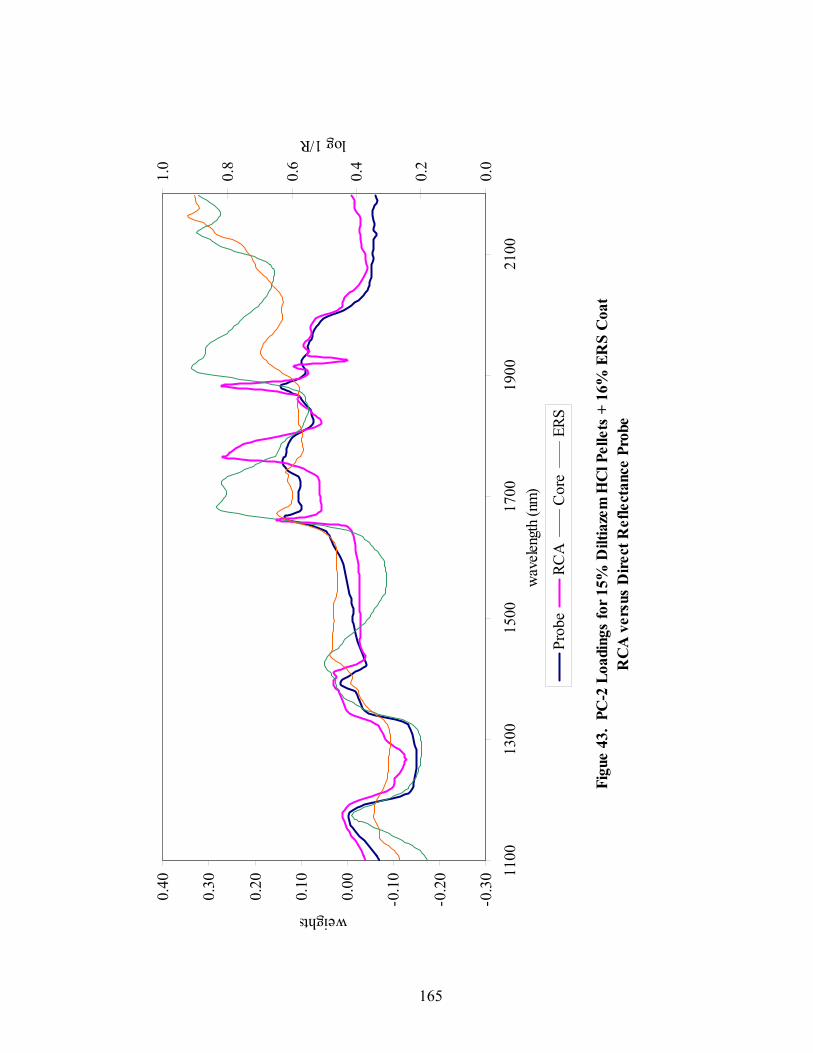
165
Figu
e 43
. PC
-2 L
oadi
ngs
for 1
5% D
iltia
zem
HC
l Pel
lets
+ 1
6% E
RS
Coa
tR
CA
ver
sus
Dire
ct R
efle
ctan
ce P
robe
-0.3
0
-0.2
0
-0.1
0
0.00
0.10
0.20
0.30
0.40
1100
1300
1500
1700
1900
2100
wav
eleng
th (n
m)
weights
0.0
0.2
0.4
0.6
0.8
1.0
log 1/R
Prob
eRC
AC
ore
ERS
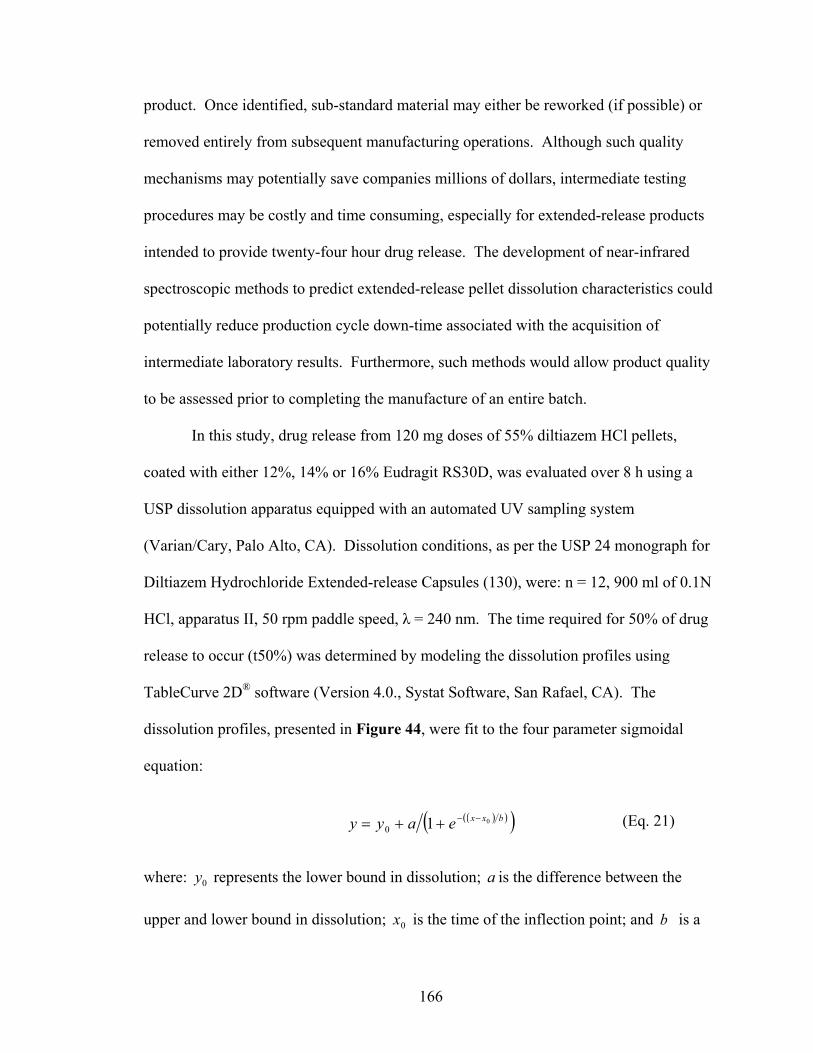
166
( )( )( )bxxeayy 010−−++=
product. Once identified, sub-standard material may either be reworked (if possible) or
removed entirely from subsequent manufacturing operations. Although such quality
mechanisms may potentially save companies millions of dollars, intermediate testing
procedures may be costly and time consuming, especially for extended-release products
intended to provide twenty-four hour drug release. The development of near-infrared
spectroscopic methods to predict extended-release pellet dissolution characteristics could
potentially reduce production cycle down-time associated with the acquisition of
intermediate laboratory results. Furthermore, such methods would allow product quality
to be assessed prior to completing the manufacture of an entire batch.
In this study, drug release from 120 mg doses of 55% diltiazem HCl pellets,
coated with either 12%, 14% or 16% Eudragit RS30D, was evaluated over 8 h using a
USP dissolution apparatus equipped with an automated UV sampling system
(Varian/Cary, Palo Alto, CA). Dissolution conditions, as per the USP 24 monograph for
Diltiazem Hydrochloride Extended-release Capsules (130), were: n = 12, 900 ml of 0.1N
HCl, apparatus II, 50 rpm paddle speed, λ = 240 nm. The time required for 50% of drug
release to occur (t50%) was determined by modeling the dissolution profiles using
TableCurve 2D® software (Version 4.0., Systat Software, San Rafael, CA). The
dissolution profiles, presented in Figure 44, were fit to the four parameter sigmoidal
equation:
(Eq. 21) where: 0y represents the lower bound in dissolution; a is the difference between the
upper and lower bound in dissolution; 0x is the time of the inflection point; and b is a
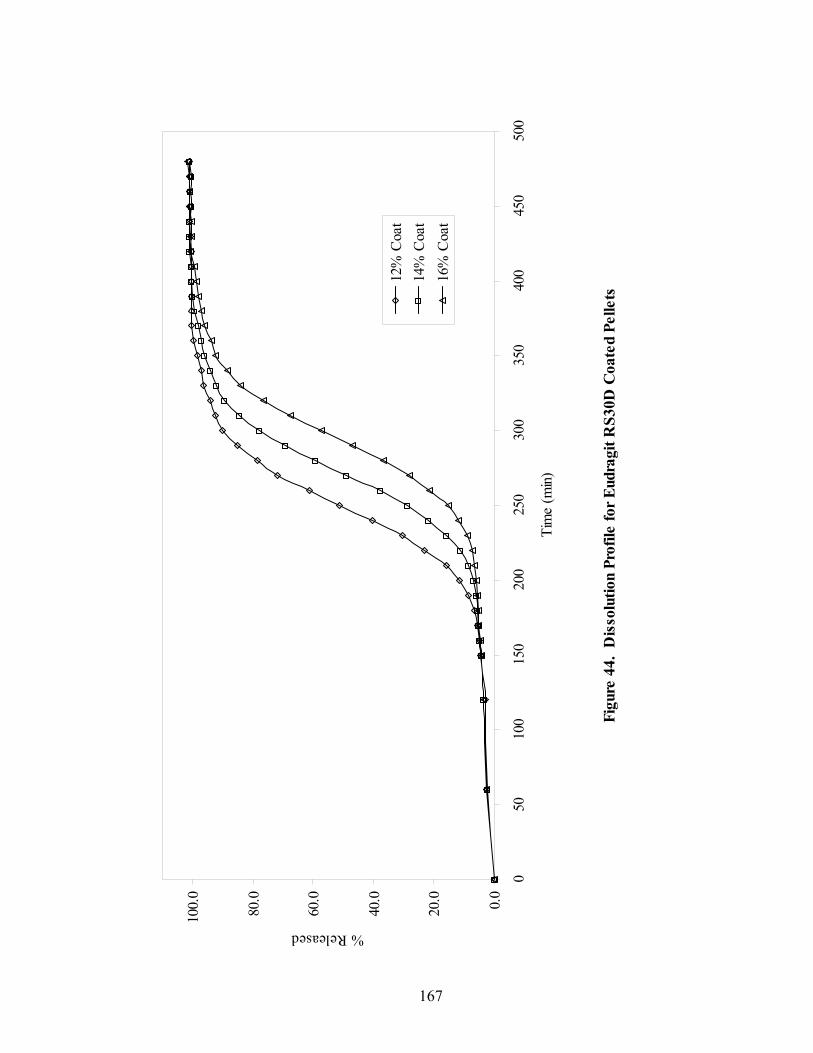
167
Figu
re 4
4. D
isso
lutio
n Pr
ofile
for E
udra
git R
S30D
Coa
ted
Pelle
ts
0.0
20.0
40.0
60.0
80.0
100.
0
050
100
150
200
250
300
350
400
450
500
Tim
e (m
in)
% Released
12%
Coa
t14
% C
oat
16%
Coa
t
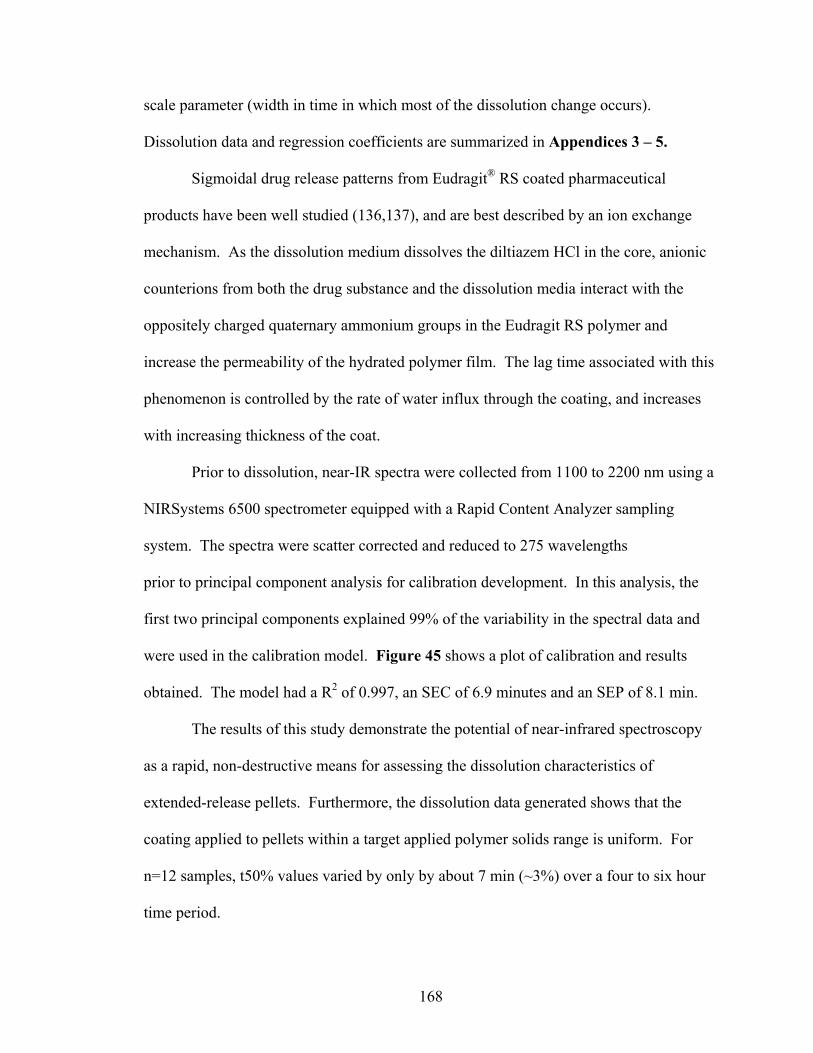
168
scale parameter (width in time in which most of the dissolution change occurs).
Dissolution data and regression coefficients are summarized in Appendices 3 – 5.
Sigmoidal drug release patterns from Eudragit® RS coated pharmaceutical
products have been well studied (136,137), and are best described by an ion exchange
mechanism. As the dissolution medium dissolves the diltiazem HCl in the core, anionic
counterions from both the drug substance and the dissolution media interact with the
oppositely charged quaternary ammonium groups in the Eudragit RS polymer and
increase the permeability of the hydrated polymer film. The lag time associated with this
phenomenon is controlled by the rate of water influx through the coating, and increases
with increasing thickness of the coat.
Prior to dissolution, near-IR spectra were collected from 1100 to 2200 nm using a
NIRSystems 6500 spectrometer equipped with a Rapid Content Analyzer sampling
system. The spectra were scatter corrected and reduced to 275 wavelengths
prior to principal component analysis for calibration development. In this analysis, the
first two principal components explained 99% of the variability in the spectral data and
were used in the calibration model. Figure 45 shows a plot of calibration and results
obtained. The model had a R2 of 0.997, an SEC of 6.9 minutes and an SEP of 8.1 min.
The results of this study demonstrate the potential of near-infrared spectroscopy
as a rapid, non-destructive means for assessing the dissolution characteristics of
extended-release pellets. Furthermore, the dissolution data generated shows that the
coating applied to pellets within a target applied polymer solids range is uniform. For
n=12 samples, t50% values varied by only by about 7 min (~3%) over a four to six hour
time period.
169
Figu
re 4
5. P
redi
ctio
n of
t50%
Dilt
iaze
m H
Cl D
isso
lved
for E
udra
git R
S30D
Coa
ted
Dilt
iaze
m H
Cl 5
50 m
g/g
Pelle
ts
225
250
275
300
325 22
525
027
530
032
5
Pred
icted
t50
(min)
Actual t50% (min)
170
3.3 Qualitative Prediction of Eudragit RS30D Coating Endpoint
In addition to being a powerful tool for quantitative pharmaceutical analysis, near-
IR spectroscopy has gained recognition for its qualitative analysis capabilities.
Qualitative analysis involves classifying samples by comparing their spectral
characteristics to those of a reference group. The most widely accepted methods for
qualitative near-IR analysis utilize pattern recognition techniques. Such methods classify
samples according to their similarity to a training set. Because pattern recognition
techniques can only recognize the variability to which they accustomed, it is necessary to
develop a training set that represents all expected sources of spectral variability. After
training the computer to recognize the spectral qualities of acceptable material, pattern
recognition algorithms can be employed to quickly identify and classify unknown test
samples.
The ability of two pattern recognition methods to qualitatively predict coating
process endpoints was assessed in this phase of study. The techniques under
investigation included a MD calculation and a BEAST (Bootstrap Error-Adjusted Single-
sample Technique). Of these methods, the BEAST has been previously shown to offer
speed, accuracy and precision over the Mahalanobis distance metrics in qualitative
analysis of near-IR data (78,138). Both methods classify samples according to their
similarity to a training set. After training the computer to recognize the spectral qualities
of pellet samples containing a desired level of applied polymer coating, the referenced
pattern recognition algorithms were employed to identify and classify unknown test
171
samples as either acceptable or unacceptable with respect to a target applied coating
level.
In this study, three different training sets, corresponding to 6%, 10% and 15%
applied polymer solids, were developed from samples collected from two Wurster
coating runs. Each target training set was comprised of 12 samples (six samples from
each coating run). For each sample, triplicate spectra were collected by scanning through
the base of the glass sample vials using a NIRSystems Rapid Content Analyzer and
model 6500 spectrometer, then averaged. Following MSC treatment of the near-IR data,
a principal-axis-transformation of the spectral data points was performed. Principal
component analysis reduced 275 independent variables to 2 principal components which
explained 99% of the variance in the data. Training sets development for both the
Mahalanobis and BEAST analyses utilized two principal components and 1000 bootstrap
replications.
During two subsequent coating trials, samples were collected at various time
points over a range of 6% to 16% applied polymer solids. Using the bootstrap algorithm
or Mahalanobis distance metric to assess test sample spectral similarity to the training set,
a distance analogous to a standard deviation was calculated between the test sample and
the center of the training cluster. Samples within 3 SDs from the training cluster were
considered to contain the target coat and were classified as acceptable. Samples with
SDs >3 were classified as outliers and were deemed unacceptable.
A graphic presentation of the classification results for BEAST and MD analyses
of all investigated pellet strengths and target coating levels is presented in Figure 46.

172
150mg/g Pellets
0
1
2
3
4
5
6
7
5 6 7 9 10 11 14 15 16
applied polymer solids (%)
no. s
ampl
es (o
ut o
f 6)
sim
ilar t
o tra
inin
g se
t
BEAST MD Training Sample
300mg/g Pellets
0
1
2
3
4
5
6
7
5 6 7 9 10 11 14 15 16applied polymer solids (%)
no. s
ampl
es (o
ut o
f 6)
sim
ilar t
o tra
inin
g se
t
BEAST MD Training Sample
550mg/g Pellets
0
1
2
3
4
5
6
7
5 6 7 9 10 11 14 15 16applied polymer solids (%)
no. s
ampl
es (o
ut o
f 6)
sim
ilar t
o tra
inin
g se
t
BEAST MD Training Sample
Figure 46. Qualitative Prediction of Target Applied Polymer Solids BEAST versus Mahalanobis Distance

173
In each graph, three training sets, 6%, 10% and 15%, are presented by the hatched bars.
The height of the bars represents the number of test samples (out of six) classified by the
BEAST and MD algorithms as similar (≤3 SDs) to the training set. Corresponding
numerical values are displayed in Appendix 6. For all pellet strengths and coating levels,
both the BEAST and MD metrics correctly classified all samples that deviated more than
1% from the training group as outliers. Therefore, these results are not presented in the
graph. With respect to samples within ~1% of target coating level, the BEAST metric
was more robust than the MD calculation in correctly identifying samples containing a
desired target coating level. Furthermore, the BEAST was more effective at correctly
classifying samples outside of the target coating range as outliers. However, it is
important to note that for both algorithms, all false positive or false negative
classifications had BEAST or MD distances that were borderline with respect to the 3 SD
classification limit for spectral similarity. Possible sources for error include inherent size
variability of individual pellets comprising a single sample, and variability of the
reference method. Differences between the chemometric techniques may also provide
some insight into the more robust performance of the BEAST metric in this application.
In a 1991 publication, Drennen and Lodder (138), provided an excellent
comparison of the BEAST and MD methods. They demonstrated that the BEAST
distance between the center of a training cluster and a sample spectrum is proportional to
the concentration of the sample constituents that generate the vector connecting the center
and sample spectral points. The direction of the vector provides the spectrum that
identifies the constituents of the sample. The BEAST is nonparametric and makes no
assumptions about the distribution of spectral points in hyperspace.
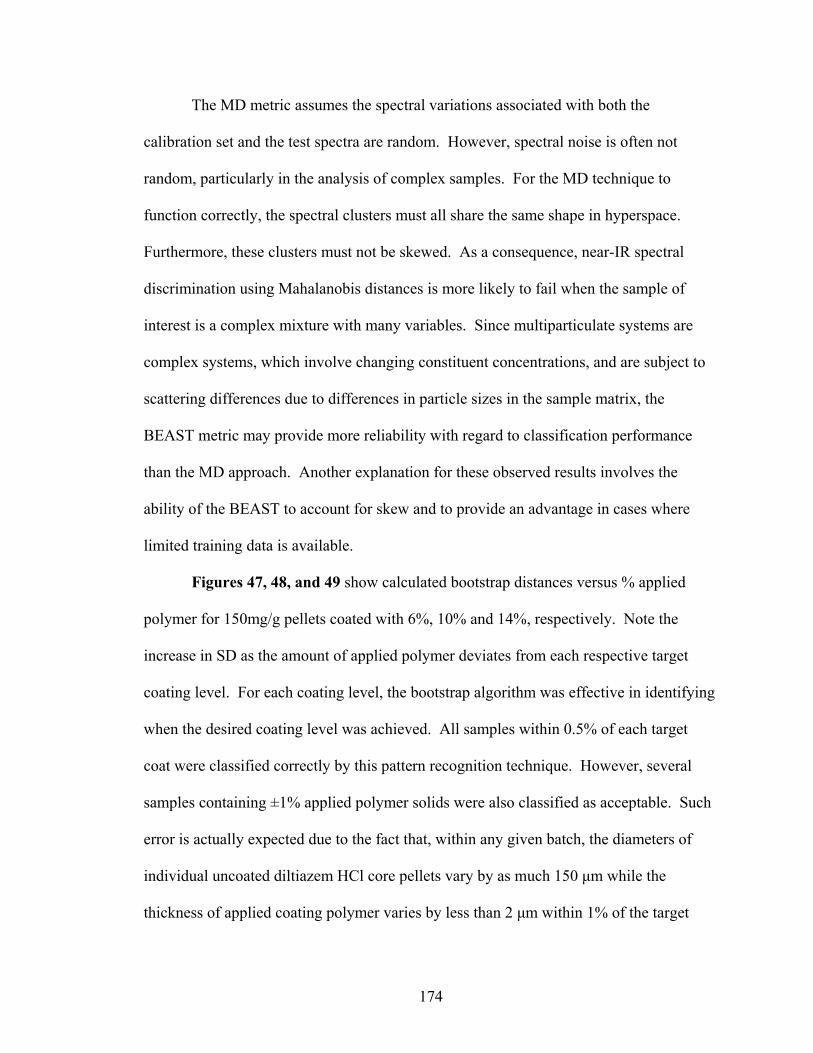
174
The MD metric assumes the spectral variations associated with both the
calibration set and the test spectra are random. However, spectral noise is often not
random, particularly in the analysis of complex samples. For the MD technique to
function correctly, the spectral clusters must all share the same shape in hyperspace.
Furthermore, these clusters must not be skewed. As a consequence, near-IR spectral
discrimination using Mahalanobis distances is more likely to fail when the sample of
interest is a complex mixture with many variables. Since multiparticulate systems are
complex systems, which involve changing constituent concentrations, and are subject to
scattering differences due to differences in particle sizes in the sample matrix, the
BEAST metric may provide more reliability with regard to classification performance
than the MD approach. Another explanation for these observed results involves the
ability of the BEAST to account for skew and to provide an advantage in cases where
limited training data is available.
Figures 47, 48, and 49 show calculated bootstrap distances versus % applied
polymer for 150mg/g pellets coated with 6%, 10% and 14%, respectively. Note the
increase in SD as the amount of applied polymer deviates from each respective target
coating level. For each coating level, the bootstrap algorithm was effective in identifying
when the desired coating level was achieved. All samples within 0.5% of each target
coat were classified correctly by this pattern recognition technique. However, several
samples containing ±1% applied polymer solids were also classified as acceptable. Such
error is actually expected due to the fact that, within any given batch, the diameters of
individual uncoated diltiazem HCl core pellets vary by as much 150 µm while the
thickness of applied coating polymer varies by less than 2 µm within 1% of the target

175
Figu
re 4
7. Q
ualit
ativ
e Pr
edic
tion
of A
pplie
d Po
lym
er S
olid
s us
ing
the
BEA
ST A
lgor
ithm
. Ta
rget
6%
coa
ting
leve
l.
03691215182124273033
46
810
1214
1618
App
lied
Polym
er S
olid
s (%
)
Bootstrap Distance
3 S
D li
mit
for s
pect
ral s
imila
rity
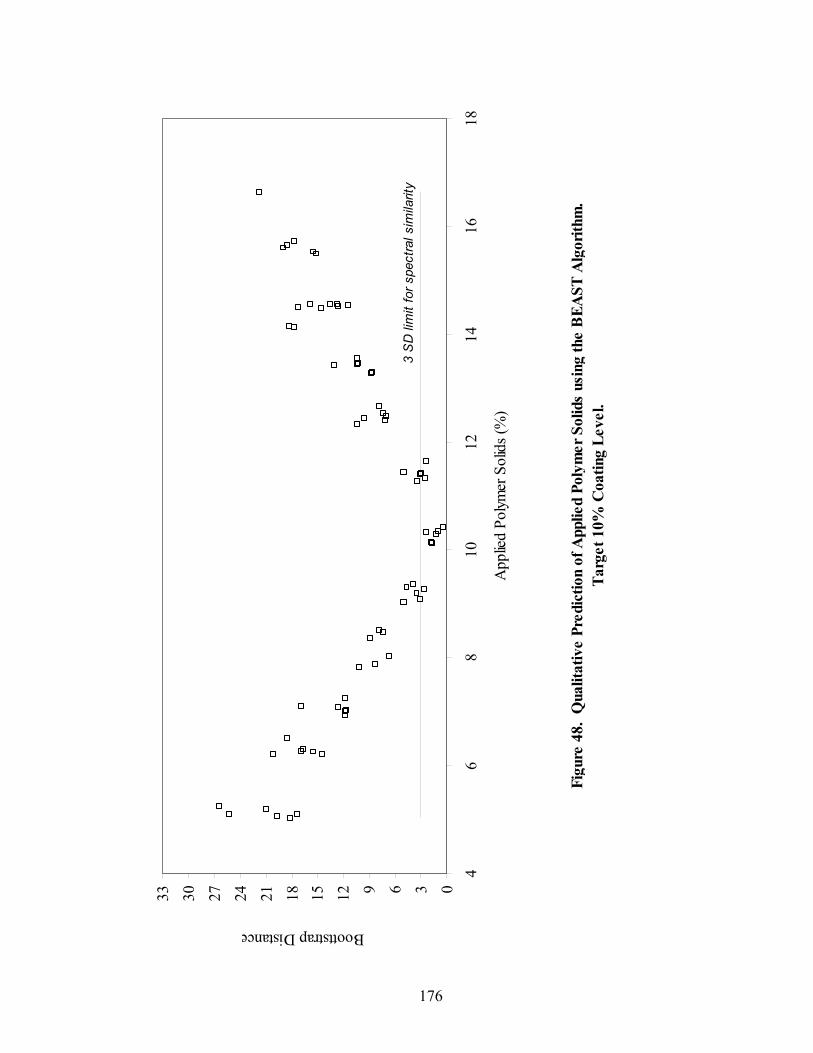
176
Figu
re 4
8. Q
ualit
ativ
e Pr
edic
tion
of A
pplie
d Po
lym
er S
olid
s us
ing
the
BEA
ST A
lgor
ithm
. Ta
rget
10%
Coa
ting
Leve
l.
03691215182124273033
46
810
1214
1618
App
lied
Polym
er S
olid
s (%
)
Boottstrap Distance
3 S
D li
mit
for s
pect
ral s
imila
rity
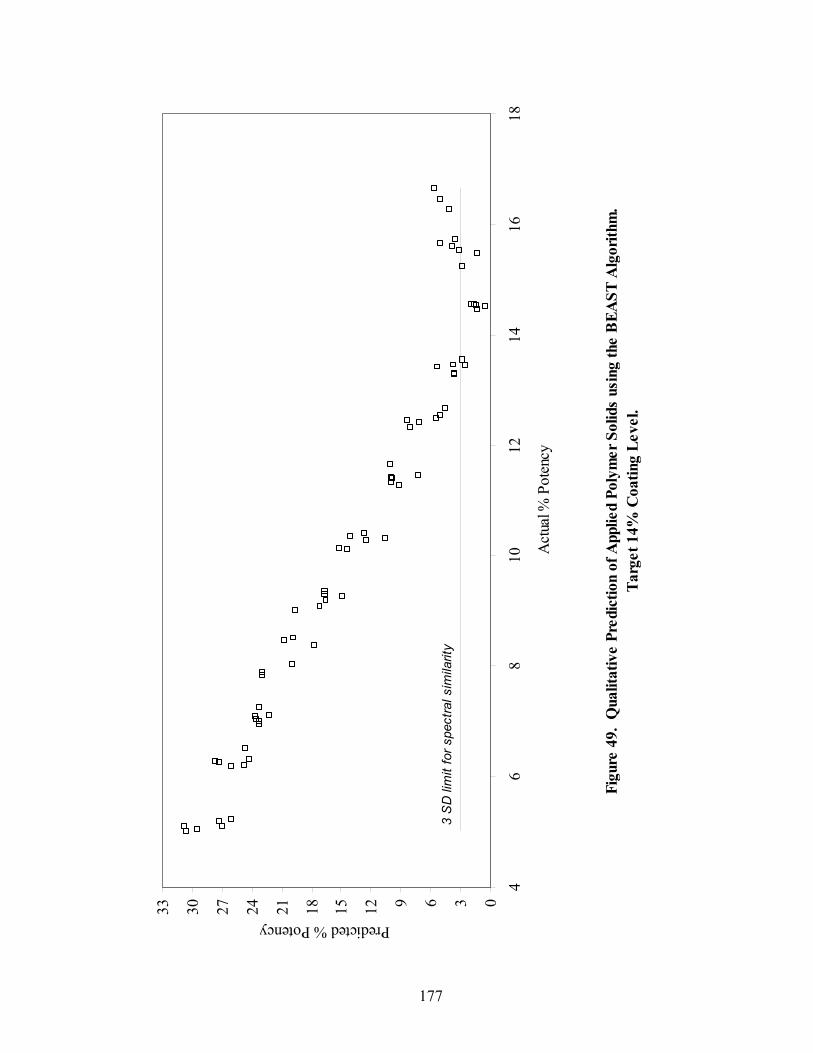
177
Figu
re 4
9. Q
ualit
ativ
e Pr
edic
tion
of A
pplie
d Po
lym
er S
olid
s us
ing
the
BEA
ST A
lgor
ithm
. Ta
rget
14%
Coa
ting
Leve
l.
03691215182124273033
46
810
1214
1618
Act
ual %
Pot
ency
Predicted % Potency
3 S
D li
mit
for s
pect
ral s
imila
rity
178
coat. Therefore, it is not unreasonable to have 1% variability in the actual polymer
content of individual coated pellets or unit-dose samples. Nevertheless, qualitative near-
IR techniques can provide a significant advantage over current methods of coating
process monitoring, and errors of approximately 0.5% to 1% should be within acceptable
limits for properly designed pellet products. In fact, FDA guidelines regarding scale-up
and post-approval changes for modified release products (SUPAC-MR) (139). allows as
much as 10% w/w change in quantity of drug release controlling polymer in a modified-
release drug product, provided the dosage form meets application/compendial product
release requirements and demonstrates dissolution similarity (F2 > 50) (140) with respect
to the original ANDA or NDA exhibit lot formulation.
179
4 CONCLUSIONS
Controlled release pellet production often involves lengthy and expensive
manufacturing operations in which there are no simple methods for accurately monitoring
potency or applied polymer solids during processing. Typically, formulation scientists
and manufacturing personnel rely solely on applied weight gain calculations to predict
drug layering and coating process endpoints. In-process potency analysis is necessary to
determine capsule fill weights needed to deliver a desired dose, and dissolution testing of
the final dosage form is essential to ensure uniformity of the drug release rate. The
availability of a rapid on-line or at-line measurement for prediction of process endpoints
and evaluation of product quality characteristics may potentially save millions of dollars
in time and materials. Therefore, the objective of this research was to develop and
evaluate at-line and in-line near-infrared spectroscopic methods for assessing
pharmaceutical pellet characteristics and to predict desired process endpoints.
The initial phase of this study demonstrated the utility of near-IR spectroscopy in
the quantitative prediction of core pellet potency during rotogranulation operations. PCR
or PLS based regression models were developed for predicting the potency of pellets
containing diltiazem HCl over a range of 15% to 55% active drug content. Both in-line
and at-line determination of pellet potency was effectively accomplished with average
SEPs of 1.11% and 0.63%, respectively. The use of single or multiple wavelength
180
models also allowed acceptable potency prediction with average SEPs of 1.09% and
0.63%, for in-line and at-line analyses.
Although it was possible to develop a single calibration across the studied range
of pellet strengths, non-linearity was noted between the response of the near-IR method
and drug concentration across the broad range of the single calibration model. Such non-
linearity may result in erroneous estimation of pellet potency, and could adversely affect
the ability to validate such a method for routine use. Therefore, this study confirmed that
the development of individual potency calibrations within specific pellet strength
categories is preferred for this type of application.
The effective application of near-IR for predicting the endpoint of clinical or
production scale batches was also demonstrated in this study. Prediction of pellet
potency at pilot scale was accomplished using laboratory data. When process efficiencies
vary, as they do, from lab scale equipment to larger equipment used for manufacturing,
the availability of a rapid on-line or at-line measurement for prediction of process
endpoints may potentially save millions of dollars in time and materials.
Perhaps one of the most important issues confirmed by this study is that
traditional weight gain methods for monitoring rotogranulation operations are neither
optimal nor reliable. True batch potency, as measured by HPLC and weight gain
methods, differed by as much as 7% when systematic process problems were encountered
during processing. Furthermore, even when no process issues were observed, actual
pellet potency varied by an average of 3% from actual values. Such findings provide
strong support for the development and routine use of in-line method for monitoring
rotogranulation operations.
181
The second major phase of this study demonstrated the ability to monitor Wurster
pellet coating operations and quantitatively predict applied coating level and dissolution
characteristics. Calibrations for applied Eudragit RS30D polymer solids were developed
for in-line or at-line analysis of a variety of pellet strengths using PCR, PLS, multiple
wavelength and single wavelength models. All regression models demonstrated R2
values of 0.98 or greater and standard errors of calibration less than 0.6%. As seen in the
rotogranulation study, the simplistic single and multiple wavelength models also
demonstrated their ability to accurately predict applied polymer solids content within
0.5% of laboratory values. Interestingly, the in-line model, in some instances, provided
better prediction results than did the at-line method. This was attributed to the fact that
in-line spectra were obtained by scanning through a stationary sapphire window sampling
system which was developed for in-line monitoring of the Wurster coating operation.
Analysis of the dissolution characteristics of sustained release pellets was also
explored in this study. Diltiazem HCl pellets containing 55% drug were coated with 12%
to 16% Eudragit RS30D and subjected to dissolution testing in a USP II dissolution
apparatus. The time to reach t50% was used as the reference value for near-IR
calibration development. SEC and SEP values of approximately 7 minutes were obtained
over a range of t50% values occurring between 4 h and 6 h. Implementation of such a
method could dramatically reduce production cycle downtime by allowing production to
proceed on the basis of acceptable near-IR results. Such applications would be
particularly beneficial in the production of sustained-release products or products which
have associated with them lengthy analytical testing procedures. However, the accuracy
of the near-IR method cannot be better than the reference method from which it is built.
182
Therefore, representative samples, those which include all type of expected variation,
must be included in the model to ensure method robustness.
In the final phase of this study, qualitative analysis of applied Eudragit RS30D
polymer level was accomplished using either a Mahalanobis Distance (MD) calculation
or a Bootstrap Error-Adjusted Single-sample Technique (BEAST). For all pellet strengths
and coating levels studied, both the BEAST and MD metrics correctly classified all
samples that deviated more than 1% from target as outliers. With respect to samples
within ±1% of target coating level, the BEAST metric was more robust than the MD
calculation in correctly identifying samples containing a desired target coating level. In
agreement with findings of previous studies, the BEAST was more efficient than the MD
metric in correctly classifying samples within or outside of the outside of the target
coating range.
Using the BEAST metric for qualitative analysis of applied polymer coating, all
samples within 0.5% of each target coat were classified correctly. However, several
samples containing ±1% applied polymer solids were also classified as acceptable. Such
error is actually expected due to inherent variability of the pellets being analyzed.
Overall, both the BEAST and the MD algorithms were effective in qualitatively
predicting pellet potency within about 1% of reference method values. Such results
should be considered as acceptable for assessment of functional coating level of properly
designed pellet systems.
This study has demonstrated the potential of near-infrared spectroscopy in
quantitative and qualitative assessment of pelletized pharmaceutical product
characteristics and in the identification of process endpoints at various stages of

183
manufacture. New at-line and in-line applications of near-IR analysis for monitoring and
controlling pharmaceutical pellet production operations and assessing core and coated
pellet characteristics were developed, and their practical limits investigated. Accurate
near-IR assessment of core pellet potency and applied polymer solids during respective
drug layering and coating operations, as well as qualitative identification of coating
process endpoints was demonstrated utilizing both formulations and manufacturing
processes that paralleled typical commercial pharmaceutical pellet production operations.
Validation and implementation of the near-IR analysis techniques discussed in this
manuscript could potentially reduce production cycle-times associated with the
acquisition of laboratory test results while ensuring product quality compliance
throughout various stages of the sustained-release pellet manufacturing process.
184
REFERENCES
1. I. Ghebre-Selassie. Pellets: A general overview. In I. Ghebre-Selassie (ed.),
Pharmaceutical Pelletization Technology, Marcel Dekker, New York, 1989, pp. 1-13.
2. R. E. O'Connor and J. B. Schwartz. Drug release mechanism from a
microcrystalline cellulose pellet system. Pharm. Res. 10(3): 356 – 361 (1993). 3. M. Rabiskova and M. Chalabala. Slow release pellets containing beta-blocker.
Eur. J. Pharm. Sci. 4(101): 157 - 157 (1996). 4. R. Bodmier. Tableting of coated pellets. Eur. J. Pharm. Biopharm. 43(1): 1 – 8
(1997). 5. B. Johansson, M. Wikberg, G. Alderborn, Compression behaviour and
compactibility of microcrystalline cellulose in pellets in relationship to their pore structure and mechanical properties. Int. J. Pharm. 117(1): 57 – 73 (1995).
6. T. E. Beckert, K. Lehmann, and P.C. Schmidt, Compression of enteric-coated
pellets to disintegrating tablets. Int J. Pharm. 143(1): 13 – 23 (1996) 7. K. Krogars, J. Heinamaki, J. Vesalahti, M. Marvola, O. Antikainen, and J.
Yliruusi. Extrusion-spheronization of pH-sensitive polymeric matrix pellets for possible colonic drug delivery. Int. J. Pharm. 199(2): 187 – 194 (2000).
8. W. Fischer, A. Boertz, S.S. Davis, R. Khosla, W. Cawello, K. Sandrock, and G.
Cordes. Investigation of the gastrointestinal transit and in vivo drug release of isosorbide-5-nitrate pellets, Pharm. Res. 4(6): 480 – 485 (1987).
9. R. Cargill, L. J. Caldwel, K. Engle, J. A. Fix, P. A. Porter, and C.R. Gardner.
Controlled gastric emptying. 1. Effects of physical properties on gastric residence times of nondisintegrating geometric shapes in beagle dogs. Pharm. Res. 5(8): 533–536 (1988).
10. M. J. Gamlen. Pellet manufacture for controlled release. Manuf. Chem. 6(6):55-
59 (1985). 11. H. Ichikawa, Y. Fukumori, and C. M. Adeyeye. Design of prolonged-release
microcapsules containing diclofenac sodium for oral suspensions and their preparation by the Wurster process. Int. J. Pharm. 156(1): 39 – 48 (1997).
12. F. Goodhart. Centrifugal Equipment. In I. Ghebre-Selassie (ed.), Pharmaceutical
Pelletization Technology, Marcel Dekker, New York, 1989, pp. 101-122.
185
13. D. M. Jones. Solution and suspension layering. In I. Ghebre-Selassie (ed.),
Pharmaceutical Pelletization Technology, Marcel Dekker, New York, 1989, pp. 145-164.
14. C. Vecchio, F. Fabiani, M. E. Sangalli, L. Zema, A. Gazzaniga. Rotary tangential
spray technique for aqueous film coating of ibuprofen pellets. Drug Dev. Ind. Pharm. 24(3): 269 – 274 (1998).
15. Y. Fukumori. Coating of pharmaceutical powders by fluidized bed process. II.
Microcapsules produced by layering of fine powder on coarse particles and subsequent aqueous enteric coating. Chem. Pharm. Bull. 36(4): 1491-1501 (1988).
16. D. M. Jones. Factors to consider in fluid-bed processing. Pharm. Tech. 9: 50-62
(1985). 17. B. N. Chukwumezie, M. Wojcik, P. Malak and C. M. Adeyeye. Feasibility
studies in spheronization and scale-up of ibuprofen microparticulates using the rotor disk fluid-bed technology. AAPS Pharm. Sci. Tech. 3(1): E2 (2003).
18. V. Rajan and S. Garg. Current status of drug delivery technologies and future
directions. Pharm. Tech. On-line. 25(2): 1-14 (2001). 19. V. Pillay and R. Fassihi. In vitro release modulation from crosslinked pellets for
site-specific drug delivery to the gastrointestinal tract. I. Comparison of pH-responsive drug release and associated kinetics. J. Control. Rel. 59(2):229-242 (1999).
20. Glatt Gmbh. Fluid Bed Coating. http://www.glatt.com /e/01_technologien/
01_04_08.htm (accessed 09/06/08). part of The Glatt Group. http://www.glatt. com/ (accessed 09/06/08).
21. I. Ghebre-Saellassie, R. Gordon, M. B. Fawzi and R. U. Nesbitt. Evaluation of a
high-speed pelletization process and equipment. Drug Dev. Ind. Pharm. 11:1523-1541 (1985).
22. B. Gados. Rotary granulators – Evaluation of process technology for pellet
production using factorial design. Drugs Made Germ. 27:30-36 (1984). 23. R. Iyer, L. Augsburger, and D. Parikh. Evaluation of drug layering and coating:
effect of process mode and binder level. Drug Dev. Ind. Pharm. 19(9):981-998 (1993)
24. D. E. Wurster. Air suspension technique for coating drug particles: A preliminary
report. J. Pharm. Sci. 48: 451-455 (1959).
186
25. Guidance for Industry – PAT: A framework for innovative pharmaceutical
development, manufacturing, and quality assurance. FDA. (September 2004). 26. J. E. Carroll, What does accelerating adoption of PAT-based approaches to
pharmaceutical manufacturing mean for the makers of spectroscopic systems? Spectrosc. 20(suppl. 1): 5-6 (2005).
27. J. Callis, D. Illman and B. Kowalski. Process analytical chemistry. Anal. Chem.
59: 624A-637A (1987). 28. W. Blaser, R. Bredeweg, R. Harner, M. LaPack, A. Leugers, D. Martin, R. Pell, J.
Workman, and L. Wright. Process analytical chemistry. Anal. Chem. 67 47R-70R (1995).
29. D. Hassel and E. Bowman. Process analytical chemistry for spectroscopists.
Appl. Spectrosc. 52: 18A-29A (1998). 30. J. Workman, D. Veltkamp, S. Doherty, B. Anderson, K. Creasy, M. Koch, J.
Tatera, A. Robinson, A. Bond, L. Burgess, G. Bokerman, A. Ullman, G. Darsey, F. Mozayeni, J. Bamberger, and M. Greenwood. Process analytical chemistry. Anal. Chem. 71: 121R-180R (1999).
31. W. Herschel. Investigations of the powers of the prismatic colours to heat and
illuminate objects; with remarks, that prove the different refrangibility of radiant heat. To which is added, an inquiry into the method of viewing the sun advantageously, with telescopes of large apertures and high magnifying powers. Phil. Trans. Roy. Soc. 90: 255-283 (1800).
32. K. H. Norris. Design and development of a new moisture meter. Agric. Eng. 45:
370-372 (1964). 33. P. Williams and K. Norris. Near-infrared Technology in the Agricultural and
Food Industries, American Association of Cereal Chemists, St. Paul, MN, 1987. 34. D. A. Burns and E. W. Ciurczak. Handbook of Near-infrared Analysis. Marcel
Dekker, New York, NY, 1992. 35. E. W. Ciurczak and J. K. Drennen. Pharmaceutical and Medical Applications of
NIR Spectroscopy, Marcel Dekker, New York, NY, 2002. 36. K. A. Martin. Recent advances in near-infrared spectroscopy. Appl. Spectrosc.
Rev. 27(4): 325-383 (1992). 37. W. F. McClure. Near-infrared spectroscopy: The giant is running strong. Anal.
Chem. 66(1): 43A-53A (1994).
187
38. J. K. Drennen, E. G. Kraemer and R. A. Lodder. Advances and perspectives in
near-infrared spectroscopy. Crit. Rev. Anal. Chem. 22(6): 443-475 (1991). 39. E. Starck and K. Luchter. Near-infrared analysis (NIRA): A technology for
quantitative and qualitative analysis. Appl. Spectrosc. Rev. 22(4): 335-339 (1986).
40. E. W. Ciurczak. Uses of near-infrared spectroscopy in pharmaceutical analysis.
Appl. Spectrosc. Rev. 23: 143-163 (1987). 41. P. Corti, E. Dreassi, and F. Lonardi. Near infrared reflectance analysis: Feature
and applications in pharmaceutical and biomedical analysis. Il. Farmaco. 48: 3-20 (1993).
42. M. Josefson, I. Jedvert, S. Johansson and F. Langkilde. New opportunities with
NIR spectrometry in the analysis of dosage forms. Eur. J. Pharm. Sci. 2: 82-83 (1994).
43. W. Plugge and C. Van der Vlies. The use of near infrared spectroscopy in the
quality control laboratory of the pharmaceutical industry. J. Pharm. Biomed. Anal. 10: 797-803 (1992).
44. B. F. MacDonald and K. A. Prebble. Some applications of near-infrared
reflectance analysis in the pharmaceutical industry. J. Pharm. Biomed. Anal. 11: 1077-1085 (1993).
45. J. D. Kirsch and J. K. Drennen. Near-infrared spectroscopy: applications in the
analysis of tablets and solid pharmaceutical dosage forms. Appl. Spectrosc. Rev. 30(3), 139-174 (1995).
46. I. Murray and P.C. Williams. Chemcical principles of near-infrared technology.
In Near-infrared Technology in the Agricultural and Food Industries. P. Williams and K. Norris (eds.), American Association of Cereal Chemists, St. Paul MN, pp 15-34.
47. E. W. Ciurczak. Principles of near-infrared spectroscopy. In Handbook of Near-
infrared Analysis. D. A. Burns and E. W. Ciurczak (eds.), Marcel Dekker, New York, NY, 1992, pp. 7-12.
48. M. Blanco, J. Coello, H. Inturraiaga, S. Mospoch, and C. Pezuela. Near-infrared
spectroscopy in the pharmaceutical industry. Analyst. 123:135R-150R (1998).

188
49. C. A. Anderson, J. K. Drennen and Emil w. Ciurczak. Pharmaceutical applications of near-infrared spectroscopy. In D. A. Burns and E. W. Ciurczak (eds.), Handbook of Near-infrared Analysis, Ed. 3, Marcel Dekker, NY, 2007, pp 585 – 612.
50. S. D. Brown, T. B. Blank, S. T. Sum, and Lois G. Weyer. Chemometrics. Anal.
Chem. 66(12): 315R - 359R (1994). 51. S. Wold. Chemometrics, why, what and where to next. J. Pharm. Biomed. Anal.
9(8): 589-596 (1991). 52. J. C. Berridge, P. Jones, and A. Roberts-McIntosh. Chemometrics in
pharmaceutical analysis. J. Pharm. Biomed. Anal. 9(8): 597-604 (1991). 53. P. Williams. Variables affecting near-infrared reflectance spectroscopic analysis.
In Near-infrared Technology in the Agricultural and Food Industries. P. Williams and K. Norris (eds.), American Association of Cereal Chemists, St. Paul MN, pp. 143-167.
54. E. Ciurczak, R. Torlini and M. Demkowicz. Determination of particle size of
pharmaceutical raw materials using near-infrared reflectance spectroscopy. Spectrosc. 1: 36-39 (1987).
55. C. Bull. Compensation of particle size effects in near infrared reflectance.
Analyst 116: 781-786 (1991). 56. P. Frake, I. Gill, C. Luscombe, D. Rudd, J. Waterhouse and U. Jayasooriya.
Near-infrared mass median particle size determination of lactose monohydrate, evaluating several chemometric approaches. Analyst 123: 2043-2046 (1998).
57. A. O’Neil, R. Jee and A. Moffat. The application of multiple linear regression to
the measurement of the median particle size of drugs and pharmaceutical excipients by near-infrared spectroscopy. Analyst 123: 2297-2302 (1998).
58. O. Berntsson, T. Burger, S. Folestad, L. Daneilsson, J. Kuhn and J. Fricke.
Effective sample size in diffuse reflectance near-IR spectroscopy. Anal. Chem. 71: 617-623 (1999).
59. P. Kubelka and F. Munk. Ein beitrag zur optik der farbanstriche. Z. Tech. Physik.
12:593 (1931). 60. G. S. Berth and H. G. Hecht. The physics of near-infrared reflectance. In P.
Williams and K. Norris (eds.), Near-Infrared Technology in the Agricultural and Food Industries, American Association of Cereal Chemists, St. Paul, MN, 1987, pp. 1-15.
189
61. H.G. Hecht. The interpretation of diffuse reflectance spectra. J. Res. Natl. Bur. Stand. 80(A):567 – 583 (1976).
62. M. Otsuka. Comparative particle size determination of phenacetin bulk powder
by using Kubelka-Munk theory and principal component regression analysis based on near infrared spectroscopy. Powd. Tech. 141: 244-250 (2004).
63. W. Hruschka. Data analysis: wavelength selection methods. In P. Williams and
K. Norris (eds.), Near-Infrared Technology in the Agricultural and Food Industries, American Association of Cereal Chemists, St. Paul, MN, 1987, pp. 33-55.
64. R. Breretin. Chemometrics. Data Analysis for the Laboratory and Chemical
Plant. Wiley, West Sussex, England, 2003; pp 147-163. 65. W. F. McClure. Analysis using fournier transforms. In D. A. Burns and E. W.
Ciurczak (eds.), Handbook of Near-infrared Analysis, Marcel Dekker, New York, NY, 1992, pp 181 – 224.
66. T. Isaksson and T. Naes. The effect of multiplicative scatter correction (MSC)
and linearity improvement in NIR spectroscopy. Appl. Spectrosc. 42(7): 1273 - 1284 (1988).
67. E. W. Ciurczak. NIR Analysis of Pharmaceuticals. In D. A. Burnsand E. W.
Ciurczak (eds.), Handbook of Near-infrared Analysis, Marcel Dekker, New York, NY, 1992, pp 549 – 563.
68. I. A. Cowe and J. W. McNichol. The use of principal components in the analysis
of near-infrared spectra. Appl. Spectros. 39(2): 257-266 (1985). 69. J. J. Workman. NIR spectroscopy calibration basics. In D. A. Burns and E. W.
Ciurczak (eds.), Handbook of Near-infrared Analysis, Marcel Dekker, New York, NY, Ed. 3, 2007, pp 123-150.
70. James K. Drennen a; Elizabeth G. Kraemer b; Robert A. Lodder. Advances and
perspectives in near-infrared spectrophotometry, Critical Reviews in Analytical Chemistry, 22(6):443 – 475 (1991).
71. M. K. Boysworth and K. S. Booksh. Aspects of multivariate calibration applied
to near-infrared spectroscopy. In D. A. Burns and E. W. Ciurczak (eds.), Handbook of Near-infrared Analysis, Marcel Dekker, New York, NY, Ed. 3, 2007, pp 207-231.
72. K. H. Erbensen, D. Guyot, F. Westad, and L. P. Houmoller. Multivariate data
analysis in practice: An introduction to multivariate data analysis and experimental design. 5th Edition. Camo, Olso, Norway, 2002, pp 115 – 153.
190
73. R. Brereton. Chemometrics: Applications of Mathematics and Statistics to Laboratory Systems, Ellis Horwood, Sussex, UK, 1990.
74. M. Sharaf, D. Illman, and B. Kowalski. Chemometrics, Wiley, New York, NY,
1986., P. Geladi and B. R. Kowalski. Partial least-squares: A tutorial. Anal. Chim. Acta. 185: 1-17 (1986).
75. H. Martens and T. Naes. Multivariate Calibration, Wiley, Chichester, UK, 1989. 76. H. L. Mark and D. Tunnell. Qualitative near-infrared reflectance analysis using
Mahalanobis distances. Anal Chem. 57(7): 1449-1456. 77. P. J. Gemperline, L. D. Webber, and F. O. Cox. Raw materials testing using soft
independent modeling of class analogy analysis of near-infrared reflectance spectra. Anal Chem. 61(2): 138-144.
78. R. A. Lodder and G. M. Hieftje. Quantile BEAST attacks the false-sample
problem in near-infrared reflectance analysis. Appl. Spectrosc. 42(8): 1351-1365 (1988).
79. B. Efron and R. Tibshirani. Bootstrap measures for standard errors, confidence
intervals, and other measures of statistical accuracy. Stat. Sci. 1(1): 54-77. 80. R.A Lodder, M. Selby, and G.M. Heiftje. Detection of capsule tampering by
near-infrared spectroscopy. Appl. Spectrosc., 59: 1921-1930 (1987). 81. R..A Lodder and G.M. Heiftje. Analysis of intact tablets by near-infrared
spectroscopy. Appl. Spectrosc., 42: 556-558 (1988). 82. S. Katju, Kreft, B. Kozamernik and U. Urleb. Qualitative determination of
polyvinylpyrrolidone type by near-infrared spectrometry. Int. J. Pharm., 177(1): 1-6 (1999).
83. J. D Kirsch and J. K. Drennen. Near-infrared spectroscopic monitoring of the
film coating process. Pharm. Res., 13(2): 234-237 (1996). 84. A. S. El-Hagrasy, H. R. Morris, F. D'Amico, R. A. Lodder, J. K. Drennen. Near-
infrared spectroscopy and imaging for the monitoring of powder blend homogeneity. J. Pharm. Sci. 90(9): 1298-1307 (2001).
85. J. D. Kirsch, and J. K. Drennen. Nondestructive tablet hardness testing by near-
infrared spectroscopy: a new and robust spectral best-fit algorithm. J. Pharm. Biomed. Anal. 19(3-4): 351-362 (1999).
191
86. R. Jensen, E. Peuchant, I. Castagne, A. M. Boirac, G. Roux. One-step quantification of active ingredient in pharmaceutical tablets using near-infrared spectroscopy. Spectros. Int. J. 6: 63-72 (1988).
87. P. Corti, E. Degrassi, G. Corbini, S. Lonardi and S. Gravina. Application of near
infrared reflectance spectroscopy to pharmaceutical control: I. Preliminary investigation of the uniformity of tablets content. Analusis 18: 112-116 (1990).
88. R. G. Buice, T. B. Gold, R. A. Lodder and G. A. Digenis. Determination of
moisture in intact gelatin capsule by near-infrared spectrophotometry. Pharm. Res. 12(1): 160-163 (1995).
89. P. Corti, E. Dreassi, G. Corbini, L. Montecchi, and J. Paggi. Application of near-
infrared spectroscopy to pharmaceutical quality control. II: Assay of cloxacillin benzatine in creams. Analusis 18: 117-121 (1990).
90. E. W. Ciurczak and R. P. Torlini. Analysis of solid and liquid dosage forms via
NIRS. Spectrosc. 2(3), 36-39 (1987). 91. J. Lin and C. Brown. Near-IR fiber-optic probe for electrolytes in aqueous
solution. Anal. Chem. 65: 287-292 (1993). 92. L. J. Galante, M. A. Brinkley, and R. A. Lodder. Bacterial monitoring in vials
using a spectrophotometric assimilation method. Pharm. Res. 9(3): 357-364 (1992).
93. L. J. Galante. M. A. Brinkley, J. K. Drennen. and R. A. Lodder. Near-infrared
spectrometry of microorganisms in liquid pharmaceuticals. Anal. Chem. 62: 2514-2521 (1990).
94. Near-infrared Spectrometry. In The United States Pharmacopeia 27, United
States Pharmacopeial Convention, Rockville, MD, 2004, pp. 2569-2573. 95. Guidance for Industry – Analytical procedures and methods validation chemistry:
manufacturing, and controls documentation. FDA. (September 2004). 96. J. E. Sinsheimer and A. M. Keuhnelian. Near-infrared spectroscopy of amine
salts. J. Pharm Sci. 55: 1240-1244 (1966). 97. N. Odu and E. Inaba. Determination of allylisopropylacetireide and phenacetin in
pharmaceutical preparations by near-infrared absorption spectroscopy. Yakugaku Zasshi 87: 213-215 (1967).
98. S. Lonardi, R. Viviani, L. Masconi, M. Bernuzzi, P. Corti, E. Dreassi,. C.
Murratzu and G. Corbini. Drug analysis by near-infrared reflectance spectroscopy: Determination of the active ingredient and water content in antibiotic powders. J. Pharm. Biomed. Anal. 7(3): 303-308 (1989).
192
99. E. W. Ciurczak. Pharmaceutical mixing studies using near-infrared spectroscopy.
Pharm. Tech. 15(9): 140-145 (1991). 100. B. G. Osborne. Determination of nicotinamide in pre-mixes by near-infrared
spectroscopy. Analyst 112(3): 313-315 (1987). 101. D. J. Wargo and J. K. Drennen. Near-infrared characterization of powdered
blends. J. Pharm. Biomed. Anal. 14(11): 1415-1423 (1996). 102. J. C. Chasseur. On-line assay of cimetidine granules by near infrared reflectance
spectroscopy. Chim. Oggi. 6: 21-24 (1987). 103. S. Watano, H. Takashima, Y. Sato, K. Miyanami, and T. Yasumoto. IR
absorption characteristics of a near-IR moisture sensor and mechanism of water transfer in fluidized bed granulation. Adv. Pwdr. Technol., 90: 153-159 (1997).
104. J. White. On-line moisture detection for a microwave vacuum dryer. Pharm.
Res., 11: 728-732 (1994). 105. R. Jensen, E. Peuchant, I. Castagne, A. M. Boirac, G. Roux. One-step
quantification of active ingredient in pharmaceutical tablets using near-infrared spectroscopy. Spectros. Int. J. 6: 63-72 (1988).
106. J. Lin and C. Brown. Near-IR fiber-optic probe for electrolytes in aqueous
solution. Anal. Chem. 65: 287-292 (1993). 107. L. J. Galante, M. A. Brinkley, and R. A. Lodder. Bacterial monitoring in vials
using a spectrophotometric assimilation method. Pharm. Res. 9(3): 357-364 (1992).
108. L. J. Galante. M. A. Brinkley, J. K. Drennen. and R. A. Lodder. Near-infrared
spectrometry of microorganisms in liquid pharmaceuticals. Anal. Chem. 62: 2514-2521 (1990).
109. K. Morisseau and C. Rhodes. Pharmaceutical uses of near-IR spectroscopy.
Drug Dev. Ind. Pharm. 21: 1071-1090 (1995). 110. K. Marshall and E. M. Rudnic. Tablet dosage forms. In G. Banker and C. T.
Rhodes (eds.), Modern Pharmaceutics, Marcel Dekker, New York, 1990, pp. 355-425.
111. S. Han and P. Faulkner. Determination of SB 216469-S during tablet production
using near-infrared spectroscopy. J. Pharm. Biomed. Anal. 14: 1681-1689 (1996).
193
112. D. D. MacLaren and R. G. Hollenbeck. A high performance liquid
chromatographic method for the determination of the amount of hydroxpropyl methylcellulose applied to tablets during an aqueous film coating operation. Drug Dev. Ind. Pharm. 13: 2179-2197 (1987).
113. L. Scattergood, K. Fegely, P. Rege, D. Ferrizzi and A. Rajabi-Siohbooi.
Comparative study of theoretical versus actual weight gain for Surelease barrier membrane pellets. Presented at AAPS Annual Meeting, November 2004.
114. J. D. Kirsch and J. K. Drennen. Determination of film-coated tablet parameters
by near-infrared spectroscopy. J. Pharm. Biomed. Anal. 13: 1273-1281 (1995). 115. J. K. Drennen and J. D. Kirsch. Apparatus for nondestructively inspecting a
coated article and associated method. US Patent 5,750,996. (May 12, 1998). 116. B. R. Buchanan, M. A. Baxter, T. S. Chen, X. A. Qin, P. A. Robinson. Use of
near-infrared spectroscopy to evaluated an active in a film coated tablet, Pharm. Res. 13: 616-621 (1996).
117. M. Andersson, M. Josefson, F. Langkilde and K. G. Wahlund. Monitoring of film
coating process for tablets using near infrared reflectance spectroscopy. J. Pharm. Biomed. Anal. 20: 27-37 (1999).
118. G. A. Duff, S. A. Thornton, B. R. Buchanan and M. A. Baxter. On-line
monitoring of pelletized product uniformity by remote reflectance near-infrared spectroscopy. STP Pharma. Pratiques 4(1): 1-4 (1994).
119. M. Andersson, S. Folestad, J. Gottfires, M. O. Johansson, M. Josefson, and K. G.
Wahlund. Quantitative analysis of film coating in a fluidized bed process by in-line NIR spectrometry and multivariate batch calibration. Anal. Chem., 72: 2099-2108 (2000).
120. M. Andersson, B. Holmquist, J. Linquist, O. Nilsson and K. G. Wahlund.
Analysis of film coating thickness and surface area of pharmaceutical pellets using fluorescence microscopy and image analysis. J. Pharm. Biomed. Anal. 22: 325-339 (2000).
121. O. Berntsson, L. G. Danielsson and S. Folestad. Characterization of diffuse
reflectance fiber probe sampling moving solids using a Fourier transform near-infrared spectrometer. Anal. Chim. Acta. 431: 125-131 (2001).
122. S. Sekulic, H. Ward, D. Brannegan, E. Stanley, C. Evans, S. Sciavolino, P. Hailey
and P. Aldridge, On-line monitoring of powder blend homogeneity by near-infrared spectroscopy. Anal.Chem. 68: 509-513 (1996).
194
123. P. Hailey, P. Doherty and P. Tapsell, T. Oliver and P. Aldridge. Automated system for the on-line monitoring of powder blending processes using near-infrared spectroscopy Part I. System development and control. J. Pharm. Biomed. Anal. 14: 551-559.
124. T. Burger, J. Kuhn, R. Caps and J. Fricke. Quantitative determination of the
scattering and absorption coefficients from diffuse reflectance and transmittance measurements. J. Appl. Spectrosc. 51: 309-317 (1997).
125. T. Burger, J. Fricke and J. Kuhn. NIR radiative transfer investigations to
characterize powders and their mixtures. J. Near Infrared Spectrosc. 6: 33-40 (1998).
126. G. Kemeny, T. Pokorny, E. Nagy, G. Istok and E. Doromby. Optical analysis
instrument having rotating optical standards. PCT Patent Application, WO 8503575 A1 (1985).
127. J. W. MacTaggert. Infrared constituent analyzer and control system. UK Patent
GB2147413A (1985). 128. J. A. Sumen, J. S. Tornberg. Procedure for measuring components of a coating on
a moving base material. United States Patent 5,914,490 (1999). 129. M. Andersson, O. Svensson, S. Folestad, M. Josefson, and K. G. Wahlund. Near-
IR spectroscopy on moving solids using a scanning grating spectrometer – Impact on multivariate process analysis. Chemomet. Intel. Lab. Syst. 75: 1-11 (2005).
130. Diltiazem HCl Extended-release Capsules, U.S. Pharmacopeia 24, US
Pharmacopeial Convention: Rockville, MD, 2000, p. 75. 131. C. D. Melia, B. R. Hansjaj, K. A. Khan, and I. R. Wilding. A simple and rapid
method for the quantification of Eudragit RS100 and RL100 poly(methacrylates) in sustained-release dosage forms. Pharm. Res. 8(7): 899-902 (1991).
132. Manual for Near Infrared Spectral Analysis Software (NSAS V. 3,23),
NIRSystems, Silver Spring, MD, 1990. 133. H. Mark and J. Workman. Chemometrics in spectroscopy. Spectrosc., 13(6): 19-
21 (1998). 134. (<612> Chromatography, U.S. Pharmacopeia 24, US Pharmacopeial Convention:
Rockville, MD, 2000, p. 2281. 135. W. L. Yoon, R. D. Jee and A. C. Moffat. Optimization of sample presentation for
the near-infrared spectra of pharmaceutical excipients. Analyst, 123:1029-1034 (1998).
195
136. R. Bodmier, X. Guo, R. Sarabia and P. Skultety. The influence of buffer species
and strength on diltiazem HCl release from beads coated with aqueous cationic polymers dispersions, Eudragit RS, RL 30D. Pharm. Res. 13(1); 52-56 (1996),
137. S. Narisawa, M. Nagata, C. Danyoshi, H. Yoshino, K. Murata, Y. Hirakawa, and
K. Noda. An organic acid-induced sigmoidal release system for oral controlled-release preparations. Pharm. Res. 11(1):111-116 (1994)
138. J. K. Drennen and R. A. Lodder. Qualitative analysis using near-infrared
spectroscopy. A comparison of discriminant methods in dissolution testing. Spectrosc. 6(8): 34-39 (1991).
139. Guidance for Industry – SUPAC-MR: Scale-up and post-approval changes:
Modified release solid oral dosage forms. FDA. (September 1997). 140. Guidance for Industry – SUPAC-IR: Scale-up and post-approval changes:
Immediate release solid oral dosage forms. FDA. (November 1995).
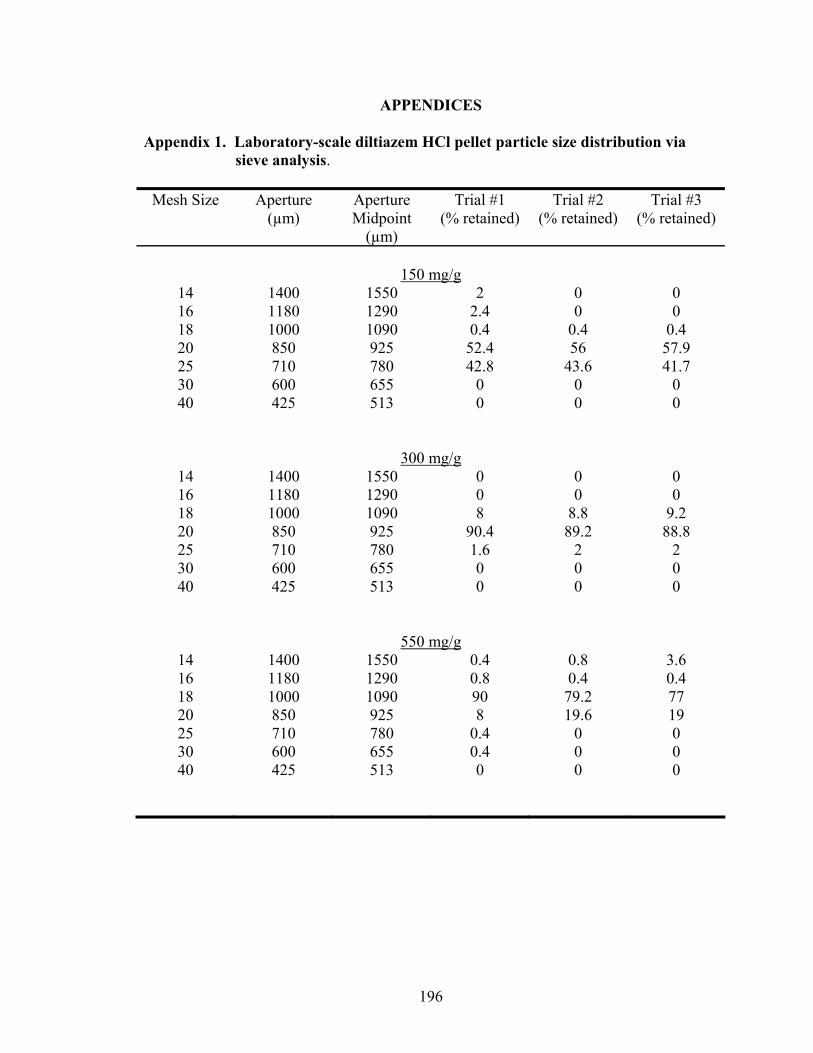
196
APPENDICES
Appendix 1. Laboratory-scale diltiazem HCl pellet particle size distribution via sieve analysis.
Mesh Size Aperture (µm)
Aperture Midpoint
(µm)
Trial #1 (% retained)
Trial #2 (% retained)
Trial #3 (% retained)
150 mg/g
14 1400 1550 2 0 0 16 1180 1290 2.4 0 0 18 1000 1090 0.4 0.4 0.4 20 850 925 52.4 56 57.9 25 710 780 42.8 43.6 41.7 30 600 655 0 0 0 40 425 513 0 0 0
300 mg/g 14 1400 1550 0 0 0 16 1180 1290 0 0 0 18 1000 1090 8 8.8 9.2 20 850 925 90.4 89.2 88.8 25 710 780 1.6 2 2 30 600 655 0 0 0 40 425 513 0 0 0
550 mg/g 14 1400 1550 0.4 0.8 3.6 16 1180 1290 0.8 0.4 0.4 18 1000 1090 90 79.2 77 20 850 925 8 19.6 19 25 710 780 0.4 0 0 30 600 655 0.4 0 0 40 425 513 0 0 0
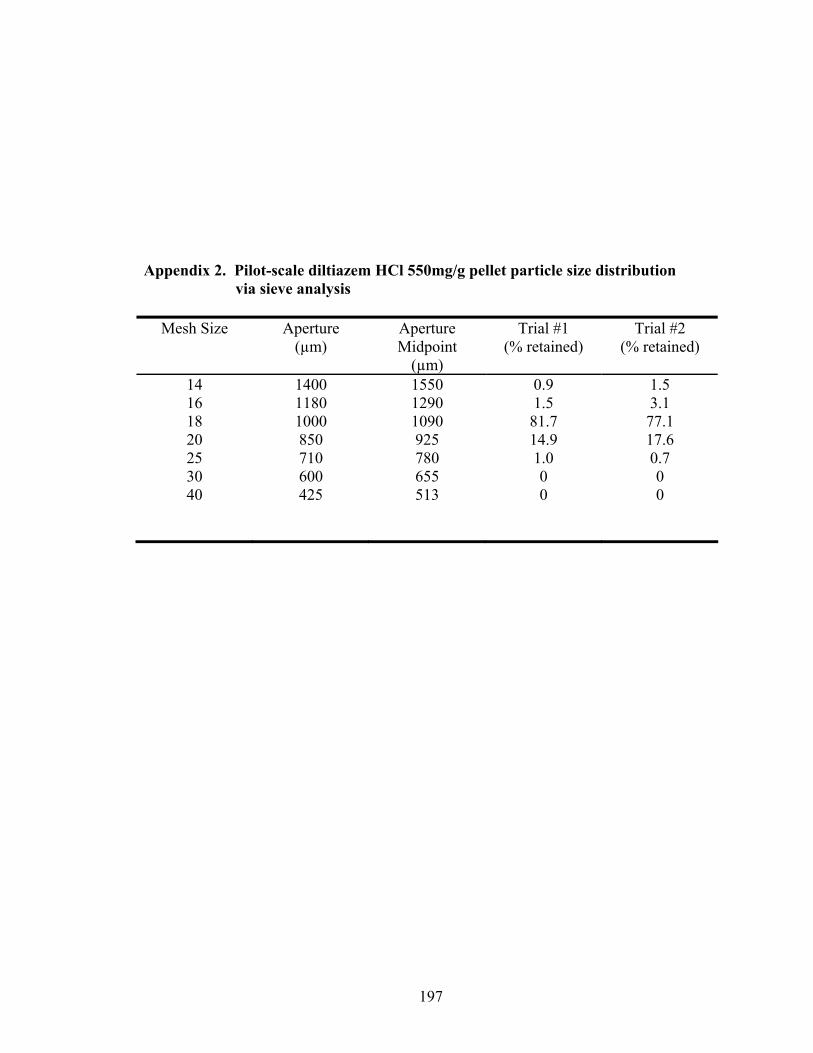
197
Appendix 2. Pilot-scale diltiazem HCl 550mg/g pellet particle size distribution via sieve analysis
Mesh Size Aperture (µm)
Aperture Midpoint
(µm)
Trial #1 (% retained)
Trial #2 (% retained)
14 1400 1550 0.9 1.5 16 1180 1290 1.5 3.1 18 1000 1090 81.7 77.1 20 850 925 14.9 17.6 25 710 780 1.0 0.7 30 600 655 0 0 40 425 513 0 0
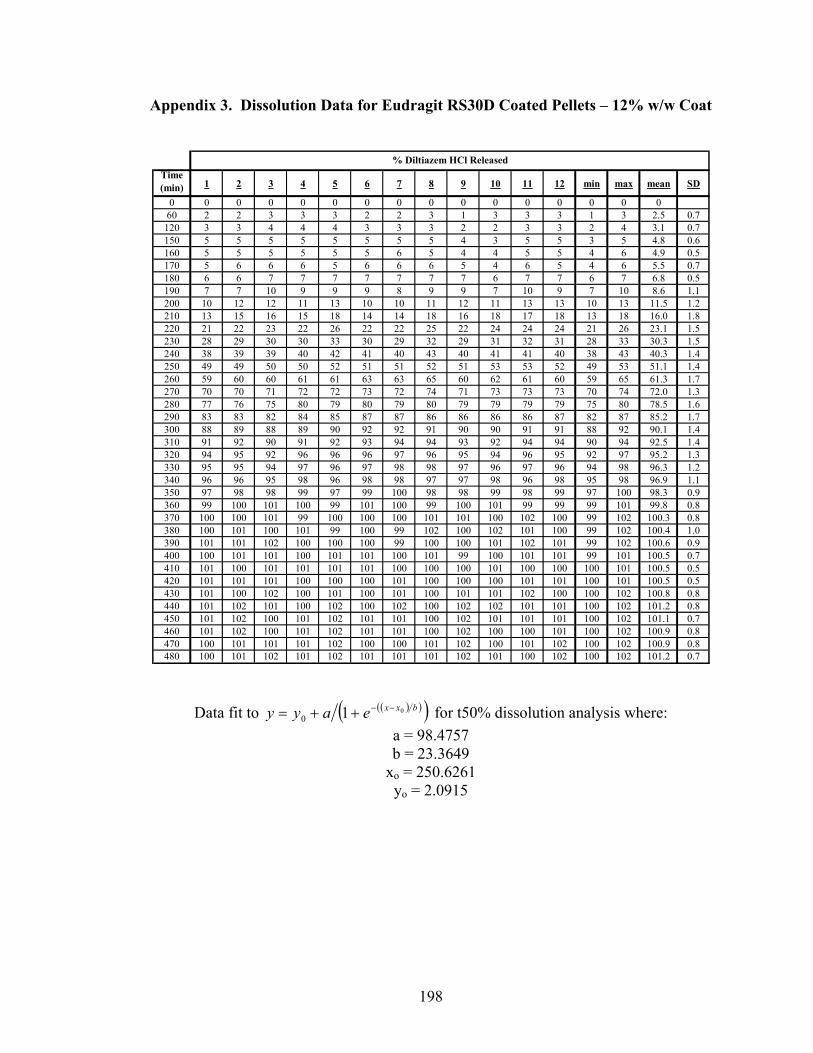
198
Appendix 3. Dissolution Data for Eudragit RS30D Coated Pellets – 12% w/w Coat
Time(min) 1 2 3 4 5 6 7 8 9 10 11 12 min max mean SD
0 0 0 0 0 0 0 0 0 0 0 0 0 0 0 060 2 2 3 3 3 2 2 3 1 3 3 3 1 3 2.5 0.7
120 3 3 4 4 4 3 3 3 2 2 3 3 2 4 3.1 0.7150 5 5 5 5 5 5 5 5 4 3 5 5 3 5 4.8 0.6160 5 5 5 5 5 5 6 5 4 4 5 5 4 6 4.9 0.5170 5 6 6 6 5 6 6 6 5 4 6 5 4 6 5.5 0.7180 6 6 7 7 7 7 7 7 7 6 7 7 6 7 6.8 0.5190 7 7 10 9 9 9 8 9 9 7 10 9 7 10 8.6 1.1200 10 12 12 11 13 10 10 11 12 11 13 13 10 13 11.5 1.2210 13 15 16 15 18 14 14 18 16 18 17 18 13 18 16.0 1.8220 21 22 23 22 26 22 22 25 22 24 24 24 21 26 23.1 1.5230 28 29 30 30 33 30 29 32 29 31 32 31 28 33 30.3 1.5240 38 39 39 40 42 41 40 43 40 41 41 40 38 43 40.3 1.4250 49 49 50 50 52 51 51 52 51 53 53 52 49 53 51.1 1.4260 59 60 60 61 61 63 63 65 60 62 61 60 59 65 61.3 1.7270 70 70 71 72 72 73 72 74 71 73 73 73 70 74 72.0 1.3280 77 76 75 80 79 80 79 80 79 79 79 79 75 80 78.5 1.6290 83 83 82 84 85 87 87 86 86 86 86 87 82 87 85.2 1.7300 88 89 88 89 90 92 92 91 90 90 91 91 88 92 90.1 1.4310 91 92 90 91 92 93 94 94 93 92 94 94 90 94 92.5 1.4320 94 95 92 96 96 96 97 96 95 94 96 95 92 97 95.2 1.3330 95 95 94 97 96 97 98 98 97 96 97 96 94 98 96.3 1.2340 96 96 95 98 96 98 98 97 97 98 96 98 95 98 96.9 1.1350 97 98 98 99 97 99 100 98 98 99 98 99 97 100 98.3 0.9360 99 100 101 100 99 101 100 99 100 101 99 99 99 101 99.8 0.8370 100 100 101 99 100 100 100 101 101 100 102 100 99 102 100.3 0.8380 100 101 100 101 99 100 99 102 100 102 101 100 99 102 100.4 1.0390 101 101 102 100 100 100 99 100 100 101 102 101 99 102 100.6 0.9400 100 101 101 100 101 101 100 101 99 100 101 101 99 101 100.5 0.7410 101 100 101 101 101 101 100 100 100 101 100 100 100 101 100.5 0.5420 101 101 101 100 100 100 101 100 100 100 101 101 100 101 100.5 0.5430 101 100 102 100 101 100 101 100 101 101 102 100 100 102 100.8 0.8440 101 102 101 100 102 100 102 100 102 102 101 101 100 102 101.2 0.8450 101 102 100 101 102 101 101 100 102 101 101 101 100 102 101.1 0.7460 101 102 100 101 102 101 101 100 102 100 100 101 100 102 100.9 0.8470 100 101 101 101 102 100 100 101 102 100 101 102 100 102 100.9 0.8480 100 101 102 101 102 101 101 101 102 101 100 102 100 102 101.2 0.7
% Diltiazem HCl Released
Data fit to ( )( )( )bxxeayy 010
−−++= for t50% dissolution analysis where: a = 98.4757 b = 23.3649
xo = 250.6261 yo = 2.0915

199
Appendix 4. Dissolution Data for Eudragit RS30D Coated Pellets – 14% w/w Coat
Time(min) 1 2 3 4 5 6 7 8 9 10 11 12 min max mean SD
0 0 0 0 0 0 0 0 0 0 0 0 0 0 0 0 60 1 2 3 3 2 2 3 3 1 3 2 3 1 3 2.3 0.8
120 3 4 5 4 3 4 3 2 3 3 3 5 2 5 3.5 0.9150 4 5 3 4 5 5 4 5 5 4 3 5 3 5 4.3 0.8160 5 5 4 6 4 4 5 5 6 5 4 6 4 6 4.9 0.8170 6 6 5 6 6 6 5 4 6 5 5 4 4 6 5.3 0.8180 6 6 6 6 5 6 5 4 7 6 6 5 4 7 5.7 0.8190 6 6 7 7 5 6 6 5 6 6 6 5 5 7 5.9 0.7200 7 8 8 6 6 7 6 6 7 7 7 7 6 8 6.8 0.7210 8 10 10 8 8 8 7 8 9 10 9 9 7 10 8.7 1.0220 10 12 12 10 13 10 10 11 12 11 13 12 10 13 11.3 1.2230 15 16 17 14 15 13 14 16 17 16 18 18 13 18 15.8 1.6240 20 22 23 20 21 20 22 23 22 21 24 23 20 24 21.8 1.4250 26 29 30 28 27 27 29 29 30 26 32 30 26 32 28.6 1.8260 36 37 39 37 39 35 38 35 38 35 41 40 35 41 37.5 2.0270 46 49 52 47 49 47 51 49 46 46 51 52 46 52 48.8 2.3280 55 60 62 58 60 57 60 60 58 57 60 62 55 62 59.1 2.1290 67 69 73 69 71 68 69 68 68 66 71 73 66 73 69.3 2.2300 76 78 81 77 80 78 78 75 77 75 80 81 75 81 78.0 2.1310 84 85 87 85 85 84 83 81 82 84 87 86 81 87 84.4 1.8320 89 91 92 90 89 90 88 87 87 89 90 92 87 92 89.5 1.7330 91 93 94 94 91 92 92 90 89 93 94 94 89 94 92.3 1.7340 93 95 93 96 93 94 94 93 91 96 96 96 91 96 94.2 1.6350 96 97 96 98 95 95 96 94 93 97 99 97 93 99 96.1 1.7360 97 97 98 99 96 96 97 94 96 98 100 98 94 100 97.2 1.6370 99 97 98 100 98 97 97 96 97 98 101 99 96 101 98.1 1.4380 99 99 100 100 100 98 98 98 99 100 101 101 98 101 99.4 1.1390 101 99 102 101 100 99 100 99 100 101 100 100 99 102 100.2 0.9400 100 101 101 100 101 101 100 101 99 100 101 101 99 101 100.5 0.7410 101 100 101 101 101 101 100 100 100 101 100 100 100 101 100.5 0.5420 101 102 100 101 102 101 101 100 102 101 101 101 100 102 101.1 0.7430 100 101 101 101 102 100 100 101 102 100 101 102 100 102 100.9 0.8440 100 101 100 101 102 101 101 101 102 101 100 102 100 102 101.0 0.7450 101 101 101 100 100 100 101 100 100 100 101 101 100 101 100.5 0.5460 101 102 100 101 101 101 101 100 102 100 100 101 100 102 100.8 0.7470 101 100 101 101 101 101 100 100 100 101 100 100 100 101 100.5 0.5480 100 101 102 100 102 101 101 101 102 101 100 102 100 102 101.1 0.8
% Diltiazem HCl Released
Data fit to ( )( )( )bxxeayy 010−−++= for t50% dissolution analysis where: a = 97.5053 b = 23.0576
xo = 273.1917 yo = 3.0055

200
Appendix 5. Dissolution Data for Eudragit RS30D Coated Pellets – 16% w/w Coat
Time(min) 1 2 3 4 5 6 7 8 9 10 11 12 min max mean SD
0 0 0 0 0 0 0 0 0 0 0 0 0 0 0 060 1 3 2 3 4 2 1 3 2 4 3 3 1 4 2.6 1.0
120 3 4 4 4 5 3 3 4 3 5 4 3 3 5 3.8 0.8150 4 4 5 4 5 4 4 5 3 5 5 3 3 5 4.3 0.8160 4 5 5 4 5 5 4 6 4 5 5 4 4 6 4.7 0.7170 5 5 6 5 5 5 5 6 5 5 6 4 4 6 5.2 0.6180 5 5 6 5 5 6 5 6 5 5 6 4 4 6 5.3 0.6190 5 5 6 6 5 6 5 6 5 5 7 5 5 7 5.5 0.7200 6 5 7 6 5 6 5 6 6 6 7 6 5 7 5.9 0.7210 7 6 7 7 6 7 6 7 6 6 7 7 6 7 6.6 0.5220 7 7 8 8 7 8 7 7 7 7 8 8 7 8 7.4 0.5230 8 9 10 9 9 10 9 8 9 8 9 9 8 10 8.9 0.7240 11 12 12 12 12 13 12 10 12 11 13 12 10 13 11.8 0.8250 15 15 16 15 16 16 15 13 15 14 16 15 13 16 15.1 0.9260 20 21 21 22 22 23 23 20 22 20 21 21 20 23 21.3 1.1270 26 28 27 29 30 30 29 27 28 27 29 28 26 30 28.2 1.3280 34 37 35 38 38 38 37 35 36 36 38 38 34 38 36.7 1.4290 46 48 45 47 49 48 46 44 47 46 48 49 44 49 46.9 1.6300 57 57 56 57 60 58 56 55 56 57 59 58 55 60 57.2 1.4310 68 67 65 69 71 69 67 66 65 68 70 66 65 71 67.6 1.9320 78 76 74 78 79 78 76 75 75 76 78 75 74 79 76.5 1.6330 84 83 82 86 87 86 84 83 83 83 87 82 82 87 84.2 1.9340 89 87 87 91 91 91 89 87 88 87 90 86 86 91 88.6 1.8350 92 93 94 93 92 92 92 90 90 93 94 94 90 94 92.4 1.4360 91 95 94 96 92 94 93 93 91 96 95 96 91 96 93.8 1.9370 95 98 97 98 95 95 96 94 93 98 98 97 93 98 96.2 1.7380 96 98 98 99 96 96 97 95 96 98 100 98 95 100 97.3 1.5390 97 97 98 100 97 99 99 98 97 99 97 99 97 100 98.1 1.1400 98 98 99 100 98 99 99 100 99 100 97 99 97 100 98.8 0.9410 99 98 99 100 99 99 99 102 101 100 98 100 98 102 99.5 1.2420 100 99 100 101 100 101 100 103 102 102 99 101 99 103 100.7 1.2430 100 100 100 102 100 99 100 102 101 101 100 100 99 102 100.4 0.9440 99 100 100 101 99 100 101 103 100 101 100 101 99 103 100.4 1.1450 100 100 101 100 100 101 101 103 100 102 101 102 100 103 100.9 1.0460 101 100 100 99 100 101 100 103 101 103 101 102 99 103 100.9 1.2470 101 101 100 100 100 102 101 103 102 102 101 101 100 103 101.2 0.9480 102 103 101 99 101 103 102 102 101 101 102 102 99 103 101.6 1.1
% Diltiazem HCl Released
Data fit to ( )( )( )bxxeayy 010−−++= for t50% dissolution analysis where: a = 96.9432 b = 23.1678
xo = 294.9015 yo = 3.6087
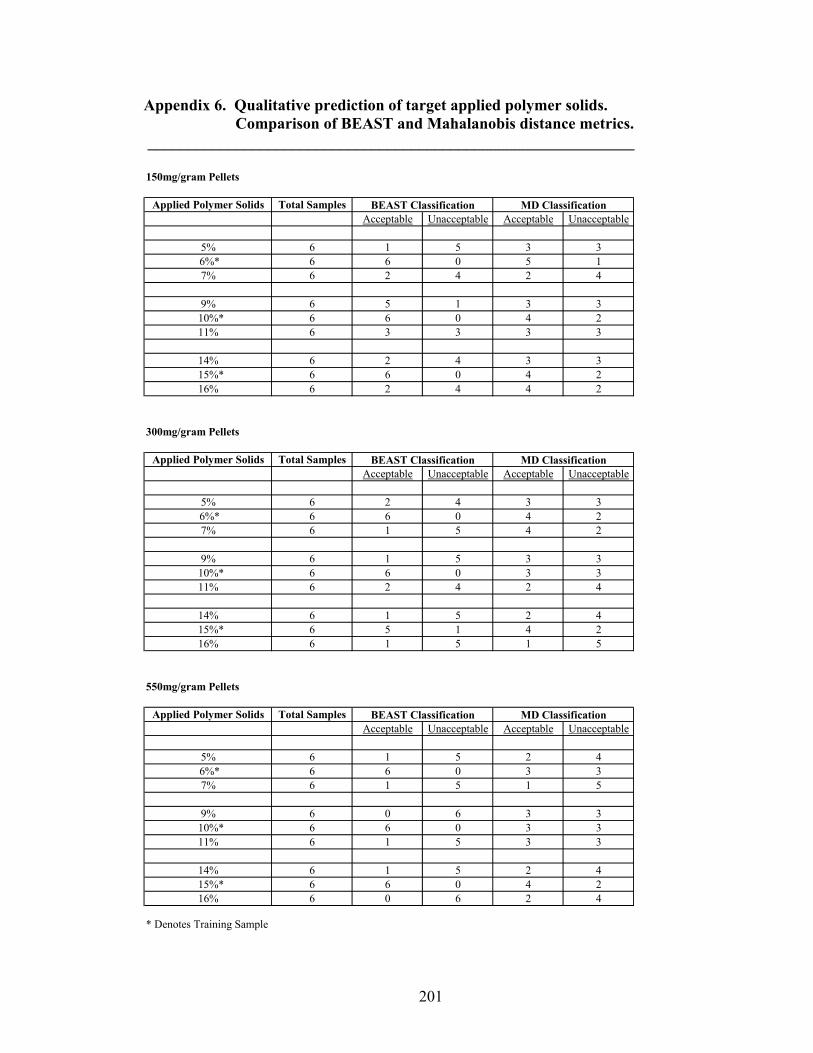
201
Appendix 6. Qualitative prediction of target applied polymer solids. Comparison of BEAST and Mahalanobis distance metrics. _____________________________________________________________
Applied Polymer Solids Total SamplesAcceptable Unacceptable Acceptable Unacceptable
5% 6 1 5 3 3
6%* 6 6 0 5 17% 6 2 4 2 4
9% 6 5 1 3 3 10%* 6 6 0 4 2
11% 6 3 3 3 3
14% 6 2 4 3 3 15%* 6 6 0 4 2
16% 6 2 4 4 2
Applied Polymer Solids Total SamplesAcceptable Unacceptable Acceptable Unacceptable
5% 6 2 4 3 3
6%* 6 6 0 4 27% 6 1 5 4 2
9% 6 1 5 3 3 10%* 6 6 0 3 3
11% 6 2 4 2 4
14% 6 1 5 2 4 15%* 6 5 1 4 2
16% 6 1 5 1 5
Applied Polymer Solids Total SamplesAcceptable Unacceptable Acceptable Unacceptable
5% 6 1 5 2 4
6%* 6 6 0 3 37% 6 1 5 1 5
9% 6 0 6 3 3 10%* 6 6 0 3 3
11% 6 1 5 3 3
14% 6 1 5 2 4 15%* 6 6 0 4 2
16% 6 0 6 2 4
* Denotes Training Sample
MD Classification
BEAST Classification MD Classification
BEAST Classification MD Classification
300mg/gram Pellets
550mg/gram Pellets
BEAST Classification
150mg/gram Pellets