NDT Instruments
96
Contents V-C-400 V-Meter Mark IV Operator’s Manual Original Instructions: Revision March 2012
-
Upload
elango-paulchamy -
Category
Documents
-
view
137 -
download
12
description
NDT instruments
Transcript of NDT Instruments

Contents
V-C-400
V-Meter Mark IV Operator’s Manual
Original Instructions: Revision March 2012

Notice
The James Instruments V-Meter Mark IV™ has been tested in accordance with the EU regulations governing Electro-Magnetic compliance and it meets required directives.
V-Meter Mark IV™ is a registered trademark of James Instruments Inc. and is property of its respective owner.
© 2012 James Instruments Inc. All rights reserved.
No part of this publication may be reproduced, stored in a retrieval system, or transmitted, in any form, or by any means, mechanical, electronic, photocopying, recording, or otherwise, without prior written permission of James Instruments.
No patent liability is assumed with respect to the use of the information contained herein. Moreover, because James Instruments is constantly striving to improve its high-quality products, the information contained in this manual is subject to change without notice. Every precaution has been taken in the preparation of this manual. Nevertheless, James Instruments assumes no responsibility for errors or omissions. Neither is any liability assumed for damages resulting from the use of the information contained in this publication.

Contents
www.ndtjames.com iii
Table of Contents Introduction ....................................................................................... 1
Applications ............................................................................. 2 Features .................................................................................. 2
Instrument Contents List .................................................................. 3 Contents List ............................................................................ 4
V-Meter Overview ............................................................................ 5 Instrument Connections........................................................... 6
Control Panel.................................................................................... 7 Instrument Functions ............................................................... 8
Instrument Display Screens ............................................................. 9 Test Menu Screen ................................................................... 9
Transducer Pulse Frequency ............................................ 11 Pulse and Frequency Rate................................................ 11 Setting Velocity or Distance .............................................. 12
Setup Menu Screen ............................................................... 15 Calibration Screen ............................................................. 17 Set Density Screen ........................................................... 18
Review Menu Screen ............................................................ 19 System Menu Screen ............................................................ 21
Clock Set Menu Screen .................................................... 23 Battery Status (Operations) Screen .................................. 24
E / μ Menu Screen ................................................................. 25 E/µ-TYPE .......................................................................... 27
Upload Menu Screen ............................................................. 29
Transducer Basics ......................................................................... 30 Transducers and Leads ......................................................... 30 Types of Transducers ............................................................ 31
24kHz ................................................................................ 31 54kHz ................................................................................ 32 150kHz .............................................................................. 32 500kHz .............................................................................. 33 Shear Wave ...................................................................... 33 Exponential ....................................................................... 34 Underwater ........................................................................ 34
Placing Transducers .............................................................. 35 Couplant ................................................................................ 37
Using the V-Meter on Location ....................................................... 38 Removing the Lid ................................................................... 38 Using the Support Straps ...................................................... 38

Contents
iv www.ndtjames.com
Velocilinx Introduction .................................................................... 40 Features ................................................................................ 40 Minimum System Requirements ........................................... 40
Velocilinx Overview ........................................................................ 41 Software Functions ................................................................ 42
Software Installation ....................................................................... 43
Data Upload ................................................................................... 48 Traditional Data Upload ......................................................... 48 Graphing Saved Data ............................................................ 49
Remote Control .............................................................................. 50 Remote Control Features ...................................................... 50
V-Meter Applications ...................................................................... 53 History of Pulse Velocity Testing ........................................... 53 Application of Pulse Velocity Testing .................................... 54 Detection of Defects .............................................................. 54 Detection of Large Voids or Cavities ..................................... 55 Determination of the Dynamic Modulus of Elasticity and Dynamic Poisson’s Ratio ....................................................... 56 Estimation the Depth of the Surface Cracks ......................... 59 Estimation of Elastic Modulus ............................................... 62 Estimation of Strength ........................................................... 63 Estimation of Strength After Fire Damage............................. 68 Homogeneity of Concrete ...................................................... 69 Influence of Test Conditions .................................................. 70 Effects of Dimensions on Pulse Transmission ...................... 71 Monitoring Changes in Concrete with Time .......................... 73 Stress Wave Propagation ...................................................... 75 Velocity of Longitudinal Pulses in Elastic Solids ................... 76
Maintenance ................................................................................... 77 Data Logger and Battery ....................................................... 77 Changing the battery ............................................................. 79
Safety ............................................................................................. 80
Available V-Meter Accessories ...................................................... 81
Specifications ................................................................................. 83
Warranty Information ...................................................................... 84
Repair Policy .................................................................................. 89
We: James Instruments Inc. Of: Chicago, IL
In accordance with the following Directive(s):
2006/95/EC Low Voltage Directive
hereby declare that:
Equipment V-Meter Mark IV
Model Number V-C-400
is in conformity with the applicable requirements of the following documents
Ref. No. Title Edition/date
ASTM C597 Standard Test Method for Pulse Velocity 2009 Through Concrete EN 61000-6-3 Electromagnetic compatibility (EMC). Generic 2007
standards. Emission standard for residential, commercial and light-industrial environments.
EN 61000-6-2 Electromagnetic Compatibility (EMC) 1999
Part 6-2: Generic Standards—Immunity for Industrial Environments.
BS 1881-203 Testing concrete. Recommendations on the 1986
use of electromagnetic covermeters. I hereby declare that the equipment named above has been designed to comply with the relevant sections of the above referenced specifications. The unit complies with all applicable Essential Requirements of the Directives.
Signed:
Name: Michael Hoag
Position: President, James Instruments Inc.
Location: Chicago, IL
On: 3/1/2012
Introduction
1 www.ndtjames.com
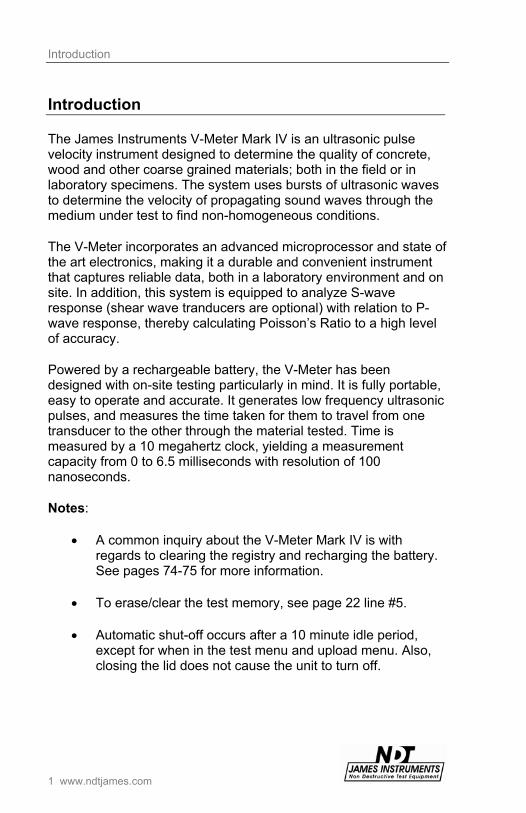
Introduction
The James Instruments V-Meter Mark IV is an ultrasonic pulse velocity instrument designed to determine the quality of concrete, wood and other coarse grained materials; both in the field or in laboratory specimens. The system uses bursts of ultrasonic waves to determine the velocity of propagating sound waves through the medium under test to find non-homogeneous conditions.
The V-Meter incorporates an advanced microprocessor and state of the art electronics, making it a durable and convenient instrument that captures reliable data, both in a laboratory environment and on site. In addition, this system is equipped to analyze S-wave response (shear wave tranducers are optional) with relation to P-wave response, thereby calculating Poisson’s Ratio to a high level of accuracy.
Powered by a rechargeable battery, the V-Meter has been designed with on-site testing particularly in mind. It is fully portable, easy to operate and accurate. It generates low frequency ultrasonic pulses, and measures the time taken for them to travel from one transducer to the other through the material tested. Time is measured by a 10 megahertz clock, yielding a measurement capacity from 0 to 6.5 milliseconds with resolution of 100 nanoseconds.
Notes:
A common inquiry about the V-Meter Mark IV is with regards to clearing the registry and recharging the battery. See pages 74-75 for more information.
To erase/clear the test memory, see page 22 line #5.
Automatic shut-off occurs after a 10 minute idle period, except for when in the test menu and upload menu. Also, closing the lid does not cause the unit to turn off.

Introduction
www.ndtjames.com 2
Applications Homogeneity of concrete and wood
Presence of voids, cracks or other imperfections, such as honeycombs, splits, and rotting
Changes in concrete and wood which may occur with time through cement hydration, or events such as fires and/or chemical attacks
Quality of concrete and wood in relation to specified standard requirements
Strength Estimation
Crack depth determination
Young’s modulus/ Poisson’s ratio
Features Remote control – Velocilinx (new)
Direct reading of calculated P-wave velocity and S-wave velocity
Direct reading of calculated Young’s modulus of elasticity (E)
Direct reading of Poisson’s ratio (µ)
Direct digital read-out of transit time
Simple calibration; no special bar required
Portable, light weight with battery and AC power
USB output for uploading to a computer
Signal and trigger output
Rugged and splash resistant Pelican case
Internal rechargeable lithium ion battery
Wave form display on LCD

Instrument Contents List
3 www.ndtjames.com
Instrument Contents List
Each James Instruments V-Meter comes with the following items included in the carrying case.
Figure 1: V-Meter Contents

Instrument Contents List
www.ndtjames.com 4
Contents List
Item # Definition
1 V-Meter PC software CD – Used to upload data from the V-Meter to a PC.
2 V-Meter Instrument – Ultrasonic pulse velocity tester encased in a durable protective case.
3 AC / Power cord – Used to power the V-Meter and recharge the unit.
4 Two Transducers (54kHz) – Robust lead zirconate titanate ceramic piezo-electric elements mounted in stainless steel cases designed to provide highly efficient acoustic transmission.
(Note: A small charge may build up in a transducer(s) over a period of time due to the crystals being subjected to vibrations during transport. Therefore, to avoid shock from a charged transducer, care should be exercised when handling the coaxial plug.)
5 Tube of Couplant – Used on concrete or other materials having smooth surfaces to ensure adequate acoustic coupling.
6 Button Connector to Coaxial Transducer Lead Adaptor – Adaptor that connects the Receiver Button Connector to the Coaxial Transducer Leads.
7 Calibration Certificate – Certificate to confirm that the instrument has been calibrated to meet or exceed published specifications.
8 Two Coaxial Transducer Leads – Used to connect the standard transducers to the V-Meter.
9 Support Strap – Used to secure the V-Meter to the user during testing.
10 Rec Four Cable Connector – Used to connect the transducer with the switch button to the V-Meter.
11 Case – Used for carrying the V-Meter and accessories.
12 USB Cable – Used to connect the V-Meter to a PC.

V-Meter Overview
5 www.ndtjames.com
V-Meter Overview
The following is an overview of all of the external features of the V-Meter.
Figure 2: V-Meter Overview

V-Meter Overview
www.ndtjames.com 6
Instrument Connections
Item # Definition
1 Osc Trig – Time base triggering signal for external oscilloscope
2 Trans – BNC connector for transmitting transducer
3 Control Panel – V-Meter control panel.
4 Display – 320 by 240 pixel backlit display screen.
5 Osc - Output BNC connector for external oscilloscope
6 Rec – Four cable connector for receiving transducer with switch button
7 USB – Connects to the USB port location to upload data onto your PC.
8 Charger – Connects to the power supply.
The TRANS connector (2) connects to the transmitting transducer. The REC connector (6), to the receiver transducer; which is easily identified by the button on the side of the housing. The USB connector (7) connects to any PC USB port via a USB cable. The OSC connector (5) allows you to connect the instrument to an oscilloscope to analyze and identify different features of the ultrasonic signal through the material. The trigger BNC connector (1) should be used with an external oscilloscope, it is to start recording the beginning of the signal.

Control Panel
7 www.ndtjames.com
Control Panel
The following buttons appear on the James Instruments V-Meter. The instrument is controlled by the front panel keys allowing the user to navigate through the system menus.
Figure 3: V-Meter Control Panel

Control Panel
www.ndtjames.com 8
Instrument Functions The following describes the function of the buttons on the V-Meter.
Key Definition
The power button. This turns the instrument on and off.
The up arrow. Used to scroll up through the menus.
The down arrow. Used to scroll down through the menus.
The left arrow. Used to change or decrease a displayed value.
The right arrow. Used to change or increase a displayed value.
The Enter key. Used to select a menu item and save displayed values.
The Esc key. Used to exit menus and cancel selections.
The light button. Turns on and off the background light.

Instrument Display Screens
9 www.ndtjames.com
Instrument Display Screens
Test Menu Screen When the V-Meter is first turned ‘on’, the TEST MENU (below) appears on the display screen. If desired, this allows the user to run a test immediately. (Note: To get to the Main Menu of the V-Meter, press the escape key once.)
Figure 4: Test Menu

Instrument Display Screens
www.ndtjames.com 10
Item# Definition
1 Displays whether the unit is off or running and lets you choose the number of pulses sent as well as the frequency of the test. Pressing “→” changes the frequency of the pulses, pressing “←” changes the number of pulses per sequence. Pressing Enter runs and stops the test.
2 Displays the test number and whether the test is saved or not. Pressing “→” changes to SAVE ON and pressing “←” changes to SAVE OFF. When the option SAVE ON appears on the screen all the performed tests are automatically saved in memory.
3 Displays the ultrasonic signal when the option is turned on. Pressing “→” changes to SHOW PICTURE and pressing “←” changes to DO NOT SHOW PICTURE.
4 Displays the P-Distance (path distance) or the P-Velocity (pulse velocity). Pressing “→” or “←” changes between P-DISTANCE and P-VELOCITY.
This option allows the operator to measure the distance between the transducers assuming a value of distance or velocity. By pressing the Enter key, this menu allows the operator to initialize the value of either distance or velocity, regardless of the variable selected for measurement. The computer’s system then runs a few cycles to measure time, and calculates the other variable.
When a value for P-Distance is chosen the V-Meter measures for P-Velocity. When a value for P-Velocity is chosen the V-Meter measures for P-Distance.
5 Displays the current battery life in percent.
6 Displays the current date and time.
7 Displays the Pulser Voltage. The letter HV (high voltage) or LV (low voltage) indicate the voltage selection, it is recommended to use the HV option for most of the cases except when testing specimens less than 2” (5 cm) thick. Pulser Voltage can be changed in the Setup Menu.

Instrument Display Screens
11 www.ndtjames.com
Transducer Pulse Frequency
The higher the transducer pulse frequency, the narrower the beam of pulse propagation but the greater the attenuation (or damping out) of the pulse vibrations.
The pulse frequency used for testing concrete or wood is much lower than that used in metal testing. Metal testing requires high frequency pulses to provide a narrow beam of energy but such frequencies are unsuitable for use with heterogeneous and coarse grain materials because of the considerable amount of attenuation which pulses undergo when they pass through these materials.
The frequencies suitable for these materials range from about 20kHz to 250kHz. . These frequencies correspond to wavelength ranging from about 8 inches (for the lower frequency) to about .6 inches at the higher frequency. For the field testing of concrete, 50kHz is the most widely used frequency.
Pulse and Frequency Rate
This can be modified depending on what material is being test. Typically three pulses every four seconds is adequate for testing concrete and wood. A single pulse is normally adequate for ceramics and finer grained materials. Longer frequencies are useful for very dense materials. Greater number of pulses per reading is better for more porous materials (concrete with large aggregates, severely rotting wood ).
To change the pulse and frequency rate:
1. Using the keys, scroll to Test Menu and press Enter.
2. By pressing you can change the number of pulses per sequence. Available pulse choices are (1, 3, 10).
3. Pressing changes the frequency of the pulses. Available frequencies are (2, 3, 4, 5, 6, 7, 8, 9, 10 seconds, and manual).
4. Pressing starts and stops the test.

Instrument Display Screens
www.ndtjames.com 12
Setting Velocity or Distance
The velocity of ultrasonic pulses traveling in a solid material depends on the elastic properties and density of the material they are traveling though. The quality of materials is often related to their elastic stiffness so that measurement of ultrasonic pulse velocity in such materials can often be used to indicate their quality as well as to determine their elastic properties.
Materials which can be analyzed in this way include, in particular, concrete and timber but exclude all metals.
When ultrasonic testing is applied to metals, its object is to detect internal flaws which send echoes back in the direction of the incident beam and these are picked up by a receiving transducer. The measurement of time taken for the pulse to travel from a surface to a flaw and back again enables the position of the flaw to be located.
Such a technique cannot be applied to heterogeneous materials like concrete or timber since echoes are generated at the numerous boundaries of the different phases within these materials resulting in a general scattering of pulse energy in all directions.
Analyzing the quality of materials is done by accurately measuring the transit time of the ultrasonic pulses through the material being tested. The distance which the pulse travels in the material must also be measured to enable the velocity to be determined from:
Velocity = Distance/Time
In this equation, the time is supplied by the measurement system and either distance or velocity must be held as a constant. The other parameter is then the variable to be reported.

Instrument Display Screens
13 www.ndtjames.com
To set the P-Distance or P-Velocity:
1. Using the keys, scroll to Test Menu and press Enter.
2. Scroll to P-DISTANCE or P-VELOCITY and press Enter.
Pressing or changes between P-DISTANCE and P-Velocity.
3. Select the value by which the P-Distance or P-Velocity increase
or decrease by pressing .
4. Pressing decreases the value. To increase the value press
.
5. Press ESC to exit.

Instrument Display Screens
www.ndtjames.com 14
To start/stop a test:
1. Connect the V-Meter instrument to the transducers using the supplied Transducer Lead and Rec Four Cable Connector. Make sure that each transducer is securely connected and attached to the proper place on the V-Meter Instrument and that each transducer is securely fitted to its cable socket.
2. Apply couplant on each face of the transducers, making sure that the entire transducer surface is adequately covered.
3. Using the keys, scroll to Test Menu and press Enter.
4. Apply the transducers to the material surface and press Enter of the button on the side of the receiver transducer.
5. As each series of pulses passes from the transducer to the receiver transducer the ultrasonic signal appears on the display.
6. Press Enter or the button on the side of the receiver transducer to stop the test. If the transmitted pulse is not received, or when the transducers are removed from the test member the display will show the message, “NO SIGNAL”.

Instrument Display Screens
15 www.ndtjames.com
Setup Menu Screen The Setup Menu is used to set the amplifier gain, picture rate, pulser voltage, calibrate the transducers and set the density.
Figure 5: Setup Menu

Instrument Display Screens
www.ndtjames.com 16
Item# Definition
1 Displays the Amplifier Gain. Pressing “→” increases the amplifier gain and pressing “←” decreases the amplifier gain. The following amplifier gains are available (1, 5, 10, 25, 50, 100, 250, 500). The gain of 500 is recommended in order to maximize the amount of energy provided by the instrument.
In a case where wave amplitude or wave energy has to be monitored, the Amplifier Gain can be set as desire by the user, usually the maximum gain that allows the visualization of maximum amplitude of the signal on the screen is selected. Cut off the signal has to be avoided when wave amplitude is monitored.
2 Displays the Picture Rate. Pressing “→” increases the picture rate and pressing “←” decreases the picture rate. The following picture rates are available (250kHz, 500kHz, 1.0MHz, 2.0MHz).
The user can select the Picture rate, so the visualization of the wave on the screen is as desired.
3 Displays the Pulser Voltage. Pressing “→” changes the pulser voltage to high and pressing “←” changes the pulser voltage to low. High is the default value set for pulser voltage.
It is recommended to use high for most of the cases except when testing specimens less than 2” (5 cm) thick.
4 Allows the user to calibrate the system. Pressing Enter calibrates the system for the type of transducers and cables that are going to be used. In order to do so, one should place the transducers in contact with coupling agent in between and then press Enter.
5 Allows the user to set the density. Pressing Enter on the SET DENSITY option, one can set the density. Density is used in the calculation of Young’s modulus. The recommended value for normal concrete is 2400 kg/m3 or 150 lbs/ft3. This can also be accessed from the E / μ Menu.
6 Displays the current battery life in percent.
7 Displays the current date and time.

Instrument Display Screens
17 www.ndtjames.com
Calibration Screen
In order to calibrate the instrument for a given set of transducers and cables, it is necessary to determine the minimum time for the pulse to be detected by the receiver.
Note: No additional calibrations need to be made after the initial calibration unless you switch to different transducers and leads. The system takes a reading for each Amplifier Gain value and saves the result as an offset to be subtracted from all future readings
Figure 6: Calibration Menu
To calibrate the system:
1. Using the keys, scroll to SETUP MENU and press Enter.
2. Scroll to CALIB TRANSDUCERS and press Enter.
3. Place the two transducers firmly together with coupling agent between them so that they are making direct contact with one another.
4. Press Enter or the button on the side of the receiver transducer to start the calibration.
When the calibration is finished, the message “CALIBRATION IS DONE” will appear in the screen.
5. Press Esc to return to the Main menu.

Instrument Display Screens
www.ndtjames.com 18
Set Density Screen
Density is used in the calculation of Young’s modulus. The recommended value for normal concrete is 2400 kg/m3 or 150 lbs/ft3. This can also be accessed from the E / μ Menu.
Figure 7: Set Density Menu
To set the density:
1. Using the keys, scroll to SETUP MENU and press Enter.
2. Scroll to SET DENSITY and press Enter.
3. Press to move between the following values, 1, 10 ,100.
4. Using the or arrow keys, increase or decrease the density by the increment you are on.
5. Press Esc to confirm any changes.

Instrument Display Screens
19 www.ndtjames.com
Review Menu Screen The Review Menu is used to review the test results and obtain detailed information about the test.
Figure 8: Review Menu
To select the review number:
1. Using the keys, scroll to REVIEW MENU and press Enter.
2. Pressing or increases and decreases the test number.
3. Scroll to RECORD DETAILS to see detailed information about the test.

Instrument Display Screens
www.ndtjames.com 20
Figure 9: Review Menu Record Details
1. Press Enter to see the ultrasonic signal of the data.
Figure 10: Review Menu Ultrasonic Signal
4. Press ESC to go back to the record.

Instrument Display Screens
21 www.ndtjames.com
System Menu Screen The System Menu is used to change the display color, language of choice, units, time and date, and battery operations can be chosen. Any saved data can also be erased from this menu.
Figure 11: System Menu

Instrument Display Screens
www.ndtjames.com 22
Item# Definition
1 Displays the background color. Pressing “→” or “←” changes the display setting from a white background with black highlighted text to a black background with white highlighted text.
2 Displays the operating language. Pressing “→” or “←” changes the operating language. English or Spanish are the two languages available.
3 Displays the units in which the instrument operates. Pressing “→” or “←” changes from Imperial units to Metric units.
4 Allows the user to change the date and time. Pressing Enter will allow the user to change the displayed date and time.
5 Allows the user to erase the memory. Pressing Enter twice erases any and all information saved in the memory of the device.
System memory has capacity to save up to 1800 tests, when test number reaches 1800, the system will overwrite test number 1 and so on. To avoid losing test data the user should upload the data to a computer and then erase the V-Meter memory.
6 Displays the charge/discharge value of the battery. Note: When fully charged the battery will operate the instrument for 4 hours. A discharged battery should be charged at the full rate for 6-8 hours. Connect the instrument to the AC mains supply and leave it off for the required time.
7 Displays the current battery life in percent.
8 Displays the current date and time.

Instrument Display Screens
23 www.ndtjames.com
Clock Set Menu Screen
From this menu the date and time can be changed.
To adjust the date and time:
1. Using the keys, scroll to SYSTEM MENU | CLOCK MENU and press Enter.
2. Press to move between the hour, minute, month, date, and year.
Figure 12: Clock Set Menu
3. Using the or arrow keys, set the current hour, minute, month, date, and year.
4. Press Enter to confirm any changes.

Instrument Display Screens
www.ndtjames.com 24
Battery Status (Operations) Screen
On this menu, the battery status can be viewed. When the instrument is using the battery, the “discharge ctr” counter should increase and the “charge ctr” counter should remain constant. The instrument can be operated from the AC mains by plugging the AC charge cable into the plug on the front panel. When the instrument is plugged to the AC mains, the “charge ctr” counter should increase and the “discharge ctr” counter should remain constant.
Figure 13: Battery Status Menu
(Note: Press ‘enter’ once while in this screen to reset its counters. This should be done preferably after a full charge is done; as the battery % will become 100%.)

Instrument Display Screens
25 www.ndtjames.com
E / μ Menu Screen On this menu, you can select the units that the instrument will display. When selecting Imperial Units, the parameters will be shown in imperial units. When Metric is selected, the parameters will be displayed in Millimeters.
Figure 14: E / μ Menu

Instrument Display Screens
www.ndtjames.com 26
Item# Definition
1 WAVE TYPE – Pressing “→” or “←” changes the wave type.
The system allows selection of Compression (P) or Transverse (S) waves. The system cannot detect which type of wave is being monitored. It is necessary, therefore, for the operator to specify the type of wave, in order for the functions μ (Dynamic Poisson’s Ratio) and E (Dynamic Young’s modulus of Elasticity) to be determined properly.
2 DENSITY – Density is used in the calculation of Young’s modulus. The recommended value for normal concrete is 2400 kg/m3 or 150 lbs/ft3. This can also be accessed from the Setup Menu.
3 E/µ-TYPE – This item gives the operator three choices for calculating µ.
Simple E
Derived μ: μ is calculated after each reading.
Arbitrary μ: μ is set by the operator (for concrete, μ = 0.17 is recommended), and held as a constant.

Instrument Display Screens
27 www.ndtjames.com
E/µ-TYPE
Young's modulus (E) is a measure of the stiffness of an isotropic elastic material. It is the coefficient of elasticity of a substance, expressing the ratio between a stress that acts to change the length of a body and the fractional change in length caused by this force.
Young’s modulus can be calculated by two methods, the simpler of the two being an approximation to the other.
Method Formula
Simple
E = g
VP
144
2
If this method is chosen (no µ ), the wave type
must be P.
Arbitrary
E = g
VP
144
2
µ-1
2µ)-µ)(11(
If this method is chosen (no µ ), the wave type
must be P.
Scrolling to Adjust µ and pressing “→”
increases the µ value while pressing “←”
decreases the µ value.
Derived
µ = )(2
222
22
SP
SP
VV
VV
E = g
VP
144
2
µ-1
2µ)-µ)(11(
This method requires that the system is equipped with transducers for both P and S type waves. When both velocity types can be measured this method should be used, and will generally yield the best accuracy.

Instrument Display Screens
www.ndtjames.com 28
Item Definition
E Young’s Modulus of Elasticity
2PV
Square of compression wave (P) wave velocity (ft/s)
PV Velocity of the compression (P) wave
SV Velocity of the transverse (S) wave
Density of the medium (lbs/ft3)
g Acceleration due to gravity
Poisson’s Ratio (μ) is the ratio of the contraction or transverse strain (perpendicular to the applied load), to the extension or axial strain (in the direction of the applied load).
Poisson’s Ratio can be determined using the following equation:
Item Definition
V Resulting Poisson’s Ratio
x Transverse Strain, - for axial tension, + for axial compression
y Axial Strain, + for axial tension, - for axial compression
y
xV
Instrument Display Screens
29 www.ndtjames.com
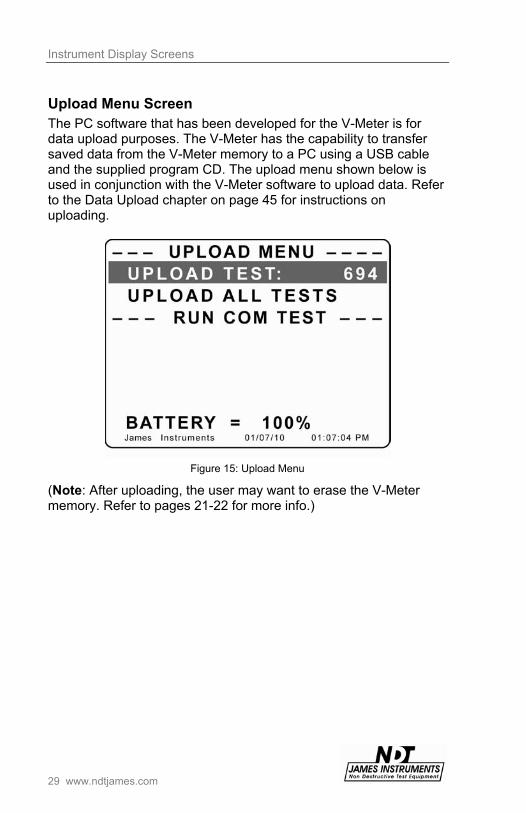
Upload Menu Screen The PC software that has been developed for the V-Meter is for data upload purposes. The V-Meter has the capability to transfer saved data from the V-Meter memory to a PC using a USB cable and the supplied program CD. The upload menu shown below is used in conjunction with the V-Meter software to upload data. Refer to the Data Upload chapter on page 45 for instructions on uploading.
Figure 15: Upload Menu
(Note: After uploading, the user may want to erase the V-Meter memory. Refer to pages 21-22 for more info.)

Transducer Basics
www.ndtjames.com 30
Transducer Basics
Transducers and Leads The transducers consist of piezo-electric elements mounted in stainless steel cases. These elements are tightly held to the inside face of the transducer housing; to provide a highly efficient acoustic transmission. The transducer assembly is rugged enough to withstand reasonably rough conditions, as can be seen in an industrial environment.
The high voltage excitation of the pulse generator causes the transducer to oscillate mechanically at its own natural frequency. This frequency varies according to the size and stiffness of the whole transducer assembly. Different sizes of piezoelectric elements and cases also enable different pulse frequencies to be obtained.
Each transducer is fitted with a cable socket to enable it to be detached, and allow for cables of different length to be used.
Short co-axial cables used for connecting the transducers to the V-Meter are supplied with the instrument. Longer cables can be used when access to the test areas is restricted. These longer cables may reduce the size of both the transmitted pulse and the receiving signal, yet these are generally of adequate magnitude for testing; even when the cables are 25 ft. long. In fact, cable lengths of up to 20 meters(approximately 60 feet) have been successfully used with the optional pre-amp (V-C-4896).
(Note: When using extra long leads, try to prevent the leads from coming into close contact with each other when the transit time measurement is being taken. Otherwise, it is possible for the receiver lead to pick up unwanted signals from the transmitter lead resulting in an incorrect display of transit time. Such incorrect displays are readily detected by their instability and may be corrected by simply separating the leads.)

Transducer Basics
31 www.ndtjames.com
Types of Transducers Different transducers are used depending on the substrate being tested. The user should be aware that using the wrong transducer for an application can lead to misleading results. If a low frequency transducer (24kHz for example) is used where the aggregate being tested is of a finer grade, the V-Meter could claim that there are no issues with the substrate when there could be. Similarly, if a high frequency transducer (150 or 500kHz) is used where the aggregate is too large, the V-Meter may claim that there are issues in the substrate when there might not be. Below is a list of available transducers. 24kHz: Used for larger (softball sized) aggregates. Range is up to 16 feet without Pre-Amp.
Figure 16: 24kHz Transducer
Transducer Basics
www.ndtjames.com 32
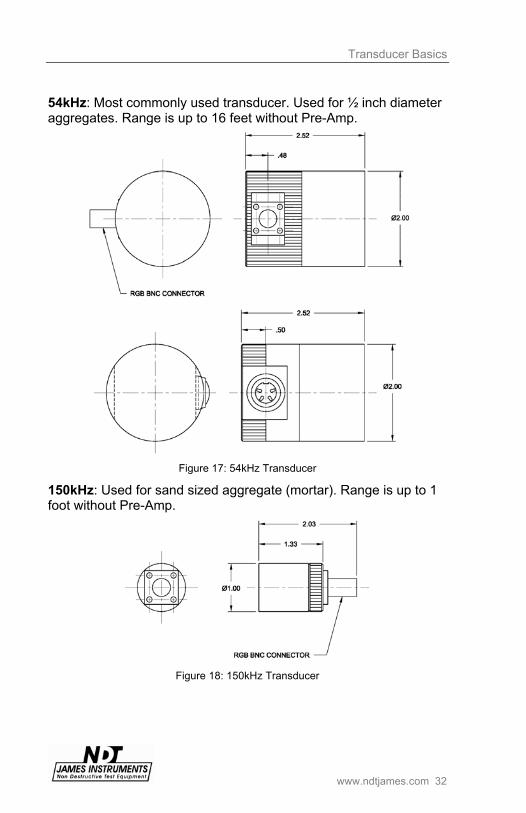
54kHz: Most commonly used transducer. Used for ½ inch diameter aggregates. Range is up to 16 feet without Pre-Amp.
Figure 17: 54kHz Transducer
150kHz: Used for sand sized aggregate (mortar). Range is up to 1 foot without Pre-Amp.
Figure 18: 150kHz Transducer

Transducer Basics
33 www.ndtjames.com
500kHz: Used for very small aggregate (ceramic and glass). Range is up to 1 foot without Pre-Amp.
Figure 19: 500kHz Transducer
Shear Wave: Used for finding non-homogenous conditions of a surface. Space the transducers 1 foot apart with the lines facing each other. No Pre-Amp required.
Figure 20: Shear Wave Transducer
Transducer Basics
www.ndtjames.com 34
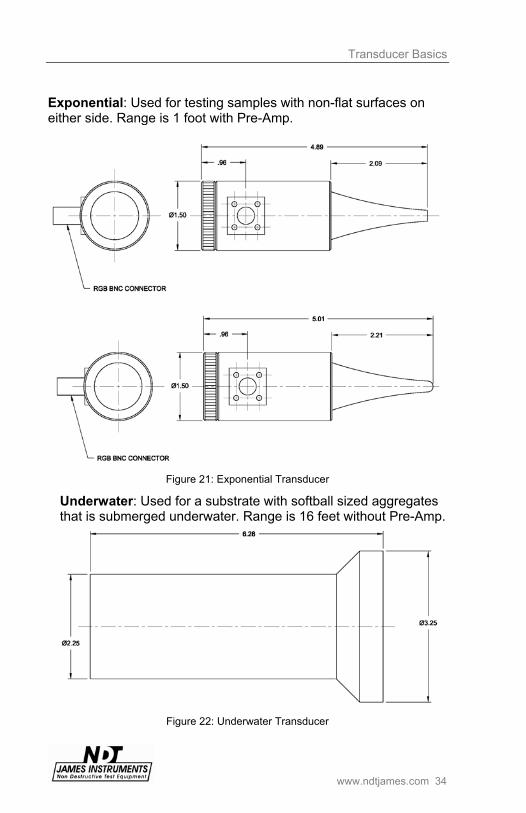
Exponential: Used for testing samples with non-flat surfaces on either side. Range is 1 foot with Pre-Amp.
Figure 21: Exponential Transducer
Underwater: Used for a substrate with softball sized aggregates that is submerged underwater. Range is 16 feet without Pre-Amp.
Figure 22: Underwater Transducer

Transducer Basics
35 www.ndtjames.com
Placing Transducers It is possible to take measurements of pulse velocity by placing the transducers in three alternative positions:
Figure 23: Transducer Positions

Transducer Basics
www.ndtjames.com 36
Item# Definition
1 Direct transmission with transducers on opposite faces of the material.
This is the most sensitive method as the receiving transducer will receive maximum energy from the transmitted pulse. Since the longitudinal pulses leaving the transmitter are propagated mainly in the direction normal to the transducer face. The travel time is affected by the concrete condition along the thickness of the member.
2 Semi-direct transmission with transducers on adjacent faces. This is the next preferred method.
3 Indirect or surface transmission with the transducers on the same face.
This should be used only when it is impossible to have access to two faces of the material under test. The received amplitude of the method, for the same path length, is only about 2% of that received signal when using the direct method.
The indirect arrangement is possible because the ultrasonic beam of energy is scattered by discontinuities within the material tested. Travel time is affected only by the properties of the concrete very near to the surface.

Transducer Basics
37 www.ndtjames.com
Couplant Be sure to use couplant between the face’s of the transducers and the material when calibrating and using the instrument. Failure to do so will result in a loss of signal due to inadequate acoustic coupling.
Silicone grease, medium bearing grease or liquid soap provide good coupling when used on concrete or other materials having smooth surfaces. For rougher surfaces, water pump grease or thick petroleum jelly is recommended.
For a concrete surface formed by casting against steel or other smooth forms, good coupling can be obtained if the surface is free from dust and grit and covered with a light or medium grease or other suitable couplant. A wet surface may present problems between the water on the surface and the couplant. It should be dried successfully by using compressed air.
If the surface is fairly rough, thicker grease should be used but very rough surfaces require more preparation. In such cases, the surface should be ground flat over an area large enough to accommodate the transducers’ face. This area may also be raised to a level/smooth surface with a minimum thickness of a suitable material such as plaster, cement mortar or epoxy resin.
If the value of the transit time displayed remains constant to within ±1% when the transducers are applied and reapplied to the concrete surface, it is a good indication that satisfactory coupling has been achieved.

Using the V-Meter on Location
www.ndtjames.com 38
Using the V-Meter on Location
Removing the Lid For easier accessibility and less interference, the V-Meter lid can be removed. With the lid fully opened up the cover then can be carefully pushed off the hinge pins.
Using the Support Straps The V-Meter support strap can be used to hold the V-Meter once the V-Meter lid has been removed. When using the V-Meter support straps, make sure that an eyelet hook is connected to each corner of the V-Meter. Two of the hooks clip to the o-rings, while the other two clip around the hinge pins.
To put on V-meter support strap:
1. Attach the straight portion of the support strap to the two metal o-rings of the V-Meter.
2. Attach the two straps stitched to the straight portion of the V-Meter to the exposed hinges that the cover latches on to.
3. Pull the supplied support strap over your neck so that the rubber guard is resting on your neck.
4. Adjust the strap so that the V-Meter is within easy reach and readable. (see Figure 24)

Velocilinx Introduction
39 www.ndtjames.com
Figure 24: V-Meter Support Strap

Velocilinx Introduction
www.ndtjames.com 40
Velocilinx Introduction
The V-Meter’s Velocilinx software enables the user to upload data from the V-Meter device to a PC. The saved data can be read in and graphed. Velocilinx also can be used to control the V-Meter remotely. Configuration settings can be adjusted, and new data sets can be collected, all remotely. When commanded remotely to take a new set of data measurements, the V-Meter will upload the new data to the PC, and the Data Handler will automatically save the data to a file. Existing individual data sets can also be uploaded and graphed to further analyze the V-Meter data. The addition of the remote control functionality makes the V-Meter a very powerful tool.
Features The ability to execute a test remotely.
The ability to review and graph test data.
The ability to adjust Test menu, Setup menu, and E/Mu menu parameters. These items include: the amplifier gain, the picture rate, the pulser voltage, the E or Mu calculation method, the material density, the measurement mode, the materials travel distance or time, the cycle time, and the number of pulses per sequence.
Minimum System Requirements
Velocilinx V-C-410 Operating System Windows Vista or Windows 7
Memory 1 GB RAM
Processor 1 GHz Pentium class processor
Capacity 1 MB hard drive space

Velocilinx Overview
41 www.ndtjames.com
Velocilinx Overview
The following is an overview of all of the features of the Velocilinx software.
Figure 25: Velocilinx Overview

Velocilinx Overview
www.ndtjames.com 42
Software Functions
Key Definition
The “Open” command (Ctrl+O) – Opens a previously uploaded text file.
The “Save” command (Ctrl+S) – Saves uploaded data to a text file.
The “Remote Control” command (Ctrl+R) – Opens the “Remote Control Commands” menu.
The “Upload” command (Ctrl+U) – Uploads data from the V-Meter to the Velocilinx program.

Software Installation
43 www.ndtjames.com
Software Installation
The PC software that has been developed for the V-Meter is for data upload purposes. To install the software on your PC follow these instructions.
To install the software: 1. Insert the V-Meter PC Software CD into the CD-ROM drive.
2. If the CD does not load the setup automatically, go to My Computer, double click on the CD under devices and double click on setup.exe.
Figure 26: Installation File Location

Software Installation
www.ndtjames.com 44
3. The InstallShield Wizard checks for the operating system you are using.
Figure 27: InstallShield Wizard
4. The InstallShield Wizard dialog appears. Click Next to proceed.
Figure 28: InstallShield Wizard
Software Installation
45 www.ndtjames.com
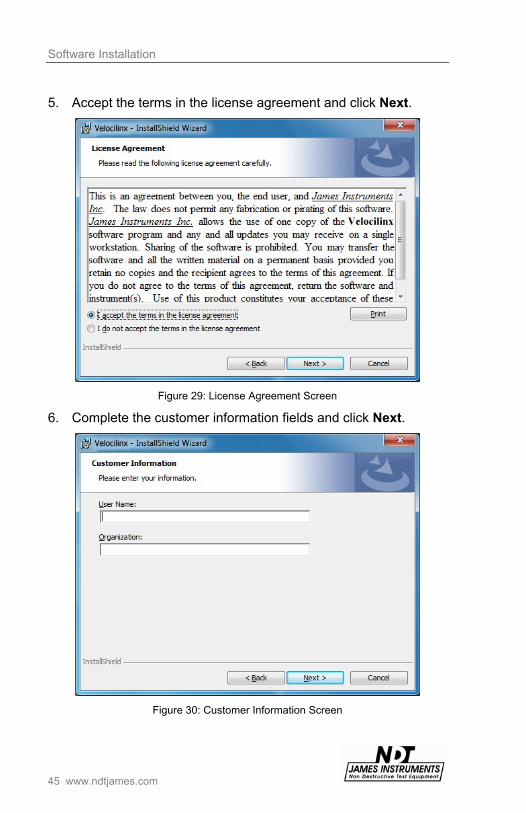
5. Accept the terms in the license agreement and click Next.
Figure 29: License Agreement Screen
6. Complete the customer information fields and click Next.
Figure 30: Customer Information Screen

Software Installation
www.ndtjames.com 46
7. The InstallShield Wizard confirms your installation. Click Install to continue.
Figure 31: InstallShield Wizard Confirmation
8. The installation progress screen appears.
Figure 32: Installation Progress Screen
Software Installation
47 www.ndtjames.com
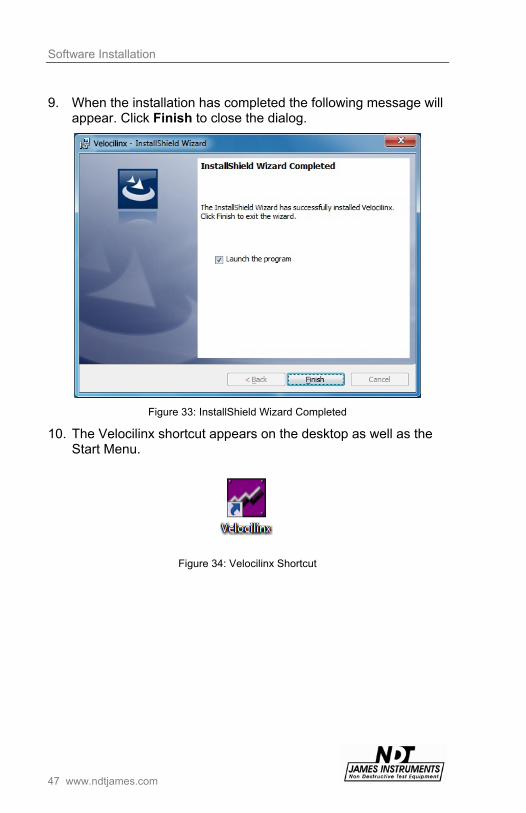
9. When the installation has completed the following message will appear. Click Finish to close the dialog.
Figure 33: InstallShield Wizard Completed
10. The Velocilinx shortcut appears on the desktop as well as the Start Menu.
Figure 34: Velocilinx Shortcut

Data Upload
www.ndtjames.com 48
Data Upload
Traditional Data Upload
Figure 35: Velocilinx
Set To English Before uploading data, the V-Meter should be set to English. This is done on the V-Meter by selecting System menu and pressing enter, and then going to the Language item. Use the left and right arrow keys to toggle the language to English. Set COM Port Configure the COM port by clicking on the main window’s Tools menu and pulling down to the appropriate COM port. The port number chosen should match the value assigned via the PC’s Device Manager.

Data Upload
49 www.ndtjames.com
Press Lightning Bolt After setting the COM port, press the lightning bolt to prepare the PC to receive data. Upload Data Immediately after pressing the lightning bolt, press the enter button on the V-Meter to complete the appropriate data upload transaction. This is accomplished by going to the V-Meter’s Upload menu and choosing the desired data set via the scroll arrows prior to hitting the enter button.
Graphing Saved Data Uploaded data that has been uploaded via the Remote Control window can be graphed. Go to the main window’s File menu and pull down to Open. Browse to the location of the saved data file and choose the desired file. The data will be graphed in a new window.
Figure 36: Graphed Data

Remote Control
www.ndtjames.com 50
Remote Control
Remote Control Features
Figure 37: Remote Control Commands
The V-Meter can be controlled remotely. The remote control feature enables this functionality. The remote control functionality starts with the Remote Control Commands window. To bring up the Remote Control Commands window, go to the Tools menu and pull down to Remote Control. Alternatively, the user can press Ctrl+R or just press on the Remote Control icon. Test Menu Commands 1. Pulses Per Sequence – Available options are 1, 3, and 10
pulses per sequence.
2. Cycle Time – The cycle time can vary in integer amounts from 2 to 10 seconds.
3. Save Test Data – Indicate data retention preference.
4. Measurement Mode – Choose between distance and velocity for the measurement mode. “P” or “S” will be displayed as a prefix based on the choice of wave type (compression (P) or shear (S) wave). As a result, there are four different measurement modes: P-Distance, P-Velocity, S-Distance, and S-Velocity.
Remote Control
51 www.ndtjames.com
5. Material Travel – Set the value associated with the measurement mode. For distance measurements, the value can be 0.1 inches to 600 inches. For velocity measurements, the value can be 1000 to 40000 ft./s.
6. Display Signal – Indicate V-Meter graphing preference. Setup Menu Commands 1. Amplifier Gain – Valid amplifier gain choices are 1, 5, 10, 25,
50, 100, 250, and 500.
2. Picture Rate – The picture rate can be picked from amongst 250kHz, 500kHz, 1MHz, and 2MHz.
3. Pulser Voltage – The pulser voltage can be set to either the low or the high setting.
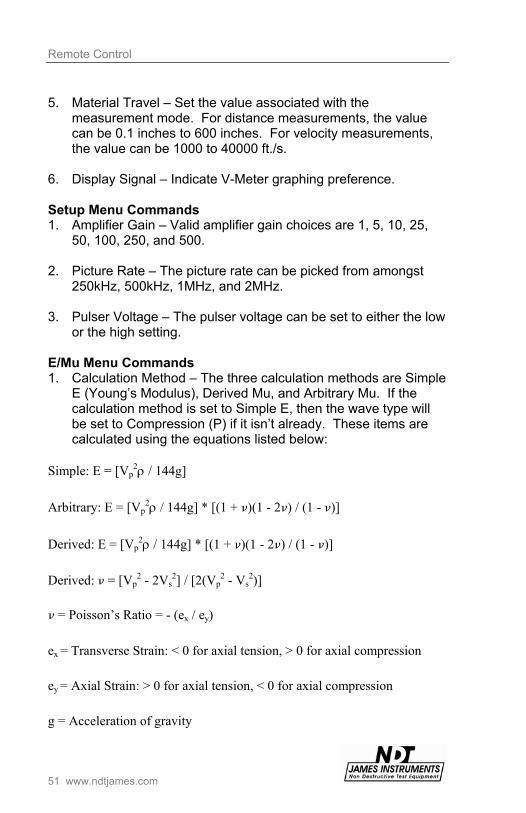
E/Mu Menu Commands 1. Calculation Method – The three calculation methods are Simple
E (Young’s Modulus), Derived Mu, and Arbitrary Mu. If the calculation method is set to Simple E, then the wave type will be set to Compression (P) if it isn’t already. These items are calculated using the equations listed below:
Simple: E = [Vp
2 / 144g]
Arbitrary: E = [Vp2 / 144g] * [(1 + )(1 - 2) / (1 - )]
Derived: E = [Vp2144g] * [(1 + )(1 - 2) / (1 - )]
Derived: = [Vp
2 - 2Vs2] / [2(Vp
2 - Vs2)]
= Poisson’s Ratio = - (ex / ey) ex = Transverse Strain: < 0 for axial tension, > 0 for axial compression ey = Axial Strain: > 0 for axial tension, < 0 for axial compression g = Acceleration of gravity

V-Meter Applications
www.ndtjames.com 52
= Density of material Vp = Velocity of a compression wave VS = Velocity of a sheer wave 2. Material Density – The material density can be set between 50
lbs./ft.3 and 500lbs./ft.3. 3. Wave Type – The wave type can be either Compression (P) or
Transverse (S). Toggling between these options will change the prefix for the Measurement Mode. If the wave type is set to Transverse (S), then the calculation method is set to Derived (µ).
Test Execution Command Set the number of test sets to acquire and then press the Start button. The V-Meter will acquire the appropriate number of test sets and send the data set uplink one at a time. Each set of data will be saved in a separate file on the PC and then graphed. Review Menu Command Set the data set number to the desired value and then press the Update button. The data set will be requested from the V-Meter, and it will be displayed on the PC if appropriate.
V-Meter Applications
53 www.ndtjames.com
V-Meter Applications
History of Pulse Velocity Testing This method of testing was originally developed for use on concrete and the published accounts of its application are concerned predominately with this material.
A considerable volume of literature has been published over the past 60 years describing the results of research on the use of ultrasonic testing for concrete and for further details of this application the reader is referred to the selected list given at the end of this work.
The method was first developed in Canada by Leslie and Cheesman between 1945 and 1949 and also independently in Britain at about the same time by Jones and Gatfield. The apparatus developed at that time made use of a cathode- ray oscilloscope for the measurement of transit times and modified forms of this equipment have been widely used in many countries. The equipment was particularly useful in the laboratory but was less easy to use under field conditions.
The apparatus described in this Manual has been designed particularly for field testing, being light, portable and simple to use. It can be operated independently of the main power supply when used in the field and directly from the A.C. supply for laboratory use.
ASTM has the specification ASTM C-597 for the use of this method since 1967 and the British Standards Institution has issued “Recommendations for Measurement of Velocity of Ultrasonic Pulses in Concrete. B.S. 1881: Part 203. 1986”.
Ultrasonic testing is now widely used throughout the world and it is clear that the advantages of this method over traditional methods of testing are likely to increase further its application. In particular its ability to examine the state of concrete in depth is unrivaled.

V-Meter Applications
www.ndtjames.com 54
Application of Pulse Velocity Testing The pulse velocity method has been shown to provide a reliable means of estimating the strength of timber and has been used to test various kinds of timber products. It is in use for the detection of rot in utility poles and provides a very economic method of inspecting these poles while in service.
The same equipment can be used to test rock strata and to provide useful data for geological survey work. The method has also been used for testing graphite, ceramics and any coarse grain materials and it is likely that it will prove useful for testing other non-metallic materials.
Detection of Defects When an ultrasonic pulse traveling through concrete meets a concrete-air interface, there is a negligible transmission of energy across this interface so that any air filled crack or void lying directly between the transducers will obstruct the direct beam of ultrasound when the void has a projected area larger than the area of the transducer faces. The first pulse to arrive at the receiving transducer will have been diffracted around the periphery of the defect and the transit time will be longer than in similar concrete with no defect.
Figure 38: Defect Detection
It is sometimes possible to make use of this effect for locating flaws, honeycombing, etc. but it should be appreciated that small defects often have little or no effect on transmission times.

V-Meter Applications
55 www.ndtjames.com
Detection of Large Voids or Cavities A large cavity may be detected by measuring the transit times of pulses passing between the transducers when they are placed in suitable positions so that the cavity lies in the direct path between them. The size and position of such cavities may be estimated by assuming that the pulses pass along the shortest path between the transducers and around the cavity. Such estimates are more reliable if the cavity has a well defined boundary surrounded by uniformly dense concrete.
Figure 39: Large Void or Cavity Detection
If the projected area of the cavity is smaller than the diameter of the transducers, the cavity cannot be detected by transit time measurement alone.
V-Meter Applications
www.ndtjames.com 56
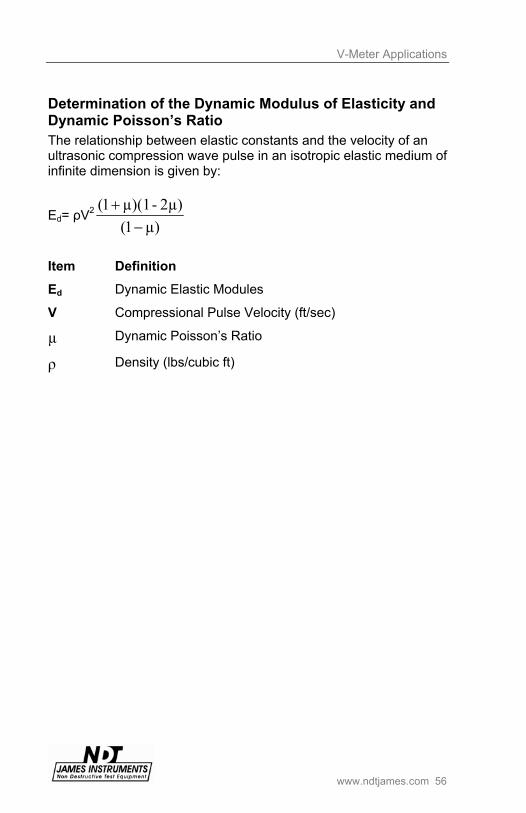
Determination of the Dynamic Modulus of Elasticity and Dynamic Poisson’s Ratio The relationship between elastic constants and the velocity of an ultrasonic compression wave pulse in an isotropic elastic medium of infinite dimension is given by:
Ed= ρV2
µ)1(
2µ)-µ)(11(
Item Definition
Ed Dynamic Elastic Modules
V Compressional Pulse Velocity (ft/sec)
µ Dynamic Poisson’s Ratio
ρ Density (lbs/cubic ft)
V-Meter Applications
57 www.ndtjames.com
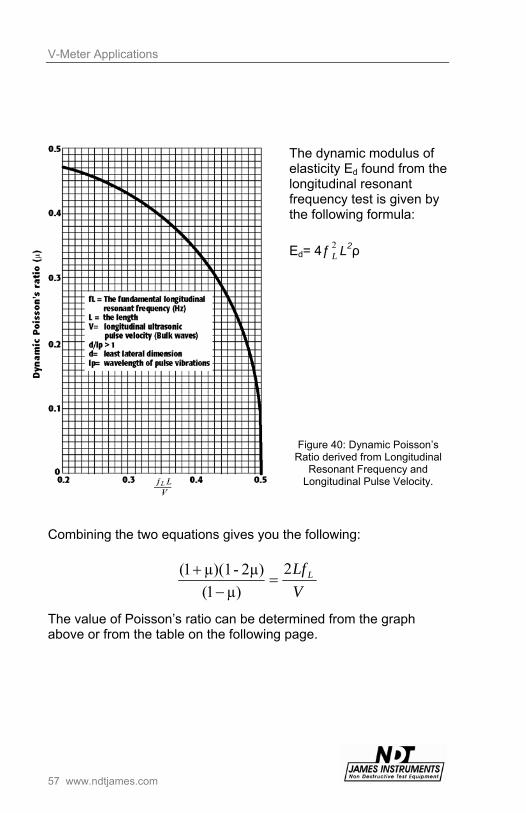
The dynamic modulus of elasticity Ed found from the longitudinal resonant frequency test is given by the following formula:
Ed= 4ƒ 2L L2ρ
Figure 40: Dynamic Poisson’s Ratio derived from Longitudinal
Resonant Frequency and Longitudinal Pulse Velocity.
Combining the two equations gives you the following:
V
Lf L2
µ)1(
2µ)-µ)(11(
The value of Poisson’s ratio can be determined from the graph above or from the table on the following page.

V-Meter Applications
www.ndtjames.com 58
The value of the longitudinal resonant frequency fL2f laboratory prisms, may be obtained by use of the E-Meter Mk II resonant frequency test equipment which fully complies with the ASTMC 215 standards.
V
Lf L
µ
.257
.342
.395
.431
.456
.474
.487
.494
.499
.45
.40
.35
.30
.25
.20
.15
.10
.05

V-Meter Applications
59 www.ndtjames.com
Estimation the Depth of the Surface Cracks An estimate of the depth of a crack visible at the surface can be obtained by measuring the transit times across the crack for two different arrangements of the transducers placed on the surface.
One suitable arrangement is shown in Figure 41, in which the transmitting and receiving transducers are placed on opposite sides of the crack and equidistant from it. Two values of x are chosen, one being twice that of the other, and the transit times corresponding to these are measured.
The equation given below is derived by assuming that the plane of the crack is perpendicular to the concrete surface and that the concrete in the vicinity of the crack is of reasonably uniform quality.
C= 2
12
2
22
21
1
4
TT
TTX
Figure 41: Estimate of Crack Depth
Let first value of x chosen be X1 and second value be 2 X1 and the transit times corresponding to these be T1 and T2 respectively, then place both transducers near to the crack and on opposite sides of it.
Move one of them away from the crack. If the transit time decreases this indicates that the crack slopes towards the direction in which the transducer was moved.

V-Meter Applications
www.ndtjames.com 60
Figure 42: Inclination of Crack
A check may be made to assess whether the crack is lying in a plane perpendicular to the surface by placing both transducers near to the crack and moving one of them away.
h=
2
1
1
2
2 T
T
T
TL
Figure 43: Determination of Crack Depth
Figure 44: Determination of Crack Depth
V-Meter Applications
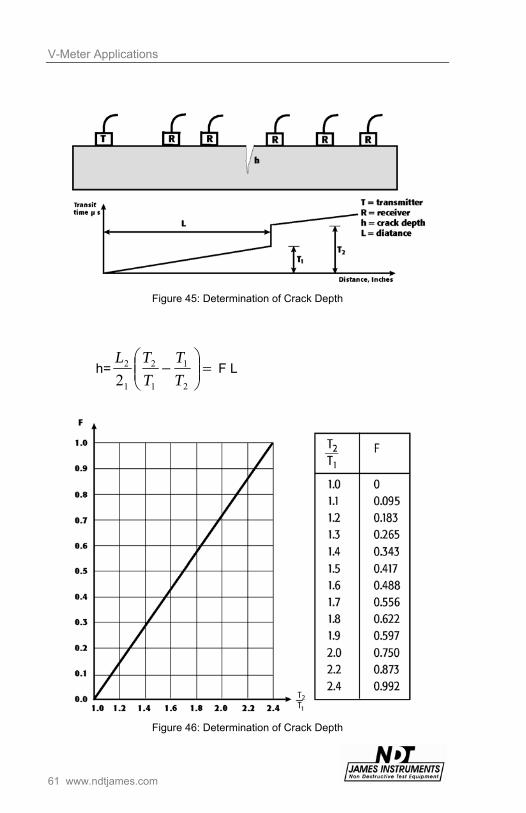
61 www.ndtjames.com
Figure 45: Determination of Crack Depth
h=
2
1
1
2
1
2
2 T
T
T
TL F L
Figure 46: Determination of Crack Depth

V-Meter Applications
www.ndtjames.com 62
It is important that the distance x be measured accurately and that very good coupling is achieved between the transducers and the concrete surface. The method is valid provided the crack is not filled with water.
Estimation of Elastic Modulus The estimating of elastic modulus is less complicated than the estimation of strength and it has been found that a single curve may be used to relate pulse velocity to elastic modulus for a wide range of different aggregates, including concrete made with lightweight aggregate.
Figure 47: Curves relating Pulse Velocity with Static and Dynamic Elastic Modulus
The figure above shows the curves which may be used to determined both static and dynamic elastic modulus from pulse velocity measurements.

V-Meter Applications
63 www.ndtjames.com
The following table shows the empirical relationship between static and dynamic modulus of elasticity and pulse velocity.
Pulse Velocity Modulus of Elasticity
Dynamic Static
ft/sec Psi Psi
11801
12464
13120
13776
14432
15088
15744
16400
3.48X10⁶
3.77
4.21
4.64
5.22
6.09
7.11
8.41
1.89X10⁶
2.18
2.61
3.19
3.92
4.93
6.24
7.54
Estimation of Strength Concrete quality is generally assessed by measuring its cylinder (or cube) crushing strength. It has been found that there is no simple correlation between cylinder strength and pulse velocity but the correlation is affected by:
Type of aggregate
Aggregate/cement Ratio
Age of concrete
Size and grading of aggregate
Curing conditions
Fuller details of the effects of these may be found in references and S. Garg and S. Shah developed a prediction equation.
fc = -6364.74 + 15089.27 (Vel.)-016 - 221.05 (Cem. )-068 - .065
(Sand)1.75 - .815 x 10-7 (agg)3.5 -0.95 x 10⁻⁹
(Wtr)5.0

V-Meter Applications
www.ndtjames.com 64
Item Definition
Vel. Velocity in ft/sec.
Cem Cement lbs/cubic yard
Sand Sand lbs/cubic yard
Wtr Water lbs/cubic yard
fc In PSI
In practice, if pulse velocity results are to be expressed as equivalent cylinder strengths, it is preferable to calibrate the particular concrete used by making a series of test specimens with materials and mix proportions the same as the specified concrete but having a range of strengths. The pulse velocity is measured for each specimen, which is then tested to failure by compressive strength testing machine.
The range of strength may be obtained either by varying the age of the concrete at test or by introducing a range of water-cement ratios. The curve relating cylinder strength to pulse velocity is not likely to be the same for these two methods of varying strength but the particular method chosen should be appropriate to the test purpose required.
If strength monitoring with time is to be carried out, the calibration curve is best obtained by varying the age but a check on quality at a particular age would require the correlation to be obtained by varying the water-cement ratio.
Figure 48: Pulse Velocity Measure Along Different Directions of the Beam
V-Meter Applications
65 www.ndtjames.com
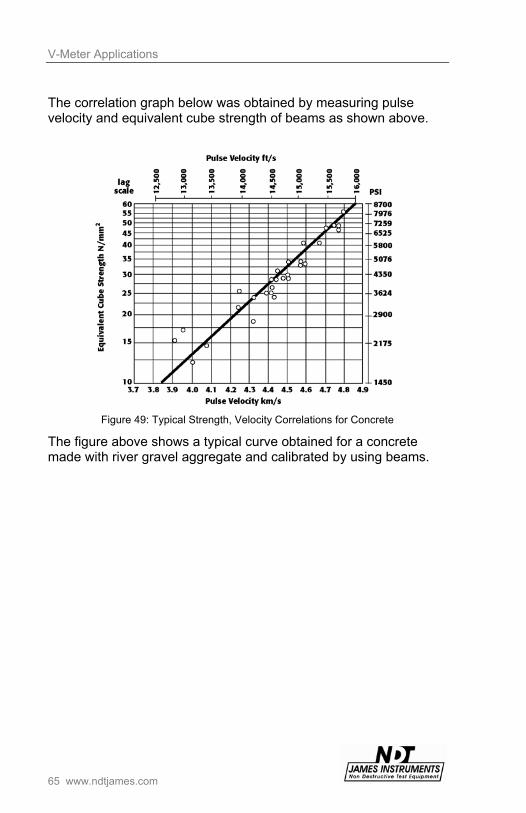
The correlation graph below was obtained by measuring pulse velocity and equivalent cube strength of beams as shown above.
Figure 49: Typical Strength, Velocity Correlations for Concrete
The figure above shows a typical curve obtained for a concrete made with river gravel aggregate and calibrated by using beams.

V-Meter Applications
www.ndtjames.com 66
Figure 50: Typical Correlation Curves Obtained for 1:6 Gravel Aggregate Concrete,
Cured in Water.
The figure above shows further typical correlation curves including one for modulus of rupture and these are for a 1:6 mix using gravel aggregate concrete.
Although such correlations can be obtained from tests on cylinders, it is preferred in Europe to use beams such as those used for testing the modulus of rupture of concrete. These beams are 500 mm long and more accurate value of pulse velocity is obtained by using the long axis as the pulse path. After testing ultrasonically, the beams are tested in flexure to determine the modules of rupture and the broken halves tested by crushing to measure the equivalent cube strength.

V-Meter Applications
67 www.ndtjames.com
When testing the concrete in a structure, it would be unreasonable to expect the value of the cylinder strength estimated from pulse velocity measurements to be the same as that specified for the control cylinders made on the site since the design of concrete structures takes into account the fact that cylinder are likely to be of higher strength than the concrete in the structure which it represents. A suitable tolerance is therefore required to allow for this. This subject is discussed more fully in other reference.
Instead of expressing the strength in terms of cylinder strength, it is preferable to obtain a direct correlation between the strength of a structural member and the pulse velocity whenever this is possible. Such correlation can often be readily applied to precast units and it is possible to obtain a curve relating pulse velocity with the appropriate mechanical test (such as bending) for the unit.
V-Meter Applications
www.ndtjames.com 68
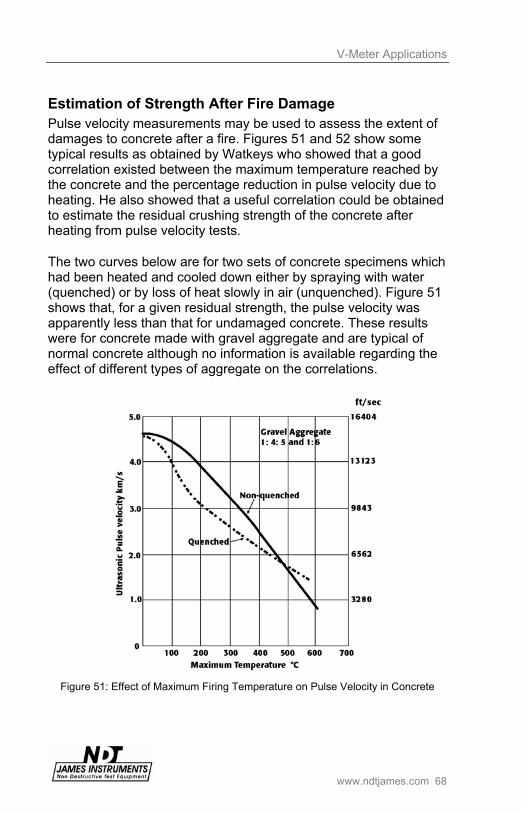
Estimation of Strength After Fire Damage Pulse velocity measurements may be used to assess the extent of damages to concrete after a fire. Figures 51 and 52 show some typical results as obtained by Watkeys who showed that a good correlation existed between the maximum temperature reached by the concrete and the percentage reduction in pulse velocity due to heating. He also showed that a useful correlation could be obtained to estimate the residual crushing strength of the concrete after heating from pulse velocity tests.
The two curves below are for two sets of concrete specimens which had been heated and cooled down either by spraying with water (quenched) or by loss of heat slowly in air (unquenched). Figure 51 shows that, for a given residual strength, the pulse velocity was apparently less than that for undamaged concrete. These results were for concrete made with gravel aggregate and are typical of normal concrete although no information is available regarding the effect of different types of aggregate on the correlations.
Figure 51: Effect of Maximum Firing Temperature on Pulse Velocity in Concrete

V-Meter Applications
69 www.ndtjames.com
Figure 52: Strength / Pulse Velocity Curve for Concrete Damaged by Fire
Homogeneity of Concrete Measurement of pulse velocities at points on a regular grid on the surface of a concrete structure provides a reliable method of assessing the homogeneity of the concrete. The size of the grid chosen will depend on the size of the structure and the amount of variability encountered.
It is useful to plot a diagram of pulse velocity contours from the results obtained, since this gives a clear picture of the extent of variations. It should be appreciated that the path length can influence the extent of the variations recorded because the pulse velocity measurements correspond to the average quality of the concrete along the line of the pulse path and the size of concrete sample tested at each location is directly related to the path length.

V-Meter Applications
www.ndtjames.com 70
Influence of Test Conditions The pulse velocity in concrete may be influenced by:
Path length
Lateral dimensions of the specimen tested
Presence of reinforcing steel
Moisture content of the concrete
The influence of path length will be negligible provided it is not less than 4 inches when 0.75 inches size aggregate is used or not less than 6 inches for 1.5 inches size aggregate.
Pulse velocity will not be influenced by the shape of the specimen provided its least lateral dimension (i.e. its dimension measured at right angles to the pulse path) is not less than the wavelength of the pulse vibrations.
Figure 53: Steel Reinforcement Influence on Pulse Velocity
For pulses of 50kHz frequency, this corresponds to a least lateral dimension of about 3 inches. Otherwise the pulse velocity may be reduced and the results of pulse velocity measurements should be used with caution.
V-Meter Applications
71 www.ndtjames.com
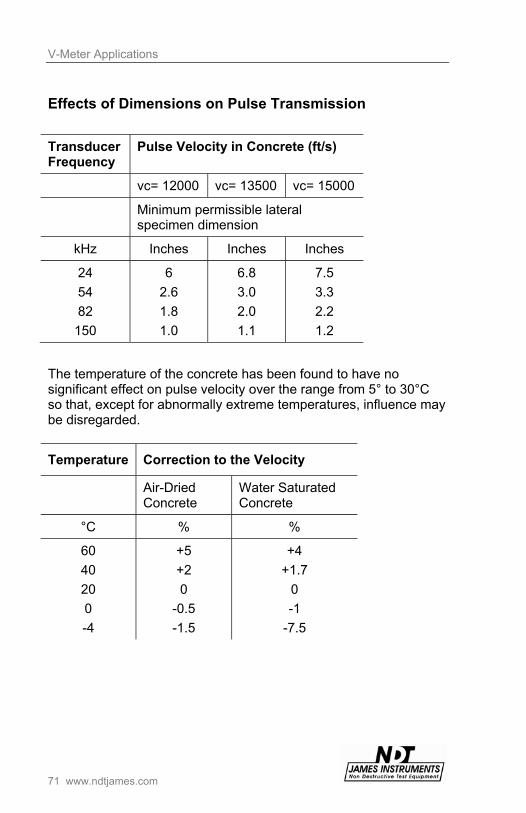
Effects of Dimensions on Pulse Transmission
Transducer Frequency
Pulse Velocity in Concrete (ft/s)
vc= 12000 vc= 13500 vc= 15000
Minimum permissible lateral specimen dimension
kHz Inches Inches Inches
24
54
82
150
6
2.6
1.8
1.0
6.8
3.0
2.0
1.1
7.5
3.3
2.2
1.2
The temperature of the concrete has been found to have no significant effect on pulse velocity over the range from 5° to 30°C so that, except for abnormally extreme temperatures, influence may be disregarded.
Temperature Correction to the Velocity
Air-Dried Concrete
Water Saturated Concrete
°C % %
60
40
20
0
-4
+5
+2
0
-0.5
-1.5
+4
+1.7
0
-1
-7.5
V-Meter Applications
www.ndtjames.com 72
The velocity of ultrasonic pulses in a steel bar is generally higher than they are in concrete. For this reason, pulse velocity measurements made in the vicinity of reinforcing steel may be high and not representative of the concrete since the V-Meter indicates the time for the first pulse to reach the receiving transducer.
The influence of the reinforcement is generally very small, if the bars run in the direction at right angles to the pulse path and the quantity of steel is small in relations to the path length.
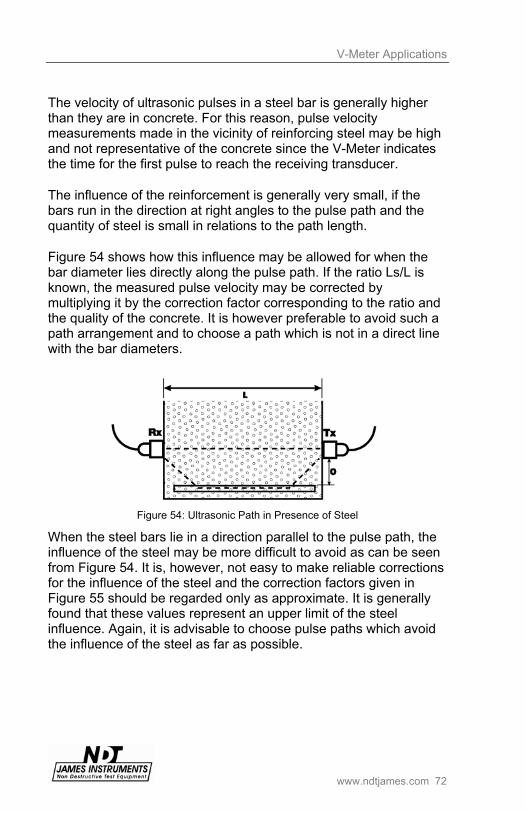
Figure 54 shows how this influence may be allowed for when the bar diameter lies directly along the pulse path. If the ratio Ls/L is known, the measured pulse velocity may be corrected by multiplying it by the correction factor corresponding to the ratio and the quality of the concrete. It is however preferable to avoid such a path arrangement and to choose a path which is not in a direct line with the bar diameters.
Figure 54: Ultrasonic Path in Presence of Steel
When the steel bars lie in a direction parallel to the pulse path, the influence of the steel may be more difficult to avoid as can be seen from Figure 54. It is, however, not easy to make reliable corrections for the influence of the steel and the correction factors given in Figure 55 should be regarded only as approximate. It is generally found that these values represent an upper limit of the steel influence. Again, it is advisable to choose pulse paths which avoid the influence of the steel as far as possible.

V-Meter Applications
73 www.ndtjames.com
Figure 55: Ultrasonic Correction Factor for Ultrasonic Path in Presence of Rebar
The moisture content of concrete can have a small but significant influence on the pulse velocity. In general, the velocity increases with increased moisture content, moisture effect in P-wave velocity is more marked for lower quality concrete. The pulse velocity of saturated concrete may be up to 5% higher than that of dry concrete of the same composition and quality, although this figure is likely to be lower for high strength concrete.
When pulse velocity measurements are made on concrete as a quality check, a contractor may be encouraged to keep the concrete wet for as long as possible in order to achieve an enhanced value of pulse velocity. This is generally an advantage since it provides an incentive for good curing practice.
Monitoring Changes in Concrete with Time Changes occurring in the structure of concrete with time caused by either hydration (which increases strength) or by an aggressive environment, such as frost, or sulphates, may be determined by repeated measurements of pulse velocity at different times. Changes in pulse velocity are indicative of changes in strength and their measurement can be made over progressive periods of time on the same test piece or concrete product.

V-Meter Applications
www.ndtjames.com 74
This facility is particularly useful for following the hardening process during the first two days after casting and it is sometimes possible to take measurement through formwork before it is removed at very early ages. The figure below shows some typical experimental results of pulse velocity measurements at early ages. This has a useful application for determining when formwork can be removed or when pre-stressing operations can proceed.
Figure 56: Typical Curves of Change of Pulse Velocity with Age

V-Meter Applications
75 www.ndtjames.com
Stress Wave Propagation If transient stress waves are introduced into a concrete structure by mechanical impact at a point on the surface, as shown in the figure below, the stress waves include a dilatational (P-) wave and a distortional (S-) wave, which propagate into the structure along hemispherical wavefronts, and a Rayleigh (R-) wave, which propagates along the surface of the structure. Among the stress waves, the P-wave propagates fastest and the R-wave propagates slowest. The S-wave propagates slightly faster than the R-wave. In an infinite isotropic elastic solid, the P-wave speed, Cp, and the S-wave speed, Cs, are related to the Young’s modulus of elasticity, E, Poisson’s ratio, v, and the density, p. For a Poisson’s ratio of 0.2, the R-wave speed is 92% of the S-wave speed and 56% of the P-wave speed. The motion of a particle disturbed by the P-wave is parallel to the direction of wave propagation while the particle motion disturbed by the S-wave is perpendicular to the wave propagation direction as schematically illustrated in the figure below.
The particle motion disturbed by the R-wave is elliptical. The vertical disturbance of a particle on the impact surface caused by the R-wave arrival is much larger than that caused by the S-wave and P-wave arrivals.
Figure 57: Schematic of Stress Wave Propagation

V-Meter Applications
www.ndtjames.com 76
Velocity of Longitudinal Pulses in Elastic Solids The velocity of a pulse of longitudinal ultrasonic vibrations traveling in an elastic solid is given by the following equation:
V = 2µ)-µ)(1(1
µ)1(
E
Item Definition
E Dynamic Modulus of Elasticity
µ Dynamic Poisson’s Ratio
ρ Density

Maintenance
77 www.ndtjames.com
Maintenance
Data Logger and Battery The Data Logger Board manages the internal Lithium-Ion Battery. The Li-Ion Battery is rated at 14.4V / 1500mAh. Its initial charge period of 4 hrs (full charge) is done “in-house” here at James Instruments. The data logger board has a Power Minder IC chip (aka. charge /discharge counter), which keeps track of the main Li-Ion Battery. This chip uses sensing resistors to monitor the battery current flow, and direction. As the battery is used, this counter reveals the discharge value of the battery. This can be viewed on the display in the Battery Operations sub-screen. Conversely, this same Power Minder chip shows the charge value of the battery when the unit is being charged; also viewed on the display screen. Thus, while being charged, the charge value will increase and the discharge value will remain the same. While in use, not being charged, the discharge value will increase and the charge value remains the same. These values are stored in the memory, until they are cleared or reset. The charge/discharge values (including Battery status) can all be reset to 0, by pressing the “Enter” button; while in the Battery Operations sub-screen.

Maintenance
www.ndtjames.com 78
Note: Performing this Reset Step, may give the operator a false impression of the true battery status. For example, a battery status of 90% can falsely be changed into 100% and seen on the display moments after pressing “Enter”. But the battery does not become instantly charged by pressing this button. Therefore, it is critical for the operator to understand that pressing “Enter” while in this screen, may or may not show an accurate status of the battery percentage. Also, the operator must realize that before a known extended period of usage, the battery should be fully charged; then and only then, would pressing the “Enter” key (to reset the values) show the actual battery status while in use.
In order to extend the battery usage time, the operator can turn “off” the Backlight feature; as this causes the largest consumption of the battery – draining it at a rate of up to 125mA, even more than the test instrument itself.
In addition, like any rechargeable battery, a near complete discharge before a full recharge will lengthen the battery life. If the Li-Ion Battery is determined to be defective and needs to be replaced, it is best to return the unit to James Instruments. Yet, if desired, the operator should perform the following steps for this replacement operation.

Maintenance
79 www.ndtjames.com
Changing the battery Before beginning, a replacement battery (with the required 2x4 connector) needs to be purchased from James Instruments( S-056-11196-001 ).
To change the battery:
1. Remove the Torx screws (#10, 2 front/2 back) holding the unit inside of the Yellow case.
2. Carefully lift the unit out; being mindful of the flexible cable connected to the front overlay, and flip the unit onto its face for easy access to the battery.
3. The battery pack is white, and can be quickly removed from its holding clips.
4. Unscrew the nut for the plug-in Power Jack to completely free the battery assembly.
5. Next, remove the battery connector from the plug-in receptacle on the Data Logger board; noting the Tab orientation of this connector.
6. (opt.) If your test unit has the wires twisted together, carefully cut away the shrink tubing to free all of the wires. (Do not to cut into the wire insulation.)
7. The wires from the plug-in Power Jack need to be removed from the old connector. Before starting, note their location in the connector housing, and reinsert the wires into these same positions on the new connector. These wires are removed by pressing down on the hold tab in the connector housing by using a pin, and gently pulling on the wires.
8. (opt.) Once removed, re-twist these wires or leave separate from the battery wires.
9. The small wire tabs in Step 7, need to be lifted slightly before reinserting into the new connector housing.
10. Once inserted, install the new connector into the plug-in receptacle on the Data Logger board – keeping the same Tab orientation as in step 5.
11. Install the Power Jack into the front cover, and screw down with the nut from step 4.

Safety
www.ndtjames.com 80
12. Snap the new battery into the hold down clips, and turn the unit over.
13. Gently insert the unit back into the Yellow case, again mindful of the flexible cable.
14. Reinstall the 4 Torx screws. This is best done if all screws are installed part of the way first, and then tightened down.
15. Plug the battery charger into the Power Jack located on the front cover, and check the charge values in the “Battery Operations” sub-menu. The charge value should be increasing. If not, remove battery charger immediately, and verify the wire positions of plug-in Power Jack. (White - top, then Black / Red / Black / Red – the last two to charger)
A full charge lasting 4 hrs will need to be done for the replaced battery. Remember to clear the battery counts by pressing, “Enter”, after charging.
Safety
Do not submerge unit in water. This can cause electrical shock.
When using underwater transducers, be sure to tightly fasten the threaded connector to prevent water from leaking into the transducer.
Do not hold transducers up to body parts. Only point them at the material you are testing.

Available V-Meter Accessories
81 www.ndtjames.com
Available V-Meter Accessories
Part # Description
S-3180 Charger
V-C-4874-CIP CIP Couplant Grease
V-C-4874-GSO Silicon Grease, Clean in place – For architectural concrete; can be cleaned
V-C-4876 54kHz Underwater Transmitter each
Length 5.87” (149mm)
Diameter 2.25” (57mm)
Weight 5lbs. (2.27kg)
V-C-4877 54kHz Underwater Receiver each
Length 6.87” (175mm)
Diameter 2.25” (57mm)
Weight 6lbs. (2.72kg)
Each supplied with 50ft. (16m) underwater cable.
V-C-4894 150kHz, Dia 0.9" Length 1.34" each
V-C-4896 Pre-Amp for TDXR W/BNC
V-C-4898 54kHz, Dia 1.97" Length 2.2" each
V-C-4905 54kHz, Exponential Receiver each
Length 4.765” (121mm)
Diameter 1.49” (38mm)
Weight 1.3lbs. (.59kg)
Used with Pre-Amp.
V-C-4910 Calibration Bar (optional)
V-C-4911 54kHz, Exponential Transmitter each
Length 4.765” (121mm)
Diameter 1.49” (38mm)
Weight .94” (.43kg)
Used without Pre-Amp.
V-C-4968-012 Cable with BNC Connector Less than 12ft

Available V-Meter Accessories
www.ndtjames.com 82
Part # Description
V-C-4968-025 Cable with BNC Connector Less than 25ft
V-C-4968-050 Cable with BNC Connector Less than 50ft
V-C-4968-100 Cable with BNC Connector Less than 100ft
V-C-4968-200 Cable with BNC Connector Less than 200ft
V-C-7217 500kHz, Dia 13mm each
V-C-7283 180kHz Shear Wave Transducer each
Length 2.37” (60mm)
Diameter 1.98” (51mm)
Weight .92lbs. (416 gr.)
Used in combination with compressional wave transducers, to calculate the Poisson’s ratio which in turn will facilitate a more accurate moduli.
V-24145-000 Rubber Couplant (10 pc 80mm X 75mm pack)
V-24145-001 Rubber Couplant (50 pc 25mm Diameter)
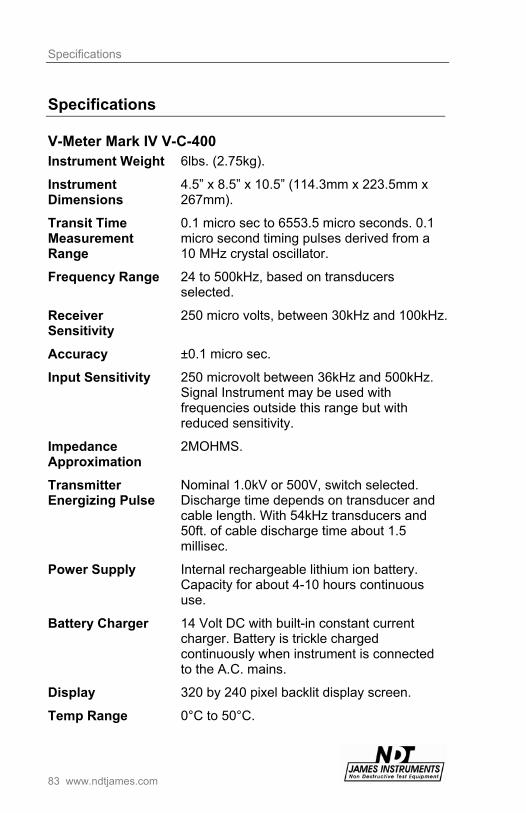
Specifications
83 www.ndtjames.com
Specifications
V-Meter Mark IV V-C-400 Instrument Weight 6lbs. (2.75kg).
Instrument Dimensions
4.5” x 8.5” x 10.5” (114.3mm x 223.5mm x 267mm).
Transit Time Measurement Range
0.1 micro sec to 6553.5 micro seconds. 0.1 micro second timing pulses derived from a 10 MHz crystal oscillator.
Frequency Range 24 to 500kHz, based on transducers selected.
Receiver Sensitivity
250 micro volts, between 30kHz and 100kHz.
Accuracy ±0.1 micro sec.
Input Sensitivity 250 microvolt between 36kHz and 500kHz. Signal Instrument may be used with frequencies outside this range but with reduced sensitivity.
Impedance Approximation
2MOHMS.
Transmitter Energizing Pulse
Nominal 1.0kV or 500V, switch selected. Discharge time depends on transducer and cable length. With 54kHz transducers and 50ft. of cable discharge time about 1.5 millisec.
Power Supply Internal rechargeable lithium ion battery. Capacity for about 4-10 hours continuous use.
Battery Charger 14 Volt DC with built-in constant current charger. Battery is trickle charged continuously when instrument is connected to the A.C. mains.
Display 320 by 240 pixel backlit display screen.
Temp Range 0°C to 50°C.

Warranty Information
www.ndtjames.com 84
Warranty Information
1. Contract Unless otherwise stated all sales transactions are expressly subject to these terms and conditions. Modification or additions will be recognized only if accepted in writing by an authorized Officer of James Instruments Inc. (hereinafter referred to as “James” or the “Company”), or an officially designated representative. PROVISIONS OF BUYER'S PURCHASE ORDER OR OTHER DOCUMENTS THAT ADD TO OR DIFFER FROM THESE TERMS AND CONDITIONS ARE EXPRESSLY REJECTED. NO WAIVER OF THESE TERMS AND CONDITIONS OR ACCEPTANCE OF OTHERS SHALL BE CONSTRUED AS FAILURE OF THE COMPANY TO RAISE OBJECTIONS. 2. Warranties The Company only warrants the equipment manufactured or supplied by the Company as set forth herein. James makes no other warranties, either expressed or implied (including without limitation, warranties as to merchantability or fitness for a particular purpose). In no event shall James be liable for any type of special, consequential, incidental, or penal damages, whether such damages arise out of or are a result of breach of contract, warranty, negligence, strict liability or otherwise. Warranty shall not apply where the equipment manufactured or supplied has been subject to accident, alteration, misuse, abuse, improper storage, packing, force majeure, improper operation, installation, or servicing. In addition, the following shall constitute the sole and exclusive remedies of Buyer for any breach by James of its warranty hereunder.
a. New Products James warrants the equipment manufactured or supplied by James as set forth herein. This limited warranty can only be exercised by the original purchaser of the equipment from James or authorized James Agent and is not transferable to any subsequent owner or party. This limited warranty gives you specific legal rights, and you may also have other rights which vary from case to case.
i. For James Equipment James warrants that James's equipment will be free from defects in materials and workmanship for a period of twenty-four (24) months on the electronic portion and six (6) months on the mechanical portion from the date of shipment of equipment from James to Buyer. Should any defects be found and reported by the Buyer during the applicable limited warranty period, the defect will be corrected upon return of the item to James. James will, during the applicable new equipment warranty period, provide the necessary replacement parts and labor to correct the defect.

Warranty Information
85 www.ndtjames.com
Excluded from the new equipment warranty are all consumable and wear and tear items such as impact bodies, penetrators, connection cables, etc. These items are subject to usual wear and tear during usage. Refer to the Consumable, Wear and Tear Items section of this warranty document.
Option For Extended Limited Warranty Coverage The original purchaser of any new equipment of James which have been identified or labeled by James from time to time in James's sole discretion as being eligible for extended warranty coverage shall have the option to purchase certain extensions of the applicable limited warranty provided hereunder to the electronic portion of any such items for either a twelve (12), twenty-four (24) or thirty-six (36) month period (up to a possible maximum limited warranty coverage period for the electronic portions of such new James equipment of sixty (60) months) by purchasing any such twelve (12), twenty-four (24) or thirty-six (36) month limited warranty extension period either all the time of the purchase of any such item(s) or within ninety (90) days from the date of delivery of the subject item(s) of the original purchaser of such item(s). The price for each such extended limited warranty coverage period shall be as determined by the Company from time to time and all such purchases of any extended warranty coverage periods shall only be effective upon a completed purchase order and payment directly between James and the original purchaser of any such item(s). The extended warranty coverage periods are only valid with respect to the original purchaser of such item(s) from the Company and such extended warranty coverage is not transferable to subsequent owners of the subject item(s) or any other parties. Upon the purchase of any extended limited warranty coverage period, the Company will issue a certificate to Buyer evidencing the details of the applicable extended warranty coverage period purchased by the Buyer.
ii. For Other Manufacturer's Products Supplied by James Products of other manufacturers supplied as such by James are warranted by James only to the extent of any warranty provided by the original manufacturer, if any.
iii. For Parts and Sub-Assemblies Parts or sub-assemblies purchased by the Buyer to perform its own repair work etc. are warranted as provided hereunder by James for six (6) months from date of shipment of material from James to Buyer.
Warranty Information
www.ndtjames.com 86
iv. For Consumables, Wear and Tear Items James supplies consumable items and items subject to wear and tear during normal usage of James supplied products. These items are not covered under warranty. Buyer is to check for proper fit, form and function of such items upon receipt of such items. In case of a defect condition, Buyer can return the item to James for evaluation within thirty (30) days of the date of shipment to the Buyer. James reserves the exclusive right to issue full, partial, or no credit to the Buyer based on the condition of the returned item and circumstances related to the return. Examples of items in this category: connection cables, test blocks, impact bodies, penetrators, probes, extraction liquids, calibration liquids, pins, recording paper, test plugs, etc.
b. Calibration and Repair
i. For Calibration Services James does not warrant the calibration of any equipment. James does however warrant the equipment manufactured by it, in proper working condition, to be capable of being adjusted to meet James printed specifications, if any, for accuracy and performance as to the particular model type during the period of warranty applicable as stated above.
ii. For Repair Services James warrants repair work performed under the direct control and supervision of James personnel for a period of three (3) months from the date repairs are completed either at James or at the customer site. Should the defect for which the repair work was performed reoccur within this period, James will supply the necessary parts and labor (repair at James facility) or parts (repair at Buyer facility) required to repair the original equipment defect for which the repair parts and labor were required. Additional repair charges that may be incurred in conjunction with any repair service warranty event will be invoiced at the James customer service rates and policies in effect at the time of the event.
Excluded are all consumable and wear and tear items such as impact bodies, probes, connection cables, etc. These items are subject to usual wear and tear during usage. Refer to the Consumable Wear and Tear Item section of this warranty document.

Warranty Information
87 www.ndtjames.com
c. Warranty Claims
i. For Warranty Claim Processing James has established James organizations in the Americas, and Europe. Please visit the James web site www.ndtjames.com for latest address and contact information for the James organization nearest you.
3. Regulatory Laws and/or Standards The performance of the parties hereto is subject to the applicable laws of the United States. The Company takes reasonable steps to keep its products in conformity with various nationally recognized standards and such regulations, which may affect its products. However, the Company recognizes that its products are utilized in many regulated applications and that from time to time standards and regulations are in conflict with each other. The Company makes no promise or representation that its product will conform to any federal, provincial, state or local laws, ordinances, regulations, codes or standards except as particularly specified and agreed upon for compliance in writing as a part of the contract between Buyer and the Company. The Company prices can not include the cost of any related inspections or permits or inspection fees. 4. Notices Notice by either the Company or Buyer will be made only by facsimile or similar electronic transmission, effective on the first business day after confirmed receipt, or by letter addressed to the) other party at its address as provided in this Agreement, effective three (3) business days after deposit with the U.S. Postal Services, postage prepaid, or one (1) business day after deposit with a recognized overnight express service. 5. Interpretation Should any term or provision contained In the contract contravene or be invalid under applicable law, the contract shall not fail by reason thereof but shall be construed in the same manner as if such term or provision had not appeared therein. 6. Assignability Neither this contract nor any claim arising directly or indirectly out of or in connection herewith shall be assignable by Buyer or by operation of law, without the prior written consent of Company. This document shall be binding upon and inure to the benefit of each party hereto and their respective permitted successors and assigns.

Warranty Information
www.ndtjames.com 88
7. Governing Law This Agreement shall be governed by and construed in accordance with the internal laws of the State of Illinois, without regard to its conflict of laws provisions. Buyer and the Company expressly agree to submit to the personal jurisdiction of the federal and/or stale courts silting in Chicago, Illinois, U.S.A. and agree that such courts may be utilized if necessary to obtain injunctive or any other relief. The Hague Convention and the United Nations Convention on Contracts for the International Sale of Goods shall not apply to the construction or interpretation of these Standard Terms and Conditions or affect any of its provisions. END.

Repair Policy
89 www.ndtjames.com
Repair Policy
United States | Canada | International
Ship the instrument in a box that meets UPS, Fed Ex, and standard shipping regulations. Enclose a note describing the problem(s) you are having. Include the name and phone number of the contact person in your organization.
The instrument will be evaluated within one week of receipt. The contact person will be notified with an estimate of the cost of the repair.
Upon receipt of your authorization of repair and payment terms, delivery time will be 2 weeks from that day.
If you need the repair back sooner than this, you have the option of paying an express service fee of 10 percent of the purchase price of said instrument, plus the repair cost. With this service, you can receive the instrument back within 3 working days in the USA (5 working days for Europe).
International repair shipments must contain a commercial invoice listing the instrument being returned and must contain the words:
Country of manufacture: USA
Instrument being returned to manufacturer for repair – no value for customs, value for carriage only.
Ship the complete system to:
Attn: Repair Department
James Instruments, Inc. - USA
3727 North Kedzie Avenue
Chicago, IL 60618-4503
USA
Attn: Repair Department
James Instruments, Inc. – Europe
Windmolen 22
7609 NN Almelo
The Netherlands
Home page: www.ndtjames.com
E-mail: [email protected]


James Instruments Inc.
3727 N.Kedzie
Chicago, IL 60618-4503
USA
Tel: (773) 463-6565
Fax: (773) 463-0009
James Instruments Inc. - Europe
Windmolen 22
7609 NN Almelo
The Netherlands
Tel: +31 (0)548 659032
Fax: +31 (0)548 659010