ND QUARTER 2017 DATA RENO/SPARKS METRO...
39
APARTMENT SURVEY 2 ND QUARTER 2017 DATA RENO/SPARKS METRO AREA PRESENTED BY JOHNSON PERKINS GRIFFIN, LLC Copyright © 2017 by Johnson Perkins Griffin, LLC All rights reserved. No part of this publication may be reproduced, distributed, or transmitted in any form or by any means, including photocopying, recording, or other electronic or mechanical methods, without the prior written permission of Johnson Perkins Griffin, LLC. ©
-
Upload
hoangquynh -
Category
Documents
-
view
215 -
download
2
Transcript of ND QUARTER 2017 DATA RENO/SPARKS METRO...

APARTMENT SURVEY
2ND QUARTER 2017 DATA
RENO/SPARKS METRO AREA
PRESENTED BY
JOHNSON PERKINS GRIFFIN, LLC
Copyright © 2017 by Johnson Perkins Griffin, LLC
All rights reserved. No part of this publication may be reproduced, distributed, or transmitted in any form or by any means, including photocopying, recording, or other electronic or mechanical methods, without the prior
written permission of Johnson Perkins Griffin, LLC.
©

Apartment Survey – 2nd Quarter 2017
TABLE OF CONTENTS STATEMENT OF METHODOLOGY ......................................................................................................... 1 ECONOMIC OUTLOOK ............................................................................................................................. 2 ECONOMIC INDICATORS ........................................................................................................................ 3 SUMMARY OF FINDINGS ........................................................................................................................ 4 HISTORICAL RENTAL AND VACANCY RATES BY UNIT TYPE ...................................................... 5 COMMENTARY .......................................................................................................................................... 6 GUIDELINES ............................................................................................................................................... 7 MARKET AREAS........................................................................................................................................ 8 MARKET AREA MAP ................................................................................................................................ 9 PROJECTS APPROVED AND/OR UNDER CONSTRUCTION ............................................................. 10 PROPOSED & UNDER CONSTRUCTION ............................................................................................. 11 ABSORPTION ........................................................................................................................................... 12 RENT CONCESSIONS .............................................................................................................................. 13 SURVEY RESULTS .................................................................................................................................. 14 OVERALL RENO/SPARKS RENT & VACANCY DATA-ALL UNIT TYPES ..................................... 15 OVERALL RENO/SPARKS RENT & VACANCY DATA-STUDIO UNITS ......................................... 16 OVERALL RENO/SPARKS RENT & VACANCY DATA-1 BED/1 BATH UNITS .............................. 17 OVERALL RENO/SPARKS RENT & VACANCY DATA-2 BED/1 BATH UNITS .............................. 18 OVERALL RENO/SPARKS RENT & VACANCY DATA-2 BED/2 BATH UNITS .............................. 19 OVERALL RENO/SPARKS RENT & VACANCY DATA-3 BED/2 BATH UNITS .............................. 20 OVERALL RENO/SPARKS RENT & VACANCY DATA-TOWNHOUSE UNITS .............................. 21 AREA 1-NORTHWEST RENO AVERAGE RENT & VACANCY DATA............................................. 22 AREA 2-NORTHEAST RENO AVERAGE RENT & VACANCY DATA ............................................. 23 AREA 3-WEST SPARKS/NORTH VALLEYS AVERAGE RENT & VACANCY DATA .................... 24 AREA 4-EAST SPARKS AVERAGE RENT & VACANCY DATA ....................................................... 25 AREA 5-WEST RENO AVERAGE RENT & VACANCY DATA .......................................................... 26 AREA 6-SOUTHWEST RENO AVERAGE RENT & VACANCY DATA ............................................. 27 AREA 7-BRINKBY/GROVE AVERAGE RENT & VACANCY DATA ................................................ 28 AREA 8-AIRPORT AVERAGE RENT & VACANCY DATA ................................................................ 29 AREA 9-LAKERIDGE AVERAGE RENT & VACANCY DATA .......................................................... 30 AREA 10-SOUTHEAST RENO AVERAGE RENT & VACANCY DATA ............................................ 31 AREA 11-DOWNTOWN URBAN AVERAGE RENT & VACANCY DATA ........................................ 32 SUMMARY BY UNIT TYPE-AVERAGE RENT & VACANCY DATA ............................................... 33 SUMMARY BY MARKET AREA-AVERAGE RENT & VACANCY DATA ....................................... 34 15 PROPERTIES WITH HIGHEST AVERAGE RENTS-AVERAGE RENT & VACANCY DATA .... 35 SURVEY PARTICIPANTS ....................................................................................................................... 36

Apartment Survey – 2nd Quarter 2017
SURVEY COMMITTEE
Stephen R. Johnson MAI, SREA
Reese Perkins, MAI, SRA Scott Q. Griffin, MAI Sarah K. Fye, MBA
DATA ACCUMULATION AND ANALYSIS COMPLETED BY
Johnson Perkins Griffin, LLC
ACKNOWLEDGEMENTS
We would like to thank all participating management companies, municipalities, and the Survey Committee for their invaluable contributions to the design and content of this report.
SURVEY SPONSORS
Johnson Perkins Griffin, LLC Real Estate Appraisers and Consultants
245 East Liberty, Suite 100 Reno, Nevada 89501
(775) 322-1155 FAX (775) 322-1156

Apartment Survey – 2nd Quarter 2017 1
STATEMENT OF METHODOLOGY The information presented in this report was collected and assembled from a combination of original research and secondary sources. This section summarizes the methods used in gathering the data. Sources The survey data is collected on a quarterly basis from participating apartment managers, management companies and owners. All information collected from individual complexes is completely confidential and only aggregate statistics are reported. The information furnished by the survey participants is considered reliable. However, the Survey Committee makes no warranty as to the reliability of the data and assumes no legal responsibility for the use of the data from the survey. Survey Criteria The projects have 80 units or more in the Reno/Sparks service area;
• Projects reflect market rents. Affordable Housing, Student & Senior Housing Projects are excluded;
• New projects have reached a stabilized occupancy of at least 90%; • The projects have a competitive on-site management program; and • A willingness of the on-site manager to participate in the survey.
The results of this survey depict the operating conditions of the average of 21,182 units reported. A total of 84 projects were surveyed. We believe the statistics presented here are representative of the overall conditions of the Reno-Sparks Survey Area. Survey Modifications One new project, 3rd Street Flats, reached stabilization during the 2nd Quarter 2017 and agreed to become a survey participant. The total apartment projects participating in the survey increased from 84 projects to 85 projects, and the total units increased from 21,182 units to 21,277 units. Additionally, we have added a new market area for Downtown Urban living, which includes the urban developments in downtown Reno and downtown Sparks. Currently, this market area includes the recently stabilized 3rd Street Flats and Square One. One additional Downtown Urban project, Fountainhouse Apartments, is nearing stabilization and several others are currently being developed. These projects will be added to the survey accordingly.
TOTAL NUMBER OF PROJECTS & UNITS-PRIOR TO CURRENT QUARTER 1st Quarter 2017 2nd Quarter 2017 Change
Total Projects 84 85 1 Additional Project Total Units 21,182 21,277 95 Additional Units

Apartment Survey – 2nd Quarter 2017 2
ECONOMIC OUTLOOK
Nevada’s unemployment rate remained steady in May at 4.7 percent, just 0.4 of a percentage point higher than the national rate. This is the second month in a row that the unemployment rate in the Silver State has remained 9 percentage points below the recessionary peak of 13.7 percent. Further, May’s reading represents an over-the-year decline of 1.1 percentage points, and the 68th consecutive month of year-over-year declines of one point or more. Based upon recent trends, we expect this month’s over-the-year decline to be amongst the strongest in the nation. “During the recession, Nevada lost a staggering 185,700 jobs. In the past six years, Nevada businesses have added back 215,600 jobs. Currently, our rate of growth is settling in at around 40,000 new jobs per year, which indicates a vibrant and healthy economy,” said Governor Brian Sandoval. “Our private sector job growth is fourth-strongest in the nation, an incredible improvement from when the Silver State’s job losses were the most pronounced in the nation.” In May, employment in the Silver State increased on a year-over-year basis for the 77th month in a row, said Bill Anderson, chief economist for Nevada’s Department of Employment, Training and Rehabilitation. Nevada has added 35,000 jobs since this time last year, a growth rate of 2.7 percent. Nationally, employment increased by 1.6 percent over the year. May marks the 58th consecutive month that year-over-year job growth in the Silver State has outpaced the nation. Through the first five months of the year, jobs are up 39,300 on average relative to a year ago. “This is perhaps the best barometer of underlying employment trends,” Anderson said. “The State lost 14.3 percent of its employment during the recession. As of May employment has increased 19.4 percent since the recession.” Key Points:
• Seasonally-adjusted employment is down 6,500 over the month, but up 39,000 year-to-date
• Employment has increased 19.4 percent, or 215,600 jobs, since the recession • 76.1 percent of total employment is in full-time jobs, vs. 23.9 percent for part-time • Nevada had the 4th-fastest growing private sector in the nation in 2016 • Small business employment averaged 603,000 in 2016, compared to 587,000 in 2015 • Weekly wages averaged $906 in 2016, a 3 percent gain from 2015

Apartment Survey – 2nd Quarter 2017 3
ECONOMIC INDICATORS
(Source: Nevada Department of Employment, Training and Rehabilitation Economic Summary May 2017)

Apartment Survey – 2nd Quarter 2017 4
SUMMARY OF FINDINGS
AVERAGE SIZE, AVERAGE RENT & AVERAGE VACANCY RATE BY UNIT TYPE
CATEGORY STUDIOS 1 BED/
1 BATH 2 BED/
1 BATH 2 BED/
2 BATH 3 BED/
2 BATH TOWNHOMES TOTALS Average SF-By Unit Type 404 SF 720 SF 862 SF 1,041 SF 1,266 SF 1,298 SF 888 SF Average Rent-By Unit Type $715 $1,060 $1,081 $1,353 $1,595 $1,338 $1,194 Average Rent/SF-By Unit Type $1.77 $1.47 $1.25 $1.30 $1.26 $1.03 $1.34 Indicated Vacancy Rate-By Unit Type 1.17% 1.28% 0.95% 1.15% 1.05% 1.85% 1.17%
OVERALL AVERAGE RENT & VACANCY-PRIOR & CURRENT QUARTER
Category 1st Quarter 2017 2nd Quarter 2017 Change Average Vacancy 2.23% 1.17% -106 Basis Points
Average Rent $1,111 $1,194 +$83 or +7.47%
COMPARISON OF RENTAL RATES & VACANCY RATES TO PRIOR QUARTER
UNIT TYPE AVERAGE RENT AVERAGE VACANCY
1st Qtr. 2017 2nd Qtr. 2017 Result 1st Qtr. 2017 2nd Qtr. 2017 Result Studio $669 $715 +$46 1.47% 1.17% -0.30%
1 Bedroom/1 Bath $992 $1,060 +$68 2.42% 1.28% -1.14% 2 Bedroom/1 Bath $1,019 $1,081 +$62 1.32% 0.95% -0.37% 2 Bedroom/2 Bath $1,244 $1,353 +$109 2.63% 1.15% -1.48% 3 Bedroom/2 Bath $1,468 $1,595 +$127 1.54% 1.05% -0.49%
Townhouse $1,362 $1,338 -$24 1.11% 1.85% +0.74% TOTALS $1,111 $1,194 +$83 2.23% 1.17% -1.06%
RENTAL AND VACANCY RATES BY SUB-MARKET AREA
AVERAGE RENT AVERAGE VACANCY Area Sub-Market 1st Qtr. 2017 2nd Qtr. 2017 Result 1st Qtr. 2017 2nd Qtr. 2017 Result
1 Northwest Reno $1,189 $1,301 +$112 2.93% 1.02% -1.91% 2 Northeast Reno $1,005 $1,081 +$76 1.22% 0.84% -0.38% 3 W. Sparks/N. Valley $977 $1,013 +$36 1.40% 1.62% +0.22% 4 East Sparks $1,345 $1,475 +$130 2.42% 1.86% -0.56% 5 West Reno $961 $1,007 +$46 0.44% 2.22% +1.78% 6 Southwest Reno $987 $1,050 +$63 6.71% 1.04% -5.67% 7 Brinkby/Grove $782 $815 +$33 0.50% 0.74% +0.24% 8 Airport $865 $924 +$59 1.25% 0.54% -0.71% 9 Lakeridge $1,217 $1,285 +$68 4.23% 1.60% -2.63% 10 Southeast Reno $1,111 $1,184 +$73 1.22% 0.49% -0.73% 11 Downtown Urban N/A $1,322 N/A N/A 4.64% N/A
Overall Reno-Sparks $1,111 $1,194 +$83 2.23% 1.17% -1.06%

Apartment Survey – 2nd Quarter 2017 5
HISTORICAL RENTAL AND VACANCY RATES BY UNIT TYPE

Apartment Survey – 2nd Quarter 2017 6
COMMENTARY The overall average rental rate for all units surveyed increased by 7.47%, with all unit types, except townhouse units, experiencing an increase in average rental rates. Each of the ten original sub-markets experienced an increase in average rental rates. The overall vacancy rate for all units surveyed decreased by 106 basis points, with seven of the original ten submarkets showing decreases in vacancies and the three remaining original submarkets experiencing a slight increase in average vacancy. All unit types, except townhouse units, experienced slight decreases in average vacancies. Average vacancy for all unit types is e now at an all-time low of 1.17%. Although several projects are under construction, supply within the major apartment projects in the region is expected to remain extremely tight over the coming year. Vacancies are expected to remain extremely low, and rental rates should continue to show increases. Over 3,400± units within major apartment projects (over 80 units) are now under construction in the region, with many more projects in the planning and entitlement stages.

Apartment Survey – 2nd Quarter 2017 7
GUIDELINES The units reported in the survey are subject to the following conditions:
• Occupancy rates represent conditions as of the date of survey; • Rents utilized in the report represent the base price of an unfurnished apartment; • Units with more than one size per unit type were calculated on a weighted average for
each unit type • Weighted averages were used in all charts to give the most accurate statistics possible.
The averages were weighted by the number of units reporting each data type; • Vacant units are defined as those units currently available for lease (no contract in place).
APARTMENT UNIT CLASSIFICATIONS Apartment Type Description
Studio Units With One Living Area Plus Bath & Kitchen 1 Bed/1 Bath Units With One Bedroom And 1 Bath Or 1-1/2 Baths 2 Bed/1 Bath Units With 2 Bedrooms, 1 Bath OR 1 Bedroom, Den, 1 Bath 2 Bed/2 Bath Units Have 2 Bedrooms And 2 Baths Or 1-1/2 Baths 3 Bed/2 Bath Units Having 3 Bedrooms And 2 Baths (Some Units Include A 3rd Bath) Townhouse Units Having 2 Or 3 Bedrooms, 2 Baths OR 2 Bedrooms, Den, 2 Baths

Apartment Survey – 2nd Quarter 2017 8
MARKET AREAS Area Sub-Market Location 1 Northwest Reno North of Truckee River & West of N. Virginia St.
2 Northeast Reno North of 2nd St.; West of US-395 & Northtowne Lane; East of N. Virginia St.
3 West Sparks/North Valleys
North of the Truckee River; West of Pyramid Way; East of US-395
4 East Sparks North of the Truckee River & East of Pyramid Way
5 West Reno North of Moana Lane; West of Plumas St.; South of Truckee River
6 Southwest Reno South of Truckee River; West of S. Virginia St.; East of Plumas St.; North of Redfield Parkway
7 Brinkby/Grove
North of Moana Lane; West of S. Virginia St.; South of Brinkby Ave.; East of Lakeside Dr. & North of Linden St.; West of Kietzke Lane; South of Plumb Lane; East of S. Virginia St.
8 Airport North of Peckham Lane; West of Longley Lane; East of S. Virginia St.; South of 2nd St. & Truckee River
9 Lakeridge South of Moana Lane and Redfield Parkway; West of S. Virginia St.
10 Southeast Reno South of Truckee River; East of S. Virginia St.& Longley Lane 11 Downtown Urban Downtown Reno; Downtown Sparks *Sub-Market Area 11 is not depicted on the following Market Area Map, as is contains portions of Downtown Reno and Downtown Sparks, which are contained within previously existing Sub-Market Areas.

Apartment Survey – 2nd Quarter 2017 9
MARKET AREA MAP

Apartment Survey – 2nd Quarter 2017 10
PROJECTS APPROVED AND/OR UNDER CONSTRUCTION The Village South, the 252-unit Phase II project for The Village at Arrow Creek, broke ground in 2016. At the end of the 2nd Quarter of 2017 four buildings were complete, 52% of the project had been pre-leased and 24% of the property was occupied. The Harvest is a 578-unit apartment complex in Damonte Ranch. Tanamera Construction broke ground on Phase I, which will include 278 units, in the 1st Quarter of 2016. Phase II of this project, which is still in the planning stages, will include 300 units. The project is located at the intersection of Steamboat Parkway and Veterans Parkway. At the end of the 2nd Quarter of 2017 four apartment buildings were complete and eighteen townhouse buildings were complete, 49% of the project had been pre-leased and 16% of the property was occupied. In September 2015, Silverwing Development broke ground on the Fountainhouse Apartments in downtown Sparks. The project includes 236 one and two-bedroom apartments within 10 four-story buildings. The leasing office and clubhouse opened in May 2016. Move-ins within the first building began in August 2016. At the end of the 2nd Quarter of 2017 the project was complete, 85% of the project had been pre-leased and 79% of the property was occupied. San Diego-based Guardian Capital broke ground on the Vida Apartments, a 312-unit apartment complex located at the intersection of Sharlands Avenue and Mae Anne Avenue in northwest Reno near Somersett in the 2nd Quarter of 2017. The Summit Club, a 574-unit apartment project located west of the Summit Mall in South Reno, has broken ground. The chart below summarizes the market rate projects within the Reno-Sparks market with approvals, in planning stages, or under construction.

Apartment Survey – 2nd Quarter 2017 11
PROPOSED & UNDER CONSTRUCTION (MAJOR APARTMENT PROJECTS OVER 80 UNITS)
PROJECTS UNDER CONSTRUCTION Project Name Units Location Area Status
Vida 312 Southeast Corner Sharlands & Mae Anne 1 Under Construction Fountainhouse Apartments 236 Victorian Plaza Circle at C Street 3 Under Construction
The Bridges 198 Victorian Square 3 Under Construction North Peak Apartments 328 Intersection of Military Road & Lemmon Drive 3 Under Construction Vineyard at the Galleria 210 Sparks Galleria 4 Under Construction
The Waterfront at Sparks Marina 209 Around Existing Parking Garage @ Sparks Marina 4 Under Construction Lyfe at the Marina 280 Sparks Market 4 Under Construction
Sierra Vista 336 Arrowcreek Parkway 10 Under Construction The Harvest-Phase I 278 Damonte Ranch 10 Under Construction The Village South 252 Intersection of Arrowcreek Parkway & Wedge Parkway 10 Under Construction
Double R Apartments 148 East Side Double R Boulevard 10 Under Construction Summit Club 574 Mt. Rose Highway 10 Under Construction Total Units: 3,361
PROJECTS PLANNED
Project Name Units Location Area Status 4th Street Apartments 164 West 4th Street, East of South McCarran Boulevard 1 Planning Stages
The Villas at Keystone Canyon-Phase II 96 Keystone Avenue & North McCarran Boulevard 1 Planning Stages The Overlook at Keystone Canyon 305 Directly West of The Villas at Keystone Canyon 1 Planning Stages
West 2nd Street District 500 Downtown Reno 1 Planning Stages Vista Rafael Apartments 416 North Virginia Street & Vista Rafael Parkway 3 Planning Stages Silverwing Development 200 Victorian Square 3 Planning Stages Silverwing Development 200 Victorian Square 3 Planning Stages Silverwing Development 100 Victorian Square 3 Planning Stages
Spectrum-Dandini Development 420 Northeast Corner of US Highway 395 & Dandini Boulevard 3 Planning Stages The Lakes at Sky Vista 768 Sky Vista Parkway, West of Lemmon Valley Road 3 Planning Stages
LandCap Project 300± Prater Way & Vista Boulevard 4 Planning Stages Lumina-Phase I 330 Pioneer Meadows 4 Beginning Construction 2017 Lumina-Phase II 220 Pioneer Meadows 4 Beginning Construction 2018
The Point at the Marina 920 LandCap Project, East of Sparks Marina 4 Entitled for up to 920 Units Silverado Development 96 Wingfield Springs 4 Planning Stages
Park Lane-Reno Urban Development 1,619 Previous Park Lane Mall Site 7 Planning Stages Confidential 400± South Reno Market 10 Planning Stages
Steamboat Creek 468 Geiger Grade & South Virginia Street 10 Planning Stages The Harvest-Phase II 300 Damonte Ranch 10 Planning Stages
Total Units: 7,822
In addition to the above projects, a number of smaller apartment projects, including market rate and tax credit projects, are in the planning stages. A number of land owners are also going through the entitlement process for apartments, in order to sell or develop the properties.

Apartment Survey – 2nd Quarter 2017 12
ABSORPTION The chart below summarizes the absorption rates of several market apartment projects in the Reno-Sparks area between 2002 and a current date, and includes the recent absorption rates of Square One and the 3rd Street Flats.
HISTORICAL & CURRENT ABSORPTION RATES
Project Name # of Units Lease up Dates Absorption Start Stabilized Per Month
Sharlands Terrace 304 Mar-00 Jan-02 13.22 Canyon Hills Phase I 256 Jun-01 Jul-02 18.29 The Village at Wildcreek 240 Jul-01 Sep-02 16.00 Aviana at Tuscany 311 Jul-01 Apr-03 14.14 Silver Creek 376 Jan-01 Aug-03 11.75 Villas at D’Andrea 256 Apr-02 Dec-03 12.19 Marina Village 240 Oct-04 Oct-06 10.00 Horizons at South Meadows 344 Nov-05 Jan-07 22.93 Caviata at Kiley Ranch 184 Jun-07 Oct-09 6.10 Waterstone at Kiley Ranch 203 Jul-07 Oct-09 7.00 The View Apartments 308 Apr-09 Jan-11 13.33 The Trails at Pioneer Meadows 300 Aug-09 Jul-11 11.78 The Alexander at South Virginia 350 Aug-09 Jul-11 13.87 The Village at Arrowcreek 208 Oct-13 Feb-15 11.56 The Bungalows at Sky Vista-Phase I 338 Mar-14 Nov-15 16.10 The Villas at Keystone Canyon 288 Sep-14 Nov-15 19.20 Edge Water at Virginia Lake 284 May-15 Sep-16 16.71 Square One 100 Jun-16 Feb-17 11.11 3rd Street Flats 94 Dec-16 Jun-17 13.43

Apartment Survey – 2nd Quarter 2017 13
RENT CONCESSIONS During the 2nd Quarter of 2017 2.35% of the apartment projects in our Survey offered rent concessions, in comparison to 7.14% in the 1st Quarter of 2017. Concessions range from discounted deposits to one month free rent with a six or twelve-month lease. The most commonly found rent concessions consist of:
• One month free rent • Discounted deposit • Reduced Rent with 6 or 12 month lease
The chart below and the graph on the following page summarize the percentage of projects which have offered concessions, and the overall vacancy rate, between 2011 and a current date. It is recognized that an increasing number of apartment projects are utilizing YieldStar, and concessions are not reported separately by the apartment managers.
REGIONAL CONCESSION HISTORY Quarter/Year % Offering Concessions Overall Vacancy %
Q1-2011 82.43% 5.64% Q2-2011 76.32% 5.51% Q3-2011 72.37% 5.38% Q4-2011 74.03% 6.56% Q1-2012 71.43% 5.59% Q2-2012 66.23% 5.13% Q3-2012 61.04% 4.83% Q4-2012 66.23% 5.60% Q1-2013 57.14% 5.11% Q2-2013 48.05% 4.65% Q3-2013 37.18% 4.05% Q4-2013 44.87% 4.12% Q1-2014 37.18% 3.83% Q2-2014 32.89% 2.41% Q3-2014 24.36% 2.13% Q4-2014 35.06% 3.31% Q1-2015 35.90% 2.97% Q2-2015 16.67% 2.27% Q3-2015 20.25% 2.67% Q4-2015 14.81% 2.90% Q1-2016 12.35% 2.30% Q2-2016 6.17% 1.98% Q3-2016 4.82% 2.24% Q4-2016 10.84% 2.93% Q1-2017 7.14% 2.23% Q2-2017 2.35% 1.17%

Apartment Survey – 2nd Quarter 2017 14
SURVEY RESULTS
This section of the report covers survey findings pertaining to the total survey area for the 2nd Quarter of 2017. OVERALL QUARTERLY TRENDS: The graphs in this section illustrate percentage vacant, percentage of rent increases or decreases and average monthly rent per quarter. The following graphs are included in overall trends: Overall Reno/Sparks Averages Overall Trends For Studio Units Overall Trends For 1 Bedroom/1 Bath Units Overall Trends For 2 Bedroom/1Bath Units Overall Trends For 2 Bedroom/2 Bath Units Overall Trends For 3 Bedroom/2 Bath Units Overall Trends For Townhouse Units Average Rent Per Unit Type TRENDS PER MARKET AREA: These graphs illustrate quarterly vacancy percentage and average monthly rent. The sub-market categories are as follows: Area 1-Northwest Reno Area 2-Northeast Reno Area 3-West Sparks/North Valleys Area 4-East Sparks Area 5-West Reno Area 6-Southwest Reno Area 7-Brinkby/Grove Area 8-Airport Area 9-Lakeridge Area 10-Southeast Reno Area 11-Downtown Urban CURRENT SURVEY COMPARISONS: This section of graphs illustrates overall comparisons based on unit type and sub-market categories. These graphs include: Summary By Unit Type Summary By Area 15 Properties With The Highest Average Rents

Apartment Survey – 2nd Quarter 2017 15
OVERALL RENO/SPARKS RENT & VACANCY DATA-ALL UNIT TYPES
Category 2nd Quarter 2017 Average Square Feet Per Unit Surveyed 888± Square Feet Average Rent For Units Surveyed $1,194 Per Month Average Rent Per Square Foot For Units Surveyed $1.34 Per Square Foot Average Overall Vacancy Rate For Units Surveyed 1.17%

Apartment Survey – 2nd Quarter 2017 16
OVERALL RENO/SPARKS RENT & VACANCY DATA-STUDIO UNITS
Category 2nd Quarter 2017 Average Square Feet Per Unit Surveyed 404± Square Feet Average Rent For Units Surveyed $715 Per Month Average Rent Per Square Foot For Units Surveyed $1.77 Per Square Foot Average Overall Vacancy Rate For Units Surveyed 1.17%

Apartment Survey – 2nd Quarter 2017 17
OVERALL RENO/SPARKS RENT & VACANCY DATA-1 BED/1 BATH UNITS
Category 2nd Quarter 2017 Average Square Feet Per Unit Surveyed 720± Square Feet Average Rent For Units Surveyed $1,060 Per Month Average Rent Per Square Foot For Units Surveyed $1.47 Per Square Foot Average Overall Vacancy Rate For Units Surveyed 1.28%

Apartment Survey – 2nd Quarter 2017 18
OVERALL RENO/SPARKS RENT & VACANCY DATA-2 BED/1 BATH UNITS
Category 2nd Quarter 2017 Average Square Feet Per Unit Surveyed 862± Square Feet Average Rent For Units Surveyed $1,081 Per Month Average Rent Per Square Foot For Units Surveyed $1.25 Per Square Foot Average Overall Vacancy Rate For Units Surveyed 0.95%

Apartment Survey – 2nd Quarter 2017 19
OVERALL RENO/SPARKS RENT & VACANCY DATA-2 BED/2 BATH UNITS
Category 2nd Quarter 2017 Average Square Feet Per Unit Surveyed 1,041± Square Feet Average Rent For Units Surveyed $1,353 Per Month Average Rent Per Square Foot For Units Surveyed $1.30 Per Square Foot Average Overall Vacancy Rate For Units Surveyed 1.15%

Apartment Survey – 2nd Quarter 2017 20
OVERALL RENO/SPARKS RENT & VACANCY DATA-3 BED/2 BATH UNITS
Category 2nd Quarter 2017 Average Square Feet Per Unit Surveyed 1,266± Square Feet Average Rent For Units Surveyed $1,595 Per Month Average Rent Per Square Foot For Units Surveyed $1.26 Per Square Foot Average Overall Vacancy Rate For Units Surveyed 1.05%

Apartment Survey – 2nd Quarter 2017 21
OVERALL RENO/SPARKS RENT & VACANCY DATA-TOWNHOUSE UNITS
Category 2nd Quarter 2017 Average Square Feet Per Unit Surveyed 1,298± Square Feet Average Rent For Units Surveyed $1,338 Per Month Average Rent Per Square Foot For Units Surveyed $1.03 Per Square Foot Average Overall Vacancy Rate For Units Surveyed 1.85 %

Apartment Survey – 2nd Quarter 2017 22
AREA 1-NORTHWEST RENO AVERAGE RENT & VACANCY DATA
Category 2nd Quarter 2017 Total Projects Surveyed 15 Projects Total Units Surveyed 4,030 Units Average Square Feet Per Unit Surveyed 905± Square Feet Average Rent For Units Surveyed $1,301 Per Month Average Rent Per Square Foot For Units Surveyed $1.44 Per Square Foot Average Overall Vacancy Rate For Units Surveyed 1.02% # of Projects Offering Concessions As Of Date Surveyed 0 Projects

Apartment Survey – 2nd Quarter 2017 23
AREA 2-NORTHEAST RENO AVERAGE RENT & VACANCY DATA
Category 2nd Quarter 2017 Total Projects Surveyed 6 Projects Total Units Surveyed 1,316 Units Average Square Feet Per Unit Surveyed 853± Square Feet Average Rent For Units Surveyed $1,081 Per Month Average Rent Per Square Foot For Units Surveyed $1.27 Per Square Foot Average Overall Vacancy Rate For Units Surveyed 0.84% # of Projects Offering Concessions As Of Date Surveyed 0 Projects

Apartment Survey – 2nd Quarter 2017 24
AREA 3-WEST SPARKS/NORTH VALLEYS AVERAGE RENT & VACANCY DATA
Category 2nd Quarter 2017 Total Projects Surveyed 13 Projects Total Units Surveyed 3,034 Units Average Square Feet Per Unit Surveyed 861± Square Feet Average Rent For Units Surveyed $1,013 Per Month Average Rent Per Square Foot For Units Surveyed $1.18 Per Square Foot Average Overall Vacancy Rate For Units Surveyed 1.62% # of Projects Offering Concessions As Of Date Surveyed 1 Project

Apartment Survey – 2nd Quarter 2017 25
AREA 4-EAST SPARKS AVERAGE RENT & VACANCY DATA
Category 2nd Quarter 2017 Total Projects Surveyed 13 Projects Total Units Surveyed 3,551 Units Average Square Feet Per Unit Surveyed 963± Square Feet Average Rent For Units Surveyed $1,475 Per Month Average Rent Per Square Foot For Units Surveyed $1.53 Per Square Foot Average Overall Vacancy Rate For Units Surveyed 1.86% # of Projects Offering Concessions As Of Date Surveyed 0 Projects
Apartment Survey – 2nd Quarter 2017 26
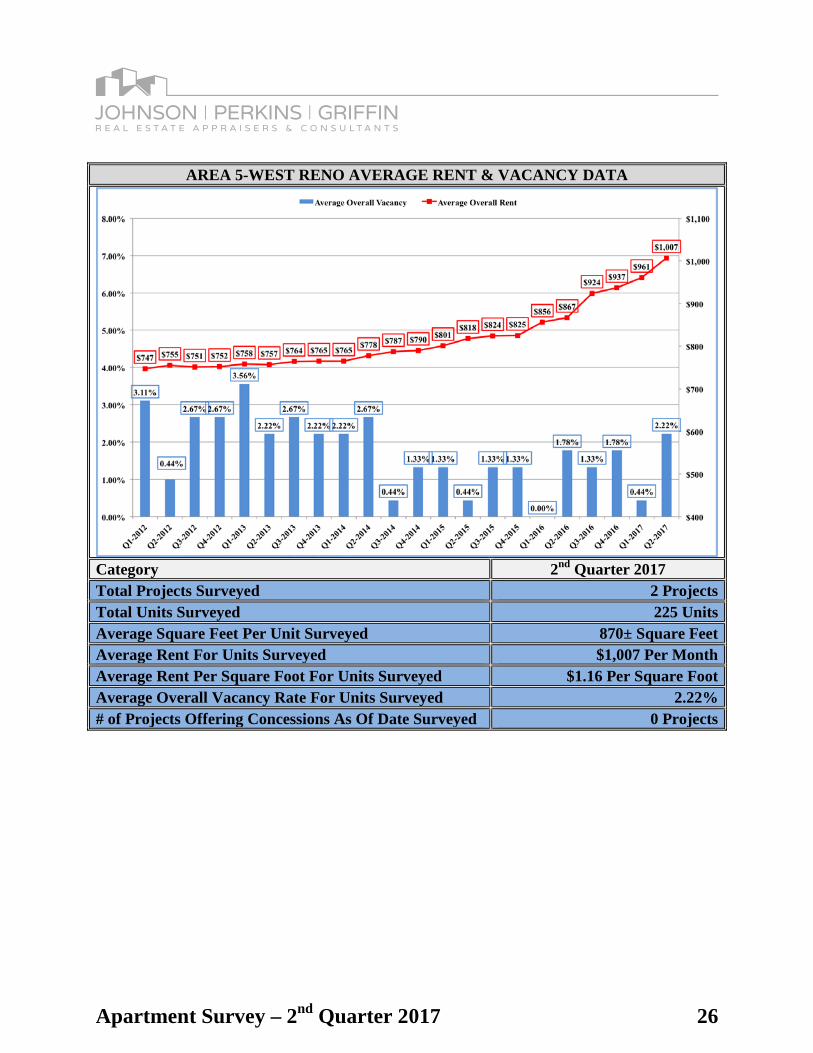
AREA 5-WEST RENO AVERAGE RENT & VACANCY DATA
Category 2nd Quarter 2017 Total Projects Surveyed 2 Projects Total Units Surveyed 225 Units Average Square Feet Per Unit Surveyed 870± Square Feet Average Rent For Units Surveyed $1,007 Per Month Average Rent Per Square Foot For Units Surveyed $1.16 Per Square Foot Average Overall Vacancy Rate For Units Surveyed 2.22% # of Projects Offering Concessions As Of Date Surveyed 0 Projects

Apartment Survey – 2nd Quarter 2017 27
AREA 6-SOUTHWEST RENO AVERAGE RENT & VACANCY DATA
Category 2nd Quarter 2017 Total Projects Surveyed 5 Projects Total Units Surveyed 1,251 Units Average Square Feet Per Unit Surveyed 841± Square Feet Average Rent For Units Surveyed $1,050 Per Month Average Rent Per Square Foot For Units Surveyed $1.25 Per Square Foot Average Overall Vacancy Rate For Units Surveyed 1.04% # of Projects Offering Concessions As Of Date Surveyed 0 Projects

Apartment Survey – 2nd Quarter 2017 28
AREA 7-BRINKBY/GROVE AVERAGE RENT & VACANCY DATA
Category 2nd Quarter 2017 Total Projects Surveyed 7 Projects Total Units Surveyed 1,210 Units Average Square Feet Per Unit Surveyed 803± Square Feet Average Rent For Units Surveyed $815 Per Month Average Rent Per Square Foot For Units Surveyed $1.02 Per Square Foot Average Overall Vacancy Rate For Units Surveyed 0.74% # of Projects Offering Concessions As Of Date Surveyed 7 Projects

Apartment Survey – 2nd Quarter 2017 29
AREA 8-AIRPORT AVERAGE RENT & VACANCY DATA
Category 2nd Quarter 2017 Total Projects Surveyed 4 Projects Total Units Surveyed 560 Units Average Square Feet Per Unit Surveyed 869± Square Feet Average Rent For Units Surveyed $924 Per Month Average Rent Per Square Foot For Units Surveyed $1.06 Per Square Foot Average Overall Vacancy Rate For Units Surveyed 0.54% # of Projects Offering Concessions As Of Date Surveyed 0 Projects

Apartment Survey – 2nd Quarter 2017 30
AREA 9-LAKERIDGE AVERAGE RENT & VACANCY DATA
Category 2nd Quarter 2017 Total Projects Surveyed 5 Projects Total Units Surveyed 1,252 Units Average Square Feet Per Unit Surveyed 927± Square Feet Average Rent For Units Surveyed $1,285 Per Month Average Rent Per Square Foot For Units Surveyed $1.39 Per Square Foot Average Overall Vacancy Rate For Units Surveyed 1.60% # of Projects Offering Concessions As Of Date Surveyed 0 Projects

Apartment Survey – 2nd Quarter 2017 31
AREA 10-SOUTHEAST RENO AVERAGE RENT & VACANCY DATA
Category 2nd Quarter 2017 Total Projects Surveyed 13 Projects Total Units Surveyed 4,654 Units Average Square Feet Per Unit Surveyed 879± Square Feet Average Rent For Units Surveyed $1,184 Per Month Average Rent Per Square Foot For Units Surveyed $1.35 Per Square Foot Average Overall Vacancy Rate For Units Surveyed 0.49% # of Projects Offering Concessions As Of Date Surveyed 0 Projects
Apartment Survey – 2nd Quarter 2017 32
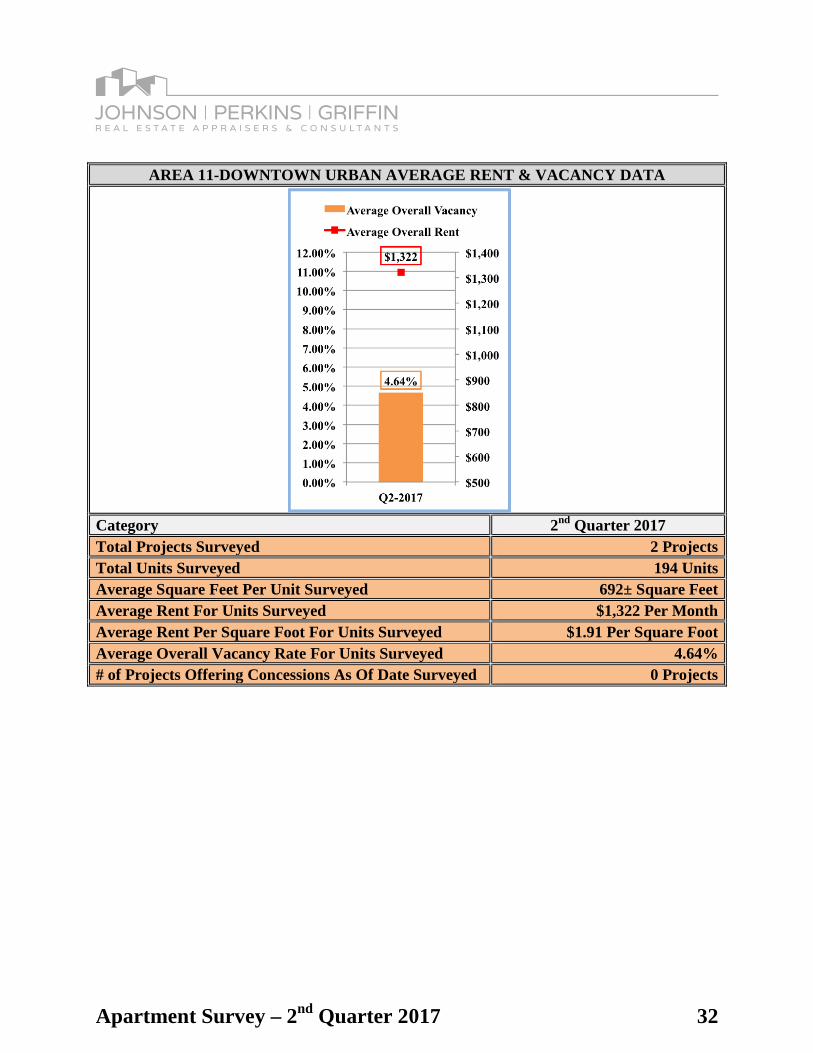
AREA 11-DOWNTOWN URBAN AVERAGE RENT & VACANCY DATA
Category 2nd Quarter 2017 Total Projects Surveyed 2 Projects Total Units Surveyed 194 Units Average Square Feet Per Unit Surveyed 692± Square Feet Average Rent For Units Surveyed $1,322 Per Month Average Rent Per Square Foot For Units Surveyed $1.91 Per Square Foot Average Overall Vacancy Rate For Units Surveyed 4.64% # of Projects Offering Concessions As Of Date Surveyed 0 Projects

Apartment Survey – 2nd Quarter 2017 33
SUMMARY BY UNIT TYPE-AVERAGE RENT & VACANCY DATA
AVERAGE SIZE, AVERAGE RENT & AVERAGE VACANCY RATE BY UNIT TYPE
CATEGORY STUDIOS 1 BED/
1 BATH 2 BED/
1 BATH 2 BED/
2 BATH 3 BED/
2 BATH TOWNHOMES TOTALS Average SF-By Unit Type 404 SF 720 SF 862 SF 1,041 SF 1,266 SF 1,298 SF 888 SF Average Rent-By Unit Type $715 $1,060 $1,081 $1,353 $1,595 $1,338 $1,194 Average Rent/SF-By Unit Type $1.77 $1.47 $1.25 $1.30 $1.26 $1.03 $1.34 Indicated Vacancy Rate-By Unit Type 1.17% 1.28% 0.95% 1.15% 1.05% 1.85% 1.17%

Apartment Survey – 2nd Quarter 2017 34
SUMMARY BY MARKET AREA-AVERAGE RENT & VACANCY DATA
Area Sub-Market Average Rent 2nd Qtr. 2017
Average Vacancy 2nd Qtr. 2017
1 Northwest Reno $1,301 1.02% 2 Northeast Reno $1,081 0.84% 3 W. Sparks/N. Valley $1,013 1.62% 4 East Sparks $1,475 1.86% 5 West Reno $1,007 2.22% 6 Southwest Reno $1,050 1.04% 7 Brinkby/Grove $815 0.74% 8 Airport $924 0.54% 9 Lakeridge $1,285 1.60% 10 Southeast Reno $1,184 0.49% 11 Downtown Urban $1,322 4.64%
Overall Reno-Sparks $1,194 1.17%

Apartment Survey – 2nd Quarter 2017 35
15 PROPERTIES WITH HIGHEST AVERAGE RENTS-AVERAGE RENT & VACANCY DATA
CATEGORY STUDIOS 1 BED/ 1 BATH
2 BED/ 1 BATH
2 BED/ 2 BATH
3 BED/ 2 BATH TOWNHOME TOTALS
Total Number of Units-By Unit Type N/A 1,457 Units 24 Units 2,132 Units 442 Units N/A 4,055 Units Average SF-By Unit Type N/A 818 SF 993 SF 1,162 SF 1,376 SF N/A 1,061 SF Average Rent-By Unit Type N/A $1,400 $1,600 $1,705 $2,010 N/A $1,628 Average Rent/SF-By Unit Type N/A $1.71 $1.61 $1.47 $1.46 N/A $1.53 Indicated Vacancy Rate-By Unit Type N/A 2.40% 0.00% 1.31% 1.36% N/A 1.70%

Apartment Survey – 2nd Quarter 2017 36
SURVEY PARTICIPANTS Special thanks to the following apartment complexes for their continued and reliable support:
3rd Street Flats Reflections at the Marina Aviana at Tuscany Spring Villas Townhomes Club Ambassador The Trails at Pioneer Meadows Manzanita Gate The Villas at D’Andrea
Montebello at Summit Ridge Waterstone at Kiley Ranch Northwind Apartments Willow Creek Villas
Sharlands Terrace The Park at Idlewild Shoreline Plaza Waters Edge Apartments
Silver Ridge Apartments Edge Water at Virginia Lake The Boulders Lakeview Apartments
The Villas at Keystone Canyon Plumas Gardens Truckee River Terrace Sundance West
Vista Ridge Apartments Willowbrook Apartments Vizcaya Hilltop Apartments Ala Moana Apartments
Westcreek Apartments Century Park Apartments Westridge Apartments Palace Apartments
El Chaparral Regency Park Apartments Green Pines Roselake Apartments
Northtowne Summit Sherwood Forest Reno Vista Apartments Southwest Village Riverwood Apartments Balfour Place The View Apartments Brooktree Apartments
1100 Place Kirman Gardens Lansdowne House The Meadows II
Sandpebble Aspen Ridge Sierra Point Apartments Lakeridge East Apartments Sierra Sage Apartments Redfield Ridge Sierra View Apartments Skyline Canyon
Sierra Woods The Lodge at McCarran Ranch Silver Lake Apartments Bristle Pointe
Sky Vista Commons Creekside Apartments Spanish Oaks Horizons at South Meadows Square One Meadowood Apartments
Stonegate Apartments Rosewood Park The Bungalows at Sky Vista The Alexander at South Virginia
The Village at Wildcreek The Element Canyon Vista Apartments The Enclave
Caviata at Kiley Ranch The Phoenix Reno Eastland Hills The Village at Arrowcreek
High Rock 5300 The Village at Iron Blossom Marina Garden Apartments Village of the Pines
Marina Village Vintage at South Meadows Park Vista