Product landscape In india - Presentation by NASSCOM & Zinnov
Upload
productnationinCategory
view
845download
3
Previous Next
9:12 AMFriday, January 24, 2014
Click to start
Zinnov Consumer Mobility & E-commerce Survey

Previous Next
Contact Us
Consumer Mobility
Ecommerce

Previous Next
Ecommerce
Application Usage
Device Change Trend
Place of Purchase
App Authenticity
Concern
Spending on Devices
Ad Clicking Behavior
Devices Adoption
Payment Mechanisms
Consumer Mobility
Previous NextDevice Adoption
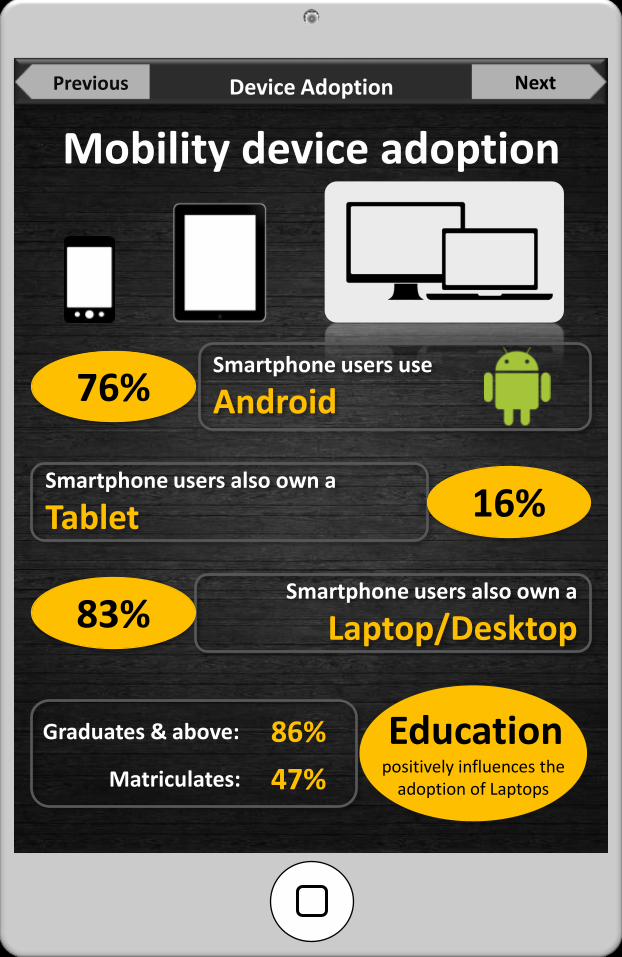
Mobility device adoption
Smartphone users also own a
Tablet 16%
Matriculates:
Graduates & above: 86%
47%
Educationpositively influences the
adoption of Laptops
Smartphone users also own a
Laptop/Desktop83%
76%Smartphone users use
Android
Previous NextDevice Change Trend (1/2)
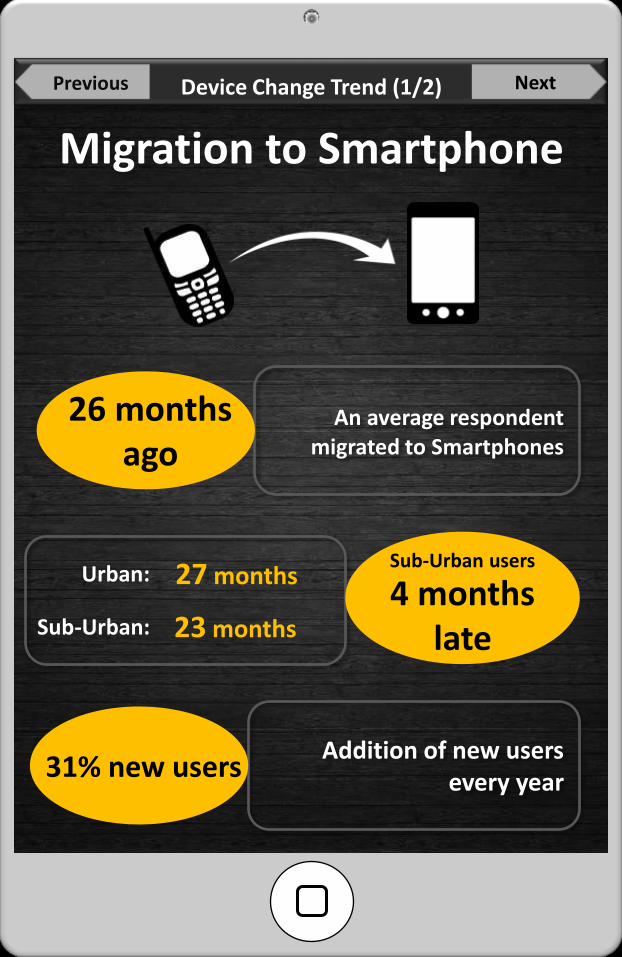
Migration to Smartphone
An average respondent migrated to Smartphones
26 months ago
Addition of new users every year
31% new users
Urban:
Sub-Urban:
27 months
23 months4 months
late
Sub-Urban users

Previous NextDevice Change Trend (2/2)
39% users Retain Smartphones for at least 2 years
Retention of Smartphones
Urban :
Sub- Urban :
42%
31%
Urban users
more prone to retain smartphones
Age < 40 years :
Age > 60 years :
39%
56%
Retention increases
with Age
Retention of smartphones for at least 2 years
Previous Next
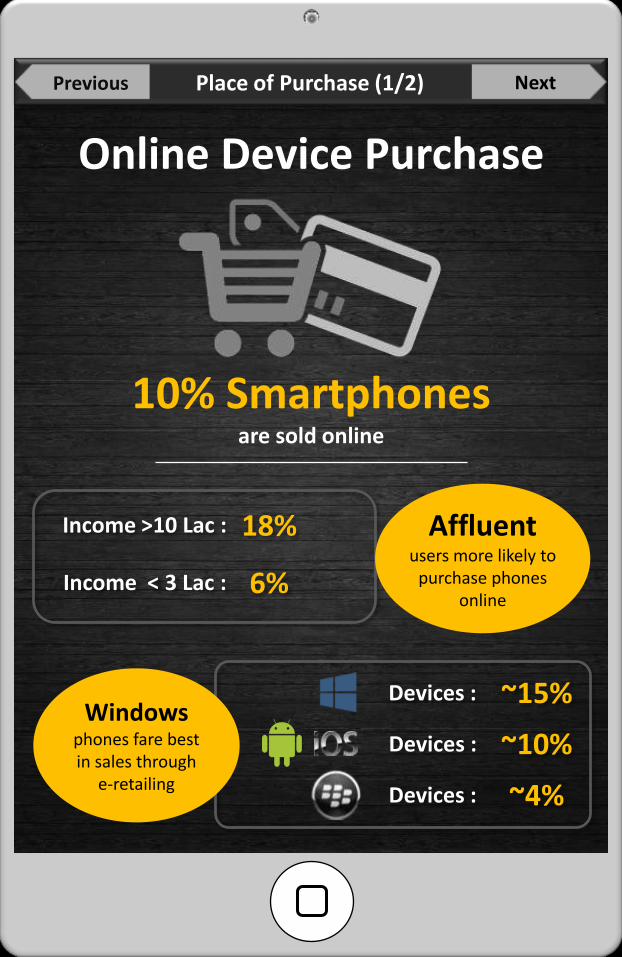
Online Device Purchase
~15%Devices :
~10%Devices :
Devices : ~4%
Windows phones fare best in sales through
e-retailing
18%Income >10 Lac :
6%Income < 3 Lac :
Affluentusers more likely to
purchase phones online
10% Smartphonesare sold online
Place of Purchase (1/2)
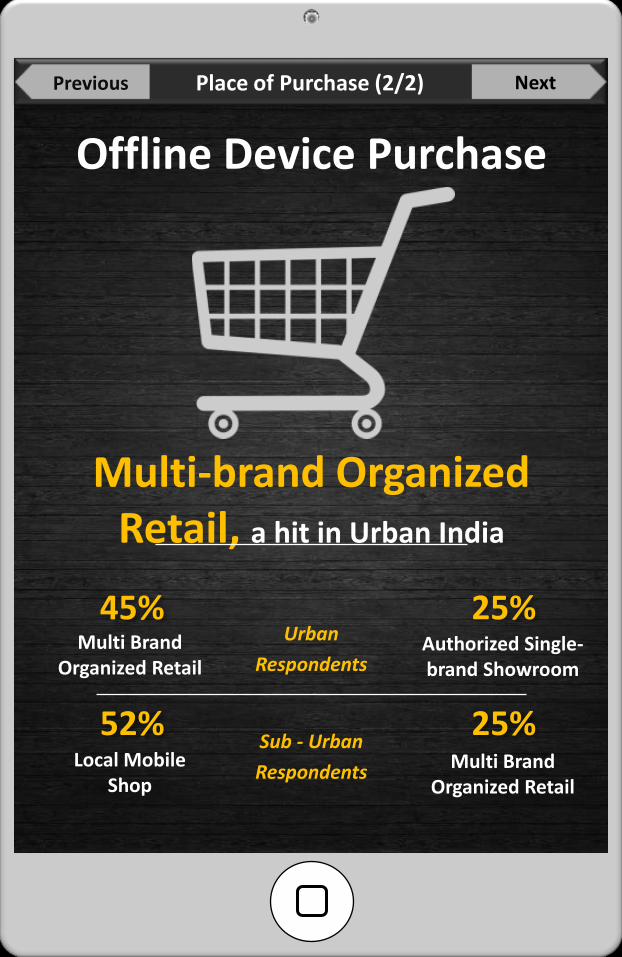
Previous NextPlace of Purchase (2/2)
Multi-brand Organized Retail, a hit in Urban India
45%Multi Brand
Organized Retail
25%Authorized Single-brand Showroom
Urban
Respondents
52%Local Mobile
Shop
25%Multi Brand
Organized Retail
Sub - Urban
Respondents
Offline Device Purchase

Previous NextSpending on Devices (1/2)
Substantial spending on smartphones, even in suburbs
18,230 Average Smartphone Price
*All values in INR
Urban :
Sub- Urban :
20,15013,680
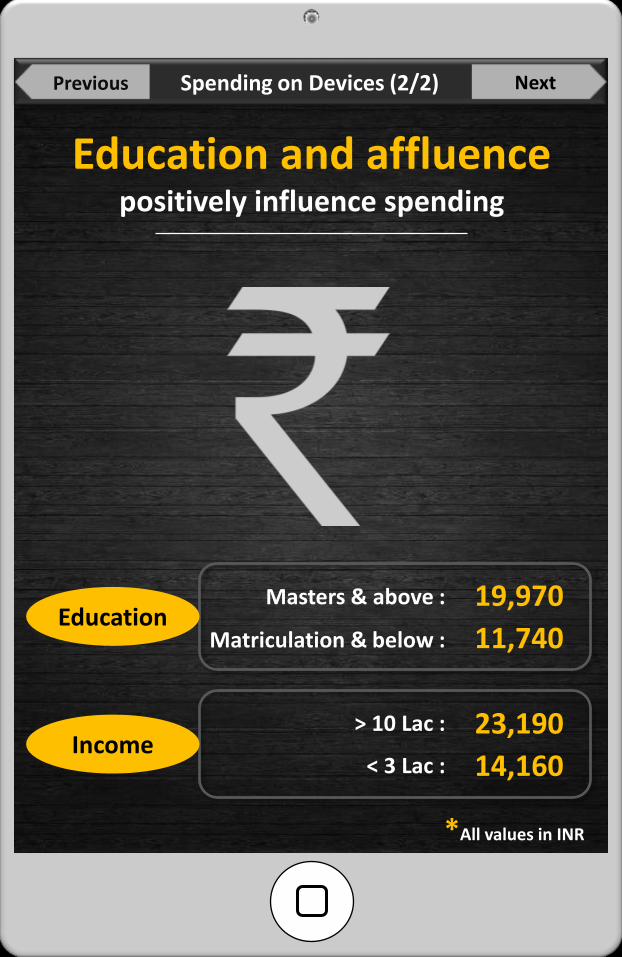
Previous NextSpending on Devices (2/2)
Education and affluence positively influence spending
*All values in INR
Masters & above :
Matriculation & below :
19,970
11,740
> 10 Lac :
< 3 Lac :
23,190
14,160
Education
Income

Previous NextPayment Mechanism
*For Buying Devices
**89% sub-urban respondents prefer to pay by cheque/cash
Urban :
Sub- Urban** :
41%
5%
> 10 Lac :
< 3 Lac :
44%
20%
Location
Income
Plastic money usage* high in Urban and Affluent Respondents

Previous NextApplication Usage (1/4)
87%Respondents
download Apps
83%Do Not Purchase
Any Apps
Despite high usage, tendency to purchase apps low
INR 417*Average
Spendingon Apps
26 Apps*Average # of
Apps Downloaded
6 Apps*Average # of
Apps Purchased
*Figures are for those who purchase Apps

Previous NextApplication Usage (2/4)
More apps downloaded by Youngrespondents compared with elders
~2x Age 16-20 yrs: 29
13Age > 60 yrs:
Urban: 28
22Sub-Urban:More apps downloaded by Urban
users compared to Sub-Urban
27%
Male: 28
22Female:More apps downloaded by Male
users compared to females
27%
Trends in App Downloads
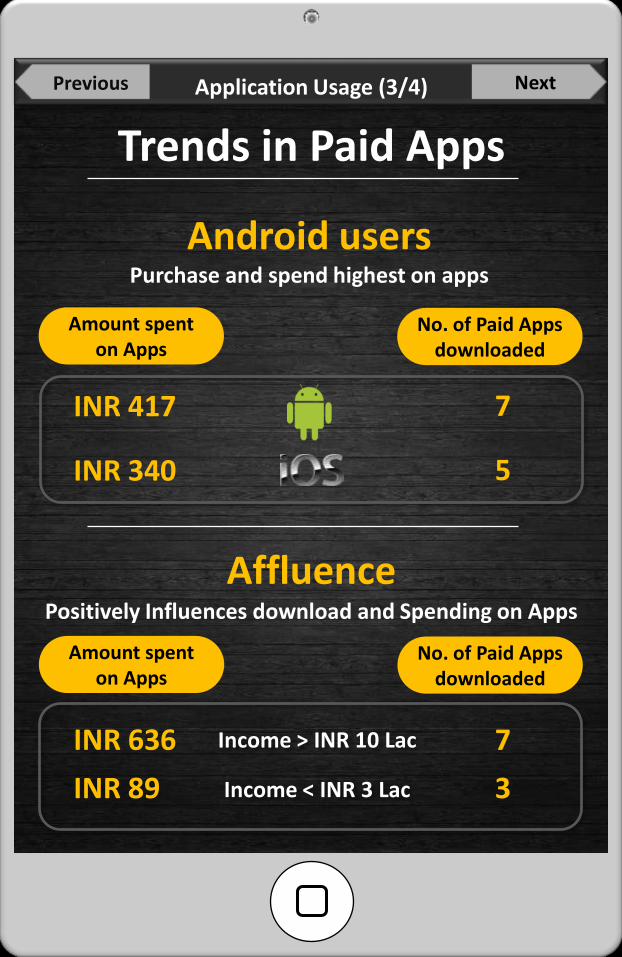
Previous NextApplication Usage (3/4)
Trends in Paid Apps
AffluencePositively Influences download and Spending on Apps
Android users Purchase and spend highest on apps
Income > INR 10 Lac
Income < INR 3 Lac
INR 636
INR 89
7
3
7
5
INR 417
INR 340
Amount spent on Apps
No. of Paid Apps downloaded
Amount spent on Apps
No. of Paid Apps downloaded

Previous NextApplication Usage (4/4)
App Use Cases
High Usage Among Urban and Sub-urban Respondents
AlikeMusic/Video
Internet Surfing
88%
93%86%
Social Networking
95%Gaming
83%

Previous NextApp Authenticity Concern
~46%* users not concerned About App Authenticity
Checks to Ensure Authenticity
68%**
Consumer Reviews
27%**
Developers Profile
24%**
Consultation with friends and peers
Indifference to Authenticity
Urban
40%*Sub-urban
60%*Higher in Suburbs:
Linked with Age:
60+ years
100%*21-25 years
42%*
<<
<<
*Among respondents who download Apps
* *Among respondents who download Apps and are concerned
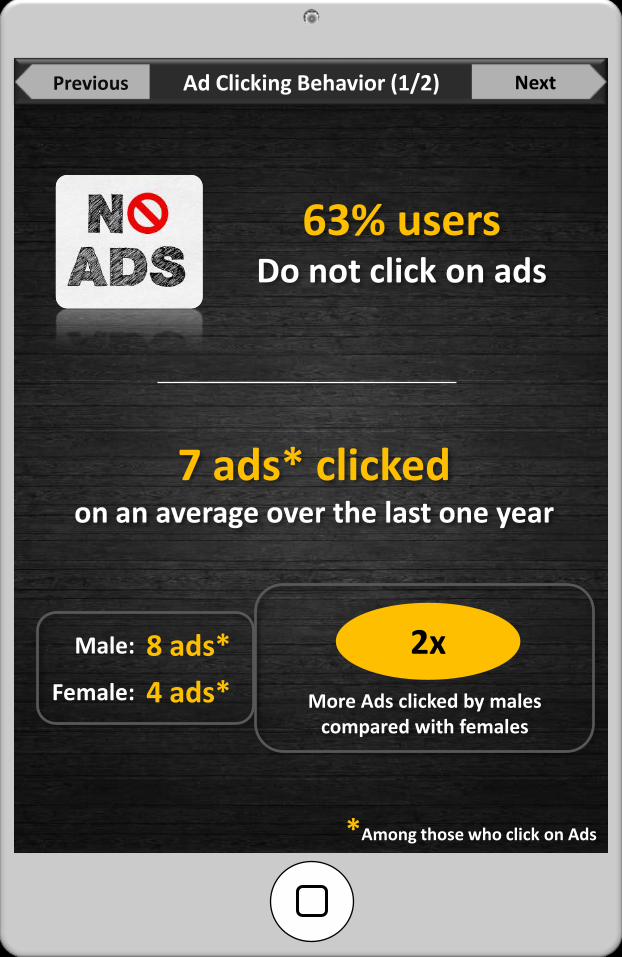
Previous NextAd Clicking Behavior (1/2)
63% users Do not click on ads
Male: 8 ads*
4 ads*Female:
*Among those who click on Ads
More Ads clicked by males compared with females
2x
7 ads* clicked on an average over the last one year

Previous NextAd Clicking Behavior (2/2)
Incentivizing Ad Clicking
Interested
NotInterested
3/4th users uninterested in sharing demographic data in exchange
of incentives
Ads Most clicked
*Among those who click on Ads
46%*respondents
54%* respondents
E-commerceGamingHealth and
Wellness
10%*respondents

Previous Next
Consumer Mobility Ecommerce
Top E-com Websites
Initiation to E-com Sites
Deterrents to E-com Adoption
E-com on Mobility Devices
E-commerce as Info Medium
Purchasing Trends
Payment Mechanisms
Adoption of E-commerce
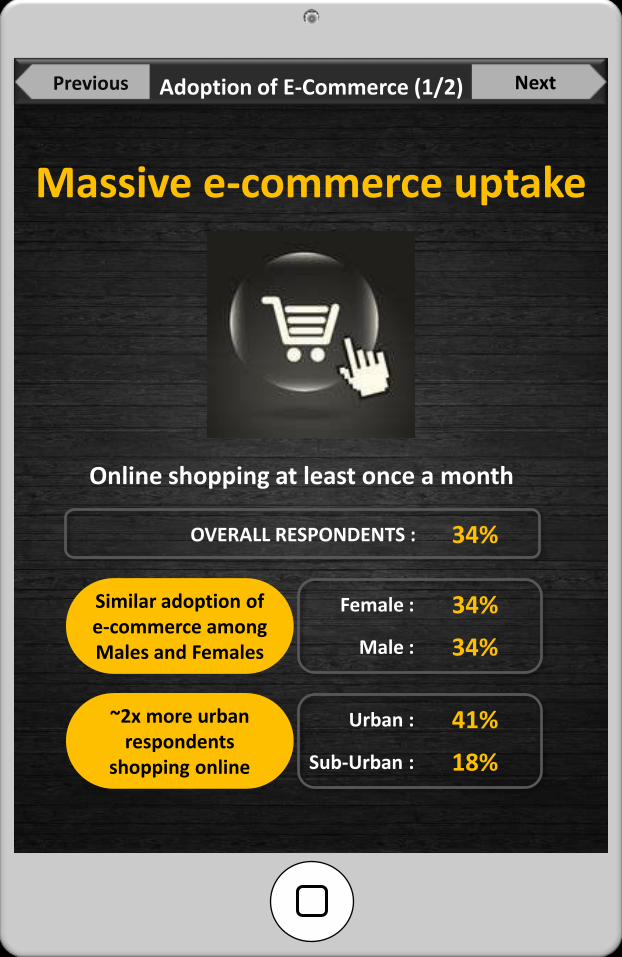
Previous NextAdoption of E-Commerce (1/2)
Massive e-commerce uptake
OVERALL RESPONDENTS : 34%
Female :
Male :
34%
34%
Similar adoption of e-commerce among Males and Females
Urban :
Sub-Urban :
41%
18%
~2x more urban respondents
shopping online
Online shopping at least once a month
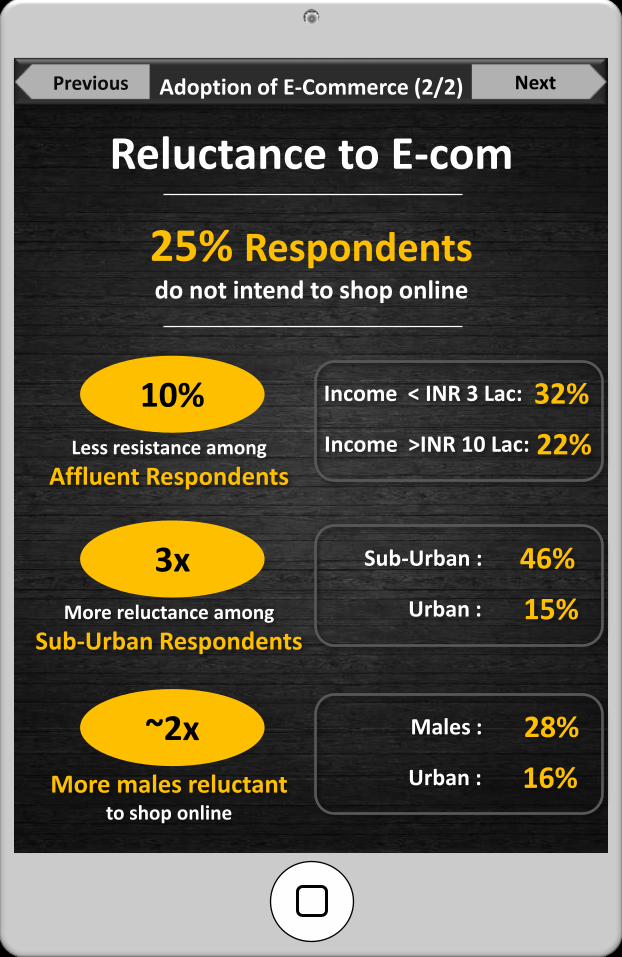
Previous NextAdoption of E-Commerce (2/2)
Reluctance to E-com
32%Income < INR 3 Lac:
22%Income >INR 10 Lac:
25% Respondents do not intend to shop online
46%Sub-Urban :
15%Urban :
Less resistance among
Affluent Respondents
10%
More reluctance among
Sub-Urban Respondents
3x
28%Males :
16%Urban :More males reluctant to shop online
~2x

Previous NextE-com as Info Medium
~50% consumers Use E-com websites to
research on Products before buying them Offline
Urban Respondents :
Sub-Urban Respondents :
64%
20%
E-com websites widely used as
Medium of Information
Tendency higher among urban respondents

Previous NextPurchasing Trends (1/2)
Substantial Percentage of Monthly Budgets spent on
E-commerce
Affluent Respondents spend higher share of
wallet online
Income < 3 Lac :
Income > 10 Lac :
14%
19%
Education positively influences the spending
on E-commerce
Matriculates & less :
Graduates & above :
12%
19%
Average share of e-commerce in expenditures: 19%
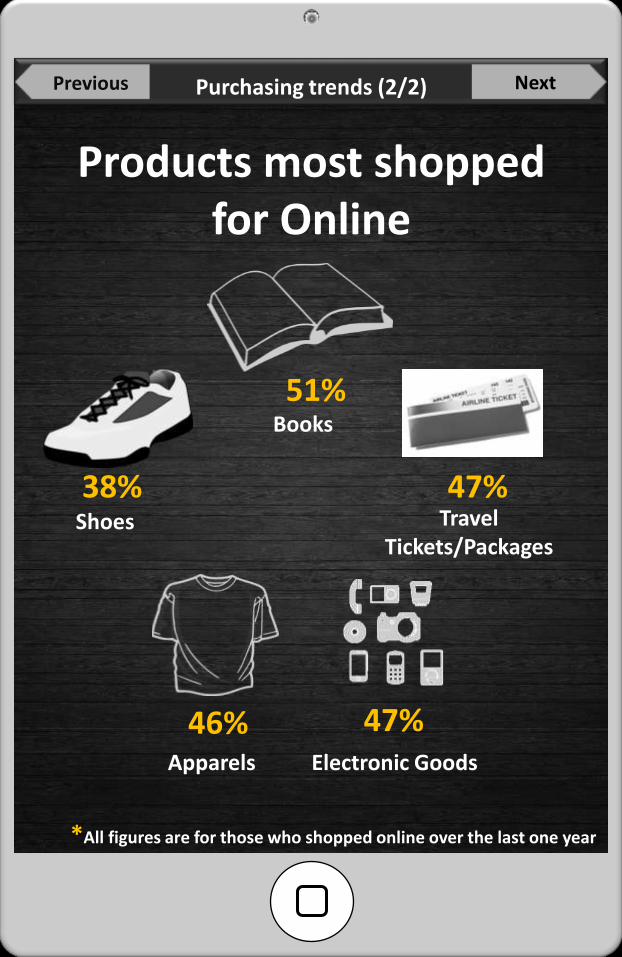
Previous NextPurchasing trends (2/2)
Products most shopped for Online
Books
51%
46%Electronic GoodsApparels
47%
Travel Tickets/Packages
47%Shoes
38%
*All figures are for those who shopped online over the last one year
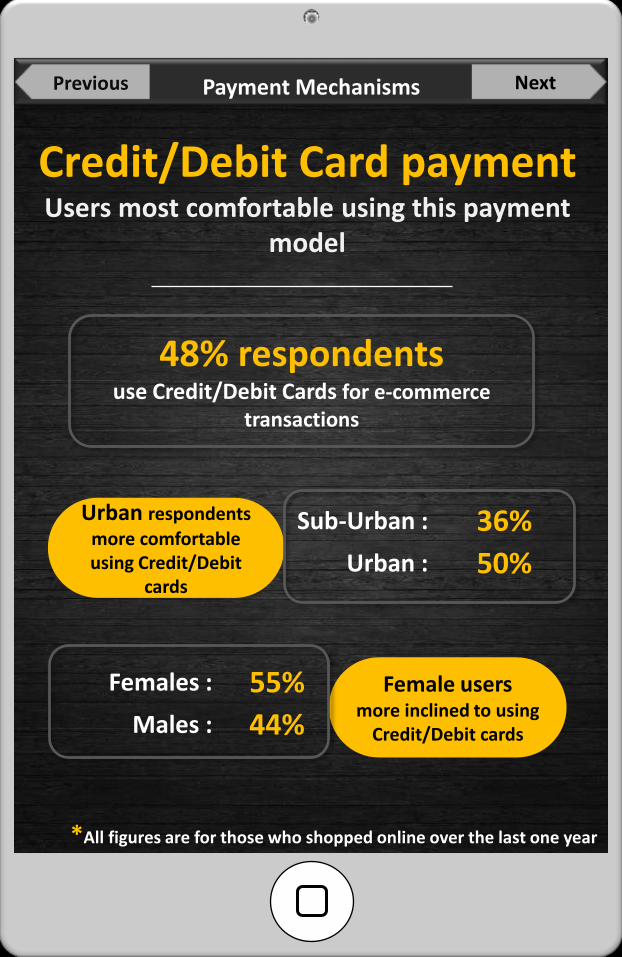
Previous NextPayment Mechanisms
Credit/Debit Card paymentUsers most comfortable using this payment
model
48% respondents use Credit/Debit Cards for e-commerce
transactions
Urban respondents
more comfortable using Credit/Debit
cards
Sub-Urban :
Urban :
36%
50%
Female users more inclined to using
Credit/Debit cards
Females :
Males :
55%
44%
*All figures are for those who shopped online over the last one year
Previous NextTop E-com Sites
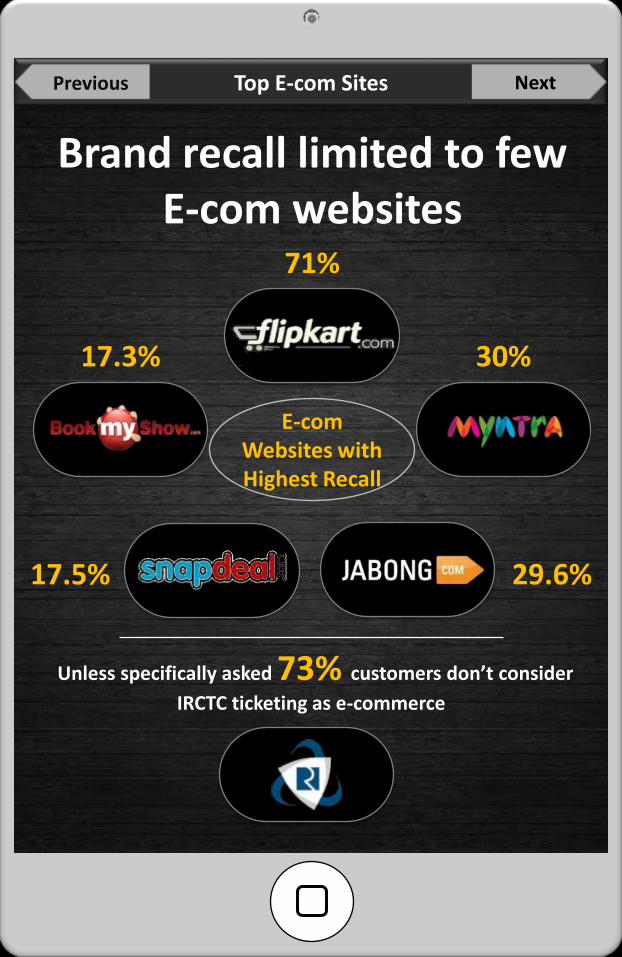
Unless specifically asked 73% customers don’t consider
IRCTC ticketing as e-commerce
Brand recall limited to few E-com websites
71%
17.3%
17.5% 29.6%
30%
E-com Websites with Highest Recall

Previous NextInitiation to E-com Sites
Peer Recommendations critical to site selection
13% Influenced by TV ads
40% on Peer Suggestion
35% Through Product Web Search
Initiation on an E-commerce site:

Previous NextDeterrents to E-commerce
31% respondentsBelieve that a local intermediary will help uptake of
E-commerce
Key deterrents to E-com
Concerns regarding product quality
Fear of wrong product delivery
Immediate Product delivery
Preference to visit shops
36%
29.7% 28.7%
30%

Previous NextE-com On Mobile Devices
Education and Affluencepositively influence use of Mobility Devices for
E-commerce
Mobility Devices for E-Com
35% respondents use mobility devices for e-commerce
Smartphones Tablets
Matriculates :
Graduates & above :
8%
37%
Income < 3 Lac :
Income > 10 Lac:
30%
40%
* All values for Smartphone and Tablet users who responded
23%
41%
33%
43%

Previous Next
69 "Prathiba Complex", 4th 'A' Cross, Koramangala Ind. Layout5th Block, KoramangalaBangalore – 560095Phone: +91-80-41127925/6
First Floor, Plot # 131, Sector - 44,Gurgaon – 122002Phone: +91-124- 4420100
21, Waterway AveSuite 300 The WoodlandsTX-77380 USAPhone:+1-281-362-2773
3080 Olcott Street Suite A125, Santa Clara, CA 95054 Phone: +408-716-8432
Level 42, Suntec Tower Three8 Temasek BoulevardSingapore 038988Phone:+65 6829 2123
Meilifang Tower 4, Entrance 4, 10/F #1003,11 Beiyuan Shuangying Road,Chaoyang District, BeijingChina 100012
Thank You
[email protected] www.zinnov.com
@zinnov
This report is solely for the use of Zinnov Client and Zinnov Personnel. No Part of it may be quoted, circulated or reproduced for distribution outside the client organization without prior written approval from Zinnov