NCLEX-RN PROGRAM REPORTS
52
NCLEX ® PROGRAM REPORTS for the period of APR 2015 - SEP 2015 NCLEX-RN ® REPORTS US12345678 000001 NRN001 11/02/15
Transcript of NCLEX-RN PROGRAM REPORTS
NCLEX® PROGRAM REPORTS
for the period of APR 2015 - SEP 2015
NCLEX-RN® REPORTS
US12345678 000001 NRN001 11/02/15
NCLEX ® PROGRAM REPORTSSAMPLE UNIVERSITY - RN Report Period: APR 2015 - SEP 2015
TABLE OF CONTENTS
Introduction
Using and Interpreting the NCLEX®
Program Reports
Summary Overview
NCLEX-RN®
Test Plan Report
Content Dimension Reports
Nursing Process
Categories of Human Functioning Categories of Health Alterations Wellness/Illness Continuum Stages of Maturity
Stress, Adaptation and Coping
Test Duration/Test Plan Performance Report References
NCLEX,® NCLEX-RN® and NCLEX-PN® are registered trademarks of the National Council of State Boards of Nursing, Inc.(NCSBN), Chicago, Illinois and may not be used or reproduced without written permission from NCSBN.
US12345678 000002 NRN002 11/02/15
NCLEX ® PROGRAM REPORTSINTRODUCTION
Welcome to the NCLEX® Program Reports—a subscription to information specific to your graduates´ performance on theNational Council Licensure Examination (NCLEX® examination). These reports describe how your graduates performed onseveral content dimensions compared against other programs both regionally and nationally.
There are four main sections to the NCLEX® Program Reports: Summary Overview, NCLEX-RN® Test Plan Report, ContentDimension Reports, and Test Duration/Test Plan Performance Report.
Summary Overview
The first report in the NCLEX® Program Reports is the Summary Overview. The Summary Overview provides information on(1) the rank of your program based on the percentage of your graduates that passed the NCLEX-RN® examination during thecurrent and previous reporting periods and (2) a listing of the jurisdictions where your graduates applied for licensure duringthe current and previous reporting periods.
The rank of your program is provided in comparison to other programs in your jurisdiction, all programs in every jurisdiction,and all similar program types across every jurisdiction. Please note that all program rankings are limited to those programswhere at least ten graduates tested during the reporting time interval.
The NCLEX-RN® Test Plan Report
The NCLEX-RN® Test Plan Report presents information on the percentile ranks of your typical graduate´s performancecompared to the performance of (1) graduates from your jurisdiction, (2) graduates from the same type of educationalprogram as your program, and (3) the national population of graduates. Prior to March 2000, percentile ranks were based onprogram comparisons (rather than graduate comparisons). For this reason, current results should not be compared to TestPlan Report results published prior to March 2000. This report is based on the NCLEX-RN® Test Plan. The majorcomponent of the test plan is Client Needs.
Content Dimension Reports
Each Content Dimension Report is identified in a separate section, including:• Nursing Process• Categories of Human Functioning• Categories of Health Alterations• Wellness/Illness Continuum• Stages of Maturity• Stress, Adaptation and Coping
An introduction explaining these reports is included as the first page of each Content Dimension. Because percentile ranksare now based on graduate comparisons (rather than program comparisons), current results should not be compared toContent Dimension Reports results published prior to March 2000.
Test Duration/Test Plan Performance Report
This section provides two reports, one on Test Duration and one on Test Plan Performance.
The Test Duration Report includes the average number of questions taken by graduates in your program, graduates fromyour jurisdiction, graduates from similar programs nationwide, and all graduates nationwide. The number of candidatesincludes all candidates except those testing under extended timing conditions and/or completing less than the minimumnumber of items. This report also provides the average test time in minutes and the percentage of candidates taking theminimum and maximum number of questions.
The Test Plan Performance Report includes information on performance in each of the Client Needs subcategories for yourgraduates, graduates from your jurisdiction, graduates from similar programs nationwide, and all graduates nationwide, aswell as an indication of how a candidate precisely at the passing standard would have performed (passing performance). This differs from the Test Plan Report in that performance here is defined with respect to the content domain, rather than incomparison with performance of other graduates.
We hope that you will find the NCLEX® Program Reports full of useful information that you will refer to many times. Asalways, we encourage your feedback. If you have any comments, compliments, or concerns, please write them down and letus know about them. We value your input!
1.1 US12345678 000003 NRN003 11/02/15
NCLEX ® PROGRAM REPORTSUSING AND INTERPRETING THE NCLEX® PROGRAM REPORTS
The NCLEX® Program Reports provides detailedinformation about the NCLEX-RN® examinationperformance of the graduates of your program whotested for the first time during the six-month periodcovered by this edition. Information on passing ratesand performance on a variety of content dimensionsis provided, as are jurisdiction, program type, andnational comparisons. These reports are designed toassist you in evaluating the strengths andweaknesses in your educational program.
The primary statistics included in these reports arepercentages, the median and the percentile rank ofthat median, and the average. Several reports usethe median (midpoint in a set of rankedperformances), rather than the mean (arithmeticaverage) as the indicator of typical performance. Thisapproach increases the stability of the resultsreported because the median is less affected byindividuals with extreme performance. Due to theunreliability of results, median performance will not becalculated for programs with fewer than ten first-timecandidates.
The percentile ranks compare the medianperformance of your graduates with that of thegraduates in the comparison group. For example, apercentile rank of 84 means that the performancelevel of 84 percent of the graduates in the referencegroup was lower than (or equal to) the medianperformance level of your graduates. You may thinkof this median performance level as the performanceof your "typical" graduate.
Because the range of program median performanceis not nearly as great as that of the performance ofindividual graduates, percentile ranks at the extremesare unlikely. In addition, small differences inperformance can lead to relatively large differences inperformance percentile ranks. For this reason, somefluctuations in the percentile ranks based on yourgraduates´ performance can be expected acrosscategories. This effect is greater near the center ofthe distribution (in the middle of the percentile ranks). In other words, only a small difference in performanceseparates the 45th and 50th percentiles, while arelatively large difference in performance separatesthe 90th and 95th percentiles, or the 5th and 10thpercentiles.
With the NCLEX-RN examination administered usingcomputerized adaptive testing (CAT), each
candidate receives a unique examination, rangingin length from a minimum of 60 scored items to amaximum of 250 scored items. Every examination,whatever its length, contains a controlledpercentage of questions from each of the contentareas covered in the NCLEX-RN® Test Plan. The NCLEX® Program Reports contains informationabout your graduates´ performance in each of thetest plan areas, and also in other contentframeworks NOT the same as the NCLEX-RN®
Test Plan. These Content Dimension Reportsprovide information about your graduates based onframeworks of: Nursing Process, HumanFunctioning, Health Alterations,Wellness/Illness Continuum, Stages of Maturity,and Stress, Adaptation and Coping. EveryNCLEX-RN examination is composed of questionsthat fulfill the NCLEX-RN® Test Plan percentagesbut, because the selection of questions is notcontrolled with respect to these other contentframeworks, candidates needing fewer questionson their NCLEX-RN examination may not beadministered items from some of these contentdimension categories. To ensure the reliability ofthe information provided in these reports,graduates who did not answer at least threequestions within a content category are notincluded in the summary of performance in thatcategory. This exclusion will only occur for theContent Dimension Reports. Median performancewill not be calculated if fewer than ten graduatesreceived at least three items in that category.
The Test Duration Report provides informationabout the number of questions answered and theamount of time spent by your graduates on theNCLEX-RN examination. With CAT, the number ofquestions answered provides information abouthow close the candidate was to the passingstandard. In comparing your program to otherprograms, it is useful to examine the averagenumber of questions taken by your graduates whopassed and who failed. For example, if theaverage number of questions taken by yourgraduates who passed was lower than for thecomparison group, this suggests that theydemonstrated their competence more quickly thangraduates in the comparison groups. Similarly, ifyour program has a higher percentage of passinggraduates take the minimum number of questions,then your passing graduates demonstrated theircompetence more quickly, indicating a higher levelof competence.
2.1 US12345678 000004 NRN004 11/02/15
NCLEX ® PROGRAM REPORTSUSING AND INTERPRETING THE NCLEX® PROGRAM REPORTS
The proportion of candidates answering the maximumnumber of questions reflects the proportion ofcandidates close to the passing standard. A highproportion of failing candidates answering themaximum number shows that most who failed wereclose to passing and, conversely, a high proportion ofpassing candidates answering the maximum numberof questions shows that most of the passers did notpass by a large margin.
The Test Plan Performance Report providesinformation on the median performance of yourgraduates in each area of the NCLEX-RN® Test Plan.Performance is reported as the expected percentage of all possible questions that could beadministered in a given category that would beanswered correctly by a graduate at this medianperformance level. The measurement model enablesthis estimate of expected percentages for all thepossible questions, even though each graduate tookonly a much smaller, unique set of questions.
Therefore, these are NOT the actual percentagesof questions answered correctly.
The passing performance data should beinterpreted as the percentage of all possiblequestions in the test plan area that a candidatewith a competence level at precisely the passingstandard would be able to answer correctly. Thispercentage varies across the content areasbecause the questions within these areas differ inaverage difficulty. For the content areas wherequestions are easier, passing performancecorresponds to a higher percentage of correctanswers. Similarly, for the content areas wherequestions are more difficult, passing performancecorresponds to a lower percentage of correctanswers. Comparisons of your graduates´ medianperformance with the passing performance levelsmay help you identify potential strengths andweaknesses in your instructional program.
Glossary
Average test time Mean amount of time candidates took to complete the NCLEX-RN® examination. Maximum amount of timeallowed for testing is six hours, unless the candidate has been approved by a board of nursing for extendedtesting time as a special accommodation.
Client Needs Subcategories as stated in the NCLEX-RN® Test Plan include:Management of CareSafety and Infection ControlHealth Promotion and MaintenancePsychosocial Integrity
Basic Care and ComfortPharmacological and Parenteral TherapiesReduction of Risk PotentialPhysiological Adaptation
Computerized AdaptiveTesting (CAT)
Computerized adaptive testing is a method for administering tests that uses current computer technology andmeasurement theory. CAT creates examinations that are unique for each candidate; the exam is assembledinteractively as the individual is tested.
First-time candidate Candidate for whom there is no prior history of taking the NCLEX-RN examination.
Graduate/Candidate A student who has completed the requirements of an educational program and is now applying for licensure topractice nursing.
Jurisdiction Board of nursing/regulatory body to which a graduate is applying for licensure/registration. State/province orterritory in which your program resides.
Minimum number of items Each test requires the candidate to complete a minimum number of examination items. For Registered Nursecandidates, the minimum number of items is 60 operational items with 15 pretest items, for a total of 75 items.
Maximum number of items For Registered Nurse candidates, the maximum number of items is 265 (250 operational items and 15 pretestitems).
National population First-time U.S.-educated candidates taking the NCLEX-RN examination during the reporting cycle.
Nursing Process A scientific problem-solving approach to client care that for the RN includes assessment, analysis, planning,implementation and evaluation.
Reporting Cycle/Reporting Period
NCLEX® Program Reports are generated cyclically, from April 1 through March 31.
Registration Process Candidates must apply for licensure to the board of nursing in the jurisdiction in which they wish to belicensed. Boards of nursing authorize candidacy and send the candidates registration materials.
Test Plan The test plan approved by the National Council of State Boards of Nursing that governs the content domain ofthe NCLEX-RN examination. The NCLEX-RN® Test Plan consists of one dimension: Client Needs.
2.2 US12345678 000005 NRN005 11/02/15
NCLEX ® PROGRAM REPORTSSUMMARY OVERVIEW
The Summary Overview section contains tables tohelp you understand the performance of graduatesfrom your program who were taking the NCLEX-RN®
examination for the first time. Reports in this sectioninclude: Rank of Your Program Based on Percentageof Graduates Passing; Where Your GraduatesApplied for Licensure; Percentage of Your GraduatesPassing the NCLEX-RN® Examination; and Distribution of Programs by National PassingPercentages.
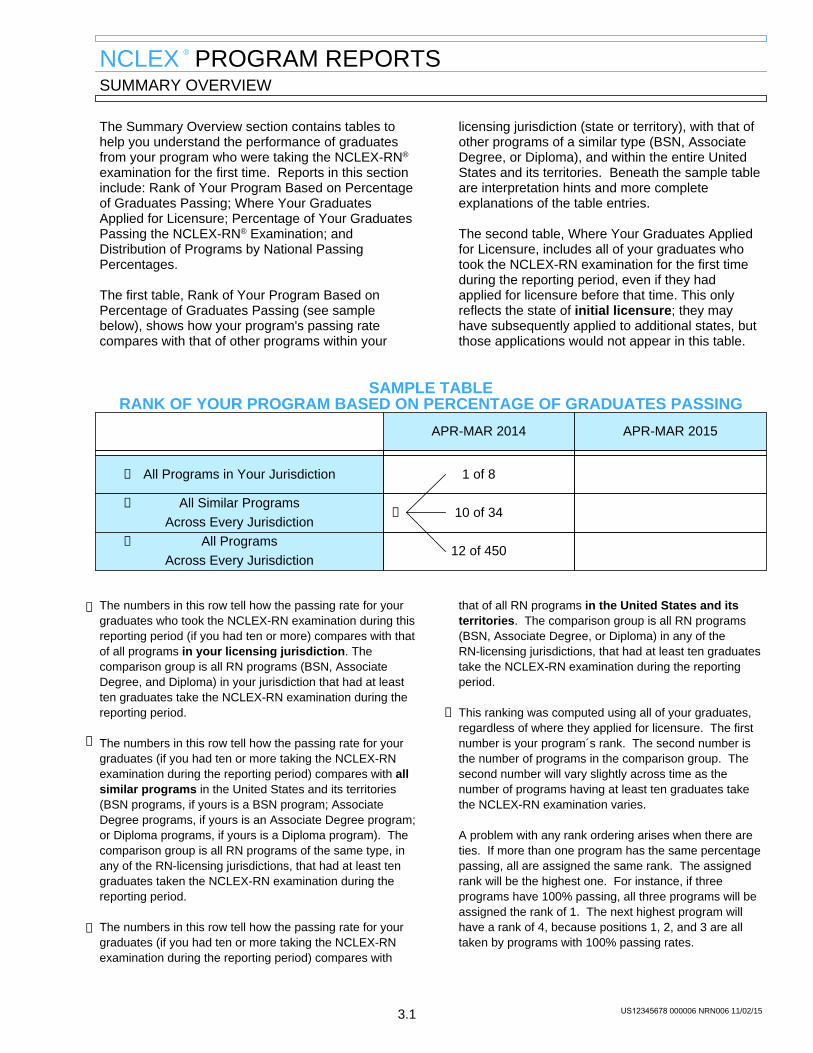
The first table, Rank of Your Program Based onPercentage of Graduates Passing (see samplebelow), shows how your program's passing ratecompares with that of other programs within your
licensing jurisdiction (state or territory), with that ofother programs of a similar type (BSN, AssociateDegree, or Diploma), and within the entire UnitedStates and its territories. Beneath the sample tableare interpretation hints and more completeexplanations of the table entries.
The second table, Where Your Graduates Appliedfor Licensure, includes all of your graduates whotook the NCLEX-RN examination for the first timeduring the reporting period, even if they hadapplied for licensure before that time. This onlyreflects the state of initial licensure; they mayhave subsequently applied to additional states, butthose applications would not appear in this table.
SAMPLE TABLERANK OF YOUR PROGRAM BASED ON PERCENTAGE OF GRADUATES PASSING
APR-MAR 2014 APR-MAR 2015
All Programs in Your Jurisdiction 1 of 8
All Similar ProgramsAcross Every Jurisdiction
10 of 34
All ProgramsAcross Every Jurisdiction
12 of 450
➀
➁
➂
➃
➀
➁
➂
➃
The numbers in this row tell how the passing rate for yourgraduates who took the NCLEX-RN examination during thisreporting period (if you had ten or more) compares with thatof all programs in your licensing jurisdiction. Thecomparison group is all RN programs (BSN, AssociateDegree, and Diploma) in your jurisdiction that had at leastten graduates take the NCLEX-RN examination during thereporting period.
The numbers in this row tell how the passing rate for yourgraduates (if you had ten or more taking the NCLEX-RNexamination during the reporting period) compares with allsimilar programs in the United States and its territories(BSN programs, if yours is a BSN program; AssociateDegree programs, if yours is an Associate Degree program;or Diploma programs, if yours is a Diploma program). Thecomparison group is all RN programs of the same type, inany of the RN-licensing jurisdictions, that had at least tengraduates taken the NCLEX-RN examination during thereporting period.
The numbers in this row tell how the passing rate for yourgraduates (if you had ten or more taking the NCLEX-RNexamination during the reporting period) compares with
that of all RN programs in the United States and itsterritories. The comparison group is all RN programs(BSN, Associate Degree, or Diploma) in any of theRN-licensing jurisdictions, that had at least ten graduatestake the NCLEX-RN examination during the reportingperiod.
This ranking was computed using all of your graduates,regardless of where they applied for licensure. The firstnumber is your program´s rank. The second number isthe number of programs in the comparison group. Thesecond number will vary slightly across time as thenumber of programs having at least ten graduates takethe NCLEX-RN examination varies.
A problem with any rank ordering arises when there areties. If more than one program has the same percentagepassing, all are assigned the same rank. The assignedrank will be the highest one. For instance, if threeprograms have 100% passing, all three programs will beassigned the rank of 1. The next highest program willhave a rank of 4, because positions 1, 2, and 3 are alltaken by programs with 100% passing rates.
3.1 US12345678 000006 NRN006 11/02/15
NCLEX ® PROGRAM REPORTSSAMPLE UNIVERSITY - RN Report Period: APR 2015 - SEP 2015
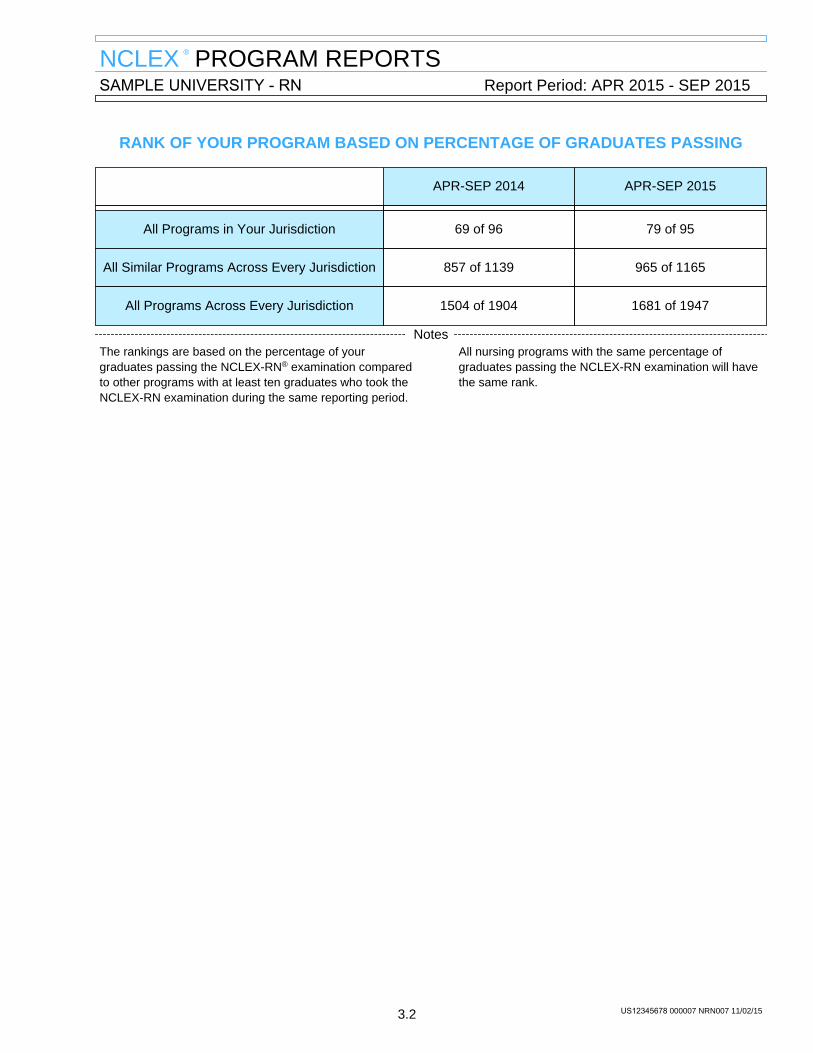
RANK OF YOUR PROGRAM BASED ON PERCENTAGE OF GRADUATES PASSING
APR-SEP 2014 APR-SEP 2015
All Programs in Your Jurisdiction 69 of 96 79 of 95
All Similar Programs Across Every Jurisdiction 857 of 1139 965 of 1165
All Programs Across Every Jurisdiction 1504 of 1904 1681 of 1947
NotesThe rankings are based on the percentage of yourgraduates passing the NCLEX-RN® examination comparedto other programs with at least ten graduates who took theNCLEX-RN examination during the same reporting period.
All nursing programs with the same percentage ofgraduates passing the NCLEX-RN examination will havethe same rank.
3.2 US12345678 000007 NRN007 11/02/15
NCLEX ® PROGRAM REPORTSSAMPLE UNIVERSITY - RN Report Period: APR 2015 - SEP 2015
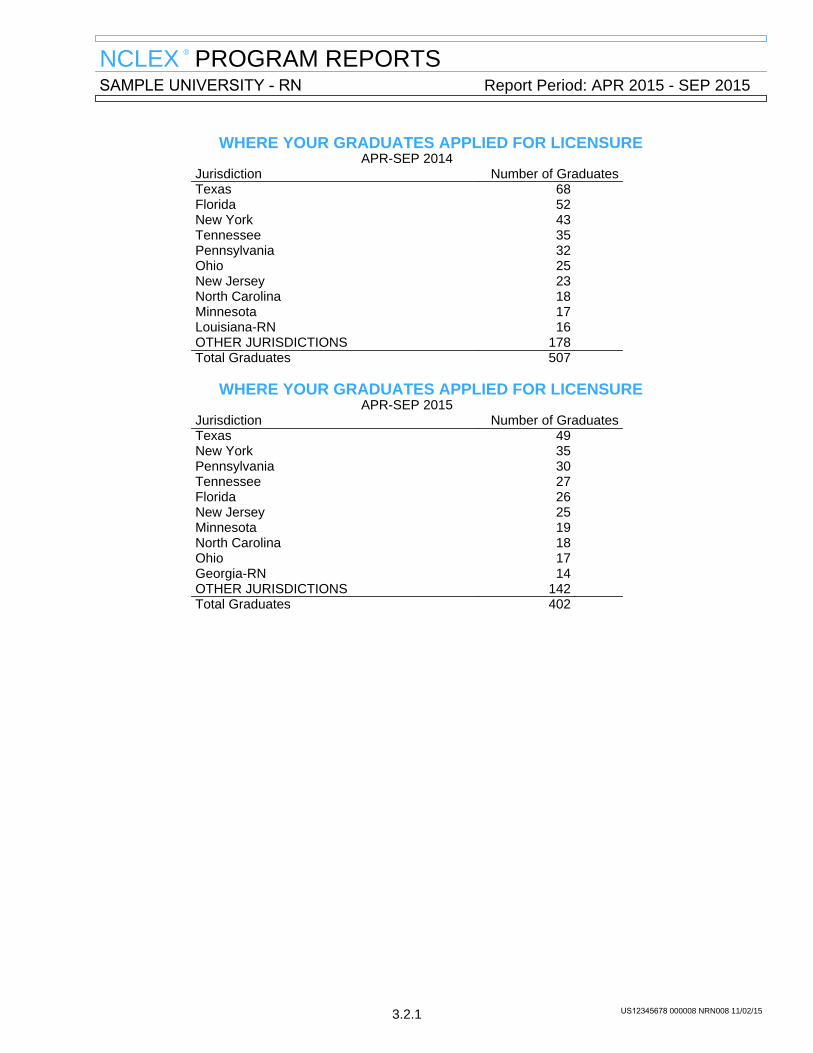
WHERE YOUR GRADUATES APPLIED FOR LICENSUREAPR-SEP 2014
Jurisdiction Number of GraduatesTexas 68Florida 52New York 43Tennessee 35Pennsylvania 32Ohio 25New Jersey 23North Carolina 18Minnesota 17Louisiana-RN 16OTHER JURISDICTIONS 178Total Graduates 507
WHERE YOUR GRADUATES APPLIED FOR LICENSUREAPR-SEP 2015
Jurisdiction Number of GraduatesTexas 49New York 35Pennsylvania 30Tennessee 27Florida 26New Jersey 25Minnesota 19North Carolina 18Ohio 17Georgia-RN 14OTHER JURISDICTIONS 142Total Graduates 402
3.2.1 US12345678 000008 NRN008 11/02/15
NCLEX ® PROGRAM REPORTSSAMPLE UNIVERSITY - RN Report Period: APR 2015 - SEP 2015
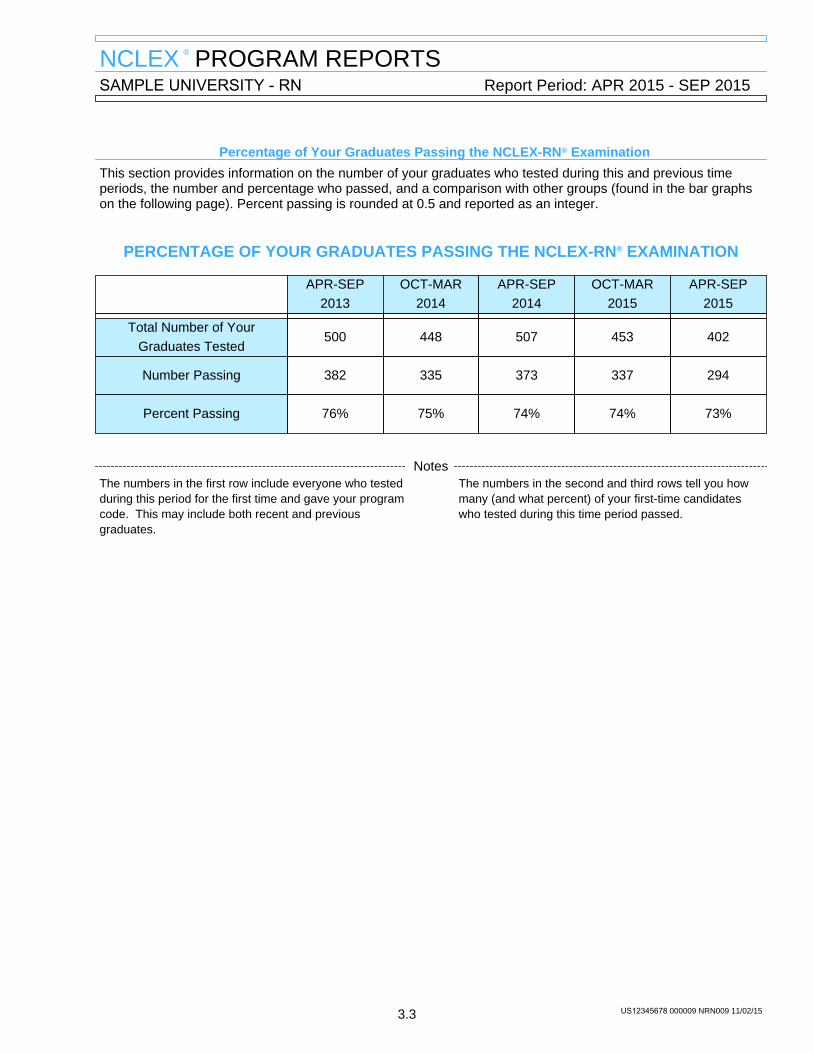
Percentage of Your Graduates Passing the NCLEX-RN® Examination
This section provides information on the number of your graduates who tested during this and previous timeperiods, the number and percentage who passed, and a comparison with other groups (found in the bar graphson the following page). Percent passing is rounded at 0.5 and reported as an integer.
PERCENTAGE OF YOUR GRADUATES PASSING THE NCLEX-RN® EXAMINATION
APR-SEP2013
OCT-MAR2014
APR-SEP2014
OCT-MAR2015
APR-SEP2015
Total Number of YourGraduates Tested
500 448 507 453 402
Number Passing 382 335 373 337 294
Percent Passing 76% 75% 74% 74% 73%
NotesThe numbers in the first row include everyone who testedduring this period for the first time and gave your programcode. This may include both recent and previousgraduates.
The numbers in the second and third rows tell you howmany (and what percent) of your first-time candidateswho tested during this time period passed.
3.3 US12345678 000009 NRN009 11/02/15
NCLEX ® PROGRAM REPORTSSAMPLE UNIVERSITY - RN Report Period: APR 2015 - SEP 2015
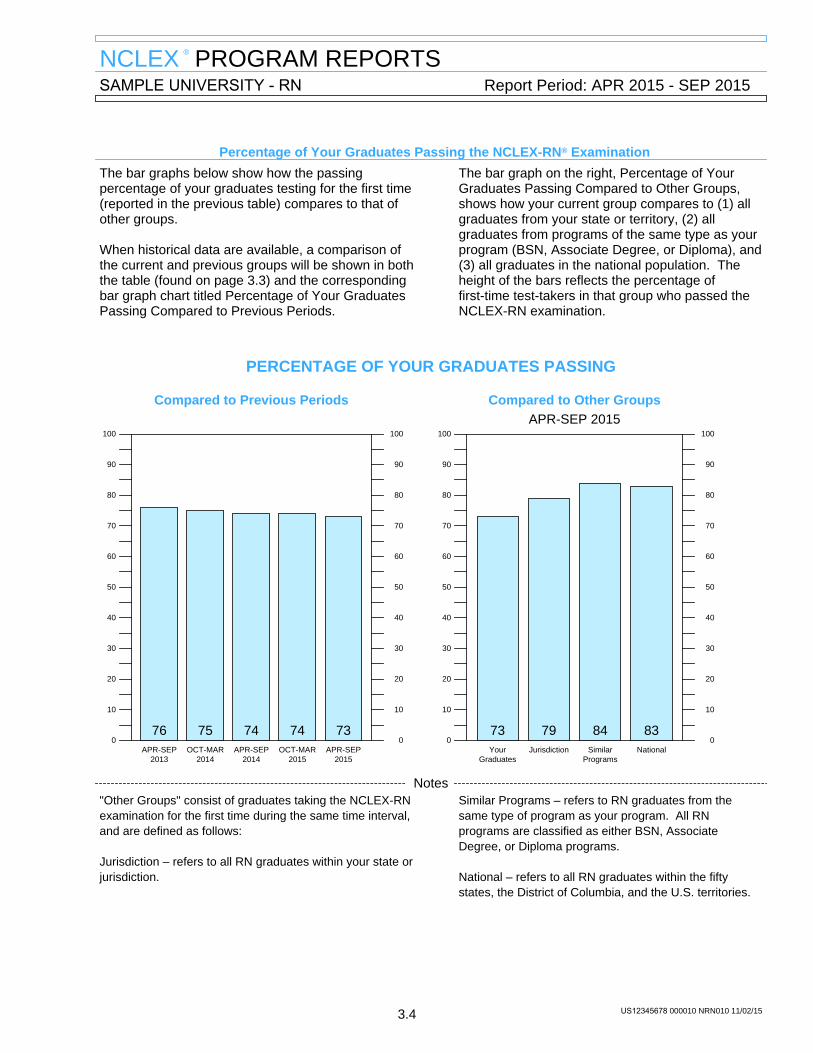
Percentage of Your Graduates Passing the NCLEX-RN® Examination
The bar graphs below show how the passingpercentage of your graduates testing for the first time(reported in the previous table) compares to that ofother groups.
When historical data are available, a comparison ofthe current and previous groups will be shown in boththe table (found on page 3.3) and the correspondingbar graph chart titled Percentage of Your GraduatesPassing Compared to Previous Periods.
The bar graph on the right, Percentage of YourGraduates Passing Compared to Other Groups,shows how your current group compares to (1) allgraduates from your state or territory, (2) allgraduates from programs of the same type as yourprogram (BSN, Associate Degree, or Diploma), and(3) all graduates in the national population. Theheight of the bars reflects the percentage offirst-time test-takers in that group who passed theNCLEX-RN examination.
PERCENTAGE OF YOUR GRADUATES PASSING
Compared to Previous Periods
100 100
90 90
80 80
70 70
60 60
50 50
40 40
30 30
20 20
10 10
0 076
APR-SEP2013
75OCT-MAR
2014
74APR-SEP
2014
74OCT-MAR
2015
73APR-SEP
2015
Compared to Other GroupsAPR-SEP 2015
100 100
90 90
80 80
70 70
60 60
50 50
40 40
30 30
20 20
10 10
0 073Your
Graduates
79Jurisdiction
84Similar
Programs
83National
Notes"Other Groups" consist of graduates taking the NCLEX-RNexamination for the first time during the same time interval,and are defined as follows:
Jurisdiction – refers to all RN graduates within your state orjurisdiction.
Similar Programs – refers to RN graduates from thesame type of program as your program. All RNprograms are classified as either BSN, AssociateDegree, or Diploma programs.
National – refers to all RN graduates within the fiftystates, the District of Columbia, and the U.S. territories.
3.4 US12345678 000010 NRN010 11/02/15
NCLEX ® PROGRAM REPORTSSAMPLE UNIVERSITY - RN Report Period: APR 2015 - SEP 2015
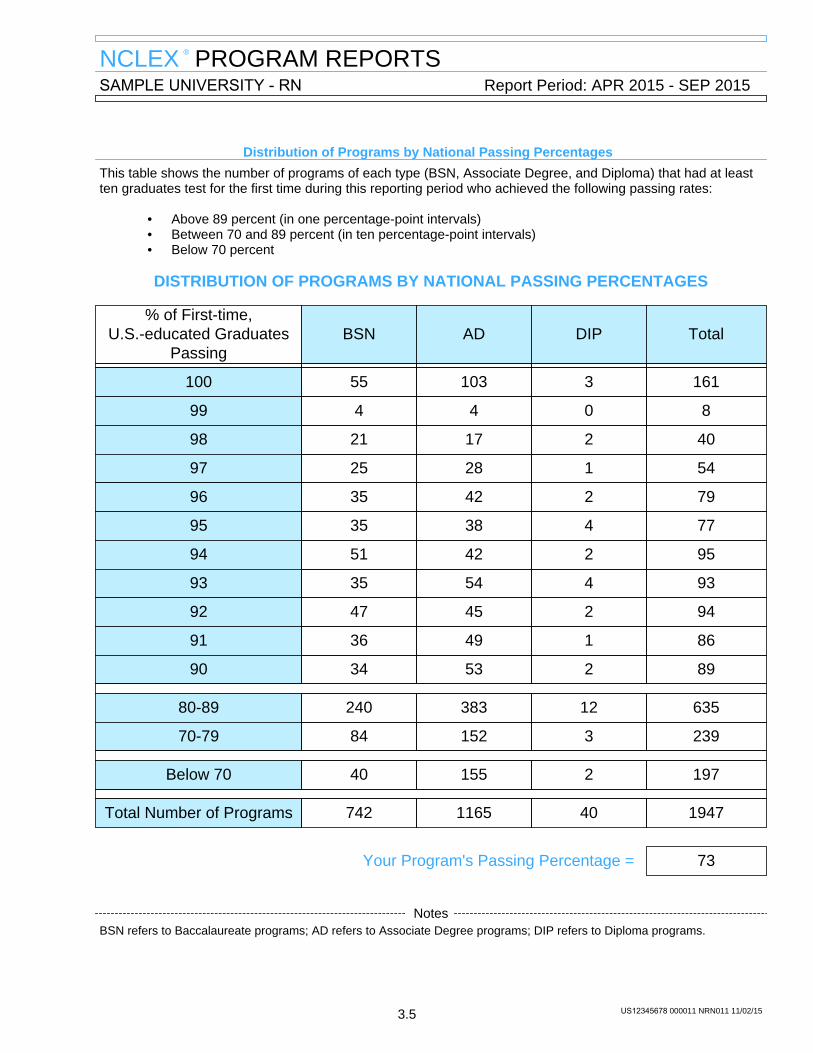
Distribution of Programs by National Passing Percentages
This table shows the number of programs of each type (BSN, Associate Degree, and Diploma) that had at leastten graduates test for the first time during this reporting period who achieved the following passing rates:
• Above 89 percent (in one percentage-point intervals)• Between 70 and 89 percent (in ten percentage-point intervals)• Below 70 percent
DISTRIBUTION OF PROGRAMS BY NATIONAL PASSING PERCENTAGES
% of First-time,U.S.-educated Graduates
PassingBSN AD DIP Total
100 55 103 3 161
99 4 4 0 8
98 21 17 2 40
97 25 28 1 54
96 35 42 2 79
95 35 38 4 77
94 51 42 2 95
93 35 54 4 93
92 47 45 2 94
91 36 49 1 86
90 34 53 2 89
80-89 240 383 12 635
70-79 84 152 3 239
Below 70 40 155 2 197
Total Number of Programs 742 1165 40 1947
Your Program's Passing Percentage = 73
NotesBSN refers to Baccalaureate programs; AD refers to Associate Degree programs; DIP refers to Diploma programs.
3.5 US12345678 000011 NRN011 11/02/15
NCLEX ® PROGRAM REPORTSNCLEX-RN® TEST PLAN REPORT
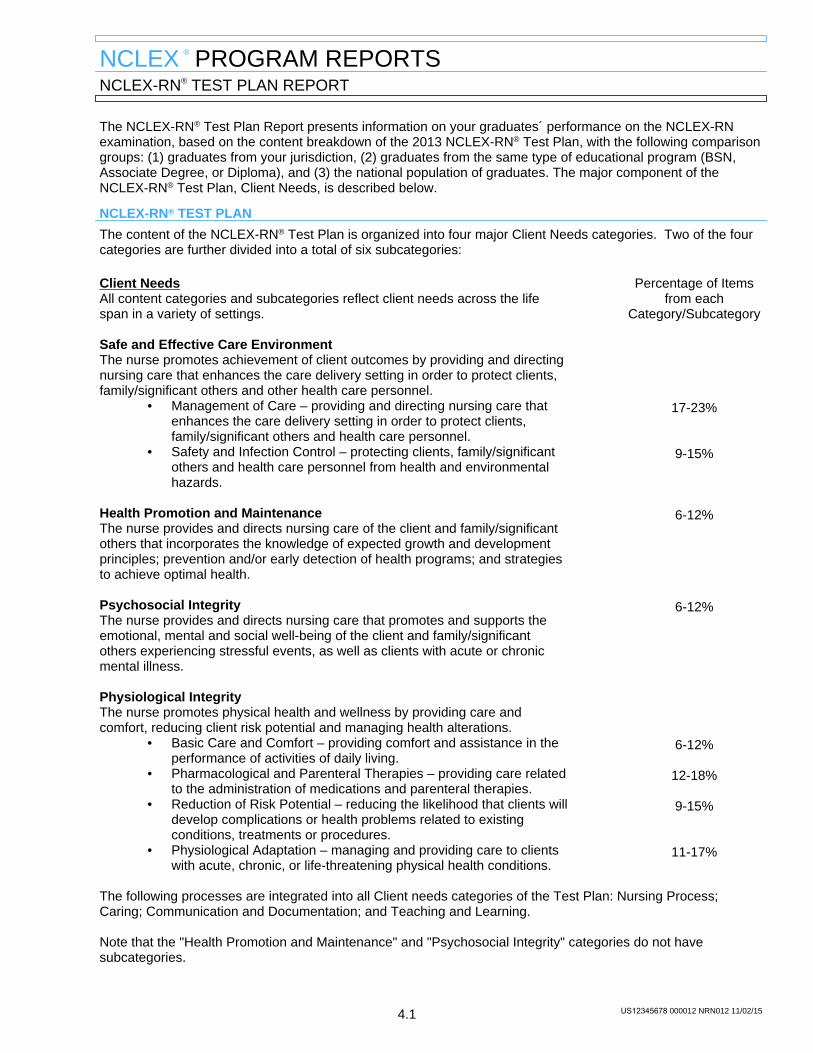
The NCLEX-RN® Test Plan Report presents information on your graduates´ performance on the NCLEX-RNexamination, based on the content breakdown of the 2013 NCLEX-RN® Test Plan, with the following comparisongroups: (1) graduates from your jurisdiction, (2) graduates from the same type of educational program (BSN,Associate Degree, or Diploma), and (3) the national population of graduates. The major component of the NCLEX-RN® Test Plan, Client Needs, is described below.
NCLEX-RN® TEST PLAN
The content of the NCLEX-RN® Test Plan is organized into four major Client Needs categories. Two of the fourcategories are further divided into a total of six subcategories:
Percentage of Itemsfrom each
Category/Subcategory
Client NeedsAll content categories and subcategories reflect client needs across the lifespan in a variety of settings.
Safe and Effective Care EnvironmentThe nurse promotes achievement of client outcomes by providing and directingnursing care that enhances the care delivery setting in order to protect clients,family/significant others and other health care personnel.
17-23%• Management of Care – providing and directing nursing care thatenhances the care delivery setting in order to protect clients,family/significant others and health care personnel.
9-15%• Safety and Infection Control – protecting clients, family/significantothers and health care personnel from health and environmentalhazards.
6-12%Health Promotion and MaintenanceThe nurse provides and directs nursing care of the client and family/significantothers that incorporates the knowledge of expected growth and developmentprinciples; prevention and/or early detection of health programs; and strategiesto achieve optimal health.
6-12%Psychosocial IntegrityThe nurse provides and directs nursing care that promotes and supports theemotional, mental and social well-being of the client and family/significantothers experiencing stressful events, as well as clients with acute or chronicmental illness.
Physiological IntegrityThe nurse promotes physical health and wellness by providing care andcomfort, reducing client risk potential and managing health alterations.
6-12%• Basic Care and Comfort – providing comfort and assistance in theperformance of activities of daily living.
12-18%• Pharmacological and Parenteral Therapies – providing care relatedto the administration of medications and parenteral therapies.
9-15%• Reduction of Risk Potential – reducing the likelihood that clients willdevelop complications or health problems related to existingconditions, treatments or procedures.
11-17%• Physiological Adaptation – managing and providing care to clientswith acute, chronic, or life-threatening physical health conditions.
The following processes are integrated into all Client needs categories of the Test Plan: Nursing Process;Caring; Communication and Documentation; and Teaching and Learning.
Note that the "Health Promotion and Maintenance" and "Psychosocial Integrity" categories do not havesubcategories.
4.1 US12345678 000012 NRN012 11/02/15
NCLEX ® PROGRAM REPORTSNCLEX-RN® TEST PLAN REPORT
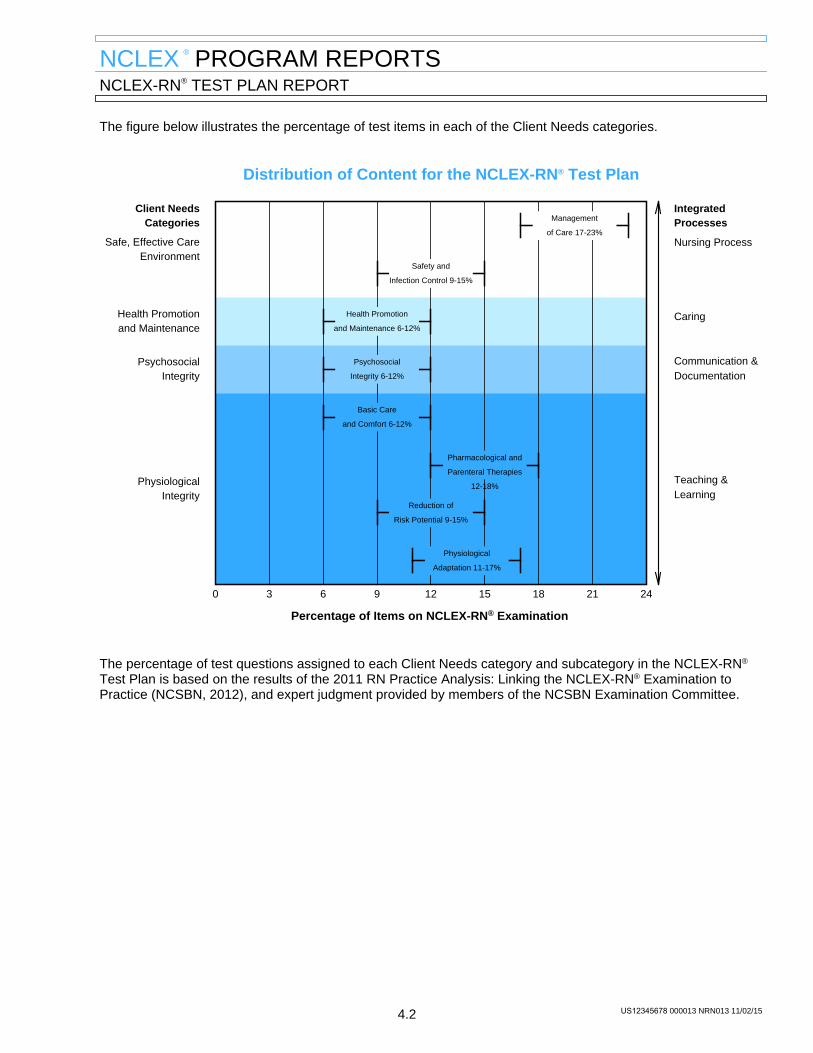
The figure below illustrates the percentage of test items in each of the Client Needs categories.
Distribution of Content for the NCLEX-RN® Test Plan
Client NeedsCategories
IntegratedProcesses
Nursing Process
Caring
Communication &Documentation
Teaching &Learning
Safe, Effective CareEnvironment
Health Promotionand Maintenance
PsychosocialIntegrity
PhysiologicalIntegrity
0 3 6 9 12 15 18 21 24
Management
of Care 17-23%
Safety and
Infection Control 9-15%
Health Promotion
and Maintenance 6-12%
Psychosocial
Integrity 6-12%
Basic Care
and Comfort 6-12%
Pharmacological and
Parenteral Therapies
12-18%
Reduction of
Risk Potential 9-15%
Physiological
Adaptation 11-17%
Percentage of Items on NCLEX-RN® Examination
The percentage of test questions assigned to each Client Needs category and subcategory in the NCLEX-RN®
Test Plan is based on the results of the 2011 RN Practice Analysis: Linking the NCLEX-RN® Examination toPractice (NCSBN, 2012), and expert judgment provided by members of the NCSBN Examination Committee.
4.2 US12345678 000013 NRN013 11/02/15
NCLEX ® PROGRAM REPORTSNCLEX-RN® TEST PLAN REPORT
Percentile Rank Charts of Test Plan Performance
These charts show how well your program´s typicalgraduate (taking the NCLEX-RN® examination for thefirst time during this reporting period) performed in thedifferent Clients Needs subcategories and how thatcompares with the performance of last year´s typicalgraduate and with graduates across the United Statesand its territories.
Instead of showing passing rates, as in the SummaryOverview section, these charts show how well agraduate at the median competence level from yourprogram performed in terms of the content breakdownspecified in the NCLEX-RN® Test Plan. TheNCLEX-RN examination measurement model allowsthe calculation of performance on any subset of itemsby adjusting for their difficulty.
Three types of comparisons are possible from thesecharts: (1) how your program´s typical graduatecompares with the rest of the country, (2) how wellyour program´s typical graduate does in the ClientNeeds subcategories (remember that the difficulty ofthe items has already been taken into account), and(3) how the two reporting periods compare.
The numbers on the vertical axis of the charts arepercentile ranks, indicating percentage of
graduates who performed less well than (or thesame as) your typical graduate. Differences inpercentile ranks must be interpreted with caution. A single percentile-point spread towards the middleof the scale represents less of an observed scoredifference than the same spread at the extremes(e.g., 50th and 51st are not as different as 90th and91st). These charts are most appropriately used todetermine areas of general program strength andweakness, and not to make precise comparisons.
An example of a statement that might be madebased on data from these charts is, "In this timeperiod, my median (typical) graduate did as well orbetter than 75% of the graduates in the country inthe first subcategory (Management of Care), butonly 50% of graduates in the second subcategory(Safety and Infection Control). In the previous timeperiod, that pattern was reversed."
Prior to March 2000, percentile ranks were basedon program comparisons (rather than graduatecomparisons). For this reason, current resultsshould not be compared to Test Plan Reportresults published prior to March 2000.
4.3 US12345678 000014 NRN014 11/02/15
NCLEX ® PROGRAM REPORTSSAMPLE UNIVERSITY - RN Report Period: APR 2015 - SEP 2015
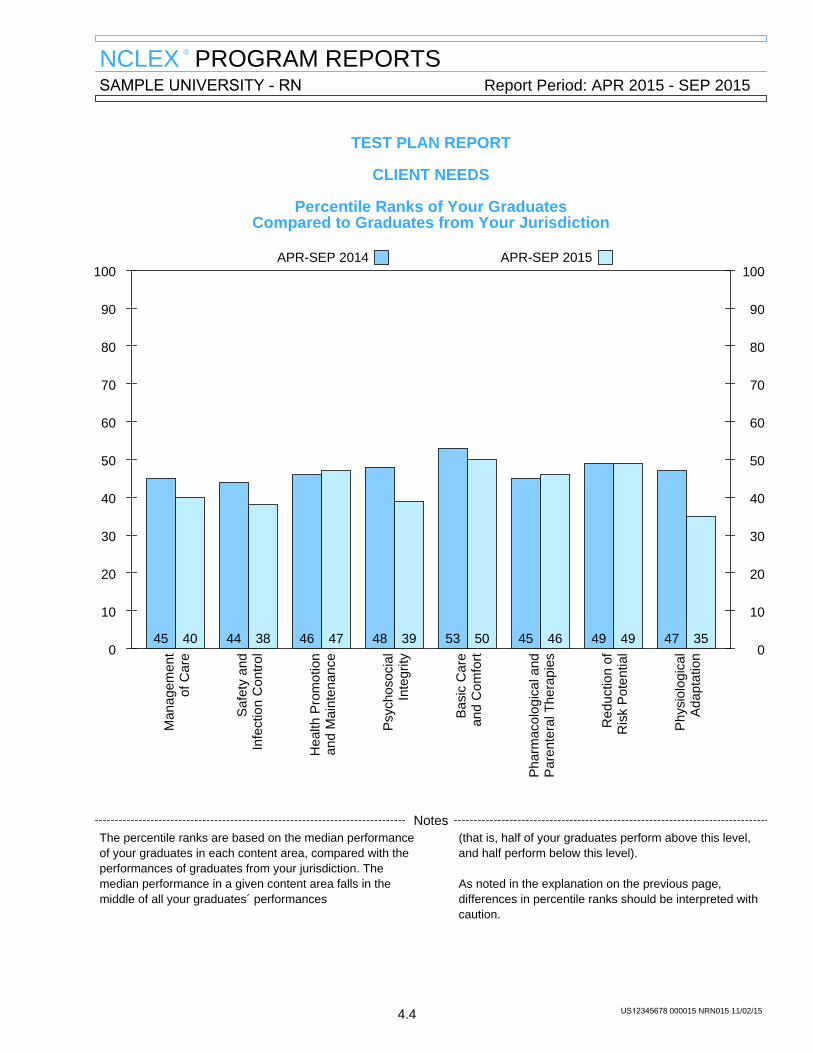
TEST PLAN REPORT
CLIENT NEEDS
Percentile Ranks of Your GraduatesCompared to Graduates from Your Jurisdiction
APR-SEP 2014 APR-SEP 2015100 100
90 90
80 80
70 70
60 60
50 50
40 40
30 30
20 20
10 10
0 0
Man
agem
ent
of C
are
45 40
Saf
ety
and
Infe
ctio
n C
ontr
ol
44 38
Hea
lth P
rom
otio
nan
d M
aint
enan
ce
46 47
Psy
chos
ocia
lIn
tegr
ity
48 39
Bas
ic C
are
and
Com
fort
53 50
Pha
rmac
olog
ical
and
Par
ente
ral T
hera
pies
45 46
Red
uctio
n of
Ris
k P
oten
tial
49 49
Phy
siol
ogic
alA
dapt
atio
n
47 35
NotesThe percentile ranks are based on the median performanceof your graduates in each content area, compared with theperformances of graduates from your jurisdiction. Themedian performance in a given content area falls in themiddle of all your graduates´ performances
(that is, half of your graduates perform above this level,and half perform below this level).
As noted in the explanation on the previous page,differences in percentile ranks should be interpreted withcaution.
4.4 US12345678 000015 NRN015 11/02/15
NCLEX ® PROGRAM REPORTSSAMPLE UNIVERSITY - RN Report Period: APR 2015 - SEP 2015
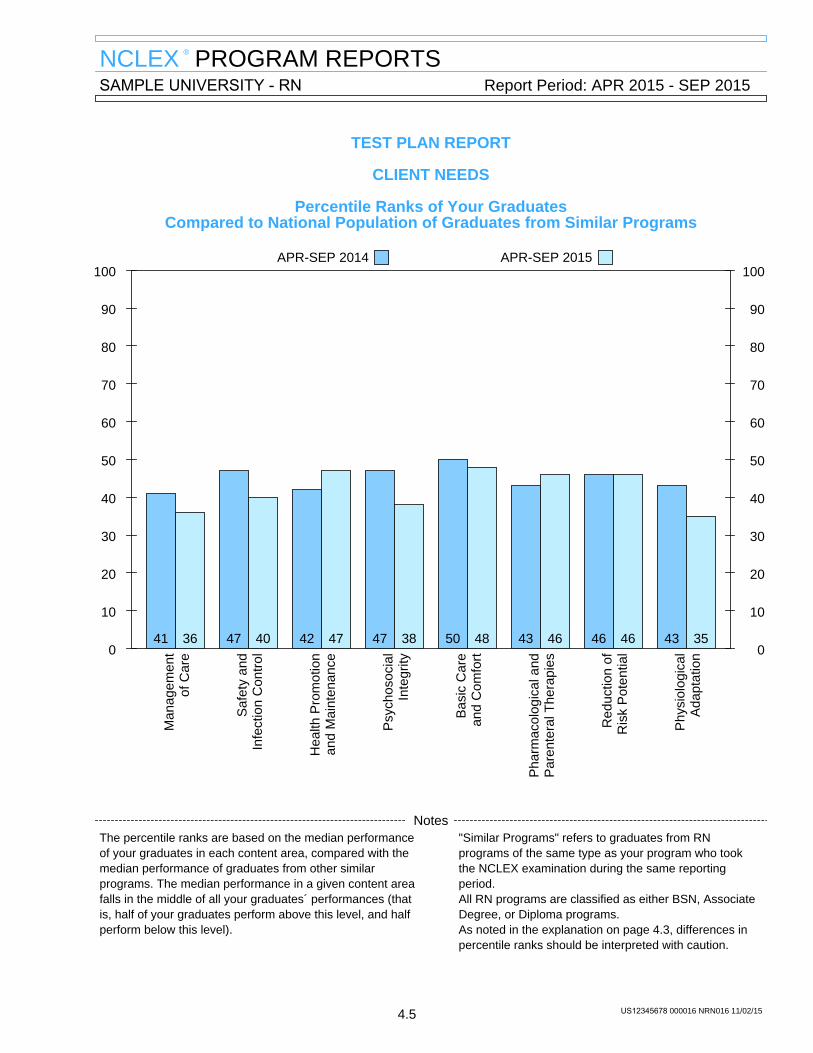
TEST PLAN REPORT
CLIENT NEEDS
Percentile Ranks of Your GraduatesCompared to National Population of Graduates from Similar Programs
APR-SEP 2014 APR-SEP 2015100 100
90 90
80 80
70 70
60 60
50 50
40 40
30 30
20 20
10 10
0 0
Man
agem
ent
of C
are
41 36
Saf
ety
and
Infe
ctio
n C
ontr
ol
47 40
Hea
lth P
rom
otio
nan
d M
aint
enan
ce
42 47
Psy
chos
ocia
lIn
tegr
ity
47 38
Bas
ic C
are
and
Com
fort
50 48
Pha
rmac
olog
ical
and
Par
ente
ral T
hera
pies
43 46
Red
uctio
n of
Ris
k P
oten
tial
46 46
Phy
siol
ogic
alA
dapt
atio
n
43 35
NotesThe percentile ranks are based on the median performanceof your graduates in each content area, compared with themedian performance of graduates from other similarprograms. The median performance in a given content areafalls in the middle of all your graduates´ performances (thatis, half of your graduates perform above this level, and halfperform below this level).
"Similar Programs" refers to graduates from RNprograms of the same type as your program who tookthe NCLEX examination during the same reportingperiod.All RN programs are classified as either BSN, AssociateDegree, or Diploma programs.As noted in the explanation on page 4.3, differences inpercentile ranks should be interpreted with caution.
4.5 US12345678 000016 NRN016 11/02/15
NCLEX ® PROGRAM REPORTSSAMPLE UNIVERSITY - RN Report Period: APR 2015 - SEP 2015
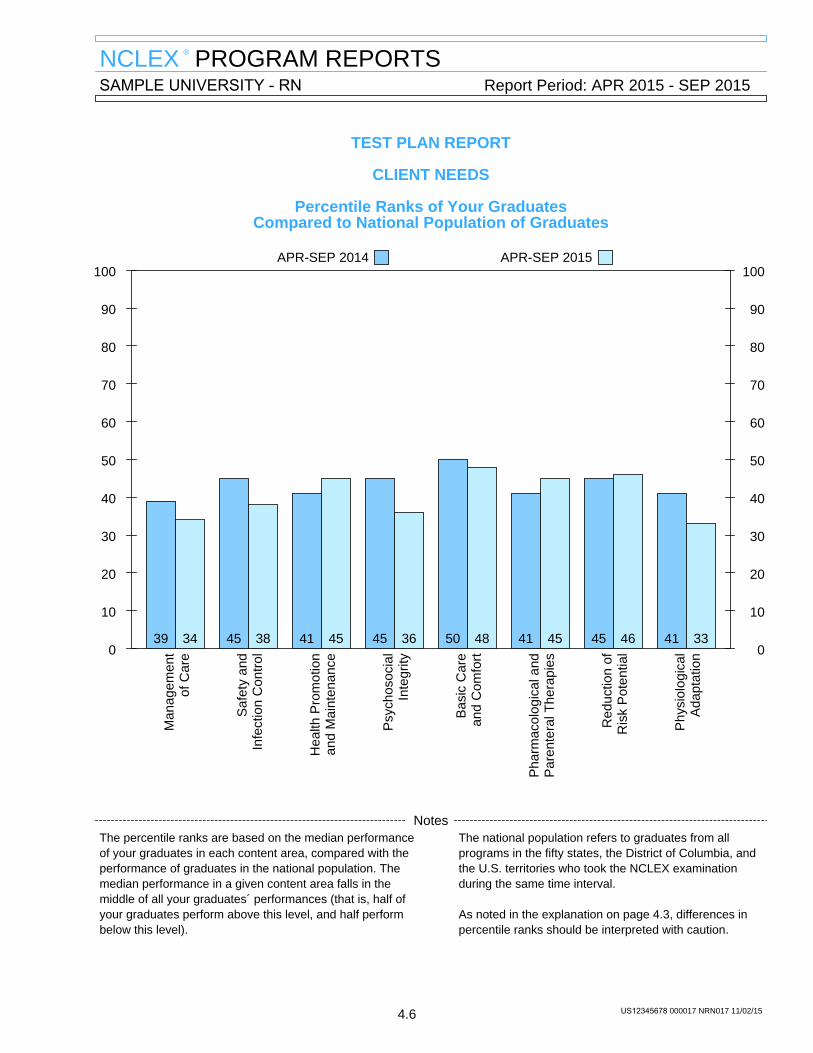
TEST PLAN REPORT
CLIENT NEEDS
Percentile Ranks of Your GraduatesCompared to National Population of Graduates
APR-SEP 2014 APR-SEP 2015100 100
90 90
80 80
70 70
60 60
50 50
40 40
30 30
20 20
10 10
0 0
Man
agem
ent
of C
are
39 34
Saf
ety
and
Infe
ctio
n C
ontr
ol
45 38
Hea
lth P
rom
otio
nan
d M
aint
enan
ce
41 45
Psy
chos
ocia
lIn
tegr
ity
45 36
Bas
ic C
are
and
Com
fort
50 48
Pha
rmac
olog
ical
and
Par
ente
ral T
hera
pies
41 45
Red
uctio
n of
Ris
k P
oten
tial
45 46
Phy
siol
ogic
alA
dapt
atio
n
41 33
NotesThe percentile ranks are based on the median performanceof your graduates in each content area, compared with theperformance of graduates in the national population. Themedian performance in a given content area falls in themiddle of all your graduates´ performances (that is, half ofyour graduates perform above this level, and half performbelow this level).
The national population refers to graduates from allprograms in the fifty states, the District of Columbia, andthe U.S. territories who took the NCLEX examinationduring the same time interval.
As noted in the explanation on page 4.3, differences inpercentile ranks should be interpreted with caution.
4.6 US12345678 000017 NRN017 11/02/15
NCLEX ® PROGRAM REPORTSCONTENT DIMENSION REPORTS
Nursing is a profession that promotes, maintains and restores health for individuals and their families. Nursesvalue a holistic approach to client care, utilizing frameworks to organize assessments, develop a plan of careand evaluate the provision of care. These systematic approaches to client care may employ functional healthpatterns, head-to-toe formats, or a body systems classification. Nursing education programs organize theircurricula in a pattern or framework to foster learning. Regardless of the framework utilized for nursing care ornursing education, its components are integrated to ensure that all clients´ physical and behavioral dimensionsare included.
The NCLEX® Content Dimension Reports in this section provide information about your graduates based on sixframeworks:
• Nursing Process• Categories of Human Functioning• Categories of Health Alterations• Wellness/Illness Continuum• Stages of Maturity• Stress, Adaptation, and Coping
The first set of the Content Dimension Reports is based on the Nursing Process.
NURSING PROCESS
The Nursing Process provides a framework fororganizing and delivering nursing care to clients andgroups. The five phases of the nursing process for theRN include: Assessment, Analysis, Planning,Implementation, and Evaluation.
AssessmentThis phase consists of establishing a database bygathering objective and subjective client data andconfirming the data. The nurse collects informationrelative to the client, verifies the data, andcommunicates the assessment data to relevantmembers of the health care team.
AnalysisThis phase consists of the identification of clienthealth care needs and/or problems based on aninterpretation of assessment data. The nurse thenformulates nursing diagnosis, and communicates theanalysis findings to relevant members of the healthcare team.
PlanningThis phase consists of setting goals for meetingclient needs and designing strategies to achieveexpected client outcomes. The nurse determinesthe expected client outcomes, develops andmodifies the plan of care, formulates outcomecriteria, and communicates the plan of care torelevant members of the health care team.
ImplementationThis phase consists of initiating and/or completingactions in order to accomplish the defined goals ofcare. The nurse organizes, manages and providescare to accomplish expected client outcomes, andcommunicates nursing interventions to relevantmembers of the health care team.
EvaluationThis phase consists of determining whether or notthe client outcomes have been achieved andinterventions have been successful. The nursecompares the actual outcomes with expectedoutcomes of care and communicates the clientresponses to interventions and/or teaching.
5.1.1 US12345678 000018 NRN018 11/02/15

NCLEX ® PROGRAM REPORTSCONTENT DIMENSION REPORTS
Percentile Rank Charts of Content Dimension Performance
These charts show how well your program´s typicalgraduate (taking the NCLEX® examination for the firsttime during this reporting period) performed indifferent content dimensions and how that compareswith the performance of last year´s typical graduate and with graduates across the United States and itsterritories.
Instead of showing passing rates, as in the SummaryOverview section, these charts show how well agraduate at the median competence level from yourprogram performed in specific content areas. TheNCLEX examination measurement model allows thecalculation of performance on any subset of items byadjusting for their difficulty.
Three types of comparisons are possible from thesecharts: (1) how your program´s typical graduatecompares with the rest of the country, (2) how wellyour program´s typical graduate does in the contentareas (remember that the difficulty of the items hasalready been taken into account), and (3) how the tworeporting periods compare.
The numbers on the vertical axis of the charts arepercentile ranks, indicating the percentage of
graduates who performed less well than (or thesame as) your typical graduate. Differences inpercentile ranks must be interpreted with caution. A single percentile-point spread towards the middleof the scale represents less of a true (observedscore) difference than the same spread at theextremes (e.g., 50th and 51st are not as different as90th and 91st). These charts are most appropriatelyused to determine areas of general programstrength and weakness, and not to make precisecomparisons.
An example of a statement that might be madebased on data from these charts is, "In this timeperiod, my median (middle) graduate did as well orbetter than 75% of the graduates in the country inthe first content area (Assessment), but only 50%of graduates in the second content area (Analysis). In the previous time period, that pattern wasreversed."
Prior to March 2000, percentile ranks were basedon program comparisons (rather than graduatecomparisons). For this reason, current resultsshould not be compared to Content DimensionReport results published prior to March 2000.
5.1.2 US12345678 000019 NRN019 11/02/15
NCLEX ® PROGRAM REPORTSSAMPLE UNIVERSITY - RN Report Period: APR 2015 - SEP 2015
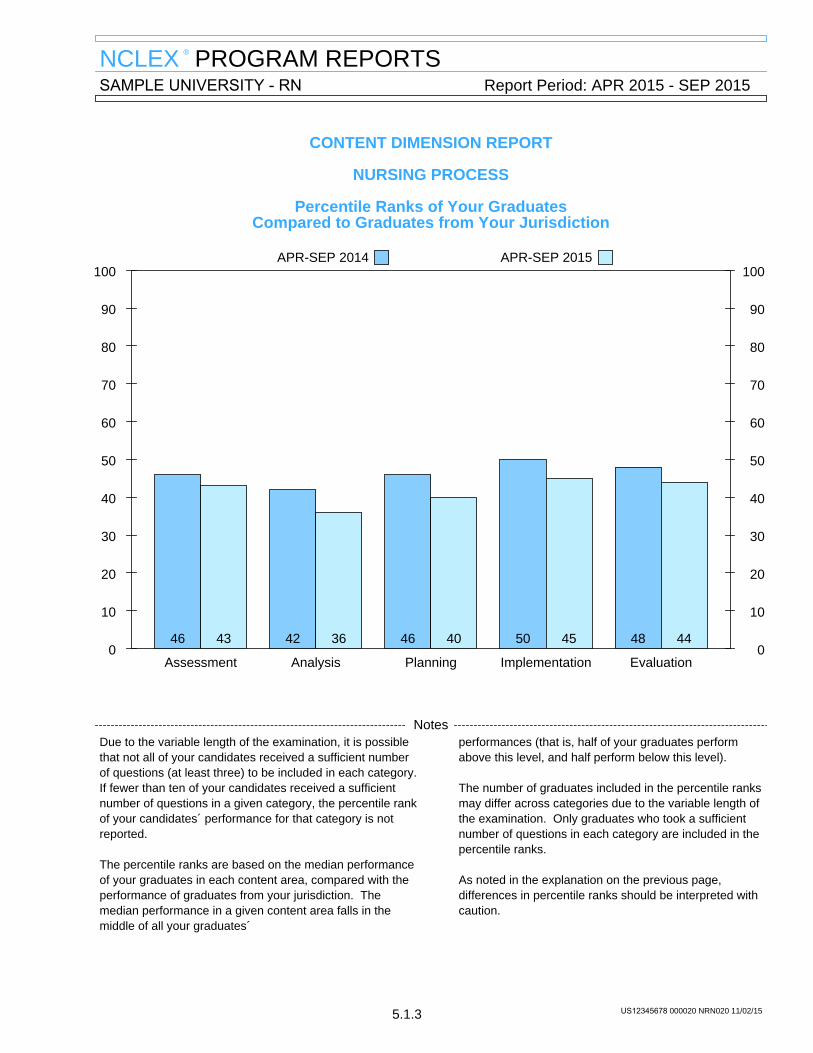
CONTENT DIMENSION REPORT
NURSING PROCESS
Percentile Ranks of Your GraduatesCompared to Graduates from Your Jurisdiction
APR-SEP 2014 APR-SEP 2015100 100
90 90
80 80
70 70
60 60
50 50
40 40
30 30
20 20
10 10
0 0Assessment
46 43
Analysis
42 36
Planning
46 40
Implementation
50 45
Evaluation
48 44
NotesDue to the variable length of the examination, it is possiblethat not all of your candidates received a sufficient numberof questions (at least three) to be included in each category.If fewer than ten of your candidates received a sufficientnumber of questions in a given category, the percentile rankof your candidates´ performance for that category is notreported.
The percentile ranks are based on the median performanceof your graduates in each content area, compared with theperformance of graduates from your jurisdiction. Themedian performance in a given content area falls in themiddle of all your graduates´
performances (that is, half of your graduates performabove this level, and half perform below this level).
The number of graduates included in the percentile ranksmay differ across categories due to the variable length ofthe examination. Only graduates who took a sufficientnumber of questions in each category are included in thepercentile ranks.
As noted in the explanation on the previous page,differences in percentile ranks should be interpreted withcaution.
5.1.3 US12345678 000020 NRN020 11/02/15
NCLEX ® PROGRAM REPORTSSAMPLE UNIVERSITY - RN Report Period: APR 2015 - SEP 2015
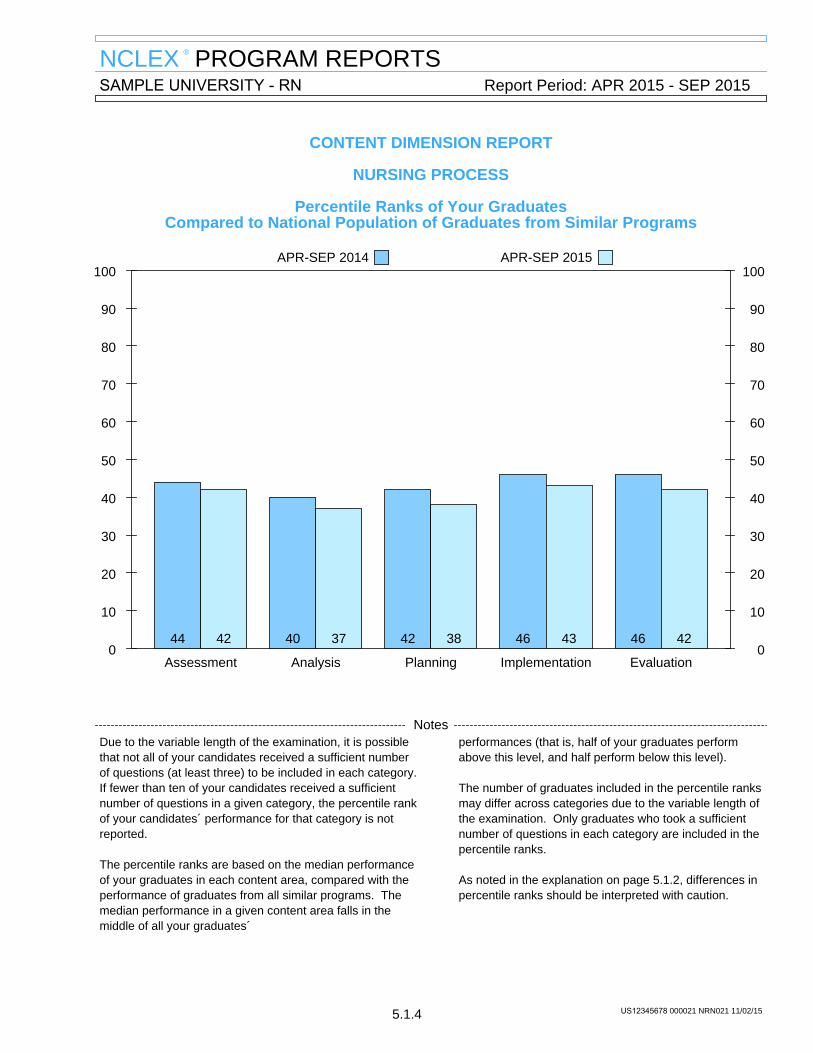
CONTENT DIMENSION REPORT
NURSING PROCESS
Percentile Ranks of Your GraduatesCompared to National Population of Graduates from Similar Programs
APR-SEP 2014 APR-SEP 2015100 100
90 90
80 80
70 70
60 60
50 50
40 40
30 30
20 20
10 10
0 0Assessment
44 42
Analysis
40 37
Planning
42 38
Implementation
46 43
Evaluation
46 42
NotesDue to the variable length of the examination, it is possiblethat not all of your candidates received a sufficient numberof questions (at least three) to be included in each category.If fewer than ten of your candidates received a sufficientnumber of questions in a given category, the percentile rankof your candidates´ performance for that category is notreported.
The percentile ranks are based on the median performanceof your graduates in each content area, compared with theperformance of graduates from all similar programs. Themedian performance in a given content area falls in themiddle of all your graduates´
performances (that is, half of your graduates performabove this level, and half perform below this level).
The number of graduates included in the percentile ranksmay differ across categories due to the variable length ofthe examination. Only graduates who took a sufficientnumber of questions in each category are included in thepercentile ranks.
As noted in the explanation on page 5.1.2, differences inpercentile ranks should be interpreted with caution.
5.1.4 US12345678 000021 NRN021 11/02/15
NCLEX ® PROGRAM REPORTSSAMPLE UNIVERSITY - RN Report Period: APR 2015 - SEP 2015
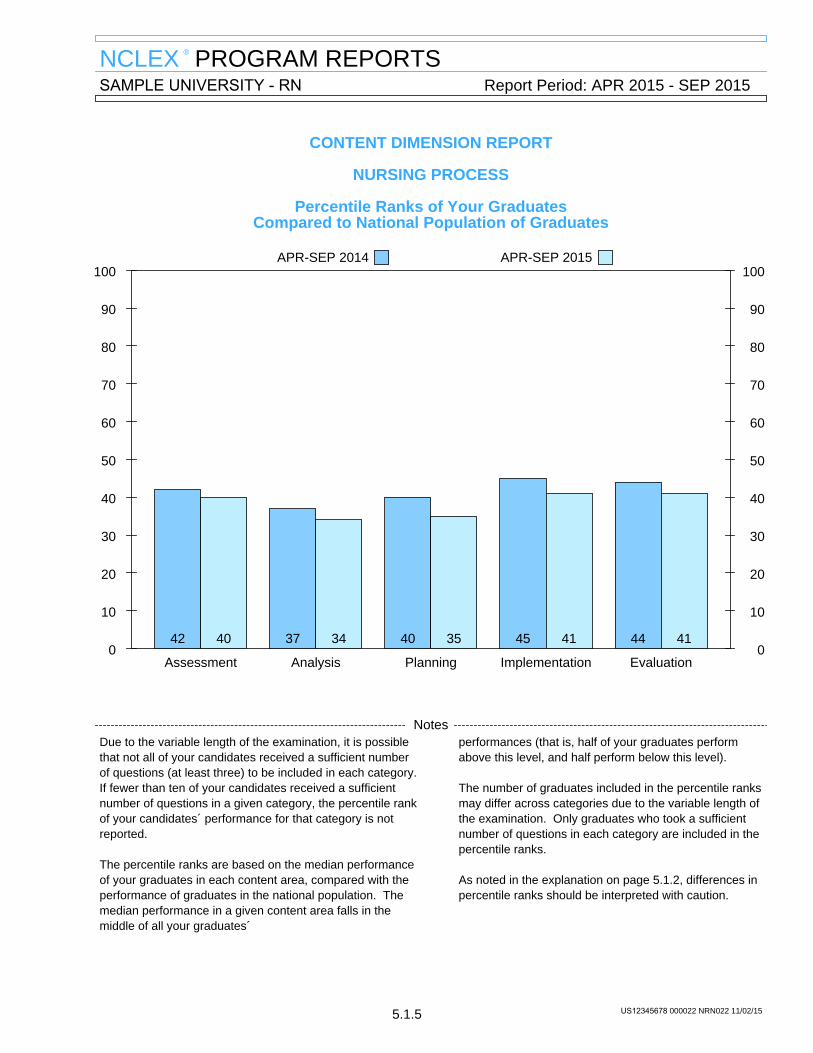
CONTENT DIMENSION REPORT
NURSING PROCESS
Percentile Ranks of Your GraduatesCompared to National Population of Graduates
APR-SEP 2014 APR-SEP 2015100 100
90 90
80 80
70 70
60 60
50 50
40 40
30 30
20 20
10 10
0 0Assessment
42 40
Analysis
37 34
Planning
40 35
Implementation
45 41
Evaluation
44 41
NotesDue to the variable length of the examination, it is possiblethat not all of your candidates received a sufficient numberof questions (at least three) to be included in each category.If fewer than ten of your candidates received a sufficientnumber of questions in a given category, the percentile rankof your candidates´ performance for that category is notreported.
The percentile ranks are based on the median performanceof your graduates in each content area, compared with theperformance of graduates in the national population. Themedian performance in a given content area falls in themiddle of all your graduates´
performances (that is, half of your graduates performabove this level, and half perform below this level).
The number of graduates included in the percentile ranksmay differ across categories due to the variable length ofthe examination. Only graduates who took a sufficientnumber of questions in each category are included in thepercentile ranks.
As noted in the explanation on page 5.1.2, differences inpercentile ranks should be interpreted with caution.
5.1.5 US12345678 000022 NRN022 11/02/15
NCLEX ® PROGRAM REPORTSCONTENT DIMENSION REPORTS
Nursing is a profession that promotes, maintains and restores health for individuals and their families. Nursesvalue a holistic approach to client care, utilizing frameworks to organize assessments, develop a plan of careand evaluate the provision of care. These systematic approaches to client care may employ functional healthpatterns, head-to-toe formats, or a body systems classification. Nursing education programs organize theircurricula in a pattern or framework to foster learning. Regardless of the framework utilized for nursing care ornursing education, its components are integrated to ensure that all clients´ physical and behavioral dimensionsare included.
The NCLEX® Content Dimension Reports in this section provide information about your graduates based on sixframeworks:
• Nursing Process• Categories of Human Functioning• Categories of Health Alterations• Wellness/Illness Continuum• Stages of Maturity• Stress, Adaptation, and Coping
The second set of the Content Dimension Reports is based on the Categories of Human Functioning.
CATEGORIES OF HUMAN FUNCTIONING
Categories of Human Functioning is a framework thatfocuses on a client´s ability to maintain essential lifefunctions. The ability to function adequately in each of thecategories results in a healthy person. Alterations in anycategory can affect health. Each of the Categories ofHuman Functioning is described below.
Categories of Human Functioning describe majordisturbances to the wellness continuum.
(1) Protective (safety): Functions related to protectionand defense of the body are classified in the protectivecategory. Physical safety is dependent on protectionfrom infection, injury, accidents, exposure, and abuse. Measures utilized to reduce these threats, such asassessing for side effects of medications and providingperioperative care, are incorporated in this category.
(2) Sensory-Perceptual (cognitive-perceptual): Functionsrelated to cognitive, sensory, and perceptual stimuliand the health concerns that develop from overloadand deprivations are the basis of this category. Content related to the ability to speak, hear, taste,touch, smell, comprehend and remember are included. Alterations in the central and peripheral nervoussystem and the senses account for the major healthproblems included in this category.
(3) Comfort, Rest, Activity, and Mobility (activity, sleep,and rest): Topics related to maintaining activities ofdaily living and the perception of comfort and rest/sleepare the principal components in this category. Alterations are related to factors that interfere with theneuromuscular system.
(4) Nutrition (nutritional-metabolic): The consumptionof food and fluid and the ability to meet themetabolic needs of the body fall under this category. Normal growth and development influence thiscategory as do disorders that interfere withingestion, digestion, and metabolism.
(5) Growth and Development: Basic concepts ofmaturation from conception throughout the life spanare included in the growth and developmentcategory. Childbearing and child rearing are viewedas part of development; thus, any alterations inthese areas are included in this category.
(6) Fluid-Gas Transport: The ability for an exchangeof gases in the lungs and at the cellular level formsan essential category. Alterations exist when thecardio-pulmonary and hematologic systems areaffected.
(7) Psychosocial-Cultural Functions (psychosocialdimensions): Human interaction, whether it is withinthe individual, between two or more people, or in alarge group, is the basis for this category. Self-concept, therapeutic communication,ethical-legal issues, spiritual needs, grieving anddying are all stages of this category.
(8) Elimination: Excretory functions of the bowel andbladder are the components of this category. Alterations in gastrointestinal or urinary patterns arethe main causes of health problems in elimination.
5.2.1 US12345678 000023 NRN023 11/02/15
NCLEX ® PROGRAM REPORTSCONTENT DIMENSION REPORTS
Percentile Rank Charts of Content Dimension Performance
These charts show how well your program´s typicalgraduate (taking the NCLEX® examination for the firsttime during this reporting period) performed indifferent content dimensions and how that compareswith the performance of last year´s typical graduate and with graduates across the United States and itsterritories.
Instead of showing passing rates, as in the SummaryOverview section, these charts show how well agraduate at the median competence level from yourprogram performed in specific content areas. TheNCLEX examination measurement model allows thecalculation of performance on any subset of items byadjusting for their difficulty.
Three types of comparisons are possible from thesecharts: (1) how your program´s typical graduatecompares with the rest of the country, (2) how wellyour program´s typical graduate does in the contentareas (remember that the difficulty of the items hasalready been taken into account), and (3) how the tworeporting periods compare.
The numbers on the vertical axis of the charts arepercentile ranks, indicating the percentage of
graduates who performed less well than (or thesame as) your typical graduate. Differences inpercentile ranks must be interpreted with caution. A single percentile-point spread towards the middleof the scale represents less of a true (observedscore) difference than the same spread at theextremes (e.g., 50th and 51st are not as different as90th and 91st). These charts are most appropriatelyused to determine areas of general programstrength and weakness, and not to make precisecomparisons.
An example of a statement that might be madebased on data from these charts is, "In this timeperiod, my median (middle) graduate did as well orbetter than 75% of the graduates in the country inthe first content area (Protective Functions), butonly 50% of graduates in the second content area(Sensory-Perceptual Functions). In the previoustime period, that pattern was reversed."
Prior to March 2000, percentile ranks were basedon program comparisons (rather than graduatecomparisons). For this reason, current resultsshould not be compared to Content DimensionReport results published prior to March 2000.
5.2.2 US12345678 000024 NRN024 11/02/15
NCLEX ® PROGRAM REPORTSSAMPLE UNIVERSITY - RN Report Period: APR 2015 - SEP 2015
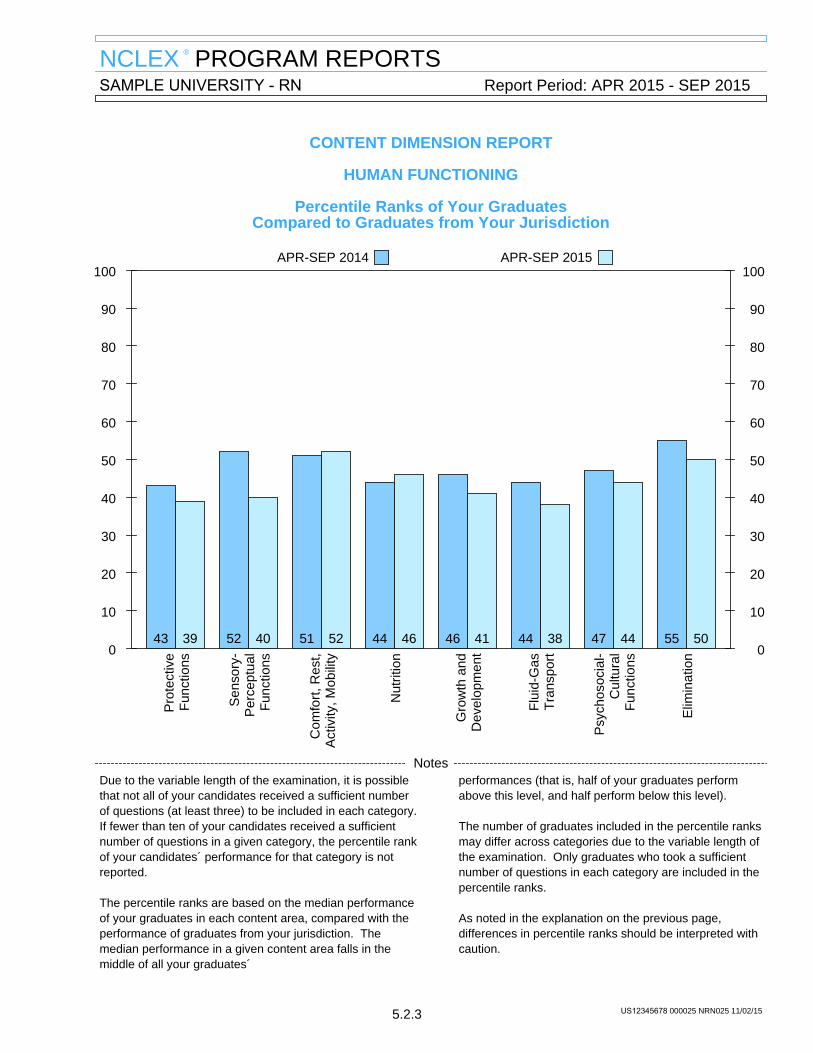
CONTENT DIMENSION REPORT
HUMAN FUNCTIONING
Percentile Ranks of Your GraduatesCompared to Graduates from Your Jurisdiction
APR-SEP 2014 APR-SEP 2015100 100
90 90
80 80
70 70
60 60
50 50
40 40
30 30
20 20
10 10
0 0
Pro
tect
ive
Fun
ctio
ns
43 39
Sen
sory
-P
erce
ptua
lF
unct
ions
52 40
Com
fort
, Res
t,A
ctiv
ity, M
obili
ty
51 52
Nut
ritio
n
44 46
Gro
wth
and
Dev
elop
men
t
46 41
Flu
id-G
asT
rans
port
44 38
Psy
chos
ocia
l-C
ultu
ral
Fun
ctio
ns47 44
Elim
inat
ion
55 50
NotesDue to the variable length of the examination, it is possiblethat not all of your candidates received a sufficient numberof questions (at least three) to be included in each category.If fewer than ten of your candidates received a sufficientnumber of questions in a given category, the percentile rankof your candidates´ performance for that category is notreported.
The percentile ranks are based on the median performanceof your graduates in each content area, compared with theperformance of graduates from your jurisdiction. Themedian performance in a given content area falls in themiddle of all your graduates´
performances (that is, half of your graduates performabove this level, and half perform below this level).
The number of graduates included in the percentile ranksmay differ across categories due to the variable length ofthe examination. Only graduates who took a sufficientnumber of questions in each category are included in thepercentile ranks.
As noted in the explanation on the previous page,differences in percentile ranks should be interpreted withcaution.
5.2.3 US12345678 000025 NRN025 11/02/15
NCLEX ® PROGRAM REPORTSSAMPLE UNIVERSITY - RN Report Period: APR 2015 - SEP 2015
CONTENT DIMENSION REPORT
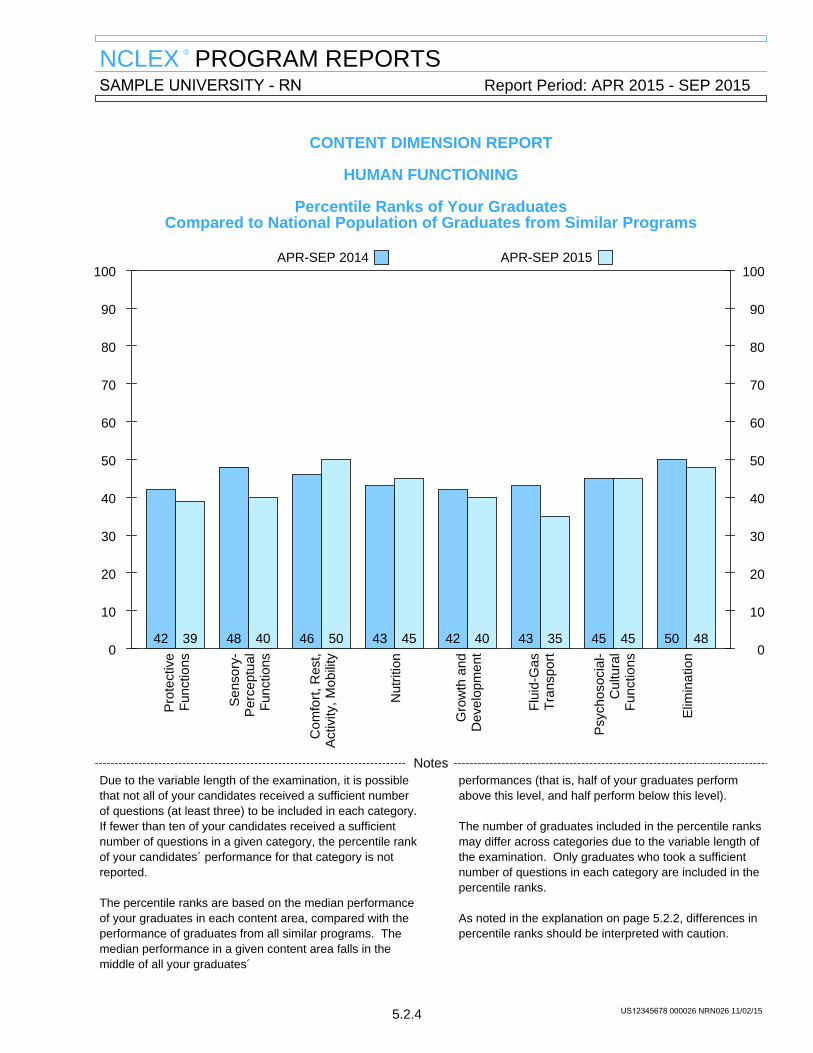
HUMAN FUNCTIONING
Percentile Ranks of Your GraduatesCompared to National Population of Graduates from Similar Programs
APR-SEP 2014 APR-SEP 2015100 100
90 90
80 80
70 70
60 60
50 50
40 40
30 30
20 20
10 10
0 0
Pro
tect
ive
Fun
ctio
ns
42 39
Sen
sory
-P
erce
ptua
lF
unct
ions
48 40
Com
fort
, Res
t,A
ctiv
ity, M
obili
ty
46 50
Nut
ritio
n
43 45
Gro
wth
and
Dev
elop
men
t
42 40
Flu
id-G
asT
rans
port
43 35
Psy
chos
ocia
l-C
ultu
ral
Fun
ctio
ns45 45
Elim
inat
ion
50 48
NotesDue to the variable length of the examination, it is possiblethat not all of your candidates received a sufficient numberof questions (at least three) to be included in each category.If fewer than ten of your candidates received a sufficientnumber of questions in a given category, the percentile rankof your candidates´ performance for that category is notreported.
The percentile ranks are based on the median performanceof your graduates in each content area, compared with theperformance of graduates from all similar programs. Themedian performance in a given content area falls in themiddle of all your graduates´
performances (that is, half of your graduates performabove this level, and half perform below this level).
The number of graduates included in the percentile ranksmay differ across categories due to the variable length ofthe examination. Only graduates who took a sufficientnumber of questions in each category are included in thepercentile ranks.
As noted in the explanation on page 5.2.2, differences inpercentile ranks should be interpreted with caution.
5.2.4 US12345678 000026 NRN026 11/02/15
NCLEX ® PROGRAM REPORTSSAMPLE UNIVERSITY - RN Report Period: APR 2015 - SEP 2015
CONTENT DIMENSION REPORT
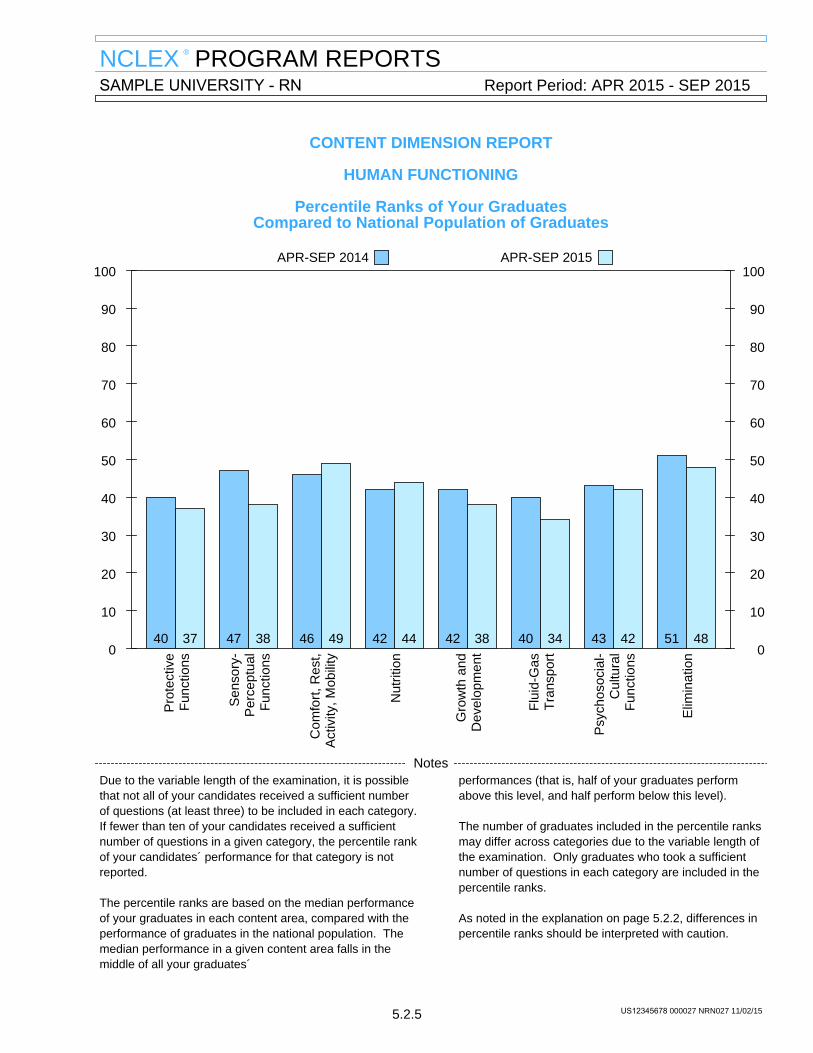
HUMAN FUNCTIONING
Percentile Ranks of Your GraduatesCompared to National Population of Graduates
APR-SEP 2014 APR-SEP 2015100 100
90 90
80 80
70 70
60 60
50 50
40 40
30 30
20 20
10 10
0 0
Pro
tect
ive
Fun
ctio
ns
40 37
Sen
sory
-P
erce
ptua
lF
unct
ions
47 38
Com
fort
, Res
t,A
ctiv
ity, M
obili
ty
46 49
Nut
ritio
n
42 44
Gro
wth
and
Dev
elop
men
t
42 38
Flu
id-G
asT
rans
port
40 34
Psy
chos
ocia
l-C
ultu
ral
Fun
ctio
ns43 42
Elim
inat
ion
51 48
NotesDue to the variable length of the examination, it is possiblethat not all of your candidates received a sufficient numberof questions (at least three) to be included in each category.If fewer than ten of your candidates received a sufficientnumber of questions in a given category, the percentile rankof your candidates´ performance for that category is notreported.
The percentile ranks are based on the median performanceof your graduates in each content area, compared with theperformance of graduates in the national population. Themedian performance in a given content area falls in themiddle of all your graduates´
performances (that is, half of your graduates performabove this level, and half perform below this level).
The number of graduates included in the percentile ranksmay differ across categories due to the variable length ofthe examination. Only graduates who took a sufficientnumber of questions in each category are included in thepercentile ranks.
As noted in the explanation on page 5.2.2, differences inpercentile ranks should be interpreted with caution.
5.2.5 US12345678 000027 NRN027 11/02/15
NCLEX ® PROGRAM REPORTSCONTENT DIMENSION REPORTS
Nursing is a profession that promotes, maintains and restores health for individuals and their families. Nursesvalue a holistic approach to client care, utilizing frameworks to organize assessments, develop a plan of careand evaluate the provision of care. These systematic approaches to client care may employ functional healthpatterns, head-to-toe formats, or a body systems classification. Nursing education programs organize theircurricula in a pattern or framework to foster learning. Regardless of the framework utilized for nursing care ornursing education, its components are integrated to ensure that all clients´ physical and behavioral dimensionsare included.
The NCLEX® Content Dimension Reports in this section provide information about your graduates based on sixframeworks:
• Nursing Process• Categories of Human Functioning• Categories of Health Alterations• Wellness/Illness Continuum• Stages of Maturity• Stress, Adaptation, and Coping
The third set of the Content Dimension Reports is based on the Categories of Health Alterations.
CATEGORIES OF HEALTH ALTERATIONS
Categories of Health Alterations describe thefundamental body systems that may be impactedfrom changes in the wellness continuum.
(1) Cardiovascular: includes the heart, blood, andthe vascular and lymphatic systems. Content thatrelates to multisystem trauma is included in thiscategory.
(2) Endocrine/Metabolic: includes all health issuesrelated to the endocrine glands, with theexception of the ovaries and testes. All aspectsof care for the client with diabetes mellitus areincluded within the endocrine system.
(3) Gastrointestinal: includes disorders as well ashealth issues related to the liver, biliary andexocrine pancreas.
(4) Reproductive: encompasses childbearing,female and male reproductive disorders,sexuality, and fertility.
(5) Integumentary/Musculoskeletal: are combinedto include all functions related to skin, bones, andjoints.
(6) Immune: encompasses health matters relatedto the body´s ability to protect and defend. Infection, autoimmune diseases,hypersensitivity states and immune complexdiseases are included.
(7) Nervous/Sensory: incorporates alterations inthe central and peripheral nervous system aswell as health concerns related to functions ofthe senses.
(8) Psychosocial Behaviors: encompassesconcepts of mental health and mental illness. Therapeutic communication and behaviorsassociated with illness are incorporated.
(9) Renal/Urinary: includes function anddysfunction related to the kidneys, bladder, andrelated structures.
(10) Respiratory: incorporates all healthconsiderations associated with gas exchangeinvolving the lungs and related airwaystructures.
5.3.1 US12345678 000028 NRN028 11/02/15

NCLEX ® PROGRAM REPORTSCONTENT DIMENSION REPORTS
Percentile Rank Charts of Content Dimension Performance
These charts show how well your program´s typicalgraduate (taking the NCLEX® examination for the firsttime during this reporting period) performed indifferent content dimensions and how that compareswith the performance of last year´s typical graduate and with graduates across the United States and itsterritories.
Instead of showing passing rates, as in the SummaryOverview section, these charts show how well agraduate at the median competence level from yourprogram performed in specific content areas. TheNCLEX examination measurement model allows thecalculation of performance on any subset of items byadjusting for their difficulty.
Three types of comparisons are possible from thesecharts: (1) how your program´s typical graduatecompares with the rest of the country, (2) how wellyour program´s typical graduate does in the contentareas (remember that the difficulty of the items hasalready been taken into account), and (3) how the tworeporting periods compare.
The numbers on the vertical axis of the charts arepercentile ranks, indicating the percentage of
graduates who performed less well than (or thesame as) your typical graduate. Differences inpercentile ranks must be interpreted with caution. A single percentile-point spread towards the middleof the scale represents less of a true (observedscore) difference than the same spread at theextremes (e.g., 50th and 51st are not as different as90th and 91st). These charts are most appropriatelyused to determine areas of general programstrength and weakness, and not to make precisecomparisons.
An example of a statement that might be madebased on data from these charts is, "In this timeperiod, my median (middle) graduate did as well orbetter than 75% of the graduates in the country inthe first content area (Cardiovascular), but only50% of graduates in the second content area(Endocrine/Metabolic). In the previous time period,that pattern was reversed."
Prior to March 2000, percentile ranks were basedon program comparisons (rather than graduatecomparisons). For this reason, current resultsshould not be compared to Content DimensionReport results published prior to March 2000.
5.3.2 US12345678 000029 NRN029 11/02/15
NCLEX ® PROGRAM REPORTSSAMPLE UNIVERSITY - RN Report Period: APR 2015 - SEP 2015
CONTENT DIMENSION REPORT
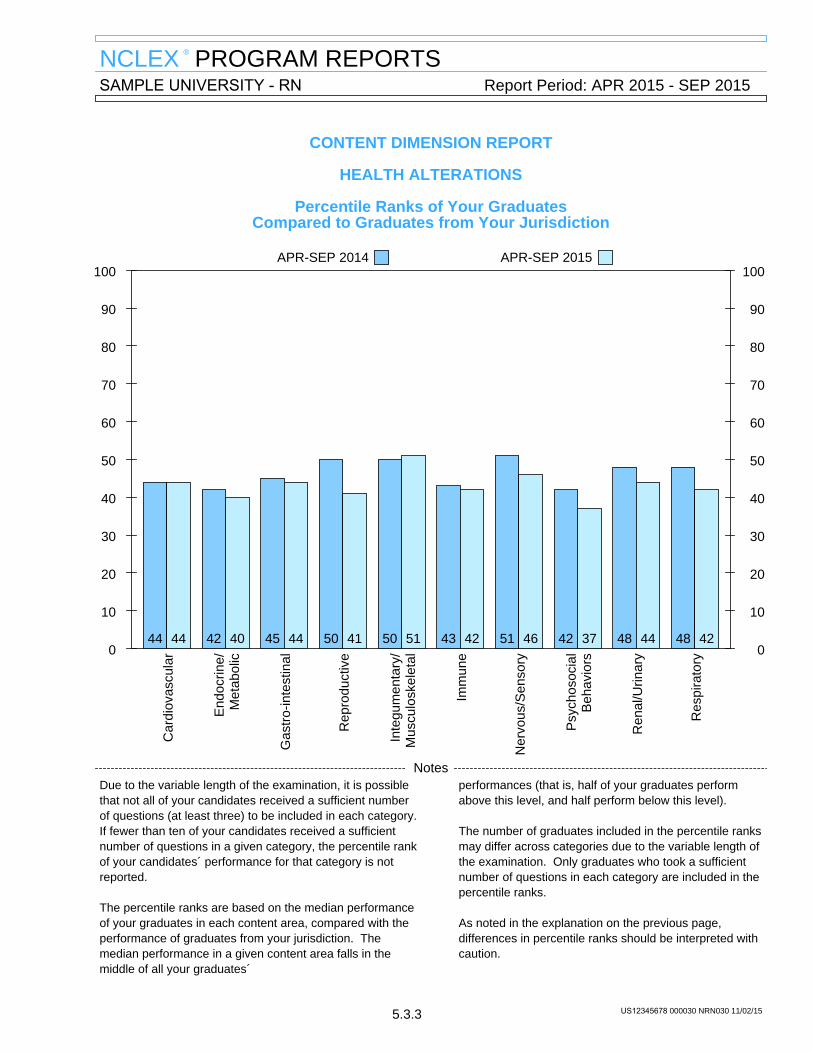
HEALTH ALTERATIONS
Percentile Ranks of Your GraduatesCompared to Graduates from Your Jurisdiction
APR-SEP 2014 APR-SEP 2015100 100
90 90
80 80
70 70
60 60
50 50
40 40
30 30
20 20
10 10
0 0
Car
diov
ascu
lar
44 44
End
ocrin
e/M
etab
olic
42 40
Gas
tro-
inte
stin
al
45 44
Rep
rodu
ctiv
e
50 41
Inte
gum
enta
ry/
Mus
culo
skel
etal
50 51
Imm
une
43 42
Ner
vous
/Sen
sory
51 46
Psy
chos
ocia
lB
ehav
iors
42 37R
enal
/Urin
ary
48 44
Res
pira
tory
48 42
NotesDue to the variable length of the examination, it is possiblethat not all of your candidates received a sufficient numberof questions (at least three) to be included in each category.If fewer than ten of your candidates received a sufficientnumber of questions in a given category, the percentile rankof your candidates´ performance for that category is notreported.
The percentile ranks are based on the median performanceof your graduates in each content area, compared with theperformance of graduates from your jurisdiction. Themedian performance in a given content area falls in themiddle of all your graduates´
performances (that is, half of your graduates performabove this level, and half perform below this level).
The number of graduates included in the percentile ranksmay differ across categories due to the variable length ofthe examination. Only graduates who took a sufficientnumber of questions in each category are included in thepercentile ranks.
As noted in the explanation on the previous page,differences in percentile ranks should be interpreted withcaution.
5.3.3 US12345678 000030 NRN030 11/02/15
NCLEX ® PROGRAM REPORTSSAMPLE UNIVERSITY - RN Report Period: APR 2015 - SEP 2015
CONTENT DIMENSION REPORT
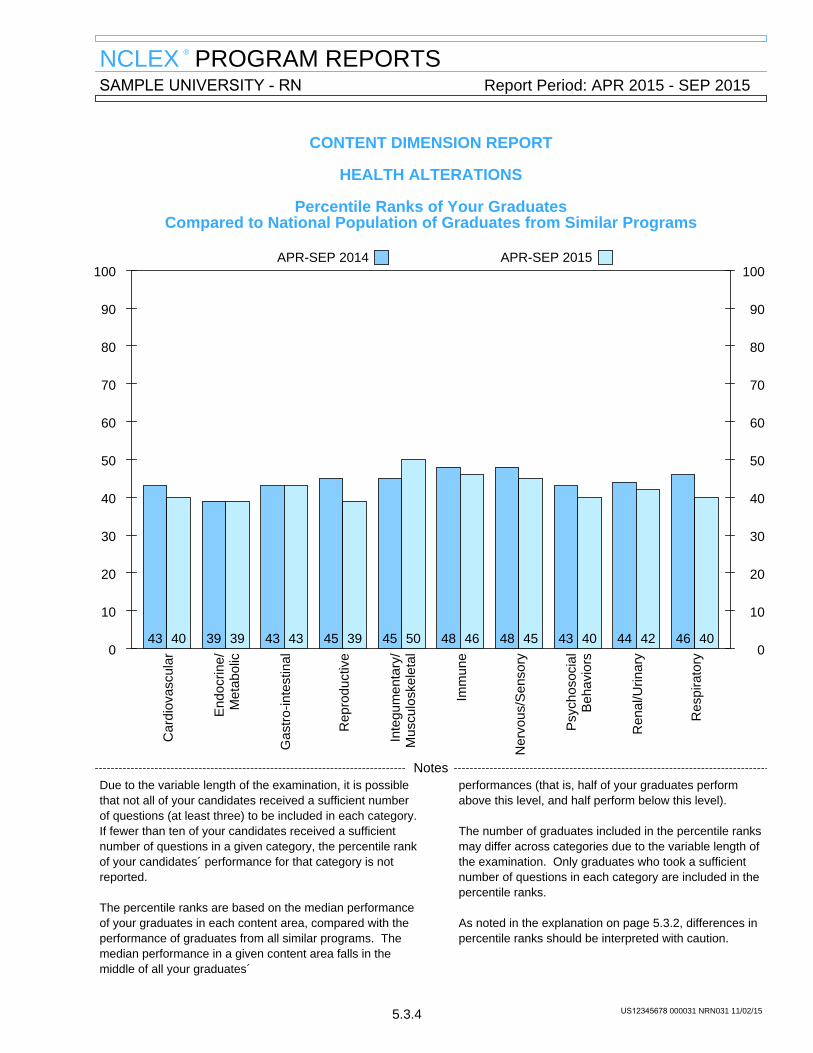
HEALTH ALTERATIONS
Percentile Ranks of Your GraduatesCompared to National Population of Graduates from Similar Programs
APR-SEP 2014 APR-SEP 2015100 100
90 90
80 80
70 70
60 60
50 50
40 40
30 30
20 20
10 10
0 0
Car
diov
ascu
lar
43 40
End
ocrin
e/M
etab
olic
39 39
Gas
tro-
inte
stin
al
43 43
Rep
rodu
ctiv
e
45 39
Inte
gum
enta
ry/
Mus
culo
skel
etal
45 50
Imm
une
48 46
Ner
vous
/Sen
sory
48 45
Psy
chos
ocia
lB
ehav
iors
43 40R
enal
/Urin
ary
44 42
Res
pira
tory
46 40
NotesDue to the variable length of the examination, it is possiblethat not all of your candidates received a sufficient numberof questions (at least three) to be included in each category.If fewer than ten of your candidates received a sufficientnumber of questions in a given category, the percentile rankof your candidates´ performance for that category is notreported.
The percentile ranks are based on the median performanceof your graduates in each content area, compared with theperformance of graduates from all similar programs. Themedian performance in a given content area falls in themiddle of all your graduates´
performances (that is, half of your graduates performabove this level, and half perform below this level).
The number of graduates included in the percentile ranksmay differ across categories due to the variable length ofthe examination. Only graduates who took a sufficientnumber of questions in each category are included in thepercentile ranks.
As noted in the explanation on page 5.3.2, differences inpercentile ranks should be interpreted with caution.
5.3.4 US12345678 000031 NRN031 11/02/15
NCLEX ® PROGRAM REPORTSSAMPLE UNIVERSITY - RN Report Period: APR 2015 - SEP 2015
CONTENT DIMENSION REPORT
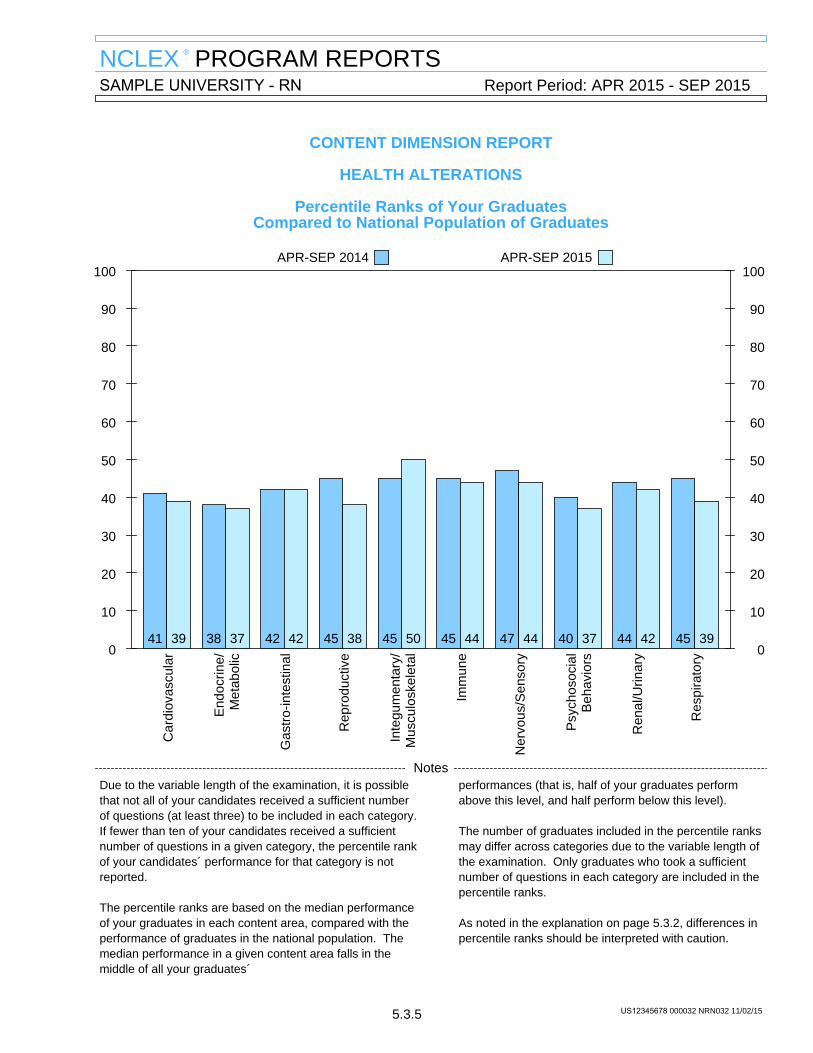
HEALTH ALTERATIONS
Percentile Ranks of Your GraduatesCompared to National Population of Graduates
APR-SEP 2014 APR-SEP 2015100 100
90 90
80 80
70 70
60 60
50 50
40 40
30 30
20 20
10 10
0 0
Car
diov
ascu
lar
41 39
End
ocrin
e/M
etab
olic
38 37
Gas
tro-
inte
stin
al
42 42
Rep
rodu
ctiv
e
45 38
Inte
gum
enta
ry/
Mus
culo
skel
etal
45 50
Imm
une
45 44
Ner
vous
/Sen
sory
47 44
Psy
chos
ocia
lB
ehav
iors
40 37R
enal
/Urin
ary
44 42
Res
pira
tory
45 39
NotesDue to the variable length of the examination, it is possiblethat not all of your candidates received a sufficient numberof questions (at least three) to be included in each category.If fewer than ten of your candidates received a sufficientnumber of questions in a given category, the percentile rankof your candidates´ performance for that category is notreported.
The percentile ranks are based on the median performanceof your graduates in each content area, compared with theperformance of graduates in the national population. Themedian performance in a given content area falls in themiddle of all your graduates´
performances (that is, half of your graduates performabove this level, and half perform below this level).
The number of graduates included in the percentile ranksmay differ across categories due to the variable length ofthe examination. Only graduates who took a sufficientnumber of questions in each category are included in thepercentile ranks.
As noted in the explanation on page 5.3.2, differences inpercentile ranks should be interpreted with caution.
5.3.5 US12345678 000032 NRN032 11/02/15
NCLEX ® PROGRAM REPORTSCONTENT DIMENSION REPORTS
Nursing is a profession that promotes, maintains and restores health for individuals and their families. Nursesvalue a holistic approach to client care, utilizing frameworks to organize assessments, develop a plan of careand evaluate the provision of care. These systematic approaches to client care may employ functional healthpatterns, head-to-toe formats, or a body systems classification. Nursing education programs organize theircurricula in a pattern or framework to foster learning. Regardless of the framework utilized for nursing care ornursing education, its components are integrated to ensure that all clients´ physical and behavioral dimensionsare included.
The NCLEX® Content Dimension Reports in this section provide information about your graduates based on sixframeworks:
• Nursing Process• Categories of Human Functioning• Categories of Health Alterations• Wellness/Illness Continuum• Stages of Maturity• Stress, Adaptation, and Coping
The fourth set of the Content Dimension Reports is based on the Wellness/Illness Continuum.
CATEGORIES OF WELLNESS/ILLNESS CONTINUUM
The wellness/illness continuum is defined as therange of one´s total health. This continuum isconstantly changing in relation to the client´s physical,mental, and social being. Wellness and illness are atopposite ends of the continuum with a multitude ofranges in between. Health and illness are separatebut coexisting and interacting. Wellness is a dynamicstate that is altered as clients adjust to environmentalstimuli and maintain a state of optimal stability. Illness represents a state in which health isdiminished or impaired due to the client´s inability toadjust to environmental stimuli. This continuum isever-changing throughout the life span.
Nursing and the health-illness care delivery systemprovide services in which clients are recipients in thefollowing categories.
(1) Health Promotion: includes prevention of illness,such as immunization of clients, screening forcommunicable diseases and control of thetransmission of infection. Preventive care alsoinvolves educating clients regarding lifestylepractices in order to prevent illness. Healthpromotion is concerned with helping individualsexpand their capabilities to live fuller and moresatisfying lives. Normal growth and developmentalong with normal childbearing are also includedin health promotion.
(2) Health Maintenance: includes preservation ofthe health status of an individual. The client inthis category will need ongoing care becauseof continuous threats to optimum health. These clients need rehabilitative services ormay have chronic disease that needs constantmonitoring. Clients may be in any age group.
(3) Health Restoration, Acute/Simple:encompasses clients who are generally healthybut have an alteration leading to diagnostictesting, injury, or illness. These clientsgenerally have an acute health alterationinvolving one system. This category alsoincludes clients with complications related topregnancy and childbirth.
(4) Health Restoration, Acute/Complex: includesclients who are experiencing an acute illnessbut also have a previous chronic illness. Thechronic illness may or may not be related to theacute health alteration. Therefore, more thanone system is usually involved. These clientsenter the health care system for diagnostictesting, complications of the chronic illness,acute illness or injury.
5.4.1 US12345678 000033 NRN033 11/02/15

NCLEX ® PROGRAM REPORTSCONTENT DIMENSION REPORTS
Percentile Rank Charts of Content Dimension Performance
These charts show how well your program´s typicalgraduate (taking the NCLEX® examination for the firsttime during this reporting period) performed indifferent content dimensions and how that compareswith the performance of last year´s typical graduate and with graduates across the United States and itsterritories.
Instead of showing passing rates, as in the SummaryOverview section, these charts show how well agraduate at the median competence level from yourprogram performed in specific content areas. TheNCLEX examination measurement model allows thecalculation of performance on any subset of items byadjusting for their difficulty.
Three types of comparisons are possible from thesecharts: (1) how your program´s typical graduatecompares with the rest of the country, (2) how wellyour program´s typical graduate does in the contentareas (remember that the difficulty of the items hasalready been taken into account), and (3) how the tworeporting periods compare.
The numbers on the vertical axis of the charts arepercentile ranks, indicating the percentage of
graduates who performed less well than (or thesame as) your typical graduate. Differences inpercentile ranks must be interpreted with caution. A single percentile-point spread towards the middleof the scale represents less of a true (observedscore) difference than the same spread at theextremes (e.g., 50th and 51st are not as different as90th and 91st). These charts are most appropriatelyused to determine areas of general programstrength and weakness, and not to make precisecomparisons.
An example of a statement that might be madebased on data from these charts is, "In this timeperiod, my median (middle) graduate did as well orbetter than 75% of the graduates in the country inthe first content area (Health Promotion), but only50% of graduates in the second content area(Health Maintenance). In the previous time period,that pattern was reversed."
Prior to March 2000, percentile ranks were basedon program comparisons (rather than graduatecomparisons). For this reason, current resultsshould not be compared to Content DimensionReport results published prior to March 2000.
5.4.2 US12345678 000034 NRN034 11/02/15
NCLEX ® PROGRAM REPORTSSAMPLE UNIVERSITY - RN Report Period: APR 2015 - SEP 2015
CONTENT DIMENSION REPORT
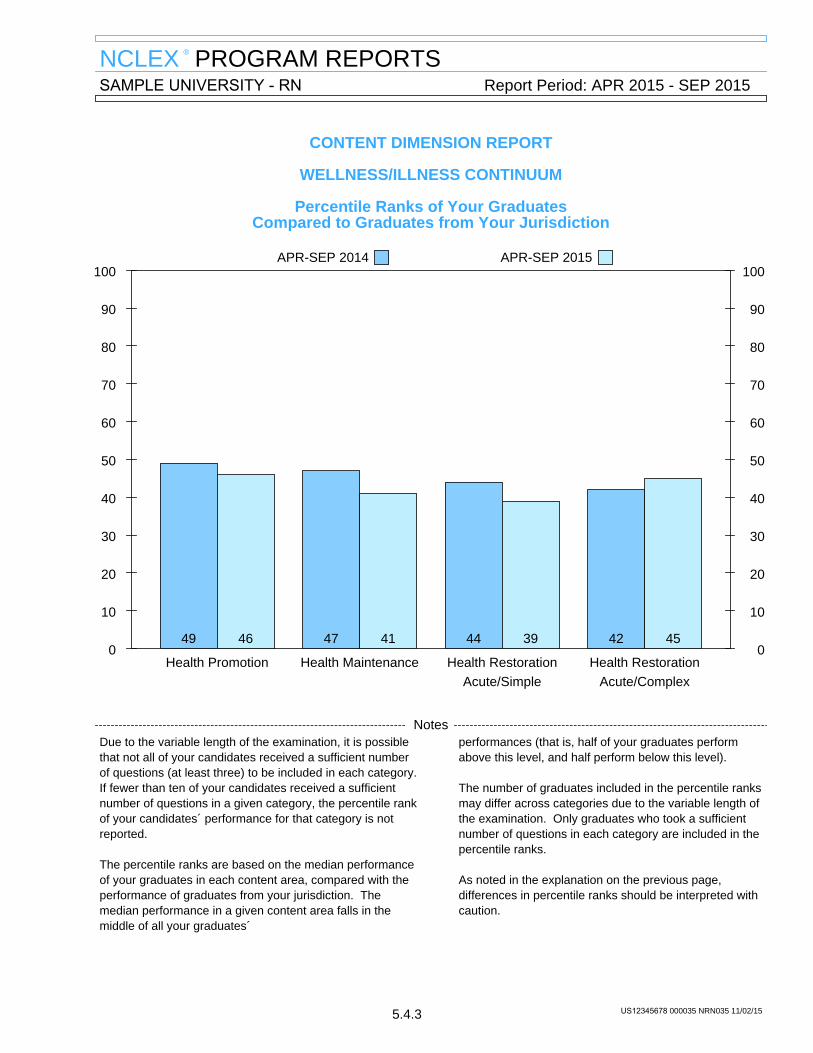
WELLNESS/ILLNESS CONTINUUM
Percentile Ranks of Your GraduatesCompared to Graduates from Your Jurisdiction
APR-SEP 2014 APR-SEP 2015100 100
90 90
80 80
70 70
60 60
50 50
40 40
30 30
20 20
10 10
0 0Health Promotion
49 46
Health Maintenance
47 41
Health RestorationAcute/Simple
44 39
Health RestorationAcute/Complex
42 45
NotesDue to the variable length of the examination, it is possiblethat not all of your candidates received a sufficient numberof questions (at least three) to be included in each category.If fewer than ten of your candidates received a sufficientnumber of questions in a given category, the percentile rankof your candidates´ performance for that category is notreported.
The percentile ranks are based on the median performanceof your graduates in each content area, compared with theperformance of graduates from your jurisdiction. Themedian performance in a given content area falls in themiddle of all your graduates´
performances (that is, half of your graduates performabove this level, and half perform below this level).
The number of graduates included in the percentile ranksmay differ across categories due to the variable length ofthe examination. Only graduates who took a sufficientnumber of questions in each category are included in thepercentile ranks.
As noted in the explanation on the previous page,differences in percentile ranks should be interpreted withcaution.
5.4.3 US12345678 000035 NRN035 11/02/15
NCLEX ® PROGRAM REPORTSSAMPLE UNIVERSITY - RN Report Period: APR 2015 - SEP 2015
CONTENT DIMENSION REPORT
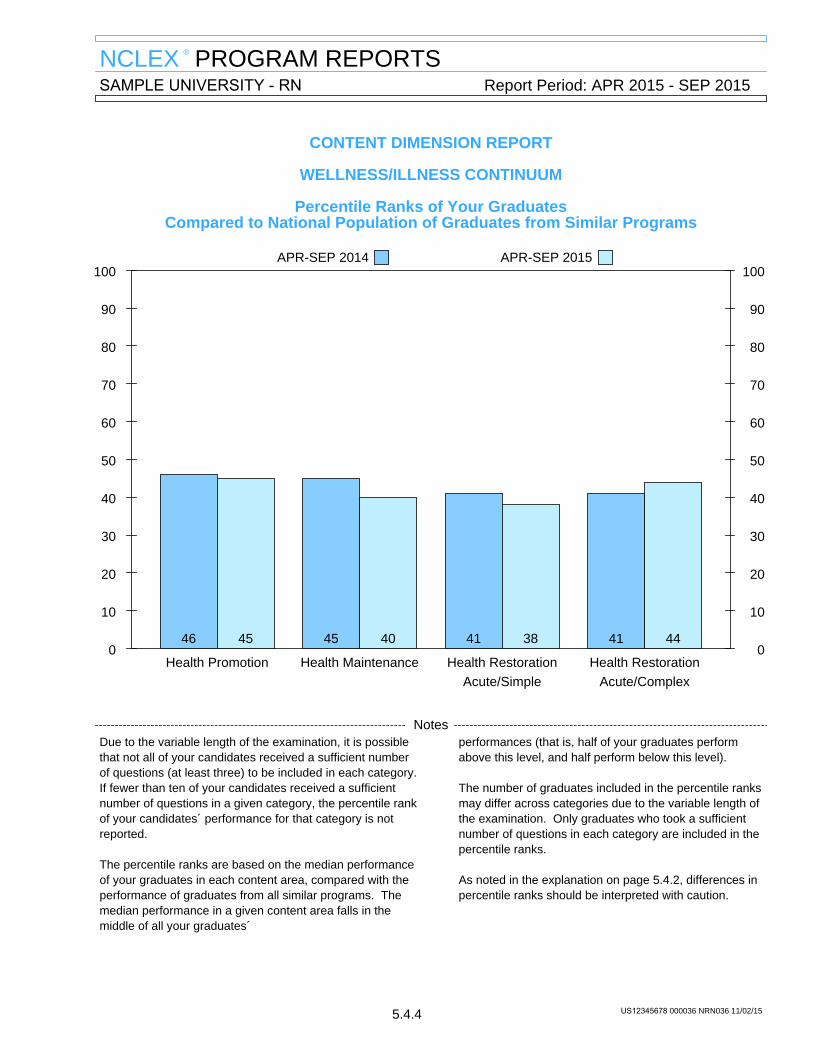
WELLNESS/ILLNESS CONTINUUM
Percentile Ranks of Your GraduatesCompared to National Population of Graduates from Similar Programs
APR-SEP 2014 APR-SEP 2015100 100
90 90
80 80
70 70
60 60
50 50
40 40
30 30
20 20
10 10
0 0Health Promotion
46 45
Health Maintenance
45 40
Health RestorationAcute/Simple
41 38
Health RestorationAcute/Complex
41 44
NotesDue to the variable length of the examination, it is possiblethat not all of your candidates received a sufficient numberof questions (at least three) to be included in each category.If fewer than ten of your candidates received a sufficientnumber of questions in a given category, the percentile rankof your candidates´ performance for that category is notreported.
The percentile ranks are based on the median performanceof your graduates in each content area, compared with theperformance of graduates from all similar programs. Themedian performance in a given content area falls in themiddle of all your graduates´
performances (that is, half of your graduates performabove this level, and half perform below this level).
The number of graduates included in the percentile ranksmay differ across categories due to the variable length ofthe examination. Only graduates who took a sufficientnumber of questions in each category are included in thepercentile ranks.
As noted in the explanation on page 5.4.2, differences inpercentile ranks should be interpreted with caution.
5.4.4 US12345678 000036 NRN036 11/02/15
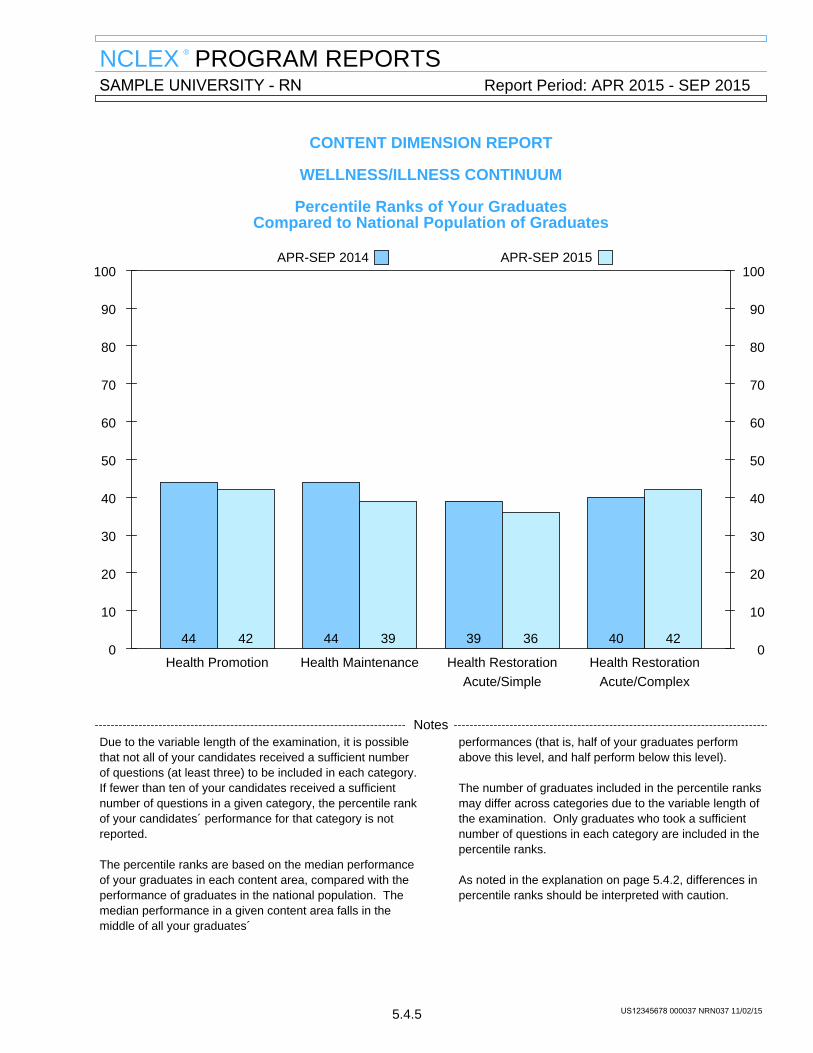
NCLEX ® PROGRAM REPORTSSAMPLE UNIVERSITY - RN Report Period: APR 2015 - SEP 2015
CONTENT DIMENSION REPORT
WELLNESS/ILLNESS CONTINUUM
Percentile Ranks of Your GraduatesCompared to National Population of Graduates
APR-SEP 2014 APR-SEP 2015100 100
90 90
80 80
70 70
60 60
50 50
40 40
30 30
20 20
10 10
0 0Health Promotion
44 42
Health Maintenance
44 39
Health RestorationAcute/Simple
39 36
Health RestorationAcute/Complex
40 42
NotesDue to the variable length of the examination, it is possiblethat not all of your candidates received a sufficient numberof questions (at least three) to be included in each category.If fewer than ten of your candidates received a sufficientnumber of questions in a given category, the percentile rankof your candidates´ performance for that category is notreported.
The percentile ranks are based on the median performanceof your graduates in each content area, compared with theperformance of graduates in the national population. Themedian performance in a given content area falls in themiddle of all your graduates´
performances (that is, half of your graduates performabove this level, and half perform below this level).
The number of graduates included in the percentile ranksmay differ across categories due to the variable length ofthe examination. Only graduates who took a sufficientnumber of questions in each category are included in thepercentile ranks.
As noted in the explanation on page 5.4.2, differences inpercentile ranks should be interpreted with caution.
5.4.5 US12345678 000037 NRN037 11/02/15
NCLEX ® PROGRAM REPORTSCONTENT DIMENSION REPORTS
Nursing is a profession that promotes, maintains and restores health for individuals and their families. Nursesvalue a holistic approach to client care, utilizing frameworks to organize assessments, develop a plan of careand evaluate the provision of care. These systematic approaches to client care may employ functional healthpatterns, head-to-toe formats, or a body systems classification. Nursing education programs organize theircurricula in a pattern or framework to foster learning. Regardless of the framework utilized for nursing care ornursing education, its components are integrated to ensure that all clients´ physical and behavioral dimensionsare included.
The NCLEX® Content Dimension Reports in this section provide information about your graduates based on sixframeworks:
• Nursing Process• Categories of Human Functioning• Categories of Health Alterations• Wellness/Illness Continuum• Stages of Maturity• Stress, Adaptation, and Coping
The fifth set of the Content Dimension Reports is based on the Stages of Maturity.
STAGES OF MATURITY
The diversity of nursing roles requires nurses to havean understanding of human growth and development.Knowledge of growth and development is needed forrecognizing normal patterns and understandingvariations in all age groups. Understanding theexpected growth and behaviors of each level ofmaturation provides the nurse with a framework forpromoting the health of individuals. The maturationalapproach assists nurses in organizing typicalbehaviors that relate to each developmental periodand in providing care in order to promote optimumgrowth and development.
The stages of maturity have been condensed into fivespecific age categories. Each of these categories isdefined below. Some NCLEX® examination questionsconcern the provision of care to clients whose needsare the same regardless of age or developmentallevel. These questions are grouped into the sixthcategory, Life Span.
Maturation Content Categories
(1) Natal: Prenatal to 1 year: begins with conceptionand includes fetal growth and development, birthand the development and health problems of theneonate and infant.
(2) Childhood: 1-10 years: includes the growth,development and health problems of thetoddler, preschool, and school-aged child.
(3) Adolescence: 11-19 years: begins with theonset of puberty and comprises the healthissues related to the physical, psychosocialand emotional development leading toadulthood.
(4) Adulthood: 20-65 years: encompasses theperiod when physical growth has halted andthe effects of aging begin. There are manyhealth considerations that relate to the social,physiological and biological changes ofadulthood.
(5) Older Adulthood: 66 years and older: encompasses the aging process that results ininevitable changes affecting the health of theolder adult. These age-related changes areoften complex and can result in chronic illness,disabilities, and death.
(6) Life Span: Certain health concepts areuniversal and continuous. These concepts donot change with a specific age ordevelopmental level.
5.5.1 US12345678 000038 NRN038 11/02/15
NCLEX ® PROGRAM REPORTSCONTENT DIMENSION REPORTS
Percentile Rank Charts of Content Dimension Performance
These charts show how well your program´s typicalgraduate (taking the NCLEX® examination for the firsttime during this reporting period) performed indifferent content dimensions and how that compareswith the performance of last year´s typical graduate and with graduates across the United States and itsterritories.
Instead of showing passing rates, as in the SummaryOverview section, these charts show how well agraduate at the median competence level from yourprogram performed in specific content areas. TheNCLEX examination measurement model allows thecalculation of performance on any subset of items byadjusting for their difficulty.
Three types of comparisons are possible from thesecharts: (1) how your program´s typical graduatecompares with the rest of the country, (2) how wellyour program´s typical graduate does in the contentareas (remember that the difficulty of the items hasalready been taken into account), and (3) how the tworeporting periods compare.
The numbers on the vertical axis of the charts arepercentile ranks, indicating the percentage of
graduates who performed less well than (or thesame as) your typical graduate. Differences inpercentile ranks must be interpreted with caution. A single percentile-point spread towards the middleof the scale represents less of a true (observedscore) difference than the same spread at theextremes (e.g., 50th and 51st are not as different as90th and 91st). These charts are most appropriatelyused to determine areas of general programstrength and weakness, and not to make precisecomparisons.
An example of a statement that might be madebased on data from these charts is, "In this timeperiod, my median (middle) graduate did as well orbetter than 75% of the graduates in the country inthe first content area (Natal), but only 50% ofgraduates in the second content area (Childhood). In the previous time period, that pattern wasreversed."
Prior to March 2000, percentile ranks were basedon program comparisons (rather than graduatecomparisons). For this reason, current resultsshould not be compared to Content DimensionReport results published prior to March 2000.
5.5.2 US12345678 000039 NRN039 11/02/15
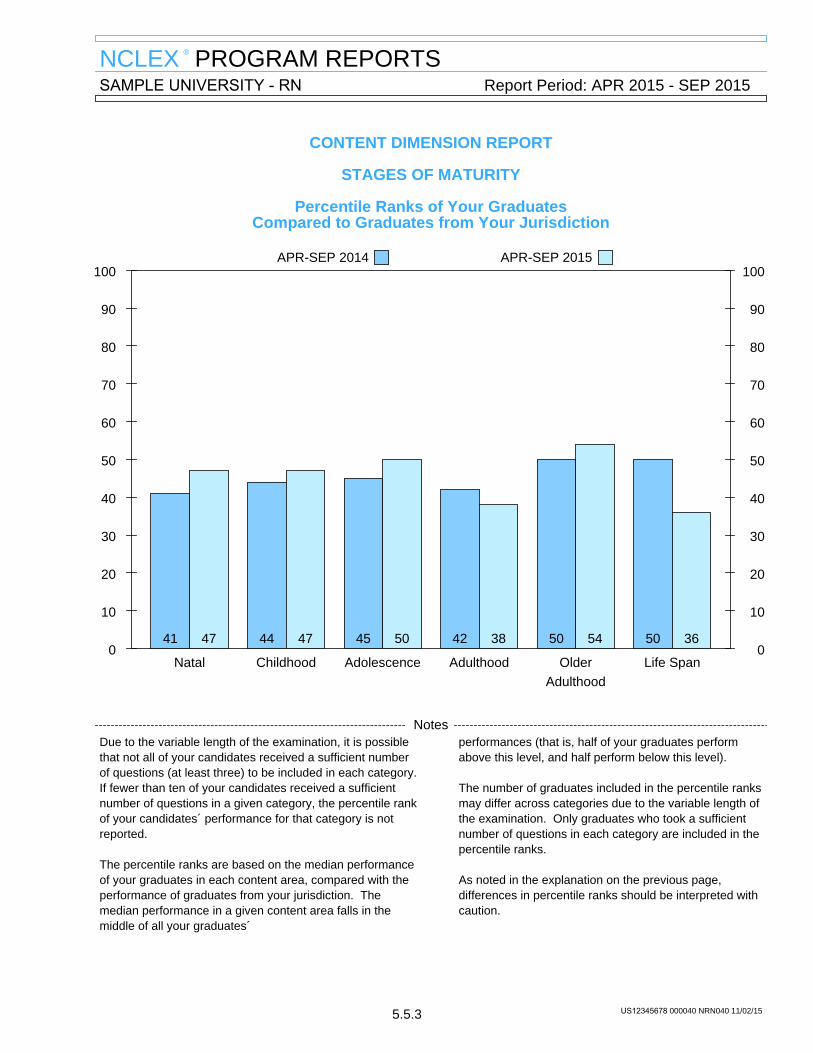
NCLEX ® PROGRAM REPORTSSAMPLE UNIVERSITY - RN Report Period: APR 2015 - SEP 2015
CONTENT DIMENSION REPORT
STAGES OF MATURITY
Percentile Ranks of Your GraduatesCompared to Graduates from Your Jurisdiction
APR-SEP 2014 APR-SEP 2015100 100
90 90
80 80
70 70
60 60
50 50
40 40
30 30
20 20
10 10
0 0Natal
41 47
Childhood
44 47
Adolescence
45 50
Adulthood
42 38
OlderAdulthood
50 54
Life Span
50 36
NotesDue to the variable length of the examination, it is possiblethat not all of your candidates received a sufficient numberof questions (at least three) to be included in each category.If fewer than ten of your candidates received a sufficientnumber of questions in a given category, the percentile rankof your candidates´ performance for that category is notreported.
The percentile ranks are based on the median performanceof your graduates in each content area, compared with theperformance of graduates from your jurisdiction. Themedian performance in a given content area falls in themiddle of all your graduates´
performances (that is, half of your graduates performabove this level, and half perform below this level).
The number of graduates included in the percentile ranksmay differ across categories due to the variable length ofthe examination. Only graduates who took a sufficientnumber of questions in each category are included in thepercentile ranks.
As noted in the explanation on the previous page,differences in percentile ranks should be interpreted withcaution.
5.5.3 US12345678 000040 NRN040 11/02/15
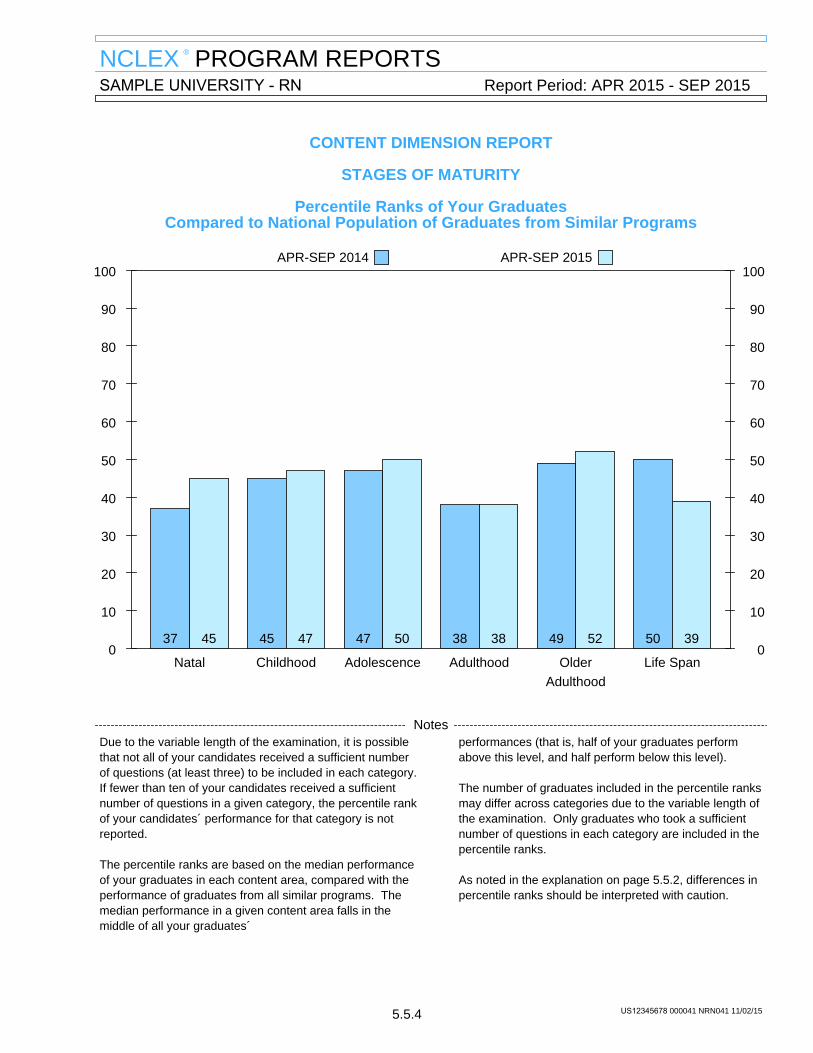
NCLEX ® PROGRAM REPORTSSAMPLE UNIVERSITY - RN Report Period: APR 2015 - SEP 2015
CONTENT DIMENSION REPORT
STAGES OF MATURITY
Percentile Ranks of Your GraduatesCompared to National Population of Graduates from Similar Programs
APR-SEP 2014 APR-SEP 2015100 100
90 90
80 80
70 70
60 60
50 50
40 40
30 30
20 20
10 10
0 0Natal
37 45
Childhood
45 47
Adolescence
47 50
Adulthood
38 38
OlderAdulthood
49 52
Life Span
50 39
NotesDue to the variable length of the examination, it is possiblethat not all of your candidates received a sufficient numberof questions (at least three) to be included in each category.If fewer than ten of your candidates received a sufficientnumber of questions in a given category, the percentile rankof your candidates´ performance for that category is notreported.
The percentile ranks are based on the median performanceof your graduates in each content area, compared with theperformance of graduates from all similar programs. Themedian performance in a given content area falls in themiddle of all your graduates´
performances (that is, half of your graduates performabove this level, and half perform below this level).
The number of graduates included in the percentile ranksmay differ across categories due to the variable length ofthe examination. Only graduates who took a sufficientnumber of questions in each category are included in thepercentile ranks.
As noted in the explanation on page 5.5.2, differences inpercentile ranks should be interpreted with caution.
5.5.4 US12345678 000041 NRN041 11/02/15
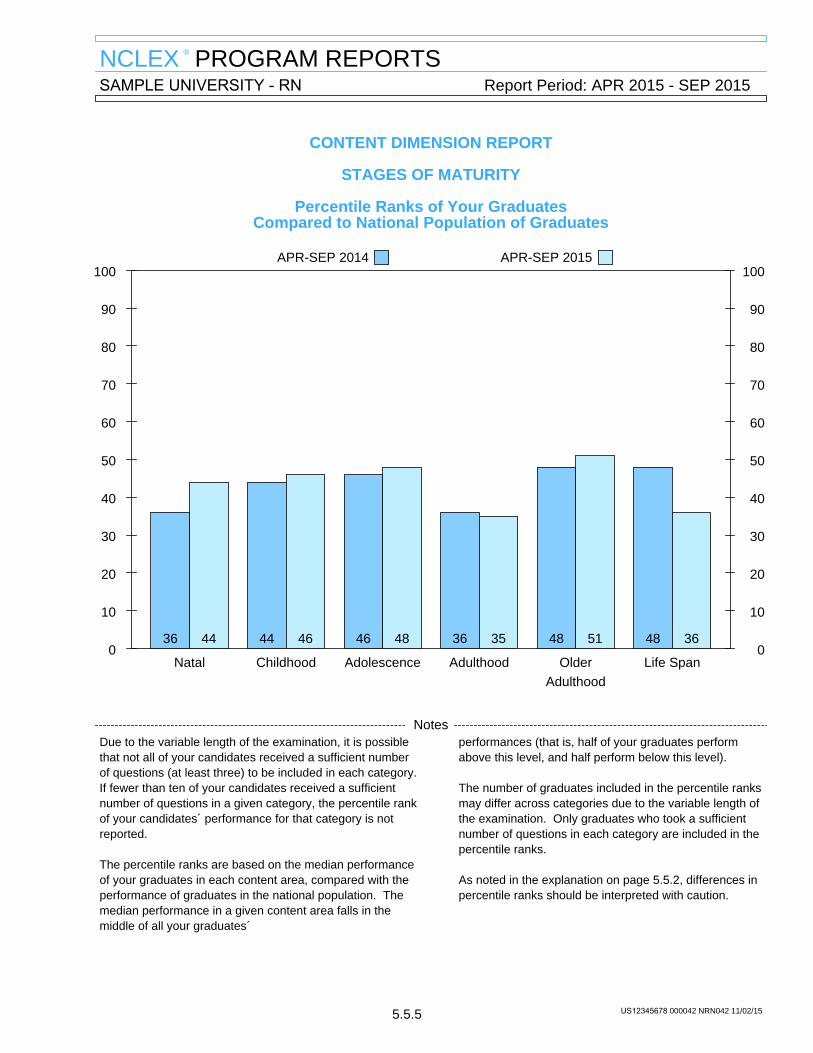
NCLEX ® PROGRAM REPORTSSAMPLE UNIVERSITY - RN Report Period: APR 2015 - SEP 2015
CONTENT DIMENSION REPORT
STAGES OF MATURITY
Percentile Ranks of Your GraduatesCompared to National Population of Graduates
APR-SEP 2014 APR-SEP 2015100 100
90 90
80 80
70 70
60 60
50 50
40 40
30 30
20 20
10 10
0 0Natal
36 44
Childhood
44 46
Adolescence
46 48
Adulthood
36 35
OlderAdulthood
48 51
Life Span
48 36
NotesDue to the variable length of the examination, it is possiblethat not all of your candidates received a sufficient numberof questions (at least three) to be included in each category.If fewer than ten of your candidates received a sufficientnumber of questions in a given category, the percentile rankof your candidates´ performance for that category is notreported.
The percentile ranks are based on the median performanceof your graduates in each content area, compared with theperformance of graduates in the national population. Themedian performance in a given content area falls in themiddle of all your graduates´
performances (that is, half of your graduates performabove this level, and half perform below this level).
The number of graduates included in the percentile ranksmay differ across categories due to the variable length ofthe examination. Only graduates who took a sufficientnumber of questions in each category are included in thepercentile ranks.
As noted in the explanation on page 5.5.2, differences inpercentile ranks should be interpreted with caution.
5.5.5 US12345678 000042 NRN042 11/02/15
NCLEX ® PROGRAM REPORTSCONTENT DIMENSION REPORTS
Nursing is a profession that promotes, maintains and restores health for individuals and their families. Nursesvalue a holistic approach to client care, utilizing frameworks to organize assessments, develop a plan of careand evaluate the provision of care. These systematic approaches to client care may employ functional healthpatterns, head-to-toe formats, or a body systems classification. Nursing education programs organize theircurricula in a pattern or framework to foster learning. Regardless of the framework utilized for nursing care ornursing education, its components are integrated to ensure that all clients´ physical and behavioral dimensionsare included.
The NCLEX® Content Dimension Reports in this section provide information about your graduates based on sixframeworks:
• Nursing Process• Categories of Human Functioning• Categories of Health Alterations• Wellness/Illness Continuum• Stages of Maturity• Stress, Adaptation, and Coping
The last set of the Content Dimension Reports is based on the Stress, Adaptation, and Coping Model.
STRESS, ADAPTATION, AND COPING
The stress, adaptation, and coping model accordingto Roy (1980) is the process of adjusting or modifyingbehavior using biopsychosocial mechanisms tomaintain personal integrity. The level of adaptation isdetermined by the effect of three classes of stimuli:(1) focal stimuli, or those changes that immediatelyconfront the client, (2) contextual stimuli, whichinclude all other measurable and observable stimulipresent that contribute to the situation, and (3)residual stimuli, beliefs, characteristics, and attitudesthe client had acquired in the past. Each client hashis/her own range of adaptation to stimuli in whichone responds with ordinary adaptive responses. When one is stimulated, the adaptation response canbe categorized according to four modes of adaptation:physiological needs, self-concept, role function, orinterdependence. The role of nursing is that ofpromoting adaptation in all four modes during healthand illness.
(1) Physiologic Needs: The physiologic mode is anadaptation response associated with variations inactivity and rest, elimination, endocrine function,fluid, electrolytes, neurological function, nutrition,oxygenation, senses, and skin integrity.
(2) Self-Concept: The self-concept mode is anadaptive response related to self-esteem,personality, identity, body image, depression,anxiety, fear, impaired adjustment, identityconfusion, powerlessness, noncompliance, roleperformance, hopelessness and trauma.
(3) Role Function: The role function model is anadaptive response that stems from the inabilityto perform behaviors related to parenting,family coping, work-related responsibilities or arole acquired as a receptor of the health caresystem.
(4) Interdependence: The interdependencemode reflects a reciprocal relationship thatinvolves giving and receiving between theadapting person and another person in theenvironment. This adaptive response isevident in grieving, social isolation, potential forviolence, impaired social interaction andspiritual distress.
5.6.1 US12345678 000043 NRN043 11/02/15

NCLEX ® PROGRAM REPORTSCONTENT DIMENSION REPORTS
Percentile Rank Charts of Content Dimension Performance
These charts show how well your program´s typicalgraduate (taking the NCLEX® examination for the firsttime during this reporting period) performed indifferent content dimensions and how that compareswith the performance of last year´s typical graduate and with graduates across the United States and itsterritories.
Instead of showing passing rates, as in the SummaryOverview section, these charts show how well agraduate at the median competence level from yourprogram performed in specific content areas. TheNCLEX examination measurement model allows thecalculation of performance on any subset of items byadjusting for their difficulty.
Three types of comparisons are possible from thesecharts: (1) how your program´s typical graduatecompares with the rest of the country, (2) how wellyour program´s typical graduate does in the contentareas (remember that the difficulty of the items hasalready been taken into account), and (3) how the tworeporting periods compare.
The numbers on the vertical axis of the charts arepercentile ranks, indicating the percentage of
graduates who performed less well than (or thesame as) your typical graduate. Differences inpercentile ranks must be interpreted with caution. A single percentile-point spread towards the middleof the scale represents less of a true (observedscore) difference than the same spread at theextremes (e.g., 50th and 51st are not as different as90th and 91st). These charts are most appropriatelyused to determine areas of general programstrength and weakness, and not to make precisecomparisons.
An example of a statement that might be madebased on data from these charts is, "In this timeperiod, my median (middle) graduate did as well orbetter than 75% of the graduates in the country inthe first content area (Physiologic Needs), but only50% of graduates in the second content area(Self-Concept). In the previous time period, thatpattern was reversed."
Prior to March 2000, percentile ranks were basedon program comparisons (rather than graduatecomparisons). For this reason, current resultsshould not be compared to Content DimensionReport results published prior to March 2000.
5.6.2 US12345678 000044 NRN044 11/02/15
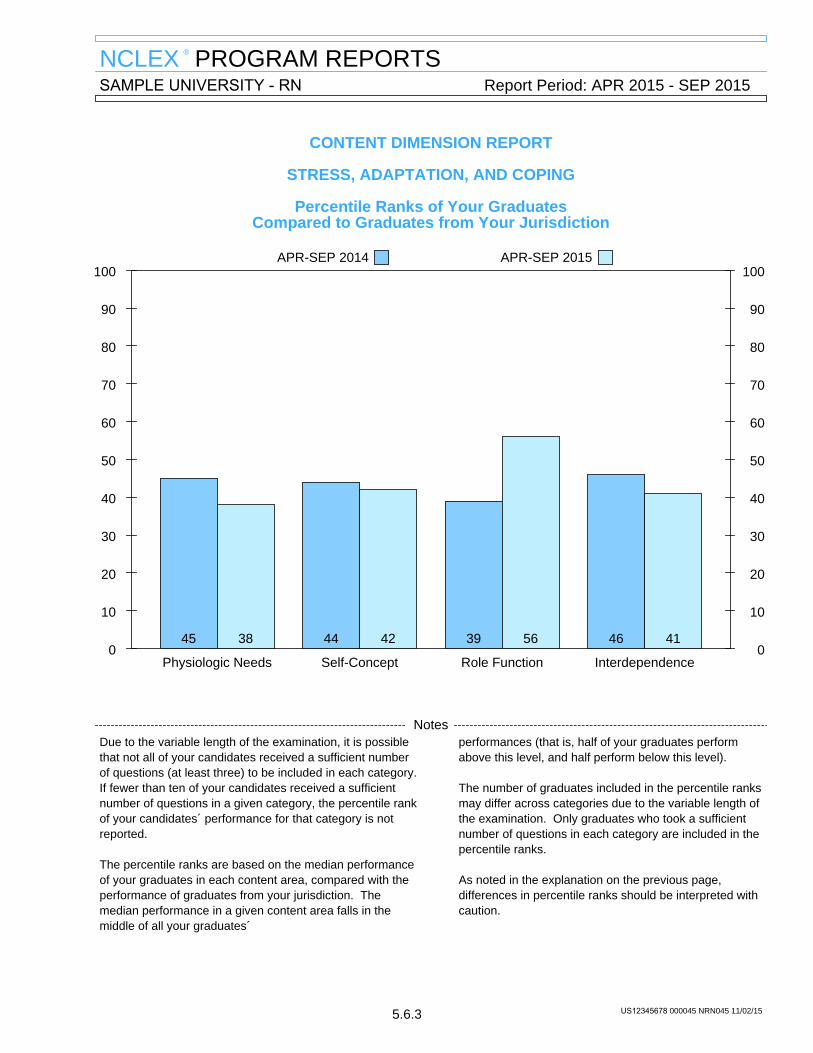
NCLEX ® PROGRAM REPORTSSAMPLE UNIVERSITY - RN Report Period: APR 2015 - SEP 2015
CONTENT DIMENSION REPORT
STRESS, ADAPTATION, AND COPING
Percentile Ranks of Your GraduatesCompared to Graduates from Your Jurisdiction
APR-SEP 2014 APR-SEP 2015100 100
90 90
80 80
70 70
60 60
50 50
40 40
30 30
20 20
10 10
0 0Physiologic Needs
45 38
Self-Concept
44 42
Role Function
39 56
Interdependence
46 41
NotesDue to the variable length of the examination, it is possiblethat not all of your candidates received a sufficient numberof questions (at least three) to be included in each category.If fewer than ten of your candidates received a sufficientnumber of questions in a given category, the percentile rankof your candidates´ performance for that category is notreported.
The percentile ranks are based on the median performanceof your graduates in each content area, compared with theperformance of graduates from your jurisdiction. Themedian performance in a given content area falls in themiddle of all your graduates´
performances (that is, half of your graduates performabove this level, and half perform below this level).
The number of graduates included in the percentile ranksmay differ across categories due to the variable length ofthe examination. Only graduates who took a sufficientnumber of questions in each category are included in thepercentile ranks.
As noted in the explanation on the previous page,differences in percentile ranks should be interpreted withcaution.
5.6.3 US12345678 000045 NRN045 11/02/15
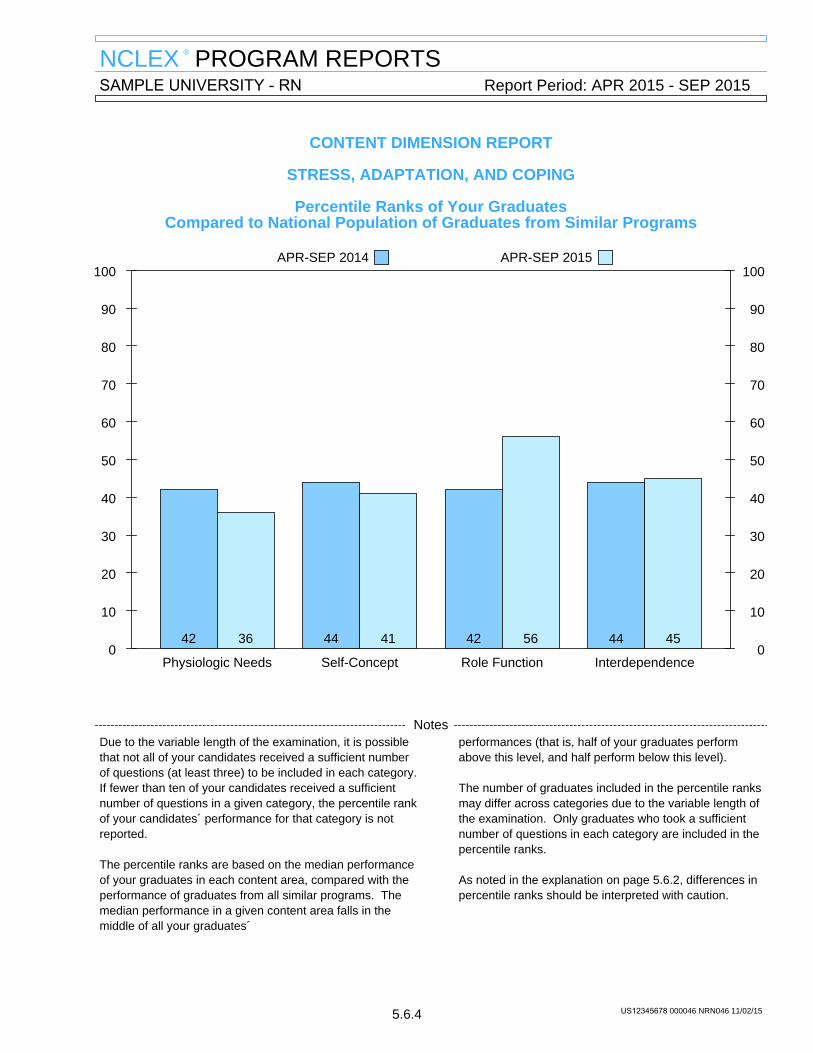
NCLEX ® PROGRAM REPORTSSAMPLE UNIVERSITY - RN Report Period: APR 2015 - SEP 2015
CONTENT DIMENSION REPORT
STRESS, ADAPTATION, AND COPING
Percentile Ranks of Your GraduatesCompared to National Population of Graduates from Similar Programs
APR-SEP 2014 APR-SEP 2015100 100
90 90
80 80
70 70
60 60
50 50
40 40
30 30
20 20
10 10
0 0Physiologic Needs
42 36
Self-Concept
44 41
Role Function
42 56
Interdependence
44 45
NotesDue to the variable length of the examination, it is possiblethat not all of your candidates received a sufficient numberof questions (at least three) to be included in each category.If fewer than ten of your candidates received a sufficientnumber of questions in a given category, the percentile rankof your candidates´ performance for that category is notreported.
The percentile ranks are based on the median performanceof your graduates in each content area, compared with theperformance of graduates from all similar programs. Themedian performance in a given content area falls in themiddle of all your graduates´
performances (that is, half of your graduates performabove this level, and half perform below this level).
The number of graduates included in the percentile ranksmay differ across categories due to the variable length ofthe examination. Only graduates who took a sufficientnumber of questions in each category are included in thepercentile ranks.
As noted in the explanation on page 5.6.2, differences inpercentile ranks should be interpreted with caution.
5.6.4 US12345678 000046 NRN046 11/02/15
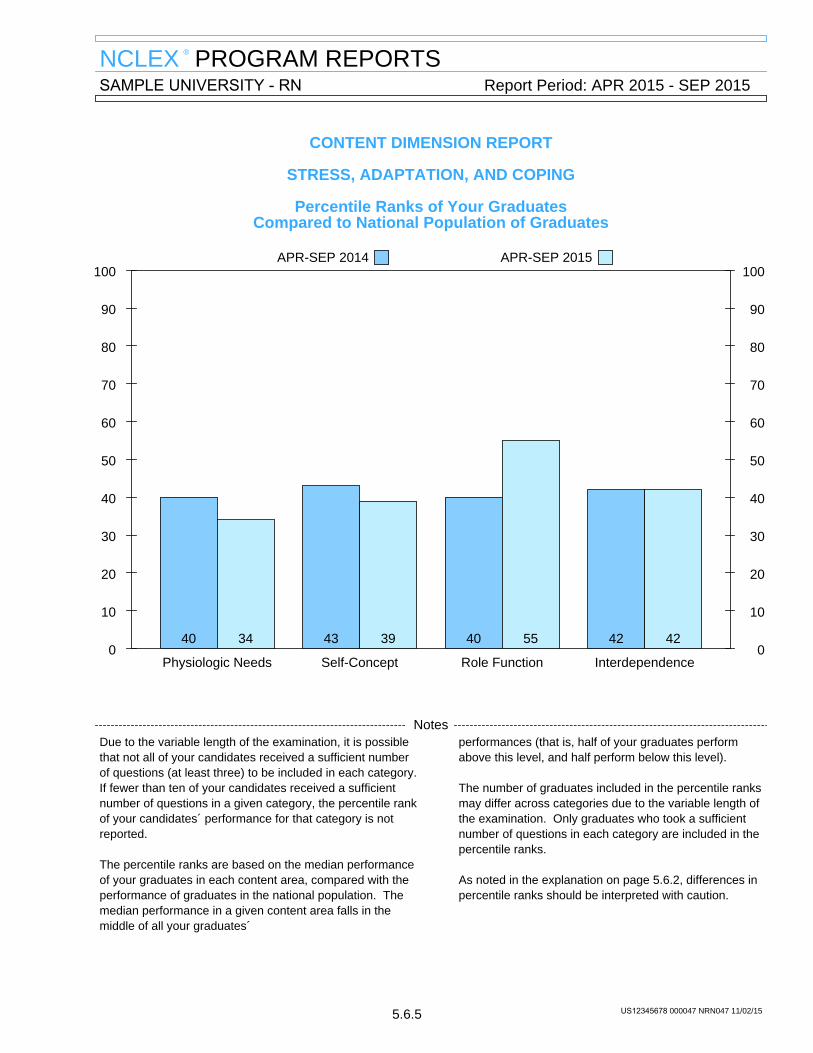
NCLEX ® PROGRAM REPORTSSAMPLE UNIVERSITY - RN Report Period: APR 2015 - SEP 2015
CONTENT DIMENSION REPORT
STRESS, ADAPTATION, AND COPING
Percentile Ranks of Your GraduatesCompared to National Population of Graduates
APR-SEP 2014 APR-SEP 2015100 100
90 90
80 80
70 70
60 60
50 50
40 40
30 30
20 20
10 10
0 0Physiologic Needs
40 34
Self-Concept
43 39
Role Function
40 55
Interdependence
42 42
NotesDue to the variable length of the examination, it is possiblethat not all of your candidates received a sufficient numberof questions (at least three) to be included in each category.If fewer than ten of your candidates received a sufficientnumber of questions in a given category, the percentile rankof your candidates´ performance for that category is notreported.
The percentile ranks are based on the median performanceof your graduates in each content area, compared with theperformance of graduates in the national population. Themedian performance in a given content area falls in themiddle of all your graduates´
performances (that is, half of your graduates performabove this level, and half perform below this level).
The number of graduates included in the percentile ranksmay differ across categories due to the variable length ofthe examination. Only graduates who took a sufficientnumber of questions in each category are included in thepercentile ranks.
As noted in the explanation on page 5.6.2, differences inpercentile ranks should be interpreted with caution.
5.6.5 US12345678 000047 NRN047 11/02/15
NCLEX ® PROGRAM REPORTSTEST DURATION/TEST PLAN PERFORMANCE REPORT
This section provides information about your graduates NCLEX-RN® examination testing experiences and abouttheir performance in each of the test plan content areas.
Test Duration Report
The Test Duration Report provides information aboutthe number of questions answered and the amount oftime spent on the NCLEX-RN examination by yourgraduates. The average number of questions taken,the average amount of time spent on the examinationand the percent taking the maximum and minimumnumber of questions are reported separately for thosewho passed and failed, as well as for the total group.
With CAT, the number of questions answeredprovides information about how close the candidatewas to the passing standard. In comparing yourprogram to other programs, it is useful to examine theaverage number of questions taken by yourgraduates who passed and who failed. For example,if the average number of questions taken by yourgraduates who passed was lower than the
comparison group, this suggests your graduateswere able to demonstrate their competence morequickly than were graduates in the comparisongroups. Similarly, if you have a higher percentageof your passing graduates take the minimumnumber of questions, then your passing graduatesdemonstrated their competence more quickly.
The proportion answering the maximum number ofquestions reflects the proportion that is close to thepassing standard. A high proportion of failingcandidates answering the maximum number ofquestions shows that most who failed were close topassing, and conversely, a high proportion ofpassing candidates answering the maximumnumber of questions shows that most of thepassers did not pass by a large margin.
Glossary
AVERAGE NUMBER OF QUESTIONS TAKEN The reported results include 15 pretest items.
MINIMUM NUMBER OF QUESTIONS The minimum number of items is 75 (which includes 15pretest items). Only candidates taking the minimumpossible number of questions are included in theresults.
MAXIMUM NUMBER OF QUESTIONS The maximum number of items is 265 (which includes15 pretest items).
AVERAGE TEST TIME The maximum testing time is 360 minutes (six hours). Candidates testing under extended timing conditionsare excluded from the results.
6.1 US12345678 000048 NRN048 11/02/15
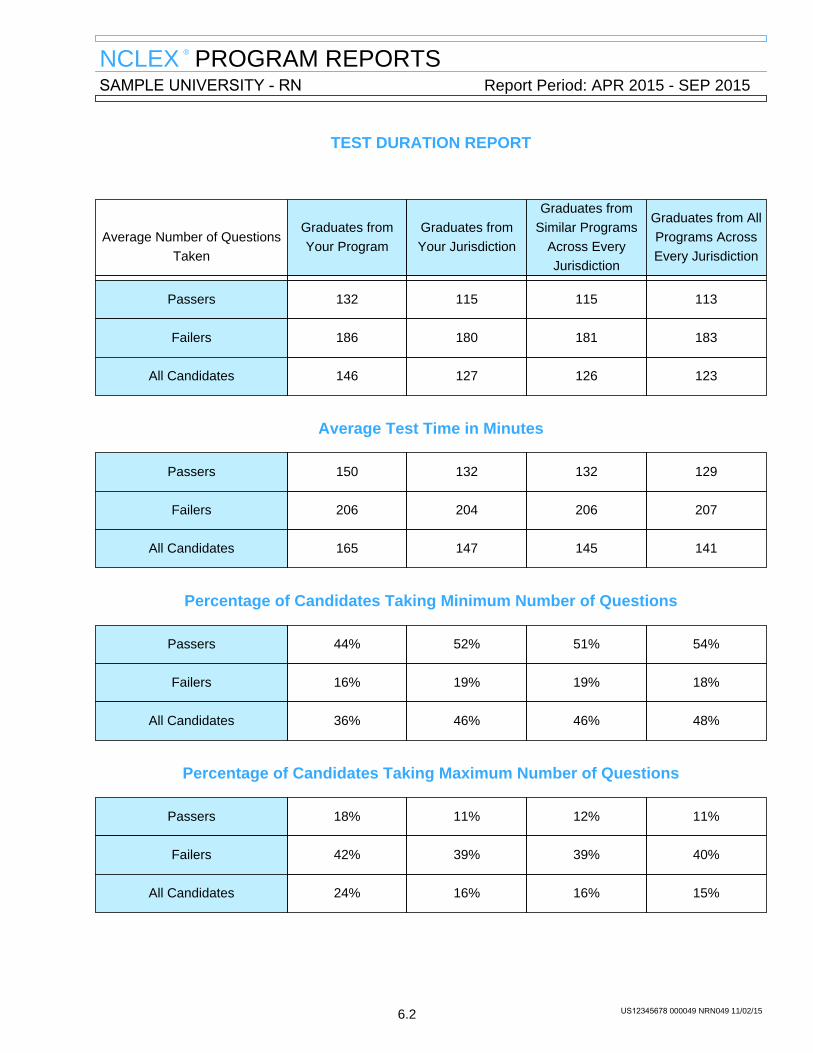
NCLEX ® PROGRAM REPORTSSAMPLE UNIVERSITY - RN Report Period: APR 2015 - SEP 2015
TEST DURATION REPORT
Average Number of QuestionsTaken
Graduates fromYour Program
Graduates fromYour Jurisdiction
Graduates fromSimilar Programs
Across EveryJurisdiction
Graduates from AllPrograms AcrossEvery Jurisdiction
Passers 132 115 115 113
Failers 186 180 181 183
All Candidates 146 127 126 123
Average Test Time in Minutes
Passers 150 132 132 129
Failers 206 204 206 207
All Candidates 165 147 145 141
Percentage of Candidates Taking Minimum Number of Questions
Passers 44% 52% 51% 54%
Failers 16% 19% 19% 18%
All Candidates 36% 46% 46% 48%
Percentage of Candidates Taking Maximum Number of Questions
Passers 18% 11% 12% 11%
Failers 42% 39% 39% 40%
All Candidates 24% 16% 16% 15%
6.2 US12345678 000049 NRN049 11/02/15
NCLEX ® PROGRAM REPORTSTEST DURATION/TEST PLAN PERFORMANCE REPORT
Test Plan Performance Report
The Test Plan Performance Report providesinformation on the performance of your mediangraduate in each area of the NCLEX-RN® Test Plan.Performance is reported as the expected percentageof all possible questions that could beadministered in a given category that would beanswered correctly by a graduate at this performancelevel. The measurement model enables this estimateof expected percentages on a very large common setof questions, even though each graduate took only amuch smaller, unique set of questions. Therefore,these are NOT the actual percentages of questionsanswered correctly.
Test plan performance is based on the median abilityscore for your program´s graduates. Therefore,expected percentage correct will be reported only forprograms with at least ten candidates testing for thefirst time during this reporting period. Likewise, testplan performance will not be reported for jurisdictionswith fewer than ten candidates testing for the first timeduring this reporting period.
Passing performance can be interpreted as thepercentage of all possible questions that acandidate with an ability precisely at the passingstandard would be able to answer correctly. Thispercentage varies across the content areasbecause the questions within these areas differ inaverage difficulty. For the content areas wherequestions are easier, passing performancecorresponds to a higher percentage of correctanswers. Similarly, for the content areas wherequestions are more difficult, passing performancecorresponds to a lower percentage of correctanswers.
Comparisons of your graduates´ medianperformance with the passing performance levelsmay help you identify strengths and weaknesses inyour instructional program.
Glossary
EXPECTED PERCENTAGE CORRECT Derived from your typical graduate´s ability score,expected percentage correct is an estimation ofperformance. This is not the actual percentage ofquestions answered correctly.
PASSING PERFORMANCE The expected percentage correct for a test plan areathat would be achieved by a candidate with acompetence level precisely at the passing standard.
TEST PLAN PERFORMANCE Reported as the expected percentage of all possiblequestions that could be administered in each of ClientNeeds subcategories that would be answered correctlyby your typical graduate.
6.3 US12345678 000050 NRN050 11/02/15
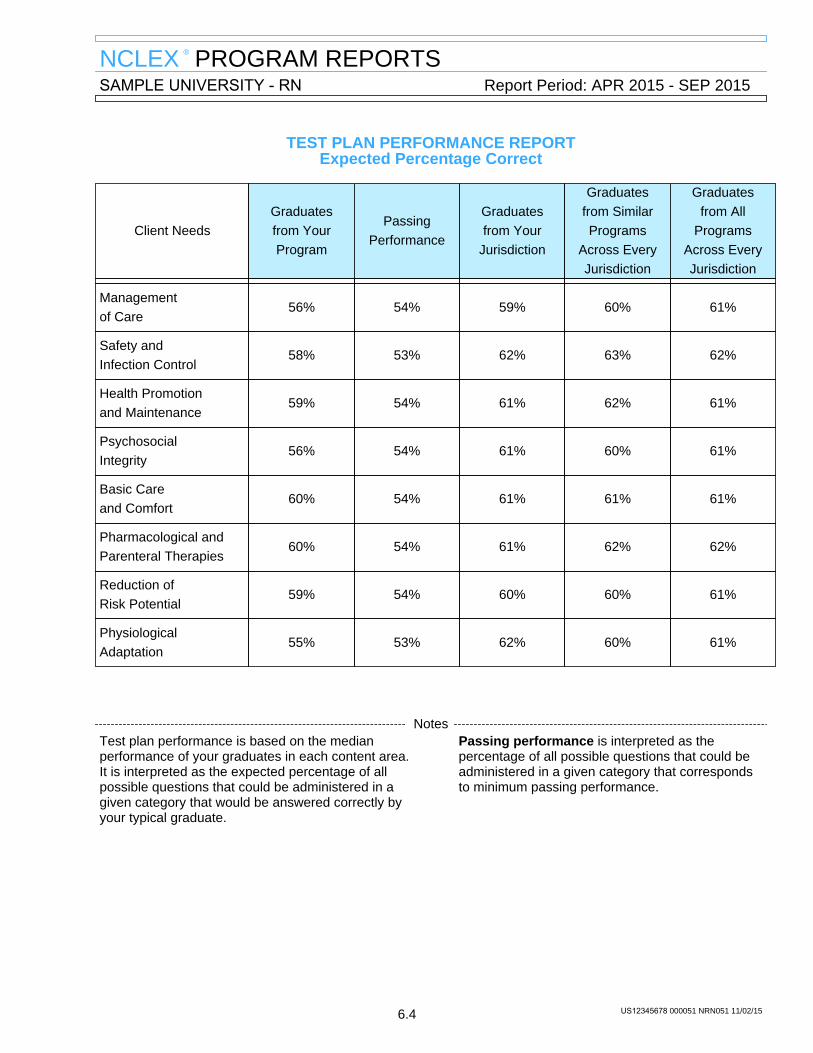
NCLEX ® PROGRAM REPORTSSAMPLE UNIVERSITY - RN Report Period: APR 2015 - SEP 2015
TEST PLAN PERFORMANCE REPORTExpected Percentage Correct
Client NeedsGraduatesfrom YourProgram
PassingPerformance
Graduatesfrom Your
Jurisdiction
Graduatesfrom SimilarPrograms
Across EveryJurisdiction
Graduatesfrom All
ProgramsAcross EveryJurisdiction
Managementof Care
56% 54% 59% 60% 61%
Safety andInfection Control
58% 53% 62% 63% 62%
Health Promotionand Maintenance
59% 54% 61% 62% 61%
PsychosocialIntegrity
56% 54% 61% 60% 61%
Basic Careand Comfort
60% 54% 61% 61% 61%
Pharmacological andParenteral Therapies
60% 54% 61% 62% 62%
Reduction ofRisk Potential
59% 54% 60% 60% 61%
PhysiologicalAdaptation
55% 53% 62% 60% 61%
NotesTest plan performance is based on the medianperformance of your graduates in each content area.It is interpreted as the expected percentage of allpossible questions that could be administered in agiven category that would be answered correctly byyour typical graduate.
Passing performance is interpreted as thepercentage of all possible questions that could beadministered in a given category that correspondsto minimum passing performance.
6.4 US12345678 000051 NRN051 11/02/15
NCLEX ® PROGRAM REPORTSREFERENCES
National Council of State Boards of Nursing, Inc. (2013). Detailed Test Plan for the National Council LicensureExamination for Registered Nurses. Chicago: Author.
National Council of State Boards of Nursing, Inc. (2013). Test Plan for the National Council LicensureExamination for Registered Nurses. Chicago: Author.
Roy, C. (1980). The Roy Adaptation Model. In Riehl, J. & Roy, C. (Eds.). Conceptual Models for nursingpractice. (2nd ed., pp. 179-188). New York: Appleton-Century-Crofts.
National Council of State Boards of Nursing, Inc. (2012). 2011 RN Practice Analysis: Linking the NCLEX-RN®
Examination to Practice. Chicago: Author.
7.1 US12345678 000052 NRN052 11/02/15