NCHRP Report 350 Evaluation of the Nebraska Thrie-Beam ...
64
NCHRP Report 350 Evaluation of the Nebraska Thrie-Beam Transition SPR-PL-l(34) P500 Brian O. Pfeifer, Ph.D., P.E. Research Associate Engineer Ronald K. Faller, Ph.D., P.E. Research Associate Engineer John D. Reid, Ph.D. Assistant Professor Midwest Roadside Safety Facility University of Nebraska-Lincoln W328.l Nebraska Hall Lincoln, Nebraska 68588-0529 (402) 472-9198 Submitted to Nebraska Department of Roads 1500 Nebraska Highway 2 Lincoln, Nebraska 68502 Research Report No. TRP-03-70-98 May 1998
Transcript of NCHRP Report 350 Evaluation of the Nebraska Thrie-Beam ...
NCHRP Report 350 Evaluation of the Nebraska Thrie-Beam Transition
SPR-PL-l(34) P500
Brian O. Pfeifer, Ph.D., P.E. Research Associate Engineer
Ronald K. Faller, Ph.D. , P.E. Research Associate Engineer
John D. Reid, Ph.D. Assistant Professor
Midwest Roadside Safety Facility University of Nebraska-Lincoln
W328.l Nebraska Hall Lincoln, Nebraska 68588-0529
(402) 472-9198
Submitted to
Nebraska Department of Roads 1500 Nebraska Highway 2 Lincoln, Nebraska 68502
Research Report No. TRP-03-70-98
May 1998

Technical Report Documentation Page
1. Report No. 2. 3. Recipient’s Accession No.
SPR-PL-1(34) P5004. Title and Subtitle 5. Report Date
NCHRP Report 350 Evaluation of the Nebraska Thrie-BeamTransition
May 1998
6.
7. Author(s) 8. Performing Organization Report No.
Brian G. Pfeifer, Ronald K. Faller, and John D. Reid TRP-03-70-98
9. Performing Organization Name and Address 10. Project/Task/Work Unit No.
Midwest Roadside Safety Facility (MwRSF)University of Nebraska - LincolnW328.1 Nebraska HallLincoln, NE 68588-0529
11. Contract © or Grant (G) No.
SPR-PL-1(34) P500
12. Sponsoring Organization Name and Address 13. Type of Report and Period Covered
Nebraska Department of Roads1500 Nebraska Highway 2Lincoln, Nebraska 68502
Final Report 1998
14. Sponsoring Agency Code
15. Supplementary Notes
Prepared in cooperation with the U.S. Department of Transportation, Federal Highway Administration.
16. Abstract (Limit: 200 words)
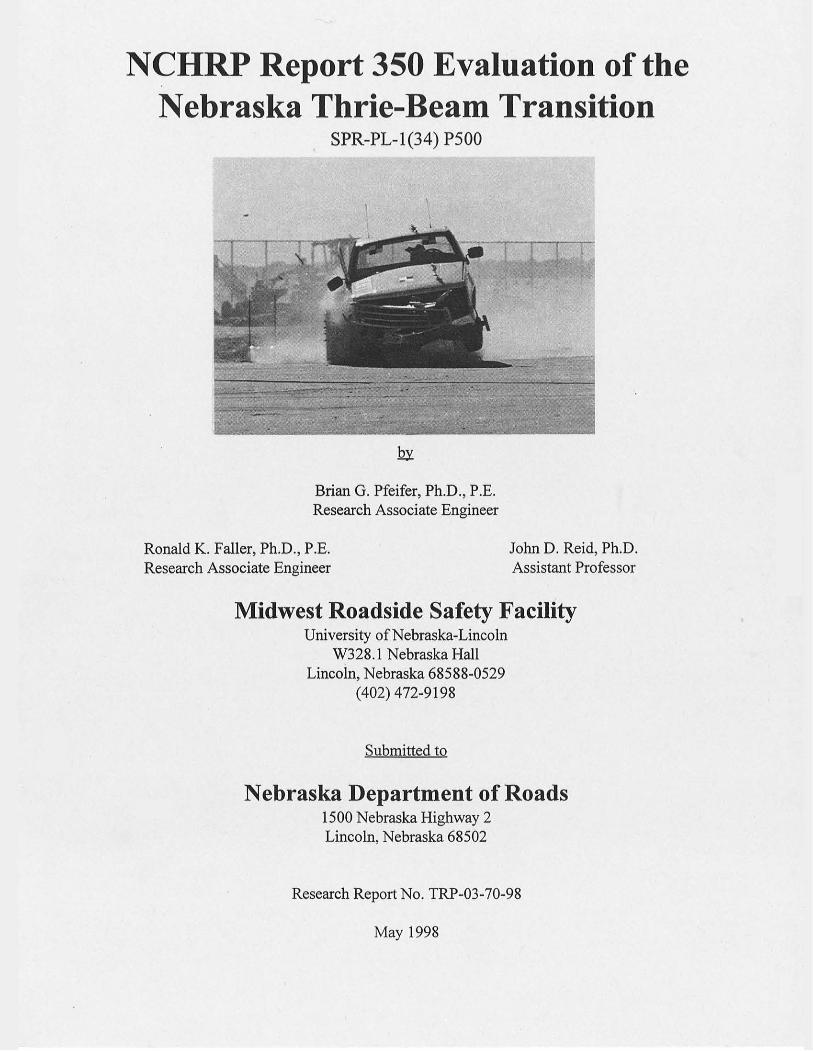
This project was initiated to develop a thrie-beam transition to a concrete bridge rail which is capable ofpassing the criteria set forth in NCHRP Report 350. The system currently used by the Nebraska Department ofRoads was redesigned with the help of the BARRIER VII computer program. This redesigned system wassubjected to one test with a 2000-kg pickup impacting the system at 100 km/h and 25 degrees. The vehicle wasredirected in a stable and controlled manner, but considerable occupant compartment damage occurred duringthe impact, resulting in failure of the test.
17. Document Analysis/Descriptors 18. Availability Statement
Highway Safety, Guardrail,Longitudinal Barrier,Approach Guardrail,
Roadside Appurtenances,Crash Tests, ComplianceTests, Guardrail Transition
No restrictions. Document available from: National Technical Information Services,Springfield, Virginia 22161
19. Security Class (this report) 20. Security Class (this page) 21. No. of Pages 22. Price
Unclassified Unclassified 56

i
DISCLAIMER STATEMENT
The contents of this report reflect the views of the authors who are responsible for the facts and
the accuracy of the data presented herein. The contents do not necessarily reflect the official views or
policies of the Nebraska Department of Roads nor the Federal Highway Administration. This report does
not constitute a standard, specification, or regulation.
ii
ACKNOWLEDGEMENTS
The authors wish to acknowledge the Nebraska Department of Roads for funding the research
described herein. A special thanks is given to the following individuals who made a contribution to the
completion of this research project.
Nebraska Department of Roads
Leona Kolbet, Research CoordinatorPhil Tenhulzen, Design Standards EngineerMark Osborn, EngineerBruce Thill, Policy and Standards EngineerMark Burnham, Physical Test EngineerStan Karel, Engineering Unit Supervisor
Federal Highway Administration
Milo Cress, P.E., Nebraska Division Office
Midwest Roadside Safety Facility
Dean L. Sicking, Ph.D., P.E., Director John R. Rohde, Ph.D., P.E., Associate ProfessorJames C. Holloway, Research Associate EngineerKenneth L. Krenk, Field Operations ManagerMichael L. Hanau, Laboratory Mechanic IEric A. Keller, Computer Technician IIUndergraduate and Graduate Assistants
Dunlap Photography
James Dunlap, Owner

iii
TABLE OF CONTENTS Page
DISCLAIMER STATEMENT . . . . . . . . . . . . . . . . . . . . . . . . . . . . . . . . . . . . . . . . . . . . . . . . . . . . i
ACKNOWLEDGEMENTS . . . . . . . . . . . . . . . . . . . . . . . . . . . . . . . . . . . . . . . . . . . . . . . . . . . . . . ii
LIST OF FIGURES . . . . . . . . . . . . . . . . . . . . . . . . . . . . . . . . . . . . . . . . . . . . . . . . . . . . . . . . . . . . v
LIST OF TABLES . . . . . . . . . . . . . . . . . . . . . . . . . . . . . . . . . . . . . . . . . . . . . . . . . . . . . . . . . . . . vi
1 INTRODUCTION . . . . . . . . . . . . . . . . . . . . . . . . . . . . . . . . . . . . . . . . . . . . . . . . . . . . . . . . . . . 11.1 Objective . . . . . . . . . . . . . . . . . . . . . . . . . . . . . . . . . . . . . . . . . . . . . . . . . . . . . . . . . . . 21.2 Scope . . . . . . . . . . . . . . . . . . . . . . . . . . . . . . . . . . . . . . . . . . . . . . . . . . . . . . . . . . . . . . 2
2 DESIGN DETAILS . . . . . . . . . . . . . . . . . . . . . . . . . . . . . . . . . . . . . . . . . . . . . . . . . . . . . . . . . . . 3
3 COMPUTER SIMULATION . . . . . . . . . . . . . . . . . . . . . . . . . . . . . . . . . . . . . . . . . . . . . . . . . . . 83.1 Introduction . . . . . . . . . . . . . . . . . . . . . . . . . . . . . . . . . . . . . . . . . . . . . . . . . . . . . . . . . 83.2 Design Alternatives . . . . . . . . . . . . . . . . . . . . . . . . . . . . . . . . . . . . . . . . . . . . . . . . . . . . 93.3 Results . . . . . . . . . . . . . . . . . . . . . . . . . . . . . . . . . . . . . . . . . . . . . . . . . . . . . . . . . . . . . 9
4 TEST CONDITIONS . . . . . . . . . . . . . . . . . . . . . . . . . . . . . . . . . . . . . . . . . . . . . . . . . . . . . . . . 114.1 Test Facility . . . . . . . . . . . . . . . . . . . . . . . . . . . . . . . . . . . . . . . . . . . . . . . . . . . . . . . . 11
4.1.1 Test Site . . . . . . . . . . . . . . . . . . . . . . . . . . . . . . . . . . . . . . . . . . . . . . . . . . . 114.1.2 Vehicle Guidance System . . . . . . . . . . . . . . . . . . . . . . . . . . . . . . . . . . . . . . . 11
4.2 Test Vehicle . . . . . . . . . . . . . . . . . . . . . . . . . . . . . . . . . . . . . . . . . . . . . . . . . . . . . . . . 114.3 Data Acquisition Systems . . . . . . . . . . . . . . . . . . . . . . . . . . . . . . . . . . . . . . . . . . . . . . 14
4.3.1 Accelerometers . . . . . . . . . . . . . . . . . . . . . . . . . . . . . . . . . . . . . . . . . . . . . . 144.3.2 High Speed Photography . . . . . . . . . . . . . . . . . . . . . . . . . . . . . . . . . . . . . . . 144.3.3 Speed Trap Switches . . . . . . . . . . . . . . . . . . . . . . . . . . . . . . . . . . . . . . . . . . 154.3.4 Strain Gauges . . . . . . . . . . . . . . . . . . . . . . . . . . . . . . . . . . . . . . . . . . . . . . . . 15
5 PERFORMANCE EVALUATION CRITERIA . . . . . . . . . . . . . . . . . . . . . . . . . . . . . . . . . . . . 17
6 TEST RESULTS . . . . . . . . . . . . . . . . . . . . . . . . . . . . . . . . . . . . . . . . . . . . . . . . . . . . . . . . . . . . 196.1 Test NEBT-1 (2000P, 100 km/h, 25 degrees) . . . . . . . . . . . . . . . . . . . . . . . . . . . . . . . 19
7 STRAIN GAUGE RESULTS . . . . . . . . . . . . . . . . . . . . . . . . . . . . . . . . . . . . . . . . . . . . . . . . . . . 30
8 DISCUSSION . . . . . . . . . . . . . . . . . . . . . . . . . . . . . . . . . . . . . . . . . . . . . . . . . . . . . . . . . . . . . 31

iv
9 RECOMMENDATIONS . . . . . . . . . . . . . . . . . . . . . . . . . . . . . . . . . . . . . . . . . . . . . . . . . . . . . 33
10 CONCLUSIONS . . . . . . . . . . . . . . . . . . . . . . . . . . . . . . . . . . . . . . . . . . . . . . . . . . . . . . . . . . 34
11 REFERENCES . . . . . . . . . . . . . . . . . . . . . . . . . . . . . . . . . . . . . . . . . . . . . . . . . . . . . . . . . . . . 35
12 APPENDICES . . . . . . . . . . . . . . . . . . . . . . . . . . . . . . . . . . . . . . . . . . . . . . . . . . . . . . . . . . . . 36APPENDIX A: Nebraska Transition Design Details . . . . . . . . . . . . . . . . . . . . . . . . . . . . . . 37APPENDIX B: BARRIER VII Simulation Input . . . . . . . . . . . . . . . . . . . . . . . . . . . . . . . . 49APPENDIX C: Accelerometer Data Analysis - Test NEBT-1 . . . . . . . . . . . . . . . . . . . . . . 52
v
LIST OF FIGURES
PageFigure 1. Original Nebraska Transition Design . . . . . . . . . . . . . . . . . . . . . . . . . . . . . . . . . . . . . . . . . 5Figure 2. Redesigned Nebraska Transition . . . . . . . . . . . . . . . . . . . . . . . . . . . . . . . . . . . . . . . . . . . . 7Figure 3. Test Vehicle, Test NEBT-1 . . . . . . . . . . . . . . . . . . . . . . . . . . . . . . . . . . . . . . . . . . . . . . 12Figure 4. Test Vehicle Dimensions, Test NEBT-1 . . . . . . . . . . . . . . . . . . . . . . . . . . . . . . . . . . . . . 13Figure 5. Summary of Test NEBT-1. . . . . . . . . . . . . . . . . . . . . . . . . . . . . . . . . . . . . . . . . . . . . . . . 22Figure 6. Downstream Sequential Photographs, Test NEBT-1. . . . . . . . . . . . . . . . . . . . . . . . . . . . 23Figure 7. Close-up Sequential Photographs, Test NEBT-1. . . . . . . . . . . . . . . . . . . . . . . . . . . . . . . 24Figure 8. Vehicle Trajectory, Test NEBT-1. . . . . . . . . . . . . . . . . . . . . . . . . . . . . . . . . . . . . . . . . . 25Figure 9. System Damage, Test NEBT-1. . . . . . . . . . . . . . . . . . . . . . . . . . . . . . . . . . . . . . . . . . . . 26Figure 10. Vehicle Damage, Test NEBT-1. . . . . . . . . . . . . . . . . . . . . . . . . . . . . . . . . . . . . . . . . . 28

vi
LIST OF TABLES
PageTable 1. Relevant NCHRP 350 Evaluation Criteria . . . . . . . . . . . . . . . . . . . . . . . . . . . . . . . . . . . . . 18Table 2. Strain Gauge Instrumentation Results . . . . . . . . . . . . . . . . . . . . . . . . . . . . . . . . . . . . . . . . 30
1
1 INTRODUCTION
Guardrails are intended to protect the traveling public from hazardous obstacles, both natural and
man made, which are located within the clearzone of a roadway. These are usually flexible systems which
are designed to deflect during the redirection of an impacting vehicle. Bridge rails serve a similar purpose,
as they prevent errant vehicles from proceeding over the edge of a bridge, and in the case of overpasses,
they protect the traffic and pedestrians below the bridge as well. Bridge rails are normally much more rigid
than guardrails, as there is little room for deflection on the edge of a bridge. The difference in stiffness
between these systems leads to a potentially dangerous situation when an approach guardrail is transitioned
to a rigid bridge rail.
If the approach guardrail is too flexible, vehicles impacting in this transition area will “pocket” and
impact the end of the bridge rail. This type of accident results in very high deceleration rates and
considerable deformation of the occupant compartment, as well as very serious injury or death to the
occupants. In order to avoid this behavior, it is necessary to gradually stiffen the approach guardrail so that
large deflections do not occur near the end of the bridge rail.
There has been a significant amount of research conducted in this area, with the majority of the
work being concentrated on designing systems which meet the performance requirements of NCHRP
Report 230 (1). This criteria has been in effect since 1981, and requires that the system pass a full-scale
vehicle crash test consisting of a 4500-lb sedan impacting at 60 mph and 25 degrees. The impact location
for this test is specified to be 15 ft upstream of the bridge rail end. A large number of guardrail to bridge
rail transitions have been tested and approved under this criteria, and have been installed throughout the
country. In 1993, a new set of criteria was introduced to the highway safety community in NCHRP Report
2
350 (2). This criteria reflected the recent increase in the popularity of light trucks and sport utility vehicles
by replacing the 4500-lb sedan, previously used as a test vehicle, with a ¾-ton pickup truck. The impact
conditions for this test are similar, 100 km/hr (62.2 mph) and 25 degrees, but the impact point is now
determined based on the predicted worst case for the system. This is referred to as the critical impact point
(CIP) and is described later in this report in more detail.
The introduction of the ¾-ton pickup as a test vehicle has presented a number of challenges to
designers of roadside appurtenances. The higher center of gravity and bumper height of this vehicle results
in a less stable impact response, often resulting in the vehicle ramping over the system or rolling over after
the initial impact. The structural design of the pickup is such that significantly more occupant compartment
deformation is present after a redirectional test, as compared to a similar test with a full-size sedan.
1.1 Objective
The objective of this research project was to redesign the guardrail to bridge rail transition used
by the Nebraska Department of Roads so that it is capable of passing the criteria required by NCHRP
Report 350 (2).
1.2 Scope
The scope of this project included the analysis and simulation of the current guardrail to bridge rail
transition, and the subsequent redesign of the system to meet the criteria set forth in NCHRP Report 350
(2). The redesigned system was then evaluated with a full-scale vehicle crash test consisting of a 2000-kg
pickup impacting the transition at 100 km/h and 25 degrees.
3
2 DESIGN DETAILS
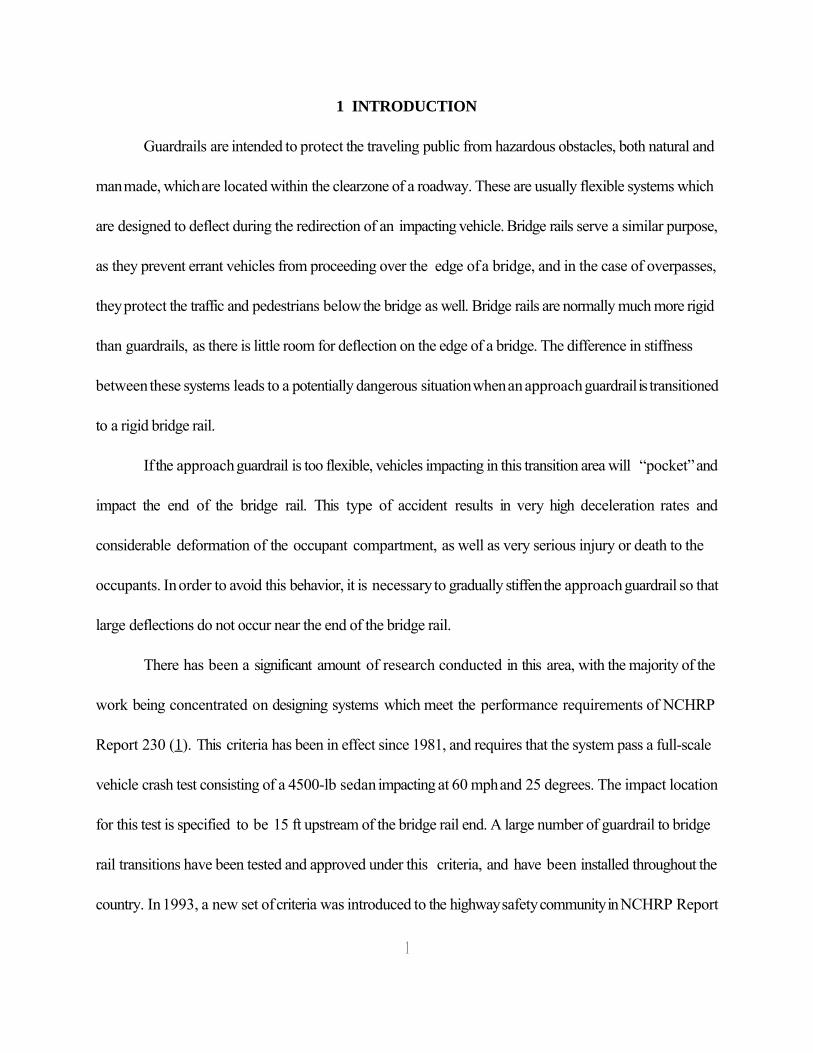
The design details of the original Nebraska Thrie-Beam Transition, which was successfully tested
to NCHRP Report 230 criteria in 1987 ( 3), is shown in Figure 1. This design has been very popular
because it allows what would normally be the first post in the transition (with 3 ft - 1½ in. spacing) to be
omitted from the system. This is often necessary due to obstructions caused by the bridge substructure
being located in this area. The obvious problem with this type of design is that the missing post allows
additional deflection at a critical point and introduces the possibility of snagging on the end of the bridge
rail. This problem is countered by nesting the thrie-beam in this area and incorporating a flare into the end
of the concrete parapet to reduce the potential for snagging. The size of the posts in the transition area are
also increased, in an effort to minimize the deflection during an impact.
Although this design was capable of passing the NCHRP Report 230 testing with the full-size
sedan, a new array of variables is introduced with the pickup testing required by NCHRP Report 350, as
discussed in the introduction. The most critical of these differences being the higher center of gravity and
the difference in vehicle structure which typically allows more occupant compartment deformation for a
given redirectional impact. With these design challenges in mind, the transition system was redesigned with
the goal of producing a system which could pass the criteria required by NCHRP Report 350. The details
of the BARRIER VII (4) computer modeling effort, which was key to the redesign procedure, are
presented in the next section.
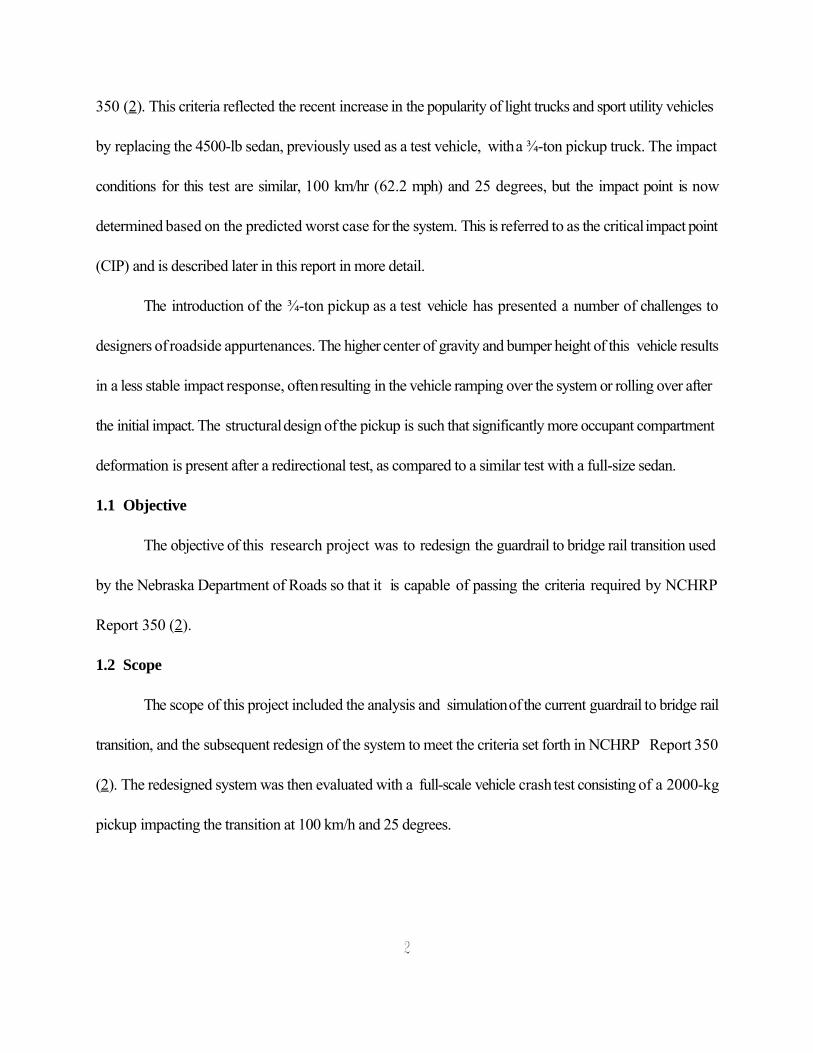
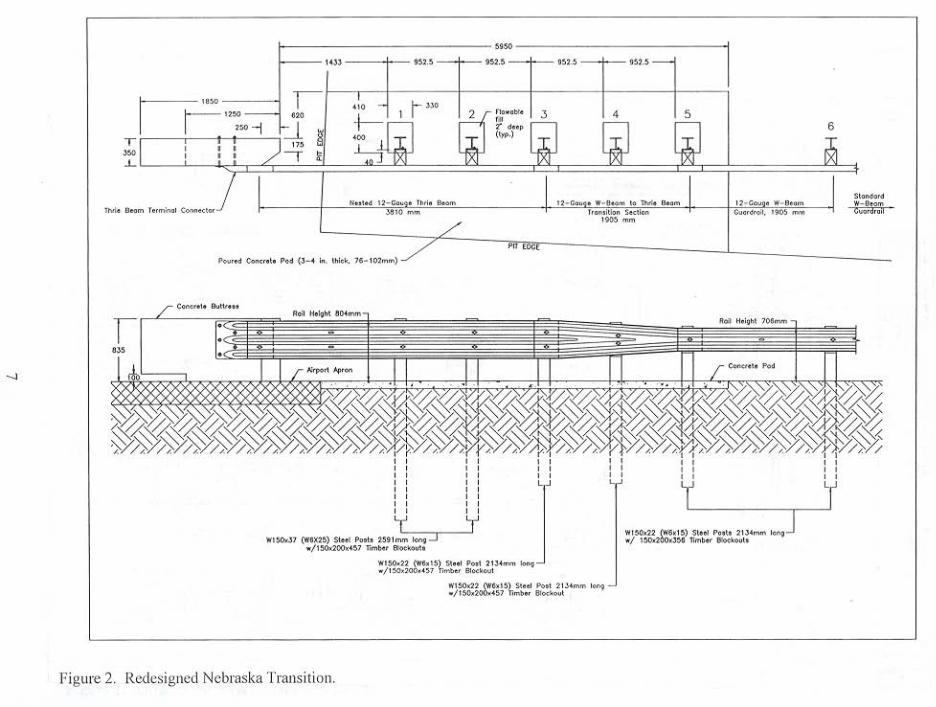
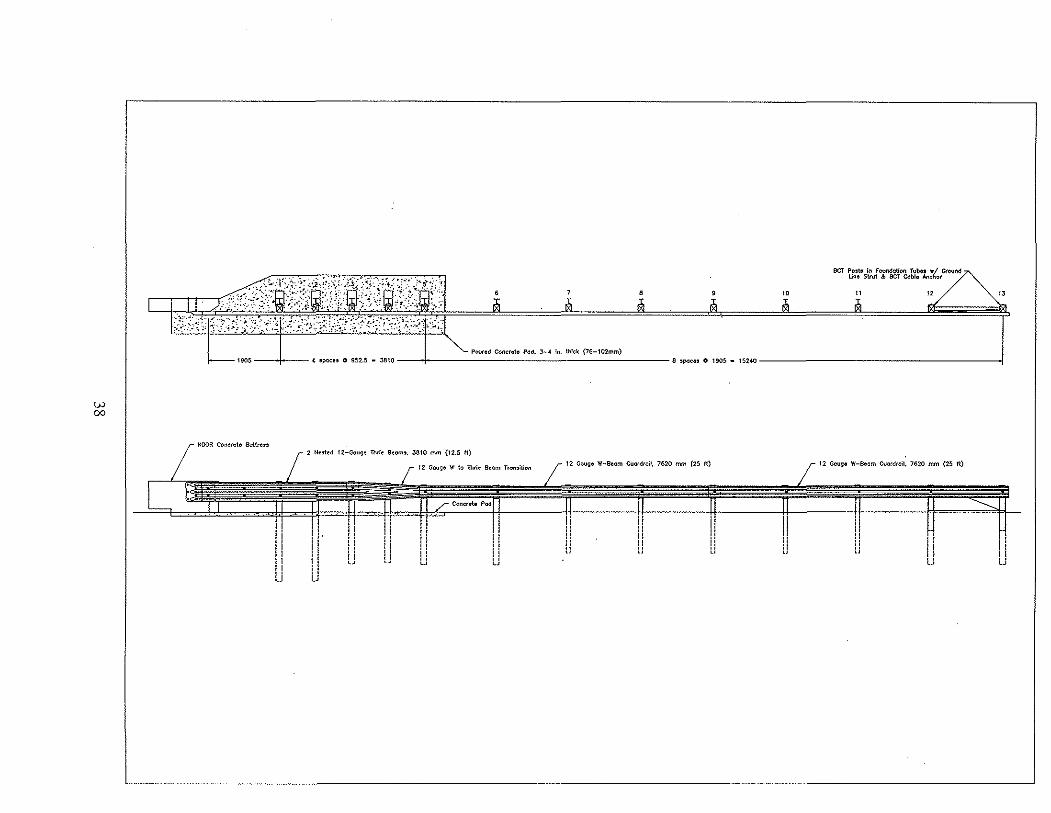
The redesigned system is shown in Figure 2, with detailed component drawings presented in
Appendix A. Several design changes were introduced, including the modification of the concrete abutment
so that the flared portion continues down to the bridge deck surface. This was done to improve

4
constructability and reduce the likelihood of the vehicle snagging on the end of the bridge rail. Other
modifications were also made to the geometry of this abutment to reduce vehicle snag, as shown in the
design drawings. These changes were based on BARRIER VII simulations which considered the amount
of wheel hub snag which would occur as a result of contact with the abutments.
First, the flare rate of the tapered end was increased in order to move the concrete end further
behind the back face of the thrie beam rail. This resulted in the concrete end being positioned 175 mm (6.9
in.) behind the rail in the modified design versus 115 mm (4.5 in.) in the original design. Second, the length
of the tapered section was decreased from 460 mm (18.1 in.) to 250 mm (9.8 in.) to reduce the required
distance the concrete end needed to be offset from the back of the thrie beam rail as well as to reduce
construction costs. The increased flare rate and decreased length of the flared portion of the abutment are
the result of the BARRIER VII analysis.
The Nebraska Department of Roads has recently begun to use steel posts in guardrail systems
instead of wood posts. As a result of this change, it was requested that the redesigned system utilize steel
posts. This also made the design more reasonable, as the strength of the steel post could be increased
without an unreasonably large increase in post size, as would have been necessary with a wood post. As
can be seen in Figure 2, a 102-mm (4-in.) concrete slab was poured around the first five posts in the
transition, with a 330-mm by 400-mm (13-in. by 15¾-in.) recess around each post. A 51-mm (2-in.) thick
layer of flowable fill was then poured around each post for vegetation control. This is a weak mix
(specifications presented in Appendix A), which should not significantly affect the performance of the post.

.. ", _ ....... _ .. -.............
.. _-. O-IIU" ~U'f'O'''!l "1.1("""[1
DOt " ll aT aTf tHO (OPoH«(lIc.o '0 IN: ... ""De(
-,,_ .. ,," , .. " .... -" ... '., ..... -"' .. ,.-. .. , •• , .. _&,...... _ .. __ ... -'M I"'" ..... , , .. __ .. ... ,., .. ,,. _ ." ..... _ .
... ' •• ".._hl .. .... ... " .. _,-._, ""'" -.., ..... -_ .... ..... -.. ~ Moo_ .. " .. .... .. '-_.'- SlUl !'OSI oil .. _ QJfSU "'00:
... ,( ... t
I·:·::·'::-::·::·~·:·::":i-ii·~·i!-;,:·j,.<::.:; _' .. ," -... ---""""' '' '' (I ..... "', . ... '"
" --""'-. --_. 1"'1(-11( '" CU'"DlIlll.
DE I .'l aT D" (10[) to""UIIOH 10 ON( WAY DIIIDCt
.". ... -.- .. _ .... -_ .. _ .. _--SlUt I'OSI WIT" _ QJfS(1 aOCK ... ,( .... ,(
.. ---.
" ........ _ ... " ~
"' M ."'_ ... _ ...... _ _ -_ ................... _ .... . .. _ ... _ ........... " .. -"'., .... .. ... __ ............... _ ..... ' ... .. ... __ .- ..... ...... _.-.. ....... '"'' ... "
1_·,,' ... _·_· ·· ....... ' _ .... _- .. _ .... _--.. _· __ ,M __ ..... _ .......... .. -. __ .. -......... _-, ... _ ... _--
...,_ ......... -..,,, . ........ ,,-- .. , " ...... ,. -,._- .. __ . """ .. , Of,. ,_ •• , ...... .. _ .. "''''' -- . -
Figure 1. Original Nebraska Transition Desilln,
--_.- _ ..... , ........ ,,, ... --IlIlIDe( .. , "04 U(II01'
'·W .. SPECIAL 'LAN c

' I ,r
,.
"AN (f Ifn (""," I[ . 11 Ell _, ~J.t
{(l"um !>I1 '" ,,!FIli I] ,!!/I
Figure I . Original Nebraska Transition Design (continued).
"
'-"- '~ "" .,_w. __ "~ *_
,." . .. , 'n ." . ,~,~ ." .. ~,~ ... _.-
J
):J,J~, ... SW !llj p-p
-... ". ". ... _ ....... - ". ,.-"'0 - ......... '--
-.. <oM,"" ... (,., :.~_:~~,: •• :,:,,:_:,~~/~~----.n~r--------_______ J _____________ _
Figure 2. Rc'-ksigncd Nebraska Transition.
" .,""" rob " ) ~ .. .. " ""_ . /, ... _." r __ ....

8
3 COMPUTER SIMULATION
3.1 Introduction
Prior to full-scale vehicle crash testing, the BARRIER VII (4) computer model was used to analyze
and predict the dynamic performance of various approach guardrail transition alternatives attached to
Nebraska’s standardized concrete buttress. The simulations were modeled with a 2000-kg pickup truck
impacting at a speed of 100.0 km/hr and at an angle of 25 degrees. A typical computer simulation input
data file is shown in Appendix B.
Computer simulation was also used to determine the critical impact point (CIP) for the approach
guardrail transition. The CIP was based upon the impact condition which produced the greatest potential
for wheel-assembly snagging on the lower blunt-end face on the upstream end of the concrete buttress,
occurring in combination with the maximum lateral dynamic rail deflection. Generally, it is believed that
wheel snag distances, in excess of 51 mm (2 in.) for the steel rim, results in an increased potential for
snagging and contact on the blunt-end face of the concrete barrier. In this design, however, the researchers
modified the size and shape of the taper on the upstream end of the concrete buttress in an attempt to
completely eliminate all wheel and rim contact. The size of the redesigned taper was 250-mm (9.8-in.) long
and 175-mm (6.9-in.) wide, while the original taper was 460-mm (18.1-in.) long by 115-mm (4.5-mm)
wide.
Past research involving sedan crash tests into transitions has shown that the potential for vehicle
pocketing is significantly reduced when the maximum dynamic rail deflections are less than 305 mm (12 in.).
However, recent pickup truck crash tests conducted according to NCHRP 350 on thrie beam transitions
have shown that the maximum allowable dynamic rail deflection should be less than this limit due to the

9
increased propensity for vehicle rollover. Currently, it is believed that a maximum dynamic rail deflection
of between 203 to 229 mm (8 to 9 in.), as measured to the top of the rail, should be allowed for TL-3 thrie
beam transitions.
3.2 Design Alternatives
The new approach guardrail transition was designed with consideration for eliminating wheel snag
on the concrete buttress and not allowing dynamic rail deflections greater than 203 to 229 mm (8 to 9 in.),
as measured to the top of the rail. Two steel post alternatives were configured to meet these design
considerations. The first alternative (Option No. 1) was supported by two W150x37 (W6x25) by 2591-
mm (8½-ft) long steel posts and four W150x22 (W6x15) by 2134-mm (7-ft) long steel posts. Post
spacings consisted of one at 1879 mm (6 ft - 2 in.), four at 953 mm (3 ft - 1½ in.), and one at 1905 mm
(6 ft - 3 in.). The second alternative (Option No. 2) was supported by four W200x46 (W8x31) by 3048-
mm (10-ft) long steel posts and three W150x22 (W6x15) by 2134-mm (7-ft) long steel posts. Post
spacings consisted of one at 1879 mm (6 ft - 2 in.), two at 476 mm (1 ft - 6¾ in.), three at 953 mm (3 ft -
1½ in.), and one at 1905 mm (6 ft - 3 in.).
3.3 Results
For Option No. 1 (W150x37), the critical impact point was determined to be the midspan between
post nos. 1 and 2 or 2105 mm (7 ft - 1 in.) from the upstream end of the concrete end section. For this
impact condition, wheel snag distances for the outer tire and inner steel rim were calculated to be
approximately 9.5 mm (d in.) and 0 mm, respectively. For this impact location, the predicted maximum
lateral dynamic rail deflection was 203 mm (8 in.), as measured to the center height of the rail.
Subsequently, the maximum dynamic rail deflection at the top of the rail was estimated to be 234 mm (9.2

10
in.).
For Option No. 2 (W200x46), the critical impact point was determined to be post no. 2 or 2105
mm (7 ft - 1 in.) from the upstream end of the concrete end section. For this impact condition, it was
predicted that wheel snag would not occur on either the outer tire and inner steel rim. For this impact
location, the predicted maximum lateral dynamic rail deflection was 184 mm (7¼ in.), as measured to the
center height of the rail. Subsequently, the maximum dynamic rail deflection at the top of the rail was
estimated to be 208 mm (8.2 in.).
A comparison of the two options revealed that for both systems, wheel snag distances were found
to be negligible and the maximum dynamic rail deflections to the top of rail were within the design limits.
Therefore, Option 1 (W150x37) was selected over Option 2 (W200x46), since the significant increase in
construction costs for Option 2 over Option 1 provided only a slight reduction in wheel snag distances and
dynamic rail deflections.
4 TEST CONDITIONS
4.1 Test Facility
4.1.1 Test Site
The Midwest Roadside Safety Facility 's outdoor test site is located at the Lincoln A ir-Park
on the northwest end of the Lincoln Municipal Airport. The test facility is approximately 8 km (5
miles) northwest of the University of Nebraska-Lincoln. The site is surrounded and protected by a
2.4 m (8-ft) high chain-link security fence.
4.1.2 Vehicle Guidance System
A reverse cable tow system with a 1:2 mechanical advantage was used to propel the test
vehicle. The distance traveled and the speed of the tow vehicle are one-half that of the test vehicle.
The test vehicle was released from the tow cable before impact with the appurtenance. A fifth wheel,
built by the Nucleus Corporation. was used in conjunction with a digital speedometer to increase the
accuracy of the test vehicle impact speed.
A vehicle guidance system developed by Hinch (~) was used to steer the test vehicle. The
guide-flag, attached to the front-left wheel and the guide cable, was sheared off before impact. The
95-mm (3 /8-in.) diameter guide cable was tensioned to approximately 13.3 kN (3 ,000 lbs), and
supported laterally and vertically every 30.5 m (100 ft) by hinged stanchions. The vehicle guidance
system was 460-m (1 ,500-ft) long for the test.
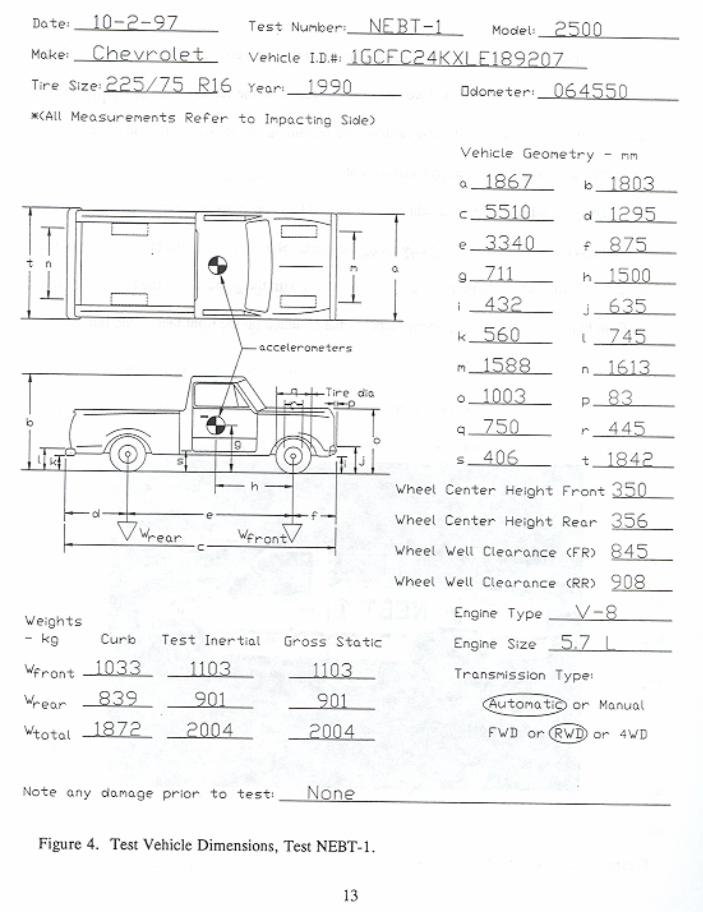
4.2 Test Vehicle
The test vehicle used for this evaluation was a 1990 'I.-ton Chevrolet pickup with a test
inertial mass of 2000 kg (4410 Ibs). Photographs of this vehicle are shown in Figure 3. with
dimensions being presented in Figure 4.
11
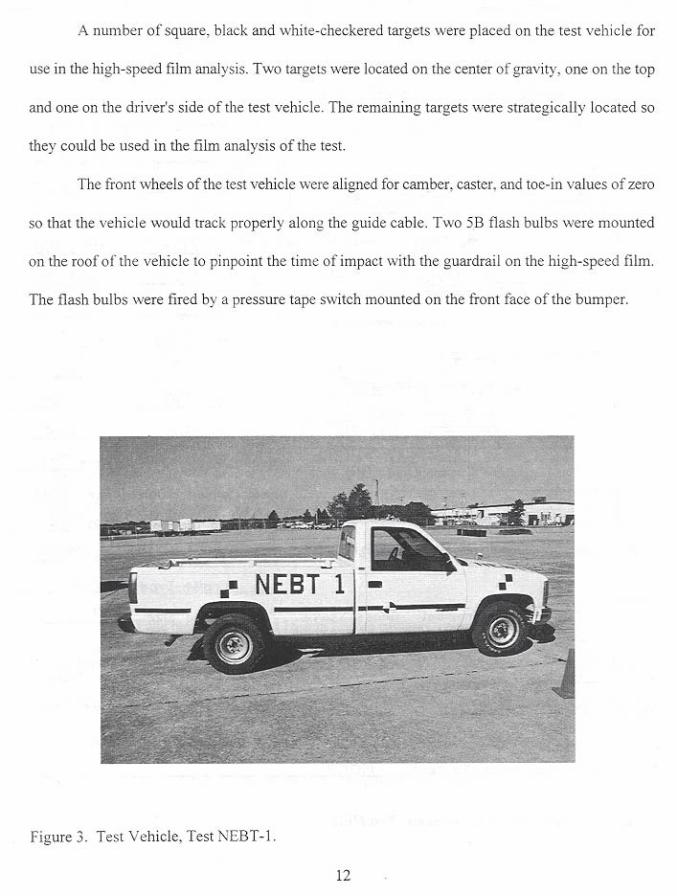
A number of square . black ilIld whlte -checkered targets were placed on the test veh>ele for
use in the high-speed film analysis. Two targets were located on the center of gravity, one on the top
and one on the dn ver's side of the test vehicle. The remaimng targets were strategically located so
they could be used in the film analysls of the test.
The froll! wheels of the test '-ehicle were aligned for camber, caster, and toe-in values of zero
:;0 that the ,ehicle would track propcrly along the guide cable. Two 58 flash bulbs were moull!ed
on the roof of the vehicle to pmpointthe time of impact wi th the guardrail on the high-speed film .
The flash bulbs were fired by a pressure tape switch mounted on the fro nt face of the bumper.
Figure 3. Test Vehicle, Test NEBT- !
12

14
4.3 Data Acquisition Systems
4.3.1 Accelerometers
One triaxial piezoresistive accelerometer system, with a range of ±200 G's, was used to measure
the acceleration in the longitudinal, lateral, and vertical directions, at a sample rate of 10,000 Hz. The
environmental shock and vibration sensor/recorder system, Model EDR-4M6, was developed by
Instrumented Sensor Technology (IST) of Okemos, Michigan and includes three differential channels as
well as three single-ended channels. The EDR-4 was configured with 6 Mb of RAM memory and a 1,500
Hz lowpass filter. Computer software, "DynaMax 1 (DM-1)" and "DADiSP" were used to digitize, analyze,
and plot the accelerometer data.
A backup triaxial piezoresistive accelerometer system, with a range of ±200 G's, was also used
to measure the acceleration in the longitudinal, lateral, and vertical directions, at a sample rate of 3,200 Hz.
The environmental shock and vibration sensor/recorder system, Model EDR-3, was developed by
Instrumented Sensor Technology (IST) of Okemos, Michigan. The EDR-3 was configured with 256 Kb
of RAM memory and a 1,120 Hz lowpass filter. Computer software, "DynaMax 1 (DM-1)" and
"DADiSP" were used to digitize, analyze, and plot the accelerometer data .
4.3.2 High Speed Photography
Five Red Lake brand high-speed 16-mm Locam cameras, operating at 500 frames/sec, were used
to film the crash test. One camera, with a 12.5-mm lens, was placed above the test installation to provide
a field of view perpendicular to the ground. A second Locam, with a 17 to 102 mm zoom lens, was placed
downstream from the impact point and had a field of view parallel to the barrier. A third Locam, with a
12.5 to 75-mm zoom lens, was placed on the traffic side of the bridge rail and had a field of view
perpendicular to the barrier. Two additional high speed Locam cameras were placed behind the rail to aid
15
in evaluation of the vehicle/rail interaction.
The film was analyzed using a Vanguard Motion Analyzer. Actual camera speed and camera
divergence factors were considered in the analysis of the high-speed film.
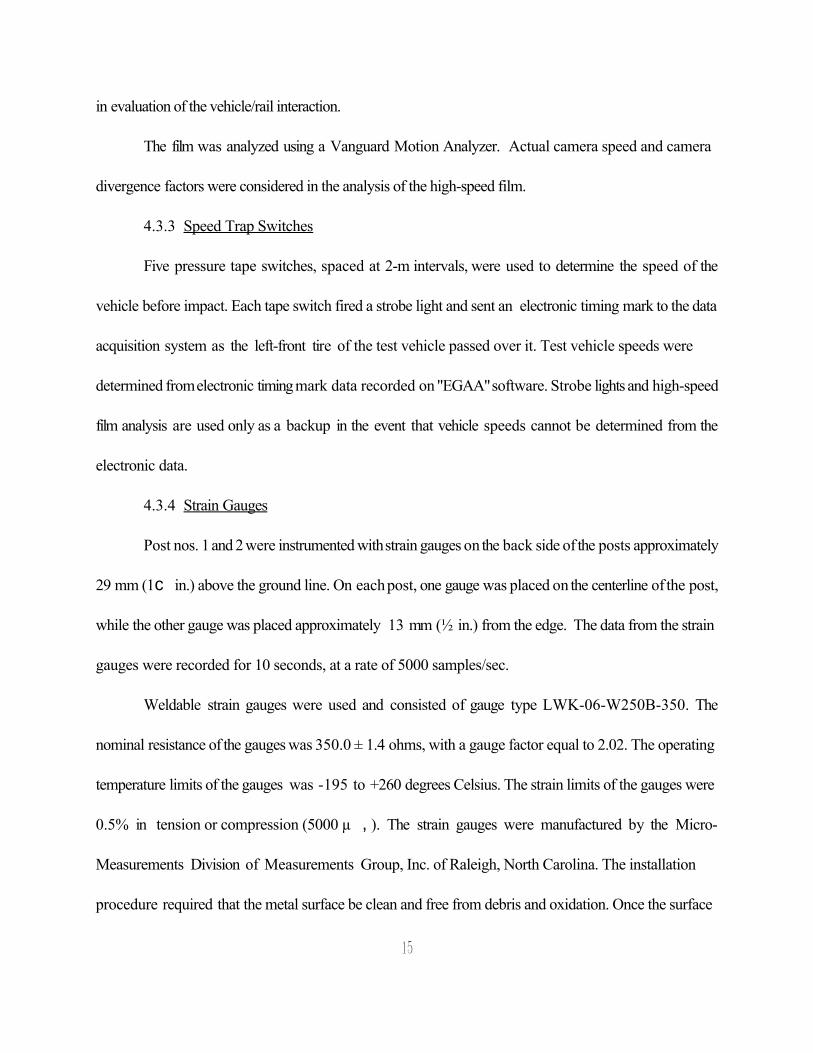
4.3.3 Speed Trap Switches
Five pressure tape switches, spaced at 2-m intervals, were used to determine the speed of the
vehicle before impact. Each tape switch fired a strobe light and sent an electronic timing mark to the data
acquisition system as the left-front tire of the test vehicle passed over it. Test vehicle speeds were
determined from electronic timing mark data recorded on "EGAA" software. Strobe lights and high-speed
film analysis are used only as a backup in the event that vehicle speeds cannot be determined from the
electronic data.
4.3.4 Strain Gauges
Post nos. 1 and 2 were instrumented with strain gauges on the back side of the posts approximately
29 mm (1c in.) above the ground line. On each post, one gauge was placed on the centerline of the post,
while the other gauge was placed approximately 13 mm (½ in.) from the edge. The data from the strain
gauges were recorded for 10 seconds, at a rate of 5000 samples/sec.
Weldable strain gauges were used and consisted of gauge type LWK-06-W250B-350. The
nominal resistance of the gauges was 350.0 ± 1.4 ohms, with a gauge factor equal to 2.02. The operating
temperature limits of the gauges was -195 to +260 degrees Celsius. The strain limits of the gauges were
0.5% in tension or compression (5000 µ ,). The strain gauges were manufactured by the Micro-
Measurements Division of Measurements Group, Inc. of Raleigh, North Carolina. The installation
procedure required that the metal surface be clean and free from debris and oxidation. Once the surface

16
had been prepared, the gauges were spot welded to the test surface.
A Measurements Group Vishay Model 2310 signal conditioning amplifier was used to condition
and amplify the low-level signals to high-level outputs for multichannel, simultaneous dynamic recording on
"Test Point" software. After each signal was amplified, it was sent to a Keithly Metrabyte DAS-1802HC
data acquisition board, and then stored permanently on the portable computer.
17
5 PERFORMANCE EVALUATION CRITERIA
The safety performance objective of a guardrail to bridge rail transition is to redirect an errant
vehicle in a controlled manner without allowing it to snag on the end of the bridge rail, causing excessive
deceleration and occupant compartment deformation.
The performance criteria used to evaluate this full-scale vehicle crash test was taken from NCHRP
Report 350, Recommended Procedures for the Safety Performance Evaluation of Highway Features
(2). The safety performance of the bridge rail was evaluated according to three major factors: (1) structural
adequacy, (2) occupant risk, and (3) vehicle trajectory after collision. These three evaluation criteria are
defined and explained in NCHRP Report 350 (2). The specific evaluation criteria which pertain to this test
are presented in Table 1.
After each test, vehicle damage was assessed by the traffic accident scale (TAD) ( 6) and the
vehicle damage index (VDI) (7).

18
Table 1. Relevant NCHRP 350 Evaluation Criteria
A. Test article should contain and redirect the vehicle; the vehicle should not penetrate, underride,or override the installation although controlled lateral deflection of the test article is acceptable.
D. Detached elements, fragments or other debris from the test article should not penetrate or showpotential for penetrating the occupant compartment, or present an undue hazard to other traffic,pedestrians, or personnel in a work zone. Deformations of, or intrusions into, the occupantcompartment that could cause serious injuries should not be permitted.
F. The vehicle should remain upright during and after collision although moderate roll, pitching andyawing are acceptable.
K. After collision it is preferable that the vehicle’s trajectory not intrude into adjacent traffic lanes.
L. The occupant impact velocity in the longitudinal direction should not exceed 12 m/s (39.4 fps) andthe occupant ridedown acceleration in the longitudinal direction should not exceed 20 g’s.
M. The exit angle from the test article preferably should be less than 60 percent of test impact angle,measured at time of vehicle loss of contact with test device.

19
6 TEST RESULTS
6.1 Test NEBT-1 (2,004 kg, 103.2 km/h, 24.9 degrees)
For this test, the 1990 Chevrolet ¾-ton pickup impacted the transition midway between post nos.
1 and 2, as can be seen in Figure 5. The actual impact conditions were 103.2 km/h and 24.9 degrees. The
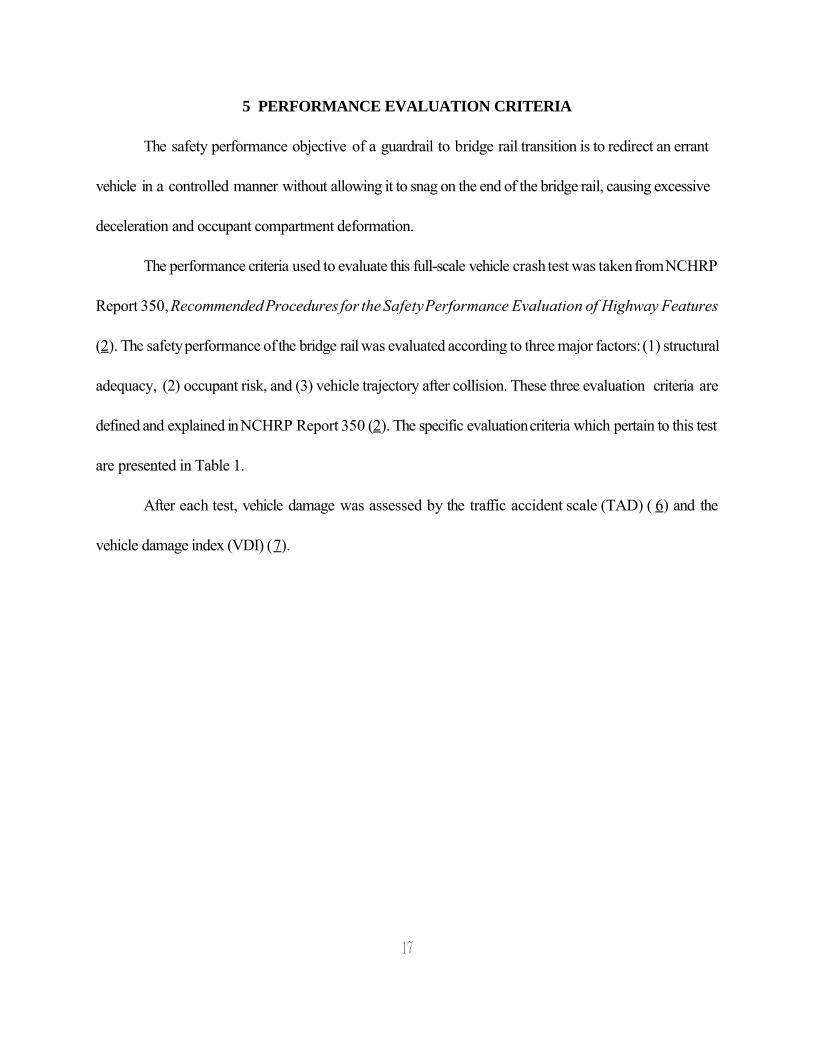
results of the test are summarized in Figure 5, with additional sequential photos presented in Figures 6 and
7.
Upon impact with the approach thrie-beam, the right-front corner of the vehicle began to crush
inward. By 14 msec after impact, the right-front corner of the vehicle had reached post no. 1, and by 49
msec, it was at the midpoint between the first post and the bridge end. At 66 msec, the vehicle reached the
leading edge of the abutment and the right-front tire began to slide under the rail. At 90 msec after impact,
the right-front tire, which had become wedged under the rail, impacted the end of the concrete abutment.
This contact caused high deceleration forces and increased the amount of occupant compartment damage
which occurred to the vehicle. At 185 msec, the rear bumper contacted the approach rail, and at 201 msec
after impact, the vehicle was parallel to the system and traveling at a velocity of 64.4 km/h (40.0 mph). The
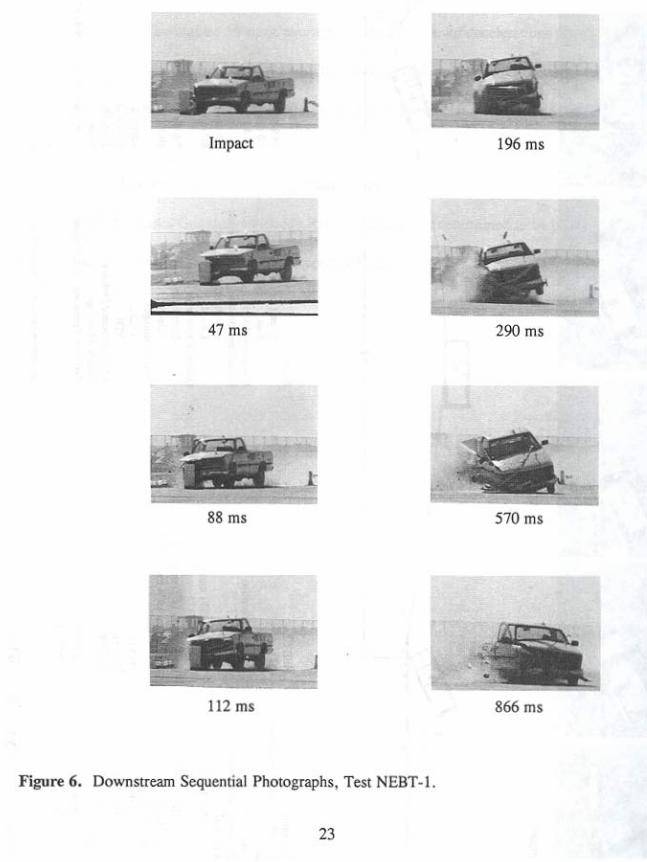
truck continued to redirect from the system, and exited at 7 degrees and 61.4 km/h (38.2 mph) at 376
msec after impact. The vehicle continued downstream and came to rest approximately 52-m (170-ft)
downstream of impact, with the vehicle center of gravity approximately 3 m (10 ft) behind a line parallel
with the front face of the guardrail. This final resting position can be seen in Figure 8.
Damage to the system was minimal, as shown in Figure 9. The maximum permanent set deflection
in the guardrail of 71 mm (2 13/16 in.) occurred at the midspan between the bridge end and the first post.
The first post fractured the flowable fill around its base, as a result of rotation during impact. There was

20
slight cracking of the flowable fill around post no. 2, but no deformation of the post. Damage to the bridge
end was very minor, and consisted of tire marks and minor concrete spalling. The tire marks indicated
approximately 3 in. of wheel snag on the flat end of the concrete abutment. There were no cracks in the
bridge end, and no repair would be necessary for this component of the system.
The vehicle damage was considerable, as shown in Figure 10. The entire right-front corner of the
vehicle was severely crushed, resulting in deformation of the occupant compartment. The upper control arm
was disengaged from the right-front wheel assembly, allowing the wheel to pivot outward and snag on the
end of the abutment. Most of the right side of the vehicle was damaged as a result of contact with the
transition system.
Deformation measurements in the occupant compartment indicated that the maximum longitudinal
and lateral deformations occurred on the right-front corner of the floorboard, which was the closest point
to the impacted region. The deformation in the occupant compartment appeared to be more typical of what
would be expected during a side-impact type loading, rather than the typical deformation caused by the
wheel being forced back into the firewall. The longitudinal deformation was measured to be 165 mm (6½
in.), while the lateral deformation was 121 mm (4¾ in.). The maximum vertical occupant compartment
deformation of 244 mm (9e in.) occurred in the left-rear corner of the passenger side floorboard. The
dash was also deformed, with measurements indicating a 152-mm (6-in.) vertical deformation and 267-mm
(10½-in.) deformation in the longitudinal direction.
The occupant risk values for this test were calculated even though NCHRP Report 350 (2) does
not require that this test meet any of the criteria. The normalized occupant impact velocities were
determined to be 9.8 m/s (32.2 fps) in the longitudinal direction, and the 8.2 m/s (26.9 fps) in the lateral

21
direction. The highest 10-msec average occupant ridedown decelerations were 7.6 g's (longitudinal) and
10.3 g's (lateral). The results of this occupant risk assessment, as determined from the accelerometer data,
are summarized in Figure 5. The accelerometer data analysis is shown in Appendix C.
As a result of the excessive occupant compartment deformation, the performance of Test NEBT-1
on the Nebraska Guardrail to Bridge Rail Transition was determined to be unsuccessful according to the
criteria set forth in NCHRP Report 350 (2).

Impact 49 ms 66 ms 109 ms 201 ms
. -'"------------~.
1-------- ---- ~.6S "",t." -----------
TOltNumk , NCI(R P 350 TOIl D<'!gnoboo 0.00 ........... .
NEBT·l 3-21 10/2/91
In,toll",o" .... ... N,b,-.. k. T ... n" ti ... ApplO~h 8"",I ... il length . . . 21 m
Ste<I PO," No. I &2 ... " .......... . WI~~7(2S9 1 mm k>n8) No, 3 10 6 .. . ........... . , WI S0x22 (21 J.4 rum [008) No. 7"' l l .......... , WISOxI3.S(I S30mmloog)
Vehicle Model , ... , . , . , , ........ .. 1m Chevro1<1 '/~ton pickup Veh icle Weigh'
Curb " .......... 1l!68 1(g T"!ln<rti.", ,, ........ .. 2000 kg Gr"" S!>.ti, . 2000 kg
...... 103.2 km1h , .... ... 61A kmIh
Figure 5. Summary ofTeSl NEBT ·1 .
lrnpocl 1:)<"
ChanS' in Velocity", ... ...... . N""". l"ed ()«up'n' lmpo<' V.locity
Longitudin,l ." ....... . lAt«.! """', ..... ... .
OocUp'", RidtJown t:>=1 ... ,,,,,, Longitudinoi .... ..... . lAte,,1
V,~;.,I.I).m"8.
TAD"""", , ........ . W,
V,~;.,te R,t>aund Di,I;o"", r"n,ilion o.mog. M .. imum Perma nenl Sel D<lk<lioo
24.9 <kg 7.0dtg 41.8 kmIh
9, 8 mi. 8,2 mi.
1,60". 10.3 (j~
I ·RfQ-~
OlRFES3 2.9m@24m Mi,.,.. 71 mm betv.'C<n bridg •• nd . nd po.! 1
COII,e"ion Foo'o,,, 1 in,- 2,S4om: I Ib- O,454 kg
Impact 196 ms
47 ms 290 ms
88 ms S70ms
112 ms 866 ms
Figure 6. Downstream Sequential Photograph.s, Test NEBT-I.
23

Impact 90 m,
36 ms 174 ms
46 m. 194 ms
68 m. 218 ms
Figure 7. Close-up Sequential Photographs. Test NEBT· I.
24
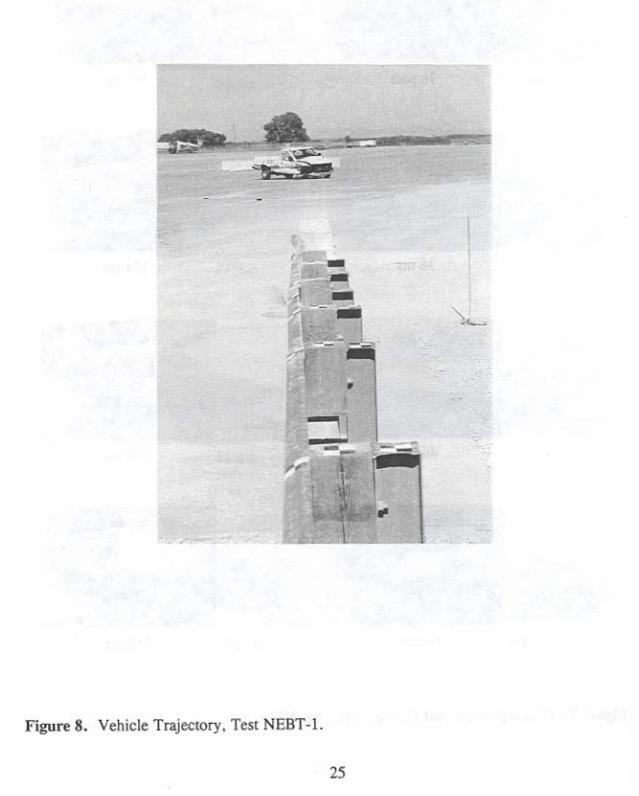
Figure 8. Vehicle TrajeclOry. Test NEBT-1.
2S
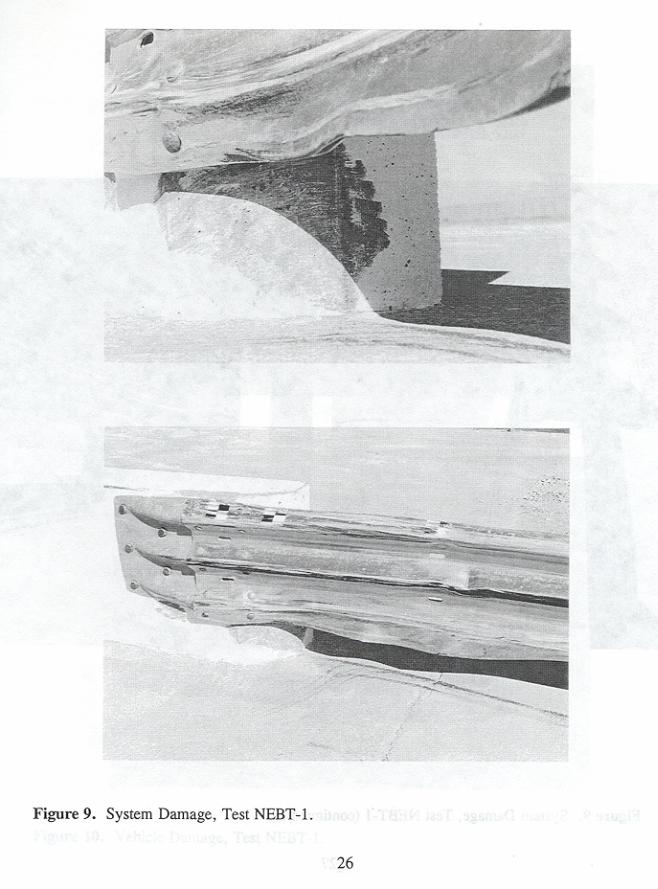
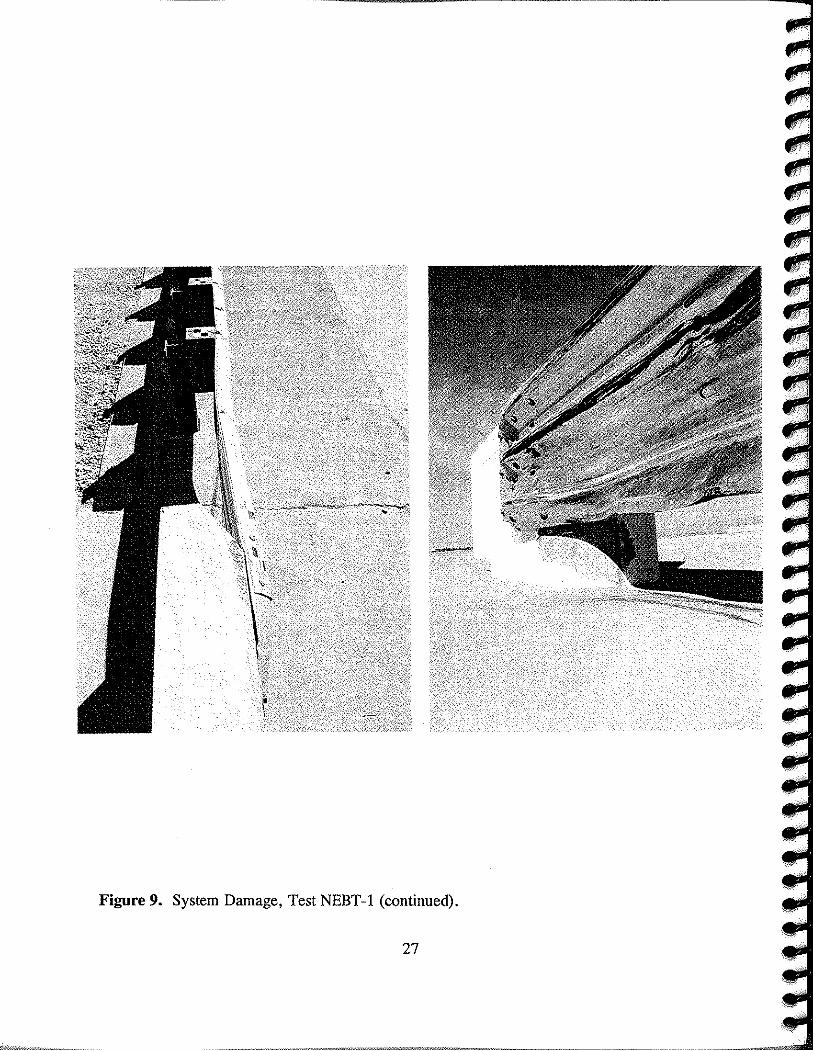
Figure 9. System Damage, Test NEBT-1 (continued).
27

Figure 10. Vehicle Damage, Test NEST·1.
28

Figure 10. Vehicle Damage. Tes! NEBT-l (continued).
29

30
7 STRAIN GAUGE RESULTS
The data obtained from the strain gauges which were placed on post Nos. 1 and 2 was analyzed
and is summarized in Table 2.
Table 2. Strain Gauge Instrumentation Results
PostNo.
Location Maximum Strain(:g)
Maximum Stress(ksi)
2 Flange edge -503 -15.09
2 Flange midpoint -468 -14.03
1 Flange edge -1270 -38.11 (close to yielding depending on exactvalue of Fy)
1 Flange midpoint -1225 -36.74 (close to yielding depending on exactvalue of Fy)
These results indicate that some yielding of the first post likely occurred just below the ground line,
indicating that the first post was not over designed. These values are presented for reference, so that they
are available for comparison of future tests.

31
8 DISCUSSION
This transition system behaved remarkably well in its ability to redirect a ¾-ton pickup, as the
vehicle was redirected with very little tendency to roll. This is significant because previous tests conducted
with pickups on transitions have resulted in high roll angles and rollovers. Vehicle vaulting is also typical in
this type of an impact, but did not occur during this test. However, the snagging which occurred on the end
of the bridge abutment was critical, as it ultimately resulted in significant deformations of the occupant
compartment, and failure of the test. Based on the extent and location of this deformation, it was judged
that it would indeed present a risk to occupants involved in an impact.
The amount of occupant compartment deformation which is allowable during a redirectional test
with a pickup, has become the object of much debate recently, as the structure of a pickup allows for more
deformation than was typically found in the older sedan test vehicle. The typical scenario witnessed during
a pickup test is that the front wheel is pushed backward into the firewall, causing local deformation of the
firewall and floorpan in the longitudinal direction. However, this was not the case in this test, as the
deformation appeared to be the result of a lateral force which caused significant deformation to the entire
floorboard. This lateral force occurred after the tire extended under the rail, contacted the upstream end
of the concrete section, and was forced to move laterally back into the wheel-well region. It is believed that
this occurrence was not due to the increased flare rate of the concrete taper but was due to the unique
observation of the tire collapsing underneath the rail and contacting the end section.
The original concrete buttress used by NDOR is configured with a tapered concrete end that does
not extend to the ground but is elevated 255 mm (10.0 in.) above the roadway. This configuration provides
a blunt end at the base of the concrete buttress at the point where the tapered concrete section becomes

32
flush with the back side of the thrie beam rail. However, the modified design incorporated a tapered section
that continued down to the bridge deck surface. As stated previously, this change was made to improve
constructability and reduce the likelihood of wheel snagging on the blunt end below the tapered concrete
section. As already mentioned, during the crash test a unique tire failure occurred, causing the wheel to
contact on the end of the tapered concrete section. The researchers believe that had the tapered concrete
section remained elevated above the roadway surface, the probability of tire contact on the blunt end below
the tapered concrete section would be equal to or greater than that found during this crash test.

33
9 RECOMMENDATIONS
Based on the system performance witnessed during the testing described herein, it is recommended
that the Nebraska transition design be modified to include a rubrail. A properly designed rubrail would
prevent the snagging which occurred on the end of the bridge rail, and reduce the amount of occupant
compartment deformation to an acceptable level.

34
10 CONCLUSIONS
The Nebraska Transition was proven to be capable of redirecting a ¾-ton pickup in a controlled
and predictable manner. However, snagging which occurred on the upstream end of the concrete tapered
section resulted in excessive occupant compartment deformations. This led to the conclusion that the system
does not pass the Test Level 3 criteria for guardrail to bridge rail transitions which is set forth in NCHRP
Report 350 (2).

35
11 REFERENCES
1. Recommended Procedures for the Safety Performance Evaluation of Highway Appurtenances,
2. Recommended Procedures for the Safety Performance Evaluation of Highway Features,National Cooperative Highway Research Program Report 350, Transportation Research Board,Washington, D.C., 1993.
3. Post, E.R., Full-Scale Vehicle Crash Tests on Guardrail-Bridgerail Transition Designs withSpecial Post Spacing, Transportation Research Report TRP-03-008-87, University of Nebraska-Lincoln, Lincoln, NE, May 1987.
4. Powell, G.H., BARRIER VII: A Computer Program For Evaluation of Automobile BarrierSystems, Prepared for: Federal Highway Administration, Report No. FHWA RD-73-51, April1973.
5. Hinch, J., Yang, T-L, and Owings, R., Guidance Systems for Vehicle Testings, ENSCO, Inc.,Springfield, VA, 1986.
6. Vehicle Damage Scale for Traffic Investigators , Traffic Accident Data Project TechnicalBulletin No. 1, National Safety Council, Chicago, IL, 1971.
7. Collision Deformation Classification, Recommended Practice J224 March 1980 , SAEHandbook Vol. 4, Society of Automotive Engineers, Warrendale, Penn., 1985.
mholton
Typewritten Text
mholton
Typewritten Text
mholton
Typewritten Text
mholton
Typewritten Text
National Cooperative Highway Research Program Report No. 230, Transportation Research Board, Washington, D.C., March 1981.
mholton
Typewritten Text

12 APPENDICES
36

APPENDIX A: Nebraska Transition Design Details
37
w 00
"
Poured Concr~te P~d. 3-~ !n. lhlck (76-102mm)
1905 --+--.(. !p<!CU 0 952.5 • J.810 ---+-----------------------9 !p<ICO! 0 1905- 1524Q -------------------------1
2 Hute<l 12-Gou~e Thrie Beomo, 3810 mm (12.5 It)
12 Gouge W-Beom Cuardroil, 7620 mm (25 It) 12 Gauge W-B~om Cuordro~, 7620 rnm (25 ft)
!, li l
I. l' !! ii

r----------------------1850---------------------1
!I II Ysl !I II 175 !l II :: ll _t.: 350
II II ~~_l
:~ 203 L 350 --t 250 ~ 0
0 0
1 203 6001 I
-r- 0 194
0197 +-0 0
_l97 194
_L_o
j_ 100 I I
~ 835
il
0 0
I 600 I 1250

-~"I' " 'I" " 1850
~l"~ 0 0 0 0 0 0 0 0 Of) Of) Of) Of) Of) Of) Of) Of)
I ~
I ~
I ~
I ~
I ~
I ~t~
I ~
I j
I I I I I : I I I :: I :: I I I I 110 I
~~ I '\S! T II II
~ 175
350 I ~ 190' 200 II II I i I II II
L ! 1 !.L.ll. II II. •
50mm min. co~ver I
~ 203 ~ 350 ==:j 250 ~ 1000
r 50mm min. cover 50mm min. cover ~ r-
~ 16 r-r r ® 100 16 r- r-
® 100 16 r- r ® 100 16
<± r- r-100 835
16 '"
-I-r-Center of 100 connector 550 16 r- r-shoe 100
16 r- r-L 13 13 13 13 100
100 16 r- r-75
I 250
I 19 19 19 19 19 19 19 19
600
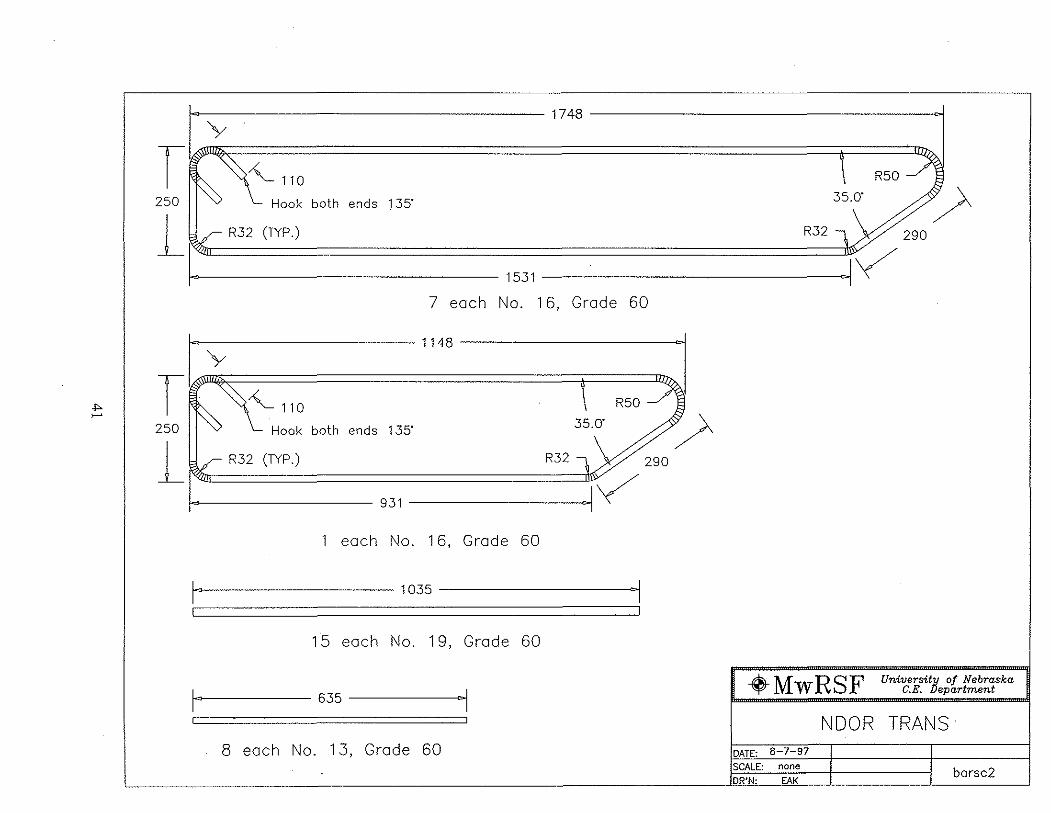
I:~, 1748
R50 I ~~::: 00," eco, !" 35.0'
1 R.32 (TYP.)
I:' 15.31 'I
R.32 290
7 each No. 16, Grade 60
-I'>- R50 >-'
250 v \... Hook both ends 1.35' .35.0'
1 R.32 (TYP.)
I:' 931 01
R.32 290
1 each No. 16, Grade 60
I ' 10.35 ' I
15 each No. 19, Grade 60
I ' 6.35 ' I -""'- MwRSF University of Nebraska V C.E. Department
NDOR TRANS· 8 each No. 13, Grade 60 DATE: 8-7-97
SCALE: none barsc2 DR'N: EAK
.po. IV
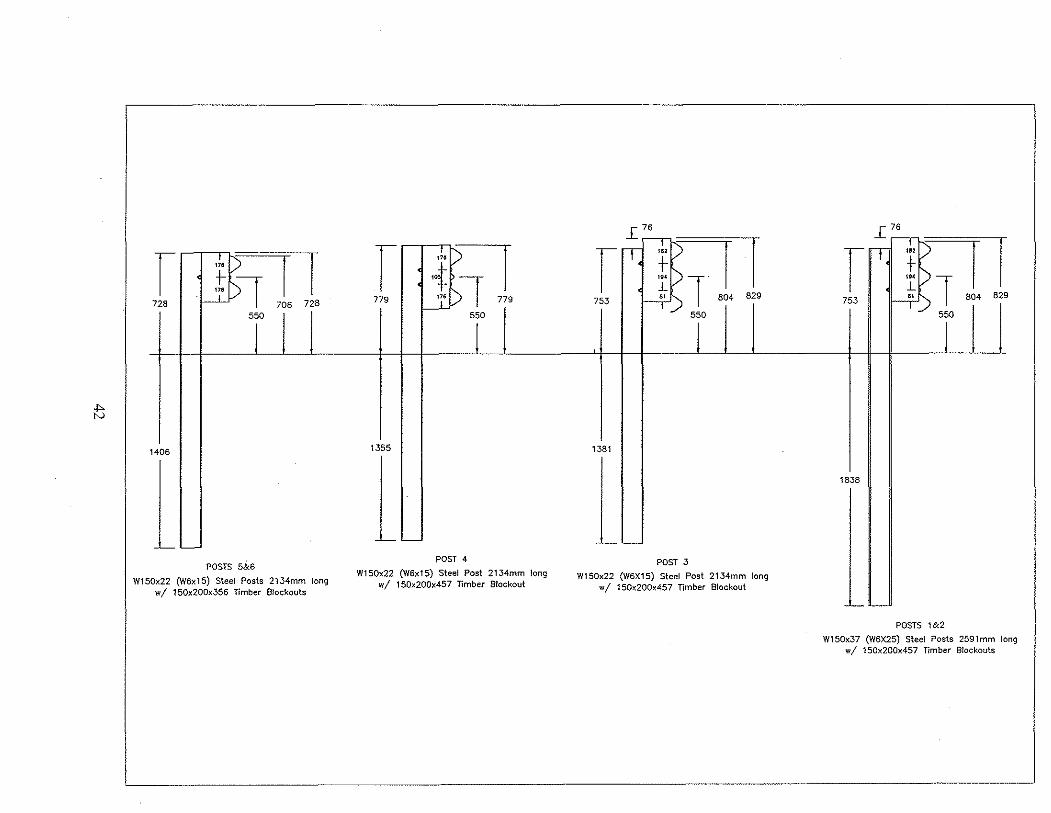
r 728 UBt~ \78)1 I I >T 706 728
550
1406
--L- L-
POSTS 5&6
W150x22 (W6xlS) Steel Posts 2134mm long wi 150x200x356 Timber Blockouts
r 779
q?=:T llf> I 779 550
J
1355
--L- L-
POST 4
W150x22 (W6xt5) Steel Post 2134mm long wI 150x200x457 Timber Blockout
L 76
r !~ 753 81 1 804 829
550
J
1381
'-'--
POST .3
W150x22 (W6XlS) Steel Post 2134mm long wi 150x200x457 Timber Slockout
("!~l 753 81 1 804 829
550
J
1838
--L- '--
POSTS 1&2
W1S0x37 (W6X25) Steel Posts 2591mm long wi 150x200x457 Timber Blockouts

~ W150x37 (W6x25)
-II- 32 (1 1/4")
II 106 (4 3/16")
0110 +---+ II 194 (7 5/S")
II j o II Qo". t---'-
II ~ ¢20 (3/4") II II II II II II II II II II II
2591 (8 1/2') II II II II II II II II II II II II II II II II II II
-I I- 200 (S")
-r-~ 150CLJ
Top
r 457 (1S")
L L--= =-----,==:
Side
-I - 32 (1 1/4")
f I 1S2 (7 5/32")
I . ; '\ f I
194 (7 5/S") " j I '- ¢20 (3/4") --'----+--1
1
0 ,
Front
POST NOS, 1 and 2
2 each W150x37 (W6x25) Steel Posts wi Timber Blackouts
43
2134 (7')
~ W150x22 (W6x15)
-I ~ 32 (1 1/4")
II 106 (4 3/16")
o II 0 +-----+ II
II 011 '\
194 (7 5/8")
I
II ~ ¢20 (3/4") II
II II
II
II II
II
II
II II II
II II
II II
II
II II
II II
II
II II
-I f- 200 (8")
150"-(6'-')- t====j j
Top
r .==== 457 (18")
L ==== Side
-I - 32 (1 1/4")
! I 182 (7 5/32")
+1---+-11
'\
194 (7) 5/8") 1 ~ no (3/4")
--'------t--I 0
I
Front
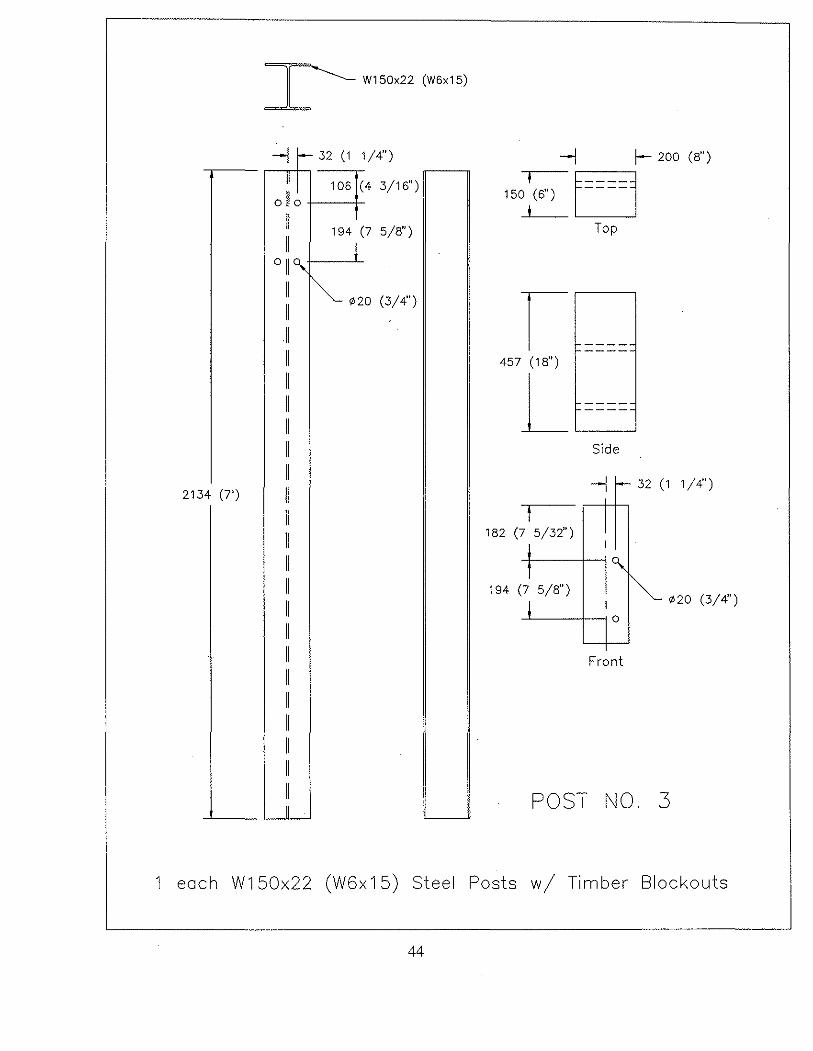
POST NO. 3
1 each W150x22 (W6x15) Steel Posts wi Timber Blockouts
44

2134 (7')
~ W150x22 (W6x15)
--1 - 32 (1 1/4")
II --r II 176 (6 15/16")
0110 t--+ II 105 (4 1/8")
°li~ II "'- ¢20 (3/4")
II
II II II II II II II II II II II II II II II
--I I- 200 (8")
150"-(6'-')- [====j I
Top
r 457 (18") L '-------J= = = =-
Side
--I - 32 (1 1/4") ,
I t 176 (6 15/16")
1
-1----+--1 '\ 105 (4 1/8") ""
-'-----+-110 "- ¢20 (3/4")
I I
Front
POST NO, 4
1 each W150x22 (W6x15) Steel Posts wi Timber Blockouts
45
Nail Hole ¢7 (1/4")
2134 (7')
~ W150x22 (W6x15)
---I r- 32 (1 1/4")
" I 25 (1")
"",R II 178 (7")
ol!~ j
II i"" II I "-- ¢20 (3/4")
II II II II II II II II II II II II II II II II II II II II II II II II
---I I-- 200 (8")
150"-(6'-')- [====j I
Top
I 356 (14") ====_
L'----1 Side
---I - 32 (1 1/4")
t 178 (7")
-,-I --t---i ~
~ ¢20 (3/4")
Front
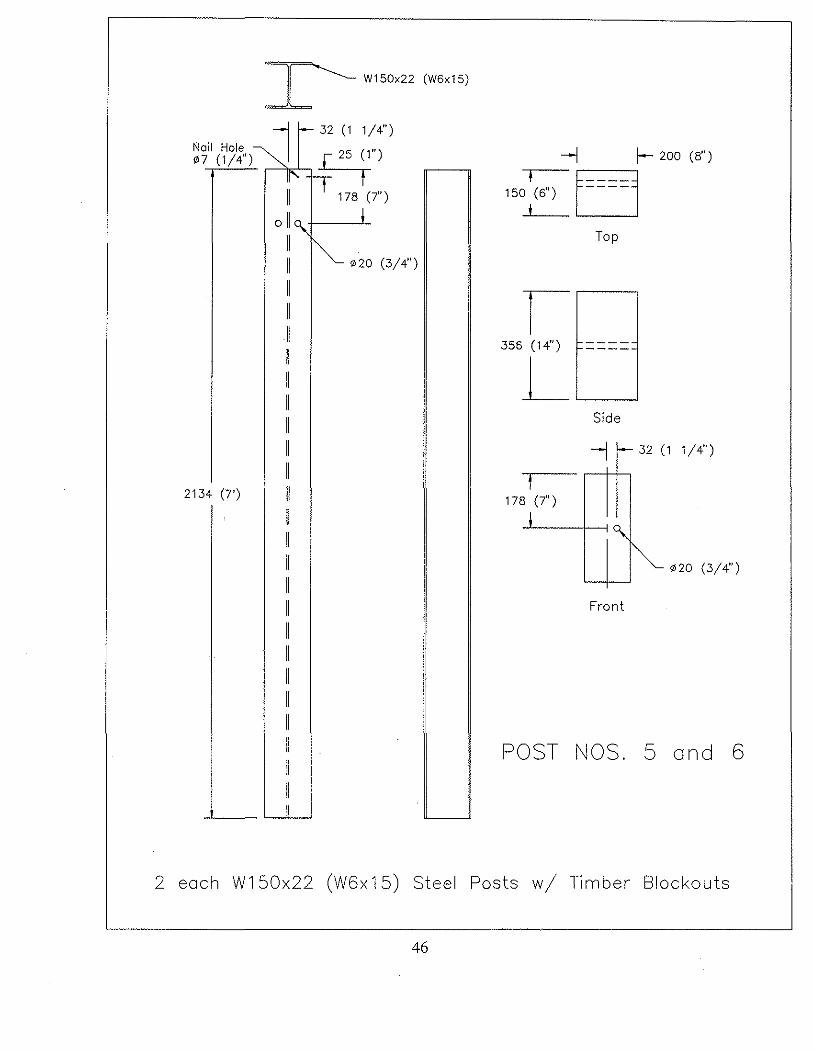
POST NOS, 5 and 6
2 each W1S0x22 (W6x1S) Steel Posts wi Timber Blockouts
46
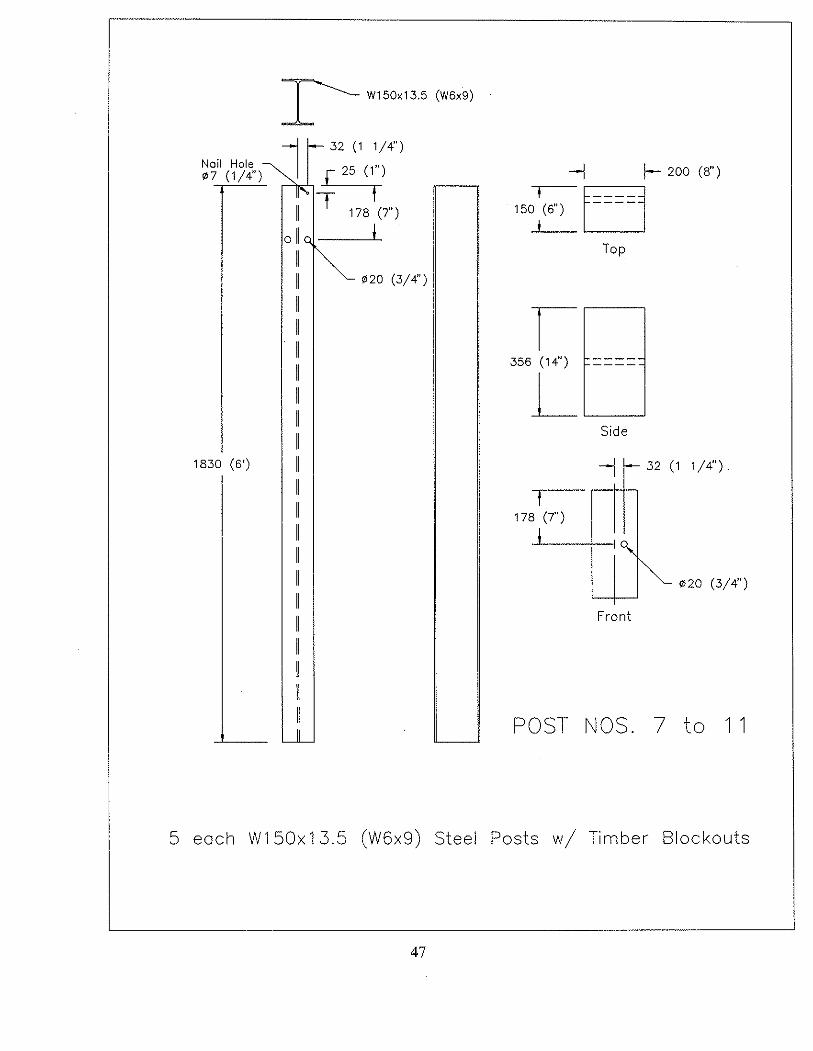
5 each W150x13.5 (W6x9) Steel Posts wi Timber Blockouts
47
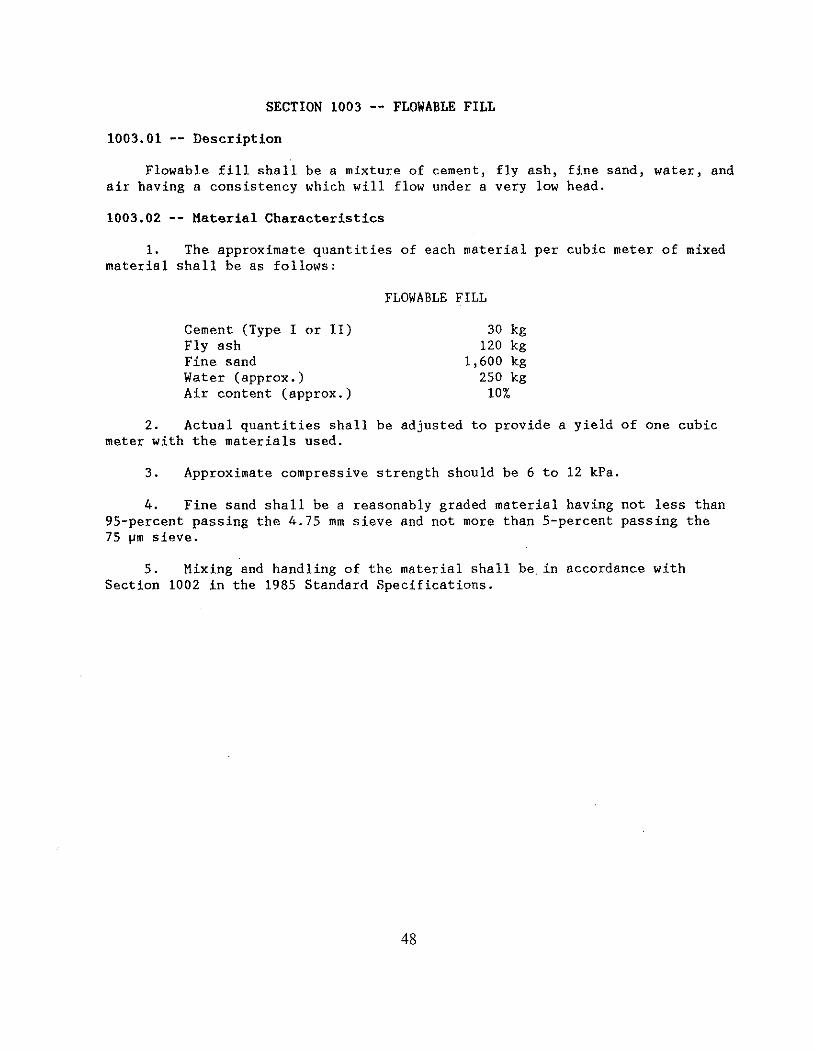
SECTION 1003 -- FLOW ABLE FILL
1003.01 -- Description
Flowable fill shall be a mixture of cement, fly ash, fine sand, water, and air having a consistency which will flow under a very low head.
1003.02 Material Characteristics
1. The approximate quantities of each material per cubic meter of mixed material shall be as follows:
Cement (Type I or II) Fly ash Fine sand Water (approx.) Air content (approx.)
FLOWABLE FILL
30 kg 120 kg
1,600 kg 250 kg
10%
2. Actual quantities shall be adjusted to provide a yield of one cubic meter with the materials used.
3. Approximate compressive strength should be 6 to 12 kPa.
4. Fine sand shall be a reasonably graded material having not less than 95-percent passing the 4.75 mm sieve and not more than 5-percent passing the 75 ~m sieve.
5. Mixing and handling of the material shall be. in accordance with Section 1002 in the 1985 Standard Specifications.
48

APPENDIX B: BARRIER VII Simulation Input
49
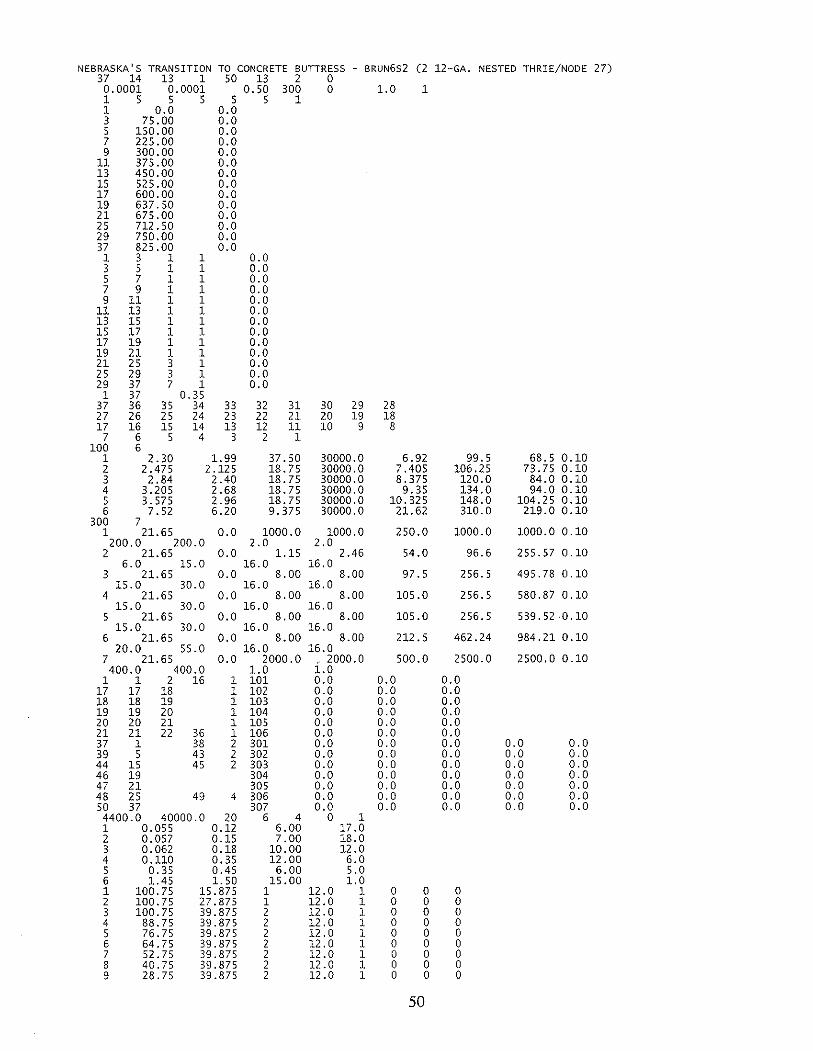
NEBRASKA'S TRANSITION TO CONCRETE BUTTRESS BRUN6S2 (2 12-GA. NESTED THRIE/NODE 27) 37 14 13 1 50 13 2 0 0.0001 0.0001 0.50 300 0 1.0 1 1 5 5 5 5 5 1 1 0.0 0.0 3 75.00 0.0 5 150.00 0.0 7 225.00 0.0 9 300.00 0.0
11 375.00 0.0 13 450.00 0.0 15 525.00 0.0 17 600.00 0.0 19 637.50 0.0 21 675.00 0.0 25 712.50 0.0 29 750.00 0.0 37 825.00 0.0 1 3 1 1 0.0 3 5 1 1 0.0 5 7 1 1 0.0 7 9 1 1 0.0 9 11 1 1 0.0
11 13 1 1 0.0 13 15 1 1 0.0 15 17 1 1 0.0 17 19 1 1 0.0 19 21 1 1 0.0 21 25 3 1 0.0 25 29 3 1 0.0 29 37 7 1 0.0
1 37 0.35 37 36 35 34 33 32 31 30 29 28 27 26 25 24 23 22 21 20 19 18 17 16 15 14 13 12 11 10 9 8
7 6 5 4 3 2 1 100 6
1 2.30 1. 99 37.50 30000.0 6.92 99.5 68.5 0.10 2 2.475 2.125 18.75 30000.0 7.405 106.25 73.75 0.10 3 2.84 2.40 18.75 30000.0 8.375 120.0 84.0 0.10 4 3.205 2.68 18.75 30000.0 9.35 134.0 94.0 0.10 5 3.575 2.96 18.75 30000.0 10.325 148.0 104.25 0.10 6 7.52 6.20 9.375 30000.0 21.62 310.0 219.0 0.10
300 7 1 21.65 0.0 1000.0 1000.0 250.0 1000.0 1000.0 0.10
200.0 200.0 2.0 2.0 2 21.65 0.0 1.15 2.46 54.0 96.6 255.57 0.10
6.0 15.0 16.0 16.0 3 21.65 0.0 8.00 8.00 97.5 256.5 495.78 0.10
15.0 30.0 16.0 16.0 4 21.65 0.0 8.00 8.00 105.0 256.5 580.87 0.10
15.0 30.0 16.0 16.0 5 21.65 0.0 8.00 8.00 105.0 256.5 539.52 -0.10
15.0 30.0 16.0 16.0 6 21.65 0.0 8.00 8.00 212.5 462.24 984.21 0.10
20.0 55.0 16.0 16.0 7 21. 65 0.0 2000.0 . 2000.0 500.0 2500.0 2500.0 0.10 400.0 400.0 1.0 1.0
1 1 2 16 1 101 0.0 0.0 0.0 17 17 18 1 102 0.0 0.0 0.0 18 18 19 1 103 0.0 0.0 0.0 19 19 20 1 104 0.0 0.0 0.0 20 20 21 1 105 0.0 0.0 0.0 21 21 22 36 1 106 0.0 0.0 0.0 37 1 38 2 301 0.0 0.0 0.0 0.0 0.0 39 5 43 2 302 0.0 0.0 0.0 0.0 0.0 44 15 45 2 303 0.0 0.0 0.0 0.0 0.0 46 19 304 0.0 0.0 0.0 0.0 0.0 47 21 305 0.0 0.0 0.0 0.0 0.0 48 25 49 4 306 0.0 0.0 0.0 0.0 0.0 50 37 307 0.0 0.0 0.0 0.0 0.0 4400.0 40000.0 20 6 4 0 1 1 0.055 0.12 6.00 17.0 2 0.057 0.15 7.00 18.0 3 0.062 0.18 10.00 12.0 4 0.110 0.35 12.00 6.0 5 0.35 0.45 6.00 5.0 6 1.45 1. 50 15.00 1.0 1 100.75 15.875 1 12.0 1 0 0 0 2 100.75 27.875 1 12.0 1 0 0 0 3 100.75 39.875 2 12.0 1 0 0 0 4 88.75 39.875 2 12.0 1 0 0 0 5 76.75 39.875 2 12.0 1 0 0 0 6 64.75 39.875 2 12.0 1 0 0 0 7 52.75 39.875 2 12.0 1 0 0 0 8 40.75 39.875 2 12.0 1 0 0 0 9 28.75 39.875 2 12.0 1 0 0 0
50

10 16.75 39.875 2 12.0 1 0 0 0 11 -13.25 39.875 3 12.0 1 0 0 0 12 -33.25 39.875 3 12.0 1 0 0 0 13 -53.25 39.875 3 12.0 1 0 0 0 14 -73.25 39.875 3 12.0 1 0 0 0 15 -93.25 39.875 3 12.0 1 0 0 0 16 -113.25 39.875 4 12.0 1 0 0 0 17 -113.25 -39.875 4 12.0 0 0 0 0 18 100.75 -39.875 1 12.0 0 0 0 0 19 69.25 37.75 5 1.0 1 0 0 0 20 -62.75 37.75 6 1.0 1 0 0 0 1 69.25 32.75 0.0 608. 2 69.25 -32.75 0.0 608. 3 -62.75 32.75 0.0 492. 4 -62.75 -32.75 0.0 492. 1 0.0 0.0 3 731.25 0.0 25.0 62.14 0.0 0.0 1.0
51

APPENDIX C: Accelerometer Data Analysis - Test NEBT-l
Figure C-l. Lateral Deceleration, Test NEBT-l.
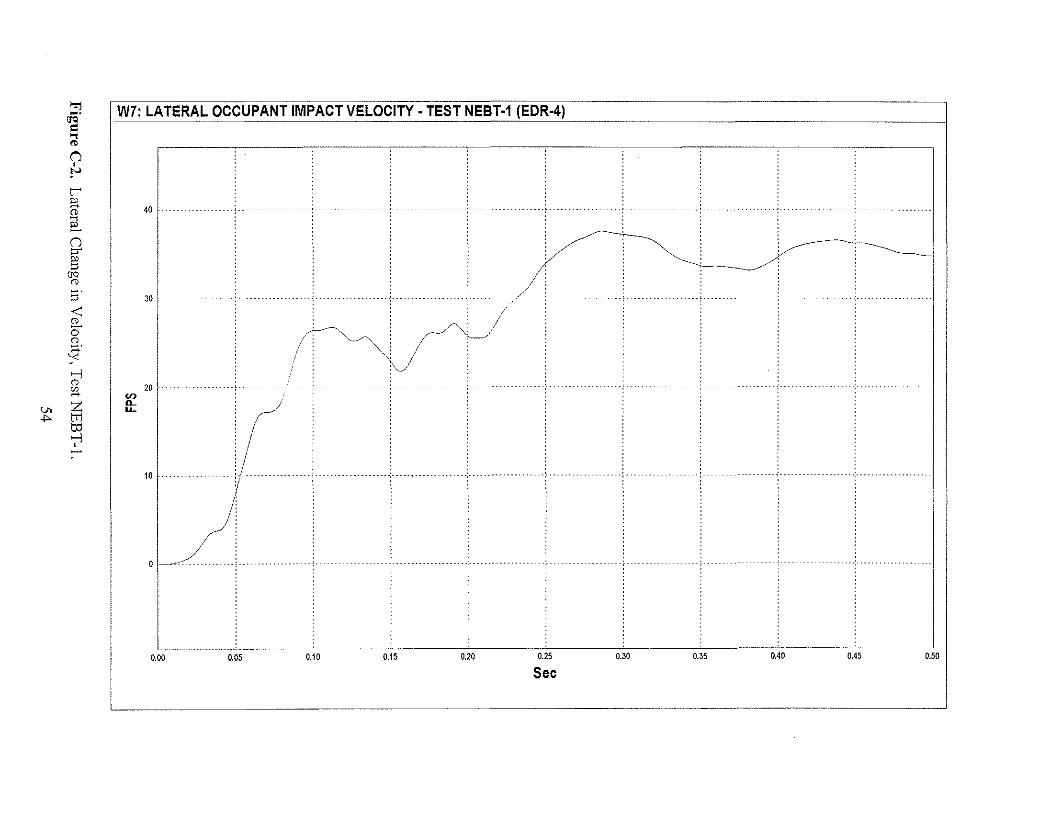
Figure C-2. Lateral Change in Velocity, Test NEBT-l.
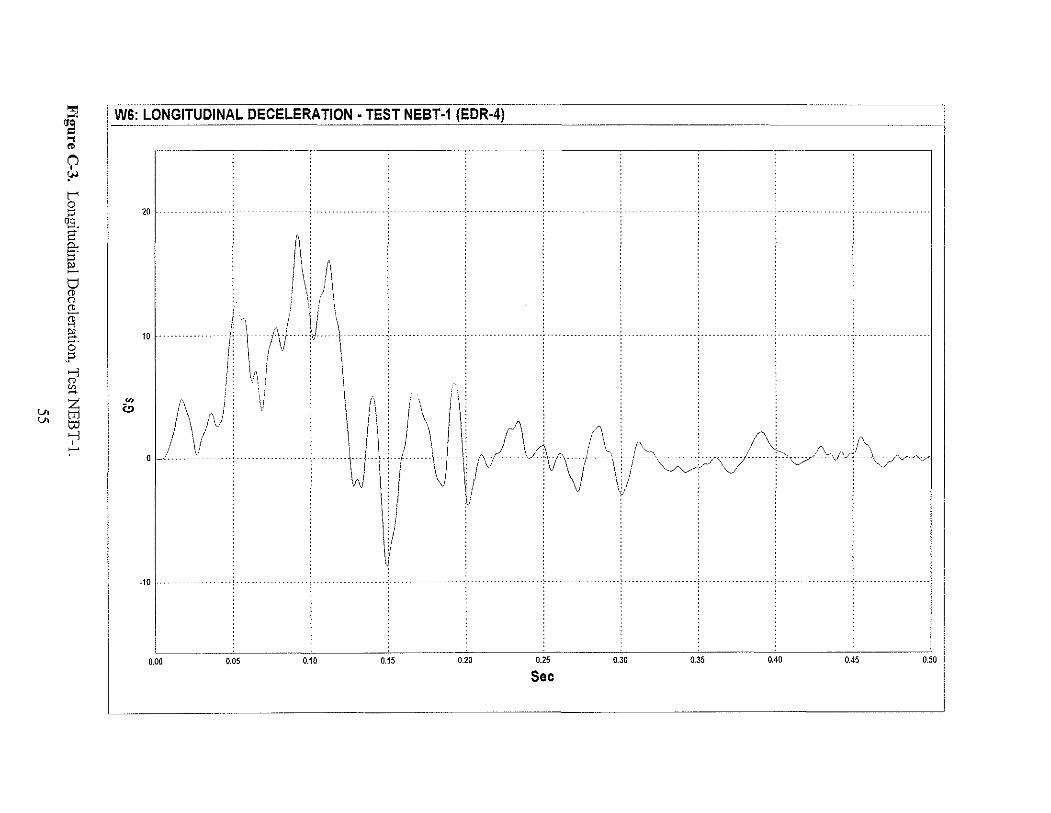
Figure C-3. Longitudinal Deceleration, Test NEBT-l.
Figure C-4. Relative Longitudinal Change in Velocity, Test NEBT-l.
52

..., ~· <1<l ~ ... '" (") ' ..... r< "' ~ (1) ..., e. v (1) () (1)
" ..., ~ c;· ? >-l (1)
"' ~ z tr1 to >-l ' \Jo -<.»
W6: LATERAL DECELERATION- TEST N.::.::EccB_T_:_·_:_1 ('-=E=-DR:.::..-24) ____________________ 1
•
"-···· ·.~ T r I 1\
········--'·-··-·--------··----··-- ·--·--·---------' ------------------:---- ---------------'-----········
i: I : 1i
I \ /\ . I\ .. A, ,, 10 -- ........ · .................... ; - . - - - - - - - - - - - - - - - - ~ -- .
0 .
~ \f\\1 I
" 1.=-.. ---·-:c::------'-· -~: .. :: __ : _____ . __ ·. ·_·_ ... '-... _ ... _ ... _ ... _ ... _ .. ·~ ... ,--.. ·_· _·. ·_·. ·_··_.-c ... c.,.._._ .. _·· .. ·_·_·.·-·~· ,.....· .. _ ... _ ... _ .. _·-c· ... -:---... _· _· ·_·. ·~·,--· _· __ .......,-l
- ~ ~o ~· ~ m g = w w g
Sec
>-.j
~· W7: LATERAL OCCUPANT IMPACT VELOCITY· TEST NEBT-1 (EDR-4) = .., ., () ' !"
" p ~
0 40 -------------------'----..., ,__ () ::r "' ::>
(]Q
"'
.. ~: ~.~~ . . . . -...__/' .
~~-- : : . . . . . . I ; ; ; : ;
::> 30 . ·'···················-'··
< "' 0 s. ~
'<
>-l
: : l // /'t~,~~J~/
l : ' : : / : ,, :
/ : : : . . . 0
"' ~ Vl z .,. tTl
to >-l ' ~
"' "I
~" /~/ . . .· ...... , ..
/) 0 -~0------·····-··<····
U__ __ '----------._~~~--'-------------'--------0,00 0.05 0.10 0.15 0.20 0.25 0.30 0.35 0.40 0.45 0.50
Sec
""! ~· crQ ~ ... " ("'] ' ~ l' 0 0
OQ a· 8: 0 e:. I:) (l) () (l)
if §-. 0 ? >-3 "' "' -
u, z tr:l u, tJj >-3 ' ~
I W6: LONGITUDINAL DECELERATION. TEST NEBT-1 (EDR-4)
20 --
10·
/\_;J
\! 0 ---------------··
-10 ..
0.00 0.05
' ' ' --- -------- -. ····················-- ···-··························---------- ---- - --, --·---- -- ---- -----
I ,I
0.10 0.15 0.20 0.25
Sec 0.30 0.35 0.40 0.45 0.50

"'l ~· <J<>
= ... "' (') ' f"
?;:!
" ~-" t-< 0
= ()Q ::;·
" 9: = £".. () ::r' g;
()Q
" = Vl < 0\ 0
0 () ::;· ::< >-1
" "' ~ z tTJ to >-1 ' -
W7: LONGITUDINAL OCCUPANT IMPACT VELOCITY- TEST NEBT-1 (EDR-4)
'T I
JO l ........... .
20 ................ --' --
I I
... / I: !
L_____ ______ ~--· ·-~c--------:-"~--0.00 0.05 0.10 0.15 0.20 0.25
Sec 0.30 0.35 0.40 0.45 0.50