NCHRP PROJECT 20-24 ALTERNATIVE DOT...
58
NCHRP PROJECT 20-24 (83): ALTERNATIVE DOT ORGANIZATIONAL MODELS FOR DELIVERING SERVICE Prepared for: American Association of State Highway and Transportation Officials (AASHTO) Subcommittee on Organizational Management (SOOM) Prepared by: Craig Secrest and Joe Crossett High Street Consulting Group, LLC Chevy Chase, MD Jessie Huang ICF International Fairfax, VA August 2012 The information contained in this report was prepared as part of NCHRP Project 20-24, Task 83, National Cooperative Highway Research Program. SPECIAL NOTE : This report IS NOT an official publication of the National Cooperative Highway Research Program, Transportation Research Board, National Research Council, or The National Academies.
Transcript of NCHRP PROJECT 20-24 ALTERNATIVE DOT...
NCHRP PROJECT 20-24 (83):
ALTERNATIVE DOT ORGANIZATIONAL MODELS
FOR DELIVERING SERVICE
Prepared for:
American Association of State Highway and Transportation Officials (AASHTO)
Subcommittee on Organizational Management (SOOM)
Prepared by:
Craig Secrest and Joe Crossett High Street Consulting Group, LLC
Chevy Chase, MD
Jessie Huang ICF International
Fairfax, VA
August 2012 The information contained in this report was prepared as part of NCHRP Project 20-24, Task 83,
National Cooperative Highway Research Program.
SPECIAL NOTE: This report IS NOT an official publication of the National Cooperative
Highway Research Program, Transportation Research Board, National Research Council, or The
National Academies.

Acknowledgements This study was conducted for the American Association of State Highway and Transportation Officials (AASHTO) Subcommittee on Organizational Management (SOOM), with funding provided through the National Cooperative Highway Research Program (NCHRP) Project 20-24(83), Alternative DOT Organizational Models for Delivering Service. The NCHRP is supported by annual voluntary contributions from the state departments of transportation. Project 20-24 is intended to fund quick response studies on behalf of Chief Executive Officers (CEOs) and other top managers of DOTs. The report was prepared by Craig Secrest and Joe Crossett of High Street Consulting Group and Jessie Huang of ICF International. The work was guided by a technical working group. The project was managed by Andrew Lemer, NCHRP Senior Program Officer. Disclaimer The opinions and conclusions expressed or implied are those of the research agency that performed the research and are not necessarily those of the Transportation Research Board or its sponsoring agencies. This report has not been reviewed or accepted by the Transportation Research Board Executive Committee or the Governing Board of the National Research Council.
Table of Contents
1.0 Executive Summary..................................................................................... 1
2.0 Introduction .................................................................................................. 7
2.1 Why Organizational Design Matters ..................................................... 8
2.2 Study Approach .................................................................................... 9
2.3 Report Structure .................................................................................... 11
3.0 Drivers of State DOT Organizational Change .......................................... 12
3.1 Five Contemporary Drivers of Organizational Change .................... 12
4.0 Characteristics of State DOT Organizational Design .............................. 17
4.1 Silo-based versus Workflow-based DOTs .......................................... 17
4.2 Centralized versus Decentralized DOTs ............................................. 19
4.3 In-house vs. Outsourced DOTs............................................................ 20
5.0 Current Trends in Organizational Adaptation ......................................... 22
5.1 Move Toward Hybrid Silo/Workflow-based Organizations .............. 22
5.2 Centralized versus Decentralized Organizations .............................. 24
5.3 In-house versus Outsourced Organizations ...................................... 28
5.4 Other Organizational Approaches..................................................... 31
6.0 Running More Like a Business – A New Organizational Ideal? ............. 33
7.0 Keys to Successful Organizational Adaptation ...................................... 35
7.1 Strong CEO and Senior Leadership .................................................... 35
7.2 Keep it Simple ...................................................................................... 35
7.3 Carefully Consider the Scope of Change ......................................... 35
7.4 Establish the “team you need” to achieve change ......................... 36
7.5 Invest in Change .................................................................................. 36
8.0 Considerations for Follow-on Research................................................... 37
References ........................................................................................................ 38
Appendix – Survey Results ............................................................................. A-1
1
1.0 Executive Summary
AASHTO’s influential ‘The Changing DOT’ report – written almost fifteen
years ago - depicts state transportation agencies increasingly looking to
strategic management practices borrowed from the private sector. The
report’s predictions suggested future agencies’ management priorities
would revolve around: 1) a focus on their customers’ needs, 2)
collaboration with partners, 3) downsizing and de-centralization of
workforces, and 4) re-orientation of business process activities to improve
schedule, cost, and quality.
Today, strategic management has gone from being a front-page headline
in a high profile industry report to an accepted way of doing business
among DOTs. Most DOTs have at least begun to use performance metrics
and they are clearly here to stay. State DOTs today also say they have
successfully institutionalized a focus on customers and partnerships,
streamlined business processes, and already reaped much of the low
hanging fruit when it comes to administrative and workplace efficiencies.
Despite considerable change over the last fifteen years, DOT
organizational design thinking continues to evolve. In particular, the
current economic climate and associated shortage of resources is driving
agencies to replace a call for ‘strategic management’ with an emphasis on
thinking about DOTs’ challenges in terms of private sector ‘change
management’ practices that necessitate organizational restructuring to
survive and succeed in today’s difficult environment.
1.1 Study Purpose and Focus
This report provides a big picture snapshot of why and how DOT leaders
are re-designing their organizations. It includes a discussion of the
primary drivers of these changes, characterizes the current state of DOT
organizational design, describes the prominent organizational adaptations
DOTs are making or plan to make, presents a new organizational ideal for
DOTs, and offers observations about key success factors for initiating
meaningful organizational change.
1.2 Drivers of State DOT Organizational Change
State DOTs today are often portrayed as less of a community of
homogenous agencies, structured to deliver highway projects than they

2
were in the past. Nonetheless, most DOTs appear to share some or all of
five important drivers for organizational change:
Pressure for Government Efficiency Gains – State DOTs are
being pushed to achieve greater ‘government efficiency’ and ‘do
more with less.’ This is occurring as agencies roles are growing,
staffing levels are being cut, and there is increased pressure to
outsource. Together, these considerations are pushing DOTs to find
ways to save costs in the delivery of services and even to re-examine
what services they provide.
Demands for Performance Accountability – The demand for
‘performance accountability’ has clearly grown over the last decade
and is having significant impacts on DOT organizational structures.
Several state DOT leaders emphasized that they are using
performance measurement to help manage the organizational
direction of their agencies and observed that Congress is likely to
drive an even greater focus on accountability and performance-
based decision making in the future.
Improved Project Delivery – An emphasis on ‘improved project
delivery’ is a major driver of organizational change within many
agencies. Several interviewed DOT leaders emphasized the
importance of breaking down organizational ‘silos’ inside their
agencies as a way to improve project delivery.
Revenue Shortfalls – The combination of aging infrastructure,
growing congestion, cost escalation, shrinking revenues, weak
economic conditions, and high fuel costs are worsening DOTs’
revenue shortfalls as system users choose more fuel-efficient
vehicles and scale back travel, forcing DOTs to re-think their roles
and organizational structures.
Importance of Agency Credibility – DOT CEOs stressed the
vital importance of ensuring agency credibility with state
legislatures, specific stakeholders, and the public. Gaining
credibility often means ensuring organizational structures meet
stakeholder expectations.
1.3 Characteristics of State DOT Organizational Design
A review of DOTs’ organizational models suggests that many agencies
share three common dimensions of organizational structure, although
each DOT can be found at different points along the continuum of each
dimension:

3
Silo-based versus Workflow-based DOTs – Most DOTs favor
functional organizational designs with separate groupings or ‘silos’ for
various activities. A functional structure emphasizes top down
management control over groupings divided by skill sets, with work
passed ‘over the wall’ to the next silo. On the other end of the spectrum,
a few DOTs have workflow-based organizational structures, where
teams composed of employees with diverse skill sets are held
accountable for final product delivery instead of for functional
responsibilities related to elements of product delivery. In between
these two approaches are “matrix structures” that share a mix of
features from both vertical and horizontal structures.
Centralized versus Decentralized DOTs – This dimension
pertains to the allocation of resources and distribution of authority
between a single central office and multiple regions or districts. In
centralized DOTs, the headquarters controls and performs most non-
construction and maintenance functions and knowledge, skills, and
resources with respect to specific activities are consolidated. In
decentralized operations, a DOT’s field offices have much greater
autonomous decision-making power over functions like design,
communications, fleet management, and public engagement.
In-house vs. Outsourced DOTs – This dimension describes the
extent to which DOT functions and activities are retained in-house or
outsourced to other entities including the private sector and local
governments. Traditional state DOT structures rely on internal staff to
perform most agency functions (other than construction). Outsourced
DOTs are agencies that maximize the use of private contractors,
consultants, and partners (as well other public agencies) to perform or
support agency functions.
Most state DOTs began life in the early 20th century as vertical,
functionally organized, centralized, organizations that relied on in-house
expertise for most tasks. They looked a lot alike. As the 21st century gets
underway, however, DOTs increasingly are experimenting with matrix or
horizontal organizational structures that decentralize decision-making
around workflows and take advantage of new communication
technologies.
1.4 Current Trends in Organizational Adaptation
To an increasing extent, DOTs take exception to ‘one size fits all’
descriptions; each DOT CEO follows his or her own unique path in setting
4
direction for organizational design that matches the special challenges
they face. None-the-less, our team’s research suggests three broad trends
are driving organizational change across many DOTs:
There is a shift toward hybrid silo/workflow-based
organizational designs that promote nimbleness, efficiency,
and innovation. Most agencies identify themselves as having either
‘functional’ or ‘hybrid leaning functional’ organizational structures.
While a large majority of DOTs expect to shift toward workflow-based
structures in the future, they are layering this approach over a
traditional silo structure. The anticipated benefits associated with this
shift include a reduced ‘over the wall’ mentality, nimble
responsiveness, better alignment with generational work culture
changes, and greater employee empowerment. Some of the ways DOTs
are becoming more team based include establishing multi-disciplinary
teams, creating cross functional project managers, conducting team-
based training, enhancing employee empowerment, and re-framing
agency missions.
DOTs are ‘re-centralizing’ some key functions to ensure
efficiency and consistency, and to refocus on the core
mission. Most DOTs favor a mix of centralization and
decentralization, and while about half of the DOTs that participated in
the study favor semi-decentralized models (i.e., districts or regions
have a high degree of autonomy), the emphasis on decentralization is
waning. Instead many agencies are now selectively re-centralizing
command-related functions while decentralizing delivery. The
anticipated benefits associated with this ‘selective approach’ include
better program consistency, enhanced policy alignment, reduced costs,
and improved communications. Some of the ways DOTs are achieving
this change include centralizing policy, command, administrative, and
communication functions/ controls, while moving project delivery
closer to the customer.
Increased interest in outsourcing as a means for operating
effectively in a lean fiscal environment. DOTs are generally
outsourcing and privatizing more than in the past and expect to do so
even more in the future. At the same time, it should be noted that CEOs
are concerned about the implications of aggressive outsourcing due to
its potential impacts on succession planning, retaining core
knowledge/ expertise, and cost effectiveness. The identified benefits of
this trend include the ability to respond to headcount reductions,
broader access to talent, a more adjustable workforce, greater

5
administrative flexibility, and a potentially improved performance-
focus. Some ways DOTs are changing their use of in-house resources,
outsourcing, and privatization include leveraging the private sector’s
unique skill sets and bench strength, maintaining ‘baseline capabilities’
in-house while outsourcing for needs beyond baseline, outsourcing
non-core functions, and broadening use of public private partnerships.
1.5 Running More Like a Business – A New Organizational Ideal?
The notion that public agencies - and DOTs in particular - should operate
more like a business is certainly not new. What is different now is the
widespread recognition that DOTs need to change how they operate and
the sense of expediency associated with doing so – the need for
transformation to more business-like organizational models has shifted
from being a leadership prerogative to a survival imperative. While not a
perfect analogy, comparisons can be drawn between the current
organizational direction of state DOTs and “change management”
initiatives pursued in the private sector that include:
Restructuring organizational hierarchies to be more agile and
responsive to a changing market;
Assessing operations and refocusing on mission-critical activities;
Aggressively cutting costs and waste through staff reductions,
rationalization of assets, outsourcing, and business process
reengineering; and
Improving transparency, accountability, risk management, and
communications.
Not surprisingly, DOTs appear to be responding to their changing
environments by recreating and refocusing themselves along the same
lines that private sector entities respond to a declining bottom line. Based
on the project research, this response is defining a new DOT
‘organizational ideal’ that can be characterized by the following:
Reduced Agency Size – DOTs are becoming smaller, leaner, and
more nimble through downsizing and organizational flattening.
Refined Mission – DOTs are shifting their philosophy from “yes we
can” to “doing less with less,” which means focusing resources on
critical functions, and spinning off or simply eliminating non-core
functions.

6
Diversified Service Delivery Strategies – DOTs are striving to
deliver projects and programs faster, better, and cheaper. These efforts
include increased use of outsourcing and privatization as well as non-
traditional approaches to using internal resources.
Performance Focus – DOT leaders are not taking even their existing
funding for granted and are constantly working to build and maintain
agency credibility. This includes reshaping agencies to support
performance measurement and improve accountability.
Improved Risk Management – DOTs are beginning to use
comprehensive risk management approaches at the enterprise,
program, and project levels to help identify and respond to the
inherent uncertainties of managing a complex organization.
1.6 Final Observations
A few overarching principles emerged from our discussions with CEOs as
critical to the success of efforts to adapt or change organizational
structures for state DOTs and help agencies better align their
organizations with strategic goals and objectives:
Strong CEO and senior leadership is needed;
Keep the message about the initiative simple and use straightforward
metaphors to communicate goals for organizational change;
Carefully consider the appropriate scope of change based on factors
such as the goals of the change management initiative, the time
available for planning and transition, the agency’s culture and nature,
the agency’s unique legal and institutional parameters, and the
mandate for change (both internally and externally);
Establish the “team you need” to achieve change; and
Be ready to invest in change, including spending on training, outreach,
and management systems.

7
2.0 Introduction
AASHTO’s influential ‘The Changing DOT’ report – written almost fifteen
years ago – depicts state transportation agencies increasingly looking to
strategic management practices borrowed from the private sector as a
guide for undertaking what is characterized as a “reinvention of
government” in response to “continuous, permanent change, as distinct
from one-time initiatives.” (AASHTO, 1998)
The Changing DOT report’s predictions about the twenty-first century
DOT suggested agencies’ management priorities would revolve around: 1)
a focus on their customers’ needs, 2) collaboration with partners like local
governments and MPOs, 3) downsizing and de-centralization of
workforces, and 4) re-orientation of business process activities to improve
schedule, cost, and quality.
Some of the organizational reinventions highlighted in The Changing DOT
as tools for managing strategically include use of performance metrics to
provide accountability; targeted staffing cuts to reduce costs and
inefficiency; decentralization of responsibility that puts project delivery
functions closer to the customer; streamlining of project delivery processes
to cut costs and improve quality; and use of state gas tax increases,
leverage from private sector finances, and outsourcing to help pay for
growing programs.
So how do The Changing DOT’s predictions of the future made in 1998
hold up? Strategic management has gone from being a front-page headline
in a high profile industry report to an accepted way of doing business
among DOTs. Most DOTs have at least begun to use performance metrics
and they are clearly here to stay. State DOTs today also say they have
successfully institutionalized a focus on customers and partnerships,
streamlined business processes, and already reaped much of the low
hanging fruit when it comes to administrative and workplace efficiencies.
Many of the driving forces DOTs faced in the mid-1990s are surprisingly
similar to those DOT CEOs still worry about today like “stove piping,”
“budget limitations,” “program proliferation,” “customer expectations,”
and “legislative accountability.” In terms of setting a future direction, the
DOT community generally seems to have gotten it right, but DOTs also
underestimated the massive scale of change needed. Can anyone imagine
an environment today where more than half of all DOTs are able to rely on

8
state gas tax increases to help fix their problems as was described in
AASHTO’s 1998 report?
Despite considerable change over the last fifteen years, DOT
organizational design thinking continues to evolve. This report identifies a
conceptual framework for the next generation of organizational models
that DOTs must adopt to stay effective. Like The Changing DOT, it
borrows from the business world, but replaces a call for ‘strategic
management’ with an emphasis on thinking about DOTs’ challenges in
terms of private sector ‘change management’ practices that necessitate
organizational restructuring.
2.1 Why Organizational Design Matters
An underlying premise of The Changing DOT is that DOTs operate in a
constantly shifting business environment; this holds even truer today.
Pressure to make government more efficient and more accountable,
shrinking gas tax revenues, and a shift from building to maintaining the
Interstate system are some of today’s biggest external drivers for change in
DOTs. In response, DOT leaders are constantly working to adapt the
organizational design of their agencies to the evolving business
environment. In a survey of DOT CEOs conducted as part of the research
for this project, 20 of the 27 DOTs that responded are considering or
undertaking efforts to adapt their organizational structures and
approaches to delivering critical programs and services.
In business, organizational structure is widely recognized as the vehicle
through which business strategy is executed and accordingly,
organizational design is viewed as a critical business activity for ensuring
customers’ expectations are met. (Deloitte, 2008) In a state DOT,
organizational design has a significant impact on its ability to plan, build,
operate, and maintain statewide transportation networks that meet the
demands of its users. (NCHRP, 2008)
A DOT’s ‘organizational design’ refers to the way in which its
organizational responsibilities and reporting authority are aligned
vertically and horizontally and made consistent with capabilities of its
staff. (SHRP, 2011) Organizational design is one of four important
elements that together determine a DOT’s overall institutional capability
to perform its prescribed roles and responsibilities. Other elements that
determine the institutional capability of a DOT include ‘culture and
leadership,’ ‘resource allocation,’ and ‘partnerships.’ (SHRP, 2011)

9
This report provides a big picture snapshot of why and how DOT leaders
are re-designing their organizations. It also offers a roadmap for current
themes and topics of particular interest to the Subcommittee on
Organizational Management (SOOM) of AASHTO’s Standing Committee
on Performance Management, which was established to provide a forum
for tackling organizational change topics.
2.2 Study Approach
Literature Review – The High Street Team prepared a targeted review
and synthesis of the literature that focused on gathering relevant
information about traditional and emerging organizational design
typologies within DOTs and the pressures that are driving DOTs to
consider and implement new organizational structures. Results were
summarized in a Technical Memo and are incorporated throughout this
final report.
Initial CEO Interviews – To supplement the findings from the
literature review and inform development of an electronic survey the High
Street Team conducted a series of phone interviews with selected current
and past DOT senior executives. Interviewees included:
Stan Gee (NYSDOT)
Paula Hammond (WSDOT)
John Halikowski (AZDOT)
Kirk Steudle (MIDOT)
Deb Miller (Former KDOT
Secretary)
Prior to the interview, each CEO was provided with a short set of questions
related to organizational issues.
Electronic Survey – The project team developed a 27 question
electronic DOT survey geared toward CEO-level respondents. Survey
content was informed by the literature review and five DOT CEO
interviews. The survey was reviewed by the NCHRP project panel. (A copy
of the electronic survey results is included in the Appendix.)
State DOT CEOs for all 52 AASHTO members were invited via an email
from AASHTO’s Executive Director to complete the electronic survey
using an online instrument (surveymonkey.com). AASHTO’s invitation
was sent on February 21, 2012 and a follow-up reminder email was sent on
March 13. The survey was closed on March 19. Twenty-seven State DOTs
responded to the survey including one anonymous response. (See Figure
1.)

10
Follow-up Interviews – To supplement the electronic survey findings,
the High Street Team conducted an additional round of phone interviews
with the following state DOT CEOs and senior executives:
Shailen Bhatt (DelDOT)
Mara Campbell (MoDOT)
Gene Conti (NCDOT)
John Halikowski (AZDOT)
Michael Lewis (RIDOT)
Joan McDonald (NYSDOT)
Brian Ness (ID DOT)
John Njord (UTDOT)
Ananth Prasad (FLDOT)
Kirk Steudle (MIDOT)
Keith Golden (GADOT)
Prior to their interviews, each CEO was provided with a short set of
questions related to organizational issues.
Figure 1. DOT Survey Respondents
State Name Title
Alabama John R. Cooper Transportation Director
Alaska Marc Luiken Commissioner
Arizona John Halikowski Director
Arkansas Scott Bennett Director
Colorado Don Hunt Executive Director
Delaware Shailen Bhatt Secretary
District of Columbia Terry Bellamy Director
Florida Ananth Prasad Secretary
Hawaii Alvin Takeshita Division
Idaho Brian W. Ness Director
Kansas Barbara Rankin Acting Secretary
Maine David Bernhardt Commissioner
Massachusetts Richard Davey Secretary and CEO
Michigan Kirk Steudle Director
Mississippi Melinda McGrath Executive Director
Missouri Mara Campbell Dir. of Customer Relations
New Hampshire C. Clement, Sr. Commissioner
New York Joan McDonald Commissioner
North Carolina Gene Conti Secretary
Oregon Matthew Garrett Director
Rhode Island Michael P. Lewis Director
South Carolina Robert St Onge Secretary
South Dakota Darin Bergquist Secretary
Utah John Njord Executive Director
Vermont Brian Searles Secretary
Wisconsin Mark Gottlieb Secretary

11
2.3 Report Structure
This report has six chapters:
Introduction – An overview of the project purpose;
Drivers of State DOT Organizational Change – A review of the
principal factors affecting organizational design in DOTs today;
Organizational Characteristics of DOTs – A summary of primary
organizational characteristics of DOTs;
Critical Trends in Organizational Adaptation – A summary of how
individual DOTs are making changes in organizational design;
Running More Like a Business – A New Organizational Ideal? –
Conclusions about the future organizational direction for DOTs;
Keys to Success – Factors that affect the success of DOTs’ efforts to
make organizational changes; and
Considerations for Follow-on Research – Based on research
conducted, ideas for follow-on research.
12
3.0 Drivers of State DOT Organizational Change
In this chapter, we review the drivers that DOTs view as today’s major
influences on organizational design within their agencies. The Changing
DOT provides a helpful benchmark for how the major influences on DOTs
have changed over time. Pressure to become more customer-focused and
to be multimodal transportation providers has largely been conquered. By
contrast, meeting funding challenges and the need to be accountable have
only grown. As discussed below, much of what drives organizational
design within DOTs today stems from harsh economic conditions and
heightened expectations of accountability.
3.1 Five Contemporary Drivers of Organizational Change
State DOTs today are often portrayed as less of a community of
homogenous agencies, structured to deliver highway projects than they
were in the past. Instead, each state DOT is viewed as creating its own
unique ‘transportation provider’ mission, organization, and culture in
response to its own customer expectations, financial resources, political
landscape, and physical context. Nonetheless, our interviews and survey of
state DOT CEOs suggest most DOTs share some or all of five important
drivers for organizational change that reflect current political and
economic realities (additional drivers are identified in the survey findings
contained in the Appendix):
1. Pressure for government efficiency gains;
2. Demands for performance accountability;
3. Need for improved project delivery capabilities;
4. Revenue shortfalls; and
5. Importance of agency credibility.
The drivers of organizational change described in this chapter were
identified via a combination of a review of current literature, interviews
with selected DOT CEOs, and results from an electronic survey that
generated responses from 27 state DOTs. The identified five drivers of
change are noticeably synergistic: better efficiency in areas like project
delivery, for example, helps DOTs become more accountable and gain
credibility while managing through revenue shortfalls.
Pressure for Government Efficiency Gains – Fifteen out of 27
respondents to the High Street Team’s electronic survey of DOT CEOs

13
indicate ‘government efficiency’ is a major driver of organizational
change within their agency; it was the most frequently cited reason by
survey respondents for organizational change. Interest in efficiency
within government is not new, but it appears to be surging alongside a
revived political debate about the general role and size of government,
and the perceived benefit of using internal public resources versus
external private contractors.
Many of the state DOT leaders interviewed as part of the project talk
about demands for greater efficiency in terms of a growing pressure on
their agencies ‘to do more with less.’ This phrase is shorthand for the
complex challenge of continuing to manage aging and congested
transportation infrastructure and systems despite workforce and
spending cuts. Several of the agencies we spoke with note that their
roles have grown over time – with added focus on public engagement
and non-highway modes, for example – while they have experienced
considerable staff cuts.
Embedded within the focus on greater government efficiency is the
expansion of agency efforts to replace internal staff with contractors.
For some agencies, increased outsourcing has been a result of
legislated mandates and/or political pressure to ‘to better leverage the
private sector.’ For other agencies, the move to outsourcing has been
one of necessity as they strive to deliver expanding roles with static or
reduced headcounts.
The magnitude of staff reductions in recent years is startling. The New
York DOT has reduced staff from around 10,000 to 8,500. At the
Michigan, Missouri, and North Carolina DOTs, leaders have recently
cut staff by 15 to 20 percent. The Utah DOT has seen its staff fall from
2,000 to 1,645 people, the Georgia DOT is currently being pressured by
its state legislature to restructure and reduce headcount from 4,500 to
3,500 people, and the Louisiana DOTD has shrunk from 7,200 to
4,500 employees. If there is one clear organizational trend at state
DOTs, it is that they are getting considerably smaller.
Organizational changes are almost a necessity for agencies with
shrinking workforces that are faced with a pressure to do more with
less. In Arizona, for example, Director John Halikowski is finding ways
for the DOT to become more efficient both by solving some problems at
a lower level, such as via its locally-based community relations officers

14
and by centralizing other functions such as human resources and
information technology (IT).
The challenge of making government efficiency gains pushes DOTs to
find ways to save costs in the delivery of services and even to re-
examine what services they provide; often this means organizational
changes.
Demand for Performance Accountability – Just behind
‘government efficiency’ in the minds of DOT CEOs as a driver for
organizational change is a growing demand for ‘performance
accountability.’ Twelve out of 27 respondents to the High Street Team’s
electronic survey indicate ‘performance accountability’ is a major
driver of organizational change within their agency. This result is
consistent with the fact that performance measurement has emerged as
a widely embraced management tool among state DOTs over the last
decade.
Several of the state DOT leaders interviewed as part of the project
emphasized that they are using performance measurement to help
manage the organizational direction of their agencies. Washington
State Secretary Paula Hammond, for example, uses performance
measures to manage all aspects of her agency. She and other DOT
CEOs we spoke with describe how new performance accountability
methods are helping DOTs operate ‘flatter’ organizational structures
that give managers flexibility to make decisions, but hold them
accountable for results. Florida DOT’s Secretary Ananth Prasad
emphasized a culture he describes as ‘centralized command,
decentralized execution’ that depends on the expectation among FDOT
managers that they will be held accountable for their performance.
AASHTO’s Transportation – Invest in Our Future – Performance
Management report notes that all DOTs track asset condition and
safety performance data and a majority of states provide
comprehensive performance data to decision makers to both increase
accountability to customers and achieve the best possible
transportation system performance with current investment programs.
(AASHTO, 2007 i) State DOT leaders observe, however, that while they
are already well-versed in performance management practices,
Congress is likely to drive an even greater focus on accountability and
performance-based decision making in the future.
15
Improved Project Delivery – Eleven out of 27 respondents to the
High Street Team’s electronic survey of DOT CEOs indicate ‘improved
project delivery’ is a major driver of organizational change within their
agency.
According to AASHTO’s Transportation – Invest in Our Future –
Accelerating Project Delivery report, a large highway project can take
from 10 to 15 years to complete—up to six years for the environmental
process, and up to nine years or more for planning, design, and
construction (AASHTO, 2007 ii). As explained in AASHTO’s report,
such delay has very real consequences for the American public.
Inadequate and congested highways cost drivers thousands of hours of
lost time, and cost businesses millions of dollars in productivity.
Stalled highway safety improvements literally cost lives in accidents
that might have been avoided. States are working in partnership with
FHWA on its ‘Every Day Counts’ initiative, which is designed to
identify and deploy innovation aimed at shortening project delivery,
enhancing the safety of our roadways, and protecting the environment.
Similarly, the SHRP 2 program has been working to improve project
delivery through initiatives such as Project Management Strategies for
Complex Projects, which is exploring the integration of more
dimensions (i.e., context and financing) into project management
approaches.
Several interviewed DOT leaders emphasized the importance of
breaking down organizational ‘silos’ inside their agencies as a way to
improve project delivery. Michigan DOT Director Kirk Steudle
describes a philosophy of ‘making holes in the silos’ that allow for
efficient collaboration across disciplines in project delivery.
Revenue Shortfalls – Ten out of 27 respondents to the electronic
survey indicate ‘revenue shortfalls’ are a major driver of organizational
change within their agency. Experts attribute the gap to a combination
of aging infrastructure, growing congestion, construction cost
escalation, and shrinking revenues. Weak economic conditions and
high fuel costs are worsening DOTs’ revenue shortfalls as consumers
and businesses choose more fuel-efficient vehicles and scale back
travel.
Our interview findings suggest DOT leaders perceive that revenue
shortfalls are not merely cyclical, but are part of a long-term funding
crisis that will force DOTs to re-think their basic roles and

16
organizational structures. Missouri DOT’s Mara Campbell, for
example, describes how her agency is currently undertaking a 19
percent cut in the DOT’s workforce in response to the need to find
$500 million in savings that has forced leadership to radically re-think
the agency’s organizational strategy. Most of the other interviewed
DOT leaders also are seeking ways to increase organizational efficiency
as a means to cut costs.
A 2012 AASHTO-sponsored workshop, ‘Leading in Lean Times,’
focused on examining management responses to ‘lean times.’ As Idaho
DOT’s Director Brian Ness noted in an AASHTO summary of the event,
he has found a lot of ways for Idaho DOT “to do things a little bit more
efficiently,” by focusing “on the way our organization is structured.”1
Many of the CEOs we talked with spoke about the need to re-centralize
some of their organizational functions as a way to cut costs and live
within their means.
Importance of Agency Credibility – Ten out of 27 respondents to
the electronic survey indicate ‘importance of credibility’ is a major
driver of organizational change within their agency. In our CEO
interviews, everyone stressed the vital importance of ensuring agency
credibility with state legislatures, specific stakeholders, and the public.
Gaining credibility often means ensuring organizational structures
meet stakeholder expectations. Secretary Prasad of the Florida DOT,
for example, stressed the importance of ‘consistent, predictable, and
repeatable’ decision-making within his agency as a foundation for
gaining and maintaining credibility with key audiences. For other DOT
CEOs, such as Brian Ness of Idaho, the need to regain credibility and
improve external accountability with key decision-makers was the
primary motivation for undertaking a major reorganization.
1 http://www.youtube.com/watch?v=lCs_thhjE_A
17
4.0 Characteristics of State DOT Organizational
Design
State DOTs are complex organizations that defy simple generalizations,
both because of the widely varying roles and responsibilities of DOTs from
state to state, and because of the way different DOTs have evolved since
the Interstate era. A review of DOTs’ organizational models, however,
suggests that many state transportation agencies share three common
dimensions of organizational structure – silo-based versus workflow-
based organizations; centralized versus decentralized organizations; and
in-house versus outsourced organizations – although each DOT can be
found at different points along the continuum of each dimension.
4.1 Silo-based versus Workflow-based DOTs
This dimension spans from DOTs organized around functional disciplines
in silos to DOTs organized around multi-disciplinary teams that follow
workflows:
Silo-based DOTs – Most DOTs favor functional organizational
designs with separate groupings (or ‘silos’) for functions like design,
right of way, environment, and planning. A functional structure
emphasizes top down management control over groupings divided by
skill sets. People within each functional department communicate
primarily with others in the same department to coordinate their work
and accomplish tasks or implement decisions that are passed ‘over the
wall’ to the next silo.
Silo-based organizations are most effective in stable business
environments where well-defined business processes and customer
needs dominate, and control is valued over flexibility,
entrepreneurship, and innovation. Silos allow the organization to
capitalize on the efficiency gains from coordinated use of specialized
technical skills, facilities, and equipment.
A functional structure can be effective if there is little need for
flexibility, innovation, or rapid response, which requires greater
horizontal coordination. Information flows up and down the vertical
hierarchy, and the chain of command converges at the top of the
organization.
Weaknesses of a functional organizational structure include problems
with communication and coordination across the silos as well as

18
potential for cross-functional conflict and rivalry. These weaknesses
tend to impede the organization’s ability to respond nimbly to new
challenges or to innovate as a whole.
Workflow-based DOTs. On the other end of the spectrum are
workflow-based organizational structures. Teams composed of
employees with diverse skill sets are held accountable for final product
delivery instead of for functional responsibilities related to elements of
product delivery. This allows the organization to be more flexible and
tailor services to fit customer needs. For DOTs, project delivery is an
obvious area where workflow-based organizational structures may
make sense.
The main disadvantage of a workflow-based organizational design is
that that the definition of a team may be arbitrary for some business
lines, particularly administrative services and may not work for all
business functions. In addition, transitioning from a functional
organization to a workflow-based one may be difficult as managers in
strongly functional departments may feel a loss of ‘turf’ and resist such
change.
Anecdotal evidence suggests only a small number of DOTs deviate from
the traditional silo model. For example, the Missouri DOT uses a team-
based design to organize around three major areas: organizational
support, system delivery, and system facilitation.
Matrix-based DOTs. In between functional and work-flow-based
organizations, matrix structures share a mix of features from both
vertical and horizontal structures. A matrix organization, for example,
may combine a functional silo structure with a strong horizontal
communication and coordination mechanism to overcome the
disadvantages of silos by opening up communication channels across
the agency. In this structure, there are continuing dual responsibilities
and reporting lines both to the function and to the product line or
project/service. While the matrix structure allows the organization to
simultaneously pursue different types of strategic initiatives, the main
drawback is the difficulty and complexity in managing and balancing
two lines of authority.
Many organizations use full-time integrators, such as product
managers, project managers, or brand managers, to provide strong
horizontal coordination. This is the case in some state DOTs, where
project (development and/or construction) managers’ responsibilities
cut across traditional single function silos. The integrator’s job is to

19
coordinate the work of several departments. Integrators in most
organizations have a lot of responsibility but little authority, which of
course adds immeasurably to the challenges of the job.
The North Carolina DOT uses a matrix design by adding a horizontal
communication overlay to the vertically arranged departments by
function.
4.2 Centralized versus Decentralized DOTs
This dimension of DOT organizational structures pertains to the allocation
of resources and distribution of authority between a single central office
and multiple regions or districts. According to NCHRP research, every
state DOT (except for the District of Columbia DOT) has field regions for
the core purpose of maintaining the roadway systems under the state’s
jurisdiction. Most also oversee construction and rehabilitation projects
from field offices. (NCHRP, 2008)
Centralized DOTs. On the centralized end of the continuum, the
DOT’s central office controls and performs most non-construction and
maintenance functions including roadway and bridge design,
environmental analysis, and project programming.
With a centralized structure, all knowledge, skills, and resources with
respect to specific activities are consolidated, providing a valuable
depth of knowledge for the DOT. This is most effective when in-depth
expertise is critical to meeting DOT goals, when the organization needs
to be controlled and coordinated through a vertical hierarchy, and
when efficiency is highly important. It has been the predominant
structure for large government agencies, such as state DOTs, for years.
Decentralized DOTs. In a highly decentralized operation, a DOT’s
field offices have much greater autonomous decision-making power
over functions like design, communications, fleet management, and
public engagement.
Organizing according to geographic areas is rather common for large-
scale enterprises whose strategies need to be tailored to fit the
particular needs and features of different geographical areas.
According to NCHRP research, the trend in the last several decades has
been for DOTs to decentralize functions as much as possible to put
them closer to the customer. A disadvantage of decentralized
structures, however, is redundancy in functions, resources, and

20
processes across all decentralized units. In addition, decentralized
agencies often foster a ‘kingdom’ mentality that can result in lack of
consistency and predictability across an agency.
4.3 In-house vs. Outsourced DOTs
This dimension describes the extent to which DOT functions and activities
are retained in-house or outsourced to other entities including the private
sector and local governments.
In-House DOTs. The traditional state DOT structure relies on
internal staff to perform most agency functions. While construction has
always been heavily contracted, other functions including design,
ROW, planning, maintenance, and various administrative functions
were likely to be handled by in-house resources. Today, most DOTs
have moved to outsource some of these and other functions (or a least a
portion of some of them), but still primarily rely on in-house resources
to deliver many of their core services. The major benefits of this
approach are that it maximizes control and enables cross training; on
the other hand, it reduces an agency’s ability to quickly adapt to
evolving issues and needs
Outsourced DOTs. Simply put, outsourcing is the use of external
resources (including both private contractors and consultants as well
other public agencies) to perform or support agency functions. Use of
outside contractors has become more common among state DOTs as
fluctuations in funding levels have made it difficult for them to retain a
high level of technical capacity in-house. Outsourcing allows DOTs to
focus limited resources on developing and retaining the core
competencies in the workforce and access other skill sets to meet
project demands as they arise. It can make agencies more nimble and
able to adapt to unpredictable funding levels over time, but also
introduces a new set of management challenges around contracts,
finances, performance, and the workforce. Moreover, while many
stakeholders and elected officials often assume that cost savings can
automatically be achieved through external contracting, sometimes
there are hidden costs and frequently the savings may be more
perception than reality.
Most state DOTs began life in the early 20th century as vertical,
functionally organized, and centralized organizations that relied on in-
house expertise for most tasks. They looked a lot alike. As the 21st century
gets underway, however, DOTs increasingly are experimenting with matrix

21
or horizontal organizational structures that decentralize decision-making
around workflows and take advantage of new communication
technologies.
22
5.0 Current Trends in Organizational Adaptation
To an increasing extent, DOTs take exception to ‘one size fits all’
characterizations of their organizational structures and processes. Each
DOT CEO follows his or her own unique path in setting direction for
organizational design that matches the special challenges they face. None-
the-less, our team’s research suggests three broad trends are driving
organizational change across many DOTs:
A shift toward hybrid silo/workflow-based organizational designs that
promote nimbleness, efficiency, and innovation;
Organizational re-centralization of some key functions that ensures
efficiency, consistency, and a refocus on core mission; and
Increased interest in outsourcing as a means for operating effectively in
a lean fiscal environment.
This chapter describes how the DOTs interviewed or surveyed as part of
the project are changing along these paradigms. In addition, while these
three areas capture much of the organizational change, there are other
areas where DOTS are employing organizational innovations to leverage
existing resources and better deliver programs and services; several of
these areas also are discussed in this chapter.
5.1 Move Toward Hybrid Silo/Workflow-based Organizations
Functional Silo Organization Structures Dominate at DOTs –
According to the survey of DOTs, most agencies identify themselves as
having either ‘functional’ (11 out of 27 respondents) or ‘hybrid leaning
functional’ (7 out of 27 respondents) organizational structures.
A functional organizational structure is a traditionally dominant
organizational approach for large corporations and government agencies
that features a functional arrangement around separate departments, e.g.
accounting, engineering, human resources, etc., that are silos of
specialized expertise. It also usually features a strong top-down,
hierarchical control structure in which a small number of people control
decision-making authority at the apex of the organization and decisions
are channeled vertically through separate departments. A good discussion
of the general characteristics of silo organizations can be found in
Organization Theory and Design (Daft, R.L; 2004).
DOTs Expect a Move to Workflow-based Structures –
Overwhelmingly (24 out of 27 respondents), DOTs say they expect to shift
23
away from functional structures toward workflow-based structures in the
future.
Workflow-based structures emphasize shaping internal organizational
boundaries to allow a high degree of coordination across functions and an
orientation around work products. They are also distinguished by team-
based structures that diminish hierarchical differences while empowering
employees. As a result, these organizations can become more nimble in
response to a changing environment. Five state DOTs responding to the
survey identified themselves as either leaning toward, or mostly, team
based including Maine, Mississippi, Missouri, North Carolina, and
Vermont.
DOTs are Layering a Workflow-based Philosophy Over a
Traditional Silo Structure – Despite the strong interest among DOTs
in workflow-based organizations, most of the DOT leaders we spoke with
do not foresee major changes in the functional ‘boxes’ on their
organizational charts. Rather, they are – as Michigan DOT’s Kirk Steudle
describes it – ‘poking holes in the silos’ to encourage the kind of benefits
that a workflow-based structure generates.
Benefits of Workflow-based DOTs
Reduced ‘Over the Wall’ Mentality – A workflow-based
organization tends to de-emphasize handing off projects and processes
‘over the wall’ at key stages. Instead, teams stay with a process or
project from start to finish, which encourages efficiency and
innovation.
Nimble Responsiveness – A flatter organizational structure means
issues can be addressed closer to the source and therefore more swiftly
rather than being ‘driven up the flag pole’ for resolution.
In Tune with Generational Work Culture Shift – A less
hierarchical organizational structure matches the work styles of the
newest generation of DOT workers.
Employees are Empowered to Innovate – A flatter
organizational structure gives employees more opportunities to
innovate, which can help DOTs develop creative solutions in lean
times.

24
How are DOTs Becoming More Team-based?
Multi-Disciplinary Leadership Teams: Arizona and
Michigan DOTs – At Arizona DOT and Michigan DOT, the agencies’
basic organizational ‘boxes’ are not being torn down, but Director
Halikowski in Arizona and Director Kirk Steudle in Michigan have each
established a leadership team to ensure commitment from the highest
levels of their agency to team-based approaches that work to ensure
better communication across the current organizational structure.
Cross Functional Project Managers: Utah DOT – Utah DOT
Director John Njord describes how his agency uses project managers
who cut across silos to solve problems.
Team-based Training: Arizona DOT – Director Halikowski
emphasizes training as a key to success. Managers across all of AZDOT
are taking ‘Transitional Change’ training, which is based on training
provided by AASHTO’s leadership academy.
Employee Empowerment: Florida and Missouri DOTs –
Florida DOT’s Ananth Prasad and MoDOT Director Kevin Keith both
emphasize the importance of giving employees empowerment to
innovate. ‘Practical Design’ is an example from Missouri of how
employees are being given more flexibility to make judgment calls
about what is needed and where savings can be achieved.
Re-Frame the DOT’s Mission: Rhode Island DOT – At Rhode
Island DOT, Director Michael Lewis is encouraging a flatter, team-
based organizational structure by re-framing the DOT’s mission as a
shared responsibility for ‘asset management’ that crosses all
organizational boundaries.
Leadership from the Top: Arizona, Florida, Michigan,
Rhode Island DOTs – CEOs Halikowski, Prasad, Steudle, and Lewis
all emphasize the importance of leadership in setting the tone for the
rest of the agency to follow. Michigan’s Steudle characterizes his core
direction to staff as ‘better, faster, cheaper, smarter.’ Florida’s Prasad
emphasizes ‘consistent, predictable, and repeatable.’
5.2 Centralized versus Decentralized Organizations
Most DOTs Favor a Mix of Centralization and Decentralization –
More than half of the DOTs that responded to the survey decentralize
some level of authority to districts, although no agencies characterized
themselves as fully or mostly decentralized. About half of the survey

25
respondents (12 out of 25) favor semi-decentralized organizational models
where decisions regarding system operations and maintenance, project
development and delivery, public engagement, and/or various
administrative functions are made at the district or regional level with a
high degree of autonomy. At the same time, a few DOTs (5 out of 25)
consider themselves mostly or completely centralized, where headquarters
controls most policy decisions, administrative functions, and project
development; field units are largely focused on project implementation,
system operations, and maintenance.
Organizing according to geographic areas (decentralization) is rather
common for large-scale enterprises whose strategies need to be tailored to
fit the particular needs and features of different geographical areas and
where the scope and nature of activities cannot be effectively delivered
from a central location. Conversely, centralization is most effective when
in-depth expertise is critical to meeting organizational goals, when the
organization needs to be controlled and coordinated through a vertical
hierarchy, and when efficiency is highly important.
The Emphasis on Decentralization is Waning – According to
NCHRP research, the trend in the last several decades has been for DOTs
to decentralize functions as much as possible to put them closer to the
customer. (NCHRP, 2008) However, this appears to have created a new
set of issues. Several DOT CEOs noted the propensity of decentralization
to encourage a “regional kingdom” mentality, which in turn creates
barriers to aligning field activities with central office policies, priorities,
and strategic direction, and thus negatively affects accountability. For
example, Florida’s Ananth Prasad commented “We’ve been decentralized
for 20 years…our seven districts became kingdoms and headquarters only
set broad policy….the same question [asked of each district] would receive
seven different answers.”
Decentralized structures also tend to create redundancy in functions,
resources and processes across all decentralized units, which is difficult to
justify in an era of increasingly scarce resources.
In response to these negative considerations, some DOT’s have begun to
“re-centralize” by selectively pulling functions and responsibilities back to
headquarters. Based on the survey, nearly half of the states with a current
structure that leans toward decentralization (5 of 12) plan to become more
centralized and only two of 25 DOTs expect to become more decentralized.

26
DOTs are Selectively Re-centralizing Command-related
Functions while Decentralizing Delivery – The comments of DOT
CEO’s about their direction with respect to centralization and
decentralization reflect a complex set of trends. Many of the state DOTs
that significantly decentralized over the last two decades (or have always
been decentralized) have begun to “re-centralize” policy-making and
control functions and/or administrative functions. For example, Director
Steudle of Michigan DOT, Commissioner McDonald of New York DOT,
and Secretary Prasad of Florida DOT have all been working to re-establish
and invigorate the policy making, standard setting, and command roles of
their agencies’ central offices. Similarly, several DOTs including North
Carolina, Utah, Alaska, and Arizona are centralizing many administrative
functions to improve consistency and eliminate redundancies.
At the same time, a number of DOTs are decentralizing project
development and delivery functions. These include states such as Arizona,
North Carolina, and Idaho that are striving to empower their field staff to
be more innovative and more responsive to customer interests and
demands.
Benefits of “Selectively Centralizing” DOTs
Program Consistency – Centralization of responsibility for
establishing and enforcing standards, procedures, and policies for
various functions helps ensure DOTs adopt a more consistent approach
to doing business across their states. This, in turn, can lead to more
uniform quality of services and facilities, and may even save money by
reducing barriers to greater completion for contracts (e.g., contractors
do not need to learn and accommodate different requirements and
practices for each district) or eliminating staff redundancies.
Policy Alignment – Similar to improving consistency, a key reason
for centralizing policy-making and command functions is to ensure
that field staff are supporting agency goals and aligning their actions
and decisions with department policies.
Cost Savings – Having each district or other business units maintain
their own staff, systems, expertise, etc. to carry out various
administrative functions can be expensive and inefficient. Centralizing
many of these functions, particularly as programs shrink and
administrative demands become more specialized can help achieve
greater economies of scale, better utilize staff, and operate more
efficiently.

27
Improved External and Internal Communications – Agencies
that centralize external communications functions are likely to convey
a clearer and more consistent message, and interface more uniformly
with the public, the media, and elected officials than when this function
is handled at the field level.
How are DOTs Changing their Centralization-Decentralization Mix?
Centralizing Policy and Command: Michigan, Florida, and
New York DOTs – Several DOTs are moving to gain more
centralized control over the policies, standards, and procedures. As
described by Florida’s Ananth Prasad “We don’t want to tell them
[district staff] what to do, we want to define “the box” within which
they operate and make decisions.” New York DOT’s Joan McDonald
aims to keep the agency generally decentralized, but centralize policy
making to establish consistent policies and procedures for project
delivery and operations/maintenance. Similarly, the Michigan DOT
has added positions to establish better alignment between the field and
the central office.
Moving Project Delivery Closer to the Customer: North
Carolina, Idaho, and Arizona DOTs – As DOTs with highly
centralized project development structures, the North Carolina, Idaho,
and Arizona DOTs are shifting more of the functions and decision-
making associated with project development and delivery to their
districts to improve customer responsiveness, expand multimodalism,
and promote innovation. A key difference between these efforts and
older DOT decentralization efforts is the incorporation of strong
accountability mechanisms to ensure consistency with Department
standards and policy goals is maintained.
Centralization of Administrative Functions: Idaho, Arizona,
Alaska, and North Carolina DOTs – A number of CEOs noted
that they are centralizing various administrative functions such as
budget, human resources, information technology (IT), and legal.
Much of this centralization is being done to promote greater
consistency, but also to save resources. For example, Director
Halikowski is centralizing Arizona DOT’s IT functions to standardize
the tools and resources the department is using to improve
consistency, drive down agency IT costs, and reduce inefficiencies.
Alaska is focusing on centralizing functions that are not core functions

28
for its regions to allow field staff to concentrate on core functions. In
North Carolina, the CEO is consolidating several administrative
functions that had been conducted independently by modal units as a
means to better integrate the agency’s modal activities and establish a
more intermodal culture within the agency.
Centrally Managing Communications: Utah and New York
State DOTs – The CEOs for Utah and New York DOTs noted their
efforts to increase central control of agency communications with the
media, the public, and elected officials. In both cases, this has not
required shifting people or authority to speak on behalf of the agency.
Instead, it has meant changing reporting relationships or working
more diligently to ensure field staff is aligned with broader agency
messages.
5.3 In-house versus Outsourced Organizations
DOTs are Generally Outsourcing and Privatizing More than in
the Past – The survey results suggest that half (13 out of 25) of DOTs are
outsourcing/privatizing more than they used to. Based on the follow-on
discussions with CEOs most of this change is related to outsourcing rather
than privatization. In fact, other than a few anecdotal examples, DOTs
appear to be making limited use of true privatization.
The traditional state DOT structure relied on internal staff to perform
most agency functions. While construction has always been heavily
contracted, other functions including design, ROW, planning,
maintenance, and various administrative functions were likely to be
handled by in-house resources. Today, most DOTs have moved to
outsource some of these and other functions (or a least a portion of some
of them), but still primarily rely on in-house resources to deliver many of
their core services. The major benefits of this approach are that it
maximizes control and enables cross training; on the other hand, it
reduces an agency’s ability to quickly adapt to evolving issues and needs
Most DOTs Expect to Outsource/Privatize More in the Future –
15 of the 25 respondents expect they will outsource or privatize functions
more in the future, and only 5 expect to do less outsourcing. Much of
agency outsourcing plans appear to be driven by either direct
requirements or the perceived need to reduce agency headcounts. As
several CEOs commented, the only way their agencies can meet the
current if not growing program requirements will be through aggressive
use of outsourcing. Also, DOTs are facing new and more divergent staffing

29
needs, many of which can be more readily and more effectively secured
through contracting.
At the same time, it should be noted that CEOs are concerned about the
potential implications of aggressive outsourcing. In particular, agencies
are concerned about succession planning and the ability to retain core
knowledge/expertise. In addition, agencies are finding that outsourcing is
not always a bargain (in many cases it is achieved at a premium to what it
would cost through in-house resources).
Benefits of Increased Outsourcing and Privatization
Respond to Headcount Reductions – In the word of Utah DOT
Director John Njord, “the private sector has unlimited resources;”
while DOT’s may face limitations on the size of their in-house staff,
they can readily obtain the personnel resources they need through
contracting.
Access to Talent – Several CEOs commented that even when they
have the ability to hire, they struggle to attract and retain people with
the capabilities, expertise, and knowledge that they need in many
places, particularly when it is highly specialized. Outsourcing provides
a viable means (and in some cases the only means) to accommodate
these needs.
A More Adjustable Workforce – One of the biggest outsourcing
benefits CEOs cited was the ability it provides to quickly adjust to
spikes and troughs in program levels. Thus while reducing in-house
staff requires painful reduction in force initiatives and staffing up can
both take significant time and be stymied by civil service requirements,
outsourcing can be adjusted almost at will.
Greater Administrative Flexibility – The private sector can often
avoid much of the bureaucracy associated with procurement and other
administrative functions. For example, the contractor that is now
operating the Atlanta Area ITS system for the Georgia DOT under a
performance-based contract is able to sole source for various
replacement parts without dealing with bureaucratic red tape; this
enables them to respond to maintenance needs more quickly and with
less expense.
Improved performance-focused – Outsourcing and privatization
can often enable agencies to create financial incentives for improved

30
performance that could not be achieved using in-house resources
because laws, rules and/or agency culture will not allow it.
How are DOTs Changing their use of In-house Resources, Outsourcing and Privatization?
Leveraging the Private Sector’s Unique Skill Sets and
Bench Strength: Utah, Florida, and Georgia DOTs – The
Utah DOT makes broad use of outsourcing to address spikes in its
program. For example, the Department is currently doing a $1.7
billion project that will be done over an extremely short period of
time; the project alone will use about 500 engineers, which is more
than Utah has in total. The Florida DOT aggressively shifted to
outsourcing over the last two decades and currently contracts about
80 percent of its maintenance, design, and construction work.
Secretary Prasad hopes to increase this to 90 percent. The Georgia
DOT is outsourcing a much larger percentage of maintenance,
largely as a way to accommodate pressures to reduce headcount. It
is also contracting with local governments to effectively outsource
the oversight of maintenance activities.
Maintaining “Baseline Capabilities” In-House: Idaho
DOT – A few CEOs discussed strategies associated with
maintaining sufficient in-house capabilities to deliver a baseline
program level, and then outsourcing to deliver above this level.
Such an approach allows a DOT to retain a sufficient level of in-
house knowledge and expertise, while shifting the risk associated
with inconsistent program levels (i.e., funding) to the private sector.
For the Idaho DOT (currently at about 80 percent in-house),
Director Ness estimates that reducing to about 60 percent in-house
would be appropriate for delivering a minimum or base program
level.
Outsourcing Non-core Functions: North Carolina DOT –
Secretary Conti is outsourcing areas such as the print shop to allow
the Department to focus its allowable headcount on core mission
activities.
Exploring Opportunities for Public Private Partnerships
(P3) – Arizona, North Carolina, Ohio, Delaware, and
Florida DOTs – The Arizona, North Carolina, and Ohio DOTs are
all beginning to explore significant P3 initiatives to bring in
additional investment in the system and potential help reduce

31
direct agency responsibilities. Delaware is looking at privatizing rest
stops on toll roads and Florida has already experimented with
several P3 arrangements and is considering others.
5.4 Other Organizational Approaches
In addition to the activities and changes state DOTs are pursuing under
the major categories of silo/team approaches, centralization/
decentralization and in-house/outsourcing, the survey and interviews
identified a few other types of organizational adaptations DOTs are using
to improve their service delivery in the current operating environment.
These include:
DOTs are Doing More to Leverage In-house Staff – Georgia
DOT is managing it’s engineers the way a consulting firm uses staff in
multiple offices, assigning personnel to projects throughout the State
based on unique project needs and staff availability. In Utah, the DOT
has consolidated its two largest workforce elements – winter snowplow
drivers and construction technicians – into one position called
“transportation technicians.” Doing so has enabled the Department to
eliminate over 100 positions.
Some DOTs are Flattening Reporting Structures – A few DOT
CEOs have recently undertaken efforts to reduce levels of management.
For example, in 2010, the Idaho DOT had nine management levels and
62 “managers” with one person reporting to them. Director Ness, has
significantly restructured the agency to reduce the number of
management levels to five, creating savings of $5 million to $8 million
a year.
DOT’s are Making Greater Use of Ad Hoc Teams – Several
DOTs are using temporary teams and working groups to tackle new
challenges, emerging opportunities, and special needs. For example,
the New York DOT recently used an ad hoc team to deal with American
Recovery and Reinvestment Act (ARRA) funding and its associated
requirements. When presented with a new P3 opportunity, the Florida
DOT develops temporary multidisciplinary teams to explore and
develop the opportunity.
DOT’s are Using Performance Measurement, Greater
Accountability, and Information Systems to Support
Organizational Change – Several DOT CEOs identified the
importance of using tools and methods to complement organizational
changes. In the words of Florida DOT’s Ananth Prasad “without strong

32
accountability, staff have a tendency to wait out organizational
changes, thus you need to make it clear that there are strong
implications for embracing change.” The Delaware DOT is taking view
of this consideration and establishing a relationship between the ‘level
of accountability’ specific units achieve and the ‘level of autonomy’ they
receive. The Louisiana DOTD recently completed a major software
integration of its back office systems and is using the improved
information to adjust span of control, flatten reporting structures, and
reallocate staff.
33
6.0 Running More Like a Business – A New
Organizational Ideal?
The notion that public agencies – and DOTs in particular – should operate
more like a business is certainly not new, it has literally been a mantra of
government reform efforts for decades. What is different now is the
widespread recognition that DOTs need to change how they operate and the
sense of expediency associated with doing so – the need for transformation to
more business-like organizational models has shifted from being a leadership
prerogative to a survival imperative.
While not a perfect analogy, comparisons can be drawn between the current
organizational direction of state DOTs and “change management” initiatives
pursued in the private sector for struggling companies. A troubled business
often lands where it is because it has clung to the status quo in the face of a
changing operating environment, placing false hope that investors will bail
them out, avoiding difficult decisions to cut costs and improve performance,
and assuming customer satisfaction and loyalty will simply return. When
circumstances reach a critical mass (e.g., bankruptcy looms or shareholders
revolt), businesses may seek to recreate themselves by:
Restructuring organizational hierarchies to be more agile and responsive
to a changing market;
Assessing operations and refocusing on mission-critical activities;
Aggressively cutting costs and waste through staff reductions,
rationalization of assets, outsourcing, and business process reengineering;
and
Improving transparency, accountability, risk management, and
communications.
State DOTs are in no way failing businesses, but the forces of change
described in chapter 3 of this report draw parallels to the circumstances that
drive private sector businesses to undertake major organizational changes.
The current and likely future DOT operating environment has changed to the
point where hoping things will ‘return to normal’ is simply no longer an
option – revenues will become even more limited, agencies will need to
continue to make difficult trade-off decisions about how they use limited
resources and become more efficient, and there is an ever-increasing need for
agencies to improve accountability for how they spend limited transportation
dollars and build greater credibility.

34
Not surprisingly, DOTs appear to be responding to their changing
environments by recreating and refocusing themselves along the same lines
that private sector entities respond to a declining bottom line. Based on the
survey responses and the CEO interviews, this response is defining a new
DOT “organizational ideal” that can be characterized by the following:
Reduced Agency Size – DOTs are becoming smaller, leaner, and more
nimble through downsizing and organizational flattening.
Refined Mission – DOTs are shifting their philosophy from “yes we can”
to “doing less with less,” which means focusing resources on critical
functions and spinning off, or simply eliminating, non-core functions.
Diversified Service Delivery Strategies – DOTs are striving to
deliver projects and programs faster, better, and cheaper. These efforts
include increased use of outsourcing and privatization as well as non-
traditional approaches to using internal resources.
Performance Focus – DOT leaders are not taking even their existing
funding for granted and are constantly working to build and maintain
agency credibility. This includes reshaping agencies to support
performance measurement and improve accountability.
Improved Risk Management – DOTs are beginning to use
comprehensive risk management approaches at the enterprise, program,
and project levels help identify and respond to the inherent uncertainties
of managing a complex organization. As noted in the recent report entitled
Successful Implementation of Enterprise Risk Management in State
Transportation Agencies (NCHRP), such initiatives can help agencies
maintain better controls over costs and delivery schedules, and reduce the
likelihood of negative public relations issues.

35
7.0 Keys to Successful Organizational Adaptation
In this chapter, we profile some of the overarching principles that emerged
from our discussions with CEOs as critical to the success of efforts to adapt
or change organizational structures for state DOTs and help agencies
better align their organizations with agency goals and objectives.
7.1 Strong CEO and Senior Leadership
Nearly all of the DOT CEOs report that changes in organizational design
generally come from the top. In addition, about 90 percent of the time
DOTs’ efforts to make organizational changes are being driven by the DOT
CEO, not commissions, governors or legislatures.
7.2 Keep it Simple
DOT CEOs often use simple metaphors to communicate their goals for
organizational change:
‘Centralized command, decentralized execution’ Ananth Prasad,
Florida DOT;
‘Faster, cheaper, better, smarter’ Kirk Steudle, Michigan DOT;
‘We are all asset managers’ Michael Lewis, Rhode Island DOT;
‘Consistent, predictable, and repeatable’ Ananth Prasad, Florida
DOT;
‘More efficient, more effective, accountability, credibility, and move
decision-making closer to the project’ Brian Ness, Idaho DOT;
‘Everything we do organizationally is directed at achieving three
major goals: safety, mobility, and infrastructure health across all
modes’ Gene Conti, North Carolina DOT
These metaphors help set a tone for employees that guide their approach to organizational change.
7.3 Carefully Consider the Scope of Change
The project research identified a wide spectrum of organizational change
initiatives occurring throughout the state DOT community, with efforts
ranging from selected ‘tweaks’ to major agency overhauls. In determining
the scope of an organizational change initiative, CEOs should consider
several factors, such as the goals of the change management initiative, the
time available for planning and transition, the agency’s culture and nature,

36
the agency’s unique legal and institutional parameters; and the mandate
for change (both internally and externally).
7.4 Establish the “Team You Need” to Achieve Change
Several CEOs stressed the importance of getting the “right” people in place
to support a change initiative. For example, the CEO’s from Michigan and
Idaho both stressed the importance of having a human resources chief
who is willing to fight the status quo and work to find solutions. Efforts
that include changes to an agency’s centralization-decentralization balance
may need to include district directors at the table, at least some of whom
are advocates for change. Similarly, when outsourcing, a CEO may need to
be careful about who manages the initiative – having the people who used
to ‘do the work’ now manage it may not be a good idea since those
individuals may want to see the effort fail.
7.5 Invest in Change
The success of organizational change can be heavily influenced by the level
of investment an agency makes in implementing the change. At a
minimum, this typically includes training to bring the agency up to speed
with the new organization, to repurpose staff, and to institutionalize
associated policy, standard, and process changes. In addition,
organizational change may necessitate new or additional outreach with
stakeholders, particular planning and service delivery partners who may
now need to work with different people or work with a DOT in different
ways. Lastly, organizational change may need to be supported by new or
expanded performance measures, data collection, and information
systems capabilities.
37
8.0 Considerations for Follow-on Research In this chapter, we present some recommendations to the Subcommittee on Organizational Management (SOOM) for follow-on research that grew from the research conducted for this engagement.
Analysis of potential organizational implications of MAP-21
Analysis of how underlying legal structures of state and local governments drive DOT organizational structures. For example, how do Dillon rule vs. home rule and other state constitutional/statutory considerations influence DOT organizational structures and options?
Evaluation of how DOT organizational changes are influencing DOT relationships with partners, stakeholders, and the general public
A comparison of project development costs, delivery times, and other considerations for projects developed via functional/silo vs. team/matrix organizational approaches
Research and analysis of the cost and performance implications of centralizing administrative functions
Research and quantification of costs savings (or premium) for outsourcing/privatizing various DOT functions
Analysis of the new DOT project/program manager – how are they different, what training and experience do they need, how are DOTs developing/obtaining them, etc.?
Analysis of how new DOT organizational structures are changing employee empowerment
Analysis of how selected DOT customers and partners (e.g., MPOs, local governments, modal agencies, resource agencies, contractors, consultants, suppliers, etc.) are reacting and responding to DOT organization changes
Research on the new and changing employee “skill sets” that will be needed by DOTs in the future as their missions, roles, and organizational structures change

38
References
AASHTO; The Changing DOT (1998)
AASHTO; Transportation – Invest in Our Future – Accelerating Project Delivery (2007, i)
AASHTO; Transportation – Invest in Our Future – Performance Management (2007, ii)
Daft, R.L; Organization Theory and Design, South-Western (2004)
Deloitte; Boosting Business Performance Through Organizational Design (2008)
NCHRP; Factors Affecting the Future of State DOTs as Institutions (Undated)
NCHRP; A Transportation Executive’s Guide to Organizational Improvement (2006)
NCHRP; Alternative Organizational Design Processes in State Departments of Transportation (2008)
SHRP; Guide to Improving Capability for Systems Operations and Management (2011)

NCHRP 20-24 (83) Task 2 Technical Memo
A-1
Appendix – Survey Results
This Technical Memo presents the research team’s findings from its Task 2 survey of
state DOTs, which was conducted as part of National Cooperative Highway Research
Program (NCHRP) Project 20-24 (83).
As per the project team’s approved work plan, the overall purpose of NCHRP
Project 20-24 (83) is to “help the industry think about the ways organizational
structure can be better aligned with organizational strategy to achieve better
performance” and ultimately to “lay out an agenda for the AASHTO
Subcommittee on Organizational Management (SOOM) and identify potential
future SOOM research initiatives to address areas where either information on
agency organization approaches appears lacking, or where the development of
new organizational models (particularly hybrid approaches) would benefit the
DOT community.” (Source: High Street NCHRP 20-24 (83) Amplified Work
Plan)
As stated in the team’s work plan for the project, the purpose of Task 2 is
“conduct a survey of CEOs for all state DOTs. The survey will provide a useful
benchmarking document that shows what DOT leaders in 2012 think about how
their agencies’ organizational structures influence performance and where
major opportunities exist for change in organizational design.”
Survey Process:
Electronic Survey Text – The project team developed a 27 question
electronic DOT survey geared toward CEO-level respondents. Survey content
was informed by the literature review and five DOT CEO interviews reported
in the Feb 2012 Task 1 Technical Memo. The survey was shared for review by
the NCHRP project panel. Appendix A to this Technical Memo contains a
copy of the electronic survey.
Survey Invitation and Timeframe – DOT CEOs for all 52 AASHTO
members were invited via an email from AASHTO’s John Horsley to complete
the electronic survey using an online instrument (surveymonkey.com).
AASHTO’s invitation was sent on February 21 and a follow-up reminder email
was sent from John Horsley on March 13. The survey was closed on March 19.

NCHRP 20-24 (83) Task 2 Technical Memo
A-2
Survey Responses – 27 State DOTs responded to the survey including one
anonymous response:
State Name Title
Alabama John R. Cooper Transportation Director
Alaska Marc Luiken Commissioner
Arizona John Halikowski Director
Arkansas Scott Bennett Director
Colorado Don Hunt Executive Director
Delaware Shailen Bhatt Secretary
District of Columbia Terry Bellamy Director
Florida Ananth Prasad Secretary
Hawaii Alvin Takeshita Division
Idaho Brian W. Ness Director
Kansas Barbara Rankin Acting Secretary
Maine David Bernhardt Commissioner
Massachusetts Richard Davey Secretary and CEO
Michigan Kirk Steudle Director
Mississippi Melinda McGrath Executive Director
Missouri Mara Campbell Dir. of Customer Relations
New Hampshire C. Clement, Sr. Commissioner
New York Joan McDonald Commissioner
North Carolina Gene Conti Secretary
Oregon Matthew Garrett Director
Rhode Island Michael P. Lewis Director
South Carolina Robert St Onge Secretary
South Dakota Darin Bergquist Secretary
Utah John Njord Executive Director
Vermont Brian Searles Secretary
Wisconsin Mark Gottlieb Secretary
Anonymous - -
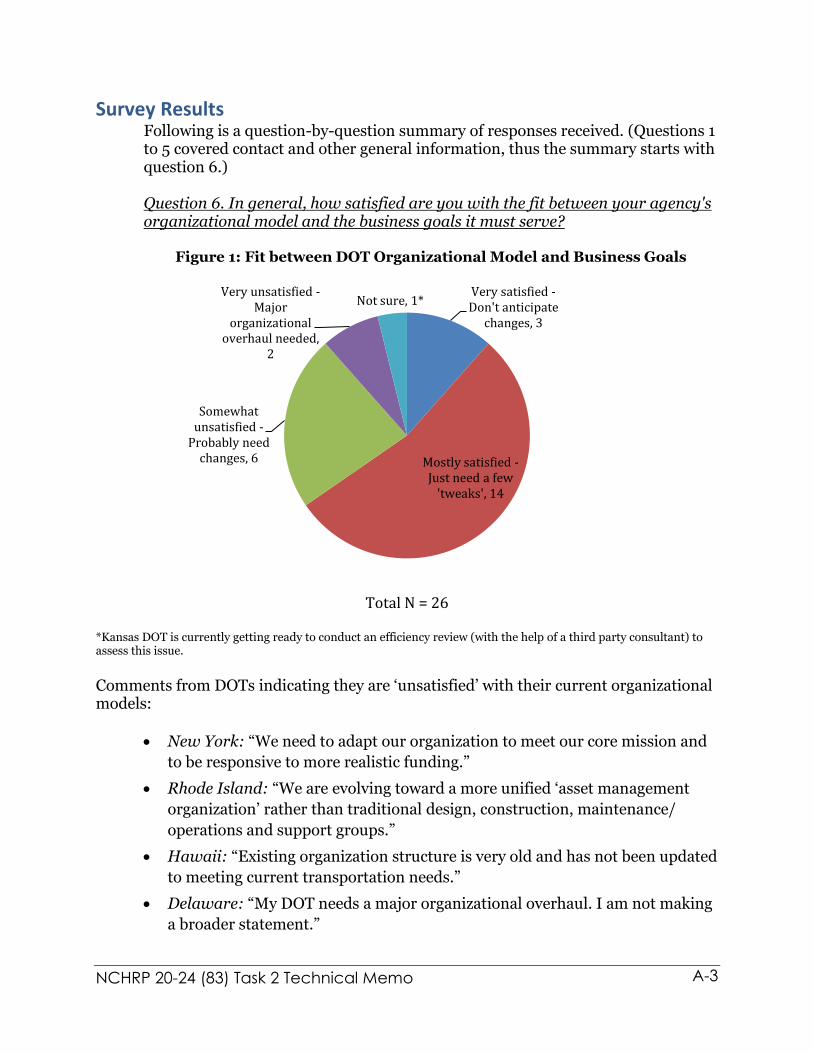
NCHRP 20-24 (83) Task 2 Technical Memo
A-3
Survey Results
Following is a question-by-question summary of responses received. (Questions 1 to 5 covered contact and other general information, thus the summary starts with question 6.) Question 6. In general, how satisfied are you with the fit between your agency's organizational model and the business goals it must serve?
Figure 1: Fit between DOT Organizational Model and Business Goals
Total N = 26
*Kansas DOT is currently getting ready to conduct an efficiency review (with the help of a third party consultant) to assess this issue.
Comments from DOTs indicating they are ‘unsatisfied’ with their current organizational models:
New York: “We need to adapt our organization to meet our core mission and
to be responsive to more realistic funding.”
Rhode Island: “We are evolving toward a more unified ‘asset management
organization’ rather than traditional design, construction, maintenance/
operations and support groups.”
Hawaii: “Existing organization structure is very old and has not been updated
to meeting current transportation needs.”
Delaware: “My DOT needs a major organizational overhaul. I am not making
a broader statement.”
Very satisfied - Don't anticipate
changes, 3
Mostly satisfied - Just need a few
'tweaks', 14
Somewhat unsatisfied -
Probably need changes, 6
Very unsatisfied - Major
organizational overhaul needed,
2
Not sure, 1*

NCHRP 20-24 (83) Task 2 Technical Memo
A-4
Question 7. For organizational changes you have made in the last five years or are planning/implementing, what is the scale of actual or anticipated organizational changes?
Figure 2: Scale of Actual or Anticipated Organizational Changes
Total N = 26
*Responses to ‘Others’ include: Massachusetts: Complete legislative overhaul, several transportation agencies merged.
North Carolina: Added NC Turnpike and NC Ports to DOT family; moving to more functional rather than modal approach
No organizational changes made
0
Targeted changes to one
or a few business units
7
Significant changes across
a major division/functional area of the
agency 10
Agency-wide changes
7
Other (please specify)
2*
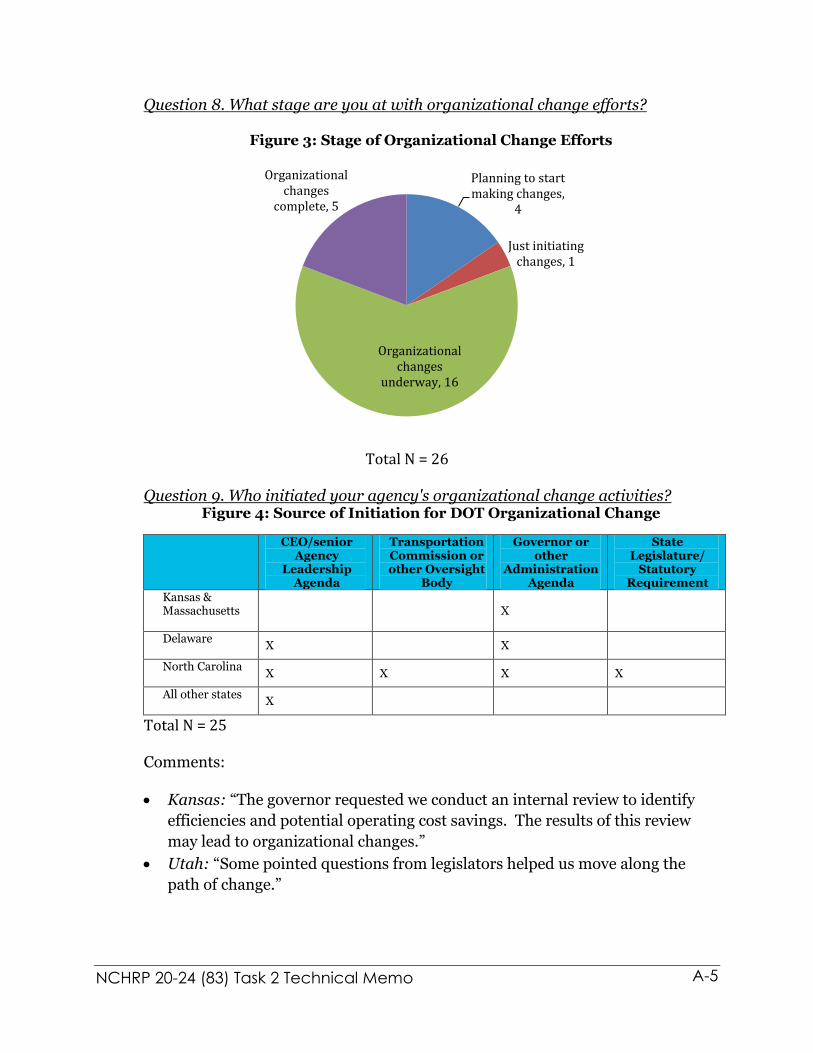
NCHRP 20-24 (83) Task 2 Technical Memo
A-5
Question 8. What stage are you at with organizational change efforts?
Figure 3: Stage of Organizational Change Efforts
Total N = 26
Question 9. Who initiated your agency's organizational change activities?
Figure 4: Source of Initiation for DOT Organizational Change
CEO/senior Agency
Leadership Agenda
Transportation Commission or other Oversight
Body
Governor or other
Administration Agenda
State Legislature/
Statutory Requirement
Kansas & Massachusetts
X
Delaware
X X
North Carolina
X X X X
All other states
X
Total N = 25
Comments:
Kansas: “The governor requested we conduct an internal review to identify
efficiencies and potential operating cost savings. The results of this review
may lead to organizational changes.”
Utah: “Some pointed questions from legislators helped us move along the
path of change.”
Planning to start making changes,
4
Just initiating changes, 1
Organizational changes
underway, 16
Organizational changes
complete, 5
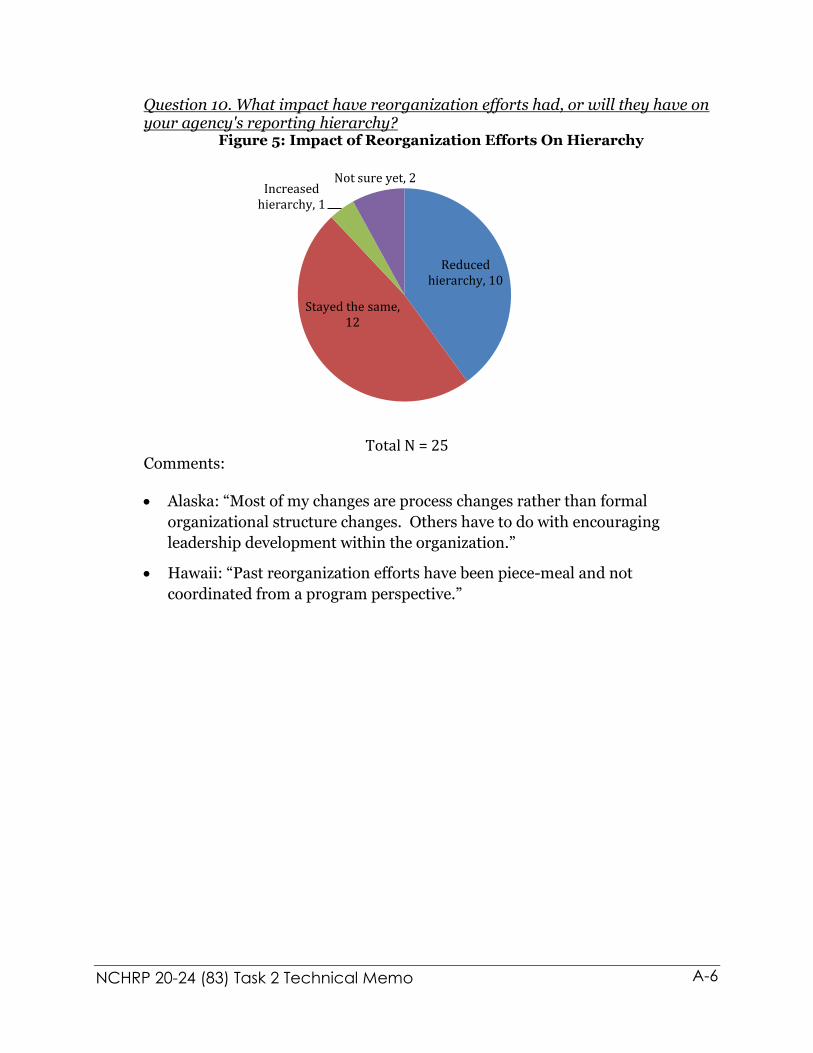
NCHRP 20-24 (83) Task 2 Technical Memo
A-6
Question 10. What impact have reorganization efforts had, or will they have on your agency's reporting hierarchy?
Figure 5: Impact of Reorganization Efforts On Hierarchy
Total N = 25
Comments:
Alaska: “Most of my changes are process changes rather than formal
organizational structure changes. Others have to do with encouraging
leadership development within the organization.”
Hawaii: “Past reorganization efforts have been piece-meal and not
coordinated from a program perspective.”
Reduced hierarchy, 10
Stayed the same, 12
Increased hierarchy, 1
Not sure yet, 2
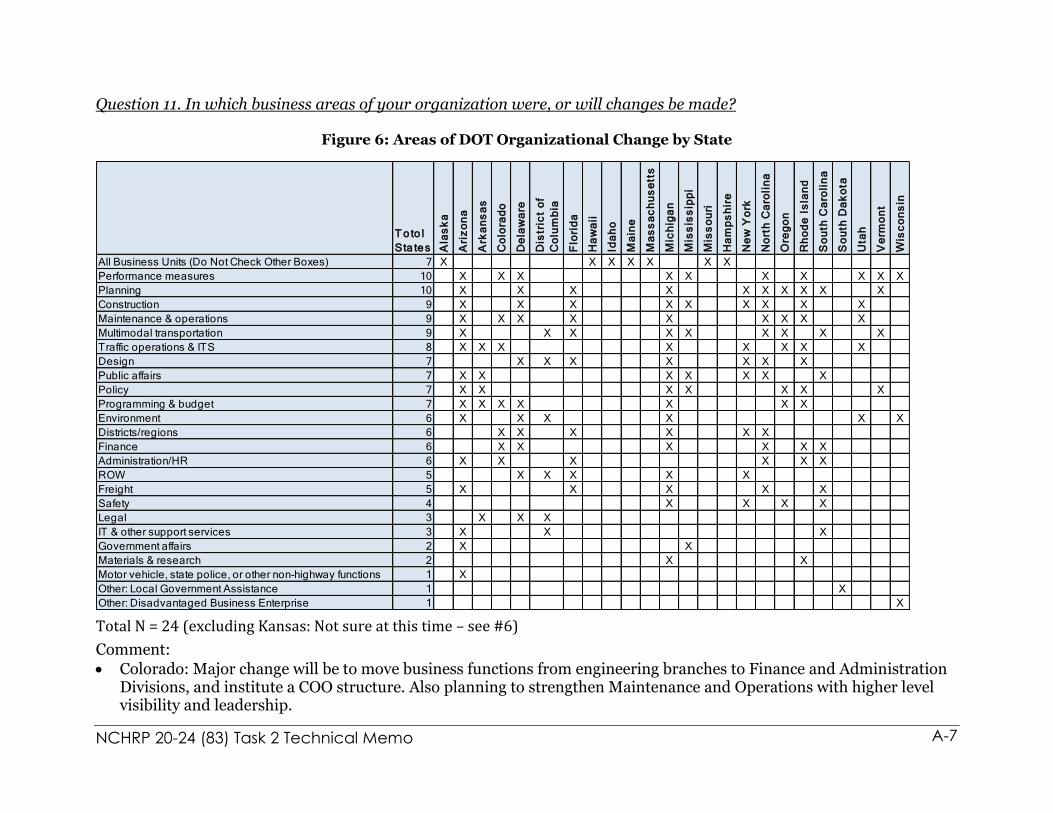
NCHRP 20-24 (83) Task 2 Technical Memo
A-7
Question 11. In which business areas of your organization were, or will changes be made?
Figure 6: Areas of DOT Organizational Change by State
Total N = 24 (excluding Kansas: Not sure at this time – see #6)
Comment:
Colorado: Major change will be to move business functions from engineering branches to Finance and Administration Divisions, and institute a COO structure. Also planning to strengthen Maintenance and Operations with higher level visibility and leadership.
T o to l
Sta te s Ala
sk
a
Ari
zo
na
Ark
an
sa
s
Co
lora
do
De
law
are
Dis
tric
t o
f
Co
lum
bia
Flo
rid
a
Ha
wa
ii
Ida
ho
Ma
ine
Ma
ss
ac
hu
se
tts
Mic
hig
an
Mis
sis
sip
pi
Mis
so
uri
N
ew
Ha
mp
sh
ire
Ne
w Y
ork
No
rth
Ca
roli
na
Ore
go
n
Rh
od
e I
sla
nd
So
uth
Ca
roli
na
So
uth
Da
ko
ta
Uta
h
Ve
rmo
nt
Wis
co
ns
in
All Business Units (Do Not Check Other Boxes) 7 X X X X X X X
Performance measures 10 X X X X X X X X X X
Planning 10 X X X X X X X X X X
Construction 9 X X X X X X X X X
Maintenance & operations 9 X X X X X X X X X
Multimodal transportation 9 X X X X X X X X X
Traffic operations & ITS 8 X X X X X X X X
Design 7 X X X X X X X
Public affairs 7 X X X X X X X
Policy 7 X X X X X X X
Programming & budget 7 X X X X X X X
Environment 6 X X X X X X
Districts/regions 6 X X X X X X
Finance 6 X X X X X X
Administration/HR 6 X X X X X X
ROW 5 X X X X X
Freight 5 X X X X X
Safety 4 X X X X
Legal 3 X X X
IT & other support services 3 X X X
Government affairs 2 X X
Materials & research 2 X X
Motor vehicle, state police, or other non-highway functions 1 X
Other: Local Government Assistance 1 X
Other: Disadvantaged Business Enterprise 1 X

NCHRP 20-24 (83) Task 2 Technical Memo
A-8
Question 12. Choose the most important driving force or forces (up to three) for organizational change in your agency.
Figure 7: Driving Forces for Organizational Change
Total N = 26
Comments:
Utah: “The description of some of these driving forces implies that something
external to the DOT is a primary motivator for a DOT to consider change.
While external forces are certainly real, achieving great performance cannot,
in my opinion, be forced upon an organization by external forces and be
completely successful. In our case, we want to be the best that we can be
because that is entirely within our control, not because we are forced to
become better.”
South Carolina: “Governor's expectations; Legislature's/Commission
expectations.”
Missouri: “Staff reduction of over 1200 employees, elimination of over 740
equipment/fleet, elimination of over 130 facilities -- three of which were
district offices -- all to save $512 million over 5 years.”
Rhode Island: “To eliminate barriers between functional units
1
1
2
5
5
3
2
7
2
1
1
1
2
1
2
5
8
3
1
1
2
2
3
4
3
3
2
5
New technology
Increased customer expectations
New partnerships
Retirements/brain drain
Future uncertainty
Shifting or new policy priorities
Importance of credibility
Revenue shortfalls
Improved project delivery
Accountability focus
Government efficiency
1st
2nd
3rd
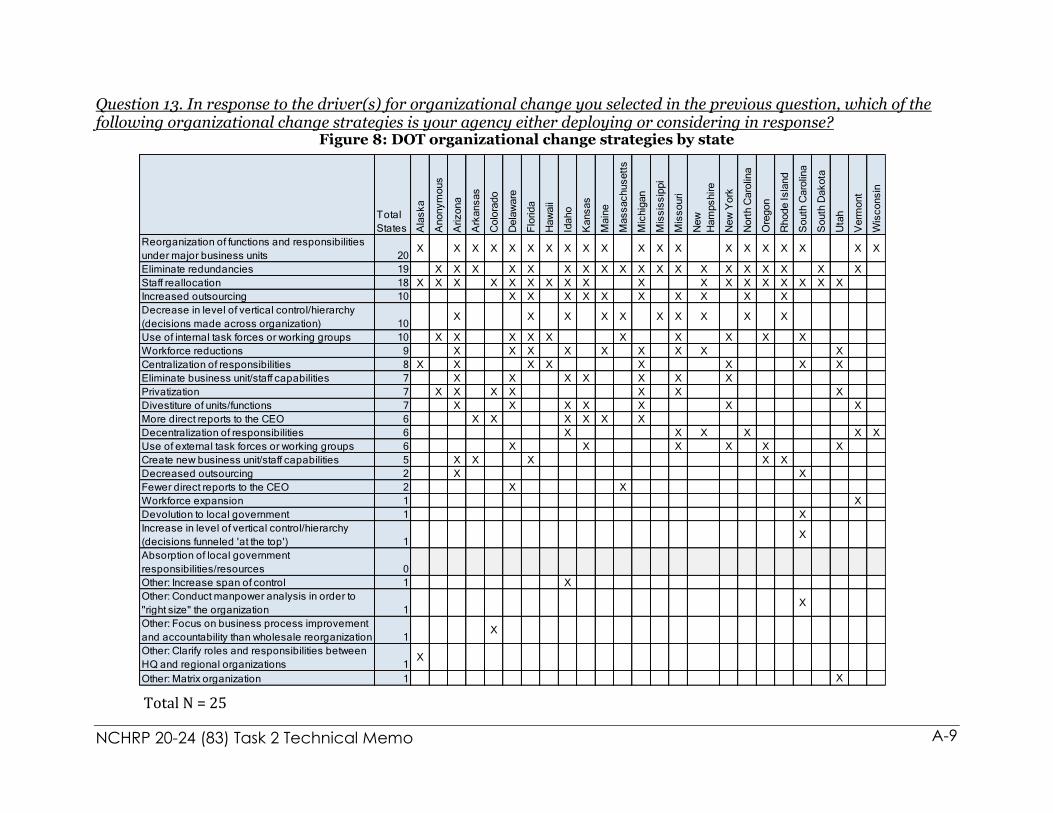
NCHRP 20-24 (83) Task 2 Technical Memo
A-9
Question 13. In response to the driver(s) for organizational change you selected in the previous question, which of the following organizational change strategies is your agency either deploying or considering in response?
Figure 8: DOT organizational change strategies by state
Total N = 25
Total
States Ala
sk
a
An
on
ym
ou
s
Ari
zo
na
Ark
an
sa
s
Co
lora
do
De
law
are
Flo
rid
a
Ha
wa
ii
Ida
ho
Ka
ns
as
Ma
ine
Ma
ss
ac
hu
se
tts
Mic
hig
an
Mis
sis
sip
pi
Mis
so
uri
Ne
w
Ha
mp
sh
ire
Ne
w Y
ork
No
rth
Ca
rolin
a
Ore
go
n
Rh
od
e I
sla
nd
So
uth
Ca
rolin
a
So
uth
Da
ko
ta
Uta
h
Ve
rmo
nt
Wis
co
ns
in
Reorganization of functions and responsibilities
under major business units 20X X X X X X X X X X X X X X X X X X X X
Eliminate redundancies 19 X X X X X X X X X X X X X X X X X X X
Staff reallocation 18 X X X X X X X X X X X X X X X X X X
Increased outsourcing 10 X X X X X X X X X X
Decrease in level of vertical control/hierarchy
(decisions made across organization) 10X X X X X X X X X X
Use of internal task forces or working groups 10 X X X X X X X X X X
Workforce reductions 9 X X X X X X X X X
Centralization of responsibilities 8 X X X X X X X X
Eliminate business unit/staff capabilities 7 X X X X X X X
Privatization 7 X X X X X X X
Divestiture of units/functions 7 X X X X X X X
More direct reports to the CEO 6 X X X X X X
Decentralization of responsibilities 6 X X X X X X
Use of external task forces or working groups 6 X X X X X X
Create new business unit/staff capabilities 5 X X X X X
Decreased outsourcing 2 X X
Fewer direct reports to the CEO 2 X X
Workforce expansion 1 X
Devolution to local government 1 X
Increase in level of vertical control/hierarchy
(decisions funneled 'at the top') 1X
Absorption of local government
responsibilities/resources 0
Other: Increase span of control 1 X
Other: Conduct manpower analysis in order to
"right size" the organization 1X
Other: Focus on business process improvement
and accountability than wholesale reorganization 1X
Other: Clarify roles and responsibilities between
HQ and regional organizations 1X
Other: Matrix organization 1 X
NCHRP 20-24 (83) Task 2 Technical Memo
A-10
Question 14. Have you reduced the number districts or regions as part of your reorganization? Of the 25 states that responded to this question, only three states (Maine, Missouri & Utah*) replied “yes.” Of the 22 states that answered “no”, four states (Hawaii, Kansas, North Carolina & Vermont) provided comments indicating past or future consideration of this strategy. *Utah Comment: “We had before a hybrid of 4 regions with three districts reporting to one very large region. We no longer refer to the districts separately.” Question 15. Please describe anything not covered in the previous questions that was (or will be) unique about either the motivation for your reorganizational changes or the types of changes you are making?
Alaska: “Most of my changes are process changes rather than formal
organizational structure changes. Others have to do with encouraging
leadership development within the organization.”
North Carolina: “We are organizing ourselves around 3 major goals: safety,
mobility, and infrastructure health across all modes. Everything we do
organizationally is directed at improving performance on those goals.”
New Hampshire: “Study the consolidation of Project Development to fewer
Bureaus.”
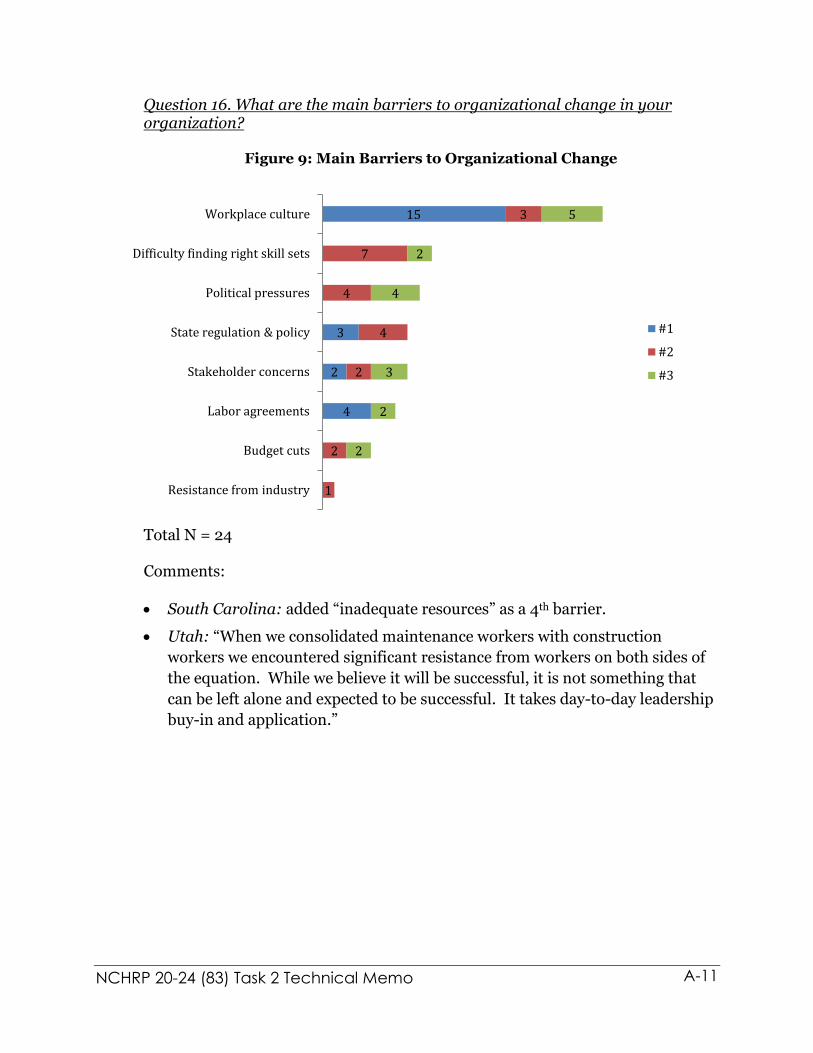
NCHRP 20-24 (83) Task 2 Technical Memo
A-11
Question 16. What are the main barriers to organizational change in your organization?
Figure 9: Main Barriers to Organizational Change
Total N = 24
Comments:
South Carolina: added “inadequate resources” as a 4th barrier.
Utah: “When we consolidated maintenance workers with construction
workers we encountered significant resistance from workers on both sides of
the equation. While we believe it will be successful, it is not something that
can be left alone and expected to be successful. It takes day-to-day leadership
buy-in and application.”
4
2
3
15
1
2
2
4
4
7
3
2
2
3
4
2
5
Resistance from industry
Budget cuts
Labor agreements
Stakeholder concerns
State regulation & policy
Political pressures
Difficulty finding right skill sets
Workplace culture
#1
#2
#3
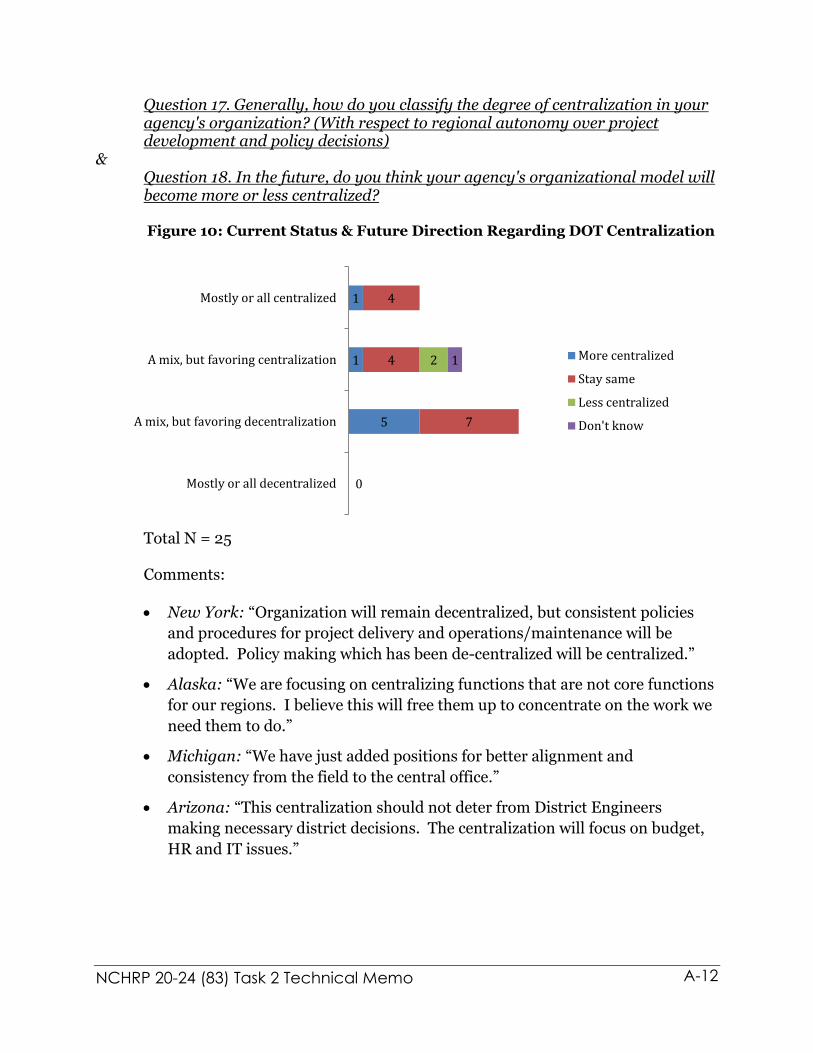
NCHRP 20-24 (83) Task 2 Technical Memo
A-12
Question 17. Generally, how do you classify the degree of centralization in your agency's organization? (With respect to regional autonomy over project development and policy decisions)
& Question 18. In the future, do you think your agency's organizational model will become more or less centralized? Figure 10: Current Status & Future Direction Regarding DOT Centralization
Total N = 25 Comments:
New York: “Organization will remain decentralized, but consistent policies
and procedures for project delivery and operations/maintenance will be
adopted. Policy making which has been de-centralized will be centralized.”
Alaska: “We are focusing on centralizing functions that are not core functions
for our regions. I believe this will free them up to concentrate on the work we
need them to do.”
Michigan: “We have just added positions for better alignment and
consistency from the field to the central office.”
Arizona: “This centralization should not deter from District Engineers
making necessary district decisions. The centralization will focus on budget,
HR and IT issues.”
5
1
1
7
4
4
2
0
1
Mostly or all decentralized
A mix, but favoring decentralization
A mix, but favoring centralization
Mostly or all centralized
More centralized
Stay same
Less centralized
Don't know
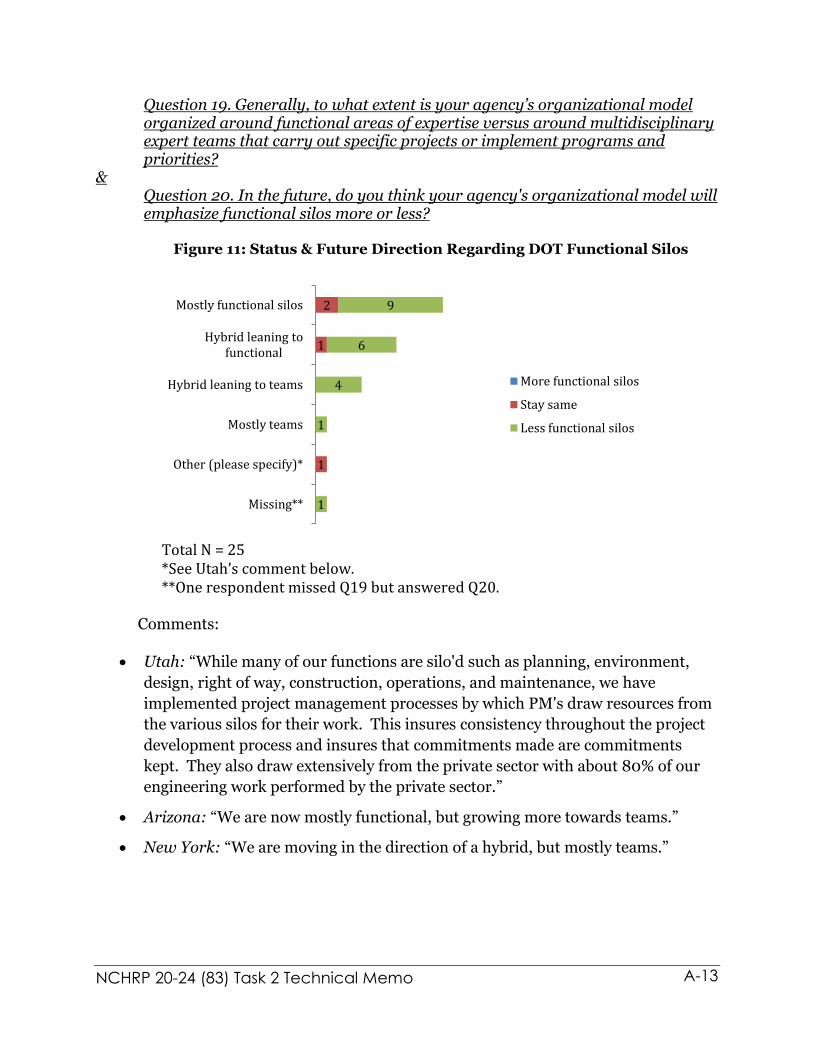
NCHRP 20-24 (83) Task 2 Technical Memo
A-13
Question 19. Generally, to what extent is your agency’s organizational model organized around functional areas of expertise versus around multidisciplinary expert teams that carry out specific projects or implement programs and priorities?
& Question 20. In the future, do you think your agency's organizational model will emphasize functional silos more or less?
Figure 11: Status & Future Direction Regarding DOT Functional Silos
Total N = 25 *See Utah’s comment below. **One respondent missed Q19 but answered Q20.
Comments:
Utah: “While many of our functions are silo'd such as planning, environment,
design, right of way, construction, operations, and maintenance, we have
implemented project management processes by which PM's draw resources from
the various silos for their work. This insures consistency throughout the project
development process and insures that commitments made are commitments
kept. They also draw extensively from the private sector with about 80% of our
engineering work performed by the private sector.”
Arizona: “We are now mostly functional, but growing more towards teams.”
New York: “We are moving in the direction of a hybrid, but mostly teams.”
1
1
2
1
1
4
6
9
Missing**
Other (please specify)*
Mostly teams
Hybrid leaning to teams
Hybrid leaning to functional
Mostly functional silos
More functional silos
Stay same
Less functional silos
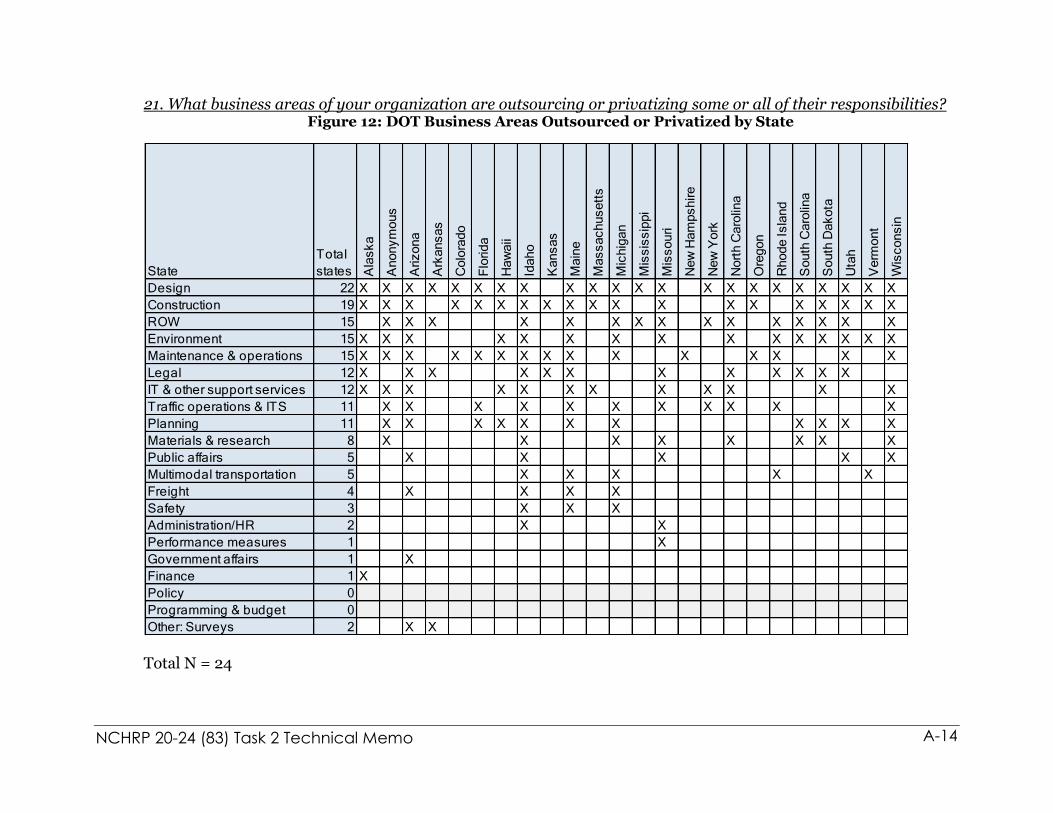
NCHRP 20-24 (83) Task 2 Technical Memo
A-14
21. What business areas of your organization are outsourcing or privatizing some or all of their responsibilities? Figure 12: DOT Business Areas Outsourced or Privatized by State
Total N = 24
State
Total
states Ala
sk
a
An
on
ym
ou
s
Ari
zo
na
Ark
an
sa
s
Co
lora
do
Flo
rid
a
Ha
wa
ii
Ida
ho
Ka
ns
as
Ma
ine
Ma
ss
ac
hu
se
tts
Mic
hig
an
Mis
sis
sip
pi
Mis
so
uri
Ne
w H
am
ps
hir
e
Ne
w Y
ork
No
rth
Ca
rolin
a
Ore
go
n
Rh
od
e I
sla
nd
So
uth
Ca
rolin
a
So
uth
Da
ko
ta
Uta
h
Ve
rmo
nt
Wis
co
ns
in
Design 22 X X X X X X X X X X X X X X X X X X X X X X
Construction 19 X X X X X X X X X X X X X X X X X X X
ROW 15 X X X X X X X X X X X X X X X
Environment 15 X X X X X X X X X X X X X X X
Maintenance & operations 15 X X X X X X X X X X X X X X X
Legal 12 X X X X X X X X X X X X
IT & other support services 12 X X X X X X X X X X X X
Traffic operations & ITS 11 X X X X X X X X X X X
Planning 11 X X X X X X X X X X X
Materials & research 8 X X X X X X X X
Public affairs 5 X X X X X
Multimodal transportation 5 X X X X X
Freight 4 X X X X
Safety 3 X X X
Administration/HR 2 X X
Performance measures 1 X
Government affairs 1 X
Finance 1 X
Policy 0
Programming & budget 0
Other: Surveys 2 X X

NCHRP 20-24 (83) Task 2 Technical Memo
A-15
Question 22. If you are privatizing any activities, please briefly describe what you are doing.
Mississippi: Using consultants to bridge the gap while training young
engineers.
Oregon: Roughly 30 percent of the A&E work is outsourced. One-hundred
percent of the heavy highway construction is done by the private-sector.
ORDOT has one maintenance pilot project currently engaged.
Colorado: Pretty standard privatization of design and construction currently.
May have more O&M privatization with P3's.
Idaho: Staffing for about 60% of normal program. Consulting the remaining
40%.
Arkansas: Outsourcing is only used to supplement existing staff in times
when the workload peaks. An Interstate Rehabilitation Program using
GARVEE bonds was just approved, which will almost double our construction
program over the next few years.
Michigan: We are looking at maintenance services and another pilot for
engineering services and management of a portion of the state road network.
North Carolina: Very little true privatization; more outsourcing with state
oversight; looking for privatization opportunities to generate revenue.
Rhode Island: Most design work is done by consultants. We will be increasing
out sourcing of some more maintenance activities.
Utah: Because our work comes in waves, we attempt to staff the organization
to handle the valleys of our work load. Anything above the valley is farmed
out if at all possible such as design and construction engineering, right of way
work, legal, and environmental. Public involvement and outreach is almost
always outsourced. Some of our planning projects are also staffed with
consultants. We like to hire the best consultants, work them like dogs, and
then put them away "wet." We assume they have unlimited resources and
therefore demand unlimited production from them. They are very good at
meeting our needs. We have had some outsourcing of our maintenance
activities with some success. Have not outsourced an entire roadway or
region of roadways to the private sector although we keep toying with the
idea.
Arizona: In areas where the Department does not have sufficient resources,
time or expertise, we are outsourcing.
qualified staff.
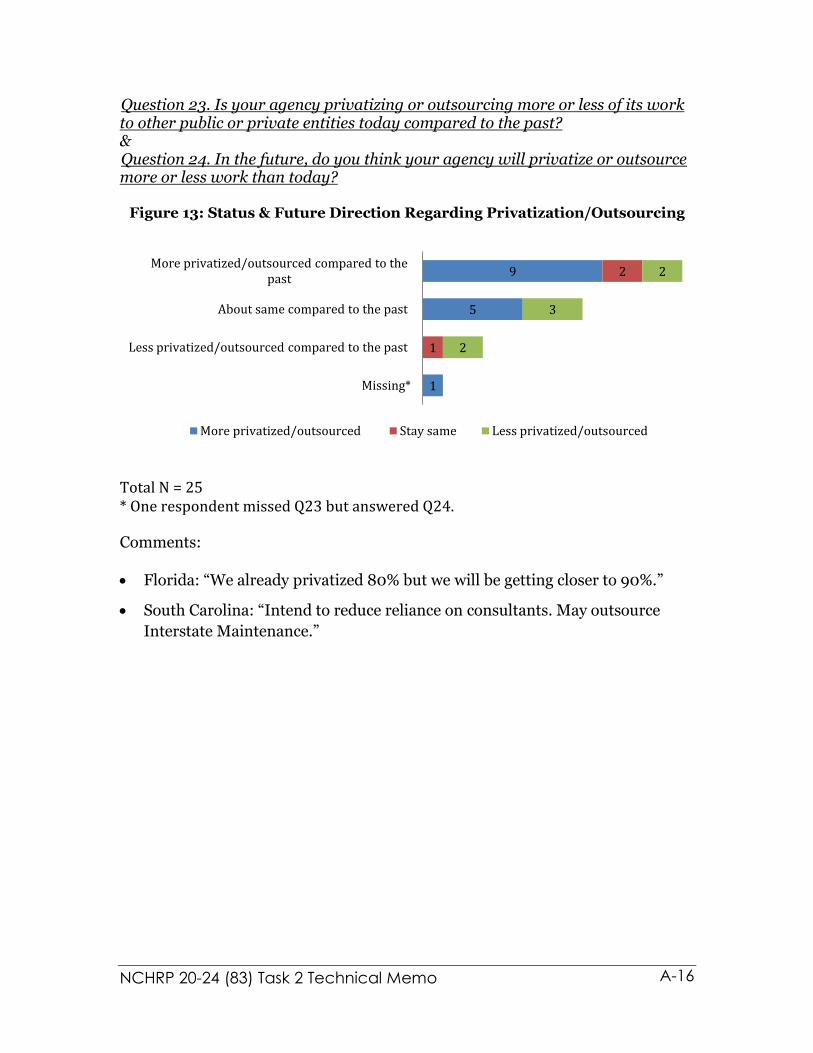
NCHRP 20-24 (83) Task 2 Technical Memo
A-16
Question 23. Is your agency privatizing or outsourcing more or less of its work to other public or private entities today compared to the past? & Question 24. In the future, do you think your agency will privatize or outsource more or less work than today?
Figure 13: Status & Future Direction Regarding Privatization/Outsourcing
Total N = 25 * One respondent missed Q23 but answered Q24. Comments:
Florida: “We already privatized 80% but we will be getting closer to 90%.”
South Carolina: “Intend to reduce reliance on consultants. May outsource
Interstate Maintenance.”
1
5
9
1
2
2
3
2
Missing*
Less privatized/outsourced compared to the past
About same compared to the past
More privatized/outsourced compared to the past
More privatized/outsourced Stay same Less privatized/outsourced

NCHRP 20-24 (83) Task 2 Technical Memo
A-17
Question 25. Do you plan to make organizational changes in the future?
Figure 14: Planned Future Organizational Change
Total N = 25
Comments:
Arizona: “Yes. As we continue to review our business model in light of
current demands, we intend to stay flexible and adjust the organizational
model accordingly.”
Michigan: “We just did a significant reorganization, I'm sure we will have to
tweak it at some point.”
Maine: “You always want to be looking at your organization, and make
changes necessary to work in the moment.”
Don't know, 6
No, 1 Yes, 18