NCHRP 3NCHRP 3- ---65: Applying 65: Applying...
31
Bhagwant Persaud, Canada David Harkey, USA George Mason University, USA McDonald & Partners, UK Rensselaer Polytechnic University, USA Rod Troutbeck, Australia Ruhr-University Bochum, Germany University of Idaho, USA NCHRP 3 NCHRP 3 NCHRP 3 NCHRP 3- - -65: Applying 65: Applying 65: Applying 65: Applying Roundabouts in the United States Roundabouts in the United States Roundabouts in the United States Roundabouts in the United States Preliminary Findings Lee A. Rodegerdts, P.E. AASHTO Subcommittee on Design, Chicago, IL June 27, 2005
Transcript of NCHRP 3NCHRP 3- ---65: Applying 65: Applying...

Bhagwant Persaud, CanadaDavid Harkey, USAGeorge Mason University, USAMcDonald & Partners, UK
Rensselaer Polytechnic University, USARod Troutbeck, AustraliaRuhr-University Bochum, GermanyUniversity of Idaho, USA
NCHRP 3NCHRP 3NCHRP 3NCHRP 3----65: Applying 65: Applying 65: Applying 65: Applying
Roundabouts in the United StatesRoundabouts in the United StatesRoundabouts in the United StatesRoundabouts in the United States
Preliminary Findings
Lee A. Rodegerdts, P.E.
AASHTO Subcommittee on Design, Chicago, IL
June 27, 2005

Topics of DiscussionTopics of DiscussionTopics of DiscussionTopics of Discussion
�Project panel and team
�Project need and objective
�Preliminary findings
� Safety
� Operations
� Design
�Anticipated products

Project panelProject panelProject panelProject panel
� Beatriz Caicedo-Maddison, Florida DOT (chair)
� Maria Burke, Texas DOT
� Jerry Champa, California DOT
� Leonard Evans, Science Serving Society
� Steve King, Kansas DOT
� Robert Limoges, New York State DOT
� Richard Long, Western Michigan University
� Ron Pfefer, HSM liaison
� Brian Walsh, Washington State DOT
� Mohsin Zaidi, City of Kansas City, MO
� Joe Bared, FHWA
� Hari Kalla, FHWA
� Rich Cunard, TRB
� Ray Derr, NCHRP

Project teamProject teamProject teamProject team
� P.I.: Lee Rodegerdts (KAI)
� (Bruce Robinson, Co-P.I. Emeritus)
� USA
� Kittelson & Associates, Inc.
� University of Idaho
� Rensselaer Polytechnic
Institute
� George Mason University
� David Harkey
� John Mason
� Australia
� Rod Troutbeck
� Canada
� Bhagwant Persaud
� Germany
� Werner Brilon
� United Kingdom
� Richard Hall

U.S. practice relies heavily on the experience U.S. practice relies heavily on the experience U.S. practice relies heavily on the experience U.S. practice relies heavily on the experience
from other countries.from other countries.from other countries.from other countries.
�Current U.S. procedures depend on
international methods without having U.S. data for calibration
�Use of roundabouts in the U.S. may differ
from that experienced in other countries
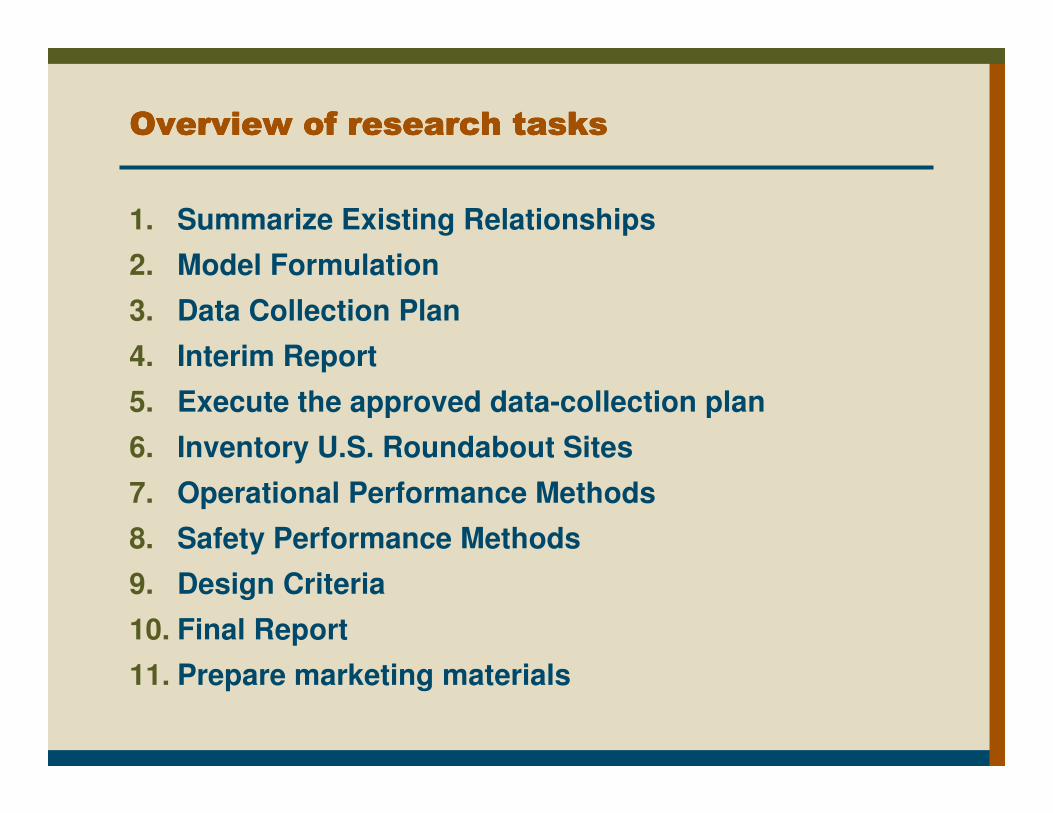
Overview of research tasksOverview of research tasksOverview of research tasksOverview of research tasks
1. Summarize Existing Relationships
2. Model Formulation
3. Data Collection Plan
4. Interim Report
5. Execute the approved data-collection plan
6. Inventory U.S. Roundabout Sites
7. Operational Performance Methods
8. Safety Performance Methods
9. Design Criteria
10. Final Report
11. Prepare marketing materials

Preliminary Safety FindingsPreliminary Safety FindingsPreliminary Safety FindingsPreliminary Safety Findings
�Roundabout-level accident models
�Approach-level accident models
�Before-after study of intersections converted to roundabouts

RoundaboutRoundaboutRoundaboutRoundabout----Level Crash PredictionLevel Crash PredictionLevel Crash PredictionLevel Crash Prediction
�Used for comparing performance to other intersection types
�Baseline prediction on which approach-level CMFs could be applied
� Form: Crashes = α(AADT)β
� Factors affecting coefficients:
� Number of lanes
� Number of approaches

ApproachApproachApproachApproach----Level Crash Data (139 approaches)Level Crash Data (139 approaches)Level Crash Data (139 approaches)Level Crash Data (139 approaches)
Total Number of Approach Crashes
0
50
100
150
200
Enter
ing
Circ
ulat
ing
Exitin
g/C
ircul
atin
gR
ear E
nd o
n App
roac
h
Loss
of C
ontro
l
Pedes
trian
Bicyc
le
Crash Type
Tota
l Num
ber
of C
rashes
Single Lane
Multi-Lane
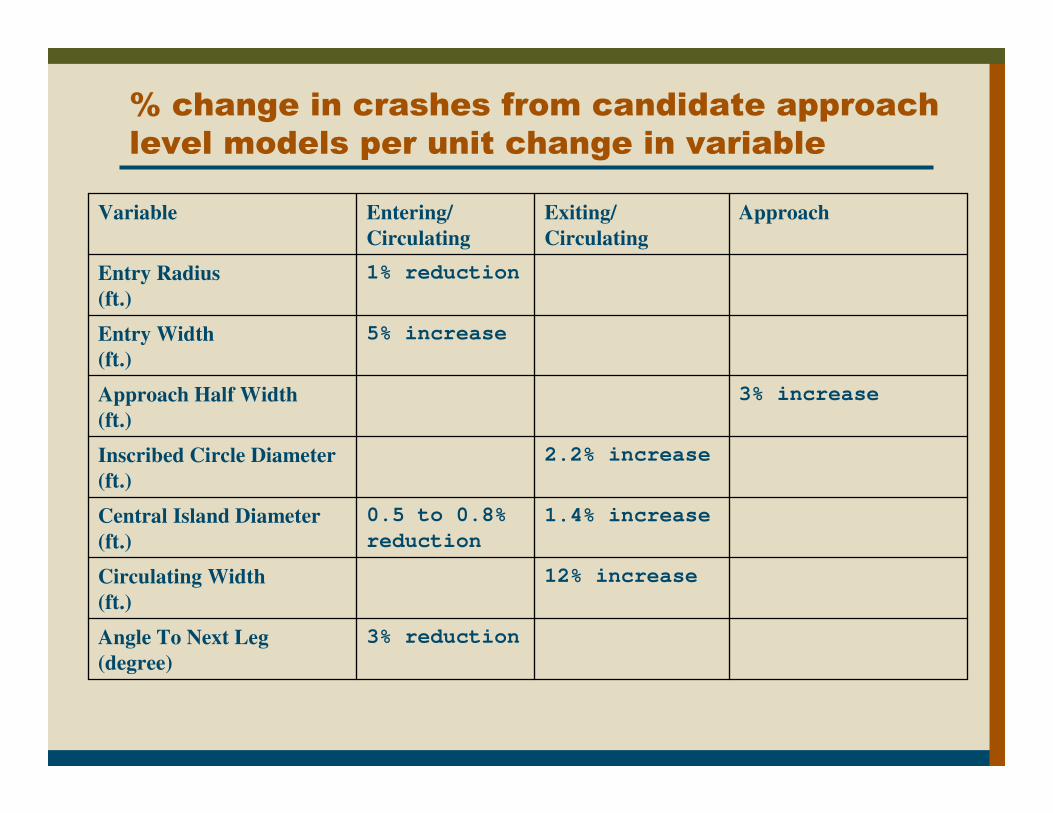
% change in crashes from candidate approach
level models per unit change in variable
3% reduction Angle To Next Leg
(degree)
12% increase Circulating Width
(ft.)
1.4% increase 0.5 to 0.8%
reduction
Central Island Diameter
(ft.)
2.2% increase Inscribed Circle Diameter
(ft.)
3% increase Approach Half Width
(ft.)
5% increase Entry Width
(ft.)
1% reduction Entry Radius
(ft.)
ApproachExiting/
Circulating
Entering/
Circulating
Variable
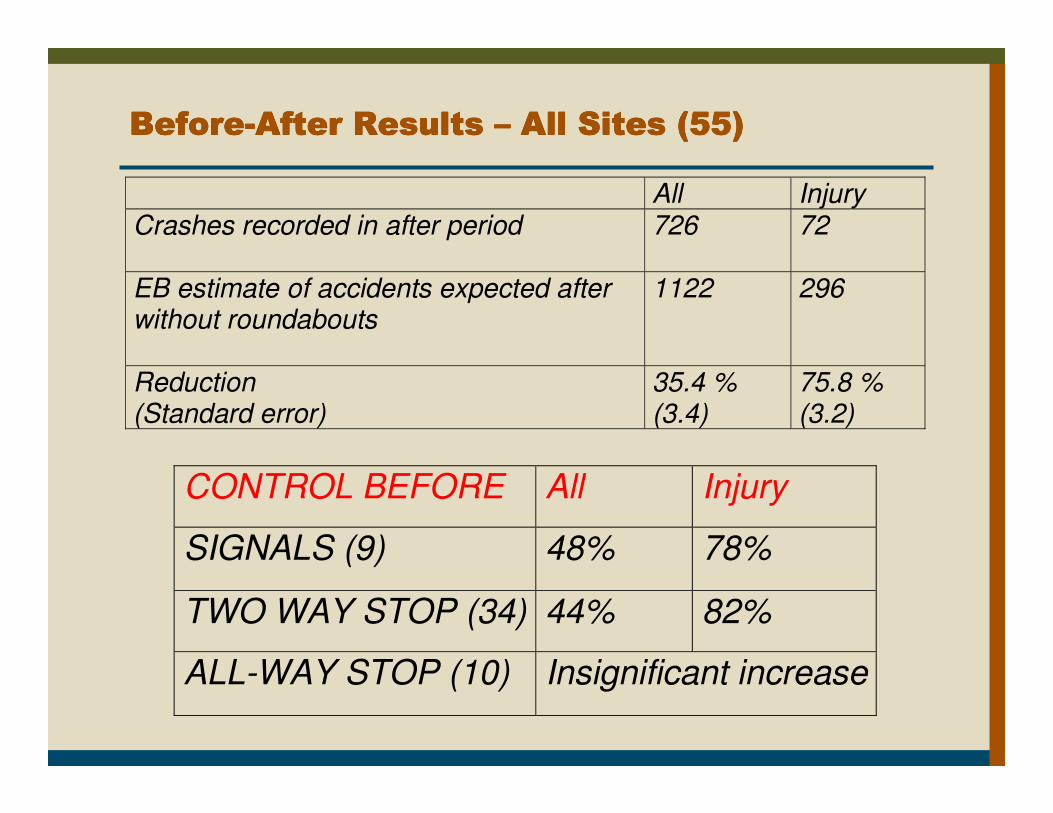
BeforeBeforeBeforeBefore----After Results After Results After Results After Results –––– All Sites (55)All Sites (55)All Sites (55)All Sites (55)
All Injury Crashes recorded in after period
726 72
EB estimate of accidents expected after without roundabouts
1122 296
Reduction (Standard error)
35.4 % (3.4)
75.8 % (3.2)
CONTROL BEFORE All Injury
SIGNALS (9) 48% 78%
TWO WAY STOP (34) 44% 82%
ALL-WAY STOP (10) Insignificant increase

Preliminary Operations FindingsPreliminary Operations FindingsPreliminary Operations FindingsPreliminary Operations Findings
�Analysis of existing models
�Driver behavior and effect of geometry
�HCM recommendations

Analysis of Existing ModelsAnalysis of Existing ModelsAnalysis of Existing ModelsAnalysis of Existing Models
�All international models (including SIDRA and RODEL) predict capacities higher than observed
WA04-N (Port Orchard)
0
500
1000
1500
2000
0 250 500 750Conflicting Flow (pcus/hr)
Ma
x E
nte
rin
g F
low
(p
cu
s/h
r) Raw Data
Akcelik Uncalibrated
Kimber Uncalibrated
Linear (Raw Data)

Influence of Flow & Geometry on Driver BehaviorInfluence of Flow & Geometry on Driver BehaviorInfluence of Flow & Geometry on Driver BehaviorInfluence of Flow & Geometry on Driver Behavior
�Entry lane width = entry width / # lanes
y = -0.047x + 3.408
R2 = 0.0336
y = -0.0079x + 4.8345
R2 = 0.0003
1.0
2.0
3.0
4.0
5.0
6.0
7.0
3.0 5.0 7.0 9.0
Entry Width
Gap P
ara
mete
rs
All tf
All tc
Linear (All

Multilane Modeling IssuesMultilane Modeling IssuesMultilane Modeling IssuesMultilane Modeling Issues
�Several sites exhibit strong queuing in only one lane
�Possible causes:
�Turning movement effects
�Lane use assignment (or lack thereof)
�Geometric effects (vehicle path overlap)
�Driver unfamiliarity
�Model intended to allow designer to capture these first-order effects apparent in U.S. data

Proposed HCM Capacity ModelsProposed HCM Capacity ModelsProposed HCM Capacity ModelsProposed HCM Capacity Models
� Single-lane: Current HCM model with new tc, tf
� Multi-Lane: Exp. regression model for critical lane
Roundabout Entry Capacity
0
200
400
600
800
1000
1200
1400
0 500 1000 1500 2000
Conflicting flow (veh/h)
En
try
ca
pa
cit
y (
ve
h/h
)
Single-Lane Capacity Multilane Critical Lane Capacity

Preliminary Design FindingsPreliminary Design FindingsPreliminary Design FindingsPreliminary Design Findings
�Design speed modeling
�Other design findings for motor vehicles
�Pedestrian and bicycle observations

Current FHWA speed prediction method is Current FHWA speed prediction method is Current FHWA speed prediction method is Current FHWA speed prediction method is
based on AASHTO speedbased on AASHTO speedbased on AASHTO speedbased on AASHTO speed----radius function.radius function.radius function.radius function.
0
5
10
15
20
25
30
35
40
0 50 100 150 200 250 300 350 400
Radius (ft)
Sp
eed
(m
ph
)
e=+0.02 e=-0.02

Design speed modeling:Design speed modeling:Design speed modeling:Design speed modeling:
V4, LeftV4, LeftV4, LeftV4, Left----turn circulating speed (all sites)turn circulating speed (all sites)turn circulating speed (all sites)turn circulating speed (all sites)
y = 1.1041x - 1.8409
R2 = 0.6483
0
5
10
15
20
25
30
35
0 5 10 15 20 25 30 35
Predicted Speed, V4p (mph), All Sites
Act
ua
l S
pee
d,
V4
a (
mp
h),
All
Sit
es
Data Match Line 85th %ile (15+ obs.) Linear (85th %ile (15+ obs.))

Design speed modeling:Design speed modeling:Design speed modeling:Design speed modeling:
Exit speed (all sites), unadjustedExit speed (all sites), unadjustedExit speed (all sites), unadjustedExit speed (all sites), unadjusted
y = 0.2513x + 13.834
R2 = 0.2933
0
5
10
15
20
25
30
35
40
45
50
0 5 10 15 20 25 30 35 40 45 50
Unadjusted Predicted Exit Speed, V3pbase or V6pbase (mph), All Sites
Act
ual
Exit
Sp
eed
, V
3a o
r V
6a
(m
ph
), A
ll
Sit
es
V3 Data Match Line 85th %ile (15+ obs.) V6 Data Linear (85th %ile (15+ obs.))

Proposed exit speed equationProposed exit speed equationProposed exit speed equationProposed exit speed equation
� where:
� V3 = V3 speed, in mph
� V3pbase = V3 speed predicted based on path radius, in mph
� V2 = V2 speed predicted based on path radius, in mph
� a23 = acceleration along the length between the midpoint of V2 path
and the point of interest along V3 path = 6.9 ft/s2
� d23 = distance between midpoint of V2 path and point of interest
along V3 path, in ft
+
=
2323
2
2
3
3
2)47.1(47.1
1
min
daV
V
V
pbaseSpeed where exit
radius is limiting
factor
Speed where circulating
speed and acceleration
distance is limiting factor

Design speed modeling:Design speed modeling:Design speed modeling:Design speed modeling:
Exit speed (all sites), adjustedExit speed (all sites), adjustedExit speed (all sites), adjustedExit speed (all sites), adjusted
y = 0.6694x + 5.9115
R2 = 0.5156
0
5
10
15
20
25
30
35
40
45
50
0 5 10 15 20 25 30 35 40 45 50
Adjusted Predicted Speed, V3p2 or V6p2 (mph), All Sites
Act
ua
l S
pee
d,
V3
a o
r V
6a
(m
ph
), A
ll S
ites
Match Line 85th %ile (15+ obs.) Linear (85th %ile (15+ obs.))

Implications for designImplications for designImplications for designImplications for design
� Tangential or nearly tangential exits do not appear to cause excessive vehicle exit speeds if the following conditions are met:
� The speed of circulation (V2 and V4) is kept low
� The distance between the start of the exit path and the point ofinterest (e.g., crosswalk) is kept short
� Similar prediction adjustment for entry speeds
� Entry speed appears to be limited by drivers’anticipation of the speed needed for circulation
� However, recommend continued reliance on entry path curvature as a primary method to control entry speed

Entry width and lane widthEntry width and lane widthEntry width and lane widthEntry width and lane width
�Narrow lane widths (entry and circulating) at
multilane roundabouts appear to have a detrimental effect on safety
�Entry width:
� Aggregated entry width (number of lanes) has a clear safety and operational effect
� Variations of lane width appear to be second-order effects

Multilane roundabout issuesMultilane roundabout issuesMultilane roundabout issuesMultilane roundabout issues
�Higher crash frequencies and crash rates
than single-lane roundabouts
�Vehicle path overlap, poor striping apparent contributors
�Anecdotal evidence suggests that their correction can substantially improve safety
performance

Example: Clearwater Beach, FL, before and Example: Clearwater Beach, FL, before and Example: Clearwater Beach, FL, before and Example: Clearwater Beach, FL, before and
after design modificationsafter design modificationsafter design modificationsafter design modifications
After (2005) Photo
: Lee R
odegerd
ts
Photo
: B
ruce R
obin
son
Before (2001)

NonNonNonNon----motorized usersmotorized usersmotorized usersmotorized users
� Examination of observed field behaviors for two groups:
� Pedestrians
� Bicyclists
� Pedestrian data:
� 10 approaches at 7 sites; 769 events
� Bicyclist data:
� 14 approaches at 7 sites; 690 events
� Geographic diversity:
� California, Florida, Maryland, Nevada, Oregon, Utah, Vermont, Washington

How do motorists behave when encountering How do motorists behave when encountering How do motorists behave when encountering How do motorists behave when encountering
pedestrians?pedestrians?pedestrians?pedestrians?
�Motorists failing to yield to pedestrians
� All sites: 30 percent
� Entry leg: 23 percent
� Exit leg: 38 percent
� 1-lane approaches: 17 percent
� 2-lane approaches: 43 percent

How do pedestrian behaviors at roundabouts How do pedestrian behaviors at roundabouts How do pedestrian behaviors at roundabouts How do pedestrian behaviors at roundabouts
compare to other forms of control?compare to other forms of control?compare to other forms of control?compare to other forms of control?
4%100%Stop-controlled
15%90%Signal-controlled
32%85%Roundabout
48%70%Uncontrolled
Percent of non-yielding vehicles
Percent of “normal”crossings
Crossing control

Anticipated productsAnticipated productsAnticipated productsAnticipated products
� Final report
� Draft Highway Capacity Manual procedure
� Components compatible with a possible Highway Safety Manual procedure
� Updated design research for use in future updates to FHWA Roundabout Guide, AASHTO Green Book
� Data that is accessible for future research
� Problem statement(s) for continued research
� Anticipated completion: December 2005

Questions?Questions?Questions?Questions?(503) 228-5230 or (800) 878-5230
Photo
: Lee R
odegerd
ts