NCCI’s Update on PEO Performance
82
© Copyright 2012 National Council on Compensation Insurance, Inc. All Rights Reserved. NCCI’s Update on PEO Performance Presented by; Mona Carter Senior Division Executive and Harry Shuford Practice Leader and Chief Economist August 20, 2013
Transcript of NCCI’s Update on PEO Performance

© Copyright 2012 National Council on Compensation Insurance, Inc. All Rights Reserved.
NCCI’s UpdateonPEO Performance
Presented by;
Mona CarterSenior Division Executive
andHarry ShufordPractice Leader and Chief EconomistAugust 20, 2013
© Copyright 2013 National Council on Compensation Insurance, Inc. All Rights Reserved.
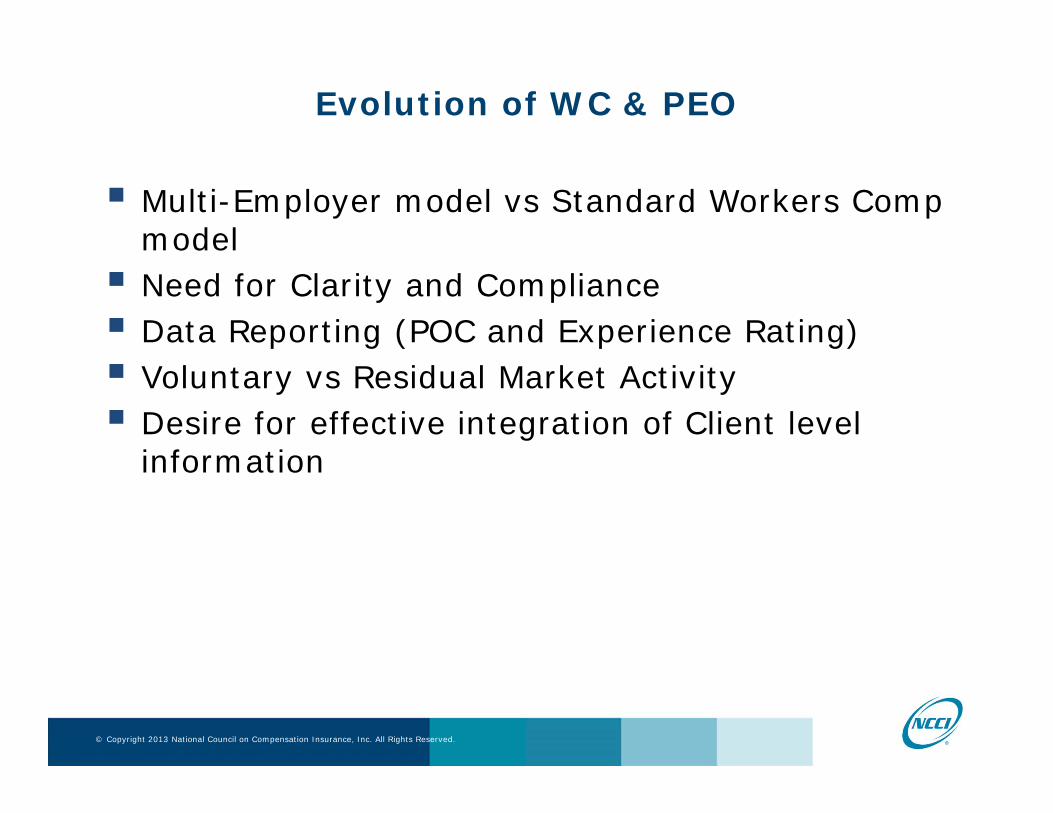
Evolution of WC & PEO
Multi-Employer model vs Standard Workers Comp model Need for Clarity and Compliance Data Reporting (POC and Experience Rating) Voluntary vs Residual Market Activity Desire for effective integration of Client level
information

© Copyright 2013 National Council on Compensation Insurance, Inc. All Rights Reserved.
Meeting The Challenges
Standardized Definitions and Terms Developing Policing and Regulatory Guidelines Insurance regulators, Industry and PEO Industry
working together for understanding States improvement of systems for integrating
information Enhanced requirements and reporting of
Individual Client data

© Copyright 2012 National Council on Compensation Insurance, Inc. All Rights Reserved.
Don’t Just Speculate, Investigate!
The Story Behind NCCI’s PEO Study
Harry ShufordPractice Leader and Chief EconomistAugust 20, 2013

© Copyright 2013 National Council on Compensation Insurance, Inc. All Rights Reserved.
The Story Behind the PEO Study
• Why a Study of PEOs?Public Health Professionals Planning a NIOSH Conference
• What Have People Been Saying About PEOs?Much of It Is Speculation
• Why No Prior Investigation?It Would Be Really Difficult
• Initial Findings? Speculation Upended
• External Push Back!More Investigation
• More FeedbackEven More Investigation
5

© Copyright 2013 National Council on Compensation Insurance, Inc. All Rights Reserved.
The Story Behind the PEO Study
But First - Something for the Uninitiated:
What Are Typical PEO Services?
Who Are the PEO Stakeholders?
6

© Copyright 2013 National Council on Compensation Insurance, Inc. All Rights Reserved.
What Are PEOs?Why Are There Concerns?
Typical PEO Services
• Payroll
• Workers compensation
• Risk management
• Employee benefits
• Recruiting
• Training and development
“Employer of record” for the leased workers from a PEO client company
7
Source: National Association of Professional Employer Organizations (www.napeo.org)

© Copyright 2013 National Council on Compensation Insurance, Inc. All Rights Reserved.
What Are PEOs?Why Are There Concerns?
Key Stakeholders:• Workers• Employers• PEOs• Regulators• Insurers• Ratemaking organizations
8

© Copyright 2013 National Council on Compensation Insurance, Inc. All Rights Reserved.
The Story Behind the PEO Study
What Are The Concerns?
9
© Copyright 2013 National Council on Compensation Insurance, Inc. All Rights Reserved.
The Story Behind the PEO Study
Planning for a NIOSH Conference
“Use of Workers’ Compensation Data for Occupational Safety and Health”
June 19-20, 2012
10

© Copyright 2013 National Council on Compensation Insurance, Inc. All Rights Reserved.
Contingent Workers and Alternative Work ArrangementsA Concern of Public Health Professionals
“Contingent Workers: Workers’ Compensation Data Analysis Strategies and Limitations,”
forthcoming in the American Journal of Industrial Medicine
11
Source: “Contingent Workers: Workers’ Compensation Data Analysis Strategies and Limitations,” forthcoming in the American Journal of Industrial Medicine

© Copyright 2013 National Council on Compensation Insurance, Inc. All Rights Reserved.
Contingent Workers and Alternative Work ArrangementsA Concern of Public Health Professionals
“The BLS identifies four categories of alternative employment arrangements, which may or may not involve contingent work:
1) independent contractors, consultants and free-lance workers, who may be either self-employed or wage and salary workers;
2) on-call workers who are called to work only as needed;
3) temporary help agency workers who are paid by a temporary help agency, regardless of whether the worker considers the job to be temporary; and
4) workers provided by contract firms, who are working for a contract company, usually work for only one customer, and usually work at the customer’s worksite.”
12
Source: “Contingent Workers: Workers’ Compensation Data Analysis Strategies and Limitations,” forthcoming in the American Journal of Industrial Medicine

© Copyright 2013 National Council on Compensation Insurance, Inc. All Rights Reserved.
Contingent Workers and Alternative Work ArrangementsA Concern of Public Health Professionals
“The BLS identifies four categories of alternative employment arrangements, which may or may not involve contingent work:
1) independent contractors, consultants and free-lance workers, who may be either self-employed or wage and salary workers;
2) on-call workers who are called to work only as needed;
3) temporary help agency workers who are paid by a temporary help agency, regardless of whether the worker considers the job to be temporary; and
4) workers provided by contract firms, who are working for a contract company, usually work for only one customer, and usually work at the customer’s worksite.”
13
Source: “Contingent Workers: Workers’ Compensation Data Analysis Strategies and Limitations,” forthcoming in the American Journal of Industrial Medicine

© Copyright 2013 National Council on Compensation Insurance, Inc. All Rights Reserved.
The Story Behind the PEO Study
Planning for a NIOSH Conference
Contingent Workers, including:
Independent Contractors, Consultants, & Free-lance Workers On-call Workers Temporary Help Agency Workers Workers Provided by Contract Firms Other Alternative Work Arrangements
14

© Copyright 2013 National Council on Compensation Insurance, Inc. All Rights Reserved.
The Story Behind the PEO Study
Employee Leasing and PEO Arrangements are considered to be “alternative work arrangements.”
15
© Copyright 2013 National Council on Compensation Insurance, Inc. All Rights Reserved.
The Story Behind the PEO Study
• What Are People Saying About PEOs?Much of It Is Speculation
16

© Copyright 2013 National Council on Compensation Insurance, Inc. All Rights Reserved.
Some Specific Regulatory Concerns
• Regulatory Concerns and PEOs:
• Worker risk exposure/lax workplace safety• Lack of clarity and/or access to workers
compensation benefits• Interference with employer compliance with state
WC proof of coverage process• Inadequate OSHA reporting
17

© Copyright 2013 National Council on Compensation Insurance, Inc. All Rights Reserved.
Some Specific Workers Comp Ratemaking Concerns
Workers Comp Professionals Also Have Expressed Concerns about PEOs.
• Concerns about PEO Behavior and Ratemaking:• Underreporting or misclassification of payroll• Underreporting of workplace injuries• Poor loss experience• Adverse impact on residual market results• Avoidance/distortion of experience rating mods
18

© Copyright 2013 National Council on Compensation Insurance, Inc. All Rights Reserved.
Some Specific Regulatory Concerns
Workers Comp Professionals Also Have Expressed Concerns about PEOs.
Experience indicates that at times monitoring of compliance with proof of coverage for PEO clients and tracking first report of injury can be challenging.
However, a review of the literature suggests that there is little solid research addressing many of the remaining issues.
That is, much of it appears to be speculation on worst case scenarios.
19

© Copyright 2013 National Council on Compensation Insurance, Inc. All Rights Reserved.
Some Specific Regulatory Concerns
Workers Comp Professionals Also Have Expressed Concerns about PEOs.
Experience indicates that at times monitoring of compliance with proof of coverage for PEO clients and tracking first report of injury can be challenging.
However, a review of the literature suggests that there is little solid research addressing many of the remaining issues.
That is, much of it appears to be speculation on worst case scenarios.
20
© Copyright 2013 National Council on Compensation Insurance, Inc. All Rights Reserved.
Some Specific Regulatory Concerns
In the spirit of the theme of the NIOSH conference NCCI’s economists decided to
Use workers compensation data to investigate the impact of PEOs on NCCI’s ratemaking.
Not only would this shed some light on some internal discussions;
It also should provide regulators and public health professionals a better understanding of their own concerns.
21
© Copyright 2013 National Council on Compensation Insurance, Inc. All Rights Reserved.
Some Specific Regulatory Concerns
If something is subject to empirical analysis:
Don’t just speculate, investigate.
22

© Copyright 2013 National Council on Compensation Insurance, Inc. All Rights Reserved.
Some Specific Regulatory Concerns
Moreover, there’s a second part to this story.
Researchers often discover that if their research findings vary from the conventional wisdom they must deal with an ongoing string of challenges.
Our analysis of PEOs has been once such study.
This has been a good thing; it increased the scope of our analysis and strengthened our overall findings.
That’s the real story behind this PEO study.
23

© Copyright 2013 National Council on Compensation Insurance, Inc. All Rights Reserved.
Some Specific Regulatory Concerns
Moreover, there’s a second part to this story.
Researchers often discover that if their research findings vary from the conventional wisdom they must deal with an ongoing string of challenges.
Our analysis of PEOs has been once such study.
This has been a good thing; it increased the scope of our analysis and strengthened our overall findings.
That’s the real story behind this PEO study.
24

© Copyright 2013 National Council on Compensation Insurance, Inc. All Rights Reserved.
Some Specific Regulatory Concerns
Moreover, there’s a second part to this story.
Researchers often discover that if their research findings vary from the conventional wisdom they must deal with an ongoing string of challenges.
Our analysis of PEOs has been once such study.
This has been a good thing; it increased the scope of our analysis and strengthened our overall findings.
That’s the real story behind this PEO study.
25

© Copyright 2013 National Council on Compensation Insurance, Inc. All Rights Reserved.
The Story Behind the PEO Study
With All of This Interest Why No Prior Investigation?
It Turns Out that It Was Major Undertaking.
26

© Copyright 2013 National Council on Compensation Insurance, Inc. All Rights Reserved.
The Story Behind the PEO Study
The Process:
Education – learn about the issues Information – get the data needed to analyze the issue Analysis and Conclusions Get Pushback on Results
Typically: “But you didn’t look at …”
So repeat the process: More Education More Data etc
27

© Copyright 2013 National Council on Compensation Insurance, Inc. All Rights Reserved.
The Story Behind the PEO Study
Lots of learning as we developed the data
28

© Copyright 2013 National Council on Compensation Insurance, Inc. All Rights Reserved.
Linking Policy and Unit Reporting Systems
• Started With Unit Data• Premium• Claims detail
• Proof of Coverage (POC) • to Identify PEOs in the unit data• NCCI’s PEO team
• Linked Policy and Unit Reporting Systems• Data and IT
29
© Copyright 2013 National Council on Compensation Insurance, Inc. All Rights Reserved.
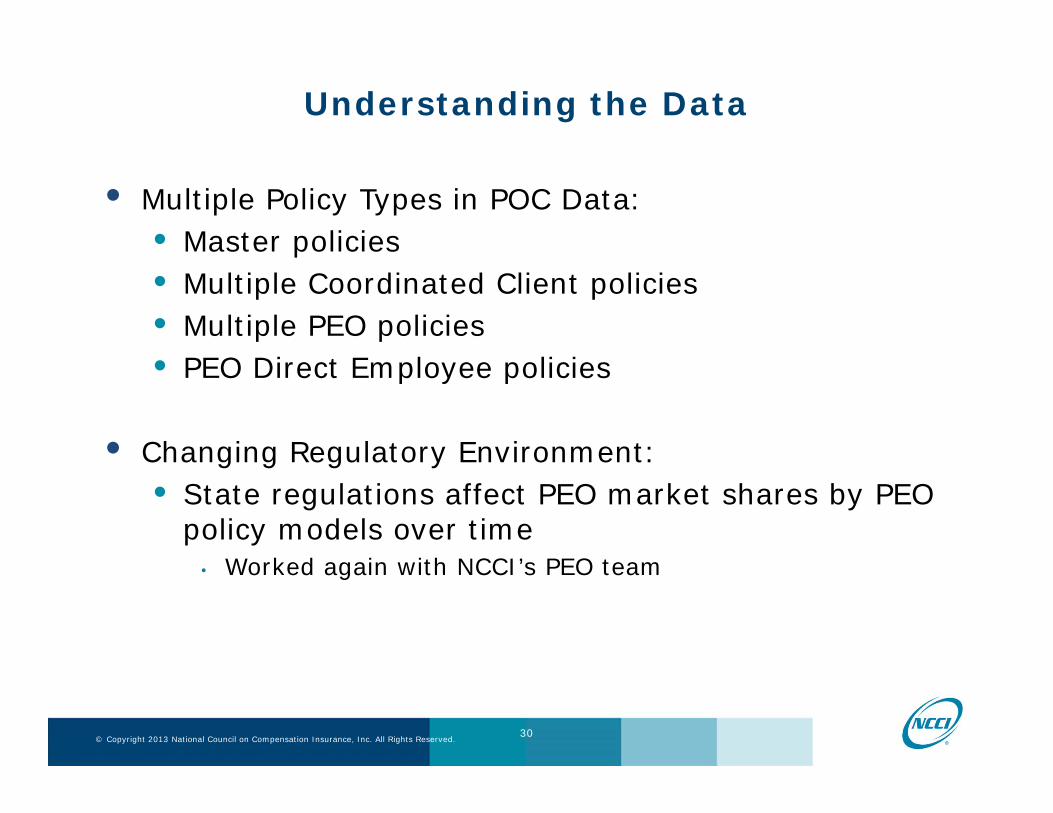
Understanding the Data
• Multiple Policy Types in POC Data:• Master policies• Multiple Coordinated Client policies• Multiple PEO policies• PEO Direct Employee policies
• Changing Regulatory Environment:• State regulations affect PEO market shares by PEO
policy models over time• Worked again with NCCI’s PEO team
30

© Copyright 2013 National Council on Compensation Insurance, Inc. All Rights Reserved.
Understanding PEOs and Issuesin Experience Rating and Residual Market
• Experience Rating Concerns and PEOs• NCCI’s Experience Rating Team
• Residual Market Issues and PEOs• NCCI’s Residual Market Team
31
© Copyright 2013 National Council on Compensation Insurance, Inc. All Rights Reserved.
Ratemaking Data Issues and PEOs
AES Class Ratemaking Team• Data Validation Issues and PEOs
• Creating Industry Group Level Data
32

© Copyright 2013 National Council on Compensation Insurance, Inc. All Rights Reserved.
Insolvencies and PEOs
• Working With NAIC Annual Statement Data
• Estimating Loss Reserve Adequacy • Schedule P
33
© Copyright 2013 National Council on Compensation Insurance, Inc. All Rights Reserved.
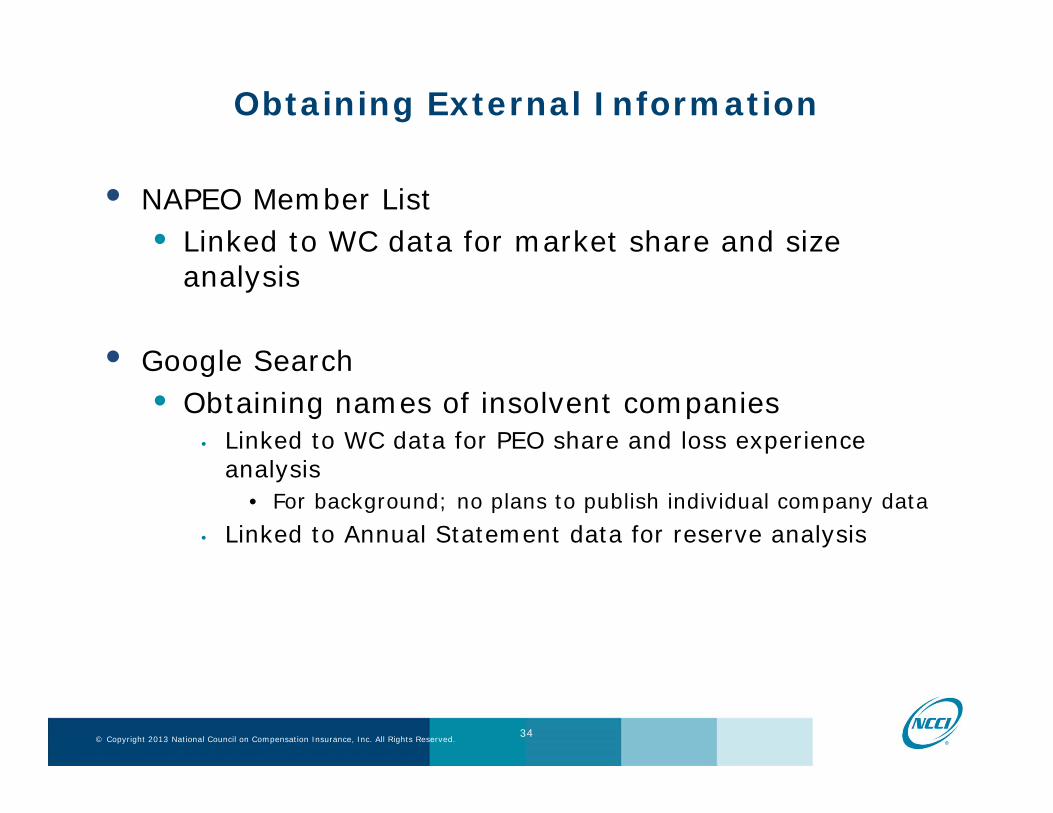
Obtaining External Information
• NAPEO Member List • Linked to WC data for market share and size
analysis
• Google Search• Obtaining names of insolvent companies
• Linked to WC data for PEO share and loss experience analysis
• For background; no plans to publish individual company data• Linked to Annual Statement data for reserve analysis
34

© Copyright 2013 National Council on Compensation Insurance, Inc. All Rights Reserved.
The Story Behind the PEO Study
What Were the Initial Findings?
35

© Copyright 2012 National Council on Compensation Insurance, Inc. All Rights Reserved.
PEOs in the WC Market
© Copyright 2013 National Council on Compensation Insurance, Inc. All Rights Reserved.
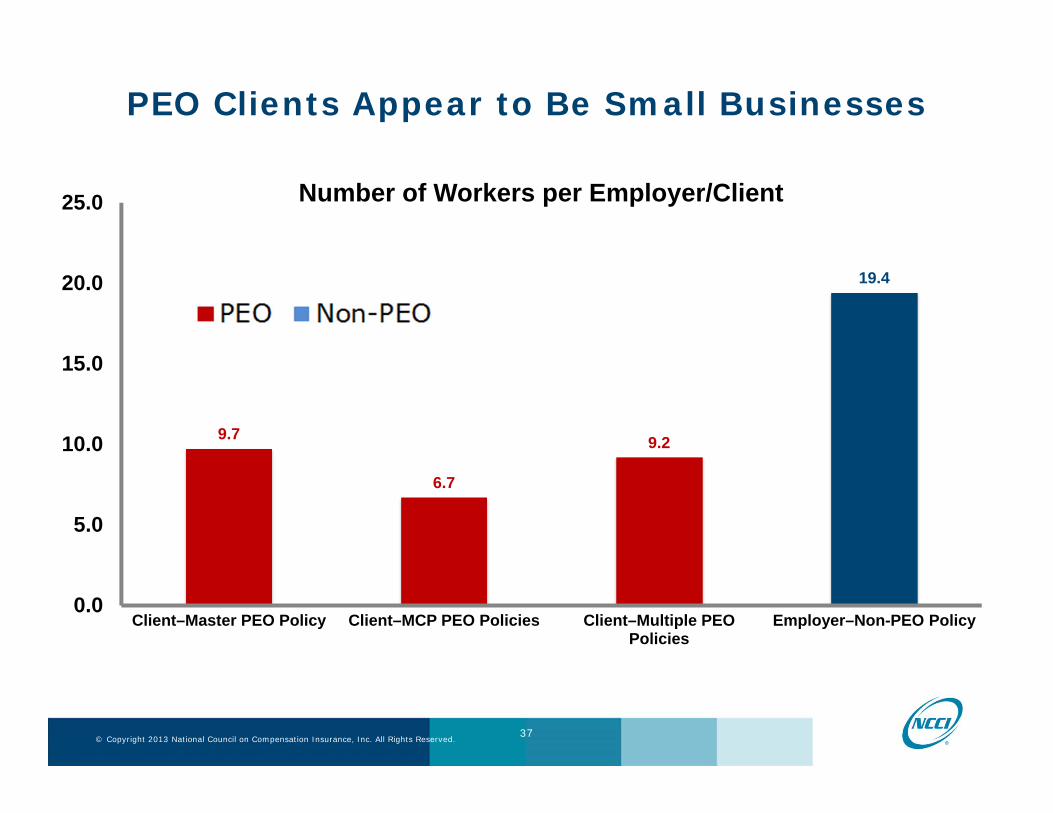
PEO Clients Appear to Be Small Businesses
9.7
6.7
9.2
19.4
0.0
5.0
10.0
15.0
20.0
25.0
Client–Master PEO Policy Client–MCP PEO Policies Client–Multiple PEO Policies
Employer–Non-PEO Policy
Number of Workers per Employer/Client
37
Source: Workers Compensation Statistical Plan data and Workers Compensation Policy data reported to NCCI, for Policy Year 2007

© Copyright 2013 National Council on Compensation Insurance, Inc. All Rights Reserved.
PEOs in WC MarketsOver PY 2004 Through PY 2010
• On Average Small Market Shares• 1 to 2 percent payroll share of the voluntary market• 2 to 6 percent of the residual market
• Great State Variation • In PY 2009:
• Florida—6 percent of voluntary market • Arizona—30 percent of residual market
38
Source: Workers Compensation Statistical Plan data and Workers Compensation Policy data reported to NCCIVoluntary Market: 37 NCCI ratemaking states; CA, DE, MA, MI, MN, NJ, NY, NC, ND, OH,PA, WA, WI, and WY are excludedResidual Market: 25 NCCI ratemaking states
AK, AL, AR, AZ, CT, DC, GA, ID, IL, IN, IA, KS, MS, MO, NE, NV, NH, NM, OR, SC, SD, TN, VT, VA, and WV are included NCCI is not the residual market plan administrator in IN, TN, MO, and NE

© Copyright 2013 National Council on Compensation Insurance, Inc. All Rights Reserved.
Workers Compensation Data Suggests Thatthe PEO Market Is Highly Concentrated
39

© Copyright 2013 National Council on Compensation Insurance, Inc. All Rights Reserved.
15 Largest PEO Companies Comprise Approximately Two-Thirds Market;National PEOs Members Make Up Majority of PEO Industry
Policy Year 2009 Data
40
48.8%
8.5%2.6%
40.1%Top 5
Next 5
Next 5
Other
Source: Workers Compensation Statistical Plan data and Workers Compensation Policy data reported to NCCINational Association of Professional Employer Organizations (NAPEO) ©NAPEO 2012; Used with permissionPEO policy models—Master policy, MCP policies, Multiple PEO policies, and PEO direct employee policies are includedNational PEOs list was based on membership list at napeo.org in April 2012MCP policies may not have PEO information as named insuredNCCI 37 ratemaking states only

© Copyright 2013 NCCI Holdings, Inc. All Rights Reserved.
2013 Annual Issues Symposium
PEO Loss Experience (@2nd Report)

© Copyright 2013 National Council on Compensation Insurance, Inc. All Rights Reserved.
PEO Loss Experience Is Comparable to Non-PEO
• Frequencies are higher by number of workers• Indicating that underreporting claims is not
apparent in the data• Severities are comparable• Loss ratios by manual premium and modified
premium tend to be comparable, if not lower• Indicating that underreporting or misclassifying
payroll is not apparent in the data
42
Source: Workers Compensation Statistical Plan data and Workers Compensation Policy data reported to NCCIVoluntary Market: 37 NCCI ratemaking states; CA, DE, MA, MI, MN, NJ, NY, NC, ND, OH,PA, WA, WI, and WY are excludedResidual Market: 25 NCCI ratemaking states
AK, AL, AR, AZ, CT, DC, GA, ID, IL, IN, IA, KS, MS, MO, NE, NV, NH, NM, OR, SC, SD, TN, VT, VA, and WV are included NCCI is not the residual market plan administrator in IN, TN, MO, and NE

© Copyright 2013 National Council on Compensation Insurance, Inc. All Rights Reserved.
Comparable or Lower Loss Experience@2nd Report
43
0.33 0.32 0.330.36
0.390.41
0.250.27
0.29
0.34
0.39
0.46
0.20
0.25
0.30
0.35
0.40
0.45
0.50
2004 2005 2006 2007 2008 2009
Lost
-Tim
e C
laim
s Lo
ss
Rat
ioby
Mod
ified
Pre
miu
m
Non-PEOs LDsPEOs LDs
0.52 0.54 0.55
0.64
0.660.59
0.49 0.470.43
0.51
0.69
0.58
0.20
0.30
0.40
0.50
0.60
0.70
2004 2005 2006 2007 2008 2009
Lost
-Tim
e C
laim
s Lo
ss
Rat
io b
y M
odifi
ed
Prem
ium
Non-PEO RMPEOs RM
0.36
0.35 0.35
0.380.41
0.43
0.32
0.37 0.36
0.31
0.38
0.48
0.20
0.25
0.30
0.35
0.40
0.45
0.50
2004 2005 2006 2007 2008 2009
Lost
-Tim
e C
laim
s Lo
ss
Rat
io b
y M
odifi
ed
Prem
ium
Non-PEO OthPEOs Oth
Source: Workers Compensation Statistical Plan data and Workers Compensation Policy data reported to NCCIVoluntary Market: 37 NCCI ratemaking states; CA, DE, MA, MI, MN, NJ, NY, NC, ND, OH,PA, WA, WI, and WY are excludedResidual Market: 25 NCCI ratemaking states
AK, AL, AR, AZ, CT, DC, GA, ID, IL, IN, IA, KS, MS, MO, NE, NV, NH, NM, OR, SC, SD, TN, VT, VA, and WV are included NCCI is not the residual market plan administrator in IN, TN, MO, and NE

© Copyright 2013 National Council on Compensation Insurance, Inc. All Rights Reserved.
Is It Industry Mix?
• PEO industry mix by payroll is comparable to non-PEO• Loss ratio experience across industry groups is
comparable• Exception: miscellaneous group shows adverse loss
experience for PEO clients• Initial analysis indicates transportation industry
exposure in PEO clients may be a factor
44
Source: Workers Compensation Statistical Plan data and Workers Compensation Policy data reported to NCCI

© Copyright 2013 NCCI Holdings, Inc. All Rights Reserved.
2013 Annual Issues Symposium
This Was Not the End of The Story Behind the PEO Study

© Copyright 2013 National Council on Compensation Insurance, Inc. All Rights Reserved.
The Story Behind the PEO Study
External Push Back!
Required More Investigation
46

© Copyright 2013 National Council on Compensation Insurance, Inc. All Rights Reserved.
The Story Behind the PEO Study:External Push Back
• Anecdotal data suggests that PEOs are problems• Why no apparent material differences between PEO
and non-PEO loss ratios?
Allegations• PEOs may look OK at Second Report
• But reporting delays by PEOs likely result in worse ultimate experience
• PEOs are responsible for the three most recent WC insurer insolvencies
• More PEO data must be excluded from ratemaking because of poor data quality
• PEOs serve as a “front” for “mod washing”
47

© Copyright 2013 National Council on Compensation Insurance, Inc. All Rights Reserved.
Could the Observed Favorable Loss Experience of PEOs Reflect Delays in
Claims Reporting by PEOs?
48

© Copyright 2013 National Council on Compensation Insurance, Inc. All Rights Reserved.
Could the Observed Favorable Loss Experience of PEOs Reflect Delays in
Claims Reporting by PEOs?
An Actuarial Type Examination of PEO Loss Development
49

© Copyright 2013 National Council on Compensation Insurance, Inc. All Rights Reserved.
PEO Claim Development Versus Non-PEO Claim Development
50
1.020
1.025
1.018
1.040
1.0211.019
1.000
1.025
1.050
Voluntary Large Deductible Voluntary Non-Large Deductible Residual Market
Mea
n 20
04–2
006
1:5
Cla
im
Dev
elop
men
t
1:5 Report Claim DevelopmentLost-Time Claims
PEO PEOPEO
StdStd Std
Source: Workers Compensation Statistical Plan data and Workers Compensation Policy data reported to NCCIVoluntary Market: 37 NCCI ratemaking states; CA, DE, MA, MI, MN, NJ, NY, NC, ND, OH,PA, WA, WI, and WY are excludedResidual Market: 25 NCCI ratemaking states
AK, AL, AR, AZ, CT, DC, GA, ID, IL, IN, IA, KS, MS, MO, NE, NV, NH, NM, OR, SC, SD, TN, VT, VA, and WV are included NCCI is not the residual market plan administrator in IN, TN, MO, and NE

© Copyright 2013 National Council on Compensation Insurance, Inc. All Rights Reserved.
PEO Loss Development Versus Non-PEO Loss Development
51
1.278
1.2411.271
1.410
1.285
1.242
1.000
1.250
1.500
Voluntary Large Deductible Voluntary Non-Large Deductible Residual Market
Mea
n 20
04–2
006
1:5
Loss
D
evel
opm
ent
1:5 Report Loss DevelopmentLost-Time Claims
PEO PEO PEO
StdStd Std
Source: Workers Compensation Statistical Plan data and Workers Compensation Policy data reported to NCCIVoluntary Market: 37 NCCI ratemaking states; CA, DE, MA, MI, MN, NJ, NY, NC, ND, OH,PA, WA, WI, and WY are excludedResidual Market: 25 NCCI ratemaking states
AK, AL, AR, AZ, CT, DC, GA, ID, IL, IN, IA, KS, MS, MO, NE, NV, NH, NM, OR, SC, SD, TN, VT, VA, and WV are included NCCI is not the residual market plan administrator in IN, TN, MO, and NE
© Copyright 2013 National Council on Compensation Insurance, Inc. All Rights Reserved.
Were PEOs Responsible for Three Recent Insurer Insolvencies?
An Issue Raised in Florida—Two of the Insurance Companies Domiciled in Oklahoma
52

© Copyright 2013 National Council on Compensation Insurance, Inc. All Rights Reserved.
PEOs and Recent Three Insurer Insolvencies2009 Through 2011
• Great Recession: Client Base Shrank• Small businesses are PEO clients• In the US, more than 200,000 small businesses
vanished between early 2008 and 2010• Insurer Business Models Are a Factor
• In the year prior to insolvency, virtually all of the premium for each of the three carriers was produced by PEO workers compensation insurance policies
• Park Avenue established in 1986 • Pegasus in 1980 • Southern Eagle (2005) was a captive insurance
company
53
Source: NAIC Annual Statement Data

© Copyright 2013 National Council on Compensation Insurance, Inc. All Rights Reserved.
Premium Declined for All Three Insolvencies During Recession
0
2
4
6
8
10
12
14
16
18
20
'04 '05 '06 '07 '08 '09 '10 '04 '05 '06 '07 '08 '09 '10 '04 '05 '06 '07 '08 '09 '10Southern EagleInsurance Co.
Park AvenueP&C Insurance Co.
PegasusInsurance Co.
Net
Writ
ten
Prem
ium
(Dol
lars
in M
illio
ns)
54
Source: NAIC Annual Statement Data

© Copyright 2013 National Council on Compensation Insurance, Inc. All Rights Reserved.
PEOs and Recent Three Insurer Insolvencies
Using Annual Statement data:• Loss reserve analysis • Non-admitted assets and receivables for large
deductibles
55

© Copyright 2013 National Council on Compensation Insurance, Inc. All Rights Reserved.
Southern Eagle Reserve Adequacy
56
ASB DevelopmentPaid
MethodPaid+CaseMethod (Dollars in Thousands)
2005 $ (933.32) $ (268.80) $ (8,281.84)2006 $ (1,429.03) $ (642.64)2007 $ (1,012.29) $ (213.03)2008 $ (2,438.56) $ (1,080.88)2009 $ (3,675.99) $ (1,461.34)2010 $ (2,441.25) $ (966.54)
(Dollars in Thousands) 2010
Surplus $ 8,763.00
Southern Eagle Development w/ASB TailPaid
MethodPaid+CaseMethod (Dollars in Thousands)
2005 $ (933.32) $ (268.80) $ (1,686.31)2006 $ (1,228.88) $ (492.16)2007 $ (653.88) $ (43.01)2008 $ (523.01) $ (62.89)2009 $ 162.90 $ 851.36 2010 $ (484.43) $ 303.51
Source: NAIC Annual Statement Data and NCCI Annual Statistical Bulletin (ASB)

© Copyright 2013 National Council on Compensation Insurance, Inc. All Rights Reserved.
The Story Behind the PEO Study
More Feedback
Even More Investigation
57

© Copyright 2013 National Council on Compensation Insurance, Inc. All Rights Reserved.
Allegation:
There Is More Litigation in PEO Claims
58

© Copyright 2013 National Council on Compensation Insurance, Inc. All Rights Reserved.
Why More Litigation for PEOs?
Allegations• Prompt Handling of Claims Is Important:
• Geographical separation between PEO and client and injured worker is a potential problem
• Inconsistent Policy Data:• Claims class codes may not line up with policy
exposure class codes • Large number of client class codes and churning of
PEO clients
59

© Copyright 2013 National Council on Compensation Insurance, Inc. All Rights Reserved.
Attorney Involvement and ALAE
• Allocated Loss Adjustment Expense (ALAE) • Accumulation of expenses incurred in investigating
and settling claims, assignable to specific claims• Examples: legal fees, adjusting fees, court costs, medical
costs containment expenses, services required by law or insurance regulation
• NCCI data:• Paid ALAE in IDB
60

© Copyright 2013 National Council on Compensation Insurance, Inc. All Rights Reserved.
PEO Claims ALAE Costs Are Slightly Higher Relative to Losses
Reporting Period Paid ALAE/IND+MED @2nd Report
61
14.0%
11.1% 11.2%
12.9%
14.2%15.0%
9.1% 9.4% 9.7% 10.1% 10.4% 10.6%
0%
2%
4%
6%
8%
10%
12%
14%
16%
2004 2005 2006 2007 2008 2009
Perc
enta
ge o
f Pai
d A
LAE
to
Paid
Los
ses
for L
ost-T
ime
Cla
ims
Policy Year
PEO non-PEO
Source: Workers Compensation Statistical Plan data and Workers Compensation Policy data reported to NCCI

© Copyright 2013 National Council on Compensation Insurance, Inc. All Rights Reserved.
Evidence Is Consistent with the Allegation:
There Likely Is More Litigation Associated with PEO Claims
62

© Copyright 2013 National Council on Compensation Insurance, Inc. All Rights Reserved.
Allegation:
PEOs Have More Data Excluded Because of Quality Concerns
63

© Copyright 2013 National Council on Compensation Insurance, Inc. All Rights Reserved. 64
0.065%
1.303%
0.154%
2.463%
0.00%
0.50%
1.00%
1.50%
2.00%
2.50%
3.00%
Portion of Excluded Policies Portion of Excluded Premium
Port
ion
of E
xclu
ded
Dat
a 20
09
PEO non-PEO
2009 Data
PEOs Have a Lower Portion of Excluded Data Versus Non-PEOs
Source: Workers Compensation Statistical Plan data and Workers Compensation Policy data reported to NCCIExclusion indication from NCCI Class Ratemaking data

© Copyright 2013 National Council on Compensation Insurance, Inc. All Rights Reserved. 65
0.065% 1.303%0.154% 2.463%0%
20%
40%
60%
80%
100%
Portion of Excluded Policies Portion of Excluded Premium
Port
ion
of E
xclu
ded
Dat
a 20
09
PEO non-PEO
2009 Data
PEOs Have a Lower Portion of Excluded Data Versus Non-PEOs
Source: Workers Compensation Statistical Plan data and Workers Compensation Policy data reported to NCCIExclusion indication from NCCI Class Ratemaking data

© Copyright 2013 National Council on Compensation Insurance, Inc. All Rights Reserved.
PEO and WC Experience Rating System
A “Front” for “Mod Washing”?
66

© Copyright 2013 National Council on Compensation Insurance, Inc. All Rights Reserved.
PEO and WC Experience Rating System
Approximately 90% of PEO Clients Do Not Qualify for Experience Mods
67

© Copyright 2013 National Council on Compensation Insurance, Inc. All Rights Reserved. 68
Only a Tiny Fraction of All RisksDisappear for Two to Three Years, Then Return
All Other 1-Year Data Gap 2-Year Data Gap 3+ Years Data Gap
Porti
on o
f Ris
ks
0.0
0.2
0.4
0.6
0.8
1.0
0.9774
Source: Workers Compensation Statistical Plan data and Workers Compensation Policy data reported to NCCIAnalysis is conducted on risks with a policy in PY 2005; All risks are tracked over the period from PY 2001 to PY 2010 (inclusive) Active continuous coverage prior to PY 2001 does not contribute to the length of active continuous coverage (i.e., "Time")
© Copyright 2013 National Council on Compensation Insurance, Inc. All Rights Reserved. 69
PEO Loss Experience in VOL and AR Markets
Matched Exposure at Class Code Level

© Copyright 2013 National Council on Compensation Insurance, Inc. All Rights Reserved. 70
Over Time PEO Exposure in AR ShrankMatched Exposure to PEO Class Codes
by State and by Policy Year
0
0.1
0.2
0.3
0.4
0.5
0.6
0.7
0.8
0.9
2003 2004 2005 2006 2007 2008 2009 2010
Total Loss R
atios b
y Mod
ified
Premium
nonPEO_LR_VOL PEO_LR_VOL nonPEO_LR_AR PEO_LR_AR

© Copyright 2013 National Council on Compensation Insurance, Inc. All Rights Reserved. 71
Differences in Loss Ratios Across States
Matched Exposure at Class Code Level
© Copyright 2013 National Council on Compensation Insurance, Inc. All Rights Reserved. 72
FL05
TX05
GA05
IL05AZ05 OK05 CO05
SC05
TN05
MO05
HI05
AL05
0
0.1
0.2
0.3
0.4
0.5
0.6
0.7
0.8
0.9
1
‐1 4 9 14 19 24 29 34 39
Total Loss Ra
tios @ 2nd
Rep
ort
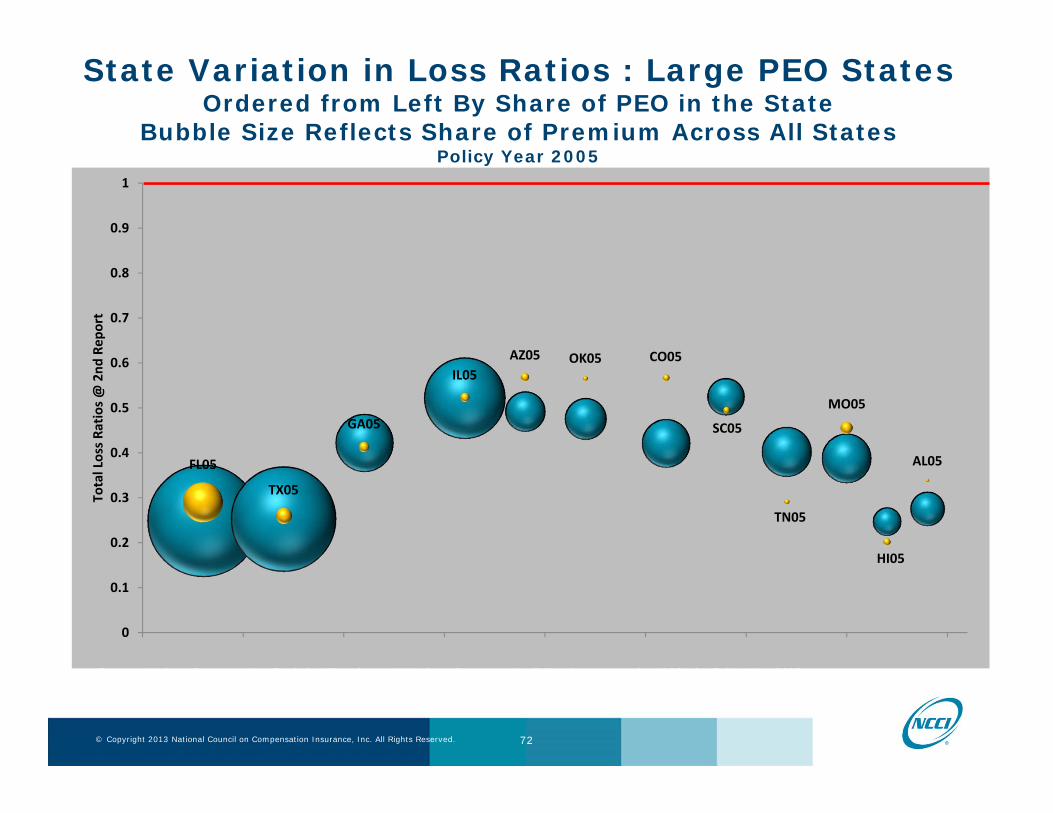
Source: Workers Compensation Statistical Plan data and Workers Compensation Policy data reported to NCCI, for Policy Year 2005Non-PEO exposure matched to PEO exposure at class code level by state by policy year
State Variation in Loss Ratios : Large PEO StatesOrdered from Left By Share of PEO in the State
Bubble Size Reflects Share of Premium Across All StatesPolicy Year 2005

© Copyright 2013 National Council on Compensation Insurance, Inc. All Rights Reserved. 73
FL09
TX09
GA09
IL09
AZ09
OK09
WV09
CO09
SC09
TN09
MO09
HI09
AL09
0
0.1
0.2
0.3
0.4
0.5
0.6
0.7
0.8
0.9
1
‐1 4 9 14 19 24 29 34 39
Total Loss Ra
tios @ 2nd
Rep
ort
Source: Workers Compensation Statistical Plan data and Workers Compensation Policy data reported to NCCI, for Policy Year 2009Non-PEO exposure matched to PEO exposure at class code level by state by policy year
State Variation in Loss Ratios : Large PEO StatesOrdered from Left By Share of PEO in the State
Bubble Size Reflects Share of Premium Across All StatesPolicy Year 2009
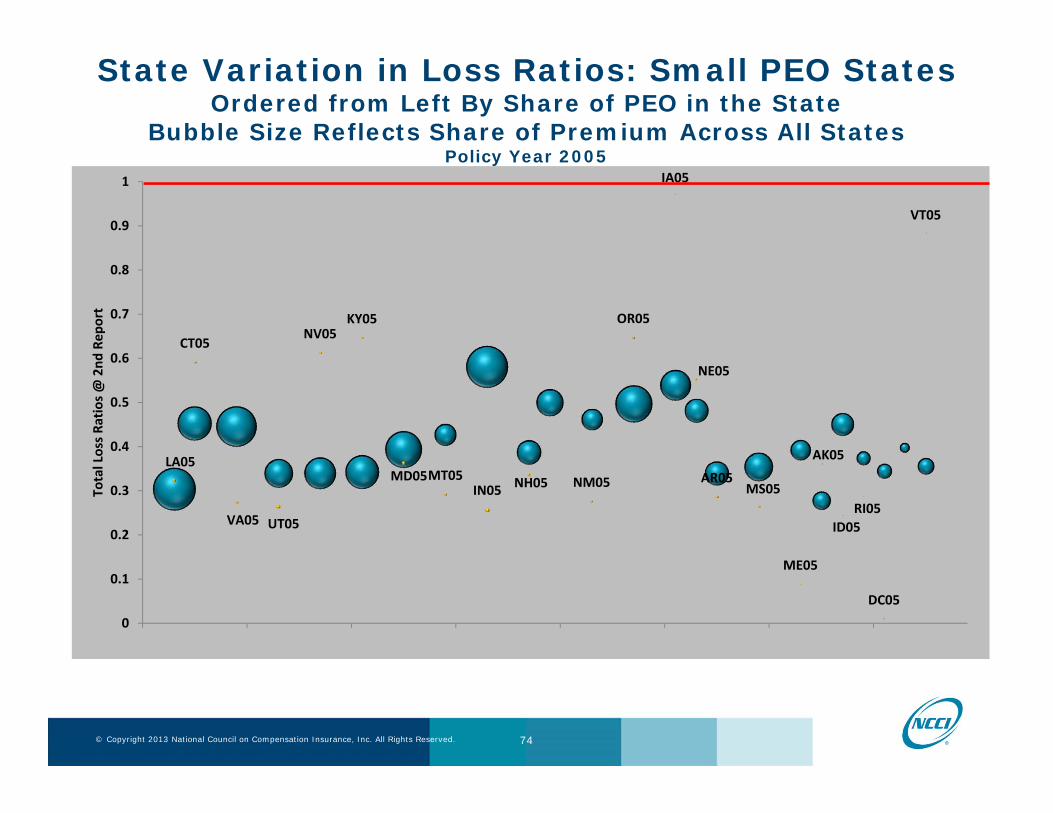
© Copyright 2013 National Council on Compensation Insurance, Inc. All Rights Reserved. 74
LA05
CT05
VA05 UT05
NV05KY05
MD05MT05IN05 NH05 NM05
OR05
IA05
NE05
AR05MS05
ME05
AK05
ID05RI05
DC05
VT05
0
0.1
0.2
0.3
0.4
0.5
0.6
0.7
0.8
0.9
1
43 48 53 58 63 68 73 78
Total Loss Ra
tios @ 2nd
Rep
ort
Source: Workers Compensation Statistical Plan data and Workers Compensation Policy data reported to NCCI, for Policy Year 2005Non-PEO exposure matched to PEO exposure at class code level by state by policy year
State Variation in Loss Ratios: Small PEO StatesOrdered from Left By Share of PEO in the State
Bubble Size Reflects Share of Premium Across All StatesPolicy Year 2005

© Copyright 2013 National Council on Compensation Insurance, Inc. All Rights Reserved. 75
LA09
CT09VA09
UT09
NV09
KY09
MT09
IN09
NH09
KS09
NM09
OR09
IA09
NE09
AR09
MS09
ME09
AK09
ID09
RI09
SD09
0
0.1
0.2
0.3
0.4
0.5
0.6
0.7
0.8
0.9
1
43 48 53 58 63 68 73 78
Total Loss Ra
tios @ 2nd
Rep
ort
Source: Workers Compensation Statistical Plan data and Workers Compensation Policy data reported to NCCI, for Policy Year 2009Non-PEO exposure matched to PEO exposure at class code level by state by policy year
State Variation in Loss Ratios: Small PEO StatesOrdered from Left By Share of PEO in the State
Bubble Size Reflects Share of Premium Across All StatesPolicy Year 2009
© Copyright 2013 National Council on Compensation Insurance, Inc. All Rights Reserved. 76
Differences in Loss Ratios Across States
Voluntary Vs. Assigned RiskRelatively Comparable within a State
Varies Across StatesLoss Ratios Typically Well Below 100%
Matched Exposure at Class Code Level

© Copyright 2013 National Council on Compensation Insurance, Inc. All Rights Reserved. 77
PEO Size and Loss ExperienceMatched Exposure at Class Code Level

© Copyright 2013 National Council on Compensation Insurance, Inc. All Rights Reserved. 78
Loss Ratios for Individual PEOs
Organized by Size of PEO
Matched Exposure at Class Code Level

© Copyright 2013 National Council on Compensation Insurance, Inc. All Rights Reserved. 79
Many More Small PEOSGreater Variability in Loss Ratios
Policy Year 2007 @2nd ReportBubble Size
1 Million Premium
0.33 0.32 0.30 0.32 0.40 0.35 0.45 0.29
‐1.00
0.00
1.00
2.00
3.00
4.00
5.00
6.00
7.00
Loss‐Tim
e Claims L
oss R
atio
By M
odified
Premium
Bin 1 Bin 2 Bin 3 Bin 4 Bin 5 Bin 6 Bin 7 Bin 8
Premium SharePEO Count ShareSource: Workers Compensation Statistical Plan data and Workers Compensation Policy data reported to NCCI, for Policy Year 2007
PEO Business Entity with premium below 5,000 dollars are excluded due to concern of data reporting and challenge in tracking. This excludes 0.04 percent of premium along with 0.004 percent of losses, therefore, there is not material impact to the analysis.
Share of premiumShare of PEOs

© Copyright 2013 National Council on Compensation Insurance, Inc. All Rights Reserved. 80
Salience* and PEO Loss Ratios
Workers Comp and Public Health Professionals Are Aware of and Have Concerns about PEOs.
Although Not Material in Terms of Market Share,
The Large Number of Small PEOs with Poor Claims Experience and Loss Ratios Will Be Noticed and
Remembered.
* Salience: “an item that stands out relative to neighboring items.”

© Copyright 2013 National Council on Compensation Insurance, Inc. All Rights Reserved.
Takeaway
Investigate Rather Than Just Speculate
• It Typically Will Be a Challenge• If it were easy, it likely would have been done
• Expect Resistance to Initial Results• Especially if the findings differ materially from the
ex ante speculation• Be Your Own Greatest Skeptic
• Challenge your findings—you should know more about the subject than anyone else
81

© Copyright 2012 National Council on Compensation Insurance, Inc. All Rights Reserved.
Questions