NCAT Pavement Test Track - Purdue Engineeringspave/old/Technical Info/AFK10... · • NCAT Pavement...
30
NCAT Update AFK10 Annual Meeting March 17, 2004
Transcript of NCAT Pavement Test Track - Purdue Engineeringspave/old/Technical Info/AFK10... · • NCAT Pavement...

NCAT Update
AFK10 Annual MeetingMarch 17, 2004

2
NCAT Activities
• Automated QC & Real-time Testing• NCAT Pavement Test Track• Laboratory Performance Testing Of OGFC Mixtures• Verification Of Superpave Ndesign Compaction
Levels• Noise Characteristics Of Hot Mix Asphalt Pavement•• International Symposium International Symposium -- Design And Construction Design And Construction
Of Long Lasting Asphalt PavementsOf Long Lasting Asphalt Pavements

3
• Can we assure agencies of product quality in a simpler and more efficient manner?
• What do we need to measure?• Can we automate those measurements
(remove the human element)?– minimize sampling & testing errors– increase frequency of measurements– provide rapid feedback (data acquisition/output)
Automated QC & Real-Time Testing

4
Belt Sampling Device• Removes sample of aggregate
while plant is running.• Plan to have a belt sampler on
aggregate incline conveyor and RAP conveyor

5
Aggregate Sample Drier
• Receives aggregate from belt sampler and dries it before the automated gradation device.

6
Automatic Gradation Unit• Sieves/weighs aggregate to
produce gradation.• Currently does not sieve
fine sizes (< No.8 sieve)• Data sent to PC in control
house or lab

7
Automated Asphalt Content Using Plant Controls
We already measure binder flow rate (gal./min. → tons/hr) with a flow meter or non-powered positive displacement pump.
And we measure feed rates of aggregates and RAP (tons/hr) with belt scales, tachometers and a computer integrator

8
In-Line Viscometer & Temperature System
• Measures the viscosity & temperature of the binder.
• Mounts on a by-pass line from AC tank to injection point.

9
National Center for Asphalt Technology1600 Lee Road 151Opelika, AL 36804
(334) 844-6855

10
FINAL RUTTING ON 2000 TRACK
5.1
4.0
2.53.1
3.8
2.8
3.5
2.01.82.12.0
7.3
5.3
7.1
3.8
1.6
0.90.5
0.91.4
2.1
3.4
4.9
2.3
3.1
5.2
3.5
1.82.0
4.8
3.4
2.21.8
0.50.50.70.7
2.1
3.3
1.82.0
4.1
1.6
2.5
1.6
6.4
0.00
2.00
4.00
6.00
8.00
10.00
12.00
E2 E4 E6 E8
E10 N2 N4 N6 N8
N10 N12 W1
W3
W5
W7
W9 S1 S3 S5 S7 S9
S11 S13
Sections in Order of Construction
Tota
l Rut
ting
via
Mul
tiple
Str
ingl
ines
(mm
)

11
2003 MIXED EXPERIMENT
Red – Mill and Inlay New Rutting Sections (14)
Blue – Excavate and Install New Structural Sections (8)
Black – Extend Original Rutting Study to 20M ESALs (23)

12
STRUCTURAL EXPERIMENT

13

14
Laboratory Performance Testing of OGFC Mixtures

15
Areas Needing Evaluation
• Draindown• Raveling• Permeability

16
Effect of Fiber and PG on Draindown
0
0.1
0.2
0.3
0.4
0.5
0 1 2 3 4 5
Without Fiber
With
Fib
erPG 67-22PG 76-22

17
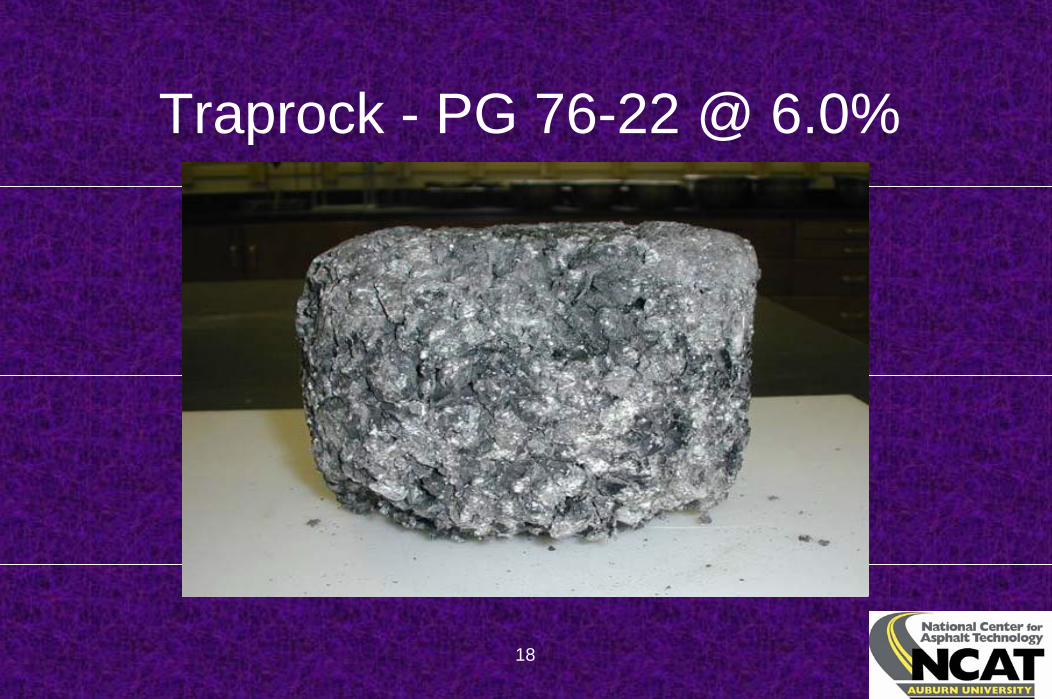
Traprock – Pg 67-22 @ 6.0%
Before
After
18
Traprock - PG 76-22 @ 6.0%

19
Permeability Results - Granite
Gradation Binder AC(%) Perm. (m/day)fine 67-22 6 66.8fine 76-22 6 70.8fine 76-34 6 45.2
medium 67-22 6 68.3medium 76-22 6 135.2medium 76-34 6 49.9coarse 67-22 6 141.6coarse 76-22 6 136.6coarse 76-34 6 108

20
VERIFICATION OF SUPERPAVE NDESIGN COMPACTION LEVELS

21
Marshall Projects Averaged 0.3% More AC
3.00
3.50
4.00
4.50
5.00
5.50
6.00
6.50
1 3 5 7 9 11 13 15 17 19 21 23 25
Project
Asp
halt
Con
tent
(%)
MarshallSuperpave
Asphalt Content Comparison - All Mixes

22
Rutting Comparison
0.000.05
0.100.150.200.25
0.300.350.40
0.450.50
1 3 5 7 9 11 13 15 17 19 21 23 25
Project
Rut
Dep
th (i
n)
MarshallSuperpave
Rut Depth Comparison

23
Relationship of VMA to Mix Type and Design Method
Mix Type
VM
A
19.012.5
18
17
16
15
14
13
19.012.5
1 2
Individual Value Plot of VMA vs Mix Type
Panel variable: Mix Method
9.5 12.59.5 12.5
9.5 12.59.5 12.5
24
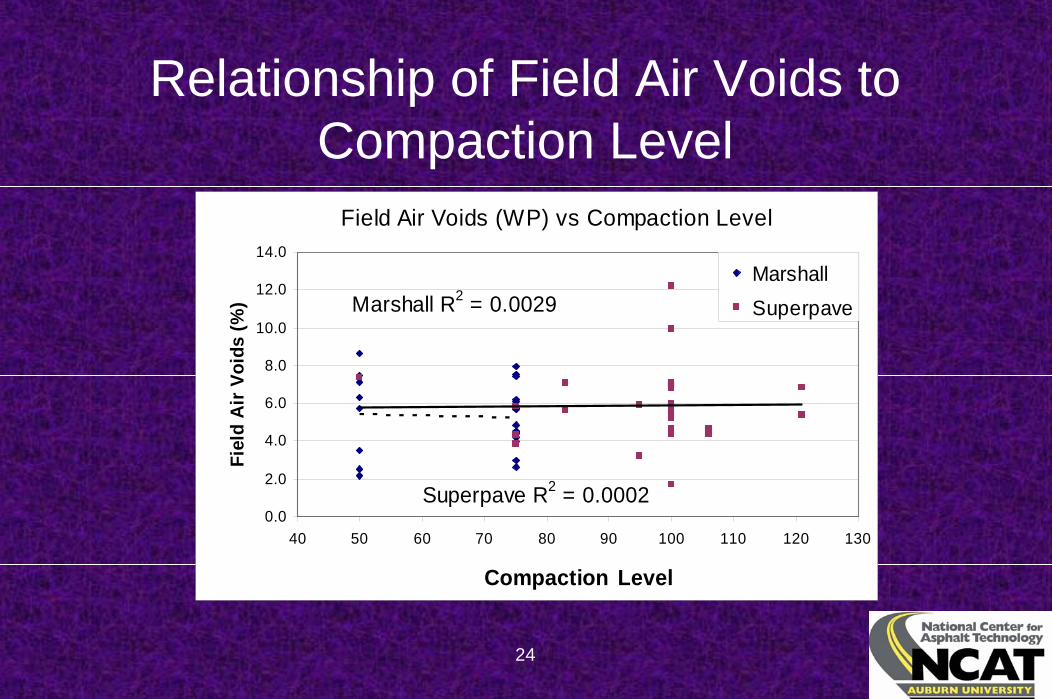
Relationship of Field Air Voids to Compaction Level
Marshall R2 = 0.0029
Superpave R2 = 0.00020.0
2.0
4.0
6.0
8.0
10.0
12.0
14.0
40 50 60 70 80 90 100 110 120 130
Compaction Level
Fiel
d A
ir V
oids
(%)
MarshallSuperpave
Field Air Voids (WP) vs Compaction Level

25
Relationship of Air Voids to Traffic Volume
WP Air Voids vs Traffic
Superpave R2 = 0.0002Marshall
R2 = 0.01420.0
2.0
4.0
6.0
8.0
10.0
12.0
14.0
0 10,000 20,000 30,000 40,000
Traffic (ADT)
Air
Void
s (%
)
MarshallSuperpaveLinear (Superpave)Linear (Marshall)

26
Noise Characteristics of Hot Mix Asphalt Pavement

27
Tire/road noise generation
Road surface
Driving direction Block‘snap out’
Blockimpact
Contact length
Air pumping/resonance

28
Pavements tested• Locations
– NCAT test track, Michigan, Alabama, New Jersey, Maryland, Colorado, Nevada, California, Arizona, Texas
• Numbers of surfaces tested– Total – 221 surfaces– HMA – 178 surfaces– PCCP – 43 surfaces

29
Summary of DataWearing Course
Average Low High
PCC 101 97 106AC 98 93 101SMA 97 93 100Nova Chip 98 95 99OFGC – C 97 95 98OGFC - F 95 92 98

30
International Symposium onInternational Symposium onDesign and Construction ofDesign and Construction of
Long Lasting Asphalt PavementsLong Lasting Asphalt Pavements
June 7 June 7 -- 9, 20049, 2004