
NBS/EPA energy environment project: semi-annual report to ...
124
^ 100 . U56 A 78-1540 12 - IS<^0 N8S Publi*';^-- cations ^ =s- ' ;., EPA-IAG-D8-E684 AlllDH 3bDb4fi NBS/EPA ENERGY ENVIRONMENT PROJECT SEMI-ANNUAL REPORT TO ENVIRONMENTAL PROTECTION AGENCY OFFICE OF ENERGY, MINERALS, AND INDUSTRY WASHINGTON, D. C. 20460 FEBRUARY 1979 U. S. DEPARTMENT OF COMMERCE NATIONAL BUREAU OF STANDARDS WASHINGTON, D. C. 20234
Transcript of NBS/EPA energy environment project: semi-annual report to ...

^ 100
. U56 A78-1540
12 - IS<^0
N8SPubli*';^--cations ^
=s-
'
;., EPA-IAG-D8-E684
AlllDH 3bDb4fi
NBS/EPA ENERGY ENVIRONMENT PROJECT
SEMI-ANNUAL REPORT
TO
ENVIRONMENTAL PROTECTION AGENCY
OFFICE OF ENERGY, MINERALS, AND INDUSTRY
WASHINGTON, D. C. 20460
FEBRUARY 1979
U. S. DEPARTMENT OF COMMERCE
NATIONAL BUREAU OF STANDARDS
WASHINGTON, D. C. 20234

fl

d!«4icrMrf1‘^UO
EPA-IAG-D8-E684
NBS/EPA ENERGY ENVIRONMENT PROJECT
SEMI-ANNUAL REPORT
TO
ENVIRONMENTAL PROTECTION AGENCY
OFFICE OF ENERGY, MINERALS, AND INDUSTRY
WASHINGTON, D. C. 20460
FEBRUARY 1979
j
U. S. DEPARTMENT OF COMMERCE
NATIONAL BUREAU OF STANDARDS
1 KASHINGTON, D. C. 20234
i
FOREWORD
The role of the National Bureau of Standards (NBS) in the
Interagency Energy/Environraent R§D program, coordinated by
the Office of Research and Development, U. S. Environmental
Protection Agency, is to provide those services necessary to
assure data quality in measurements being made by a wide
variety of Federal, state, local, and private industry par-
ticipants in the entire program. The work at NBS is under
the direction of the Office of Environmental Measurements and
is conducted in the Center for Analytical Chemistry and the
Center for Radiation Research. NBS activities are in the
Characterization, Measurement, and Monitoring Program category
and addresss data quality assurance needs in the areas of air
and water measurement methods, standards, and instrumentation.
NBS outputs in support of this program consist of the develop-
ment and descript ion of new or improved methods of measurement,
studies of the feasibility of production of Standard Reference
Materials for the calibration of both field and laboratory
instruments, and the development of data on the physical and
chemical properties of materials of environmental importance
in energy production. This report is one of a series issued
every six months by NBS to provide information to the interagency
Energy/Environment community on the status of methods, standards
and data projects at NBS. Detailed project information is also
provided in the Interagency Energy/Environment Research and
Development Series.
C. C. GravattChief, Office of Environmental MeasurementsNational Bureau of Standards
ii
\
INTRODUCTION AND SUMMARY
This report describes work performed by the National Bureau of
Standards (NBS) during the period, July 1978 to January 1979,
under the Interagency Agreement (ERA/ lAG -D8 -E68 4) between the
U. S. Environmental Protection Agency and NBS. This agreement
covers the development of standards, methods, data, and instrumen-
tation for the measurement of pollutants associated with energy
production and use. The categories for this reporting period are
represented by seven subagreement areas and are reported as
follows
:
80 BCKa — Energy Related Pollutant Measurement and Instrumentation
Development
Under the task Energy-Re lated Water Pollutant Analysis Instrumen-
tation work done with the cerium oxidative detection system for
detection of phenols in the effluent of a liquid chromatograph was
found to have a detection limit in the order of 10 ng phenol.
A new type of probe was also constructed for LC-MS interface, and
use of iso-octane solvent was found to provide better results.
Studies done in the area of particulate analysis using secondary
ion mass spectra from organic layers was applied to metallic
particles
.
In the laser-enhanced ionization (LEI) area, work focused
primarily on improved refinements in the detection limit table,
completion of a workable theoretical model to explain and predict
experimental sensitivities and initial real sample measurements.
LEI has been demonstrated for 18 elements in water at the sub-ppm
level
.
iii
80 BCKb — Energy Related Water Pollutant Analysis Instrumentation
A project has been initiated this period on the development of
Specific Immunoassays for Dinitrophenols in Water, DNA-conj ugated
proteins were produced to be used in the assay of purchased
antisera. All antisera were assayed for specificity and titre by
double gas diffusion and passive hemagglutination.
Under generation of Enhanced CARS Spectra of Organic Liquids in
Capillary Waveguides, a new approach to analysis of organic
compounds in liquid phase by Raman Spectroscopy has been developed.
This technique can be adapted to a flow-through geometry coupled
to HPLC, to improve the detection sensitivity of such systems.
80 BCLa — Energy Related Pollutants and Effects Monitoring and
Associated Methods and Te'chniques Development
Under the task Development of SRMs for Stationary Sources Asso-
ciated with Energy Production, results of analyses of two concen-
trations of NO^ in air suggests a degree of stability suitable for
a possible SRM. Under Development of SRMs for the Monitoring of
Ambient Air Impacted by Emissions Resulting from Energy Production,
study of feasibility of a low concentration sulfur dioxide-in-air
compressed gas SRM has been completed. Due to instability of
cylinders these gas mixtures would not serve as satisfactory SRMs,
but possibly as secondary standards. Results obtained thus far
show a slow decline in the concentration of nitric oxide, which
would make mixtures in the concentration range of 1500 ppm unsuit-
able as SRMs. High concentrations of hydrocarbons were found in
samples of carbon monoxide-in-air in cylinders lined with ceresin
wax. The Computer -Operated Gas Analysis System (COGAS) has been
modified and programmed to automatically analyze gas SRMs using
gas chromatographic and other discontinuous analyzers. This system
is now being used routinely for certification of all gas SRMs.
\
IV

Under Develop Methods for Dispersal of Particulates on Filter
Media and Methods for Determining and Controlling the Composition
and Morphology of such Dispersed Particulates, work was concen-
trated on focused ion-beam sputtering. The larger machine used
produced films whose composition was closer to the bulk target
composition for Ca, Zn, and Pb . Results thus far indicate that
ion acceleration voltage and ion-beam current determine the rate
at which the sputtered secondary atoms leave the surface of the
target, with no significant change in the film composition. Also,
the addition of oxygen to the sputtering atmosphere appears to
increase the content of ZnO and PbO in the films and decrease the
amount of trapped argon in the films.
In work with the Particle Doppler Shift Spectrometer, progress has
been made in the optical configuration, chamber design and in the
data collection method. Also, for the first time, experimental
data reproducibility matches the calculated Mie Scattering Curve
features over a broad range of sizes.
The Ion Chromatograph instrument is now fully operational and has
been used to analyze diverse sample types. In addition to sulfate
and nitrate on glass fiber filters, other sample types analyzed
were lyophilized oyster tissue, mechanical packing products,
penetrant inspection materials, and waste oil.
A mul ti - element radioanalyt ical procedure for the simultaneous
determination of As, Cr, Se,
Sb,
Cd, and Cu was developed and
applied to a new Fly Ash SRM (1633a) and a new Sub -bituminous
Coal SRM (1635)
.
Preliminary analysis of a proposed Oil Shale SRM has been done
by INAA for elements having intermediate and long-lived neutron
irradiation products. Concentrations of 30 elements can be
determined by INAA.
V

80 BCLb - Energy Related Air Pollutant Analysis Instrumentation
Under the task Development of an Instrument to Measure Airborne
Sulfate Particulate Matter, field calibration results were
compared with laboratory calibration results. Laboratory results
showed considerable scatter, as well as systematic dependence on
both SO^ and relative humidity. In comparison to field calibra-
tion, in cases where sample is humidified and where SO2
is present,
agreement with laboratory calibration was found to be good.
80 BCLc — Energy Related Pollutant and Effects Monitoring and
Associated Methods and Techniques Development
Under the task Radiocarbon as an Environmental Tracer, the results
of the feasibility of mini-low level counting (lie) of radiocarbon
to distinguish anthropogenic from natural pollutant sources using
only mg sample sizes, have been published. Further extention of
the capabilities of this technique in terms of sample size, through-
put and quality control have been undertaken. Experiments to apply
the llo method to two specific environmental problems have been
undertaken: (a) in Oregon, to resolve the contribution of field
and slash burning, wood stoves, natural emissions, fossil fuel
combustion etc., to the total particle load; and (b) in Washington,
a study to relate to the organic fraction in marine sediments.
Activities directed toward measurement accuracy and model validity
also have taken place. These applications served to increase the
discriminating po\\/er of the llo method through addition of chemical
and physical selectivity.
Also development of capabilities through the use of accelerator
mass spectrometry, large low-background proportional counters,
stable isotope analysis, and trace gas radiocarbon analyses were
also under investigation.
\
VI
80 BCMa - Energy Related Pollutants and Effects Monitoring and
Associated Methods and Techniques Development
Under Energy Related Water Pollutant Standard Reference Materials,
material for the Estuarine Sediment SRM is being analyzed by
neutron activation analysis. Certification of a larger trace
element - in-water SRM is in progress.
A report, entitled "The Quantitative Removal of the Alkali and
Alkaline Earth Elements from the Trace Transition Elements in Sea
Water Using Chelating Resin, and its Application to Analytical
Instrumental Techniques," has been completed.
In the Inductively Coupled Plasma (ICP) technique, an operational
approach was chosen to examine the statistical behavior of all
channel-to-channel ratios during a normal analysis time period.
Results indicate that, with proper choice of an internal standard,
variability of response can be improved by a factor of two,
provided that the s ignal - to -background ratio for the analyte
element is ten or greater.
The procurement process for the production of an aqueous PAH
SRM is presently in progress.
A direct injector is being developed that places a liquid sample
on the head of the capillary column, bypassing the normal heated
injection port, without adversely affecting chromatographic
resolution, and has been found to be solute boiling point
independent
.
Data on the work related to the phenols - in -i\rater SRM have shown
that concentrations of phenol, o-cresol, and p-cresol remained
constant throughout a 27-month study while the concentrations of
2-naphthol and 2 , 4 ,6 - trimethylphenol were found to decrease with
vii

time. The most probable cause for such losses were attributed to
adsorptive losses to the walls of the glass ampoules. Also,
radiation sterilization was found not to be a practical means of
quenching biological activity.
80 BCN — Radiological Pollutant Quality Assurance
This work includes the completion of the calibration of natural
isotopic uranium and continuation of the measurement of the
half-life of plutonium- 241 . Fly Ash from combustion of eastern
United States Coal is being assayed for radium-226 and radium-228.
Tests on the radioactivity in SRM 1653, Trace Elements in Coal
Fly Ash, continue. Gamma ray measurements using Ge(Li) for the
determination of radium-228 are in progress. Six test sources
have been provided to QAB and one result reported to MBS.
viiiV

TABLE OF CONTENTS
Page
FORWARD ii
INTRODUCTION AND SUMMARY. iii
LIST OF FIGURES xiii
LIST OF TABLES xv
80-BCKa-ENERGY RELATED POLLUTANT MEASUREMENT ANDINSTRUMENTATION DEVELOPMENT
1 Energy-Related Water Pollutant AnalysesInstrumentation 1
1 . a Development of Marker Compounds 1
1 . b Application of Selective Detectors to LiquidChromatography . . ! ! ! ! ! [ ! ^ ^ 1
l.c Liquid Chromatography -Mas s Spectrometry ....... 4
1 . d Feasibility Study of Application of ParticulateAnalysis by Ion Microprobe 6
1 . e Liquid Chromatography with ElectrochemicalDetection of Organometallic Compounds 10
l.£ Laser Enhanced Ionization 10
80-BCKb-ENERGY RELATED WATER POLLUTANT ANALYSISINSTRUMENTATION
1 Development of Measurement Methods for Non-VolatileOrganic Pollutants in Water due to EnergyTechnologies 25
1 . a Raman Microprobe Characterization of TracePolynuclear Aromatic Hydrocarbons 23
1 . b Development of Specific Immunoassays forDinitrophenols in Water 23
l.c LC-MS 27
l.d LC-EC 27
IX

Page
l.e Ion - Probe 27
1 . f Generation of Enhanced CARS Spectra of OrganicLiquids in Capillary Waveguides 27
80 -BCLa -ENERGY RELATED POLLUTANTS AND EFFECTS MONITORING ANDASSOCIATED METHODS AND TECHNIQUES DEVELOPMENT
1 Development of SRMs for Stationary SourcesAssociated with Energy Production 28
l.a NO2
in Air Gas Blend SRMs 28
l.b SO^ inN^ SRMs 2 8
l.c NO in N^ SRMs 2 8
1.
d O2
in N^ and CO2
in N2
SRMs 29
2 Development of SRMs for the Monitoring of AmbientAir Impacted by Emissions Resulting from EnergyProduction 29
2 . a SO2
in Air 29
2.
b CO in Air : 31
2.
C Automation of Gas Analysis 31
3 Develop Methods for Dispersal of Particulates onFilter Media and Methods for Determining and'
Controlling the Composition and Morphology ofSuch Dispersed Particulates . ! ! ] !! ] ! ] T .... 32
3.
a NBS-SRM 1648 Urban Particulate Matter 32
3.b Synthetic Ground Glasses Deposited on Filters .... 32
3
.
c Thin Glass Films Produced by Focused-Ion BeamSputtering 32
4 Particulate Physical and Chemical Characterization . . 38
d.a.b.c Particle Doppler Shift Spectrometer (PDSS) 38
4.
d.e Development of Air Supported Plasmas 40
5 Particulates on Glass Fiber Filters . . 40
5.
a.i lon-Chrom.atography 40
X
N

Page
5 , a . ii Lead, Sulfate, and Nitrate on Filter Media. .... . 49
6 Urban Air Particulate Washinston D. C. Sample . . . . 50
7 Develop SRMs for Coal Conversion Processes and
Materials Balance Determinations. . 50
8 Development of an Oil Shale SRM • . 52
80-BCLb-ENERGY RELATED AIR POLLUTANT ANALYSIS INSTRUMENTATION
1 Development of an Instrument to Measure Airborne
Sulfate Particulate Matter. ! ! TT T~I T~ ! 1 . . .
80 -BCLc -ENERGY RELATED POLLUTANTS AND EFFECTS MONITORING AND
ASSOCIATED METHODS AND TECHNIQUES DEVELOPMENT
]_ Radiocarbon as an Environmental Tracer 62
80 -BCMa-ENERGY RELATED POLLUTMTS AND EFFECTS MONITORING AND
ASSOCIATED METHODS AND TECHNIQUES DEVELOPMENT
1 Energy Related Water Pollutant Standard Reference_
Materials ‘
l.a Complete Certification of Ocean Sediment SRM . . . . .
l.b.i Estuarine Sediment, Proposed SRM 1646 ........
. b . i i Preconcentration and Separation of Sea Water*
Transition Elements •
1 . c Anions in Water SRM . . . .
l.d Anion SRM
1.
e Anion and Trace Elements in Water SRM
1 f The Role of Internal Standardization in Analysis
of Aqueous Samples Using the inductively Coupled-
Plasma (.ICPJ lechnique . ! ! ^ ^ ^ ^ ^ ^ ....
2 SRMs for Organic Analysis
2.
a/b Production of an Aqueous PAH SRM
2 , c Development of a Phenols - in-Water SRM
79
79
79
79
80
80
80
80
83
83
85
XI

Page
2 . d Development of SRMs for Organics in Sedimentand Biota 87
2 . e Spectroscopic Certification Technique for Analysisot Trace Organics in Water SRM 87
80 -BCMb -ENERGY RELATED POLLUTANTS AND EFFECTS MONITORING ANDASSOCIATED METHODS AND TECHNIQUES DEVELOPMENT
1 Develop Organic Standard Reference Materials forthe Calibration of Energy-Related Water PollutantMeasurement Methods ! ! T ] ! ] ! ! ! ! ! ^ i T . . 9 7
80-BCN-RADIOLOGICAL POLLUTANT QUALITY ASSURANCE
1 Develop Calibrated Radioactive Materials forRadiological Pollution Associated with Nucl'e'ar
and Coal Energy Sources and Production 98
1 . a Solution of Natural Isotopic Uranium, and Solutionof Plutonium- 241 . ! ! ! ! ! ! ! ! ! ! ! ! ! ! ! ! . . 9
8
l.b Fly Ash from Coal Combustion L . . . 98
2 Measurement Traceability Studies with the Quality -
Assurance Branch of EPA-LVY ! ! ^ ! i [ ! T ! ! T . . 100
APPENDIX I NBS Certificate of Analysis SRM 1648,Urban Particulate Matter 54
APPENDIX II Resolution of Spectral Peaks: Use ofEmpirical Peak Shape 74
APPENDIX III Advances in the Discrimination of Naturalfrom Anthropogenic Carbonaceous Pollutantsvia Isotopes of Carbon 75
APPENDIX IV NBS Certificate of Analysis SRM 1645,River Sediment 89
APPENDIX V Request for Bid Submitted to DOC for PAH SRM , 92
APPENDIX VI Report of Calibration — Uranium Solution ofNatural Isotopic Composition 102
APPENDIX VII Report of Test — Hydrogen-3 RadioactivityTest Solution 105
xii
\

LIST OF FIGURES
Figure
Figure
Figure
Figure
F i gure
Figure
Figure
Figure
Figure
Figure
Figure
Figure
F i gure
Figure
1
2
3
4
5
6
7
8
9
10
11
12
13
14
Page
New type of LC-MS interface probe 5
A portion of the positive secondary ion massspectrum obtained from atropine applied to abulk nickel substrate 8
A limited mass scan in the range 90-120 massunits on a layer applied to a nickel particle. . . 9
Partial energy level diagram of lithium 13
Generalized energy level diagram used to modelLEI 15
Comparison of experimental LEI sensitivities tothe two -parameter theoretical fit value fortwenty-one transitions in fourteen elements. ... 18
Percent recovery of the 100 ppb indium LEI signalwith increasing sodium matrix, using 1 mmdiameter cathode rods 20
Percent recovery of 100 ppb indium LEI signal withincreasing sodium matrix, using cathode plates . . 21
Typical analysis of a suitably prepared samplecontaining fluoride, acetate, chloride, nitrite,phosphate, bromide, nitrate, sulfite, and sulfate. 41
Solubles in oysters 44
Chloride and sulfur concentrations in oyster SRMas determined by ion chromatography afterSchoniger flask combustion 46
Pulsed FPD system response to ammonium sulfateaerosols at various relative humidities withand without SO
2added to the sample 58
Response of the pulsed FPD system in mV outputversus sample sulfur concentration in yg S/m^for ammonium sulfate 59
Response of the pulsed FPD system in mV outputversus sample sulfur concentration in yg S/m^for sulfuric acid 60

Page
Figure 15 Anticoincident>meson
>and guard
(R^) count rates (cpm) versus run number for
uses Wood Sample utilizing Counter J. Poissonuncertainties (±la) are represented by errorbars for corresponding point symbols 66
Figure 16 Comparison of observed with expected vegeta-tive impact (fine particles) 70
Figure 17 Degree of RSD improvement over raw intensitydata examined at various signal to backgroundratios for seven elements 82
xiv
\

LIST OF TABLES
Page
TABLE 1 Comparison of the Sensitivities Afforded byCerium Oxidative and Ultraviolet Detection ofPhenols in Liquid Chromatographic Effluents .... 2
TABLE 2 Intensity as a Function of Time on Two ReplicateRuns of 20 ym Diameter Particles 10
TABLE 3 Comparison of Detection Limits (ng/mL) 12
TABLE 4 LEI Detection Limits for Three Transitions inLithium 14
TABLE 5 Representative Real Sample Measurements 22
TABLE 6 Dinitrophenylated Proteins Produced 24
TABLE 7 Specificity and Titre of Antiserum toDinitrophenylated Conjugates 25
TABLE 8 Summary of Instrumental Conditions Employed(Large Machine) 33
TABLE 9 Composition of Glass Films Determined by X-rayFluorescence Spectrometry 35
TABLE 10 Comparison of the Average Composition ofSputtered Films Using Two Different InstrumentsA and B 36
TABLE 11 Solubles in Oysters 43
TABLE 12 Chloride and Sulfur (as sulfate) Concentrations inOyster SRM as Determined by Ion-ChromatographyAfter Schoniger Flask Combustion 45
TABLE 13 Summary Analysis of Filter Strips for Nitrateand Sulfate by Ion- Chromatography 48
TABLE 14 Nominal Values of SO^, NO^, and Pb on Filters ... 50
TABLE 15 NBS SRM Sub -bituminous Coal (1635) 51
TABLE 16 NBS SRM Fly Ash (1633a) 51
TABLE 17 Approximate Elemental Concentrations in Shale Oilas Determined by INAA 53
TABLE 18 Counter Backgrounds 64
TABLE 19 Standards and Reference Samples 67
XV

Page
TABLE 20 Modern Carbon in Portland Aerosols. ........ 69
TABLE 21 Comparison of Normal and Splitless InjectorTechniques. . 84
TABLE 22 Boiling Points of Some Polynuclear AromaticHydrocarbons 84
TABLE 23 Stability of Selected Phenols in Distilled Water. . 86
TABLE 24 Degradation of Aqueous Solutions of Phenols Due toRadiation Treatment 88
TABLE 25 Radiological Pollutant Quality Assurance 99
TABLE 26 Status of Traceability Studies of RadioactivityMeasurements by the Quality Assurance Branch(EPA-LV) for the Period of July 1 throughDecember 21 ,
1978 101
APPENDIX III
Table 1 Isotopic Source Indicators 77
APPENDIX VI
Table 1 Summary of the Isotopic Composition and the AtomicMass 103
Table 2 Uranium Concentration Data 103
Table 3 Relevant Conversion Factors and Constants 103
Table 4 Calculated Isotopic Uranium RadioactivityConcentrations, October 1978 104

80-BCK-a-ENERGY RELATED POLLUTANT MEASUREMENT AND INSTRUMENTATION
DEVELOPMENT
1 Energy-Related Water Pollutant Analyses Instrumentation
1 . a Development of Marker Compounds
Activity in this project must await development of the master
analytical method by EPA/ERL/Athens
.
1 . b Application of Selective Detectors to Liquid Chromatography
The cerium oxidative detect
sensitive and fairly select
in the effluent of a liquid
Lett., 5, 177 (1972)} first
monitor" for the detection
components in body fluids.
cerium(IV) reagent solution
acid — by means of a magnet
section, which consists of
volume of 4 mL) immersed in
20 mL/min employed for the
acids, the residence time i
minutes. A fluorometer mon
cerium(III) produced in the
ion system is in principle a highly
ive means for the detection of phenols
chromatograph. Katz and Pitt (Anal,
developed the "cerate oxidative
of organic acids and other oxidizable
The column effluent is mixed with
— cerium(IV) sulfate and sulfuric
ic mixer before entering the reaction
coiled Teflon tubing (with an internal
boiling water. At a flow rate of
anion- exchange separation of aromatic
n the reaction section is about 12
itors the fluorescence emission of the
reaction.
Wolkoff and Larose (J. Chromatogr., 731 (1974)) employed a
similar cerium fluorescence detector for the reversed-phase HPLC
analysis of phenols in water. These workers used a peristaltic
proportioning pump to add the reagents to the column effluent in
order to reduce peak broadening in the HPLC separation. Using
this system, concentrations of about 10 ppb of phenol could be
detected, but the response generally decreased as substitution on
the phenolic ring increased.
1
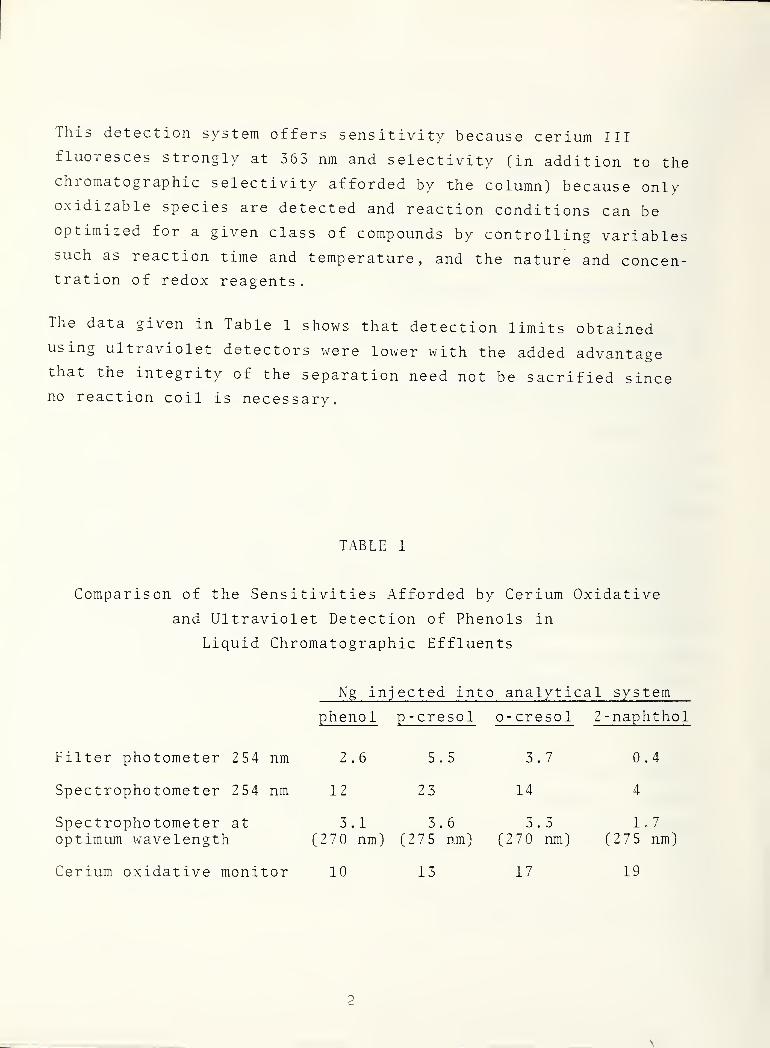
This detection system offers sensitivity because cerium III
fluoiesces strongly at 363 nm and selectivity (in addition to the
chromatographic selectivity afforded by the column) because onlyoxidizable species are detected and reaction conditions can beoptimized for a given class of compounds by controlling variablessuch as reaction time and temperature, and the nature and concen-tration of redox reagents.
The data given in Table 1 shows that detection limits obtainedusing ultraviolet detectors were lower with the added advantagethat the integrity of the separation need not be sacrified sinceno reaction coil is necessary.
TABLE 1
Comparison of the Sensitivities Afforded by Cerium Oxidative
and Ultraviolet Detection of Phenols in
Liquid Chromatographic Effluents
Ng injected into analytical system
pheno 1 p - creso 1 o- cresol 2 -naphthol
Filter photometer 254 nm
Spectrophotometer 254 nm
Spectrophotometer atoptimum wavelength
Cerium oxidative monitor
2.6 5.5 3.7
12 23 14
3.1 3.6 3.3(270 nm) (275 nm) (270 nm)
10 13 17
0.
4
4
1 . 7
(275 nm)
19
\
2

1
In a previous report we have described the use of an electro-
chemical detection system for HPLC detection of phenols. This
system has superior sensitivity (detection limit less than 0.1 ng)
when compared with the cerium oxidative monitor and UV detectors
and offers selectivity at least comparable to that afforded by
the cerium oxidative monitor.
Though simple in principle and potentially sensitive and selective,
there are other factors that detract from the utility of this
system
:
a) Cerium IV is unstable when in contact with fresh glass
or heat and is oxidized to the fluorescent cerium III which
causes background fluorescence.
b) The relationship between concentration and response is
not always linear, probably due to the uncontrolled produc-
tion of fluorescent oxidation products that also contribute
to the signal measured.
c) ' The volume between the exit of the chromatographic
column and the detector must be sufficiently large to allow
reaction of the phenols with the Cerium(IV), a sulfate.
We used a 2 mL reaction coil. This caused chromatographic
band broadening and hence severe losses in resolution.
Because of combinations of these three factors, we found that we
could not detect less than 10 ng phenol.
3
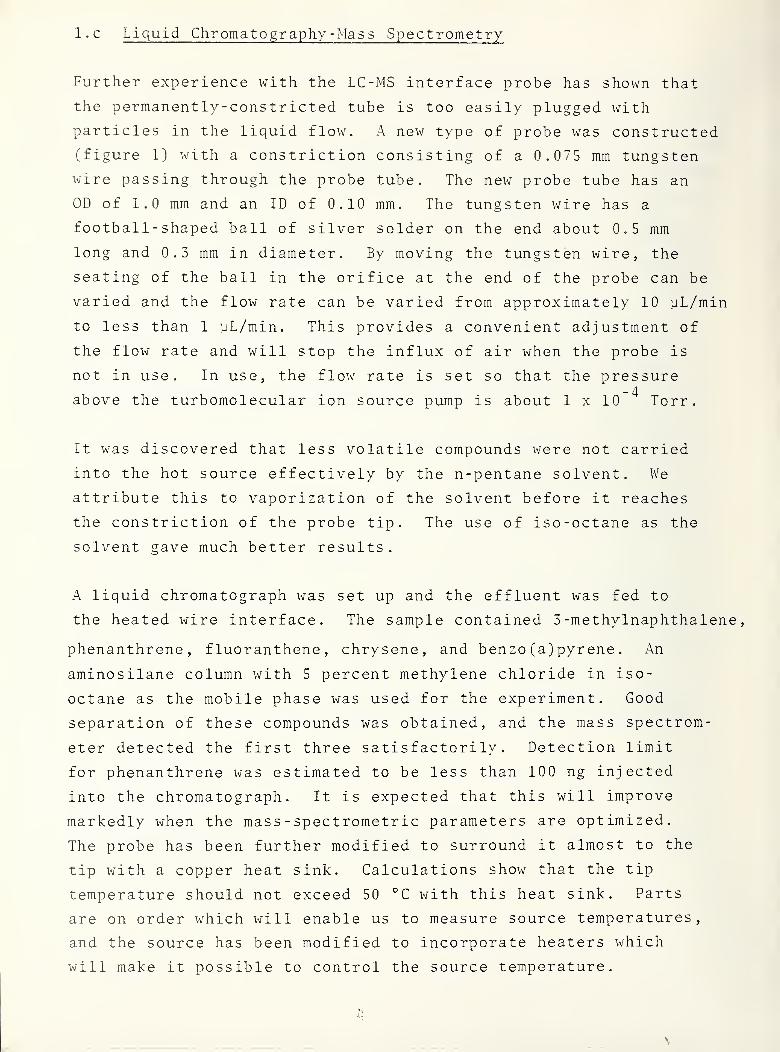
Liquid Chromatography-Mas s Spectrometry1 . c
Further experience with the LC-MS interface probe has shown that
the permanently-constricted tube is too easily plugged with
particles in the liquid flow. A new type of probe was constructed
(figure 1) with a constriction consisting of a 0.075 mm tungsten
wire passing through the probe tube. The new probe tube has an
OD of 1.0 mm and an ID of 0.10 mm. The tungsten wire has a
footbal 1- shaped ball of silver solder on the end about 0.5 mm
long and 0.3 mm in diameter. By moving the tungsten wire, the
seating of the ball in the orifice at the end of the probe can be
varied and the flow rate can be varied from approximately 10 yL/min
to less than 1 yL/min. This provides a convenient adjustment of
the flow rate and will stop the influx of air when the probe is
not in use. In use, the flow rate is set so that the pressure
above the turbomo lecular ion source pump is about 1 x 10 Torr.
It was discovered that less volatile compounds were not carried
into the hot source effectively by the n-pentane solvent. We
attribute this to vaporization of the solvent before it reaches
the constriction of the probe tip. The use of iso-octane as the
solvent gave much better results.
A liquid chromatograph was set up and the effluent was fed to
the heated wire interface. The sample contained 3 -methylnaphthalene
,
phenanthrene,fluoranthene, chrysene, and benzo (a) pyrene . An
aminosilane column with 5 percent methylene chloride in iso-
octane as the mobile phase was used for the experiment. Good
separation of these compounds was obtained, and the mass spectrom-
eter detected the first three satisfactorily. Detection limit
for phenanthrene was estimated to be less than 100 ng injected
into the chromatograph. It is expected that this will improve
markedly when the mass - spectrometric parameters are optimized.
The probe has been further modified to surround it almost to the
tip with a copper heat sink. Calculations show that the tip
temperature should not exceed 50 °C with this heat sink. Parts
are on order which will enable us to measure source temperatures,
and the source has been modified to incorporate heaters which
will make it possible to control the source temperature.
LC
-
MS
INTERFACE
cO OJ
•M -HO 3
• O-trH
(D O O
5
Figure
1.
New
type
of
LC-MS
interface
probe.

Consideration has been given to methods for a feedback control of
the power input to the evaporator wire. This should make it
possible to control the amount of evaporation on the wire so that
99 percent concentration can be obtained in spite of small input
flow variations.
1 . d Feasibility Study of Application of Particulate Analysis by
Ion Microprobe
In the previous semi-annual report on the NBS/EPA Energy Environment
Project (Sept. 1978) we reported preliminary results on the appli-
cation of the ion microprobe (a focused beam form of secondary ion
mass spectrometry) (SIMS) to the study of thin organic layers on
substrates. Benninghoven and co-workers (University of Munster)
had previously demonstrated that secondary ions corresponding to
the parent organic compound as well as characteristic fragment ions
could be successfully sputtered under ion bombardment conditions
selected to minimize damage to a specimen: (a) inert gas primary
ion such as Ar"*";
(b) ion beam energy, typically 2 keV;and most
important, (c) low primary ion beam current density, typically
10 A/cm . These conditions are said to be "static SIMS" in which
the specimen is unaltered by the measurement process. In order
to obtain an adequate total signal with such a low current density,2
an area in the range 0.1-1 cm must be bombarded. While Benninghoven ’
s
technique is satisfactory for the characterization of organic layers
on a large substrate, or possibly on a large aggregate of particles,
it is clearly not adequate for the characterization of organic
layers on single particles.
In the previous report, we demonstrated the possibility of
obtaining results similar to these reported by Benninghoven
under primary ion bombardment conditions which were more typ
of the ion microprobe: (a) reactive gas primary ion,^^
02''';
(b) high beam energy, 18.5 keV, and (c) primary ion current
in the range 10 A/cm"^, Parent compound and characteristic
et al
.
ical
densities
ion
6

fragments were detected from glycine on a nickel substrate
and 5 -f luorodopamine on a gold substrate.
These studies have been extended to the area of particulate
analysis by measuring secondary ion mass spectra from organic
layers applied to metallic particles (commercial purity nickel
and silver) with a size range 20-60 pm diameter. The primary ion
beam conditions employed were: (a) primary ion species, 0^ ;
(b) beam energy, 9.50 keV (which corresponds to 4.25 keV monotomic
oxygen bombardment); (c) current density, 2.8 x 10 A/cm (1 nA
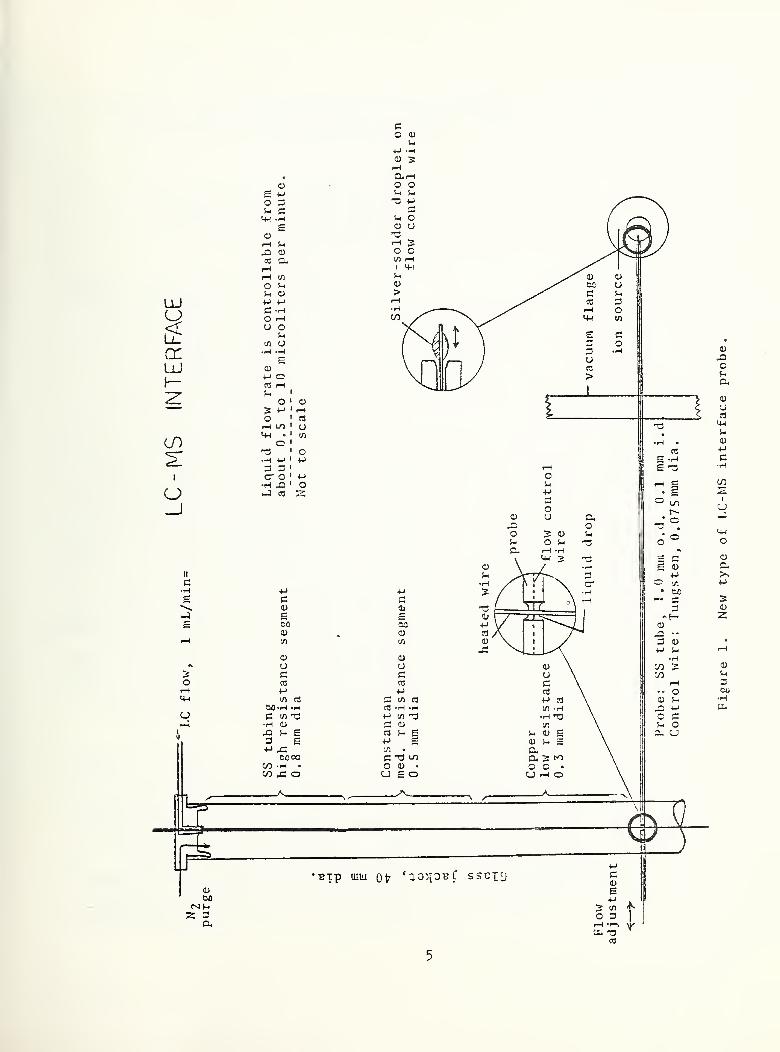
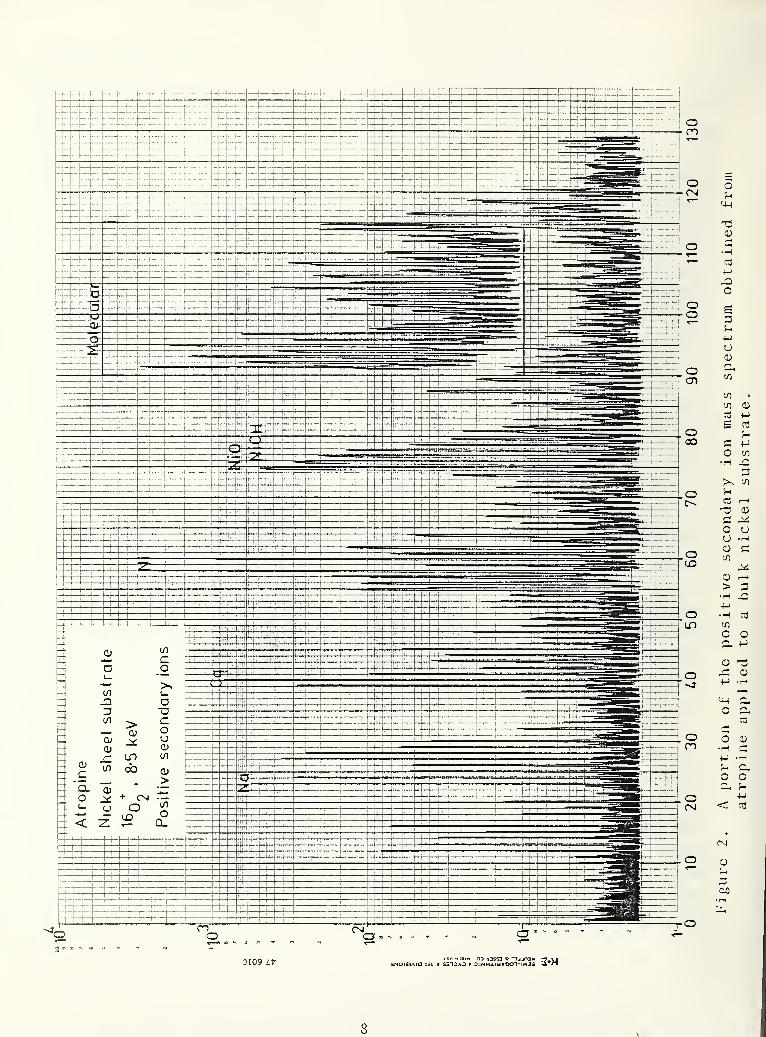
into a 60 X 60 ym square scan) . Figure 2 shows a portion of the
positive secondary ion mass spectrum obtained from atropine
(C^yH^^NO^) applied to a bulk nickel substrate. An ion signal
was observed at 289 mass units which presumably corresponds to the
parent ion. Most of the signals observed in the spectrum corres-
pond to the substrate and its contaminants. Upon scanning the
region from 9.0-120 mass units on a fresh area (offset portion),
a large number of peaks corresponding to organic fragments are
observed. This experiment points out the difficulty in obtaining
useful spectra with a sequential spectral measurement. The
destructive nature of SIMS leads to a destruction of the organic
target. Figure 3 shows a limited mass scan in the range 90-120
mass units on a layer applied to a nickel particle. A pattern
similar to that observed from the bulk target. Figure 2, is
found. Peak- to -background ratios as high as 100:1 are observed
for these ions in both the particle and in the bulk.
A similar expe riment was CO nduct
to 20 ym diame ter silver sphere
.
dopamine spect rum shown in the p
obtained from the layer on the p
parent ion at 171 mass unit s was
of the ion dose (bombardment time
observed as a function of time on
diameter particles
.
ed with 5- fluorodopamine applied
Spectra similar to the 5-fluoro
revious report (Figure 12) were
article. The intensity of the
found to be a strong function
) . Table 2 gives the intensity
two replicate runs of 20 ym
0t09 L‘7
8
l^igure
2.
A
portion
ot
the
positive
secondary
ion
mass
spectrum
obtained
from
atropine
aj)plied
to
a
bulk
nickel
substrate.

1^
^ r-
90 100 110 120
Figure 3. A limited mass scan in the range 90-120 mass unitson a layer applied to a nickel particle.
Q

TABLE 2
Intensity as a Function of Time on Two Replicate Runs of
20 ym Diameter Particles
Time Intensity at 171 mass units
sphere #1 sphere
2 seconds 1073 1052
4 246 495
6 179 351
8 135 253
10 106 151
12 127 128
14 104 103
16 86 98
This strong decrease in
the organic layer and (2
Further experiments are
with organic SIMS.
signal is due to (1)
) beam damage 0 f the
being carried out to
rapid sputtering of
organic compound.
enlarge our experience
1 . e Liquid Chromatography with Electrochemical Detection of
Qrganometallic Compounds
A comprehensive report entitled, "Development of Methodology for
the Measurement of Trace Organometal Species by Liquid Chromatography
with Electrochemical Detection," has been completed and will be
submitted to EPA for publication as an EPA Technical Report.
1 . f Laser Enhanced Ionization
Introduction
Previous reports over the past three years have described the
origination and early development of laser enhanced ionization
for trace metal analysis in flames. The method uses a pulsed
\
10

or chopped tunable dye laser to selectively excite analyte
atoms in the flame. A current passed through the flame via
external electrodes and the burner head is seen to change in
response to the laser excitation. The laser- induced current is
separated from the dc background current by a simple RC network,
amplified, and signal averaged following gated or synchronous
detection. Sub-ng/mL detection limits and linear response over
at least four orders of magnitude are currently obtained for
over a dozen elements in water.
The second half of 1978 was devoted primarily to 1) continuing
refinements in the detection limit table, 2) completion of a
workable theoretical model to explain and predict experimental
sensitivities, and 3) initial real sample measurements.
Limits of Detection
All of the limits of detection obtained to date are shown in
Table 5, along with comparative limits by other flame techniques.
Limits obtained during the period of this report (distinguished
by footnote "c" in the table) are Ag, Ba, Bi, Ca, and Li.
As sho^^;n by footnote "d” in Table 3, twelve of the eighteen have
equivalent or superior detection limits by LEI, in comparison to
the best reported results by atomic absorption (.AA),atomic
emission (AE),atomic fluorescence (AF)
,or laser-excited AF . Of
the thirteen elements with ionization potential (IP) ^7.5 eV
,
only Ca, Cr, and K are better detected by another method.
For these elements, much weaker transitions were used for the LEI
measurement than for the other methods
.
Of particular interest is the work done with lithium, detailed in
Table 4. The 1 pg/mL (one part-per- trillion by weight) detection
limit of Table 3 is the best yet measured for the method. The? 9
transition used was the traditional 2s “S—2p “P at 670.8 nm,
as
shown in Figure 4.
11

TABLE o
Comparison o£ Detection Limits (ng/mL)
Element LEI
(46 ,85)
AA AE AF Laser AF
Ag (7.6)'" l'^ 1 2 . 1 4
‘^Ba (5.2) 0 .2^ 20 1 - - - 8
Si (7.3) 2^ 50 20000 5 3
Ca (6.1) 0 .1^ 1 .01 20 .08
Cr (6.8) 2 2 2 5 1
Cu (7.7) 100 1 0 . 1 0 . 5 1
Fe (7.9) 2 4 5 8 30
d.Ga (6.0) 0 .07 50 10 10 0.9
In (5.8) 0 .006^^ 30 0 .
4
100 0 . 2
K (4.3) 1 3 .05 — —•H (5.4) 0.001*^ 1 .02 — 0 . 5
Mg (7.6) 0 .
1
0 .
1
5 0 . 1 0 . 2
Mn (7.4) 0 . 3 0.8 1 1 0.4
Sa (5.1) 0 .05 0 . 8 0 . 1 - - - 0.1
Ni (7.6) 8 5 20 3 n
^Pb (7.4) 0 . 6 10 100 10 13
drSn (7.3) 6 20 100 50 —d?!
(6.1) 0 .09 20 20 8 4
^LEI in C.^H j/slIt flame;others in best flame available
.
^Ionization potential in parentheses CeV) .
^New LEI result (since last report)
.
^LEI best method.
\
12

state Energy
Ionization Potential43,487 cm""*
31,283 cm*1
14,904 cnr"*
0 cm’'^
Figure 4. Partial energy level diagram of lithium.
13

TABLE 4
LEI Detection Limits for Three Transitions in Lithium
Wavelength (nm) No . Photons Transition LOD (ng/mL)
670 . 8 1 2s ^2p ^P° 0 .001
610 .
4
1 2p ^P^^3d "D 0 .012
639.3 2 2s ^3d 0 .4
2 2A detection limit of 12 pg/mL for the excited 2p P°—3d D transi-
tion at 610.4 nm illustrates the surprising sensitivity of the
method for excited state transitions. The detection limit is
only 12-fold worse than the ground state transition in spite of
a Boltzmann population of '^10 ^ for the 2p“P® level. This effect
is further discussed along with the mechanism studies below.
A final surprising result from lithium is the 0.4 ng/mL detection2 2limit for the two photon 2s S—3d D transition using 639.3 nm light
Although of no practical value for Li detection, the result
illustrates a method of extending laser enhanced ionization to
elements of high ionization potential. Two UV photons — from a
suitably high-powered frequency-doubled laser — could be used to
excite energy levels up to '^^10 eV above ground. The effective-
single-photon wavelength of such transitions is in the vacuum
UV,and cannot be reached directly with current laser technology.
Mechanism
The model for the production of LEI signal is based on the gen-
eralized energy level diagram of Figure 5. Levels 1, 2, and 3
represent the lower and upper levels of the optical transition,
and the ion ground state, respectively. The E^ , n^ ,and are
14

energy
population
statistical
WEIGHTPOCS3
CSIo 03
o
nc
CMC
o+J
'ao•j)
hhI
< c/3S C/3
S CJ
^ cc
<pO-o
J
c/3LUC/3
C/3uuCJOCCQ-
03
O>0)
X
CD
S
T3Ors)
03
CL)
CD
Ln
O
nuu
es4LU
15

the corresponding energies, number densities, and statistical
weights. (E- is thus the ionization potential, and n^ the ion
number density.) ^21’ ®lt’ ®21 Einstein coefficients
for spontaneous emission, absorption, and stimulated emission;
I is the spectral irradiance of the laser; and and ^2 ^
are
collisional rate constants for quenching (de - excitation) and
ionization from the excited state. Additional processes which
occur are omitted as being of secondary importance.
The LEI signal current, S, is proportional to the rate of ioniza-
tion from the excited state:
S
dn.
dt^23 ^2 ( 1 )
The excited state population, in turn, is a function of the laser
intensity. In the absence of optical saturation.
%n^
^21 ^ ^"^21( 2 )
where N = n, + n^ + n, is the total analyte number density in the0
flame. Combining C2) and (1),
dn- B,-I(N-n^)S a: = k- -T ^:-r
dt 21 21C3)
If nj< <N for all time
,
fract
i
on of the analyte
signal current
,
S,can
m ’
laser intens ity
,
I , orm’
can be seen from (3) to occur at the peak
k--B-, --jl- 2 0 1 2 m . r
S -r —i Nm + k.‘21 21
( 4 )
16
ivhich is linear
probability. A
for the maxiinum
in power, absorption coefficient, and
more general solution of (3)
,
however
current
ionization
yields
S Nm
2u 12 mX
^21 ^ ^21(5)
where 0<X£l, and the less - than- linear response to power, abs
tion, and ionization probability results from "electrical
saturation", i.e., the conversion of a significant fraction
the analyte to ions during the pulse.
orp-
of
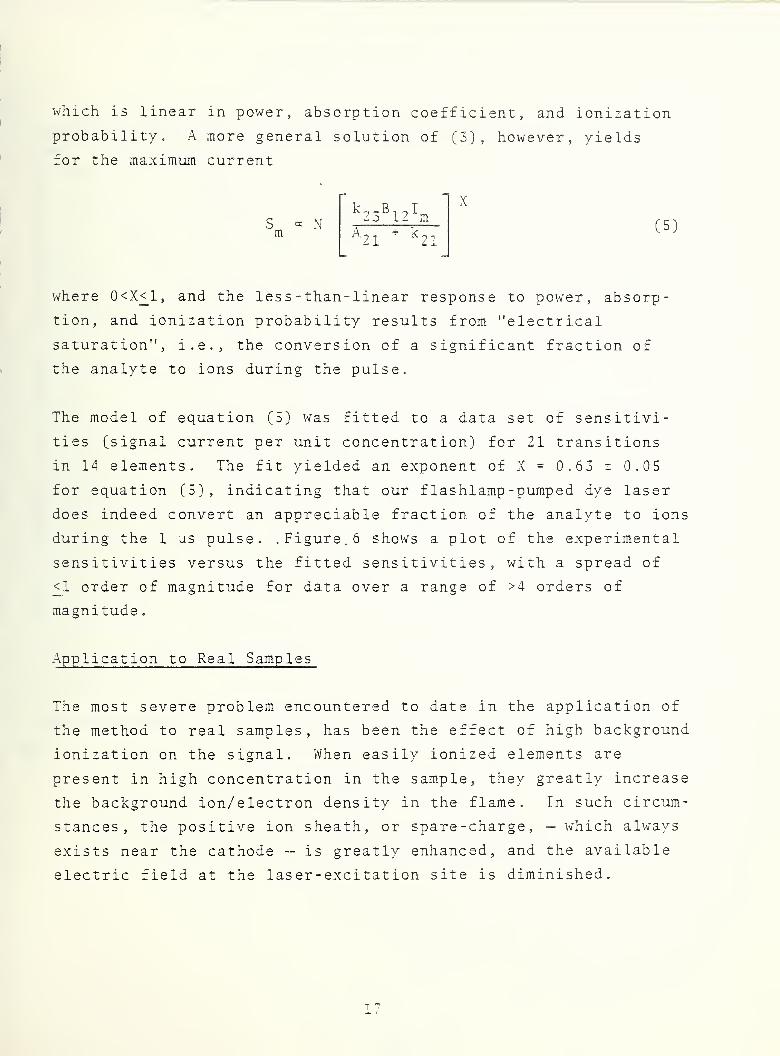
The model of equation (5) was fitted to a data set of sens
ties (signal current per unit concentration) for 21 transi
in 14 elements. The fit yielded an exponent of X = 0.63 ±
for equation (5), indicating that our flashlamp -pumped dye
does indeed convert an appreciable fraction of the analyte
during the 1 us pulse. .Figure. 6 shows a plot of the exper
sensitivities versus the fitted sensitivities, with a spre
;<1 order of magnitude for data over a range of >4 orders o
magnitude
.
i tivi
-
t ions
0.05
laser
to ions
iment al
ad of
f
Application to Real Samples
The most severe problem
the method to real samp
ionization on the signa
present in high concent
the background ion/elec
stances, the positive i
exists near the cathode
electric field at the 1
encountered to date i
les,
has been the effe
1. When easily ionize
ration in the sample,
tron density in the fl
on sheath, or spare-ch
— is greatly enhanced
as er - exci tat ion site i
n the application of
ct of high background
d elements are
they greatly increase
ame
.
In such circum-
arge, — which al^'/ays
and the available
s dim inished
.
1~

EXPERIMENTAL
SENSITIVITY
(nA/ppb)
FIHED SENSITIVITY (nA/ppb)
Figure 6. Comparison of experimental LEI sensitivities to thetwo -parameter theoretical fit value for twenty-onetransitions in fourteen elements.
\18
TTTTT

The extent of the problem when 1 mm diameter tungsten rods are
used for the cathode is shown in figure 7, for a 100 ppb indium
solution with increasing sodium matrix. During the present
reporting period, an order of magnitude improvement was achieved
— as shoxm in figure 8 — by the simple expedient of replacing the
cathode rods with flat molybdenum plates. The positive ion sheath,
and hence the matrix effect, is reduced by the inverse of the
lightning rod principle — for a given applied potential, the field
strength is less at a flat surface than at one of positive
curvature
.
The presence of easily ionized matrices is checked simply by
comparing the background (dc) current with and without the sample
being aspirated into the C^H^/air flame. With the signal modified
— but not eliminated — by easily ionized matrices, accuracy may be
assured by using the method of standard additions. An alternative
method, for small differences in background current, is to increase
the fuel to the flame, thereby raising the background current to
a point such that the change due to the sample is negligible. Then,
the increased ion/electron density affects the sample and calibra-
tion standard measurements equally. Table 5 shoi\/s examples of
three types of real sample measurement: 1) no matrix effect, neat
calibration standards, 2) small matrix effect, fuel-rich flame
used with neat standards, and 5) large matrix effect, standard
additions used.

100
ppb
In,
Cathode
Rods
=0
m
o o o o o o oC\J O CO CT) ^ C\J
<u
— 'J)
CD
uaZD
Ad3A033d iN33d3d
SODIUM
CONCENTRATION
(ppm)

PERCENT
RECOVERY
Figure 8. Percent recovery of 100 ppb indium LEI signal x\rith increasing
sodium matrix, using cathode plates.

TABLE 5
Representative Real Sample Measurements
Element Wavelength Sample LEI^ Expected^ Comments
In 30 3.9 Ni-based Alloy 35 37 1
Mn 304.5 River Sediment 786 770 7L,
Mn 304.5 SRM 1261-Steel 6700 6600 3
Comments
;
1. No matrix effect; calibration via neat standardsolutions
.
2. High background current; calibration via standardadditions
.
3. Moderate background current; matrix effect compensatedby using fuel-rich (high electron content) flame forboth sample and neat standard solutions.
Cone lus ions
Laser enhanced ionization in flames has been demonstrated at
sub-ppm levels for eighteen elements in water, with the best
case extending to the part-per- trillion level. A model for the
signal production mechanism has been shown to adequately describe
observed sensitivities, and may be used to predict sensitivities
for other elements and transitions. Matrix effects have been
reduced an order of magnitude with a simple change in electrode
shape, and five percent accuracy has been achieved ;\^ith a small
but representative selection of real samples.
Future directions will include 1) the extension to high ioniza-
tion potential species with multiphoton or stepwise excitation,
2) further studies of optimum electrode structure for minimum
matrix effect, 3) comparison of different laser systems, and
4) characterization of the electron/ion transport process.
22
N

80 -BCK-b- ENERGY RELATED WATER POLLUTANT ANALYSIS INSTRUMENTATION
1 Development of Measurement Methods for Non-Volatile Organic
Pollutants in Water due to Energy Technologies
1 . a Raman Microprobe Characterization of Trace Polynuclear
Aromatic Hydrocarbons
No activity in this project during the present reporting period.
1 . b Development of Specific Immunoassays for Dinitrophenols in
Water
Because the sensitivity and selectivity of immunoassays for a
variety of ligands offer many possibilities of separation and
detection, we have started a project to develop assays for one of
the priority pollutants, 2 ,4 -dinitrophenol (DNP) . Existing proce-
dures evaluated at NBS have shown that gas chromatography and high
performance liquid chromatography, while suited for analytical
determinations of most 0 f th e toxic pollutants, a re no t as
efficient in the separat ion and identification of the nitropheno Is
Immunoas s ays requ ire hig hly specif
i
c antibodies p roduc ed in
animals
,
usually rabbits or goats
.
Antibodies wi th sp ecif ici ty
for small molecul es such as DNP are made by chemi cally conj ug at ing
the DNP g roup to a speci f ic protein and injecting the conj ugat
e
into the animal
.
A1 though c ommerci ally prepared antis era to DNP-
proteins are aval lable
,
we f ound th at custom-prep ared ant iser a
were more economical and of higher quality.
We produced DNP -con
j
purchased antisera,
specific antisera.
ugated proteins t
or to be injected
Listed in Table 6
be used in the
as immunogens to
the antigens
assay of
produce
produced
.
are
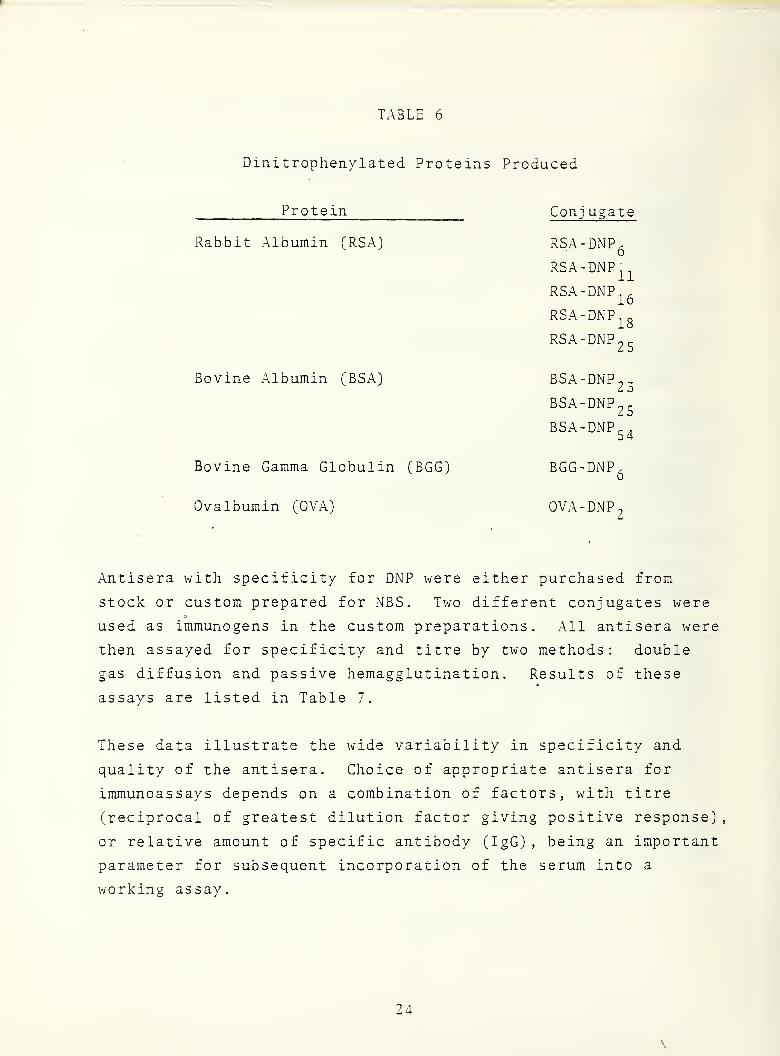
TABLE 6
Dinitrophenylated Proteins Produced
Protein
Rabbit Albumin (RSA)
Bovine Albumin (BSA)
Bovine Gamma Globulin
Ovalbumin (OVA)
Conj ugate
RSA-DNP.6
RSA-DNP^^
RSA-DNP^
.
16RSA-DNP^g
RSA-DNPgg
BSA-DNP^,L o
BSA-DNPgg
BSA-DNPg^
(BGG) BGG-DNP^
OVA-DNP^
Antisera with specificity for DNP were either purchased from
stock or custom prepared for NBS. Two different conjugates were
used as immunogens in the custom preparations. All antisera were
then assayed for specificity and titre by two methods: double
gas diffusion and passive hemagglutination. Results of these
assays are listed in Table 7.
These data illustrate the wide variability in specificity and
quality of the antisera. Choice of appropriate antisera for
immunoassays depends on a combination of factors, with titre
(reciprocal of greatest dilution factor giving positive response)
,
or relative amount of specific antibody (IgG),being an important
parameter for subsequent incorporation of the serum into a
working assay.
\
24
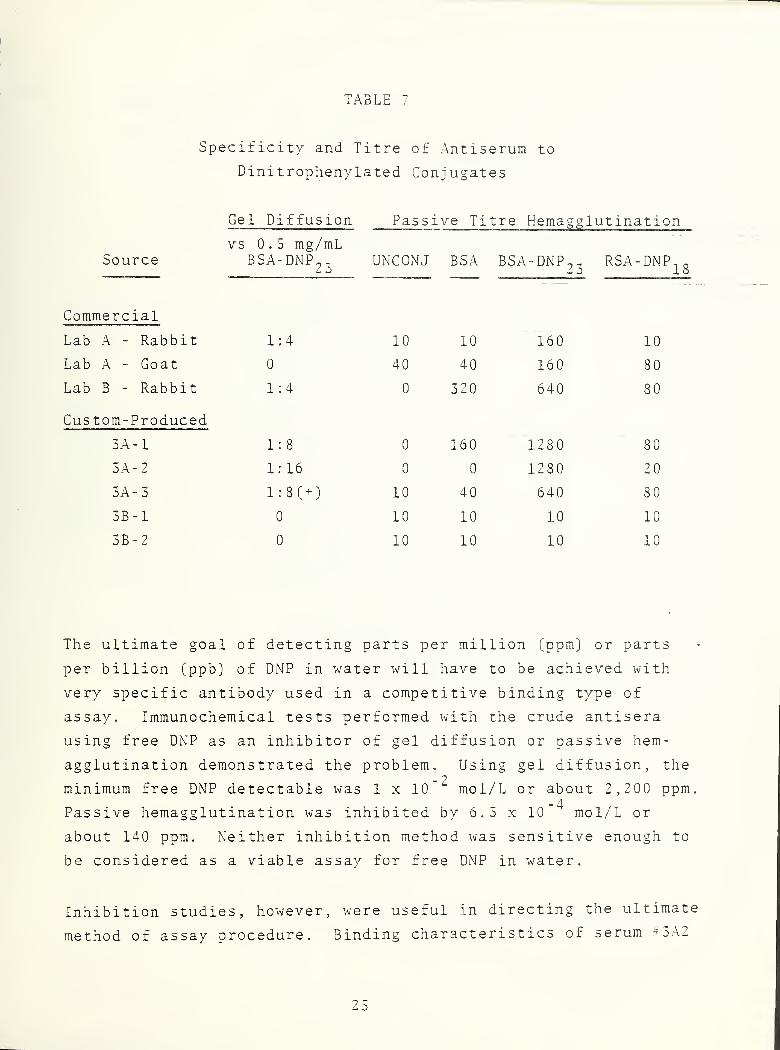
TABLE 7
Specificity and litre of Antiserum to
Dini trophenylated Conjugates
Gel Diffusion Passive Titre Hemagg lut ination
Sourcevs 0.5 mg/mL
BSA-DNP.^Z 0
UNCONJ BSA BSA -DNP.,2 0
RSA-DNP^g—
Commercial
Lab A - Rabbit 1 : 4 10 10 160 10
Lab A - Goat 0 40 40 160 80
Lab B - Rabbit 1 : 4 0 320 640 80
Custom -Produced
3A-1 1 : 8 0 160 1280 80
3A-2 1:16 0 0 1280 20
3A- 3 1:8(+) 10 40 640 80
3B-1 0 10 10 10 10
3B-2 0 10 10 10 10
The ultimate goal of detecting parts per million (ppm) or parts
per billion (ppb) of DNP in water will have to be achieved with
very specific antibody used in a competitive binding type of
assay. Immunochemical tests performed with the crude antisera
using free DNP as an inhibitor of gel diffusion or passive hem-
agglutination demonstrated the problem. Using gel diffusion, the
minimum free DNP detectable was 1 x 10 mol/L or about 2,200 ppm.
Passive hemagglutination was inhibited by 6.5 x 10 mol/L or
about 140 ppm. Neither inhibition method was sensitive enough to
be considered as a viable assay for free DNP in water.
Inhibition studies, however, were useful in directing the ultimate
method of assay procedure. Binding characteristics of serum tt3A2

were studied by inhibiting gel
labeled compounds. Affinity fo
affinity for the homologous ant
the following series;
reactions with a
r the DNP ligand
igen (BSA-DNP^.)
variety of DNP-
is weak, while
is strongest in
DNP<p - amino ben zyl -L - glut amate -DNP<glycylglycylglycine - DNP< lys ine
-
DNP<BSA-DNP^.
.
2 0
Development of a ligand binding assay using tritiated DNP C^H-DNP)
was started. Whole antisera was used in the initial study as we
developed optimum conditions for separation of the bound vs. free
fractions of labeled ligand. Charcoal separation (0.1% Norit)
was 96 percent effective in separating the free ligand from the
bound. Similarly, a purchased commercial preparation was evaluated
for separating the bound ligand on the IgG antibody from the free
ligand in solution. Both methods showed some promise for separa-
tion but were not satisfactory for assay because the binding of
the ligand to the specific antisera was not significantly different
from binding to the normal control sera. This non- specif icity
may be due to the presence of many other proteins in the sera.
We have now fractionated the sera to isolate the immunoglobulin,
IgG. These fractions are being evaluated and will be bound to
plastic tubes for use as solid-phase reagents. We have developed
for this procedure protein detection methods suitable for detect-
ing microgram quantities of IgG bound to tube surfaces.
Better sensitivity of a solid phase assay may depend on displace-
ment of a different ligand than "^H-DNP. We are procuring a small14
amount of C-DNP-lysine to be used in the method.
Additional experiments are now being carried
binding of IgG onto either polypropylene or p
These will be followed by binding experiments
DNP compounds. We also anticipate measuring
fluorescence as it binds with the DNP hapten.
out to optimize the
olystyrene tubes.
with the labeled
quenching of antibody
\
26

l.c LC-MS,Covered under section 80-BCK-a, l.c.
l.d LC -EC,Covered under Section 80-BCK-a, l.b.
l.e Ion- Probe,Covered under section 80-BCK-a, l.d.
1 . f Generation of Enhanced CARS Spectra of Organic Liquids in
Capillary Waveguides _
Recently we have developed a new approach to analysis of organic
compounds in liquid phase by Raman Spectroscopy. Enhancements
of up to a factor of 130 have been demonstrated in the Coherent
Anti-Stokes Raman Spectroscopy (CARS) output from a sample in a
liquid-filled dielectric waveguide compared to the signal
obtained from the same material in a cuvette. The waveguide CARS
experiments show this large enhancement in sample volumes of about
0.75 yL. Thus, the' advantages of CARS, namely fluorescence
rejection, low average power input, and spatial filtering can be
maintained in the waveguide in very small volumes. This technique
can be adapted to a flow through geometry to be coupled to HPLC,
for example, to improve the detection sensitivity of such systems.

80-BCL-a-ENERGY RELATED POLLUTANTS AND EFFECTS MONITORING AND
ASSOCIATED METHODS AND TECHNIQUES DEVELOPMENT
1 Development of SRMs for Stationary Sources Associated with
Energy Production
l.a NO^ in Air Gas Blend SRMs
The results obtained on periodic analyses of two concentrations
of nitrogen dioxide in air (reported in September 1978 semi-
annual report) suggests a degree of stability which may be
satisfactory in terms of an SRM. However, the small number of
available samples makes it difficult to fully evaluate these
mixtures over the desired concentration range of 250 to 2500 ppm.
Consequently, a large number of cylinders at nominal concentra-
tions of 250, 500, 1000, and 2500 ppm have been ordered. The
mixtures at 250 and 2500 ppm should be received and a preliminary
analysis completed by March 31, 1979. The 500 and 1000 ppm
mixtures should be received and analyzed by June 30, 1979.
Subsequent analyses may be necessary to establish stability
but the number of such subsequent analyses and the time period
involved will depend to a great extent on the results of the
preliminary analyses.
l.b SO2
in N2
SRMs
No work was done during the last six month period in this
project. We must await funds for purchase of material.
l.c NO in N^ SRMs
Work on this project will be completed in the next few months
but is being funded by MVMA.
\
28
1
.
d O2
in and CO^ in SRMs
No work was done during the last six month period in this
project. Material has been ordered (2 and 10 percent Oy in
Nz) .
2 Development of SRMs for the Monitoring of Ambient Air
Impacted by Emissions Resulting from Energy Production
2
.
a SO^ in Air
The study of the feasibility of a low concentration sulfur
dioxide in air compressed gas SRM has been completed. While
it appears that some individual aluminum cylinders containing
mixtures of sulfur dioxide in air at concentrations below one
part per million (ppm) may have reasonable stability, similar
cylinders in the same concentration range were found to be in-
stable. The instability appears to depend on the condition of
the individual cylinder, and is of sufficient magnitude that
such mixtures would be unsatisfactory as SRMs. However, the
rate of loss of sulfur dioxide is such that cylinders containing
mixtures of sulfur dioxide may serve as satisfactory laboratory
standards, provided that the concentration is periodically
determined on a relatively short time basis.
Another problem which was observed with these mixtures results
from adsorption of small quantities of sulfur dioxide in the
cylinder valves. The aluminum cylinders employed in this study
were equipped with stainless steel valves. It was necessary
to flow the mixture out of the valve at either a high flow rate
or for a very long period of time in order to reach equilibrium.
For example, a sample flowing at a rate of 1.3 L/min had not
reached equilibrium after a period of 30 minutes. Conversely,
a mixture in the same concentration range generated with a

permeation tube and flowing at 1.2 L/min reached equilibrium
within 9 minutes. Flow through the valve at a rate of 2.3 L/min
would require about 20 minutes to reach equilibrium.
It was possible to minimize all external factors in the slow
equilibration process by proper choice of materials and by condi-
tioning but it was not possible to eliminate the influence of the
cylinder valve.
Thus, it appears unlikely that gas mixtures of this sort would
serve as satisfactory SRMs . However, with proper selection and
monitoring of individual cylinders, and with an awareness of the
critical nature of the flow through the valve it is possible to
use them as secondary standards.
NO^ in Air
There have been no further developments in the gas industry
that would offer any hope for preparing concentrations of nitrogen
dioxide in air at concentrations below the 1 ppm level that would
be satisfactory as SRMs.
NO in
Further measurements of the four mixtures previously analyzed
confirm the anomalies reported earlier. It appears from the
results obtained thus far, that there is an initial slow decline
in the concentration of nitric oxide. As the pressure within
the cylinder decreases, nitric oxide previously adsorbed on the
walls is desorbed and a slight rise in concentration occurs.
This effect will be confirmed by further analyses during which
all four samples will be bled to approximately atm.ospheric
pressure. If the effect is real it will mean that mixtures in
this concentration range would not be suitable as SRMs.
\
30

2.b CO in Air
Further examination of samples of carbon monoxide in air in
cylinders lined with ceresin wax has revealed the presence of
hydrocarbons at concentrations higher than expected. Previous
batches of carbon monoxide in nitrogen contained in wax lined
cylinders did not contain detectable quantities of hydrocarbons.
Substitution of aluminum cylinders for the wax-lined steel
cylinders appear to have resolved this problem. Analysis of 26
samples of 10 ppm carbon monoxide in air, prepared as a single
lot, indicates complete homogeneity within the limits of precision
of the method of analysis (±0,12% relative). This is rather good
evidence of the essential stability of the mixture in aluminum
cylinders
.
2 . c Automation of Gas Analysis
The Computer Operated Gas Analysis System (COGAS) has been
modified and programmed to analyze gas SRMs using gas chromato-
graphic and other discontinuous analyzers . The system works as
well for discontinuous analyzers as it does for continuous
analyzers, such as non -disper s ive infrared instruments. It
is now used routinely for certification of all gas SRMs, with
the exception of permeation tubes and high concentration sulfur
dioxide in nitrogen standards.
Work is in progress t
cylinder capability,
a different program,
bration of permeation
programming as was de
o expand COGAS from a
In addition, work is
to construct a system
tubes utilizing simi
veloped for COGAS.
twenty to a fifty
in progress,within
to automate the cali-
lar hardware and
31

0 Develop Methods for Dispersal of Particulates on Filter
Media and Methods for Determining and Controlling the
Composition and Morphology of Such Dispersed Particulates
5 . a NBS-SRM 1648 Urban Particulate Matter
SRM 1648 has been certified (see Appendix I).
5 . b Synthetic Ground Glasses Deposited on Filters
There has been no activity in this project during the past
six-month period.
5 . c Thin Glass Films Produced by Focused-Ion Beam Sputtering
In the previous report covering the period from January 1 to
July 1978 we described our work in the following areas: (1) Depo
sition of NBS-SRM 1648 particulate matter, (2) Grinding of syn-
thetic glasses prior to deposition on filters, and (3) thin
films of glasses prepared by the focused ion-beam sputtering
technique. From July 1978 to December 30, 1978 our work was
directed totally to the preparation and characterization of glass
films prepared by sputtering and the results of this work are
described in this report.
The 17.8 cm glass target used in these sputtering experiments
was fabricated and ground to a thickness of 2 mm at NBS, The
elemental composition of the target was the same as used in
previous work described in the report of July 1977 and consisted
of 36.0% SiO^, 18.0% CaO, 20% ZnO, and 26% PbO. A series of
experiments was performed in which the major instrumental
parameters, such as ion- acceleration voltage and ion-beam current
were systematically varied to determine their effect on the
elemental composition of the glass films. Table 8 is a summary

SLUiuiiary
of
Instrumental
Conditions
Employed
(Large
Machine)
c/1 o o o OHf 'T "H” rH
o u Oh—4 O o o O O
Cl <S) o LOrH
4->
•g %“O ^ LO un LO LO cn o""3 H" CO rH
rHo-
O o VO \0 vO 'O• • e « « «
-M CM CNl oi CSI Osl
CD O \0 o O vO2 HJ- HT
O0) o o o O
• CcO o o o o LO o1 r—I CC 00 CO CO o rH oG U 4-> 1 i 1 o 1 LOO U f-H o o o o1—1 o o o o rH o rH> r-- o
rH
CO CO CO CO 00 CO1 1 1 j 1
o o o o o oCXI r-} rH rH rH rH rHO g X X « X X X
rH rH rH rH rH rH
CO CO oo CO CO 00OQ 1 1 J 1 I
o o o o o o< ^ rH rH rH rH rH rH
X X X X X Xg r-x r-- r--
•
o-M o vO 'O CO
£ • « • • •
c/i 5-1 rsi Osl CNJ Osl •
CQ <D
C O o o o o oG. CD O o vO vO vO iGia
LO LO LO LO LO oj
M LO i_n LO LO LO lO<—« X,
S LTi lC LO LO LO vO• • • • • rH
3 HT rH H"rH cva CV] rg fNl CN4
•H 1 1 1 1
)Gi o vO 'OrH rH rH rH
0 •
£ c/) ro LO•H 5-t • «> • •
H X HT Hf CV! to ro
• -MO C 0 hO r^ vO LO LO LOX -H CO
M •
0 O rH 04 hO LO vOCO 2
OO CO COCO CO CO r-- r^
0 r-- o-cr^ 'O CTi
c3 LO LO r-H CM CNl
—
^
LO LO LO VO ’O 'O
(
3 3
Large
machine
used
is
instriuiient
Bin
1978.

of the instrumental conditions employed. Table 9 is the
results of the analysis of the glass films measured by x-ray
fluorescence spectrometry. Some commercial thin films con-
taining single elements were used as standards, including
previously measured thin sputtered films Ce.g . F-20, F-23).
It should also be noted that in the present instrument employed,
a 12 % oxygen, S8% argon atmosphere was maintained for sput-
tering the target, prior to deposition on the substrates for
at least two hours. For purposes of comparison the results
of previous work described in the July 1977 report (i.e.,
instrument A) are tabulated along with the results of this work
(i.e., instrument B)
.
Comparison of the results in Table 10 indicate that the larger
instrument (B) used in 1978 produced films whose composition
was closer to the bulk target composition for Ca, Zn, and Pb
.
The value fo-r silicon is about the same for either instrument.
It is interesting to note that although preferential sputtering
for the light elements Si and Ca and a decrease for Zn and Pb
still exists, .the absolute value of the relative difference
of all elements from the bulk composition is approximately the
same. From Table 9 it appears that varying the sputtering
parameters (voltage and ion-current) does not affect the film
composition apprecia-bly . The best agreement was obtained in
sets 2 and 3 which were done in the same day under identical
conditions. Set 5 showed the largest deviation for Pb and
was prepared under the highest ion-beam current obtainable.
Even under these extreme conditions the Pb composition of set
5 was only 10-15% less than the average value of the other sets.
These findings are important in that the ion acceleration vol-
tage and ion-beam current principally determine the rate at
which the sputtered secondary atoms leave the surface of the
target with no significant change in the film composition.
\
34
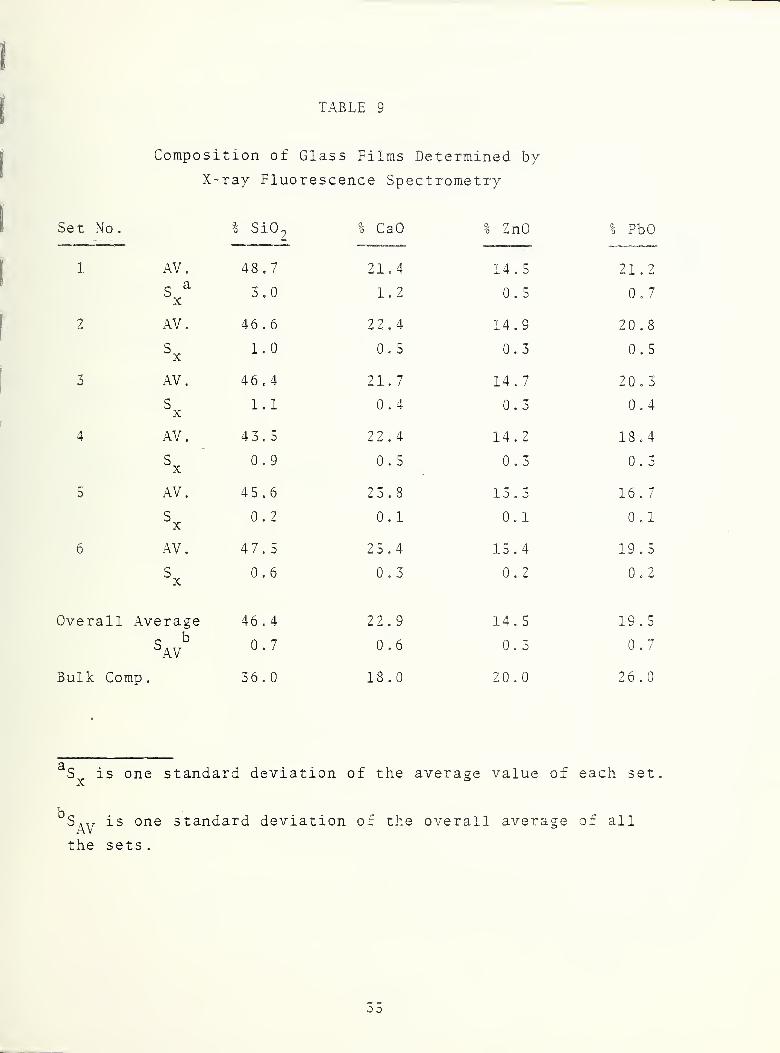
TABLE 9
Composition of Glass Films Determined by
X-ray Fluorescence Spectrometry
Set No. % SiO^ % CaO ZnO % PbO
1 AV. 48.7 21.4 14.5 21.2
S^
X3.0 1 .
2
0 . 5 0 . 7
2 AV. 46.6 22.4 14.9 20 .
8
Sx 1.0 0.5 0.3 0 . 5
-r
j AV. 46.4 21.7 14.7 20.3
SX
1.1 0 .
4
0.3 0 .
4
4 AV. 43.5 22.4 14.2 18.4
SX
0.9 0 . 5 0 . 3 0 . 3
5 AV. 45 .
6
23 .
8
13.3 16 . 7
SX
0.2 0.1 0 . 1 0 .
1
6 AV. 47.5 25.4 15 . 4 19 .
5
SX
0.6 0 . 3 0 . 2 0 . 2
Overall Average 46 .
4
22 .
9
14.5 19 .
5
S°
^AV 0.7 0 .
6
0. 3 0 . 7
Bulk Comp
.
36.0 18.0 20 . 0 26 . 0
a-cS IS one standard deviation of the average valueo of each set,
Uis one standard deviation of the overall average of all
the set s
.

TABLE 10
Comparison of the Average Composition of Sputtered
Films Using Two Different Instruments A and B
Instrument ^ % CaO ZnO PbO
A, 1977
AV. 43.7 32.0 7.8 8,8
B, 1978
AV. 46.4 22.9 14.5 19 .
5
Bulk Comp. 36.0 18.0 20 . 0 26 .
0
% Rel. A,^ A +21 +78 -61 - 66
^0 Rel. A,^ B +29 +27 -28 -25
o
Percent relative difference between the film and bulk composit;
1 . eFilm-Bulk
BulkX 100
56
\

Although there still exists an appreciable difference between
the target and the film composition, this is not considered
important as long as the film composition obtained from any
particular target is constant and reproducible. The results
obtained thus far indicate that this is indeed the case. The
addition of oxygen in the sputtering atmosphere appears to
increase the content of ZnO and PbO in the films, and also
greatly decreases the amount of trapped argon in the films.
Additional experiments are now in progress in which the amount
of oxygen in the sputtering atmosphere is being varied to quan-
titate its effect on the film composition.
Future Work
Further work is planned in 1979
targets of different elemental
and to prepare thin films from
is the fabrication of a target
borate matrix. The results of
next semi-annual report.
to fabricate additional glass
composition of interest to EPA
these. Of great interest to us
containing sulfur as sulfate in a
this work will be reported in the
37

4 Particulate Physical and Chemical Characterization
l.a.b.c Particle Doppler Shift Spectrometer (PDSS)
Progress has been made in the optical configuration, the
chamber design, and the data collection method. Calibration
of a commercial optical particle counter was performed. Also,
for the first time, experimental data reproducibly matches the
calculated Mie scattering curve features over a broad range of
sizes. These Mie features are reflected in relatively large
differences in the intensity of light scattered as a function
of particle diameter. This match of Mie features serves as an
internal standard to better than 0.2 pm accuracy for homogeneous,
spherical aerosol particles of four to .twenty ym diameter.
Before reviewing these advances, some comment on items in the
January 1978 and September 1978 Semi-annual Reports- is in order.
First, methylene blue was found to be unsatisfactory for solid
size standard particles. The imaginary part of the index of
refraction was so large as to obliterate the Mie feat.ures . Second,
a vacuum system was implemented on the PDSS, and the predicted
increase in particle velocity was observed for 2 ym diameter
latex spheres. We have not yet pursued this further because of
difficulties in introducing the aerosol sample into the vacuum,
and because of a lack of Mie features for smaller particles
.
Third, computer matching Mie features to experimental data by
searching the index of refraction and density space has turned
out not to be practical. Index or density, but not both, can
be determined by matching the Mie features . We have found it
better to start with a substance of known index and density,
determined from the bulk material.
The ne\'i PDSS optical configuration increases the size resolution
and data rate by collecting light from a larger scattering volume
\
38

and from a more narrowly defined scattering angle. A viewing
microscope is included to give a visual check of the scattering
.volume
.
The new chambers are de
interference effects as
new design also include
surface (bottom window)
signed to suppress convection and wall
were present in previous chambers . The
s a Brewster window and a sample collection
that can be changed during a run.
An entirely new data collection scheme is being developed. The
spectrum analyzer collects the summation of many spectra in the
usual way for the Mie feature calibration. Simultaneously, the
computer accumulates the peaks (particles) by size, from each
spectrum, in real time. In this fashion, the size distribution
can be measured directly in terms of equivalent aerodynamic
diameter regardless of the shape of the aerosol particles. For
the case of homogeneous spheres made from well characterized
material, the equivalent aerodynamic diameter can then be related
to the optical diameter using the Mie feature calibration.
The match of Mie features mentione
a spray of pure di-octyl phthalate
match is being used as a standard
generated by the following general
are observed: the vibrating orifi
higher flow rates, and aerosol spr
be due to various effects which we
sensitivity of the Mie feature cal
d above has been obtained with
(DOP) from an atomizer. This
for investigation of DOP aerosol
ors for which slight mismatches
ce generator, the atomizer at
ay cans. These mismatches may
can detect because of the
ibration technique.
Befo re the ab
opti cal parti
low part ic le
gene rat ed by
and eight ym
ove match was obtained, a comparison of a commercial
cle counter with the PDSS was performed at very
concentration. The twelve particle sizes used
the vibration orifice generator, were between four
diameter. Results of this work are to be published.
59

F
4.
d.e Development of Air Supported Plasmas
No activity in this project during the last six months.
5 Particulates on Glass Fiber Filters
5.
a.i. I on -Chromatography
A recent acquisition to the Inorganic Analytical Research
Division of the Center for Analytical Chemistry at NBS is the
Ion-Chromatograph (Dionex Corp. ,
Sunnyvale, CA) . Acquired
in January 1978 and put into operation in March, the instrument
is now fully operational and has already been used to analyze
several diverse types of samples, ranging from oysters to air
filters
.
The Ion-Chromatograph is a new tool for trace analysis in
analytical chemistry that is based on the ion-exchange chromato-
graphic separation of ionic species, followed by conductimetric
detections. The high background conductance associated with
the eluent is made negligible through use of a suppressor resin
column. The method is ideally suited for inorganic anions,
but is also applicable to low molecular weight organic acids,
as well as some cations and cationic species. Ion-chromatography
has already shown great promise toward the solution of complex
trace analysis problems, in particular, the speciation and
quantitation of species existing in, or are conducive to
conversion to, anionic forms. The potential of ion-chromatography
to determine several species simultaneously is especially attrac-
tive to the field of microanalysis. A typical analysis of a
suitably prepared sample containing fluoride, acetate, chloride,
nitrite, phosphate, bromide, nitrate, sulfite, and sulfate, takes
about 25 minutes (Fig. 9). The minimum detection limit for these
common anions under standard conditions is about 0.5 ppm, with
a precision of 1 to 3 percent. The minimum detection limit can
\
40

lOW-CHROMATOGRAPHY
STANDARD
1
41
minutes
Figure
9.
Typical
analysis
of
a
suitably
prepared
sample
containing
fluoride,
acetate,
chloride,
nitrite,
phosphate,
liromide,
nitrate,
sulfate,
and
sulfate.

be extended 10 to 100-fold through use of larger sample loops
or concentrator columns. Current research indicates that, under
different chromatographic conditions, iodide can also be deter-
mined with a minimum detection limit of about 0.2 ppm.
Since ion- chromatography is a chromatographic (separation)
technique, speciation (e.g. sulfide/sulfite/sulfate; nitrite/
nitrate) is possible, and is primarily dependent on the method
of sample preparation. Aqueous samples, such as rain water,
fresh water, and sea water, may be analyzed with little or no
sample manipulation; solids must be solubilized, generally by
standard microchemical techniques (dissolution, sonif icat ion
,
extraction, fusion, digestion, or combustion) .Such
manipulat ions may, of course, alter the rate of these species
in the original sample. Much research is being concentrated
in this laboratory in optimizing sample preparation methods
and chromatographic parameters for simultaneous mult i-com.ponent
analyses in real samples.
The types of samples analyzed to date in this laboratory by
ion-chromatography include lyophilized oyster tissue, mechanical
packing products, glass fiber filters, penetrant inspection
materials, and waste oil.
The scope of the oyster project was to detect and quantitate
as many anionic species as possible in lyophilized oyster tissue.
It was intended to look at both the anions soluble in water, and
the anions resulting from a suitable combustion technique. For
the solubles, six peaks were detected, and identified by refeience
to a standard solution. Quantitation was possible only to a
very approximate level for the soluble anions (Table 11) i^Figure
10) . Very good quantitative information on chloride and sulfur
was obtained after combustion of the oyster tissue in a Schoniger
oxygen flask (Table 12) (Fig. 11)
.
4 2
\

TABLE 11
Solubles in Oysters
Peak Identification and Approximate Quantitation
PeakProbable ApproximateSpecies Concentration
a F < 0 . 0 2
b Cl 1.1%
c PO^' 0.7%
d Br“ <0.09%
e no; <0.13%
f SO4
0.19%

SOLUBLES IN OYSTER
Figure 10, Solubles in oysters.
\
44

TABLE 12
Chloride and Sulfur (as Sulfate) Concentrations in
Oyster SRM as Determined by Ion- Chromatography
After Schoniger Flask Combustion
Sample Wt
.
ScrubberSo In. Wt. Chloride Sulfate
11.59 mg 20.10 g 1.034% 2.201%
24.36 20 .07 1.032 2 .259
oo o 20.00 1.057 2 . 244
12.05 19.99 1 . 010 2 .253
18 .32 19.99 1.037 2 . 258
17 . 33 20.20 1 .051 2 .278
26.67 19.99 1.038 - " -
20 . 11 20 . 02 1 .013 2 . 300
MeanStd . Dev
.
Rel . Std . Dev
.
1,034%0.016 ,
1.6 %
2 .256%0 .0311.4 %
4 5
o\o
o\o

OYSTER
17.33 mg combusted in Schdniger flask
Figure 11. Chloride and sulfur concentrations in oyster SRM asdetermined by ion chromatography after Schdnigerflask combustion.
46 s

Leachable chlorides have been determined in mechanical packings
(Teflon asbestos or graphite-asbestos composites) at the 10-100
ppm level. Nitrate and sulfate on glass fiber filters were
determined for use as standards in air -part iculate analysis
(Table 13) . Penetrant inspection materials used to detect faults
in steel welds were analyzed for fluoride and chloride in conjunc
tion with an ASTM round-robin. These materials were combusted
in a Parr oxygen bomb prior to analysis. The level of chloride
in fourteen different samples ranged from 3 to 1800 ppm, and
fluoride from 0.5 to 200 ppm. Waste oil has also been analyzed
by ion-chromatography for chloride and bromide after digestion
by the sodium alcoholate method.
These five types of analyses briefly illustrate the types of
samples amenable to analysis by ion-chromatography. Obviously,
ion-chromatography has tremendous potential in the determination
of heretofore uncertified species in the NBS environment and
energy related Standard Reference Materials presently available
(such as coal and bovine liver);
as well as in new materials
(such as the air-particulate filter strips). It is anticipated
that the potential of the ion chromatograph will be fully exploit
in trace analysis application to such areas of activity at NBS.

TABLE 13
Summary Analysis of Filter Strips for Nitrate and Sulfate
by Ion-Chromatography
Nitrate SulfateSeries Mean CS .D. ) (R.S.D.) Mean (S.D .) (R.S.D.)
II-BL 1.5 dg (1.0) 2.3 yg (1.5)
II-A 100 .
3
ug (2.6) (2.6%) 502.6 yg (8.9) (1.8%)
II-B 1002 ug (16) (1.65) 2002 yg (29) (1.5%)
II-C 2513 yg (43) (1.7%) 6939 yg (109) (1.6%)
48
5 . a . i i Lead, Sulfate, and Nitrate on Filter Med i
a
This SRM consists of '^16 nun x 203 mm strips cut from glass
fiber filters. These filters are of the type commonly used
with high volume samplers for the measurement of atmospheric
particulates. Solutions containing known amounts of potassium
sulfate, potassium nitrate, and lead nitrate were prepared
gravimetrically and aliquots of 25 yL were pipeted onto the
filter strips. Four aliquots were transferred to each filter
in all cases except sample I-C which required five aliquots.
The pipets were calibrated by weighing similar aliquots trans-
ferred into weighing bottles.
The filters were prepared in a clean room and allowed to air-
dry before packaging in glassine envelopes. The filters
were prepared in groups of 100 and the proper number of aliquots
were dispensed into weighing bottles at the beginning and end
of each loading sequence, to monitor the performance of the
pipet
.
The values calculated from the composition of the solutions
and the quantities delivered by the pipets are in agreement
with the analytical values. The nominal values are shown in
the attached table 14. Six hundred filters at each level were
prepared
.
Work on Pb on GFF has started and is being steered toward
development of an SRM.
Work on sulfate and nitrate also being steered toward develop-
ment of SRMs
.

TABLE 14
Nominal Values of SO^, NO^, and Pb on Filters
------- yg/filter -----Filter Group Sulfate Nitrate Lead
Blank 0 0
I-A 500 100
I-B 2000 1000
I-C 7000 2500
Blank — 0
II-A 100
II-B 300
II-C 1500
6 Urban Air Particulate Washington D. C. S amp 1
e
Work begun under this task to be reported on in next semi-
annual report.
7 Develop SRMs for Coal Conversion Processes and Materials
Balance Determinations
A multi -element radioanalytical procedure for the simultaneous
determination of As, Cr, Se, Sb,
Cd, and Cu was developed and
applied to two NBS environmental standards, a new Fly Ash SRM
(1633a) and a new Sub -bituminous Coal SRM (1635). An inorganic
ion exchanger coupled to a solvent extraction system was used
for the selective separation of these elements from neutron-
activated matrices. The results are shown in Tables 15 and 16.
During dissolution of the Fly Ash SRM, large losses of chromium
were observed. These losses were mainly due to the large amounts
of HF needed for complete dissolution of the highly silaceous
matrix and the fact that chromyl fluoride is extremely volatile.
\
50

Because of the losses of chromium, instrumental neutron activa-
tion analysis was used to analyze chromium in the Fly Ash.
TABLE 15
NBS SRM Sub -bituminous Coal (1655)
Element Certified Values^ This Work^
As 0.42 ± 0.15 0.44 0.05
Sb (0.14) 0.12 ± 0.01
Se 0.9 ± 0.3 0 .82 ± 0.04
Cr 2.5 ± 0.3 2.48 + 0.08
Cd 0 .03 ± 0.01 0 .029 0.003
Cu 3.6 ± 0.3 3 . 56 + 0 .18
TABLE 16
NBS SRM Fly Ash (1633a)
This Work^
146 ± 6
152 ± 8
6.07 ± .61
11 ± 1
200 ± 7
1.06 ± .16
121 ± 6
3.
Units in ug/g.
Determined by Instrumental Neutron Activation Analysis.
As
As
Sb
Se
Cr
Cd
Cu
51

8 Development of an Oil Shale SRM
A preliminary analysis of the proposed Oil Shale SRM has been
done by instrumental neutron activation analysis (INAA) for
elements having intermediate and long-lived neutron irradiation
products. The observed elemental concentrations are listed in
Table 17, along with the estimated uncertainties obtainable by
INAA. The concentrations of approximately thirty elements can
be determined by INAA. In general, the concentrations of trace
elements in the Oil Shale is very similar to those in SRM 1632a
(Coal) .
Arrangements are being made to have some of the Oil Shale
sterilized. This sterilized material will be compared to some
unsterilized Oil Shale to determine if there are any changes in
the elemental concentrations of volatile elements. Some of
the sterilized and unsterilized material will be given to the
Organic Analytical Research Division to look for differences
in the concentrations of organic compounds.

TABLE 17
Approximate Elemental Concentrations in Shale Oil
as Determined by INAA
ug/g Estimated Uncertainty
Na 1.6^ <5
K 1.0^ <5
Rb 63 <5
Cs 3.4 <5
Ba 540 5-10
Sc 4.6 <5
Cr 32 <5
Fe 1 .8^ <5
Co 9 .0 <5
As 64 <5
Se 3.5 5-10
Sb 2.8 5-10
La 20 <5
Ce 34 <5
Sm 2 . 5 <5
Eu 0 .52 <5
Yb 0 .85 <5
Lu 0 . 18 <5
H£ 1.5 5-10
Ta 0.30 10-15
Th 4 .
7
<5
o
Value is given as percent, all other values are in ug/g.
55
o\=>

L' S, Depanment ot CommerceJuanita Kreps
Secretary
APPENDIX I
Nationai Bureau of StandardsErnest Ambler. Director ^
pmmvi
of
Standard Reference Material 1648
Urban Particulate Matter
of ^lanrlards
^nal^sts
This Standard Reference Material is intended for use in the calibration of methods used in the chemical analysis
of atmospheric particulate matter and materials with similar matrices. The material is atmospheric particulate
matter collected in an urban location.
The certified values are based on measurements of 6 to 30 samples by each of the analytical techniques indicated.
The estimated uncertainties include those due to sample variation, possible methodology differences, and errors
of measurement (see Preparation and Analysis). The certified values are based on a sample size of at least
100 mg of the dried material. The material should be dried at 105 °C for 8 hours before use.
Element Mg/g Element Weight %
Arsenic''
115 ± 10, a b c e
Iron 3.91 ±0.10
^ , abedCadmium 75 ± 7
T ,a b dLead 0.655 ± .008
Chromium*’'
403 ± 12
^ a b eCopper 609 ± 27
Nickel^ 82 ± 3
— . abedZinc 4760 ± 140
TT•
Uranium 5.5 ± 0.1
Atomic Absorption Spectrophotometry
Isotope Dilution Mass Spectrometry
Neutron Activation Analysis
Poiarography
Spectrophotometry
The overall direction and coordination of the technical measurements leading to certification were performed
under the chairmanship of J. K. Taylor.
The technical and support aspects involved in preparation, certification, and issuance of this Standard Refer-
ence Material were coordinated through the Office of Standard Reference Materials by W. P. Reed.
Washington, D.C. 20234 J. Paul Cali, Chief
November 16, 1978 Office of Standard Reference Materials
(over)
54
N

Preparation and Analysis
This SRM was prepared from urban particulate matter collected in the St. Louis, Missouri, area in a baghouse
especially designed for this purpose. The material was collected! over a period in excess of 12 months and, there-
fore, is a time-integrated sample. While not represented to be typical of the area in which it was collected, it is
believed to typify the analytical problems of atmospheric samples obtained from industrialized urban areas.
The material was removed from the filter bags by a specially designed vacuum cleaner and combined into a
single lot. This product was screened through a fme-mesh sieve to remove most of the fibers and other
extraneous material from the bags. The sieved material was then thoroughly mixed in a V-blender, bottled, and
sequentially numbered.
Randomly selected bottles were used for the analytical measurements. Each analyst examined at least 6 bottles,
some of them measuring replicate samples from each bottle. No correlation was found between measured
values and the bottling sequence. Also, the results of measurements of samples from different bottles were not
significantly different than the measurements of replicate samples from single bottles. Accordingly, it is
believed that all bottles of this SRM have the same composition.
The analytical methods employed were those in regular use at NBS for certification of Standard Reference
Materials, except as noted in the following paragraphs. Measurements and calibrations were made to reduce
random and systematic errors to no more than one percent, relative. The uncertainties of the certified values
listed in the table include those associated both with measurement and material variability. They represent the
95 percent tolerance limits for an individual sub-sample, i.e., 95 percent of the sub-samples from a single unit of
this SRM would be expected to have a composition within the indicated range of values 95 percent of the time.
The following values have not been certified because either they were not based on results of a reference
method, or were not determined by two or more independent methods. They are included for information only.
All values are in units of ug/g of sample, unless otherwise indicated.
Aluminum (3.3 wt. %) Lanthanum (42)
Antimony (45) Magnesium (0.8 wt. %)
Barium (737) Manganese (860)
Bromine (500) Potassium (1.0 wt.%)
Cerium (55) Samarium (4.4)
Cesium (3) Scandium (7)
Chlorine (0.45 wL %) Selenium (24)
Cobalt (18) Silver (6)
Europium (0.8) Sodium (0.40 wt. %)
Hafnium (4.4) Thorium (7.4)
Indium (1.0)' Titanium (0.40 wt. %)
Iodine (2O0’ Tungsten (4.8)
Vanadium (130) _
55

The values listed below are based on measurements made in a single laboratory, and are given for information
only. While no reason exists to suspect systematic bias in these numbers, no attempt was made to evaluate such
bias attributable to either the method or the laboratory. The method used for each set of measurements is also
listed. The uncertainties indicated are two times the standard deviation of the mean.
Nitrogen (NO3)
Nitrogen (NH4)
Sulfate
Si02
Freon Soluble
(1.07% ± 0.06)
(2.01% ± .08)
(15.42% ± .14)
(26.8% ± .38)
(1.19% ± .47)
The above values were determined by the methods indicated below;
Nitrate -
Ammonia
Sulfate
Si02
Freon Soluble
Extraction with water and measurement by ASTM Method D992.
NaOH addition followed by steam distillation and titration.
Extraction with water and measurement by ASTM D5I6.
Solution and measurement by ASTM Method E350.
— Extraction with Freon 113, using the method described in “Standard
Methods in Examination of Water and Waste Water,” 14th Edition, p. 518,
American Public Health Association, Washington, D.C.
J. W. Matwey supervised the collection of the material as well as sieving and bottling. The following members
of the staff of the NBS Center for Analytical Chemistry performed the certification measurements: R. W. Burke;
E. R. Deardorff; B. I. Diamondstone; L. P. Dunstan; M. S. Epstein; M. Gallorini; E. L. Gamer, J. W. Gramlich;
R. R. Greenberg; L. A. Machlan; E. J. Maienthal; and T. J. Murphy.
\
56
80-BCL-b-ENERGY RELATED AIR POLLUTANT ANALYSIS INSTRUMENTATION
1 Development of an instrument to measure airborne sulfate
particulate matter
Introduction
This progress report presents the results of further study of the
pulsed flame photometric sulfur analyzer and of the effects of SO^
and humidity on the calibration of the system with (NH^)^SO^ and
H^SO^ aerosols. The system has been used in a mobile laboratory
by the University of Minnesota in recent field studies and field
calibration results will be compared with those obtained from
laboratory calibration.
Calibration Results
The laboratory calibration technique consists of generation of an
ammonium sulfate or sulfuric acid aerosol by atomization of the
appropriate solution, followed by dilution with dry air and neu-
tralization of the aerosol with a radioactive neutralizer. The
humidity of the sample is adjusted by mixing with the required
amount of moist air to give the desired relative humidity. Part
of the sample is fed to the pulsed FPD system and part to an E.AA
(electrical aerosol analyzer) to determine the sample concentration.
Figure 12 shows the pulsed FPD system response to ammonium sulfate
aerosols at various relative humidities with and without SO^
added to the sample. Figures 15 and 14 show the response of the
pulsed FPD system in mV output versus sample sulfur concentration
in ugS/m'*^ for ammonium sulfate and sulfuric acid, respectively.
Calibrations were done at low humidification ('^10%r.h.) and at
high humidification ('^bOr.h.) with SO^ levels of 0 ppb and '^10 ppb
.
The results in all figures show considerable scatter as xvell as a
systematic dependence of the results on both SO^ and relative
57

ciddod*
appnox
10ppb.
t'iold
oallbration
I—{—
h
H—
h
H h H i h
inCM
Q(M
(MU^ M/qV gi 1/ w
IT3
4—+-
rc4
ea
ru
CM
CM
CM
CM
Ci
CSTJ
CM
CM
-f—
r
IT/
S0UOC'r—;4 iiJGq
ES
0Z.
03
ss
+ r»4,I S'
E3
03
01
V ^
X+)
•H
~U•H
3X9
•H«
\
d
58
ligiire
12.
Pulsed
PPD
system
response
to
ammonium
sulfate
aerosols
at
various
relative
b.umidities
witii
anci
v'ltliout
SO^
added
to
the
sample.

S9
Io
.
11rLJ
n
Lcinoe;
n
tf*'
a'bions
rn
io
r-o
cj
r-
ci
n;
;/i
'
ponse
of
the
pulsed
fPO
system
in
mV
output
versus
sample
Iu1'
concent
rat
ion
in
jig
S/m^
for
aiiimoii
ium
sulfate.

No
Humid
iFi
cation,
HumidiFiocition,
no
SOg
SO2,
but
no
humidiFioation
Both
humidiFioation
and
SO
0
!/)
DCO
U •
O r3>
uM r3
C- U
3 ^O 3
rH£ 3
CO
H ?-(
O
o4_) m
CO CO
u,c
03 -H0•o 3r—
I O
3.c3
0 3r3 (->
!-> 30
'+-( ;j
O 3O
0 U’J)
3 3C 33-’-^
CO
0 3Ci CO
033cO
\
60

humidity. The results in Figure 12 showing instrument sensi-3tivity (ygS/m mV) as a function of relative humidity are quite
consistent in the presence of '^^10ppb added SO^, but show great
scatter if no SO2
is present.
^
In the figures a field calibration value is also indicated. This
was obtained from a comparison of the average response of the
sulfur monitor and x-ray fluorescence analysis of filter samples
taken during the corresponding averaging time interval. This3comparison gives a value of 3.45 ugS/m mV for the pulsed FPD
instrument response. This is plotted in the figures and one can
see that in the cases where the sample is humidified ('^^60% r.h.)
and where SO^ is present (viOppb) the agreement with laboratory
calibration results is quite good. This is encouraging because
the field results were obtained under conditions similar to these.
We are still not able to explain the results for low relative
humidity and SO2
. Low SO^ may accentuate some noise problems with
the nonlinear amplifier in the FPD and signals around zero may
cause problems in signal averaging by the lock-in amplifier. We
are also going to check the use of the EAA as a means of charac-
terizing the calibration samples by comparing it with values
obtained by filter and QCMM (quartz crystal mass monitor)
measurements
.
Conclusion
The pulsed-FPD sulfur analysis sytem has performed xvell in field
study applications and the results obtained are in agreement with
results obtained by other techniques. Several problems still
exist related to the effect of relative humidity and gas phase
sulfur on calibration techniques. We must determine if these
effects are related to the system response or our calibration
methods. Field and laboratory calibration values are consistent
and in agreement for laboratory calibrations done under conditions
similar to those in the field study.
61

80-BCL-c-ENERGY RELATED POLLUTANTS AND EFFECTS MONITORING AND
ASSOCIATED METHODS AND TECHNIQUES DEVELOPMENT
1 Radiocarbon as an Environmental Tracer
Introduction
The first results demonstrating the feasibility of mini-low level
counting (lla) of radiocarbon to distinguish anthropogenic from
natural pollutant sources, using only mg sample sizes, have been
published (1,2). Following this accomplishment, we have taken
steps to further extend our capabilities — in terms of sample
size, throughput, and quality control. We have undertaken coopera-
tive experiments at the request of the Oregon Graduate Center and
the University of Washington to apply our unique method to two
specific environmental problems. These particular applications
served also as a logical next step in our research, for they
allowed us to increase the discriminating power of the (lie) method
through the addition of chemical and physical (particle size)
selectivity
.
Building on the experience of the past year, we are now developing
future directions to make major advances in our capabilities
through the use of accelerator mass spectrometry (AMS ) ,large low-
background proportional counters, stable isotope analysis, and
trace gas radiocarbon analysis (Ref. 5 and App . III). These
approaches will make possible far more selective and reliable
information on source strengths, residence times and transport
mechanisms of carbonaceous species in the environment; and the
resultant data could provide important insight concerning
paleopollution and the influence of atmospheric species on climate.
Parallel activities directed toward measurement accuracy and model
validity have also taken place. A comprehensive treatment of the
question of accuracy in chemical analysis has just been published

Beyond the limit of our shielding, i.e., thick iron or lead
external shielding plus pure copper internal shielding, the back-
ground rate is limited by counter size and construction material
purity. In order to minimize these effects, counters have been
constructed of high purity quartz, and volume has been reduced
such that elevated pressures are required to assure sufficient
sample activity. These experiments have been successful in that
routine operation up to several atmospheres is not possible, with
no detectable pressure dependence of the background rate. The
international radiocarbon dating standard (Oxalic Acid, SRM 4990B)
has been used for counter calibration, and this and two other
reference samples have been used for quality control or inter-
laboratory comparison of percent contemporary carbon activity
of environmental samples. The following materials are used in
our laboratory; NBS contemporary oxalic acid, SRM 4990B; USGS
wood sample (7060 ± 250 yrs. B.P.); and urban dust air particulate,
NBS SRM 1648 (Table 19)
.
The results in Table 18 thus illustrate three phases of our work:
calibration (NBS-Oxalic Acid SRM- standard),measurement (urban
dust SRM),and quality control (USGS wood sample) . The result
for the USGS wood (counter N) is consistent with the known age,
and the result for the urban dust is the first quantitative
radiocarbon assay of that material.
Quality control for (llo) is monitored by a continuous record of
anticoincident count rate, meson rate, and guard rate. Figure 15
is an illustration representing data from our measurements of the
USGS wood sample. The parameters monitored (Rq, R,
permit
us to assess electronic and counter stability, meson cancellation
efficiency, and counting gas purity. A fourth parameter, baro-
metric pressure, will be added for high precision measurements and
evaluation of trends in guard and meson rates. For the initial
observations (1-4) in figure 15, neither precision nor control
65

Observed
Fraction
of
Contemporary
(1978)
Carbon
1.00
0.75
0.50
BCDI j j
©/
/
///
/ ©
//
/
0.25 - //
//
/
0 0.25 0.50 0.75 1.00
Expected Fraction of Contemporary Carbon
(Pure Source)Figure IS. .-inticoincident (R^^)
,meson (R^), and guard (R^J count
rates (cpm) versus run number for USGS Wood Sampleutilizing Counter J. Poisson uncertainties (±la) arerepresented by error bars for corresponding pointsymbols
.
6 6 \

TABLE 19
Standards and Reference Samples
Counter Percent(nominal Counting Standard and Net Count Rate Modern,volume) Gas Reference Samples (cpm/10 mg C) Carbon^
N CO^ NBS - Oxalic Acid 0.090 ± 0. 005 105%L SRM 4990B
uses Wood Sample(7060 ± 250 yr B.P.)
0.029 ± 0 . 005 34%
NBS - Urban Dust 0.048 ± 0.006 56%SRM 1648
J CO^ NBS - Oxalic Acid 0.097 ± 0.007 105%
(5 mL)L SRM 4990B
uses Wood Sample(7060 ± 250 yr B.P.)
0.038 ± 0.004 41%
M CO^ NBS - Oxalic Acid 0.085 ± 0.009 105%
(15 mL)
^Uncertainties represent
^Percent modern carbon =
Poisson standard deviations.
Net Sample Activity0.95 X NBS Oxalic Acid SRM
^ 10 0 %
were adequate, due in part to insufficient counting time and
external difficulties (air conditioning and computer shutdown)
.
For the rest of the sequence, all observations are consistent
with counting statistics, except for small barometric pressure
related variations in R- and R .
G y
A planned expansion of our multiple counter capability is under-
way (—first) through the investigation of source(s) of spurious
pulses. Our present system, which uses two-dimensional spectrom-
etry, (energy vs rise time), is limited to the simultaneous
67

operation of four counting channels. If sources of spurious
pulses can be identified and controlled, then counting can be
accomplished by energy discrimination only. It would be then
much more practicable to utilize the full capacity of our present
shielding, which can accommodate 50 to 100 counters. A Cromemco
Z-2 Computer System, with an 8-inch dual floppy-disc drive, line
printer, viewing screen, and teletype will be installed shortly
[J. R. DeVoe, personal communication) for acquisition and reduc-
tion of radiocarbon data. With this new system environmental
parameters influencing count rate, such as barometric pressure,
room temperature, and humidity, as well as the previously discussed
counter-control parameters, can be continuously monitored.
Applications to Pollutant Source Identification
During the past three months experiments have been completed to
access the applicability of radiocarbon measurements (lie) to
resolve the contributions of field and slash burning, wood stoves,
natural emissions, fossil fuel combustion, etc. to the total
urban particle load in areas such as Portland and Eugene, Oregon
(6). This cooperative project with Prof. John A. Cooper of the
Oregon Graduate Center (OGC) complements an extensive analytical
program at OGC to determine the major sources of airborne
carbonaceous and non-carbonaceous particles. From the many
particulate samples taken in the Portland area at different
locations, and for differing collecting periods, meteorological
conditions, and particle size fractions, a select group (filters
frl-8, see Table 20) was taken for radiocarbon assay as most
representative of the sources in question. Radiocarbon results
will later be compared to the results of inorganic analyses to
develop a powerful tool to derive quantitative information on
sources of fine particles as an aid in defining sources on days
when air quality criteria are exceeded.
\
6

TABLE 20
Modern Carbon in Portland Aerosols
Carbon
Filter Collection Primary Size Mass PercentNumber Date Impact Fraction (mg) Contemporary
1 18 Oct. 77 Slash Total 48 47 ± 12
2 Fine 11 107 ± 18
3 F ine 21 80 ± 15
4 23 Jan. 78 Fireplace F ine 24 62 ± 13
5 Total 72 45 ± 12
6 17 Aug. 77 Violation(No Burning)
Total 22 77 ± 15
7 11 Aug. 78 Field Fine 42 107 ± 15
8 3 Aug. 78 Slash F ine 29 76 ± 12
Total 72 104 ± 16
As with our previous study (1) ,the Oregon aerosol pro j ect
utilized radiocarbon (lla) for source discrimination. Two new
elements are added, however; a) not all of the Oregon sources
can be distinguished 14with C (vegetation contains modern carbon)
,
and b) selectivity was enhanced through the measurement of radio-
carbon in s ize - fractionated material Further discussion of
these matters will be found in References 3 and 6 ;and a visual
summary is given in figure 16, which shows that the radiocarbon
content of the fine particle fraction is a reliable indicator for
sources such as field, slash, and fireplaces.
A s econd cooperative study (with J. Swanson,Univ. Washington)
relates to the organic fraction in marine sediments,which is
derived primarily from planktonic matter. Of this fraction, the
69

(i/\idora
(lAidO)
a
(lAidO)
Run Number
Figure 16. Comparison of observed with expected vegetative impact(fine particles). Dashed line represents the ideal-ized situation for a pure source. The numbered box(|3|) indicates the median result; and the individualresult uncertainty (±la) is shown for sample r^4 only,for clarity. Abscissa locations (A,B,C,D) are derivedfrom the atmospheric radiocarbon input function andthe mean ages (t) of the material burned. A (fossil
14-
fuel, t>> C-tj^, B (slash, t at core v 200 yrs. ) ,
C (fireplace, t at core v 40 yrs.), D (field, t ^ 0)
.
7 0
S

lipid component constitutes 20 to 50 percent, and 5 to 20 percent
of this is in the form of fatty acids with the remainder being
hydrocarbons. Polycyclic aromatic hydrocarbons (PAH), known to
include carcinogens, have been extracted from the lipid fraction.
Since there is some question as to whether a natural marine
source for PAH exists, it was suggested (Swanson, personal com-
munication) that measurement of the radiocarbon content of the
aromatic and fatty acid fractions could help identify the source.
Presently there are contradictory opinions as to the major source
of PAH found in marine sediments. Blumer et al., (7), have
investigated the molecular weight distribution of the PAH in marine
sediments from Buzzards Bay, Massachusetts. They found the
unsubstituted hydrocarbons predominate and suggest that (natural)
forest fires form, and that air currents disperse, a complex PAH
assemblage that eventually accumulates in soils and recent
sediments
.
On the other hand, Hites et al. (8), found a correlation between
the time distribution of alkyl homologs of PAH in sediment, and
the timed distribution calculated for coal, wood, oil, hydro-
electric, and gas combustion-product PAH. The authors specifically
suggested that fossil fuel combustion is the primary source of
PAH in recent (1850-present) Buzzard Bay, Massachusetts marine
sediments. The objective of our cooperative project with Swanson
will therefore be to test the hypotheses that the PAH fraction is
primarily natural or anthropogenic in origin. Our (lie) system is
required because it is quite impractical to get more than 10-20
mg of aromatic hydrocarbons from large amounts of sediment.
A third environmental matter to which we are now giving major
attention is the question of the relative amounts of atmospheric
CH^,
CO, and light hydrocarbons that are generated by man compared
to that from natural sources. Previous investigations (9,10) of
the radiocarbon in atmospheric CH^ showed the average contemporary
carbon content as 80 percent, indicating that four-fifths of the
71

CH^ was of recent biological origin. Atmospheric carbon monoxide
was also investigated (11), and found to be 75 percent contemporary
carbon. These data are questionable, however, since the samples
were provided by air-liquefication plants situated in industrial14areas. Our current plans therefore call for remeasuring C in
these gases in contamination- free regions using portable sampling
apparatus
.
References
1. Currie, L. A,, Kunen, S. M.,Voorhees
,K. J., Murphy, R. B.,
and Koch, W. F., Conference in Carbonaceous Particles in
the Atmosphere (1978).
2. Currie, L. A,, "Environmental Radiocarbon Measurements,"
Proceedings of the First Conference on Radiocarbon Dating
with Accelerators,University of Rochester, 1978, p. 372.
3. Currie, L. A. and Klouda, G. A., Advances in the Discrimina -
tion of Natural from Anthropogenic Carbonaceous Pollutants
via Isotopes of Carbon,presented before the Division of
Environmental Chemistry, American Chemical Society, (April,
1979) .
4. Currie, L. A., "Sources of Error and the Approach to Accuracy
in Analytical Chemistry," Chap. 4 in Part I, Vol. I, Treatise
on Analytical Chemistry,
I. M. Kolthoff and P. Elving (Eds.),
John Wiley § Sons, Inc., New York (1978).
5. Ritter, G. L. and Currie, L. A., "Resolution of Spectral
Peaks: Use of Empirical Peak Shape," Proc. Conf. Computers
in Activation Analysis and Gamma-Ray Spectroscopy,Amer.
Nucl , Soc. (1979)
.
6. Cooper, J. A., Currie, L. A., and Klouda, G. A., "Impact of
Vegetative Burning on Urban Air Quality as Defined by
Carbon-14 Measurements," to be submitted to Environ. Sci .
Techn. (1979) .
/2
N
7 . Blumer, M. and Youngblood, W. W., "Polycyclic Aromatic
Hydrocarbons in Soils and Recent Sediments," Science 188 ,
pp. 53-55 (1975).
8. Hites, R. A., LaFlamme, R. E., and Farrington, J. W.
,
"Sedimentary Polycyclic Aromatic Hydrocarbons: The
Historical Record," Science 198, pp . 829 (1977)'.
9. Libby, W. F., Personal Communication (1978).
10. Bainbridge, A. E., Suess, H. E., and Friedman, Irving,
"Isotopic Composition of Atmospheric Hydrogen and Methane,"
Nature, pp. 648 (1961).
11. MacKay, C., Pandow, M.,and Wolfgang, R.
,"On the Chemistry
of Natural Radiocarbon," J. of Geophys. Res., 68,
pp. 3929 (1963).
12. Swanson, J., Personal Communication.
73

APPENDIX II
Resolution of Spectral Peaks: Use of Empirical Peak Shape*
G. L, Ritter and L. A. Currie
National Bureau of Standards, Washington, D. C.
ABSTRACT
A semiempirical method of gamma- spectrum peak resolution (PICO),
which uses experimentally determined singlet peak shapes, has
been devised to minimize sensitivity to systematic deviations
from assumed analytic shape functions. The resolving power and
accuracy of the method have been demonstrated through the use of
International Atomic Energy Agency test spectra having Poisson
measurement precision of about 0.5 percent and peak separations
ranging from approximately 0.3 to 1.3 full width at half maximum
* Proc. Conference of Computers in Neutron Activation Analysis and
Gamma-Ray Spectroscopy (American Nuclear Society, in press).

APPENDIX III
Not For PublicationPresented Before the Division of Environmental Chemistry
American Chemical SocietyHonolulu; April, 1979
ADVANCES IN THE DISCRIMINATION OF NATURAL FROM ANTHROPOGENICCARBONACEOUS POLLUTANTS VIA ISOTOPES OF CARBON
L, A. Currie and G. A. Klouda
National Bureau of Standards, Washington, D. C. 20234
Introduction
Alteration of the natural radiocarbon concentration inliving matter by the dilution of atmospheric carbon dioxide withfossil ("dead") carbon was first recognized by Suess (1) throughthe examination of the ^^C/^^C ratio in early twentieth centurytree rings. This dilution effect was subsequently employed byClayton et.al. (2) and Lodge et.al. (3) to estimate the anthropogenic(fossil carbon) contribution to carbonaceous atmospheric particu-lates in urban locales. Although the potential of this method fordetermining the impact of man's use of fossil fuels on the currentand historical burdens of carbonaceous pollutants was clear, itsapplication was severely limited by the large samoles required --
typically grams of carbon --- for measurement v;ith conventionalradiocarbon dating facilities. The possibility of overcoming theforegoing limitation through the use of miniature, high-purity,low-level counters was investigated two years ago (4); and thefirst measurements on milligram amounts of carbon from air particu-late samoles were reported earlier this year (5)
,
Measurement Techniques; Results
Two approaches currently exist for the assay of the radiocarboncontent of atmospheric carbonaceous gases and particles, usingsmall (~mg) carbon samples: mini-low level counting [lie ) andAccelerator Mass vSpectrometry (AMS ) . Both methods are appropriatefor the resolution of fossil from biogenic carbon in environmentalpollutants. The advantage of I to is that it is already developedfor routine use and it requires somewhat less expensive facilities;AMS has the potential for greater throughput and improved precision.A comparison of the Poisson precision of the two methods appliedto environmental samples is given in the proceedings of the firstConference on the new accelerator technique (6)
.
Recent develop-ments in our lla method, involving multiple counting channelsand improved detector design, give us the possibility of achievingadeauate pollutant source discrimination with a throughput of aboutone result every three hours (lOmg - C)
.
75

The llo approach is currently being applied to milligramsamples of atmospheric gases (CH 4 ,
CO), urban and rural particulatematerial, and natural and pollutant organic species in marine sedi-
ment (7) . Details of the sampling, preparation of high purity _C02counting gas, and special counting techniques have been given in
Ref 4 5. Requisite counting sensitivity was achieved through the
design of small volume (5-is mL) high purity quartz proportionalcounters ^«ith minimal dead volume , and through the combination of
^
pul^e
energy and pulse shape analysis to discriminate against radioactivecontaminants and electronic noise. These measures led originally to
a net signal from 10 mg of contemporary carbon which was comparable
to the backround rate, both being about 0.1 cpm. As a result, an
adequate level of (Poisson) precision could be achieved v;ith about a
one day count. Results of ZI 0 applied to urban and desert samples (5)
showed over 70 percent fossil carbon in the urban samples, but
little if any in the desert sample. The smallest sample size in the
set consisted of just 5.3 mg—G ; this sample, collected in Salt Lake
gity, yielded a result of 72 + 13 percent fossil carbon in 2.7 days of
counting time.
Future Directions: Chemical and Isotopic Selectivity
The dichotomous "dead or alive" hypothesis for distinguishinganthropogenic from natural carbonaceous pollutants is too simple.Though useful when the two source components are chemically stableand strictly correlated with fossil and biogenic (living) carbon, thehypothesis breaks down in certain cases involvina contaminable/un-stable sample species or when non-fossil carbon is released throughman's activities (or the converse). Fossil carbon, for example, canbe released through natural volcanic or geothemal activity; andbiogenic carbon can be released through man's burning of wood,fields, etc. Similarly, radiocarbon itself arises from bothnatural (cosmic ray interactions) and anthropogenic (nuclear tests,reactors, tracer experiments) sources.
In order to achieve reliable conclusions with such a multiplicityof sources, we can: (a) employ carefully-designed sampling plans,(b) augment the radiocarbon measurements through the selection ofcritical particle sizes and chemical species, and (c) add a seconddimension to our isotopic space through the measurement ofThe first two approaches have already been implemented (7)
,
and thethird is under investigation. Typical of the sample selection re-ferred to is the separation of size fractions for the removal oflarge biogenic particles (spores, etc.), and the measurement ofradiocarbon in individual chemical fractions such as "soot", andaliphatic and aromatic hydrocarbons.

Table 1
ISOTOPIC SOURCE INDICATORS
^“c (%) ^^C (%)
Concentration Variation Concentration Variation
artificial >> 100 .unpredict- PDB (COf) 0.
biosphere ^ 130 . injection^ CO 2 (atm) -0.7 sl, seasondispersion al, local
effects
cosmic rays 100 . solar. C 4 plants -to species
,
geomagnetic (grasses
)
to localfield -18 climate
decay T = 8270 yr. C 3 plants "2.2 species
,
(trees)
,
to localcoal
,
-12 climate
,
petroleum precursors
fossil fuel 0 .—
Natural gas -15 species
,
to precursors-AB
Dry ice -52
(a) Standard (100%) is 0.95 x NBS oxalic acid SRM. See references 8 and 10,for causes and magnitudes of variation.
(b) Standard (0%) is Peedee Belemnite. (Conventional units are %«. . ) Seereference 9 for information on standard and variations.
By complementing the radioisotope (^^C) measurements withinformation on the stable isotopic (13^) composition, we have thepossibility of increased source resolving power. As shown in Table 1,the ability to resolve fossil carbon from most living plants lieswith whereas provides the means to resolve certain classesof fossil fuels as well as certain classes of living matter (C 3 fromC 4 plants). Two important conclusions regarding the use of thecarbon isotopes are apparent from the table: (a) careful attentionmust be paid to the causes and ranges of intraclass variations, and(b) the concentration differences between (resolvable) sources implythe requisite measurement accuracy. That is, an uncertainty ofabout 10 % is adequate for but as little as 0 . 1 % is requiredfor measurements.
In conclusion, a brief survey will be given of some environmentalproblems which may be attacked with the new approaches. These include:the identification of fossil, natural and nuclear (power, testing)sources of atmospheric carbon; the assay of pathwavs and residencetimes for atmospheric carbonaceous species; and the investigation ofthe historical record of carbonaceous sources via analvsis ofmaterial from ice cores and sediment.

REFERENCES
^Suess, H. E., Science, 122 , 415 (1955).
2Clayton, G. D., Arnold, J. R. , and Patty, F. A., Science,
122 , 751 " (1955) .
3Lodge, J. P., Jr, Bien, G. S., and Suess, H. E., Inter-
national Journal of Air Pollution, 309 (1960)
.
4Currie, L. A., Noakes, J., and Breiter , D., "Measurementof Small Radiocarbon Samples: Pov/er of Alternative Methods forTracing Atmospheric Hydrocarbons", Ninth International RadiocarbonConference, University of California, Los Angeles and San Diego,1976.
5Currie, L. A., Kunen, S. M. , Voorhees, K. J. , Murphy, R. B.
,
and Koch, 7J. F., Paper #7 in Conference in Carbonaceous Particlesin the Atmosphere , March (1978) .
gCurrie, L. A., "Environmental Radiocarbon Measurements",Proceedings of the First Conference on Radiocarbon Dating v/ithAccelerators, University of Rochester, 1978, p. 372.
"^Radiocarbon measurements on small samples (mg-carbon) havebeen applied to assess urban carbonaceous pollution from fossilsources (Reference 5) and vegetative sources (J. A. Cooper, L. A.
Currie, and G. A. Klouda, to be published) ,and to define the
anthropogenic component in marine sediments (J. Sv/anson, A. Fairhall,and L. A. Currie, to be published).
gLopes, J. S., Pinto, R. E., Almendra, M. E., and Machado, J. A.,
Proceedings of the Conference on Low Radioactivity Measurements andApplications, High Tatras, Czechoslovakia (1975), p. 265.
9Craig, H. , Geochim. Cosmochim, Acta _3 (1953) 53; Troughton
,
J. H., Proceedings of the Eighth International Radiocarbon DatingConference, Lower Hutt, M. Z. (1972) ]^, 421.
^*^Damon, P. E., Lerman, J. C., and Long, A., "TemporalFluctuations of A.tmospheric C-14: Causal Factors and Implications,"Ann. Rev. Earth and Planet. Sci., 6 457 (1978).
s

80-BCMa-ENERGY RELATED POLLUTANTS AND EFFECTS MONITORING
AND ASSOCIATED METHODS AND TECHNIQUES DEVELOPMENT
1 Energy Related Water Pollutant Standard Reference Materials
1 . a Complete Certification of Ocean Sediment SRM
No activity in this project during the past six-month period.
l.b.i Estuarine Sediment, Proposed SRM 1646
The material for Proposed SRM 1646, Estuarine Sediment was
collected by personnel of the Virginia Institute of Marine
Sciences at coordinates 37 11.1 N, 76 17.1 W in the Chesapeake
Bay. The material was freeze-dried and irradiated at 2.5
megarads
.
At NBS,the material was sieved through an 18 mesh sieve to
remove coarse contaminants, and then ball-milled to pass a 100
mesh sieve. The sieved material was blended for 45 minutes.
As anticipated, the chemical composition of Proposed SRM 1646
is significantly different from SRM 1645, River Sediment. At
present. Proposed SRM 1646 is being analyzed by neutron activation
analysis to determine the inhomogeneity of the 150 kg of processed
material. (See Appendix IV for certification of SRM 1645j
.
l.b.ii Preconcentration and Separation of Sea Water Transition
Elements
A comprehensive report entitled, "The Quantitative Removal of the
Alkali and Alkaline Earth Elements from the Trace Transition
Elements in Sea Water Using Chelating Resin, and Its Application
to Analytical Instrumental Techniques," has been completed and
will be submitted to EPA for publication as an EPA Technical Report.
79
l.c Anions in Water SRM
No activity in this project during the past six-month period,
l.d Anion SRM
No activity in this project during the past six-month period,
l.e Anion and Trace Elements in Water SRM
SRM 1643, Trace elements in water, has been completely sold out.
The certification of a much larger trace element in water SRM
is now in progress.
1 . f The Role of Internal Standardization in Analysis of Aqueous
Samples Using the Inductively Coupled Plasma (TCP) Technique
As indicated in the previous report, the application of the ICP
technique to water analysis requires instrumental background
correction. This need arises because of background shifts between
samples and standards which introduce systematic error. Spectral
scanning was shown to be an effective approach to this measurement
problem. However, since the total analysis time is lengthened,
the possibility of instrumental drift is increased. Preliminary
data has indicated that when such drift does occur, it is due
to variability of nebulizer aspiration. Under these conditions
similar behavior has been noted for groups of detector channels
in the direct reading spectrometer. Ratios of appropriate
channel pairs should, therefore, exhibit significantly less drift,
indicating the feasibility of internal standardization.
An operational rather than theoretical approach was chosen which
would examine the statistical behavior of all possible channel-to-
channel ratios during a normal analysis time period (40 min.}.
Raw intensity data for three multi -element solutions were reduced
\
80
by the NBS central computer to evaluate all possible intensity
ratios. These ratios as well as the raw intensities were then
statistically analyzed for random and normally distributed
variability [1]. Intensity ratios which exhibited significant
improvement in relative standard deviation (RSD) were grouped
as possible internal standard elements. Seven elements were
then ratioed to the best internal standard for each, and the
degree of RSD improvement over the raw intensity data was examined
at various signal to background ratios. The results are plotted
in Figure 17. The plot indicates that \vith proper choice of an
internal standard, the variability of response can be improved
upon by at least a factor of two, if the s ignal - to -background
ratio for the analyte element is ten or greater. Under such
conditions it has also been found that long-term (6 hrs) drift
of intensity ratios is limited to less than one percent while the
raw intensity drift was five percent. Frequency of restandardiza-
tion can thus be reduced for routine analyses utilizing internal
standardization.
Future developments will involve the application of new spectrom-
eter and computer systems which will allow photographic as well
as electronic multi-channel detection of ICP emission. ^ In the
multi-channel mode complete flexibility as to line choice,
observation height and automatic scanning background correction
will be available. Furthermore, spectral resolution will be a
factor of ten better than the present direct reading spectrometer
allowing more complete separation of analyte emission lines from
those of the matrix.
Reference
[1] Filliben, '’Testing Basic Assumptions in the Measurement
Process”, in Validation of the Measurement Process,
James R. DeVoe, Editor, ACS Symposium Series 63,
Washington, D. C., p. 30 [1976).
81

EFFECT
OF
I.S.
ON
R.S.D.
o
X
X
- X
XX
o X
iy
<3
t
%
«£>
cn
O
^ 5 z ^ - =32 2 O M ^ Z Ogo X N
oo
aN
NN
ii_Ll_L
cn
CO
- CD
Km- LD
QC/1
p::
cn
aJ
T30
£ t/i
CO 4->
X C0 0
£CO 0+-i rHCO 0T3
C0
+J >•H 0(/) (/I
0 ^M OC 4-1
•Hin
:s OCO -H5-1 -M
cO
5-< 40> T3O G
2M OC 40 40£ 4S0 u> CO
O ^42. O£ -M•H •
r-i
Q CO
40 C<X. 40
•H4j '01
o(O
0 20 O4 'H40 40 CO
Q >
0f-t
a/(a-s)
\

2 SRMs for Organic Analysis
l.di/h Production of an Aqueous PAH SRM
Research on the feasibility of using PAH generator columns as
SRMs for PAH in water has been completed. We are now in the
procurement process for the production of this material. A copy
of the request for bid submitted to the Department of Commerce is
appended to this report (Appendix V)
.
Direct Injector for a Capillary Gas Chromatograph Used in Air and
Water Pollution Analysis
Normal injection techniques for capillary gas chromatography pre-
clude the introduction of more than 100 nL (10" ^L) onto the chro-
matographic column. It is necessary, however, for trace analysis
of environmental materials to place a considerably greater volume
of sample (1 to 5 yL) onto the column in order to be able to
detect some of the low level organic compounds contained in the
sample. A number of special splitless injection techniques (such
as that developed by Grob and Grob) have been developed in order
to allow large sample volumes to be placed on the chromatographic
column without undue loss of system resolution. These splitless
methods have been shown (Table 21) to yield systematic losses for
solutes with boiling points approximately 50 °C in excess of the
injector temperatures. Thus, since the maximum injector tempera-
ture is 350 °C, losses might be expected for any analytes with
boiling points greater than 400 °C. The boiling points of some
polynuclear aromatic hydrocarbons (PAHs) which can be success-
fully eluted without on column losses are listed in Table 22. If
the compounds containing four or more rings are to be accurately
determined by gas chromatographic means, a new method of sample
injection will have to be used.
83

TABLE 21
Comparison of Normal and Splitless Injector Techniques
Injector Temperature 350 °C
Peak Area Splitless'Compound Boiling Pt °C Peak Area Normal
5-methyl tetradecane 264 1.3
n-hexadecane 287 1.3
n-eicosane 343 1.5
n- tetracosane 341I—
1
squalane 350 OOo
n-hexacosane 414 OOo
n -octacos ane 440 0.5
^If both injector techniques are temperature independent, theratio should remain constant.
TABLE 22
Boilin g Points of Some Polynuclear
Aromatic Hydrocarbons
Compound Boiling PtN Limb e r
of Rings
nap thalene 210 °C 2
phenanthrene 340 °C 3
1 , 2 , benzanthracene 435 °C 4
chrysene 448 °C 4
benz (a) pyrene >450 °C 5
coronene 525 °C 7
\
84
A direct injector is being developed at NBS which places a liquid
sample, of between 1 and 10 pL, on the head of the capillary
column, completely bypassing the normal heated injection port.
This injector consists of a pressurized glass tube in which the
head of the capillary column is placed and immobilized and a
steel rod in which a sample cup has been inserted. This steel
rod slides through a pressure sealing 0-ring down the glass tube
until the head of the capillary column just touches the bottom of
the sample cup. The liquid sample, which had previously been
placed in the cup with a microliter syringe, is transferred to
the column by capillary action. This injector has been shown not
to adversely affect chromatographic resolution and preliminary
experiments indicate that the injector is boiling point independent.
2 . c Development of a Phenols - in-Water SRM
In some of our earlier reports we have presented preliminary
results of a study of the stability of some selected phenols
in distilled water. That study has now been completed and the
final results are given in Table 23. The data show that the
concentrations of phenol, o-cresol, and p-cresol remained con-
stant throughout the 27 month study. The concentrat ioits of
2-naphthol and 2 , 4 , 6-trimethylphenol decreased with time. The
concentration of each of these 'five compounds in a 10 percent
benzene/90 percent hexane solution was constant throughout the
27 month period.
We have previously stated that the two most probable causes of
these losses were adsorptive losses to the walls of the glass
ampoules and biodegradation. Of these two probable causes, the
former seems to be the most probable cause for the observed
phenomenon. The two compounds that were lost from solution were
the least water soluble and most likely ones to adsorb on and
cling to the walls of the ampoules. On the other hand there is
no reason to assume that both 2-naphthol and 2 , 4 ,6 - trimethylphenol
would be more susceptible to biodegradation than phenol or the
two cresols
.
85

Stability
of
Selected
Phenols
in
Distilled
Water
vO <r (JS• • • •
uO o m
03 O+1 +1 +1 +1 +1
a CO CO o r-i CO r—
1
o m GO cnCM m CO
CO uo Oc cn •
cn •
o o o o T—i 0) 03
a 0)
So CO +1 +1 +1 +1 +\ 3 rM03 O O 3a CO m CO LT\ vO 00 a O
« • * « • B ao CN CN CO 03 gCN un CO CO CO 3
<3* <D oo CO 4-4 4-J
« c • • «
o r—
)
o o o 4-1 44CJ o o?0 r-i +1 +) +1 +1 +13 a^ 3 3Q '3- o a m rH CO *H
• * « e • CO 3rH <T CO So SoCN m m a rH
3 3« 3 3So 3 3
m 00 a a a 3 3« • • « c 3 u 4-i
a o o o o CO 3 03 300 3 3
3 0-. +1 +) +1 +i +1 O •H HQ 1-H u r-4 rH
o m uH <r cn a a• • • « 6 g •H H
UO oo LPl o 3 3CvJ UO cn a cn 3 4-1 u
CJ s go O
T—
i
CN rH CO cn a 3 3•H 44 44
rH t—
1
rH o cn 3o cr 33 03
CM +1 +1 +1 +1 +1 •jH 3 33 0^ r3 3 3a CN CN a a cn •H •H
3 3CN o CO 3 U uCN tn cn cn d a a
3 o oB3 3 3O 00 00
CN nT 3 cn
• « • • • 3 3 3a o o o o o 3 3 3
So a > >+1 +1 -i-| +1 +1 3 3
a rd<3\ o^ m <T a 00 t3 3)
• • • • * •H 3 3OS m t—
1
CO n 3 3r-H m CO m •H
a a3 ^ a g g
o o a o o•H *H 33 3 35-1 -U OC 3•W ci3 2 3 3 33 3 w o CO CO <r cn 3 r-
S J-i • • • * « 3 4-J U•H c -a r—
f
<r <r rH 03 3>33 CN m m cn 3 4-i U3 3 T3 B 3 35-1 3 a 1 3 3a o <; rH 3 3 3a So 3 3 3
O 3 34-1 •H a a3 U 3 3
r-
1
g 3 3 3o •H 3
a r—
1
3 r-i 4-J o: 0]
3 o o u 3 Q HI Hi
3 03 3 1 3 3 r—
1
o o 3 3 p ^ a 3 3 3 3r> 3 3 3 r- 02 02
B 3 3 3 3 ot a O 3 3o 1 1 1 U aa a a. O CN CN 3 a 3
86
\

We also have concluded that radiation sterilization is not a
practical means of quenching any biological activity that might
occur in such solutions. The data given in Table 24 shows that
an irradiation dose of 1.5 megarads (suggested by D. Woodward,
Neutron Products Inc., Dickerson, Maryland) causes molecular
degradation within the solution.
Given this information, we have decided to initiate a similar
study using a coal by-product water, where we have added 1-100
ppm of the same five compounds plus several other hydroxylated
aromatics. The purpose of this study will be to determine whether
the highly water soluble compounds again show a high degree of
stability and if the increased organic content of this matrix
will enhance the stability of less soluble compounds such as
2-naphthol and 2 , 4 , 6-trimethylphenol and some hydroxylated PAHs
.
2 . d Development of SRMs for Organics in Sediment and Biota
More data on the Muscle Intercomparison Exercise are being
compiled, and the compilation should be available for the next
semi-annual report.
2 . e Spectroscopic Certification Technique for Analysis of Trace
Organics in Water SRM
No activity in this project during this six-month reporting
period.
87

oui
Q c5
"HU ^cO 5^
03 t3 OJ w03 CO i-4
o oi H-3
COLD r~- CJN CJN
<rCN
Wfq<H
1
*H •u
T3 3C CO 03
O U so •H uu •U U CO
CO 03 03 y-«S
OJ S-1 O i.1 <r CN CO
3 u H • • • • *
Q fi w GjO 00 m O CN CN03 3 B iH rH
03 O T3 O 'v—'
rH C S "H
o O 3 4-1
c CJ O cO
0) far*
M-4 03
o 4J
03 03
a s0 4-1
•H CO 14J
U 0) C •H 33 o T3 0)
H 'H cO go U fa 4.1
C/1 C cO 3o J-i O 03
03 4.1 U-l 00 rH CO t—
i
3 4-t fi H • • • • •
o 03 03 a O CN CO CO CO
0) •H a •T3 3 'w' CM CO CO
3 T3 fl C OCO o 3 •H
C oi o O 4-1
fa CO
M-l
O
O •
U03
T3
03
"O03
cd a o Wu •H *H cd
CO U 4J CO
0) 4-1 3 TS .•—V <D
03 !-i 3 fae 4-1 T3 o cn CO <r CO*H c T3 fa • • • * m> 03 <3 e fa MT rH CO •
CO CJ CM LO CO CO CN
Ca o *'
CJ O1
03
rH O?o Qr-
iJ 3OJ O
rH B •H
O •tH U'O fa rH fa 33 o O 4H 4J o *rH
3 fa 03 03 J3 1 3 00O O 03 0) Cu ^sO 3 3c. 3 U 03 fa ;-i
S CJ CJ 3 <r fao 1 1 1
Ma "fa cx, o CN CN 3
88

APPENDIX IVU.S. Department of Commerce
Juanita KrepsSecretary
Naiionai Surau of StandanisErnest Amoier. Director
Olerltftcals of
Standard Reference Material 1645
River Sediment
This Standard Reference Material is intended for use in the calibration of methods used in the analysis of river
sediment and materials with similar matrices. The material has been freeze dried and is now essentially free
from moisture. The certified values given below are based on measurements made on a dried sample of at least
100 mg for the trace elements and for a 1-g sample for iron and chromium.
The values are based on the results of 6 to 30 determinations by the analytical techniques indicated. The
estimated uncertainties include those due to sample variation, possible method differences, and errors of
measurement (see Preparation and Analysis).
Element Mg/g Element
Cadmium‘S 10.2 ± 1.5 Thorium*’ 1.62 ± 0.22
Copper*’ 109 ± 19^ o 1
Uranium*’ 1.11 ± .05
Lead*’^
714 ± 28 Vanadium* 23.5 ± 6.9
Manganese*’
'
785 ± 97ad
Zinc 1720 ± 169
Mercury^
'
1.1 ± 0.5Weight %
Nickel*’ 45.8 ± 2.9 Chromium*’ 2.96 ± 0.28
Thallium*’ 1.44 ± 0.07 Iron* 11.3 ± 1.2
^ Atomic Absorpuon Spectrometry
*’Isotope Dilution Mass Spectrometry
Neutron Activation Analysis
Polarography
The overall direction and coordination of the technical measurements leading to certification were pierfonmed
under the chairmanship of J. K.. Taylor.
The technical and support aspects involved in the preparation, certification, and issuance of this Standard
Reference Material were coordinated through the Office of Standard Reference Materials by W. P. Reed.
Washington, D.C. 20234
November 16, 1978
(over)
89
J. Paul Cali, Chief
Office of Standard Reference Materials

Instructions for Use
The material, as received, is essentially free from moisture. In case of exposure to moisture, it should be dried
without heat to a constant weight before using. Recommended procedures for drying are: (1) drying for 24
hours using a cold trap at or below —50 °C and a pressme not greater than 30 Pa (0.2 mm Hg); (2) drying in a
desiccator over P2O5 or Mg(C 104)2-, When not in use, the material should be kept in a tightly sealed bottle and
stored in a cool, dark place.
Material of this kind is intrinsically heterogeneous. Consequently, the analyst should endeavor to minimize any
segregation by thoroughly mixing the contents of the bottle by shaking>'and rolling before each use. In addition,
when taking a portion for analysis, the analyst should strive to remove as representative a sample as possible.
Preparation and Analysis
This SRM was prepared from material dredged from the bottom of the Indiana Harbor Canal near Gary,
Indiana, This material was screened to remove foreign objects, freeze dried, and sieved to pass a No. 80 ( ISO^ni)
screen. This material was thoroughly mixed in a V-blender, bottled, and sequentially numbered. The material
has been radiation-sterilized to minimize alteration from biological activity.
Randomly selected bottles were used for the analytical measurements. Each analyst examined at least 6 bottles,
some of them measuring replicate samples from each bottle. No correlation was found between measured values
and the bottling sequence. The results of measurements on samples from different bottles did not appear to
differ significantly from sub-samples within the bottles. Accordingly, it is believed that all bottles of this SRMhave substantially the same composition. The analytical methods employed were those in regular use at NBS for
certification of Standard Reference Materials, except as noted below. Measurements and calibrations were
made to reduce random and systematic errors to no more than one percent, relative. The uncertainties of the
certified values listed in the table include those associated with both measurement and material variability. Theyrepresent the 95 percent tolerance limits for an individual sub-sample, i.e., 95 percent ofthe sub-samples from a
unit of this SRM would be expected to have a composition within the indicated range of values 95 percent ofthe
time.
The following values have not been certified because either they are not based on results of a reference method,
or were not determined by two or more independent methods. They are included for information only.
All values are in units of ^g/g of sample, unless otherwise indicated.
Antimony (51) Potassium (1.2 wt. %)
Arsenic (66) Scandium (2)
Cobalt (8) ,
1
Sodium (0.55 wt %)
Lanthanum (9) 1
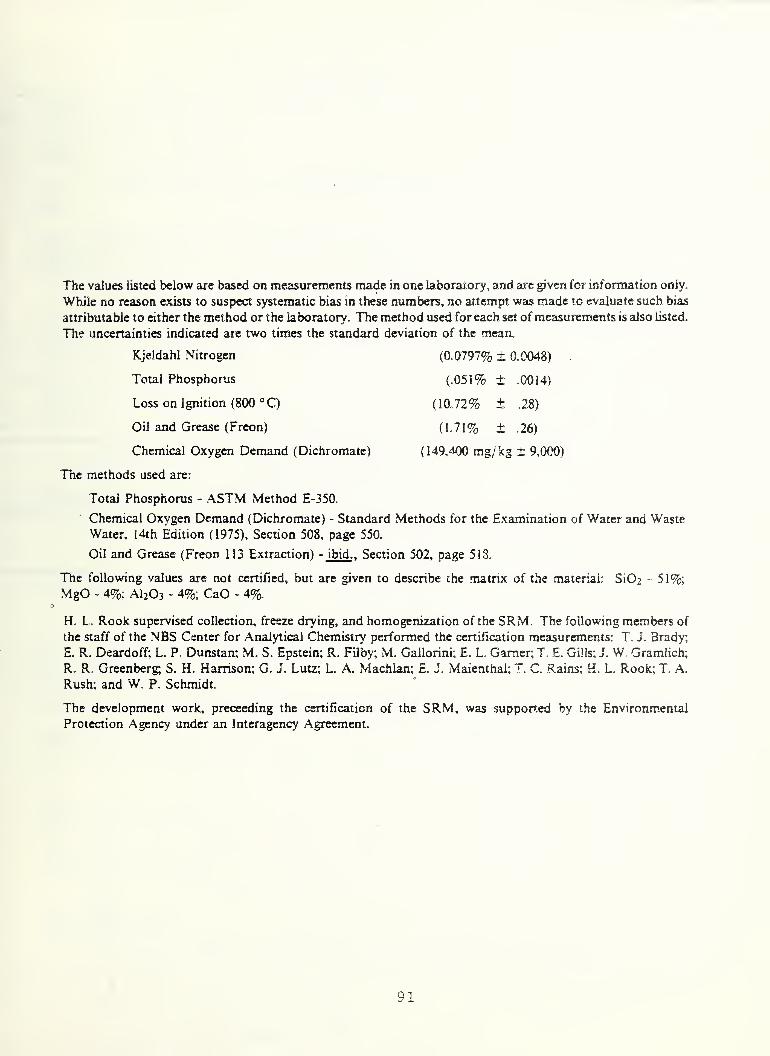
The values listed below are based on measurements made in one laboratory, and are given for information only.
While no reason exists to suspect systematic bias in these numbers, no attempt was made to evaluate such bias
attributable to either the method or the laboratory. The method used for each set of measurements is also listed.
The uncertainties indicated are two times the standard deviation of the mean.
Kjeldahl Nitrogen
Total Phosphorus
Loss on Ignition (800 °C)
Oil and Grease (Freon)
Chemical Oxygen Demand (Dichromate)
The methods used are:
(0.0797% ± 0.0048)
(.051% ± .0014)
(10.72% ± .28)
(1.71% ± .26)
(149,400 mg/ kg ± 9,000)
Total Phosphorus - ASTM Method E-350.
Chemical Oxygen Demand (Dichromate) - Standard Methods for the Examination of Water and Waste
Water, 14th Edition (1975), Section 508, page 550,
Oil and Grease (Freon 113 Extraction) - ibid. . Section 502, page 513.
The following values are not certified, but are given to describe the matrix of the material: SiOi - 51%;MgO . 4%; M 2O 3 - 4%; CaO - 4%.
H. L. Rook supervised collection, freeze drying, and homogenization of the SRM. The following members of
the staff of the NBS Center for Analytical Chemistry performed the certification measurements: T. J. Brady;
E. R. Deardoff; L. P. Dunstan; M. S. Epstein; R. Filby; M. Gallorini; E. L. Gamer; T. E. Gills; J. W. Gramlich;
R. R. Greenberg; S. H. Harrison; G. J. Lutz; L. A. Machlan; E. J. Maienthal; T. C. Rains; H. L. Rook; T. A.
Rush; and W. P. Schmidt.
The development work, preceeding the certification of the SRM, was supported by the Environmental
Protection Agency under an Interagency Agreement.
91
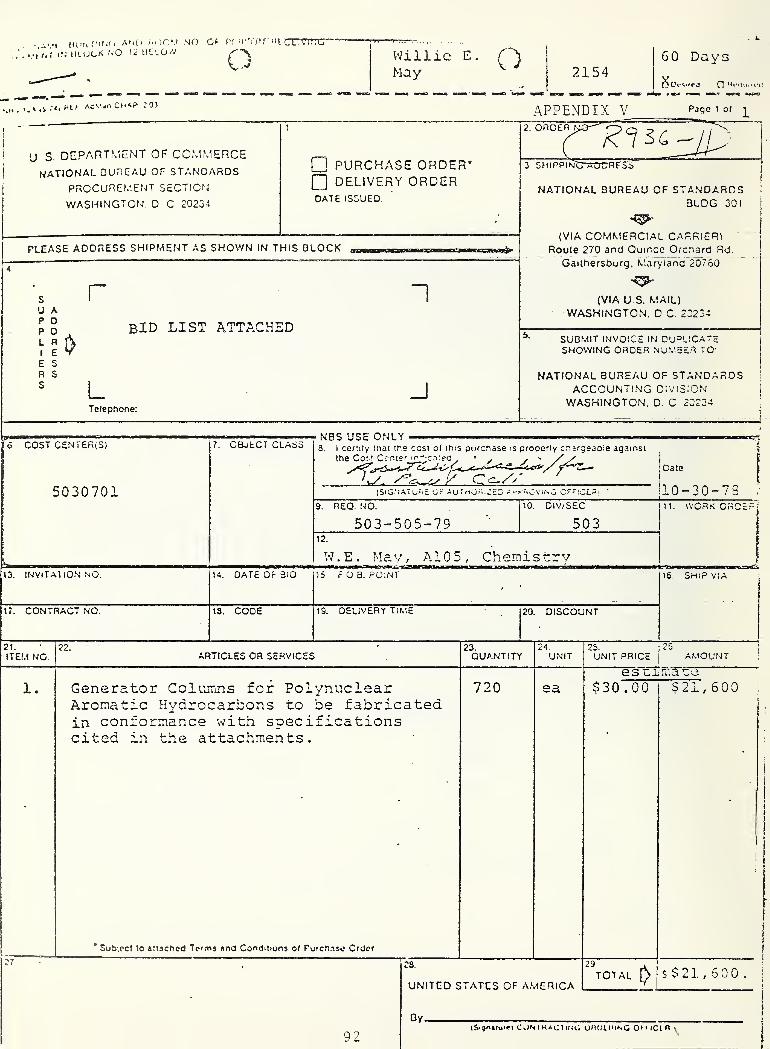
•I'locvt ^40 Mt cnvTTrn"
i-J uujcK f.o uao//
, ;4, HLt ‘03
- :.-k
Willie E. OMay ^ ^
2154
APPENDIX V
60 Days
Piqc 1 o( ^
'J s. DCPARTMcNT OF COMMEPCEnational DUnEAU OF STANDARDS
PROCUREMENT SECTION
WASHINGTON. D C 20234
PURCHASE ORDER’DELIVERY ORDER
DATE ISSUED
PLEASE ADDRESS SHIPMENT AS SHOWN IN THIS BLOCK
SU AP DP 0L
rbid list attached
E SR Ss L
Telephone;
J
2 ORDER
'r'STSc^jp~3 SHiPPiNG~ACrDnFSS~"
NATIONAL BUREAU OF STANDARDSBLDG 301
(VIA commercial CARRIGRlRoute 270 and Ouince Orenard Rd.
Gaithersburg. Ltaryiand 20760
(VIA U S. MAIL)
WASHINGTON. D C. 20234
SUBMIT INVOICE IN DU=LIC.ATE1
SHOWING ORDER NUMBER TO-
j
NATIONAL BUREAU OF STANDARDS !
ACCOUNTING DIVISIONj
WASHINGTON, D C 20234|
n6 COST CENTER(S)
5030701
7, OBotCT CLASSNBS USE ONLY ... — i , . ... rn, .
3 . I certily mat the cost ol this pufchase is properly cn.argeaOie against
(SlG‘iATu4'£ C.- AUTnOiMjE:
Date I
110-30-73 :
9 . REO. NO. 10 . DIV/SEC n. WORK CnCE
503-505-79 50312.
W.E. May, A105, Chemistry13 . INVlTAl ION NO. 14 , DATE OF BIO 15 FOB. POINT 16 . SHIP VIA
17 . contract NO. 18 . CODE 19 . DELIVERY TIME 20 . DISCOUNT
21.
ITEM NO.
1 .
27
22 .
ARTICLES OR SERVICES
Generator Columns for PolynuclearAromatic Hydrocarbons to be fabricatedin conformance with specificationscited in the attachments.
* Sub;cct to attached Tennj and Conditions o( Purch.ase Order
23.QUANTITY
720
92
24 ,
UNIT
ea
28.
UNITED STATES OF AMERICA
Dy
25.
UNIT PRICE :>MOUNT
es1:i.ma tir
$30.00
29
total
$21, 600
: f
'
f
s$21,600. I
(S'9''»iu>*'l Ci.)N I MAC I irJG UiitJt. King Ol ' iCl n

SPECIFICATIONS
r
Generator Columns for Polynuclear Aromatic Hydrocarbons
MATERIALS
Glass Beads 0.4OOO grams) ~ Glassport M, 60-80 mesh,#8501-6304 , Hev;lett Packard Corp., Avondale Division
# 316 Stainless Steel Tubing (400 meters) - 1/4 in (6.4—mm) OD . , 4 mjn ID . ,
Fittings for Columns (all fittings, nuts, and ferrules,should be Sv/agelok 316 SS)a. Porous Teflon Plugs (800) - approximately 4 mm dia-
meter, but should be cut to fit snuglv into 1/4 to1/16 inch reducing union.
b. 1/4 in. female nuts and ferrules (L600)c. 1/4 to 1/16 in. reducing union (800)d. 1/4 to 1/16 in. reducing union with 5 micrometer
(0.005mm) snubber (L600)e. 1/16 in. cap. (L600)
Chemicals (40 grams of each)Anthracene, 1, 2 ben zanchracene and 3,4 benzpyrene areto be used for coating three separate .batches of glassbeads. These compounds must be at least 98.5 mole %
pure. 5 mg of each compound should be sent to NBS fora purity check.
Reagents - 70 liters methylene chloride', 50 litersmethanol, 14 liters 1 % HF , 400 liters water. Allorganic solvents shall be reagent grade. The waterused shall be distilled over alkaline permanganate.
Sieve - No. 45 U.S. Standard Sieve or equivalent (0.0139in = 354 yra opening)
PREPARATION OF GENERATOR COLUMNS
Dfescriotion of Columnsstainless steel columns shall be made. Each column shall
be 50 cm in length and have an internal diameter of 4 mm.
Cleaning ColumnsThe interior of each column shall be cleaned initially withsoap and water and thoroughly rinsed- The columns shouldthen be purged with 30 mL of methanol, methylene chloride andhexane respectively. All column fittings shall be cleaned by5 minutes of ultrasonic agitation in methylene chloride.
Cleaning BeadsThe beads shall be cleaned by 5 minutes of ultrasonic agitationin 14 liters of each of the following in succession: methylene
93
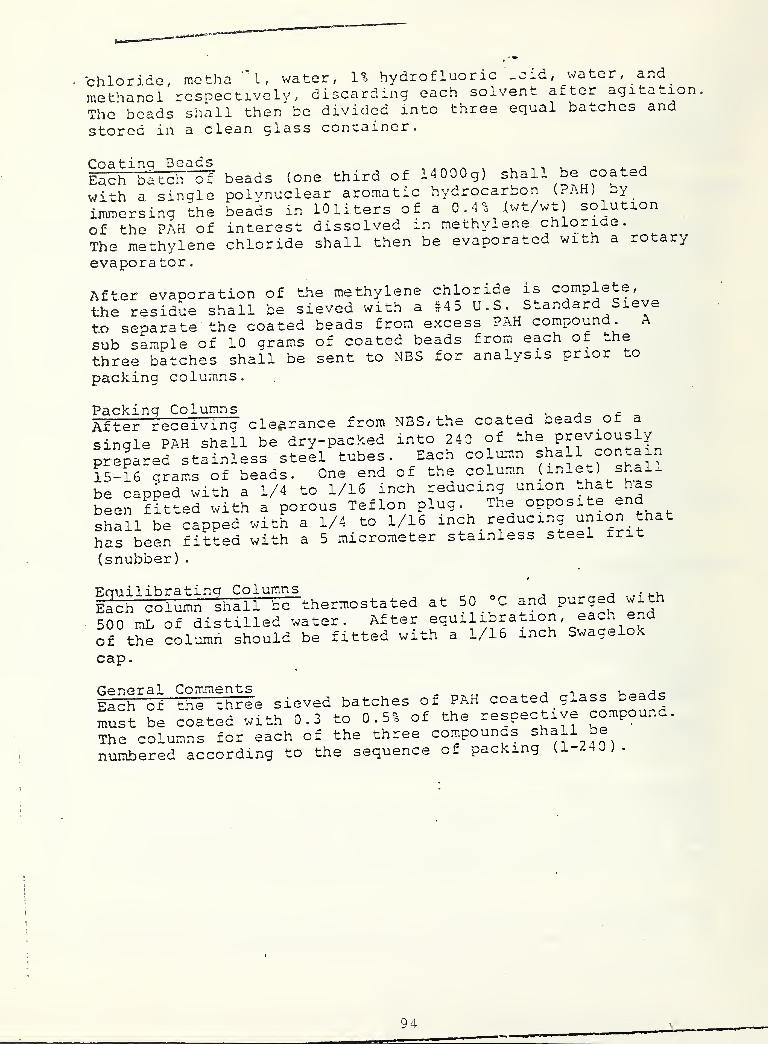
chloride, metha I ,water, 1% hydrofluoric „cid, water, and^
methanol respectively, discarding each solvent after agitation
The beads shall then be divided into three equal batches and
stored in a clean glass container.
Coating DeadsEach batch ofwith a singleimmersing theof the PAH ofThe methyleneevaporator
.
beads (one third of 14000g) shall be coated
polynuclear aromatic hydrocarbon (PAH) by
_
beads in lOliters of a 0.4% iwt/wt) solution
interest dissolved in methylene chloride,
chloride shall then be evaporated with a rotary
After evaooration of the methylene chloride is comple e,
the residue shall be sieved with a if 4 5 U.S. Standard Sieve
to separate the coated beads from excess PA.H compoun .
sub sample of 10 grams of coated beads from each of the
three batches shall be sent to NBS for analysis prior to
packing columns.
Packing Columns ^ . v ^ ,
After receiving clearance from NBS/ the coated beads of a
single PAH shall be dry-packed into 240 of the previous y
prepared stainless steel tubes. Each colu.tm shall contain
15-16 gramiS of beads. One end of the column (inle-)
be capped with a 1/4 to 1/16 inch reducing union that has
been fitted with a porous Teflon plug. The opposite en
shall be capped with a 1/4 to 1/16 inch reducing union tnat
has been fitted with a 5 micrometer stainless steel frit
(snubber)
.
F.nn il ibratina Columns , ^
Each column shall b~thermostated at 50 ®C and purged with
500 mL of distilled water. After equilibration, eaca end
of the column should be fitted with a 1/16 inch Swagelok
cap.
General CommentsEach of the three s
must be coated withThe columns for eac
numbered according
ieved batches of PAH coated glass beads
0.3 to 0.5% of the respective compound,
h of the three compounds shall be
to the sequence of packing (1-240).
94

Q ,.V
^^>ti o‘*'
UWITCD STATES DEPARTMETJT GF COtYlMERCEIMational Durpau of StandardsWashington. C. 20234
October 2 , 1978
MEMORANDUM FOR Procurement Section2Kt
From : W . E . May
Subject: Justification for Procurement ofGenerators for Polynuclear AromaticHydrocarbons (PAH)
Since many PAH are known to be carcinogenicor cocarcinogenic , there is justifible con-cern regarding the measurement of extremelylow concentrations of these compounds inwater. The PAH generator columns, preparedas specified will be issued by NBS ,as an SRM.It will enable investigators to generate known,accurate concentrations (in the 1-50 ppb range)of a three, four, and five-condensed ring PAHin water, and use these certified concentrationsfor calibrating instrumentation and validatingmethodology.
95
1

BID LIST
1 . Analabs80 Republic DriveNorth Haven, Conn. 06473(203) 283-8463Contact: Mr. William Cullen
2. Applied Science Lab.P .0 . Box 4 40State College, Pa.- 16001(814) 238-2406Contact: Sharon .McKinley
3 . Waters AssociatesMilford, Mass.(617)478-2000Contact: Ken Alden
)
)
I
\
96
80 -BCMb -ENERGY RELATED POLLUTANTS AND EFFECTS MONITORING AND
ASSOCIATED METHODS AND TECHNIQUES DEVELOPMENT
I Develop Organic Standard Reference Materials for the
Calibration of Energy-Related Water Pollutant Measurement
Methods
No activity under this task in the present semi-annual report.
97

80-BCN-RADIOLOGICAL POLLUTANT QUALITY ASSURANCE
1 Develop Calibrated Radioactive Materials for Radiological
Pollution Associated with Nuclear and Coal Energy Sources
and Production
The goal of the program is to provide measurement traceability,
through the U. S. Environmental Protection Agency at Las Vegas
(EPA-LV),for certain radionuclides not included in other programs.
These radionuclides were chosen because they are released into the
environment from nuclear power reactors (such as light-water
reactors), coal burning plants, or other, related, sources. The
program for FY 76-80 is summarized in Table 25.
1 . a Solution of Natural Isotopic Uranium, and Solution of
Plutonium- 241
The uranium oxide (UO^) has been pur
shipped to EPA. The isotopic compos
certified by mass spectrometry, and
'has been determined by isotope -dilut
of the Report of Calibration for thi
Appendix VI
.
ified, solutions prepared and
ition of the uranium has been
the total uranium concentration
ion mass spectrometry. A copy
s material is attached as
The EPA-LV has received the ampoules and Reports of Calibration
of the calibrated solution of plutonium- 241 . We are continuing
to measure the half life of p lutonium- 24 1 by means of measurements
of the gi’owtn of americium- 241
.
1 . b Fly Ash from Coal Combustion
Fly ash from the combustion of east
assayed for radium-226 and radium-2
radioactivity in SRM 1633, Trace El
ern United
28. Homog
ements in
States coa
eneity test
Coal Fly As
1 is being
s of the
h, have
\
98

TABLE 25
Radiological Pollutant Quality Assurance
Performing Agency: National Bureau of Standards
(E-AP ID No. 79 BCN)
[Revised Milestones as of June 1978]
A - due;
k - completed
Task 1. Radiological call- FY 76 FY 77 FY 78 FY 79 FY 80
brated radioactive materials $k 91 50 50 50 30
1.1 Establish lab k
facility
1.2 ^^*^Po solution k
1.3226„
Ra soil
,
k
Mixed gamma solution. k
239^Pu solution k
1.4 Mixed gamma soil k
1.5 Natural U solution. k
Pu solution k
1.6 Fly ash from coal^ A
1.7232
Th solution. A
Mixed radionuclide solution A
1.8 solution
,
A
solution. A
solution A
'Issuances of all Standards are subject to satisfactory performance as
defined by NBS Standard Reference Material criteria.
An additional $31k was allocated for (i) traceability testing, whichwill be a continuing program, and (ii) preparation of the fly ashstandard.
99

been performed by the Radioactivity Section and the material
found to be satisfactorily homogeneous for this program. Ge(Li)
gamma-ray measurements for the determination of radium-228 are
in progress. Radon gas counting of radiochemically processed
samples to determine the radium-226 concentration is nearing
completion
.
2 Measurement Traceability Studies with the Quality Assurance
. Branch of EPA-LV
The NBS conducts tests with the Quality Assurance Branch (QAB)
to ascertain whether radioactivity measurements made by the QAB
are traceable to NBS. These studies are on radioactive test
sources, with known but undisclosed values, that are sent to the
QAB by NBS, and on radioactivity standards prepared by QAB and
sent to NBS for confirmatory measurements. The criteria for
conducting the studies are given in an appendix to the NBS-EPA
interagency agreement.
The status of these studies for this six-month period is given
in Table 26. NBS has provided the QAB with six test sources of
undisclosed value, and one result has been reported to NBS. A copy
of the traceability statement for the completed test is attached as
Appendix VII.
100N
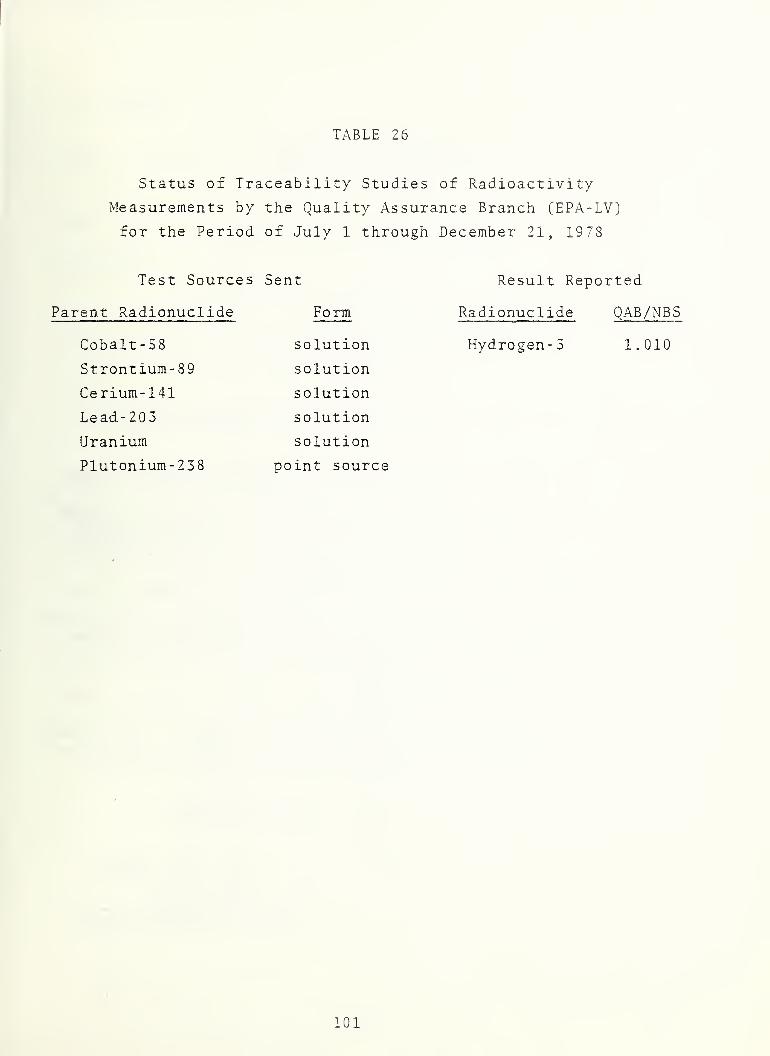
TABLE 26
Status of Traceability Studies of Radioactivity
Measurements by the Quality Assurance Branch (EPA-LV)
for the Period of July 1 through December 21, 1978
Test Sources Sent Result Reported
Parent Radionuclide Form Radionuclide QAB/NBS
Cobalt - 5 8 solution Hydrogen-3 1.010
Strontium- 89 solution
Cerium- 141 solution
Lead- 203 solution
Uranium solution
Plutonium-238 point source
101

FORM NB5->UI(RSV. 12-6B)
APPENDIX VI
U.S. DEPARTMENT OF COMMERCENATIONAL. BUREAU OF STANDARDS
WASHINGTON, D.C. 20234
REPORT OF CALIBRATION
Uranium Solution of Natural Isotopic Compositionprepared for the
Quality Assurance BranchU.S. Environmental Protection Agency
Las Vegas, Nevada
This solution consists of uranium of natural isotopic composition in approx-imately 4.9 g of 1 M HNO
3in a flame-sealed borosil icate-glass ampoule.
The solution was prepared in the following manner. Uranium tri oxide wasdissolved in 4 M HNO
3 , uranium was precipitated as hydrated oxides from thissolution with carbonate-f ree NH^OH, and the precipitate was then dissolvedin 4 M CH
3COOH. The uranium was purified in June 1978 by the method of Moore'
starting with a solution of 1 M CH3CCOH containing 15 mg uranium per gram of
acid. Uranium was next repreci pi tated from 0.5 M HNO3with NH^OH, and the
precipitate was dissolved with 2 M HNO3
. The final solution was prepared by
filtering this solution, diluting it with water to 1 M i n HNO3 , and then
adding 1 M HNO3
until the desired uranium concentration was reached.
Six of the 3LS ampoules containing ali quants of the final solution were assayedfor uranium isotopic composition and total uranium concentration by isotope-dilution mass spectrometry '
' in the Inorganic Analytical Research Division,National Bureau of Standards, in September 1978. Summaries of tne results of
these assays are given in Tables 1 and 2.
The radioactivity concentrations of ^^^U, and ^^^U were calculated using
the conversion factors and constants that are listed in Table 3. The calculatedvalues are given in Table 4. The radioactivity concentration of each isotope is
equal to its alpha-particle-emission rate per gram of solution, witnin the
stated uncertainty.
For the Director
w. B. Mann, ChiefRadioactivity SectionCenter for Radiation Research
November 1978
\
102

and the Atomic Mass.
. 2 -
TABLE 1. Summary of the Isotopic Composition^^’^^
234y 235y 238y
Atom percent 0.0052 i 0.0002 0.7204 t 0.0006 99.2743 i 0.0008
Calculated 0.0051 ~ 0.0002 0.7114 i 0.0006 99.2835 i 0.0008mass percent
Atomic mass of uranium = 238.0287 amu
^^The indicated uncertainties are composed of the linear sum of statisticalerror in the mass spectrometric measurements at the 95-percent confidencelevel and the sum of conceivable systematic errors.
^^Uranium-236 was not detected. An upper limit of 0.00005 atom percent was
estimated on the basis of the noi se-to-signal ratio.
TABLE 2. Uranium Concentration data (a)e
Milligrams of U pergram of solution
3.4776 t 0.0035
Milligrams of ^^^Uper gram of solution
0.02474 t 0.00003
Milligrams of ^^^Uper gram of solution
3.4525 i 0.0035
^^The indicated uncertainties are composed of the linear sum of statisticalerror in the mass spectrometric measurements at the 95-percent confidencelevel and the sum of conceivable systematic errors.
TABLE 3. Relevant Conversion Factors and Constants.
Half life of ^^^^U
Hal f 1 i fe of -^^U
Hal f 1 i fe of ^^^U
Atomic mass of ^^^U
Atomic mass of ^^^U
Avagadro constant
Length of tropical year
^^based on the ephemeris second.
(2.445 t 0.010) X 10^ y^^^
(7.038 i 0.005) X 10^ y^^^
(4.468 i 0.003) X 10^ y^^^
(235.043925247 - 0.000002552) amu^^^
(238.050735782 i 0.000002361) amu^^^
(6.0220978 i 0.0000010) x lO^^ (7)
3.155693 X 10^ s^^^
103

TABLE 4. Calculated Isotopic Uranium Radioactivity Concentrations, October 1978.
234u (s"^g“ ^^^U (s”^g“M ^^^U (s”^g“M
41.3 i 5.2% (a) 1.98 i 0.4% 42.9 i 0.3%
^Hhe indicated uncertainty is the linear sum of the uncertainty in the mass-percent value and three times the uncertainty in the half-life value.
*^^The indicated uncertainty is the linear sum of the uncertainty in the con-centration value and three times the uncertainty in the half-life value.
References
(1) F. L. Moore, "Liquid-Liquid Extraction of Uranium and Plutonium fromAcetate Solution with Tri iso-octyl ami ne". Anal. Chem. , 32(9), 1075
(I960).
(2) E. L. Garner, L. A. Machlan, and W. R. Shields, Uranium IsotopicStandard Reference Materials , MBS Special Publication 260-27,. NationalBureau of Standards, Washington (April 1971).
(3) Y. A. Ellis, "Nuclear Data Sheets for A=234", Nucl . Data Sheets , 21 ,
493 (1977).
(4) M. R. Schmorak, "Nuclear Data Sheets for A=231, 235, 239", Nucl
.
* Data Sheets , 21 , 91 (1977).
(5) Y. A. Ellis, "Nuclear Data Sheets for A=238" ,Nucl. Data Sheets , 21 ,
549 (1977).
(6) A. H. Wapstra and K. Bos, "The 1977 Atomic Mass Evaluation, Part I.
Atomic Mass Table", Atomic and Nucl. Data Tables, 19 , 177 (1977).
(7)
Recent, unpublished value. National Bureau of Standards.

FORM N^S-ISS APPENDIX VII
U.S. Department of CommerceNATIONAL. aURSAU OF STANDARDS
WASHINGTON, D.C. 20234
REPOST OP TEST
Hydrogen-3 Radioactivity Test Solution
prepared for the
Quality Assurance Branch, USEPA
Las Vegas, Nevada
This test solution consisted of approximately 5 grams of water containinghydrogen-3. The solution v/as contained in a flame-sealed borosi 1 icate-glass ampoule.
Material from another aliquot of this test solution was quantitatively dilutedwith triple-distilled water and the radioactivity concentration of hydrogen-3in the dilute solution was determined by liquid-scintillation counting. Ten
'
vials prepared from this material were intercompared with ten vials preparedfrom MBS Standard Reference Material 4926.
The radioactivity concentration of hydrogen-3 in this test solution, as of0700 EST April 19, 1978, was
*1 .748 X 10^ s-ig-i ± 2.8%*.
The total uncertainty in the radioactivity concentration value, 2.8 percent,is the linear sum of 0.2 percent, which is the limit to the random error of the
liquid-scintillation comparative measurements at the 99-percent confidence level
(2.6 Stn, where Sm is the standard error computed from 6 sets of 20 measurements),2.5 percent, which is the uncertainty associated with SRM 4926, and 0.1 percent,which is a contribution to the uncertainty due to source preparation.
A half life of 12.35 ± 0.01 years [ORNL/NUREG/TM-1 02 , 19, August, 1977] was used
for the decay correction. The estimated systematic error given above includes a
0.8-percent contribution due to the uncertainty in the half life and the 16.62-
year decay.
The Quality Assurance Branch of the U.S. Environmental Protection Agency (EPA)
measured the radioactivity concentration of this solution by means of comparative
liquid-scintillation measurements, and found it to be, as of 0700 EST April 19,
1978,
1.767 X 10^ s“ig"i ± 5.6%.
105

- 2
The uncertainty in the EPA value, 5.6 percent, is the linear sum of 0.3 percent,which is the limit to the random error of the liquid-scintillation measurementsat the 99-percent confidence level (3.250 S^, where Sm is the standard errorcomputed from 10 determinations), and 5.3 percent, which is the estimated upperlimit of conceivable systematic errors.
The ratio of the EPA to NBS values, 1.010, dem.onstrates traceability of the EPA
to NBS to within 1.0 percent as of April 1978, and lies within 5 percent of theNBS value as specified in the Appendix "Traceability Studies" of the NBS-EPAInteragency Agreement of April 20, 1976.
For the Director,
W. B. Mann, ChiefRadioactivity SectionCenter for Radiation Research
August 15, 1973
106