NBS SPECIAL PUBLICATION 260-54 - NIST
164
A11103 0653SQ NBS SPECIAL PUBLICATION 260-54
Transcript of NBS SPECIAL PUBLICATION 260-54 - NIST

A11103 0653SQ
NBS SPECIAL PUBLICATION 260-54

NBS TECHNICAL PUBLICATIONS
PERIODICALS
JOURNAL OF RESEARCH reports National Bureauof Standards research and development in physics,
mathematics, and chemistry. It is published in twosections, available separately:
• Physics and Chemistry (Section A) <^Papers of interest primarily to sciep 1 orking in
these fields. This section covers a br ^njf* .ige of physi-
cal and chemical research, wit> jt emphasis on
standards of physical measu v, fundamental con-
stants, and properties of m r^c** '..ssued six times a year.
Annual subscription: D-Ne S
0>>-. $17.00; Foreign, $21.25.
• Mathematical Sci' ^jc&vSection B)Studies and comr '
%* .is designed mainly for the math-ematician anH . 0<**<:tical physicist. Topics in mathemat-ical statist c«?"\ieory of experiment design, numericalanalyst ^retical physics and chemistry, logical de-
sign programming of computers and computer sys-
tr X^jnort numerical tables. Issued quarterly. Annuals\/ ocription: Domestic, $9.00; Foreign, $11.25.
DIMENSIONS/NBS (formerly Technical News Bulle-
tin)—This monthly magazine is published to informscientists, engineers, businessmen, industry, teachers,
students, and consumers of the latest advances in
science and technology, with primary emphasis on thework at NBS. The magazine highlights and reviewssuch issues as energy research, fire protection, building
technology, metric conversion, pollution abatement,health and safety, and consumer product performance.In addition, it reports the results of Bureau programsin measurement standards and techniques, properties of
matter and materials, engineering standards and serv-
ices, instrumentation, and automatic data processing.
Annual subscription: Domestic, $12.50; Foreign, $15.65.
N0NPERI0DICALS
Monographs—Major contributions to the technical liter-
ature on various subjects related to the Bureau's scien-
tific and technical activities.
Handbooks—Recommended codes of engineering andindustrial practice (including safety codes) developedin cooperation with interested industries, professional
organizations, and regulatory bodies.
Special Publications—Include proceedings of conferencessponsored by NBS, NBS annual reports, and otherspecial publicatipns appropriate to this grouping suchas wall charts, pocket cards, and bibliographies.
Applied Mathematics Series—Mathematical tables, man-uals, and studies of special interest to physicists, engi-neers, chemists, biologists, mathematicians, com-puter programmers, and others engaged in scientific
and technical work.
National Standard Reference Data Series—Providesquantitative data on the physical and chemical proper-ties of materials, compiled from the world's literature
and critically evaluated. Developed under a world-wideprogram coordinated by NBS. Program under authorityof National Standard Data Act (Public Law 90-396).
NOTE: At present the principal publication outlet for
these data is the Journal of Physical and ChemicalReference Data (JPCRD) published quarterly for NBSby the American Chemical Society (ACS) and the Amer-ican Institute of Physics (AIP). Subscriptions, reprints,
and supplements available from ACS, 1155 Sixteenth
St. N.W., Wash. D. C. 20056.
Building Science Series—Disseminates technical infor-
mation developed at the Bureau on building materials,
components, systems, and whole structures. The series
presents research results, test methods, and perform-ance criteria related to the structural and environmentalfunctions and the durability and safety characteristics
of building elements and systems.
Technical Notes—Studies or reports which are complete
in themselves but restrictive in their treatment of a
subject. Analogous to monographs but not so compre-
hensive in scope or definitive in treatment of the sub-
ject area. Often serve as a vehicle for final reports of
work performed at NBS under the sponsorship of othe
government agencies.
Voluntary Product Standards—Developed under proc
dures published by the Department of Commerce in Pa10, Title 15, of the Code of Federal Regulations. Tpurpose of the standards is to establish nationally re
ognized requirements for products, and to provide all
concerned interests with a basis for common under-
standing of the characteristics of the products. NBSadministers this program as a supplement to the activi-
ties of the private sector standardizing organizations.
Consumer Information Series—Practical information,
based on NBS research and experience, covering areas
of interest to the consumer. Easily understandable lang-
uage and illustrations provide useful background knowl-
edge for shopping in today's technological marketplace.
Order above NBS publications from: Superintendent
of Documents, Government Printing Office, Washington,D.C. 20402.
Order following NBS publications—NBSIR's and FIPSfrom the National Technical Information Services,
Springfield, Va. 22161.
Federal Information Processing Standards Publication!
(FIPS PUBS)—Publications in this series collectively
constitute the Federal Information Processing Stanards Register. Register serves as the official source
information in the Federal Government regarding stam
ards issued by NBS pursuant to the Federal Propert;
and Administrative Services Act of 1949 as amended,Public Law 89-306 (79 Stat. 1127), and as implementedby Executive Order 11717 (38 FR 12315, dated May 11,
1973) and Part 6 of Title 15 CFR (Code of Federal
Regulations).
NBS Interagency Reports (NBSIR)—A special series of
interim or final reports on work performed by NBS for
outside sponsors (both government and non-govern-
ment). In general, initial distribution is handled by the
sponsor; public distribution is by the National Techni-
cal Information Services (Springfield, Va. 22161) in
paper copy or microfiche form.
The following current-awareness and literature-survey
bibliographies are issued periodically by the Bureau:Cryogenic Data Center Current Awareness Service. A
literature survey issued biweekly. Annual subscrip-tion: Domestic, $25.00 ; Foreign, $30.00'.
Liquified Natural Gas. A literature survey issued quar-terly. Annual subscription: $20.00.
BIBLIOGRAPHIC SUBSCRIPTION SERVICESSuperconducting Devices and Materials. A literature
survey issued quarterly. Annual subscription: $30.00 . i
Send subscription orders and remittances for the pre-'
ceding bibliographic services to National Bureau of
Standards, Cryogenic Data Center (275.02) Boulder,
Colorado 80302.

NATIONAL BUREAUOF STANDARDS
LIBRARY
SEP 1 1977
Standard Reference Materials:
Certification and Use of Acidic Potassium Dichromate
Solutions as an Ultraviolet Absorbance Standard—SRM 935 loO
^opec^l PSkcdi*" Z^O-M >Vf7
R. W. Burke and R. Mavrodineanu
C ,
Analytical Chemistry Division
Institute for Materials Research
National Bureau of Standards
Washington, D.C. 20234
U.S. DEPARTMENT OF COMMERCE, Juanita M. Kreps, Secretary
Dr. Sidney Harman, Under Secretary
Jordan J. Baruch, Assistant Secretary for Science and Technology
i NATIONAL BUREAU OF STANDARDS, Ernest Ambler, Acting Director
Issued August 1977

Library of Congress Catalog Card Number: 77-600027
National Bureau of Standards Special Publication 260-54
Nat. Bur. Stand. (U.S.), Spec. Publ. 260-54,157 pages (Aug. 1977)
CODEN: XNBSAV
U.S. GOVERNMENT PRINTING OFFICEWASHINGTON. 1977
For sale by the Superintendent of Documents, U.S. Government Printing Office, Washington, D.C. 20402
Price $3—Stock No. 003-003-01828-7

PREFACE
Standard Reference Materials (SRM's) as defined by theNational Bureau of Standards are "wel 1 - character! zed mate-rials, produced in quantity, that calibrate a measurementsystem to assure compatibility of measurement in the nation."SRM's are widely used as primary standards in many diversefields in science, industry, and technology, both within theUnited States and throughout the world. In many industriestraceability of their quality control process to the nationalmeasurement system is carried out through the mechanism anduse of SRM's. For many of the nation's scientists and tech-nologists it is therefore of more than passing interest toknow the details of the measurements made at NBS in arrivingat the certified values of the SRM's produced. An NBS seriesof papers, of which this publication is a member, called theNBS Special Publication - 260 Series is reserved for thispurpose
.
Tnis 260 Series is dedicated to the dissemination ofinformation on all phases of the preparation, measurement,and certification of NBS-SRM's. In general, much more de-tail will be found in these papers than is generally allowed,or desirable, in scientific journal articles. This enablesthe user to assess the validity and accuracy of the measure-ment processes employed, to judge the statistical analysis,and to learn details of techniques and methods utilized forwork entailing the greatest care and accuracy. It is alsonoped that these papers will provide sufficient additionalinformation not found on the certificate so that new appli-cations in diverse fields not foreseen at the time the SRMwas originally issued will be sought and found.
Inquiries concerning the technical content of thispaper should be directed to the author(s). Other questionsconcerned with the availability, delivery, price, and soforth will receive prompt attention from:
Office of Standard Reference MaterialsNational Bureau of StandardsWashington, D.C. 20234
J. Paul Cali, ChiefOffice of Standard Reference Materials
iii

FOREWORD
Spectrophotometry is a technique widely used in analyticalchemistry. Due to its inherent characteristics of highsensitivity and good specificity it has been applied to theestablishment of fundamental parameters, as well as to thedetermination of the composition of inorganic or organiccompounds in solids, liquids, or gases in science and industry.For example, in one field of application, clinical analyticalchemistry, spectrophotometry is used in over 50 percent of theanalytical methods commonly employed. The number of spectro-photometry analyses performed in an active hospital laborator)!exceeds 1,000 measurements per day, with more than 1,000,000measurements performed in the clinical laboratories in theU.S. daily. A conservative projection for the future indicates;that a growth rate of 15 percent per year in spectrophotometrymeasurements in clinical analysis should be expected.
The widespread use of spectrophotometric techniques onsamples vital to the health, safety, and industry of the natioiji
makes it imperative that suitable means be available to establithe accuracy of these analyses. Because of the importance ofthese measurements, the Analytical Chemistry Division of theInstitute for Materials Research is conducting an extensiveprogram to study and develop means which can be used by theanalytical chemist to verify the proper functioning of spectro-;photometers, and to insure that the data produced are reliable.
A principal ingredient in the Analytical Chemistry Divisicjjprogram has been the design and construction of a high-accuracyspectrophotometer which represents the primary optical trans-mittance standard. This instrument was used to produce a numbeof transfer Standard Reference Materials in the form of neutral;!glass filters and liquid filters certified for transmittanceat various wavelengths and transmittance levels. Quartzcuvettes with certified paralellism and pathlength were alsoproduced at NBS.
This Special Publication describes another transmittance/absorbance transfer standard which has been developed withinthe program. This material, crystalline potassium dichromate,allows certification to be extended into the ultravioletspectral region and, additionally, provides a convenient meansto verify the linearity of the absorbance scale of conventionaspectrophotometers. This material is now available asStandard Reference Material 935. The details of the selectionpreparation, certification, and use of this SRM are describedin detail in this publication.

Improved methods and materials which can be used to verifythe proper functioning of conventional spectrophotometers arenow being actively investigated. Examples are evaporatedmetal -on-fused silica filters, which should extend the trans-mittance/absorbance calibration range from 200 nm to 3000 nm,and liquid materials, such as holmium perchlorate solutions,which can be used for verifying the accuracy of the wavelengthscale of spectrometers in transmittance and luminescencemeasurements
.
The availability of these Standard Reference Materials,and their use by the analyst, should contribute significantlyto accurate measurements in spectrophotometry and shouldprovide a solid base for future progress in this field.
P. D. LaFleur, ChiefAnalytical Chemistry Division
v

OTHER NBS PUBLICATIONS IN THIS SERIES
Catalog of NBS Standard Reference
Materials ( 1975-76 edition), R. W
.
Seward, ed., NBS Spec. Publ. 260 (June
1975). $1.50*
Michaelis, R. E., and Wyman, L. L.,
Standard Reference Materials: Pre-paration of White Cast Iron Spectro-chemical Standards, NBS Misc. Publ.260-1 (June 1964). COM74-1 1061**
Michaelis, R. E., Wyman, L. L., andFlitsch, R., Standard Reference Materials:
Preparation of NBS Copper-Base Spectro-
chemical Standards, NBS Misc. Publ. 260-2
(October 1964). COM 74-11063**
Michaelis, R. E., Yakowitz, H., and Moore, G. A.,
Standard Reference Materials: Metallographic
Characterization of an NBS Spectrometric
Low-Alloy Steel Standard, NBS Misc. Publ.
260-3 (October 1964). COM74-1 1060**
Hague, J. L., Mears, T. W., and Michaelis, R. E.,
Standard Reference Materials: Sources of
Information, NBS Misc. Publ. 260-4 (February
1965). COM74-11059Alvarez, R., and Flitsch, R., Standard Reference
Materials: Accuracy of Solution X-Ray Spectro-
metric Analysis of Copper-Base Alloys, NBSMisc. Publ. 260-5 (March 1965). PB168068**
Shultz, J. I., Standard Reference Materials:
Methods for the Chemical Analysis of White
Cast Iron Standards, NBS Misc. Publ. 260-6
(July 1975). COM74-11068**Bell, R. K., Standard Reference Mate-
rials: Methods for the Chemical Analysis of
NBS Copper-Base Spectrochemical Standards,
NBS Misc. Publ. 260-7 (October 1965).
COM74-11067**Richmond, M. S., Standard ReferenceMaterials: Analysis of Uranium Con-centrates at the National Bureau of
Standards, NBS Misc. Publ. 260-8 (December
1965). COM74-11066**Anspach, S. C, Cavallo, L. M., Garfinkel,
S. B., Hutchinson, J. M. R., and Smith,
C. N., Standard Reference Materials:Half Lives of Materials Used in thePreparation of Standard Reference Materials of
Nineteen Radioactive Nuclides Issued by the
National Bureau of Standards, NBS Misc.
Publ. 260-9 (November 1965). COM74-1 1065**
Yakowitz, H., Vieth, D. L., Heinrich, K. F.
J., and Michaelis, R. E., Standard
Reference Materials: Homogeneity Charac-
terization on NBS Spectrometric Standards II:
Cartridge Brass and Low-Alloy Steel, NBSMisc. Publ. 260-10 (December 1965).
COM74-11064**Napolitano, A., and Hawkins, E. G.,
Standard Reference Materials: Vis-
cosity of Standard Lead-Silica Glass,
NBS Misc. Publ. 260-1 1 (November1966). NBS Misc. Publ. 260-11**
Yakowitz, H., Vieth, D. L., and Michaelis,
R. E., Standard Reference Materials:Homogeneity Characterization of NBSSpectrometric Standards III: WhiteCast Iron and Stainless Steel PowderCompact, NBS Misc. Publ. 260-12(September
1966). NBS Misc. Publ. 260-12**
Spijkerman, J. I., Snediker, D. K., Ruegg,
F. C, and DeVoe, J. R , StandardReference Materials: Mossbauer Spectroscopy
Standard for the Chemical Shift of Iron Com-pounds, NBS Misc. Publ. 260-13 (July 1967).
NBS Misc. Publ. 260-13**
Menis, O., and Sterling, J. T., StandardReference Materials: Determination of Oxygenin Ferrous Materials - SRM 1090, 1091, and
1092, NBS Misc. Publ. 260-14 (September 1966).
NBS Misc. Publ. 260-14**
Passaglia, E., and Shouse, P. J., Standard
Reference Materials: Recommended Method of
Use of Standard Light-Sensitive Paper for Cali-
brating Carbon Arcs Used in Testing Textiles for
Colorfastness to Light, NBS Misc. Publ. 260-15
(June 1967). (Replaced by NBS Spec. Publ.
260-41.)
Yakowitz, H., Michaelis, R. E., and Vieth,
D. L., Standard Reference Materials:
Homogeneity Characterization of NBSSpectrometric Standards IV: Prepara-tion and Microprobe Characterizationof W-20% Mo Alloy Fabricated byPowder Metallurgical Methods, NBSSpec. Publ. 260-1 6 (January 1969).COM74-11062**
Catanzaro, E. J., Champion, C. E., Garner,
E. L., Marinenko, G., Sappenfield, K.
M., and Shields, W. R., Standard Reference
Materials: Boric Acid; Isotopic and Assay
Standard Reference Materials, NBS Spec. Publ.
260-17 (February 1970). 65 cents*
vi

Geller, S. B., Mantek, P. A., and Cleveland, N. G.,
Standard Reference Materials: Calibration of
NBS Secondary Standard Magnetic Tape (Com-
puter Amplitude Reference) Using the Reference
Tape Amplitude Measurement "Process A,"
NBS Spec. Publ. 260-18 (November 1969). (See
NBS Spec. Publ. 260-29.)
Paule, R. C, and Mandel, J., Standard Reference
Materials: Analysis of Interlaboratory Measure-
ments on the Vapor Pressure of Gold (Certifica-
tion of Standard Reference Material 745), NBSSpec. Publ. 260-19 (January 1970). PB190071**
Paule, R. C, and Mandel, J., Standard Reference
Materials: Analysis of Interlaboratory Measure-
ments on the Vapor Pressures of Cadmium and
Silver, NBS Spec. Publ. 260-21 (January 1971).
COM74-11359**Yakowitz, H., Fiori, C. E., and Michaelis, R. E.,
Standard Reference Materials: Homogeneity
Characterization of Fe-3 Si Alloy, NBS Spec.
Publ. 260-22 (February 1971). COM74-1 1357**
Napolitano, A., and Hawkins, E. G., Standard
Reference Materials: Viscosity of a Standard
Borosilicate Glass, NBS Spec. Publ. 260-23
(December 1970). 25 cents*
Sappenfield, K. M., Marineko, G., and Hague, J.
L., Standard Reference Materials: Comparison
of Redox Standards, NBS Spec. Publ. 260-24
(January 1972). $1.00*
Hicho, G. E., Yakowitz, H., Rasberry, S. D., and
Michaelis, R. E., Standard Reference Materials:
A Standard Reference Material Containing
Nominally Four Percent Austenite, NBS Spec.
Publ. 260-25 (February 1971). COM 74-1 1356**
Martin, J. F., Standard Reference Materials:
National Bureau of Standards-US Steel
Corporation Joint Program for Determining
Oxygen and Nitrogen in Steel, NBS Spec. Publ.
260-26 (February 1971). 50 cents*
Garner, E. L., Machlan, L. A., and Shields, W. R.,
Standard Reference Materials: UraniumIsotopic Standard Reference Materials, NBSSpec. Publ. 260-27 (April 1971). COM74-11358**
Heinrich, K. F. J., Myklebust, R. L., Rasberry, S.
D., and Michaelis, R. E., Standard Reference
Materials: Preparation and Evaluation of
SRM's 481 and 482 Gold-Silver and Gold-
Copper Alloys for Microanalysis, NBS Spec.
Publ. 260-28 (August 1971). COM7 1-50365**
Geller, S. B., Standard Reference Materials: Cali-
bration of NBS Secondary Standard Magnetic
Tape (Computer Amplitude Reference) Using
vi
the Reference Tape Amplitude Measurement
"Process A-Model 2," NBS Spec. Publ. 260-29
(June 1971). COM71-50282**
Gorozhanina, R. S., Freedman, A. Y., and
Shaievitch, A. B. (translated by M. C. Selby),
Standard Reference Materials: Standard
Samples Issued in the USSR (A Translation
from the Russian), NBS Spec. Publ. 260-30 (June
1971) . COM71-50283**
Hust, J. G., and Sparks, L. L., Standard Reference
Materials: Thermal Conductivity of Electrolytic
Iron SRM 734 from 4 to 300 K, NBS Spec. Publ.
260-31 (November 1971). COM7 1-50563**
Mavrodineanu, R., and Lazar, J. W., Standard
Reference Materials: Standard Quartz Cuvettes
for High Accuracy Spectrophotometry, NBSSpec. Publ. 260-32 (December 1973). 55 cents*
Wagner, H. L., Standard Reference Materials:
Comparison of Original and Supplemental SRM705, Narrow Molecular Weight Distribution
Polystyrene, NBS Spec. Publ. 260-33 (May
1972) . COM72-50526**
Sparks, L. L., and Hust, J. G., Standard Reference
Materials: Thermal Conductivity of Austenitic
Stainless Steel, SRM 735 from 5 to 280 K, NBSSpec. Publ. 260-35 (April 1972). 35 cents*
Cali, J. P., Mandel, J., Moore, L. J., and Young,
D. S., Standard Reference Materials: A Referee
Method for the Determination of Calcium in
Serum, NBS SRM 915, NBS Spec. Publ. 260-36
(May 1972). COM72-50527**Shultz, J. L, Bell, R. K., Rains, T. C, and Menis,
O., Standard Reference Materials: Methods of
Analysis of NBS Clay Standards, NBS Spec.
Publ. 260-37 (June 1972). COM72-50692**
Richmond, J. C, and Hsia, J. J., Standard Refer-
ence Materials: Preparation and Calibration of
Standards of Spectral Specular Reflectance,
NBS Spec. Publ. 260-38 (May 1972). 60 cents*
Clark, A. F., Denson, V. A., Hust, J. G., and
Powell, R. L., Standard Reference Materials:
The Eddy Current Decay Method for Resistivity
Characterization of High-Purity Metals, NBSSpec. Publ. 260-39 (May 1972). 55 cents*
McAdie, H. G., Garn, P. D., and Menis, O.,
Standard Reference Materials: Selection of
Thermal Analysis Temperature Standards
Through a Cooperative Study (SRM 758, 759,
760), NBS Spec. Publ. 260-40 (August 1972).
65 cents*
i

Wood, L. A., and Shouse, P. J., Standard Refer-
ence Materials: Use of Standard Light-Sensitive
Paper for Calibrating Carbon Arcs Used in
Testing Textiles for Colorfastness to Light, NBSSpec. Publ. 260-41 (August 1972). COM72-50775**
Wagner, H. L., and Verdier, P. H., eds., Standard
Reference Materials: The Characterization of
Linear Polyethylene, SRM 1475, NBS Spec.
Publ. 260-42 (September 1972). 45 cents*
Yakowitz, H., Ruff, A. W., and Michaelis, R. E.,
Standard Reference Materials: Preparation and
Homogeneity Characterization of an Austenitic
Iron-Chromium-Nickel Alloy, NBS Spec. Publ.
260-43 (November 1972). 45 cents*
Schooley, J. F., Soulen, R. J., Jr., and Evans, G. A.,
Jr., Standard Reference Materials: Preparation
and Use of Superconductive Fixed Point
Devices, SRM 767, NBS Spec. Publ. 260-44
(December 1972). COM73-50037**
Greifer, B., Maienthal, E. J., Rains, T. C, and
Rasberry, S. D., Standard Reference Materials:
Powdered Lead-Based Paint, SRM 1579, NBS„ Spec. Publ. 260-45 (March 1973). COM73-
50226**
Hust, J. G., and Giarratano, P. J., Standard Refer-
ence Materials: Thermal Conductivity and
Electrical Resistivity Standard Reference Mate-
rials: Austenitic Stainless Steel, SRM's 735 and
798, from 4 to 1200 K, NBS Spec. Publ. 260-46
(March 1975). $1.00*
Hust, J. G., Standard Reference Materials: Elec-
trical Resistivity of Electrolytic Iron, SRM 797,
and Austenitic Stainless Steel, SRM 798, from
5 to 280 K, NBS Spec. Publ. 260-47 (February
1974) . COM74-50176**Mangum, B. W., and Wise, J. A., Standard Refer-
ence Materials: Description and Use of Precision
Thermometers for the Clinical Laboratory,
SRM 933 and SRM 934, NBS Spec. Publ.
260-48 (May 1974). 60 cents*
Carpenter, B. S., and Reimer, G. M., Standard
Reference Materials: Calibrated Glass Stand-
ards for Fission Track Use, NBS Spec. Publ.
260-49 (November 1974). 75 cents*
Hust, J. G., and Giarratano, P. J., Standard
Reference Materials: Thermal Conductivity and
Electrical Resistivity Standard Reference Mate-
rials: Electrolytic Iron, SRM's 734 and 797
from 4 to 1000 K, NBS Spec. Publ. 260-50 (June
1975) . $1.00*
Mavrodineanu, R., and Baldwin, J. R., Standard
Reference Materials: Glass Filters As a Stand-
ard Reference Material for Spectrophotometry;
Selection; Preparation; Certification; Use -SRM930, NBS Spec. Publ. 260-51 (November 1975).
$1.90*
Hust, J. G., and Giarratano, P. J., Standard Refer-
ence Materials: Thermal Conductivity and
Electrical Resistivity Standard Reference
Materials 730 and 799, from 4 to 3000 K, NBSSpec. Publ. 260-52 (September 1975). $1.05*
Durst, R. A., Standard Reference Materials:
Standardization of pH Measurements, NBSSpec. Publ. 260-53 (December 1975, Revised)*.
Burke, R. W., and Mavrodineanu, R., Standard
Reference Materials: Certification and Use of
Acidic Potassium Dichromate Solutions as an
Ultraviolet Absorbance Standard, NBS Spec.
Publ. 260-54 (in press).
* Send order with remittance to: Superintendent
of Documents, US Government Printing
Office, Washington, DC 20402. Remittance
from foreign countries should include an
additional one-fourth of the purchase price for
postage.
** May be ordered from: National Technical
Information Services (NTIS), Springfield,
Virginia 22151.
viii

TABLE OF CONTENTS
PAGE
1. GENERAL 2
2. INTRODUCTION 3
3. SELECTION OF POTASSIUM DICHROMATE AS ANULTRAVIOLET ABSORBANCE STANDARD 5
4. IONIC COMPOSITION AND SPECTRAL PROPERTIES OFPOTASSIUM DICHROMATE SOLUTIONS 6
5. MEASUREMENT OF THE APPARENT SPECIFIC ABSORBANCESOF SRM 935 8
5.1 Source and Purity of the PotassiumDichromate SRM 8
5.2 Preparation of Solutions. 9
5.3 Instrumentation 105.4 Selection of Wavelengths 115.5 Details of the Transmittance/Absorbance
Measurements 125.6 Calculation of the Apparent Specific
Absorbances of SRM 935 Potassium Dichromatein 0.001N Perchloric Acid 18
5.7 Statistical Treatment of ExperimentalApparent Specific Absorbances 24
6. OTHER EXPERIMENTAL PARAMETERS AFFECTING THEAPPARENT SPECIFIC ABSORBANCES OF SRM 935 ... . 28
6.1 Wavelength Accuracy 286.2 Spectral Bandpass 306.3 Stray Radiation 326.4 Beam Geometry 336.5 Temperature 336.6 Acidity 356.7 Water Purity 35
7. INSTRUCTIONS FOR USING SRM 935 AS ANABSORBANCE STANDARD 37
8. USE OF SRM 935 TO VERIFY ABSORBANCE LINEARITY. . . 41
9. SUMMARIZING REMARKS 44
10. ACKNOWLEDGEMENTS . . . , 4 5
11. REFERENCES
.
46
12. APPENDICES 48ix

LIST OF TABLES
TABLE NO. PAGE
1. Calibration of the microbalance 10
2. Teletype printout of transmittance/absorbancedata for a set of acidic K 2 Cr 2 0 7 solutions. . . 16
3. Apparent specific absorbances, e , calculatedfrom transmittance/absorbance measurements onfive concentration levels of SRM 935 potassiumdichromate in 0.001N perchloric acid at wave-lengths corresponding to absorbance maxima orminima 20
4. Apparent specific absorbances, e , calculatedfrom transmittance/absorbance measurements onfive concentration levels of SRM 935 potassiumdichromate in 0.001N perchloric acid at wave-lengths near the two isosbestic points 22
5. Composition of chromium (VI) solutions in 0.001Nperchloric acid at 25 °C 25
6. Certified values of the apparent specificabsorbances, e , of SRM 935 potassiumdichromate in 0.001N perchloric acid atwavelengths 235 , 257 , 313 and 350 nm 26
7. Experimental conditions used in establishingthe apparent specific absorbances, e , ofSRM 935 ? 27
8. Recommended values of the apparent specificabsorbances, e , of SRM 935 potassiumdichromate in 0.001N perchloric acid at fourwavelengths approximating the two isosbesticpoints 27
9. Characteristic radiations emitted by a quartz,low pressure, mercury discharge tube 29
10. Variation of transmittance density with spectralbandpass of a 0.001N perchloric acid solutionof potassium dichromate at wavelengths corre-sponding to absorbance maxima and minima. ... 31
11. Densities of 0.001N perchloric acid solutions ofpotassium dichromate at 23.5 °C 41
x

LIST OF FIGURES
FIGURE NO. PAGE
1. Absorbance spectra of the HCrQit ion and itsdimerizat ion product, Cr 2 0 7 8
2. Absorbance spectrum of a 40 mg kg 1 solution ofK 2 Cr 2 0 7 in 0.001N perchloric acid 12
3. Apparent absorbances, A , of the blank solventmeasured against air m the five cuvettesused-Nos. 14, 16, 18, 25, and 26 14
4. Test of the distilled water for reducingimpurities 36
5. Correction curve for the absorbance scale of aprecision spectrometer 40
xi


CERTIFICATION AND USE OF ACIDIC POTASSIUM DICHROMATE
SOLUTIONS AS AN ULTRAVIOLET ABSORBANCE STANDARD
The apparent specific absorbances of 0.001N perchloric
acid solutions of a high purity potassium dichromate salt,
Standard Reference Material (SRM) 935, have been certified at
four wavelengths in the ultraviolet—235 , 257 , 313 and 350 nm.
This publication describes in detail the measurements leading
to the certification, and discusses the use of this SRM as
a transfer standard for verifying the accuracy of the absorb-
ance scale of narrow bandpass absorption spectrometers in
this important wavelength region. Apparent specific absorb-
ance data are also reported near two predicted isosbestic
wavelengths in the acidic HCrOi* /Cr 2 0 7 system. The apparent
specific. absorbances at 345 nm are sufficiently independent
of concentration that absorbance measurements at this wave-
length can be used for verifying absorbance linearity to
about one part in a thousand.
Key Words: Absorbance linearity; accuracy of transmittance
or absorbance scale; acidic potassium dichromate
solutions; calibration of ultraviolet
spectrometers; certification of apparent specific
absorbances; isosbestic wavelengths; liquid
filters; Standard Reference Material; transfer
standards
.
R. W. Burke and R. Mavrodineanu
Analytical ChemisInstitute for MaterNational Bureau o
Washington, D.
try Divisionials Researchf StandardsC. 20234
1
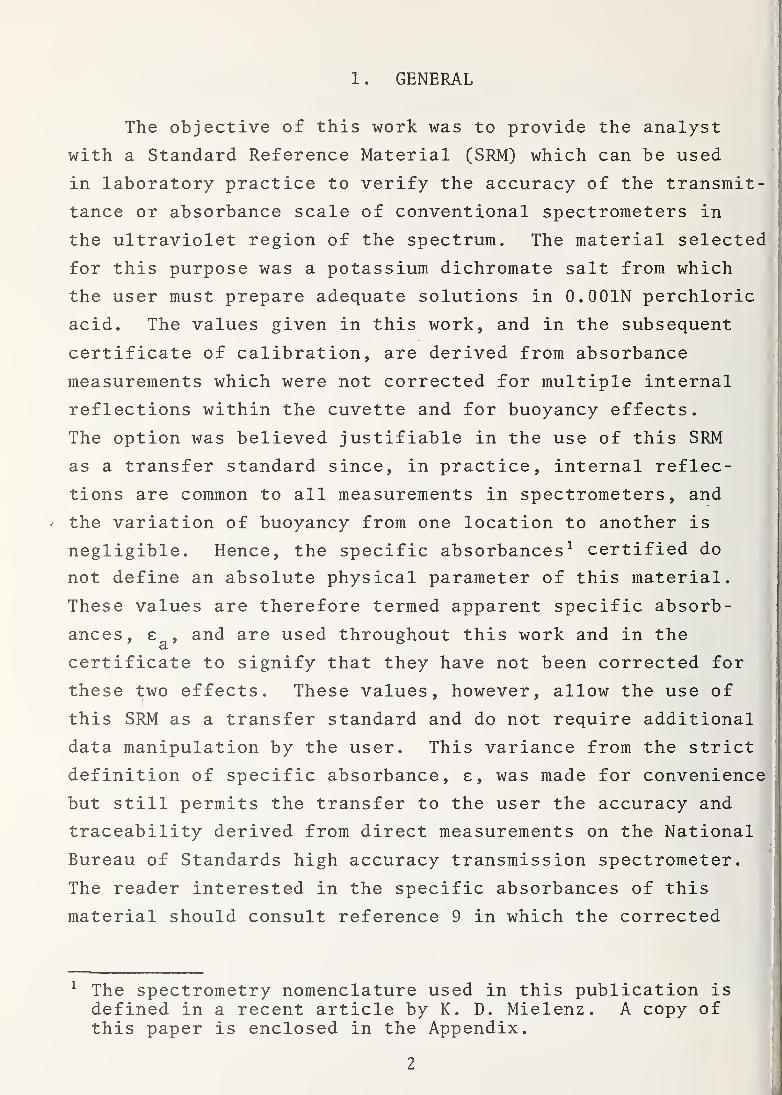
1 . GENERAL
The objective of this work was to provide the analyst
with a Standard Reference Material (SRM) which can be used
in laboratory practice to verify the accuracy of the transmit-
tance or absorbance scale of conventional spectrometers in
the ultraviolet region of the spectrum. The material selected
for this purpose was a potassium dichromate salt from which
the user must prepare adequate solutions in 0.001N perchloric
acid. The values given in this work, and in the subsequent
certificate of calibration, are derived from absorbance
measurements which were not corrected for multiple internal
reflections within the cuvette and for buoyancy effects.
The option was believed justifiable in the use of this SRM
as a transfer standard since, in practice, internal reflec-
tions are common to all measurements in spectrometers, and
the variation of buoyancy from one location to another is
negligible. Hence, the specific absorbances 1 certified do
not define an absolute physical parameter of this material.
These values are therefore termed apparent specific absorb-
ances, e , and are used throughout this work and in the
certificate to signify that they have not been corrected for
these two effects. These values, however, allow the use ofi
this SRM as a transfer standard and do not require additional
data manipulation by the user. This variance from the strict
definition of specific absorbance, e, was made for convenience
but still permits the transfer to the user the accuracy and
traceability derived from direct measurements on the National
Bureau of Standards high accuracy transmission spectrometer.
The reader interested in the specific absorbances of this
material should consult reference 9 in which the corrected
The spectrometry nomenclature used in this publication isdefined in a recent article by K. D. Mielenz. A copy ofthis paper is enclosed in the Appendix.
2

values are given. The difference between the corrected and
uncorrected values does not exceed 0.2 percent.
2. INTRODUCTION
During the past forty years molecular absorption spec-
trometry has been a much used analytical technique in all
areas of science and technology. Despite this widespread
use there has been, until recently, no suitable Standard
Reference Material available for verifying the accuracy of
the transmittance or absorbance scales of the spectrometers
on which the measurements were made. Yet, as early as the
late 1940 T s, the question of photometric accuracy was of
general concern. Soon thereafter the results of various
collaborative testings of absorption spectrometers began
appearing in the literature. Among the most notable of
these were the tests conducted by the British Photoelectric
Spectrometry Group [1,2], by a similar Dutch Group [3] and
by Vandenbelt [4,5] in the United States. All of these
tests showed significant differences between measurements
made on different instruments. However, since no certified
transmittance or absorbance standards were available to
assess accuracy, the only other alternative was to use
agreement with consensus results in order to intercompare
instruments
.
This situation remained essentially unchanged until 1969
when, largely from requests by the American Association of
Clinical Chemists and the College of American Pathologists,
a program was initiated at the National Bureau of Standards
(NBS) in the Analytical Chemistry Division of the Institute
for Materials Research. The express purpose of this program
was to develop and make available to the public Standard
Reference Materials which could be used to establish that an
absorption spectrometer was functioning properly and was
producing meaningful and reliable data. With partial funding
3

from the National Institute of General Medical Sciences,
this program led, in 1970, to the design and construction of
a high-accuracy transmission spectrometer [6,7]. This instru-
ment, in turn, was used to develop and certify two Standard
Reference Materials (SRM's) - SRM 930, Glass Filters for
Spectrophotometry, and SRM 931, Liquid Filters for Spectro-
photometry. These SRM's were issued in 1971. A third
Standard Reference Material, SRM 932, Quartz Cuvettes for
Spectrophotometry, was added in 1973 and was produced in
association with the Optical Physics Division of the Institute
for Basic Standards at NBS. SRM 932 was intended to be used
in association with SRM 931, and in general, in all measure-
ments requiring accuracy in determining the transmittance or
absorbance of liquids.
Since the issuance of these Standard Reference Materials,
research interest has focused on developing new SRM's which
can be used in the ultraviolet. The need for such standards' has been voiced again most strongly by the clinical chemists
and pathologists. They emphasize the importance of these
SRM's by pointing out, for example, that progress in all
areas of enzyme research and analysis is directly related to
the accuracy of absorbance measurements made in the wave-
length range from 260 to 350 nm. Neither of the two current
SRM's meet this need. The glass filters do not transmit
below about 350 nm and the liquid filters are certified at
only one wavelength in the ultraviolet, 302 nm.
Progress in this research effort was described in two
papers presented at the Workshop Seminar on Standardization
in Spectrophotometry and Luminescence Measurements held in
the NBS facilities at Gaithersburg,Maryland, on November 19- I
20, 1975. These papers have since been published in the NBS
Journal of Research [8,9]. The first paper described an
extensive evaluation of the solid metal -on-quartz type
filters while the second presented data which showed that
acidic potassium dichromate solutions were the most promising
4

liquid standards that we had studied thus far for use in the
ultraviolet
.
Following that meeting, the decision was made to
certify and issue a high purity potassium dichromate salt in
solid form (SRM 935) , to be used as an SRM for verifying the
accuracy of the absorbance scale of narrow bandpass spectrom-
eters over the range 235-350 nm. In as much as this SRM is
being issued as a solid, it is being certified for its
apparent specific absorbances which have been determined
under a set of selected and well-defined conditions. In
practice, the user will have to prepare solutions containing
known concentrations of the SRM and, using the Beer-Lambert
equation, convert the certified apparent specific absorbance
data into accurate absorbance or transmittance values
.
This publication describes in detail the operations
involved in the certification of SRM 935 and demonstrates,
with examples, its function as a transfer standard for
verifying the accuracy of the transmittance or absorbance
scales of narrow bandpass absorption spectrometers. Reprints
of papers pertinent to the subject matter discussed in this
report have been reproduced and included in the Appendix
Section for the convenience of the reader.
3. SELECTION OF POTASSIUM DICHROMATE AS AN ULTRAVIOLET
ABSORBANCE STANDARD
The decision to certify and recommend acidic potassium
dichromate solutions as transfer standards for verifying the
accuracy of the transmittance or absorbance scale of narrow
bandpass absorption spectrometers in the ultraviolet was
made after extensive studies had shown this system to be the
best of those liquid filters considered for this purpose.
Other systems considered potentially useful included potas-
sium nitrate, potassium acid phthalate, benzoic acid,
p-nitrophenol , alkaline potassium chromate, composite
5

solutions of metal ions, and various water-soluble organic
dyes. These studies have been described previously [10].
Since both the acidic and alkaline chromium systems were
clearly superior to the others in terms of the spectral
range covered, the final choice was reduced to choosing
between these two. Subsequently, the acidic system was
selected because of the following considerations: (a) more
useful distribution and relation of absorbance maxima and
minima, (b) more favorable weighing factor, (c) a smaller
temperature dependence, (d) less reaction with glassware,
and (e) greater ease of transferring and rinsing. These
advantages were considered to more than offset the one
disadvantage that can be cited for the acid potasssium
dichromate system, namely that the absorbance, as a function
of concentration, exhibits a stronger deviation from linearity
than most systems. As will be shown in subsequent sections
^ of this report, this deviation detracts little, if any, from
the practical use of this material as a transfer standard.
4. IONIC COMPOSITION AND SPECTRAL PROPERTIES OF POTASSIUM
DICHROMATE SOLUTIONS
The ionic composition of aqueous chromium (VI) solutions
is dependent on their acidity or alkalinity. Variation of
composition with pH was discussed in detail in a previous
paper [10] . A copy of this publication is included in the
Appendix. In alkaline solution chromium (VI) exists only in
the form of CrOit" ions. In weakly acidic media, the pre-
dominant chromium (VI) ion is HCrOi* . In addition, and
depending on the total concentration of chromium present,
there exist varying amounts of a second ion, Cr 2 0 7~. This
ion is formed by the dimerization of HCrOi* " . The equilibrium
expression for this dimerization may be written as follows:
6

-KD
ZHCrCU _1 Cr 2 0 7+H 2 0 (1)
where KD , the concentration dimerization constant, is given
by
[Cr 2 0 7 ]
K = — (2)U
[ECrO h ]
2
Using the value o£ KD
determined previously [10] , it can be
shown that, for the range of potassium dichromate solutions
used in this study, the percentage of the total chromium
(VI) present as the Cr 2 0 7~ dimer varies from about one to
four percent.
The variation in the ionic composition with concentra-
tion is the principal cause of the observed deviations of
the acid system from Beer's law. These deviations are
easily measured at those wavelengths where the specific
molar absorbances of the Cr 2 0 7~ and HCrO^ ions are different.
As shown in figure 1, at most wavelengths in the ultraviolet
the Cr 2 0 7~ ion is more strongly absorbing than the HCrOi*
form. Consequently, at these wavelengths, solutions would
be expected to exhibit increasingly positive deviations from
Beer's law with increasing chromium concentration. The
reverse behavior, but to a lesser degree, would be expected
for those wavelengths in the range of approximately 320-345 nm
since, in this region, the Cr 2 0 7 ion is the less strongly
absorbing form. At the two isosbestic points both ions have
the same specific molar absorbances and no deviations from
changes in ionic composition would be expected. The data
presented in the following section will demonstrate better
these various effects.
7

250 300 350 400
Wavelength, nm
Figure 1. Absorbance spectra of the HQrOtt ion and itsdimerization product, Cr 2 0 7 .
5. MEASUREMENT OF THE APPARENT SPECIFIC ABSORBANCES
OF SRM 935
5 . 1 Source and Purity of the Potassium Dichromate SRM
The potassium dichromate (KaCraOy) salt used for this
SRM was an analytical reagent grade material purchased as a
single lot from the J. T. Baker Chemical Company, 2 Phillips-
burg, New Jersey 08865. Drying studies performed at 105 °C
showed that the surface moisture of this material was less
than 0.01 percent. No attempts were made to determine pos-
sible occluded water. However, a recent paper [11] by
2 In order to describe materials and experimental proceduresadequately, it is occasionally necessary to identify thesources of commercial products by the manufacturer's name.In no instance does such identificaton imply endorsementby the National Bureau of Standards, nor does it implythat the particular product is necessarily the bestavailable for that purpose.
8

Yoshimori and Sakaguchi has shown that K 2 Cr 2 0 7 typically
contains 0.01 to 0.02 percent moisture which can be removed
only by crushing and drying at temperatures in excess of
350 °C. SRM 935 is intended to be used without further
drying. When not in use, it is recommended that it be capped
and stored in a dessicator over magnesium perchlorate to
avoid undue exposure to humidity.
A coulometric assay of the purity of the undried
material was performed in the Analytical Chemistry Division
by G. Marinenko. The purity of SRM 935, expressed as an
oxidant, was found to be 99.972 ± 0.005 percent where the
uncertainty figure represents the 95 percent confidence
interval for the mean based on 11 degrees of freedom. In
addition, this material was examined for trace elemental
impurities by J. A. Norris, also from the Analytical Chemistry
Division, using emission spectrometry. The only significant
impurities detected were sodium and rubidium. Their concen-
trations were estimated to be in the range 0.02 and 0.03
percent, respectively.
5 . 2 Preparation of Solutions
All concentrations of potassium dichromate solutions
used in this study were prepared, and are expressed, on a
weight basis. Each solution was prepared individually by
weighing milligram amounts of the K 2 Cr 2 0 7 SRM to the nearest
microgram on a sensitive microbalance . The weighed samples
were transferred quantitatively to 1-liter volumetric flasks
which had been pre-weighed to the nearest 0.01 g on a single-
pan, top-loading balance. The samples were dissolved in
400-500 ml of distilled water shown to be free of reducing
impurities (see Section 6.7 for recommended test) and 1 ml
of IN perchloric acid, prepared from reagent grade material,
was added to each to adjust acidity. After diluting approx-
imately to volume with distilled water, the flasks were
sealed with tightly- fitting , double-ribbed Teflon stoppers

to prevent evaporation and the solutions were mixed well.-
These stoppers are available from Kontes Glass Company,
Vineland, New Jersey 08360. The flasks and contents were
weighed again on the top-loading balance to the nearest
0.01 g and the net weights of the solutions determined by
difference. The concentrations of each solution were then
calculated and expressed as mg K 2 Cr 2 0 7 /kg of solution. A
solvent blank was prepared by diluting 1 ml of IN perchloric
acid to 1 liter with distilled water.
Prior to preparing the K2Cr2C>7 solutions, the accuracy
of the two balances was checked with weights calibrated in
the Mass Section of the NBS Institute for Basic Standards.
Table 1 shows the corrections that were applied to all
weighings made on the microbalance . No correction was found
necessary for weighings made on the top-loading balance.
Table 1. Calibration of the microbalance.
Nominal Wt
.
mgTrue Wt.
mgMeasured Wt
.
mgCorrection
mg
20 19.9993 20. 002 -0.003
40 39. 9932 39. 995 -0. 002
60 59.9941 60.001 -0. 007
80 79.9798 79.976 +0. 004
100 99.9924 99. 992 0. 000
5 . 3 Instrumentation
The Institute for Materials Research high accuracy
transmission spectrometer was used for performing all trans-
mittance measurements which, in turn, were converted to
absorbance by an appropriate computer program. The design
and construction of this instrument have been described in
detail by one of us (RM) in reference 7 and will not be
repeated here. Similarly, the quartz cuvettes used are also
of NBS design and construction and have been described10

previously [12] . These certified cuvettes are identified as
SRM 932 and are available through the NBS Office of Standard
Reference Materials. A copy of the paper describing the
construction and calibration of these cuvettes is included
in the Appendix.
5 . 4 Selection of Wavelengths
Four wavelengths - 235, 257, 313 and 350 nm - were
chosen for the certification of the apparent specific ab-
sorbances of acidic potassium dichromate. These wavelengths
are indicated in the absorbance spectrum shown in figure 2.
They were selected because they are least subject to small
inaccuracies that may be present in the wavelength scales of
the instruments for which this SRM is intended. Although
the spectral bandpass effect has been increased at these
wavelengths in comparison to measurements made along the
slopes of the spectrum, the restrictions are not severe.
The bandwidths of the 257 and 350 nm peaks are approximately
40 and 60 nm respectively and therefore an instrumental
spectral bandwidth of 2 nm or less is sufficent for obtaining
at least 0.999 of the maximum peak intensities (see also
pp. 30 to 32)
.
In addition to the four above-mentioned wavelengths
chosen for certification of apparent specific absorbances,
four additional wavelengths were selected in each of the
regions of the two isosbestic points shown in figure 1.
This approach was necessary because of the uncertainty in
the Cr 2 0 7 spectrum which is a calculated spectrum. The
details of its derivation have been described in reference
[10] . The four wavelengths chosen as the best estimates of
these isosbestic points were 322, 323, 345 and 346 nm.
11

1.0
0.8
0.6
0.4
0.2
-
I i I
\ 235
257
350
l
\ 313 /
ii
250 300
Wavelength, nm
350 400
Figure 2. Absorbance spectrum of a 40 mg«kg 1 solution ofK 2 Cr 2 0 7 in 0.001N perchloric acid.
5 . 5 Details of the Transmittance/Absorbance Measurements
All of the transmittance/absorbance measurements were
made relative to air in a temperature-controlled room at
23.5 ± 0.2 °C. Two sets of measurements were necessary
therefore in order to determine the absorbance required for
the calculation of an apparent specific absorbance. These
were: A measurement of the transmittance density,
D = -logioT, of the solvent blank (Dg) and a similar measure-
ment of the sample solution (Dg) . The apparent absorbance
(A ) due to the chromium (VI) ions was then computed from
the relation A = Dc, - D,,
.
a S BThe first transmittance/absorbance measurements performec
on the high-accuracy transmission spectrometer entailed
making a series of runs on a solvent blank. Five of the
certified cuvettes described in reference 12 (reproduced in
the Appendix) were selected for this experiment. This number
was chosen because, in subsequent experiments, five different
concentrations of potassium dichromate were to be measured.12

The cuvettes were cleaned by immersion in concentrated
(36N) sulfuric acid for several hours. They were then
transferred consecutively to 24, 12 and 6N solutions of
sulfuric acid in order to eliminate excessive generation of
heat upon rinsing directly with distilled water and thereby
avoid the possibility of deforming them. They were then
allowed to air-dry under an inverted Petri dish. Finally,
the windows of the cuvettes were wiped with a lint-free lens
tissue immediately before placing in the spectrometer. Once
placed into their respective holders, they were not removed
again until all the measurements necessary for the certifica-
tion of SRM 935 had been completed.
Transfer of solvent and sample solutions to and from
the cuvettes were made by means of 23-cm, borosilicate
,
Pasteur- type,disposable pipettes fitted with 2 ml rubber
bulbs. These pipettes and bulbs are readily available from
all major chemical supply houses. Similar pipettes made
from soft glass are also widely available. The soft glass
types are not recommended because, in general, their surfaces
are contaminated with ultraviolet absorbing contaminants and
they also have an alkaline surface which could be an addi-
tional source of error [13]. As a precautionary measure,
the borosilicate pipettes were always rinsed thoroughly with
distilled water and dried in an oven at 105 °C before using.
The pattern of results obtained for the five cuvettes
when they were filled with blank solvent and their apparent
absorbances measured relative to air is shown in figure 3.
These initial measurements were made at 235 nm because it
was the shortest wavelength of interest and any problems
associated with cuvette cleanliness or transfer of solution
were expected to be maximal at this wavelength. All of the
cuvettes exhibit the same qualitative absorbance behavior
upon sucessive fillings with solvent. The term "rinse" as
used in figure 3 and throughout the remainder of this report
refers to the exchange of one cuvette volume for a second
13

4.90 1
1 2 3 4 5 6 7
No. OF RINSES
Figure 3. Apparent absorbances, A , of the blank solventmeasured against air in the five cuvettes used—Nos. 14, 16, 18, 25, and 26; ref. [6].
volume. A minimum and constant absorbance reading was
obtained in each case after 5-6 rinses. Consequently six
rinses were used in the transfer of all blank and sample
solutions. Following these measurements the first set of
acidic potassium dichromate solutions were prepared. Com-
prising this set were six 0.001N perchloric solutions
having nominal concentrations of 0, 20 40, 60, 80 and 100 mg
K 2 Cr 2 0 7 /kg. The K 2 Cr 2 0 7 solutions were prepared accurately
by weight as described previously and immediately placed in
the controlled- temperature room housing the high-accuracy
transmission spectrometer and allowed to equilibrate. Gener-
ally, for convenience, the solutions were prepared one
afternoon and measurements were made the following day.
This series of measurements were begun by repeating the
absorbance measurements on the solvent blank at 235 nm.
14

Since these values were in agreement with those obtained
previously, similar blank measurements were then made at the
other seven wavelengths of interest. Thereupon, the solvent
was removed from the five cuvettes by means of the Pasteur-
type, disposable pipettes and immediately replaced with the
acidic potassium dichromate solutions. This operation was
performed in a sequential manner and, as a matter of conven-
tion, the lowest K 2 Cr 2 0 7 concentration was always placed in
the first cuvette and the highest concentration in the last.
Six rinses of each cuvette were made with the appropriate
sample solution in order to assure that the concentrations
of the solutions measured were identical to those sampled.
Two different pipettes were used alternately for the
filling and emptying operation associated with the transfer
of each solution. After the third rinse, the pipette used
originally for filling was made the emptying pipette and a
new pipette was taken for the filling step. Such an approach
appeared to be a good technique for avoiding concentration
errors and thereby having a truly representative sample in
the cuvette before the measurements were made. After the
sixth rinse the last transfer was made as quickly as possible
(approximately 10 s) and the cuvette was sealed with a Teflon
stopper. This sequence of operations was repeated for each
solution and cuvette combination until all five K 2'Cr 2 07
solutions were loaded into the high-accuracy spectrometer.
Three cycles of transmittance/absorbance measurements
were then made on each of the solutions at the eight wave-
lengths selected. Each cycle was separated in time by one
revolution of the rotating sample turn-table [7] . All
results were presented on a teletype printout in the form
illustrated in table 2. The measurements shown were made at
235 nm. A cuvette containing blank solvent was in position
2. The cuvettes containing the five acidic potassium dichro-
mate solutions and having nominal concentrations of 20, 40,
60, 80 and 100 mg K 2 Cr 2 0 7 /kg were in positions 4, 6, 8, 10
15

Table 2. Teletype printout of transmittance/absorbance datafor a set of acidic K.2 L.r £ O7 solutions; X
1 .2001 12E 0 1 . 4423E-032 . 1 77946E C 1 . 29 3 2 E- G 3
3 .2G0142E 0 1 . 3373E-03 33.9 16 33 .943 .0 509
4 . 10021 5E 0 1 . 7656E-035 .2001 73 E C 1 . 50 61 E- 0 3 50. 067 50. 063 . 3005
6 • 567963E 00 . 6426E-037 .200142E 0 1 . 4 7 63 E- 0 3 23 . 375 23 • 370 . 547 1
3 . 3 1 73.6 1 E 00 . 1 1 70E-029 .2001 53E 0 1 . 4663E-03 1 5.33 1 1 5.3 79 . 7992
10 . 1 73 730E 00 . 1 354E-021 1 .200145E 0 1 . 43 93 E- 0 3 3 .932 3.9 31 1 . 049 1
12 .992660E- 0 1 .2317E-0213 .200247E 0 1 . 50 60 E- 0 3 4.9 53 4.9 53 1 • 304714 . 55253 3E 00 . 109 3E-021 5 .200 13 5E 01 . 3479E-03 27. 599 27 • 59 4 . 5 59 2
1 .200142E 0 1 . 43C3E-032 . 177936E 0 1 . 40 63 E- 0 3
3 .2001 19E 0 1 . 49 57E-0 3 33.9 10 38 -9 36 . 05094 . 1001 63 E 0 1 . 63 41 E- 0 3
5 •200126E 0 1 . 5103E-03 50.053 50 . 0 43 • 300 6
6 . 563272E 00 . 59 7 3 E- 0 3
7 •200176E 01 • 49 1 7 E- 0 3 23 . 39 2 23 • 33 6 • 54693 . 31 7599E 00 . 1 235E-029 .2001 1 6E 01 . 3510 E- 0 3 1 5.363 15.366 • 79 9 5
10 . 1733 59E CO . 1 1 C2E-02! 1 . 200073E 0 1 . 323 5 E- 0 3 3 .9 39 3 .9 37 1 . 0 43 3
12 .992523 E- 01 . 1 39 0 E- 0 2
13 . 200 1 43E 01 . 373 3E-03 4.960 4.9 59 1.30 4614 . 5521 33 E 00 . 6704E-0315 .200071
E
0 1 . 3046E-03 27. 592 27 . 53 6 • 559 3
1 .200059 E 01 . 37 1 5E-032 . 1 77765E 01 . 43 63E-033 . 199997E 0 1 . 69 1 1 E- 0 3 33.370 33.397 • 05114 . 1001 56E 0 1 . 71 49E-0 3
5 .200041 E 01 . 424 1 E-03 50.073 5 0 . 0 63 . 30046 . 567657E 00 . 5464E-037 .200050E 01 . 4 1 3 1 E- 0 3 23 . 376 23 . 37 1 • 547 1
8 . 317523E 00 • 3951E-039 . 199993E 0 1 . 3614^-03 1 5.3 74 15.3 72 • 799 410 . 173623E CO . 1 333E-021 1 • 200C49E 0 1 . 43 9 3E-0 3 3.9 30 3 .9 29 1 .049212 .99 19 1 3E- 0 1 . 1 74 1 E-0213 •200025E 01 . 51C0E-03 4.9 59 4.9 53 1 . 304714 .552294E 00 . 1 1 26E-0215 . 200 1 1 5E 01 • 4190E-03 27. 605 27. 599 . 559 1
RUN NO. 170 NO. CYCLES 3 STARTPOS AVERAGE CORP.. T AVERAGE
2 38 .925 •05097
4 50. 060 . 30051
6 23. 375 . 54705
3 15.372 . 79936
10 8 .932 1 . 04903
12 4.9 53 1 .30463
14 27. 593 . 559 19
LOC. 1 END
ABS3MC
LOC 1 5 NO. PTS. 50
NOTE: The printout contains the data from three sets oftransmittance measurements made on seven samples (I) meas-
16

ured against air (I ) . The data from the first column iden-tify the positions at which the measurements are performed.The odd numbers represent the eight I measurements whichbracket the seven I measurements (even numbers) . The secondcolumn gives the average of the 50 individual measurement^of the photocurrent made in 2.5 s, and corresponding to I
and I. Column 3 contains the standard deviation of the 50individual measurements averaged in column 2. The non-corrected transmittance is given in column 4, which isdeduced from:
l2
1° + 1°= T
The corrected transmittance is given in column 5 and thecorresponding calculated transmittance density (-logi 0 T)is given in column 6. The corresponding averages from thetriplicate measurements are given at the bottom of theprintout. For further details consult reference 7.
and 12, respectively. A filter consisting of inconel-on-
quartz [8] was placed in position 14 for use as a reference.
In table 2, column 5 is the transmittance (T) relative
to air after correction for detector non-linearity; column 6
contains the corresponding corrected transmittance density
(D) calculated from the relation D = -logi 0 T. At the bottom
of table 2, the average values for corrected T and D are
tabulated for the three cycles of measurements. From the
data the apparent absorbance (A ) was calculated using the
relation A = D , -D, , n . Immediately upon completiona sample blank / r v
of the first series of measurements for all eight wave-
lengths, the cuvettes containing the five sample solutions
were rinsed twice with fresh solution, refilled and measured
again. Invariably, since no systematic differences were
observed between the sets of duplicate runs, the values were
simply averaged and used for the subsequent calculation of
apparent specific absorbances
.
For the certification of SRM 935, six samples of each
of the five concentrations of acidic potassium dichromate
17

solutions were prepared and measured according to the procedure
just described. All transmittance/absorbance measurements
were made on a given set of solutions on the same day.
Approximately three weeks were required to complete the
measurements on the six sets.
5 . 6 Calculation of the Apparent Specific Absorbances of
SRM 935 Potassium Dichromate in 0.001N Perchloric Acid
Specific absorbances were calculated at the eight wave-
lengths of interest for each of the 30 potassium dichromate
solutions measured using the relation
D c " D-d AS B _ a ^
a ~T5 • c~~ B • c ^ '
where
:
e = apparent specific absorbancea
Dg = transmittance density of sample solution
Dg = transmittance density of the solvent blank
b = internal light path of the cuvette in centimeters
c = weight concentration of potassium dichromate solu-
tion in g kg
Aa
= apparent absorbance.
Before calculation of e , the apparent absorbances, A,
(A = D - Dg) were corrected for a small systematic error
arising from the fact that the light beam in the IMR high-
accuracy spectrometer is not collimated but instead is
slightly convergent at the sample position. This correction
has been mentioned by Mielenz and Mavrodineanu [14] . The
error in absorbance, AA/A, for normal incidence at the
cuvette for this instrument was shown to be 6.3 x 10 h. All
values of A were subsequently corrected by multiplying by
the factor 0.99937.
The exact values used for the internal light paths of
the five sample cuvettes were the averages of the values
18

given for positions seven through ten in table 2 of reference
12, a copy of which is included in the Appendix. These
averages were the values used for b in Eq. (3).
As discussed previously, no corrections were made to
the measured transmittances or absorbances for internal
multiple reflections since this effect is present to the
same extent, within the uncertainty of the measurements, in
both the certification and the intended use of this SRM.
Internal multiple reflections are not instrument dependent
and therefore corrections for their effect are not necessary
in order to certify and use this SRM as a transfer standard.
On the other hand, if this material were being certified for
specific molar absorbance, appropriate corrections for
internal multiple reflections should be applied. Burnett
[15] has discussed recently the magnitude of the internal
multiple reflection correction as a function of wavelength
and absorbance level. The reader should refer to this paper
before attempting to make and report specific molar absorbance
data. Potential corrections for reflections from other
surfaces such as lenses and slit jaws [14] were disregarded
also because they were believed adequately eliminated by use
of the solvent blank.
Values of the apparent specific absorbances of SRM 935
potassium dichromate were calculated using Eq. (3) for the
eight wavelengths chosen and for the 30 K 2 Cr 2 07 solutions
measured. The only correction applied to the experimental
data was the one for convergent beam geometry. The apparent
specific absorbances calculated are summarized in Tables 3
and 4
.
19

Table 3. Apparent specific absorbances, e , calculated fromtransmittance/absorbance measurements on five con-centration levels of SRM 935 potassium dichromatein 0.001N perchloric acid at wavelengths correspond-ing to absorbance maxima or minima; T = 23.5 °C.
K 2 Cr 2 0 7
Cone. ,
mg kg 1
20. 346
20.112
20. 269
20. 112
20.136
20. 107
Av.
S.D.
20.180
------- ea ,
kg-g ^cm i ------ -
255(1. 2)anm 257(0. 8)nm 313(0. 8)nm 550(0 .8)nm
Min
.
12. 254
12. 244
12. 264
12 .279
12. 264
12. 275
12. 265
0.015
Max.
14.249
14. 252
14. 268
14. 278
14. 264
14. 267
14. 265
0.011
4
4
4
4
4
4
Min
.
801
796
80'2
811
806
805
4. 805
0.005
Max
.
10.668
10.667
10.676
10.681
10.674
10.676
10.674
0.005
Av.
S.D
40.612
40. 292
40. 500
40. 555
40. 288
40.554
40. 565
12. 295
12. 502
12. 505
12. 501
12. 504
12. 507
12.502
0.004
14. 514
14. 520
14.525
14.511
14. 520
14. 515
14.517
0. 005
4.807
4.816
4.815
4. 815
4. 815
4.814
4. 814
0.005
10.674
10.685
10.684
10.682
10.685
10.677
10.681
0.005
Av.
S.D.
60. 561
60.458
60.426
60. 554
60. 558
60. 585
60.417
12. 545
12. 542
12. 548
12. 545
12. 549
12.551
12. 546
0. 004
14. 568
14.570
14. 579
14.572
14.575
14.568
14 . 571
0.004
4.812
4.816
4.817
4.816
4.815
4.816
4.815
0.002
10.685
10.690
10.690
10.688
10.690
10.687
10.688
0.002
20

Table 3 continued.
K 2 Cr 2 0 7
Cone. ,
mg kg 1
80. 534
81.119
80. 528
80. 999
80.442
80.383
kg'g cm
80. 668
522(1. 2) nm 257(0. 8)nm 313(0. 8)nm 350(0. 8)nm
Min.
12. 390
12. 392
12.397
12.396
12.392
12. 594
12. 394
0.005
Max
.
14.459
14.450
14.450
14.459
14.448
14.442
14.448
0.007
Min.
4.820
4.824
4.823
4.824
4.821
4.821
4 .822
0. 002
Max
.
10.702
10.706
10.705
10. 708
10.704
10.701
10.704
0.003
100.722
100.845
100. 772
101.081
100.458
100.420
100. 715
12.450
12.454
12.458
12. 454
12.457
12.458
12.455
0. 005
14.482
14.488
14.491
14.481
14.486
14.477
14.484
0. 005
4.827
4.825
4. 828
4.826
4.827
4.8 22
4.826
0.002
10.714
10.714
10.711
10.710
10.711
10. 710
10.712
0 .002
Spectral bandpass.
Standard deviation of a single determination.
21

Table 4. Apparent specific absorbances, e , calculated fromtransmittance/absorbance measurements on five con-centration levels of SRM 935 potassium dichromatein 0.001N perchloric acid at wavelengths near thetwo isosbestic points; T = 23.5 °C.
K 2 Cr 2 0 7
Cone. , mg kg 1 322(0. 8) nm 3 2 3 ( 0 . 8 ) nm 345(0. 8)nm 346(0. 8)n
20. 346 5.855 6.070 10.606 10.621
20.112 5.849 6.068 10.598 10.623
20.269 5.860 6. 078 10.607 10.623
20.112 5 . 849 6.070 10.611 10 . 638
20.136 5.843 6 . 068 10.609 10.630
20.107 5.868 6. 091 10.616 10.629
Av . 20.180 5.854 6.074 10.608 10.627
S.D.b
0. 009 0. 009 0. 006 0. 006
40.612 5.845 6. 071 10. 597 10.621
40.292 5. 858 6.074 10. 602 10.631
40.300 5 .859 6.071 10.601 10.629
40 . 333 5.843 6 . 061 10 . 599 10 . 629!
40.288 5.841 6.064 10. 596 10.624
40.354 5.864 6. 081 10.604 10.627
Av. 40.363 5.852 6.070 10. 600 10.627
S.D. 0. 010 0.007 0.003 0.004
1
60. 561 5.844 6.067 10. 597 10.628
60.458 5.846 6.064 10. 597 10.630
60.426 5.851 6. 063 10. 597 10.631
60.334 5.836 6.057 10. 593 10.628
60.338 5.828 6.053 10. 594 10.630
60.385 5.854 6. 074 10. 597 10 . 628i
Av. 60.417 5. 843 6.063 10. 596 10. 629 1
S.D. 0. 010 0.007 0. 002 0. 001
Av
22

Table 4 continued.
------- ea ,
kg-g'^cm" 1 -------K 2 Cr 2 0 7
Cone., mg kg" 1
5 22(0. 8)anm 323(0. 8)nm 345(0. 8)nm 546(0. 8)nm
80.534 5 .
rt 7 n859 6
.
062 10
.
600 10.650
81.119 5. 845 6. 062 10. 602 10. 657
80.528 5. 845 6. 062 10. 602 10.655
80 . 999 5 . 833 6
.
055 10 . 602 10 . 656
80.442 5
.
824 6 . 050 10 . 601 10 . 651
80 . 385 5
.
850 6
.
071 10 . 606 10 . 654A - -Av
.
80 . 668 5 .
n 7 a839 6 . 060 10
.
602 10.654
S . D
.
0
.
009 0 . 007 0
.
002 0 . 005
100 .722 5 . 836 6
.
059 10
.
602 10.655
100.845 5. 855 6. 056 10. 605 10.658
100. 772 5. 858 6. 054 10. 605 10.656
101.081 5. 824 6. 046 10. 598 10.654
100.458 5. 818 6. 045 10. 602 10.655
100.420 5. 842 6. 065 10. 605 10.655
Av. 100. 713 5. 852 6. 054 10. 602 10. 656
S.D. 0. 009 0. 008 0. 002 0.001
aSpectral bandpass.
Standard deviation of a single determination.
25

5 . 7 Statistical Treatment of Experimental Apparent Specific
Absorbances
The increase in the apparent specific absorbances of
acidic potassium dichromate solutions with increasing con-
centration is clearly evident in the data shown in table 3.
As discussed previously, this effect is due primarily to the
concentration dependence of the HCrOi+ /Cr 2 07 equilibrium.
These data were subsequently analyzed and evaluated by
H. H. Ku of the NBS Statistical Engineering Section. The
average apparent specific absorbances obtained for the five
concentration levels were fitted for each of the four wave-
lengths as a quadratic function and as a linear function of
the average concentrations. The resulting residual standard
deviations showed that the data fitted a linear function
equally well as a quadratic function. While not expected,
subsequent calculation of HCr0 4 /Cr 2 0 7~ speciation using the
dimerization equilibrium expression = [Cr207 j/CHCrCK ]
2
explained the reason for this observation. The relative
amounts of HCrOi+ and Cr 2 0 7~ present for the 20-100 mg kg 1
range of K 2 Cr 2 07 concentrations employed are given in table 5
The value used for [32.9 (mol kg l
) *] in this calculation
was taken from an earlier publication [10] . -The speciation
data in table 5 clearly show that the percentage of chromium
present in the dimer form (Cr 2 07 ) is very nearly a linear
function of the K 2 Cr 2 07 concentration over the five-fold
concentration range used and hence explains the equal success
of the linear fit.
24

Table 5. Composition of chromium (VI) solutionsin 0.001N perchloric acid at 25 °C.
K 2 Cr 2 0 7 Percent Cr as Percent Cr as
Cone, mg kg" 1 HCrO*" Cr 2 0 7
=
20 99.10 0.90
40 98.22 1.78
60 97.38 2.62
80 96.56 3.44
100 95.77 4.23
•
The results obtained from a linear fit of the apparent
specific absorbances are shown in table 6. The uncertainties
given were derived from estimates of all known systematic
errors and the 95 percent confidence interval for the mean.
A summary of the experimental conditions used in establishing
the certified values of the apparent specific absorbances of
SRM 935 and their uncertainties is given in table 7.
A similar statistical treatment of the average apparent
specific absorbances obtained for the four wavelengths near
the two isosbestic points (table 4) yielded the values given
in table 8. These values are not certified because of their
stronger dependence on wavelength accuracy and temperature
control. They are given here to demonstrate that there are
two isosbestic wavelengths in the weakly acidic potassium
dichromate system which could be useful for verifying
absorbance linearity.
25

>N o•p
LCI/•HP CD CD CD CD
r
,
M rHPtO •H "St O O O O o oCXi CO to (Nl CNI CNI. CNI m •H
Hp o O o o o P T3 t/1
H rH CO P (U
to /i\QJ o o o o cd •H O pHJp
CO cni (JrHp
>rH
5h UCO CD
rHcdm CD J> (/)k
—
r>
O rP •PHP rH /1\rP <u
•» 00 •H \ rHP rPcdP O -P CD
CO cd CD o rPi—I
rHp O ,—' rHc P +->
•V CD 1 (NI CNI rH rH (/) -HCO oo O rH (D MH
0 cd ' vO >o vD [ CD CD ou |2 o •H rH frP Mp 1 C3 O CD MH P cd
f 1 1
Cd +-> o r—
1
I—
1
i—
1
rH rH i—
1
rO Cti LO o CD (0 cd
P to u > CD rP •
O *"G 1 • P -H I—
1
CD +-* o •
rO O 1 t/5 Pcd cd
1 PCD
U 5h ctJ. iT3 •
U O /—
\
H Ph -P CD OjO
•H «H 1 oo LO rH ^JO rH H CJ C4-1 P o rH rH CNI CNI Ph O CD P•H O i—
i
o oo 00 00 00 oo P U Tj OO i—
1
i *—
'
LO rHP CD O<D rP r—
>
to «=3" o CD 3 P rHP-i U u 1—
1
UV) p • to CD cd cd
•—
i
rH-C i rHrH rG l rH
4-> PhCJ i +-> Ph -P cd
P o >NCD 2 • E 1 <—
1
Hp OPi—1 LO DO rHp Cg DO P ooCCS o •
i jr-*H (Nl OO o vO CO E P •H
PhO tO oo vO rH to 00 (/) •H O cd •»
Ph • CM1
* CNI to to ^f CO- \ rHL) rP p o
nj o CO o rH CD -P P vOII Ci) '
'•St" o 1 1HJ rH CD
CD P 1—
1
1—
1
rH 1—
1
1—
1
—
i
c 5-H cd O •>
rC "H E—1 1 LO cd 5-HrH r^iP o
P CNI CD P •» i-H iPCD • - 1
. rH•H pI—
1
O rP O cd mO cd P 1 CO •H P *H rH ^
i-P OE rH P P HP
(/) o o 1 P 4-> CO CD CO
CD p CO n—
i
U rH f .rP H » rH" p1 ' s o o "St CD CD Hp HP
cjh. r^E OrH u CNI vD o to Ph P P r—H lP "H-J 1 1
Cd -H T3 1 • CNI to to to t/1 O CD HP
> ""d p rH >N,—4P •P U to Cd
CO 1v cni (Nl CNI (Nl CNI o rHP rH HLO r—
1
rH rH rH I—
1
•H P o tO HP(D 3 to 1 to TJ •P CD U rHP•H »H i—
1
cni CD cdi
—
> MH CD
<-H t/1 tO •P rH •H rP CD o o•H t/5 cd +-> OjO-P U pP Cd *> e P •h cd X op HP t*-- •H CD CD |5 rH HP OCD O LO i—
i
cd +-> O P Ph 001
00+-*
(/)
CD
POO
cd cd
•P rHt/J CO CO
rH »p t^
CD O1—1 CM
• OjO (/) p CD t3 E CD PO bo U Pi CD cd rH P -H<N E o O O o o CD T3 CD cd rH CD U cd cni
CD rH (NJ vO oo o rH e P Cd rP CD
r-l u - rH CD rH •H > -P T3rj->
s,r* o CD M M
CO « o cd o cd o oH p
oIS
cd
r-
1
Po H3i
Ph mCD
26

Table 7. Experimental conditions used in establishing theapparent specific absorbances, e , of SRM 935.
Sample and Instrumental Parameters
Weighing of K 2 Cr 2 0 7
Weighing of K2Cr 2 07 solutions
Temperature
Curvette pathlength
Wavelength accuracy
Spectral bandpass
Stray radiation
Beam geometry
Transmittance accuracy
Conditions
Nominal 20 to 100 mg,±0.004 mg
Nominal 1000 g, ±0.020 g
23.5 ± 0.2 °C
Nominal 10 mm, ±0.0005 mm
±0.05 nm
For X = 23 5 nm, 1.2 nm;for all other wavelengths,0.8 nm
Less than 5 in 10 5 at600 nm
Convergent, f:10, correctedto normal incidence
1 part in 10 4
Table 8. Recommended values of the apparent specificabsorbances, e , of SRM 935 potassium dichromate in0.001N perchloric acid at four wavelengths approxi-mating the two isosbestic points; T = 23.5 °C.
K 2 Cr 2 0 7
Cone. ,
mg kg 1
kg'g 1• cm 1
522 (0. 8) nm 323 (0. 8)nm 545(0. 8)nm 346(0. 8)nm
20u
5. 854 6 . 074 10.604 10.626
40 5 . 849 6 . 069 10.6 03 10.628
60 5. 844 6.064 10.602 10 .631
80 5 . 838 6. 059 10.601 10.633
100 5.833 6.054 10.600 10.636
kWavelength and, ( ) ,
spectral bandpassNominal concentration.
27

6. OTHER EXPERIMENTAL PARAMETERS AFFECTING THE APPARENT
SPECIFIC ABSORBANCES OF SRM 935
6 . 1 Wavelength Accuracy
Except near the maxima and minima, the absorbances of
acidic potassium dichromate solutions- are strongly dependent
on wavelength. Therefore, the accuracy of wavelength scale
must be established before SRM 935 can be used as a standard
to verify the accuracy of the absorbance scale.
In general, the wavelength accuracy of a spectrometer
can be verified by the use of (a) emission sources capable
of producing discrete radiations of suitable intensity and
adequately spaced throughout the spectral range of interest
and (b) solutions or glasses containing rare-earth elements.
Since SRM 935 is being certified for use in the ultraviolet,
the most useful and readily available source for checking
^ wavelength accuracy in this region is the quartz low pressure
mercury discharge tube. To calibrate the wavelength scale,
this tube should be placed immediately in front of the
entrance slit of the monochromator . Adequate eye protection
against ultraviolet radiation should be worn while this
discharge tube is being used.
A detailed description of the characteristic radiations
and the use of low pressure discharge tubes for wavelength
calibration is given in NBS Letter Circular LC-1017; "Stan-
dards for checking the Calibration of Spectrophotometers" by
K. S. Gibson, H. J. Keegan, and J. C. Schleter, re-issued in
January 1967. The data on the quartz low pressure mercury
discharge, which are reproduced in table 9, were taken from
this report.
28

Table 9. Characteristic radiations emitted by a quartz, lowpressure, mercury discharge tube.
Wave- Wave- Wave- Wave-length Note length Note length Note length Note
(nm) (nm) (nm) (nm)
205. 29222.47
230. 21232.32235. 25237.83239.94)239.973244.69246.41248 . 20)248. 27248.38)
253 . 481 X 296. 73 398 . 40
253. 653
302. 15257 . 63 302 . 35 404. 66260. 32 302. 56
r 6407. 78
265. 2 01
302 . 75 435. 83265 . 37 4 312. 57 491. 60265 .
51
J
312. 15 546. 07269. 95 313. 181
7576. 96
275 . 28 334. 1 5 J 579. 07275. 97 623 . 44280. 35]
5365. or 671. 64
280 .45i 365. 48
1
8'690. 75
284. 78 366. 29
1
1014. 0
289 . 36 366. 33; 1128 . 7
292. 54 390. 64
NOTES:
1. A value of 239.95 is recommended for the unresolved pair.2. A value of 248.3 is recommended when the three lines are
unresolved
.
3. The intensity of 253.48 is negligible compared to thatof 253.65. The latter value should be used when thelines are unresolved.
4. The 265.20 line is somewhat stronger than the others anda value of 265.3 is recommended when the three lines areunresolved
.
5. These two lines are of approximately the same intensityand a value of 280.40 is recommended for the unresolvedpair
.
6. The two shorter lines are considerably stronger than theother two. It is probable that a value of 302.25 shouldbe used for the unresolved lines.
7. A value of 313.16 is recommended for the unresolved pair8. With the arc used on the Beckman DU spectrophotometer
the ratio of intensities for 365.01 : 365.48 : 366.29is 100 : 48 : 36, approximately. The intensity of the366.29 line appears negligible relative to that of 366.33
9. These two lines are of approximately the same intensityand a value of 578.0 is recommended for the unresolvedpair
.
29

If additional information is needed, the user is referred
to the NBS Letter Circular LC-1017 mentioned above or to the
Manual on Recommended Practices in Spectrophotometry published
by the American Society for Testing Materials, 1916 Race
Street, Philadelphia, PA 19103. The wavelength scale
should be accurate to ±0.2 nm in order for the SRM to be
used properly.
The accuracy of the wavelength scale of the high-accuracy
spectrometer used in this work was verified with a low pres-
sure mercury discharge lamp using a slit of 0.1 mm which is
equivalent to an effective spectral bandpass of 0.08 nm. The
deviation of the wavelength scale from the true value in the
range from 230 nm to 400 nm was found to be +0.05 nm and
hence this value was applied to correct the scale.
6 . 2 Spectral Bandpass
Failure to select an appropriate spectral bandpass can
lead to inaccurate results when optically non-neutral mate-
rials are used as transmittance or absorbance standards. In
general, the degree of inaccuracy will depend on how sharp
the absorbance peaks are. The use of too large a spectral
bandpass will result in underestimating the absorbance at a
maximum and overestimating the absorbance at a minimum.
As pointed out in the introduction of this publication,
the use of acidic potassium dichromate as an absorbance
standard is restricted to the verification of the transmit-
tance/absorbance scale of spectrometers capable of providing
spectral bandpasses of the magnitude indicated in table 10.
In a previous publication [10] a somewhat simplified
mathematical treatment was presented on the effect of spectral
bandpass on the measurement of absorbance at the wavelength
maximum of a Gaussian peak. This study showed that the
ratio of the spectral bandpass of the spectrometer to the
natural bandwidth of the sample at half intensity of the
fully resolved peak should not exceed 0.05 in order that the
30

ooo
to
p4-1 00O P
CD
C/l i—
I
(/> CD
OS >Ph o3
-a £po3 +J
rO 03
i—l CD
03 PP 03
p eu oCD pPnrPt/> o
•HX -d
ccj
6HP•H
T3
03
•H
•H
P w 6•H 03 •H
C O 03
0) ft£4h 0)
CD OUpo3
Up
P 03
O ^•H p
p p o
10 O 03
P V)
03 OP T3 PP -H
U 00m 03 pO "H
Upo P•H Op I—l
oPhIf)
03 ,P CD
•H UP P03 0)
Po
Ph u
i—l
x>03
H
>sP•HV)
P<d
oCD
Up03
p+->
•HS
P03
PH
ep
Xo 03LO StO
6P
to
to
pX03
LOCM
6P
PiLO •HtoCM
pid•H
P•Hi—l
CO
vO to CnI—
1
I—l CM CM to O • • •
O to LO1—1 CM to LO OO i—l 1—1 1—1
cn cn OO to CM OO 00 vOvo vO vO vO LO to I—l cn
•st- toCM CM CM CM CM CM CM CM CM
o LOt-- i—
t
OO LO to o 00o
o i—
1
CM CM to LO r-» 00 iH
to LO vO to ^t- r-. toCn cn CT> cn o 1—1 CMCM CM CM CM CM to to to toi—
1
i—
1
T-H i-H i—l I—l I—l I—l 1—1
00to vO o vO to i-H
o o 1—1 i—l i—
1
CM to LO
OO OO OO OO [>- LO CM cn [>-
vo vO vO vO vO vO o LO LOCM CM CM CM CM CM CM (M CMto to to to to to to to to
o
03/—
\
00 CM vOCM cn CM 00 O vO
O o o o i-H i—l CM to to
to to to to I>~ e'- ocn cn cn cn cn CTi en o
CO 00 00 00 00 OO 00 00 cnCM CM CM CM CM CM CM CM CM
CM^vOOOOLOOLOOOOOOi—I i—ICMCMtO
03
uoPi
Ph•HuCD
P
p03
4->
n3•H
+->
•Hi—l
to
•
o /—
\
P Pm CD
PCD
CD e+-> o03 pi-H p3 ou CD
i-H Ph03 C/)
OCD
rPto PPCD ,PP PCD •HeoP03 CD
P •H
Pi—
1
Ph•H Ph
Pin
(/)
t/>
o3 o3
Ph Po3
P03
rO PO
1—
1
•H03 C/l
P PP CD
a PhCD mPh-hCO T3
03
31

measured absorbance be at least 0.999 of the true absorbance.j
A similar treatment of absorbance minima is not as straight
forward because these result from two overlapping peaks.
Based on these considerations and the data presented in
table 10, the following restrictions are placed on spectral
bandpass when SRM 935 is used as an absorbance standard: at
A = 23 5 nm - 1.2 nm; at X = 25 7 nm - 1.4 nm; at A = 313 nm; and
at X=350 nm - 2.0 nm. For certification, a spectral bandpass
of 1.2 nm was used at 235 nm, and 0.8 nm for the remaining
wavelengths
.
6 . 3 Stray Radiation
Stray radiation is defined as any radiation outside of
the nominal spectral region isolated by the monochromator
that reaches the detector. It is produced by scatter from
the optics and walls of the monochromator and is present in
varying amounts in all spectrometers. Although extensive
literature [16,17,18] exists on the detection and measure-
ment of stray radiation, no Standard Reference Materials are
presently available for this purpose.
The spectrometrist must be aware of the potential
presence of significant stray radiaton errors whenever 1
absorbance measurements are made in a wavelength region
where the spectrometer components are extended to their
performance limit. These regions correspond to wavelengths
where: (a) the source intensity is low, (b) the detector
response in poor, and (c) the transmission of the mono-
chromator is low. A detailed discussion of this instrumental
parameter is given in ASTM Standard Method E 387-72. The
procedures recommended in this work should be used to
determine this parameter in the spectral range of interest.
Measurements performed on the high- accuracy spectrometer
have indicated that the stray radiation in this instrument
is less than five parts in 10 5 at 600 nm.

NOTE : The user is cautioned that SRM 955 will provide
meaningful data only when the three parameters discussed
above—wavelength accuracy, adequate spectral bandpass and
absence of stray radiation—are assured.
6 . 4 Beam Geometry
Since most commercial spectrophotometers use lens
optics, the radiation impinging upon the sample usually is
not collimated. This source of systematic error has been
considered previously [10] . For angles of incidence up to
five degrees, the absorbance correction is less than 0.1
percent. Insofar as the use of SRM 935 is concerned, this
correction can be combined with the transmittance/absorbance
scale correction.
6 . 5 Temperature
A change in temperature normally produces a change in
the absorbance of an absorbing liquid. The sign and magnitude
of the temperature coefficient are determined by the combined
contributions of three effects. These are: (a) a change in
concentration resulting from the thermal expansion or con-
traction of the solvent, (b) a change in ionization, protona-
tion, or hydration of the absorbing species, and (c) a red
or blue spectral shift resulting from either the addition or
removal of thermal energy to the absorbing species. Generally,
effects (a) and (c) are predominant and the sign of the
temperature coefficient is negative, i.e., the absorbance
decreases with increasing temperature. However, as seen
previously [10] , there are also systems that have positive
temperature coefficients.
The variation of the absorbance of acidic potassium
dichromate solution with temperature is the smallest that we
have observed for any liquid filter that we have studied.
For the four wavelengths selected for verifying the accuracy
of the transmittance/absorbance scale — 235, 257, 313, and
33

350 nm — the specific absorbances decrease with increasing
temperature. Over the range 20-30 °C, the temperature
coefficients, k, are, respectively, -0.05, -0.05, -0.02, and
-0.05 percent per °C. The temperature coefficients near the
two isosbestic wavelengths are slightly larger, -0.06 and
-0.08 percent per °C, respectively.
The apparent specific absorbances given in table 6 are
certified at a temperature of 23.5 °C. However, SRM 935 can
be used as an absorbance standard at any temperature in the
range 20-30 °C provided corrections are made to the apparent
specific absorbance data. The apparent specific absorbance
at any temperature in this range can be calculated from the
certified values and the appropriate temperature coefficient
from the relation
eI = I 1 +
IOT (t "23 - 5) l W
apparent specific absorbance at temperature t (°C
specific absorbance certified at 23.5 °C
temperature coefficient, percent/°C.
where
:
t£a
23.5a
For example, the apparent specific absorbance of a 20 mg kg 1
solution of SRM 935 in 0.001N perchloric acid at 30 °C and
a wavelength of 350 nm can be calculated as follows: From
table 6, the certified apparent specific absorbance for this
concentration and wavelength is 10.672 kg»g 1• cm t
.
Substituting this value into Eq. (4), the specific absorbance
at 30 °C is:
el° = 10 . 672 [1 - ^| (30 - 23.5)]
= 10.672 [1 - 0.0033]
= 10.637 kg g" 1 cm" 1
a
34

6 . 6 Acidity
Acidic potassium dichromate solutions traditionally
used in collaborative tests have been prepared in 0.01N
sulfuric acid [1,2,3,4,5]. A number of studies, however,
have confirmed the tendency of sulfate to form mixed comp-
lexes with chromium (VI) ions in acidic media [10,19,20,21].
Rather than risk making the HCrOi* ~/Cr 2 0 7
=system even more
complex, the decision was made in an earlier study [10] that
acidification with perchloric acid was preferable to acidi-
fication with sulfuric acid. For similar reasons it was
decided that an acidity somewhat less than 0.01N was desir-
able in order to prevent partial formation of H 2 Cr0it from
protonation of HCr0 4 • At the same time, the acidity chosen
could not be too low because HCrCK would partially ionize
to give CrOit , a chromium (VI) species which has quite dif-
ferent absorption characteristics. As a practical compromise
for minimizing the protonation and ionization processes, an
acidity of 0.001N (pH » 3) was finally selected. At this
acidity, less than 0.1 percent of the total chromium in the
absorbing system is present in either the H 2 CrOit or CrO^form. Close control of acidity at the 0.001N level is not
critical in the use of SRM 935 as an absorbance standard.
The data in tables 6 and 8 are equally valid for perchloric
acid solutions whose pH is in the range 2.5 to 3.5.
6 . 7 Water Purity
Since SRM 935 will be issued in solid form, attention
must be given by the user to the quality of the distilled
water used to prepare the standard solutions. Since acidic
potassium dichromate is a potential oxidant, the water must
be checked and shown to be free of reducing impurities in
order that the SRM provide accurate information. A simple
but definitive test is illustrated in figure 4. In this
test a 500-fold dilution of a 100 mg kg 1 solution of
35

O LU
co E
0.0025
0 0020
gf, 0.0015
<
500—FOLD DILUTION OF 100 mg K2Cr
20
?/ kg
2 4 6 8 10 12 14 ' ' 30
DAYS AFTER PREPARATION
60
Figure 4. Test of the distilled water for reducingimpurities
.
K 2 Cr 2 07 (A 3 1.0) was made with the distilled water to be
tested and its absorbance measured at 350 nm. The measured
absorbance (A = 0.002) agreed with the expected value, thus
indicating that no reduction of chromium (VI) occurred.
Subsequent measurements showed that this solution was stable
for at least two months. Hence, any solution standards
prepared with this water should be stable for the same
period provided they are adequately protected against evapo-
ration losses and exposure to light.
All of the measurements described in this publication
were made using distilled water provided to the Analytical
Chemistry Division from a central supply. The still, con-
denser system, storage tanks and the copper pipes supplying
this distilled water to the individual laboratories are all
tin-lined. Although this water is not free of organic com-
pounds, the test described above shows that these compounds
do not reduce chromium (VI) under the acidity conditions
used. In this regard, it is interesting to note that the
oxidation potential of potassium dichromate is strongly acid
dependent. By preparing the K 2 Cr 2 0 7 solutions in 0.001N
rather than 0.01N perchloric, the oxidation potential of
36

the chromium (IV) system is lowered by about 13 percent.
Whenever the quality of the distilled water is suspect, it
should be redistilled from an alkaline potassium permanganate
solution in order to preoxidize any reducing impurities.
7. INSTRUCTIONS FOR USING SRM 935 AS AN
ABSORBANCE STANDARD
The procedure recommended for using SRM 935 to verify
the accuracy of the absorbance scales of narrow bandpass
absorption spectrometers is identical to the one used in
the certification of this Standard Reference Material. All
the operations involved in this certification were described
in detail in Section 5 of this publication. Once the solu-
tions of SRM 935 have been prepared accurately, their
absorbances are measured on the spectrometer to be verified
using the instrumental conditions and restrictions described
in Sections 5 and 6. Strict attention must be given to
wavelength accuracy, adequate spectral bandpass, absence of
stray light, and temperature.
The certification of SRM 935 for apparent specific
absorbances provides considerable flexibility in the use of
this material for verifying the accuracy of the absorbance
scale. The user for example, is not required to prepare
specified concentrations of K 2 Cr 2 07 solution. The only
requirement is that the concentration of every solution for
checking the scale be known accurately. Although the
certified values given in table 6 are for nominal K 2 Cr 2 0 7
concentrations of 20, 40, 60, 80 and 100 mg kg-1
the appro-
priate specific absorbances for other concentrations can be
obtained by linear interpolation.
The derivation of e&
by linear interpolation and its
subsequent use to calculate an accurate value of Aa
are
37

described below, assuming the following experimental con-
ditions :
A = 350.0 ± 0.2 nm; spectral bandpass < 0.8 nm
b = 0.9982 cm
c = 0.04375 g kg" 1
t = 23.5 °C
From table 6, the e for X = 350 nm and concentrations ofa
0.040 and 0.060 g kg" 1 are 10.682 and 10.692, respectively.
The e o for c = 0.04375 g kg" 1 is:
ea
10 - 682 +°:o
4
6o75
:0:°!°
(10 - 692 - 10 - 682 >
e o - 10.682 + 0.0019 (6)
e = 10.684a
The corresponding apparent absorbance A is given by:cl
i
Aa
= ea
* b ' c
A = 10.684 x 0.9982 x 0.04375a
A = 0.4666a
The uncertainty AA in the calculated A is determined from3.
the combined uncertainties in e , b, and c in equation 7,a
provided no other systematic errors are present. Thus, using
the propagation of error formulas given by Ku [22]
AA = bclAe I + e c I Ab I + e b I Ac I (8)a 'a' a 11 a 1
.
1v J
To evaluate AA , the appropriate value of Ae is taken froma a
table 6 and the Ab and Ac values must be provided by the
user. For the example taken, solution of equation 8 for
the Ae term gives
AA = 1 x 0.044(0.020) + e c|Ab| + e b|Ac| (9)a a , a
38
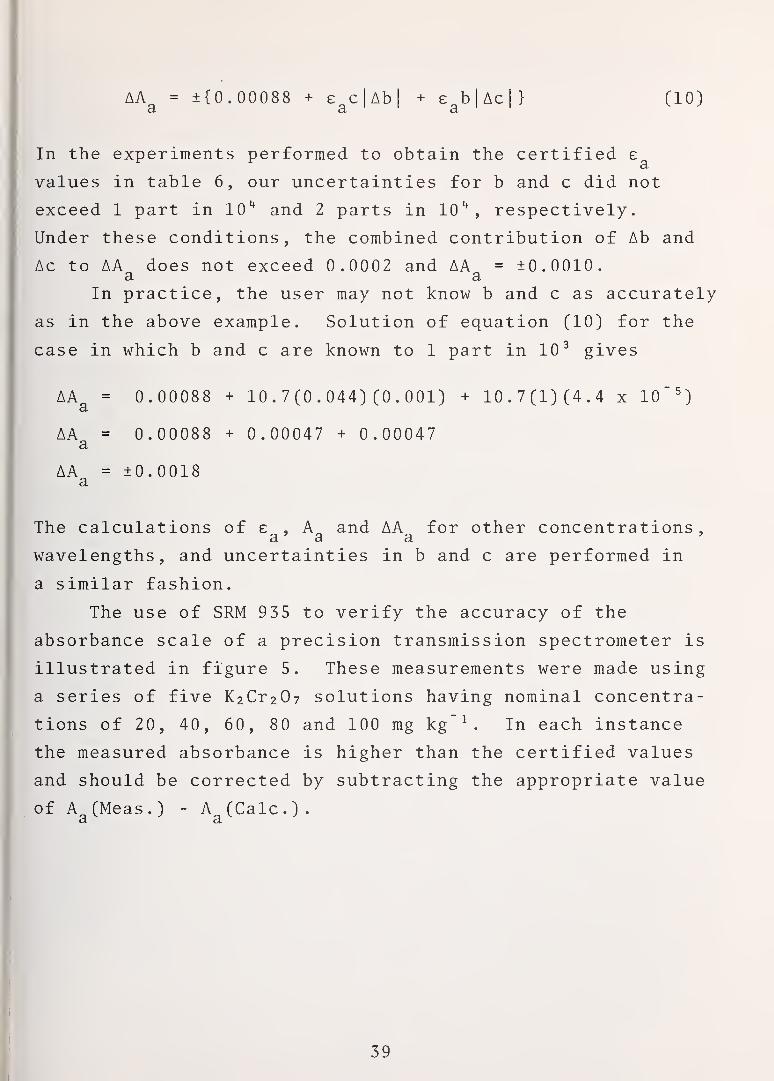
AA = ±{0.00088 + e clAbl + e b I Ac I
>
a a 1 1 a 1 1(10)
In the experiments performed to obtain the certified e&
values in table 6, our uncertainties for b and c did not
exceed 1 part in 10 4 and 2 parts in 10**, respectively.
Under these conditions, the combined contribution of Ab and
Ac to AA does not exceed 0.0002 and AA = ±0.0010.a a
In practice, the user may not know b and c as accurately
as in the above example. Solution of equation (10) for the
case in which b and c are known to 1 part in 10 3 gives
0.00088 + 10.7 (0.044) (0.001) + 10.7 (1)(4.4 x 10" 5)
0.00088 + 0.00047 + 0.00047
±0. 0018
The calculations of e . A and AA for other concentrations,a ' a a '
wavelengths, and uncertainties in b and c are performed in
a similar fashion.
The use of SRM 935 to verify the accuracy of the
absorbance scale of a precision transmission spectrometer is
illustrated in figure 5. These measurements were made using
a series of five K 2 Cr 2 07 solutions having nominal concentra-
tions of 20, 40, 60, 80 and 100 mg kg In each instance
the measured absorbance is higher than the certified values
and should be corrected by subtracting the appropriate value
of Aa(Meas. ) - A (Calc. )
.
AA =a
AA =a
AA =a
39

ft 0.2 0.4 0.6 0.8 1.0
Absorbance
Figure 5. Correction curve for the absorbance scale of aprecision spectrometer. The error bars are thesum of the errors arising from the uncertaintiesin the certified apparent specific absorbancese , cuvette pathlength b, and concentration c.
Although solutions of this SRM should be prepared
strictly on a weight/weight basis, there are undoubtedly
users who will desire to prepare and express concentrations
on a weight/volume basis. While this approach is not recom-
mended, the certified apparent specific absorbances in
table 6 can be recalculated for the case in which the
K 2 Cr 2 07 concentration is expressed in g«L 1. This recalcula-
tion simply requires dividing the certified values by the
appropriate density given in table 11. The uncertainties
and temperature coefficients remain unchanged. Anyone
wishing to use this approach should calibrate the volumetric
flasks used. NBS recommendations for performing this cali-
bration are given in two papers included in the Appendix.
40

Table 11. Densities of 0.001N perchloric acid solutions ofpotassium dichromate at 23.5 °C.
K 2 Cr 2 0 7
Cone, mg'kg 1 Density, kg»L 1
20 0.99746
40 0.99747
60 0.99749
80 0.99750
100 0.99752
8. USE OF SRM 935 TO VERIFY ABSORBANCE LINEARITY
The apparent specific absorbances of 0.001N perchloric
acid solutions of SRM 935 at wavelengths near the two
isosbestic points in the HCrOi* /Cr 2 0 7 spectra (figure 1)
have been presented in table 7. Inspection of these data
show that, of the four wavelengths selected, the calculated
values for 345 nm are, within an uncertainty of 0.1 percent,
independent of concentration over the range of 20-100 mg*kg 1
K 2 Cr 2 0 7 . This relation was not expected since none of the
data in table 7 have been corrected for internal multiple
reflection effects. The constancy of the uncorrected
specific absorbances at 345 nm therefore must result from
the presence of compensating effects.
The most plausible explanation for the observed invari-
ance in the apparent specific absorbance data at 345 nm is
that the internal reflection corrections, which are propor-
tionally larger at lower absorbances [15] , are almost exactly
offset by the effect of the variable HCrOi+ /Cr 2 0 7~ speciation
at the higher absorbances. Following this reasoning, the
Cr 2 0 7 ion must have a slightly larger specific molar
absorbance at 345 nm than the HCrOi* ion. Consequently the
true isosbestic point is at a slightly shorter wavelength
41

than those used for measurement. A similar consideration
of the data reported for 322 and 323 nm indicate that this
isosbestic point is also slightly below the wavelengths
chosen.
For the purpose at hand the important fact remains that
the apparent specific absorbances of 0.001N perchloric acid
solutions of K 2 Cr 2 0 7 at 345 nm are independent of concentra-
tion at the one part in a thousand level over the range
20-100 mg*kg 2. Consequently, if the absorbance scale of a
narrow bandpass (<_2 nm) spectrometer is linear, the apparent
absorbances of a series of K 2 Cr 2 07 solutions at this wave-
length should be a linear function of concentration. Such a
test may be particularly useful to the clinical chemists who
make a proportionally large number of measurements in the
wavelength range of 340-350 nm.
In summary, an outline of the step-by-step operations
required to use SRM 935 for verification of a spectrometer
is given below.
— Weigh 20, 40, 60, 80 and 100 mg of SRM 935 to ±0.02 mg
and transfer quantitatively to five 1-liter borosilicate
volumetric flasks that have been preweighed, with their
individual Teflon stopper, to ±0.01 g.
— Dissolve each sample in 200 to 300 mL of distilled
water that is free of reducing impurities, add 1 mL of
IN perchloric acid, and dilute approximately to
volume with distilled water.
— Stopper, mix, and weigh each flask and contents to
±0.01 g.
— Prepare a blank solution by diluting 1 mL of IN
perchloric acid to 1 liter with the same distilled
water
.
42

Place a clean, calibrated, fused-silica (non-fluorescent)
cuvette in the temperature-controlled sample compartment
of the spectrometer to be verified. The temperature
should be controlled to ±0.2 °C and in the range of 20
to 30 °C.
Using a borosilicate,Pasteur-type pipette, rinse the
cuvette with six volumes of the blank solution.
Transfer a seventh volume and close the cuvette with a
Teflon stopper.
After 10 minutes measure the apparent absorbance of the
blank solution against air at wavelengths 235, 257, 313
and 350 nm, using the spectral bandpasses given in
table 6. For verification of linearity, measure the
apparent absorbance also at 345 nm. The data obtained
represent the values of Dg in equation (3) on page 18.
In a similar manner perform apparent absorbance measure-
ments on the five solutions of SRM 935 potassium
dichromate. For each concentration, rinse the cuvette
a minimum of six times before beginning measurements.
The data represent the values of Dg in equation (3) on
page 18.
Use the values of Dg and thus obtained to calculate
the measured A of each of the five concentrations.a
Compare the experimental values of A&
for these five
concentrations with the accurate A calculated froma
the certified values of apparent specific absorbances,
e ,given in tables 6 and 7 of this publication and
comprising table 1 of the certificate (a copy of the
certificate is included in the Appendix)
.
43

— The differences between the calculated and measured Aa
values are used to correct the absorbance scale of the
spectrometer as illustrated in figure 5. The correction
curves for the four wavelengths at which e is certified° ashould be similar.
It must be added, however, that the absorbance linear-
ity test described above should not be associated with the
accuracy of the transmittance/absorbance scale of the
spectrometer being tested. Detailed discussions of important
distinctions between ascertaining transmission accuracy and
linearity will be found in references 23 and 24.
9. SUMMARIZING REMARKS
Potassium dichromate is the first SRM to be issued by
the NBS Office of Standard Reference Materials for use as an
"ultraviolet absorbance standard. The fact that this com-
pound has been widely used for many years in the collabora-
tive testing of spectrometers suggests that it should play a
more significant role in the future since, for the first
time, the absorbance measurements have been performed with
an instrument of proven accuracy. The certification of the
apparent specific absorbances of solutions prepared from
this SRM over a range of concentrations should give the
analyst the flexibility necessary to verify the accuracy of
any portion of the absorbance scale that may be desired. In
addition the capability of using the isosbestic data as a
verification of absorbance linearity suggests a number of
other useful applications.
In conclusion, it is believed that SRM 935, when used
in conjunction with a calibrated quartz cuvette (SRM 932)
,
will provide a valid means to verify the accuracy of the
absorbance scale of narrow bandpass spectrophotometers in
the ultraviolet over the wavelength range of 235-350 nm.
44

10. ACKNOWLEDGEMENTS
The authors gratefully acknowledge the assistance of
the following members of the NBS staff:
• K. D. Mielenz, Research Physicist, Analytical Chem-
istry Division, for many helpful discussions of fundamental
spectrophotometric parameters and for critically reading
the manuscript.
• G. Marinenko, Research Chemist, Analytical Chemistry
Divison, for performing the coulometric assays.
• J. A. Norris, Research Chemist, Analytical Chemistry
Divison, for performing the emission spectrographic analyses
• H. H. Ku, Senior Statistician, Statistical Engine-
ering Section, for the evaluation and statistical treatment
of the experimental data.
• R. W. Seward, Technical Representative, Office of
Standard Reference Materials, for obtaining and providing
the lot of potassium dichromate used for certification.
• I. L. Barnes and J. R. DeVoe, Section Chiefs,
Analytical Chemistry Division, for their kind support and
encouragement throughout this work.
The authors also wish to acknowledge the cooperation
and early financial support of the National Institute of
General Medical Sciences in the research leading to this SRM
The enthusiastic encouragement of George N. Bowers, Jr.,
M.D., Hartford Hospital, Hartford, Connecticut and
Royden N. Rand, Ph.D., Eastman Kodak Co., Research Labora-
tories, Rochester, New York is likewise gratefully acknow-
ledged .
4 5

11. REFERENCES
[1] Gridgemen, N. T. , Photoelectric Spectrometry Group
Bull. 4, 67-79 (1951) .
[2] Photoelectric Spectrometry Group Bull. 1_6, 441-457
(1965)
.
[3] Ketelaar, J. A. A., Fahrenfort, J., Hass, C., and
Brinkman, G. A., Photoelectric Spectrometry Group Bull.
8, 176-179 (1955).
[4] Vandenbelt, J. M. , and Spurlock, C. H. , J. Opt. Soc.
Am. 4_5, 967-970 (1955).
[5] Vandenbelt, J. M. , J. Opt. Soc. Am. 5_0 , 24-27 (1960).
[6] Mavrodineanu, R. in NBS Technical Note 544 , 6-16 (July
1969-June 1970; and 584, 2-21 (July 1970-June 1971).
[7] Mavrodineanu, R. , J. Res. Nat. Bur. Stand. (U.S.) 76A
(Phys. and Chem.), No. 5, 405-425 (Sept. -Oct. 1972).
[8] Mavrodineanu, R. , J. Res. Nat. Bur. Stand. (U.S.) 80A
(Phys. and Chem.), No. 4, 637-641 (July-Aug. 1976).
[9] Burke, R. W. , and Mavrodineanu, R. , J. Res. Nat. Bur.
Stand. (U.S.) 80A (Phys. and Chem.), No. 4, 631-636
(July-Aug. 1976), included in the Appendix.
[10] Burke, R. W.,Deardorff, E. R. , and Menis, 0., J. Res.
Nat. Bur. Stand. (U.S.) 76A (Phys. and Chem.), No. 5,
469-482 (Sept. -Oct. 1972), included in the Appendix.
See also NBS Technical Note 544-, 17-34 (July 1967-June
1970; and 584, 21-45 (July 1970-June 1971).
[11] Yoshimori, T. and Sakaguchi, N. , Talanta 22_, 233-238
(1975)
.
[12] Mavrodineanu, R. and Lazar, J. W. , Nat. Bur. Stand.
(U.S.), Spec. Publ. 260-32, 26 pages (Dec. 1973), and
in Clin. Chem. 1_9 , 1053-1057 (1973), included in the
Appendix
.
[13] McCormick, P. G.,Burke, R. W. , and Doumas , B. T.
,
Clin. Chem. 18, 854-856 (1972).
46

[14] Mielenz, K. D. and Mavrodineanu , R. , J. Res. Nat. Bur
Stand. (U.S.) 77A, (Phys. and Chem.), No. 6, 699-703
(Nov. -Dec. 1973).
[15] Burnett, R. W. , Anal. Chem. 4_5, 383-385 (1973).
[16] Perry, J. W. , Photoelectric Spectrometry Group Bull.
3, 40 (1950)
.
[17] Slavin, W. , Anal. Chem. 3_5, 561-566 (1963).
[18] Paulson, R. E. ,
Appl. Opt. 3, 99-104 (1964).
[19] Tong, J. and King, E. L., J. Am. Chem. Soc . 7_5, 6180-
6186 (1953).
[20] Davies, W. G. , and Prue , J. E., Trans. Faraday Soc.
51, 1045-1051 (1955).
[21] Haight, G. P., Richardson, D. C, and Coburn, N. ri.,
J. Inorg. Chem. 3, 1777-1780 (1964).
[22] Ku, H. H., J. Res. Nat. Bur. Stand. (U.S.), 70C, (Eng
and Instr.), No. 4, 263-273 (Oct. -Dec. 1966).
[23] Reule, A. G., Appl. Optics 7_, 1023-1028 (1968) and J.
Res. Nat. Bur. Stand. (U.S.) 80A, No. 4, 609-624
(1976). See also NBS Technical Note 544, 17-34 (July
1967-June 1970); and 584_, 21-45 (July 1970-June 1971)
[24] Sloane, H. J. and Gallaway, W. S., Appl. Spectry. 51,
25-30 (1977).
47

12. APPENDICES
For additional information and as a convenience to the
reader, reprints of papers which are considered particularly
relevant to the certification and use of SRM 935 have been
included in the Appendix of this publication together with a
copy of the certificate. These are:
1. Comments on Spectrometry Nomenclature.
2. Liquid Absorbance Standards.
3. Standard Reference Materials: Standard Quartz Cuvettes
for High—Accuracy Spectrophotometry.
4. Acidic Potassium Dichromate Solutions as Ultraviolet
Absorbance Standards.
5. Testing of Glass Volumetric Apparatus.
6. The Calibration of Small Volumetric Laboratory
Glassware
.
7. Certificate of Analysis, SRM 935, Crystalline Potassium
Dichromate for Use as an Ultraviolet Absorbance
Standard.
48

APPENDIX I
Reprinted from ANALYTICAL CHEMISTRY, Vol. 48, Page 1093, June 1976Copyright 1976 by the American Chemical Society and reprinted by permission of the copyright owner
Reprinted by permission of the American Chemical Society
Comments on Spectrometry Nomenclature
Sir: As an optical physicist who collaborates with analyt-
ical chemists in the development and use of absorption and
luminescence spectrometers, I have become increasingly
aware of the fact that our vocabularies are not always the
same. Although some of these differences have been point-
ed out before (1) it seems worthwhile to familiarize the
readers of this journal with the currently prevailing termi-
nology of physical optics. Perhaps the following commentsmay be helpful to editors, authors, and nomenclature com-
mittees in establishing a common and consistent terminol-
ogy that can be used in all branches of spectrometry and
would save readers a good deal of puzzlement and reading
between lines. The main purpose of these comments is to
emphasize the need for interdisciplinary efforts in defining
spectrometry nomenclature without perpetuating the in-
consistencies that exist at present. They do not represent
an official position of the National Bureau of Standards.
The basic concept of modern optical terminology (2, 3) is
to combine nouns and adjectives in order to describe quan-
tities and properties as explicitly as necessary, rather than
using glossaries of short names for them. This "Chinese
Restaurant" method of nomenclature (4) offers flexibility
in introducing new terms, and has recently been extended
to include the photon quantities used in photochemistry
and similar disciplines dealing with the interaction of light
and matter (5).
The basic list of nouns describing the transport of energy
according to the laws of geometrical optics is:
Energy, Q.
Energy density, u = dQ/dV. Energy per unit volume.
Flux, 4> = dQ/df. Time rate of energy flow.
Flux density, W = d4>/dA. Flux per unit area.
Intensity, I = d<J>/dfi. Flux per unit solid angle.
Sterance, L = d23>/d(Acos6)d£L Flux per unit projected
area and unit solid angle.
(A number of alternative and additional terms have been
proposed. For example: pointance to replace the continual-
ly misused term intensity; incidance and exitance, or inci-
dent areance and (transmitted, emitted, etc.) areance for
the flux densities arriving at and leaving a surface; steri-
sent for the sterance generated per unit path length byemission or scattering into the direction of propagation;
and fluence for the surface energy density incident upon a
volume element irradiated from within a large solid angle
of rays (F. E. Nicodemus, private communication). As these
have not yet been accepted generally, they were not includ-
ed here. However, the new term sterance was included as it
avoids the misnomer photon radiance that has appeared in
papers on luminescence spectrometry.)
These nouns are modified by the adjective radiant, andthe above symbols are written with a subscript 'e' (for ener-
gy), when radiometric units are used. The modifiers lumi-
nous and photon are used in conjunction with subscripts
V (for visual) and 'p' (for photon) to indicate the use of
photometric and photon units, respectively. For example:
Radiant energy density, u e [J m-3].
Luminous intensity, 7v [lm sr-1
].
Photon sterance, L P [E m~ 2 sr-1
s-1
].
(The basic unit for photon energy used here is the einstein
[E], defined as one mole of photons. It is not an SI unit, but
is used so extensively in photochemistry and photobiology
that its acceptance as a supplementary SI unit may be de-
sirable.)
The additional modifier spectral and subscripts X and a
are used to denote derivatives of radiometric and photon
quantities with respect to wavelength and wavenumber, re-
spectively. Thus:
Spectral radiant energy density, u e,x = du e/dX [J m-4].
Radiant energy density per unit wavelength interval.
Spectral photon intensity, 7 Pi<r= dlp/da [E sr
-1s_1
m].
Photon intensity per unit wavenumber interval.
Any of these can be modified further; such as: fluorescence
photon flux, transmitted spectral radiant flux density, or
absorbed luminous energy. Usually, it is possible to drop
most of the modifying adjectives as well as the subscripts e,
v, or p, once the context has been clearly established or
whenever a distinction is not necessary.
The same method of nomenclature also provides a sim-
ple and logical way of specifying the precise meaning of the
quantities and material properties commonly measured in
analytical spectrometry. Thus radiant absorptance ae and
photon absorptance ap should be used for the ratios of the
radiant or photon fluxes absorbed by a sample to those in-
cident upon it, when measured with a large bandwidth so
that these two ratios are not the same. On the other hand,
spectral absorptance a(\) is sufficiently accurate in the
case of measurements made with a small bandwidth. Simi-
larly, luminescence yields (the ratios of the radiant or pho-
ton fluxes emitted by a sample to those absorbed by it)
should be designated as radiant yield r]e or photon yield r]p
(not energy yield or quantum yield). In this case, spectral
radiant yield, r)e^ = dr)Jda, and spectral photon yield, j)p(T
= dr/p/dc, are different quantities even in the limit of infi-
nitely narrow bandwidths, and thus should be referred to
by these names.
[The dependence on wavelength or wavenumber is indi-
cated by a subscript (7? Pi<r ) when the spectral distribution is
defined as a derivative, but in functional form [a(\)] in the
case of spectral distributions that are not derivatives. This
is an important distinction that must also be borne in mindin the presentation of spectra. The positions of the peaks
and valleys in derivative spectra depend on the units used,
so that these should not be published in the form of a single
graph with dual scales (such as wavelength and wavenum-ber, or spectral radiant and photon yield).]
In addition to this general description of current optical
terminology, the following comments are made in direct
reference to the nomenclature list in the December 1975
issue of Analytical Chemistry (6).
1) This list cautions not to use optical density instead of
absorbance, but defines the latter as "the logarithm to the
base ten of the reciprocal of transmittance"—which is the
definition of optical density. Internal transmittance
should have been substituted for transmittance in this def-

inition of absorbance. The International Lighting Vocabu-
lary suggests transmission density and internal transmis-
sion density instead of optical density and absorbance.
This is more determinative, and also fits into a general
scheme where reflection density is defined as the negative
logarithm to the base ten of reflectance. On the other hand,
transmission and reflection density are operational quan-
tities that merely express measured data on a logarithmic
scale, whereas absorbance is directly related to molecular
constants through the Lambert-Beer and Strickler-Berg
equations. Thus, in my opinion, it should be retained as a
separate term. I believe that all confusion would be avoided
by defining:
Transmittance, r. Ratio of the flux transmitted by a
sample to the flux incident upon it.
Internal transmittance, r\. Transmittance exclusive of
losses at boundary surfaces and effects of interreflec-
tions between them.
Transmittance density, D = — logini". Negative loga-
rithm to base ten of transmittance.
Absorbance (Internal transmission density), A =
—logioTj. Negative logarithm to base ten of internal
transmittance.
2) The definitions of absorptivity in chemistry and phys-
ics are not the same. In chemistry, it means absor6ance per
unit path length and unit concentration (A/bc), whereas
the International Lighting Vocabulary (2) defines it as in-
ternal absorptance per unit path length (dajdb). Similarly,
it specifies transmissivity as internal transmittance per
unit path length and reflectivity as the reflectance of a
thick layer (so that a further increase in thickness will no
longer change its value). Generally, terms ending in -ance
represent sample properties, whereas terms ending in -ivity
denote material properties that are independent of sample
geometry. The quantity A/bc does not fall in this latter cat-
egory as it is also independent of sample concentration.
The International Union for Pure and Applied Chemistry,
apparently aware of this discrepancy, has suggested calling
it absorption coefficient. However, as this name has been
given different and mutually inconsistent meanings in the
past, a less ambiguous word—perhaps specific absorbance—would have been better. Therefore it is proposed to define:
Absorptivity, a = d«j/dfe [m -1]. Internal absorptance per
unit path length.
Specific absorbance, € = A/bc [kg-1 m2
}. Absorbance per
unit path length and unit concentration.
Specific molar absorbance, cm = A/bc m [mol -1 m 2]. Ab-
sorbance per unit path length and unit molar concen-
tration.
3) The December 1975 nomenclature list also implies
that the Beer-Lambert laws are the same. The correct defi-
nitions are:
Beer's law: Absorbance is proportional to concentration.
Lambert's law: Absorbance is proportional to path
length. Also called Bouguer's law.
4) The definition of the angstrom unit in terms of the
red line of cadmium has been abrogated several years ago.
It is now defined as 10-10 m, exactly. However, the ang-
strom is not an SI unit, and has been sanctioned by the In-
ternational Committee on Weights and Measures only as a
supplementary unit that will eventually be abandoned (7).
Therefore, authors should be encouraged to use microme-ters or nanometers.
5) The December 1975 list defines spectrometry as the
"measurement of spectra", but restricts the meaning ofj
spectrometer to "instrument with an entrance slit, a dis-
persing device, and with one or more exit slits . ..". As this
excludes non-dispersive and slit-less instruments, such as
Fourier and Girard spectrometers, it would be more consis-
tent to call any instrument used for spectrometry a spec-
trometer. Therefore:
Spectrometer: Instrument for the measurement of spec-
tra.
The general term for instruments that measure spectral
distributions of radiometric quantities is spectroradiomet-j
er. However, as this implies measurements in absolute,
units, spectrometer is a better term for the simpler, usually
ratio-forming instruments used in analytical spectrometry.
Thus, a spectrophotometer could also be called absorption
spectrometer, and fluoroescence spectrometer would endthe controversy of spectrofluor imeter vs. spectrofluorome-
ter.
(Strictly speaking, the word spectrophotometer is a mis-
nomer. A photometer is an instrument that measures lumi-
nous flux in lumens. Since the adjective luminous implies
the integral effect of visual radiation as perceived by the
human eye, the spectral analysis of luminous flux has no i
physical meaning. However, in view of the firmly estab-
lished meaning of spectrophotometer, it is not suggested to
change it, although a scanning of the recent literature
shows an increasing usage of absorption spectrometer.)
LITERATURE CITED
(1) G. A. W. Rutgers, in "Accuracy in Spectrophotometry and LuminescenceMeasurements." Nat. Bur. Stand. (U.S.). Spec. Publ. 378, 53 (1973).
(2) "International Lighting Vocabulary", 3rd ed.. Publication CIE No. 17,
Paris, 1970.
(3) Editor's Page, J. Opt. Soc. Am., 57, 854 (1967).
(4) J. Geist and E. Zalewski, Appl. Opt., 12, 435 (1973).
(5) J. J. Murray, F. E. Nicodemus, and I. Wunderman, Appl. Opt.. 10, 1465(1971).
(6) "Spectrometry Nomenclature", Anal. Chem., 47, 2526 (1975).
(7) "The International System of Units (SI)", Nat. Bur. Stand. (U.S.), Spec.Publ. 330 (1971).
Klaus D. MielenzAnalytical Chemistry Division
Institute for Materials Research
National Bureau of Standards
Washington, D.C. 20234
RECEIVED for review September 26, 1975. Accepted De-
cember 23, 1975.
50

the
(7).
APPENDIX II
JOURNAL OF RESEARCH of the National Bureau of Standards— A. Physics and ChemistryVol. 76A, No. 5, September-October 1972
Liquid Absorbance Standards
R. W. Burke, E. R. Deardorff, and O. Menis
Institute for Materials Research, National Bureau of Standards, Washington, D.C. 20234
(June 14, 1972)
Errors in the measurement of the absorbances of liquid filters result from instrumental and chem-ical uncertainties. This paper presents a systematic study of these variables on the absorbances of
selected filters. Three types of liquid filters are discussed. These are (1) individual solutions of high
purity compounds, (2) composite mixtures and (3) aqueous solutions of organic dyes. The accuracy of
the absorptivity data is established using NBS-calibrated glass filters. The magnitude of the errors
arising from spectral bandpass, beam geometry, stray light, internal multiple reflections, and refrac-
tive index are delineated. Finally, as a practical outgrowth of this study, the development and issuanceof NBS Standard Reference Material 931, Liquid Absorbance Standards for Ultraviolet and Visible
Spectrophotometry, is described.
Key words: Absorptivity data; accuracy; liquid absorbance standards; Standard Reference Materials.
I. Introduction
In the use of filters for checking the accuracy of
le photometric scale of spectrophotometers, oneteeds materials which exhibit absolute spectral neu-
rality. Such ideal filters are not available at present,
he use of the materials which have been suggested is
mited by instrumental and sample variables. For this
eason, one must carefully specify conditions whichefine the other sources of errors.
The first part of this paper reviews several of the
nore important instrumental parameters and dis-
cusses their effects on absorbance measurements.Examples from the literature are given to illustrate
he magnitude of the errors arising from spectral
aandpass, stray light, nonparallel radiation, andmultiple reflections. The second part presents somesxperimental studies of several materials which mayserve as calibration "filters" or standards.
II. Instrumental Parameters
A. Wavelength Accuracy
The absorbances of most samples are sufficiently
wavelength dependent that even in the most favorable
regions of maxima and minima a wavelength error of
1—2 nm can produce absorbance errors of a fewtenths of a percent. When performing measurementson the slopes of absorption peaks, the wavelengthsetting is obviously much more critical and errors are
typically several percent per nanometer. Wave-length accuracy, therefore, becomes especially
important when making absorbance measurementsat, for example, an isosbestic point.
A fine source provides the most definitive means for
establishing the accuracy of the wavelength scale.
The best single source is a mercury lamp which maybe used throughout the range of 200-1000 nm. Forcalibration in the visible region, helium lines are
also useful.
Gibson [l] 1 has discussed the use of mercury andhelium sources and has listed those lines best suited
for wavelength calibration. Other sources which havebeen used include neon, cadmium, cesium, and sodium.
The M.I.T. Wavelength Tables [2] summarizes the mostprominent emission fines of these elements. Not all
wavelengths are given and care must be taken in
using any of these lines in order not to confuse closely
adjacent fines with the one being checked. For those
spectrophotometers having a hydrogen or deuterium
source, the emission lines at 486.13 and 656.28 nm(H) or 485.99 and 656.10 nm (D) may provide con-
venient checks at these wavelengths.
Calibrated holmium oxide and didymium glasses maybe useful secondary standards, particularly for check-ing recording spectrophotometers in which a dynamiccheck of the instrument is often desirable. Theapparent absorption maxima of these filters, however,may vary with spectral bandpass. Therefore, for the
highest accuracy, they should be calibrated for the
spectral bandpass at which they are to be used.
In general, prism instruments require more frequent
calibration than the grating type because their dis-
persion is temperature dependent. Corrections in the
visible region are of the order of 0.1 nm per degreeCelsius. Hysteresis effects must also be considered
1 Figures in brackets indicate the literature references at the end of this paper.
51

and the wavelength settings should always be ap-
proached from the same direction.
B. Finite Bandwidth
Spectral bandpass differences undoubtedly accountfor a significant portion of the discrepancies in molarabsorptivity values reported in the literature. Somehave resulted from the employment of inadequate in-
strumentation; others have resulted from improper useof these instruments or complications arising fromsolution equilibria.
Increasing the spectral bandpass at an absorption
maximum has two effects on apparent peak heights:
(1) the observed values are always less than the
true values and (2) the differences between the twoare proportionally greater at higher absorbances.
Thus, for a finite bandpass, a plot of absorbanceversus concentration or path length will always havea smaller slope than it does in monochromatic radia-
tion and, in addition, will be concave to the con-
centration axis. Figure 1 illustrates these effects.
The reverse behavior will be observed for measure-ments at an absorption minimum. Meehan [3] has
given a simple example which verifies these twoeffects mathematically.
1
CO MCE NITRATION (PATH LENGTH)
FIGURE 1. Effect of spectral bandpass on absorbance: (a) Mono-chromatic radiation (b) Finite bandwidth.
Consider that an absorbing system is illuminated
by two monochromatic radiations of wavelengths
\i and X-2 and that the Lambert-Beer law is obeyedat each wavelength with absorptivities ai and a 2 .
If the effective intensities of the two wavelengths are
1\ and It, respectively, the transmittance, T, is
T= (7i-10- a i 6c +h 10- a 2bc)l(h + h) (1)
where 6 = path length and c— concentration. If A.i
is the wavelength of maximum absorption so that
a.\ > a 2 , then
(1 + r)
•10- a i" c [l + r-10(a i- a2)»c](2)
where r = Ii\I\. The absorbance, A, defined as — log
Tis
A = aibc + log (1 + r) - log [1 + r-10(a i- a2>»c](3)
which may be differentiated with respect to be to
give
dA/d(bc) = a, - [r(ai - a 2 )10< a i-«2>f>c]/
[1 + r • 10<«i-«2>6c] (4 )
At low absorbances
dAld(bc)bc~oai + rat
1 + r (5)
whereas when be becomes large, 10 Ql6c ^>10°26c and
the limiting slope is
dA/d(bc) bc^ a0= a2 . (6)
Thus, the limiting absorptivity at low absorbances is
is a weighted average of ai and at while, at higher
absorbances, it is equal to at, the smaller of the
individual absorptivities.
The theory for the correction of spectral bandpasserrors has been developed by Hardy and Young [4],
Eberhardt [5], and Broderson [6]. Rigorous calculation
requires integration of the relation
^ot>s = k>g!hS\dk
(7)
hS k10~Adk
where /\ is the incident intensity and Sx is the spectral
sensitivity of the detector. Equation (7) emphasizesthe fact that the observed absorbance depends not
only on the shape of the absorption curve, but also onthe wavelength distribution of the source and the
detector response. If I\S\ is constant over the wave-length interval used, approximate corrections for
spectral bandpass may be calculated by assuming a
Gaussian shape for the absorption peak and a tri-
angular slit function for the instrument. Some calcu-
lations are given in table 1 based on these assumptions.
The tabulated values of A obJA agree closely with
those observed experimentally for A up to 1. Asshown by Broderson [6] however, for values of RBWlarger than 0.5, A obJA also depends on A and the
above treatment is no longer applicable.
C. Stray Light
Stray light is defined as any light outside the spectral
region isolated by the monochromator that reaches the
detector. It is produced by scatter from the optics and
52

ill TABLE 1. Dependence of Aobs on spectral bandpassat an absorption maximum under idealized
conditions (see text)
RBW a RBW a
0.0100 0.99995 0.0800 0.9970
.0200 .9998 .0900 .9962
.0300 .9995 .1000 .9954
.0400 .9992 .2000 .9819
.0500 .9988 .3000 .9604
.0600 .9983 .4000 .9321
.0700 .9977 .5000 .8987
a Relative bandwidth: Ratio of spectral band-width to half bandwidth of fully resolved peak.
Walls of the monochromator and is present in varying
imounts in all spectrophotometers,
ji Stray light can lead to varied problems in spectro-
photometry. Spurious absorption bands may arise in
d |>ome cases. More frequently, however, deviations
iTom the Lambert-Beer law are produced. Theseleviations are positive if the stray light is absorbed and
i)legative if it is not.
Extensive literature exists on the detection, ineasure-
s
nent and mimization of stray light. Several of the
,
r
nore useful papers are those by Hogness, Zscheileind Sidwell [7], Perry [8], Slavin [9], and Poulson [10]
n which additional references may be found.The amount of stray light present is proportionally
|
arge in those wavelength regions where the trans-
Bnission of the monochromator, the source intensity or
he detector sensitivity are relatively low. Theseegions, which should first be checked, are 200-230lm and 600-700 nm. If a tungsten lamp must be usedn the range 350-400 nm, a visible cutoff filter should
|)
ilways be employed.The quantitative assessment of stray light requires
he use of extremely sharp cutoff filters. Slavin [9]
jind Poulson [10] have described a number of liquid
i
ind solid filters that may be used. Aqueous solutions of
|(
he alkali halides, for example, are extremely useful
n
n the ultraviolet. Care must be taken, however, that
ight leaks in the cuvet compartment are not contribut-
ng to the observed results. The apparent stray light'
vill not vary appreciably with slitwidth if only instru-
3
nental stray fight is present. In a quick test for light
I
eaks, the apparent stray light will decrease rapidly as
he slits are opened.The stray light error encountered most frequently in
l!
spectrophotometry produces a decrease in an absorp-ion peak and leads to negative deviations from the
.ambert-Beer law. If it is assumed that none of thetray light is absorbed by the sample, the measuredibsorbance is related to the true transmittance by the
expression [9]
^ obs =log [(l-DS+ n- 1
(8)
I II »tfhere S is the instrumental stray fight expressed as a
jraction. The effects of several levels of unabsorbedstray light on absorbance are given in table 2. Most
samples absorb sufficiently in other regions of the spec-
trum to filter out a proportion of the stray light. Thus,indirect estimates of instrumental stray light based ondeviations from linearity are generally low.
Table 2. Effect of unabsorbed stray'light on absorbance
A
S= 0.0001 S= 0.001 S = 0.01
0.1 0.1000 0.0999 0.0989
.5 .4999 .4990 .4907
1.0 .9996 .9961 .9626
1.5 1.499 1.487 1.384
2.0 1.996 1.959 1.701
D. Nonparallel 1ncident Ra diation
A perfectly parallel beam of radiation must comefrom a point source and can carry only an infini-
tesimal amount of energy. The light beam in a spectro-
photometer always has some finite angular size. As a
result, the average light path is greater than the per-
pendicular distance between the cuvet faces. Meehan[3] has considered the case in which the incident
radiation is convergent or divergent in one dimensionsuch as corresponds, respectively, to radiation focused
by a cylindrical lens or leaving a narrow slit. If 0 andR are the angles of incidence and refraction, re-
spectively, the path length of the extreme ray (fig. 2)
is 6/cos R and the absorbance of this ray is A/cos R.
Other rays enter at smaller angles and the observedabsorbance is given by
b H
Figure 2. Nonparallel incident radiation [3]. Reprinted by permis-
sion of John Wiley & Sons, Incorporated.
fftmax
^obs= ^/f?max I/COS RdR. (9)
For this relation to hold, the incident beam must beuniform over its cross section. Evaluation of this
integral for R max of 2-10° (6max = 2.7°-13.4°) gives
the following percent errors in A (table 3). Thus, for
angles of incidence up to 5 degrees, the absorbanceerror is less than 0.1 percent.
E. Multiple Reflections
On passage of light through a cuvet containing
solvent or sample solution, some radiation is reflected
53
470-063 OL - 72 - 7

Table 3. Dependence of absorbance error on nonparal-
lelism of incident radiation
ftmM ,degrees 0max ,
degrees Percent error in A
2
4
6
8
10
2.7
5.3
8.0
10.7
13.4
0.020
.081
.18
.33
.51
at each of the two air-glass and the two glass-liquid
surfaces. For perpendicular incidence, the fraction
/ reflected on passing from a medium of refractive
index n x to a second having retractive index m is
given by the Fresnel expression
/= (10)
For an air-glass surface, /= 0.04 and for a glass-
liquid surface,/= 0.0035. When more than one surface
is involved, the effects of multiple reflections must beconsidered. The essential question when dealing with
liquid filters is whether the solvent completely compen-sates for such reflections. According to Goldringet al. [11], it does not. They consider the case where the
reflections from all surfaces perpendicular to the
fight beam on the two sides of the sample are groupedtogether to form two effective reflection coefficients, ri
and r2 , as shown in figure 3. Considering only first andsecond order reflections, the observed absorbance is
%d-r,l
3*B, r, r,
P0T-P0Tr,
-T-Trj,
SOLVENT SAMPLE
FIGURE 3. Internal multiple reflections [11]. Reprinted by permis-
sion of the American Chemical Society.
A obs = log—=log— — — — (11)P2 r07 (1 — r x + rir2l
2)
which, after transformation and series expansion, can
be reduced to the following expression:
A obs= A + 0.4343 (1-712
)
fir2
1-r,(12)
Considering only the reflections from the two cuvet
faces and that ri = r2 = 0.05, the variation of ^ obs with
A is
A 0.1 0.2 0.5 1.0 2.0
A^ 0.1004 0.2007 0.5010 1.0011 2.0011
Thus, because of internal multiple reflections, the
measured absorbance should always be larger than the
true absorbance with the percentage difference being
greatest at low absorbances. Verification of these
deviations is difficult experimentally. Goldring et aL
[11], however, have suggested ways of minimizingreflection effects. These include positioning the cuvet
at a small angle to the beam and stopping down the
detector surface, immersing the cuvet in a fluid con-
tained in a larger rectangular cuvet turned at an
angle to the beam, or by using a cuvet with prismatic
windows. In each case, the effective path length mustbe determined separately. Other alternatives consist
of using cuvets constructed of absorbing materials or
immersion of a glass filter into the sample. For a
limited wavelength range, reflection errors can also bereduced by coating the external window surfaces
with anti-reflection layers.
In addition to reflections from the cuvets, reflections
from other surfaces must also be considered. Gibson
[1] has pointed out that reflections may occur from the
surfaces of the slit and detector and has suggested a
means for checking this source of error. A thin glass
plate is placed in its normal position at right angles
to the beam and then at a small angle from this posi-
tion. In the second position the reflected energy is
directed out of the beam while scarcely affecting the
true absorbance.
F. Cuvets
The majority of absorbance measurements are
performed on solutions and, in such instances, the
cuvet becomes an integral part of the measurementsystem. Presently, the uncertainty in the length of the
light path can be a limiting factor in the determination
of molar absorptivity. Nonparallelism of the end
windows can be of even greater consequence. How-ever, the effect can be minimized by using the samecuvet orientation for all measurements. The uncer-
tainty in path length is nevertheless greater.
Cuvets are available in a variety of shapes and :
sizes and may be made of glass or silica. Construc-
tion remains largely an art and cuvets may vary con-
siderably in their quality. Two methods of assemblyare commonly used. These are: (1) fusion using only
heat and (2) the use of intermediate, low-melting
glasses. At present, each has its disadvantage. Thefirst technique is the more desirable, but our ex-
perience, primarily with rectangular cuvets, indicates
that the edges are not always completely fused.
These surfaces exhibit capillarity and may becomeserious sources of contamination. Under such condi-
tions, the cleaning of these cuvets is difficult, if not
impossible. The use of low-melting fluxes on the other
hand can produce strains because of differences in
coefficients of expansion and cuvets so constructed
are generally more fragile.
Cuvets are frequently offered in matched sets. This
may be considered more of a convenience than a
necessity since this terminology is normally used onl>
to describe the transmission of the window material.
54

Path length and parallelism of end plates are of morefundamental importance. Unfortunately, no generally
accepted tolerances have been established in this
country for the construction of cuvets. The British
Standards Institution, however, has published a set
of specifications [12] which merit our consideration andpossible adoption. They recommend that the path
length be specified to ±0.02 mm and the end windowsbe flat over a defined beam area to four Newton fringes
jper centimeter in mercury green light. It should befeasible for greater accuracy, especially for the 10 mmcuvets, to calibrate a limited number by appropriate
metrology techniques to ±0.01 mm.
B. Individual Solutions of High Purity Compounds
1. Potassium Dichromate. Numerous attempts
have been made to use chormium (VI) solutions
as ultraviolet absorbance standards. In the early
studies [7, 14, 15, 16, 17] alkaline solutions of potassium
chromate were preferred. More recently, potassium
dichromate in slightly acidic media has been described
[18, 19, 20]. The absorption spectra of these two sys-
tems are quite different with the latter giving the moredesirable arrangement of maxima and minima (fig. 4).
The approximate composition of chromium (VI)
solutions may be derived from the following equilibria:
III. Evaluation of Selected Liquid Filters
This section is a report of our efforts to develop
ivell characterized liquid absorbance standards. Threegeneral types of liquid filters are discussed. These are
1) individual solutions of high purity materials, (2) em-
pirical mixtures and (3) aqueous solutions of organic
lyes. Much of the emphasis has been placed on deter-
mining the optimum conditions for preparation of these
liters and, once established, what the absorbing
species or ionic compositions of these systems are.
iy combining this information with the instrumental
:onsiderations developed in the first part of this paper,
t is hoped that the resulting data represent a step
oward obtaining more meaningful absorptivity
neasurements.
A. Instrumentation
i Absorbance measurements at a fixed wavelength
yere performed manually on a high precision double-
leam spectrophotometer provided with a double
aonochromator. The accuracy of the photometric
cale of this instrument was established with the
IBS high-accuracy spectrophotometer described by/lavrodineanu [13]. The wavelength scale was checkednth a mercury lamp. Potassium halide solutions [9,
0] were used to assess stray light in the ultraviolet.
Room temperature was maintained between 24 to
'6 °C. The cuvet compartment and jacketed holders
vere thermostated by a circulating water bath. Copper-onstantan thermocouples were used to measureemerature differences between the bath and the
ample solution.
An electronic feeler gauge [13] was used to measurehe path length of the 10 mm rectangular cuvetsormally used. Solutions, assumed to obey Beer'saw, were used for calibrating the 1 mm cuvets.
The accuracy of the microbalance was established
nth NBS-calibrated weights. Class A, 1 -liter volu-
netric flasks were checked gravimetically. All dilutions
'ere subsequently made by volume. To minimizerrors from cell positioning, borosilicate, Pasteur-ype pipets were used to transfer solutions to and fromhe cuvets.
220 250 300 350 400WAVELENGTH, nm
FIGURE 4. Absorption spectra of 10-" M Cr (VI) in 0.05 N KOHand 10-W HC104 .
H2Cr04 = tP + HCrOj (13)
HCrOf = H+ + CrO? (14)
2HCrC>4- = Cr2Of + H20. (15)
Some values reported for the equilibrium constants
Ki, K2, and K3 at 25 °C are as follows:
A:, = 0.16 [21]
K2 = 3.2 x 10- 7[22] and 3.0 x 10~ 7
[23]
#3 = 43.7 [21], 35.5 [24] and 33.0 [25].
Thus, at a pH greater than 10, chromium (VI) exists
almost entirely as Cr0.r ions while, in weakly acidic
solutions, the predominant species is HCrOj whichpartially dimerizes to Cr20f. The amount of dimerwill increase with increasing chromium concentra-
tion. The formation of H 2Cr04 or CrOf can be es-
sentially eliminated by maintaining the acidity nearpH 3.
55

Much of the uncertainty that has arisen from the use
of acidic potassium dichromate solutions as potential
absorbance standards can be attributed to the dimeri-
zation reaction (eq (15)). It is primarily this equi-
librium which leads to the observed deviations fromBeer's law. Because of the range of values reportedfor K3 , one of the first objectives of the present studywas to redetermine this constant. The spectrophoto-
metric method was chosen and is described in somedetail below.
a. Spectrophotometry Determination of theDimerization Constant for: 2HCr04= = Cr2 0 7
=
+ H 20. If HCrOi" and Cr20 7= are the only Cr(VI)
species present with molar absorptivities ei and e-2 ,
respectively, the apparent molar absorptivity, em ,
will be given by
em = (1 — a)€i + 1/2 • ae2 (16)
where a is the fraction of total chromium in the
dichromate form. From eq (15) the thermodynamicequilibrium constant of the dimerization reaction is
K3
[Cr2Of] 72
[HCrOr?(17)
or, in terms of a
K32(l-a) 2Crr
'
y\(18)
where yi and 72 are the activity coefficients of HCrOfand Cr20f\ respectively, and Crr is the total chro-mium concentration. Because the ionic strength neverexceeded 0.01, the activity coefficients may be treated
by the Debye-Hiickel expression [25]
log yi
AZ'fpi2
(19)
where Z is the ionic charge, / is the ionic strength andA has a value of 0.509 1/mol at 25 °C. Equations (16)
and (18) can be rewritten to give, respectively,
€m = a(l/2 e2 — 61) + €1 (20)
and
log K3 = loga 2AP'2
2(l-a)2Crr 1+/1/2(21)
Assuming a value of K3 , one can calculate from eq(21) the a values at various total chromium concentra-
tions. If the choice of K3 is correct, the measuredvalues of em should he on a straight line of slope (1/2
€2— €1) and intercept €1, as seen from eq (20). Thebest value of K3 is then determined by the method of
least squares.
1. Experimental Procedure
The chromium (VI) solutions used in the subsequent!studies were prepared from NBS SRM-136c, potas-
sium dichromate, which had been dried at 110 °C for
two hours. The distilled water was shown to be free
of reducing impurities by titration with a dilute
potassium permanganate solution. Perchloric acid
was used to maintain the pH at 3.0 ± 0.1.
The optimum wavelengths for the determination of
K3 were chosen as follows: Two solutions were pre-
pared, one containing 391 mg K 2Cr20 7/l and the other,
40.0 mg K2Cr20;/l. The former was transferred to a
1.023 mm cuvet and the latter to a 10.00 mm cuvet. A1
differential scan was then made on a recording spectro-
photometer equipped with a 0-0.1 absorbance (full
scale) slidewire, using the less concentrated solution-
as the reference. The resulting spectrum is shown in
figure 5. Relatively large differences in absorbance are
seen in the wavelength regions near 275 and 385 nmeven though the total number of chromium atoms in
each light path is the same. Thus, it is in these two
regions that the largest deviations from Beer's law
should be observed. Three wavelengths were subse-
quently selected in each region for the determination i
of K3-390, 385 and 380 and 280, 275 and 270 nm]
respectively.
220 250 300WAVELENGTH nm
350 40C
Figure 5. Difference spectrum of 391 mg K2Cr20 7/l in 1.023 mncuvet versus 40.0 mg KoCrsCVl in 10.00 mm cuvet; pH = 3.
2. Results
The apparent molar absorptivities calculate
from absorbance measurements on the four chromiurconcentrations used for the determination of Kare given in table 4. Using the method of least squares
these em values were plotted against the a fraction
calculated from eq (21) for various assumed values 0
K3 . The molar absorptivities were weighted accordin
to the reproducibility of the absorbance measurements. A computer was used for all calculations
56

A typical graph of the residual standard deviation
of the experimental em values from the best straight
jiline fit is shown in figure 6 for K 3 values of 28 through
36. The minimum in this curve is the best estimate
of K 3 and, for the case shown, is 32.6. The K 3 values
at the six wavelengths are summarized in table 5.
Table 4. Apparent molar absorptivities, em , of K2Cr20 7 solutions at 25 °C; pH = 2.9 (HCIO4)
K2Cr207Conc. e m 1/mol" 1 cm~'
mg/1
100.06
400.48
699.86
1000.27
390 nm 385 nm 380 nm 280 nm 275 nm 270 nm
589.2 748.7 865.1 1579.3 1718.6 1881.0
714.1 878.6 997.8 1758.2 1914.4 2069.8
806.2 973.8 1094.0 1890.0 2053.5 2208.0
875.9 1045.6 1166.5 1988.2 2161.5 2313.6
2.0
oI-<>
<oz<
0.8
0.4
FIGURE 6. Least squares determination ofK3 .
Table 5. K3 values at 25 °C as determined at several
wavelengths
X, nm
390
385
380
280
275
270
32.4
33.3
33.8
33.5
32.6
31.6
Avg. 32.9
Std. Dev. 0.8
Rel. Std. Dev. 2.5%
b. Absorption Spectra of HCr0 4 and C^Oy.The absorbances of three solutions containing nom-inally 20, 40, and 60 mg K2Cr207/l (pH = 3.0 ±0.1)were measured in a 10.00 mm cuvet at 5 11m incre-
ments over the wavelength range of 220-400 nm. Aclose approximation of e^CrOj) was obtained byextrapolating the apparent molar absorptivities to
zero chromium concentration. This extrapolation is
simplified since the variation of a is nearly linear overthis concentration range. Similar absorbance measure-ments were performed on three solutions containing1000 mg K2Cr20 7/l using a 1.023 mm cuvet and the
corresponding a value was calculated from eq (21),
with K3 — 32.9. The first approximations of 1/2*
e(Cr2Of) values were obtained by substituting the
extrapolated eCHCrO^) results and the above avalue into eq (20). The e(HCr04 ) and 1/2 • e(Cr207
=)
values were then refined bv successive approximations.The calculated absorption spectra of these two ions
are shown in figure 7.
250 300 350WAVELENGTH, nm
400
FIGURE 7. Absorption spectra of HCrO., and Cr 2Of.
c. Molar Absorptivities ofHCrCf and Cr2Of at
350, 313, 257, and 235 nm. As shown previously
in figure 4, the absorption spectrum of weakly acidic
solutions of K2Cr207 exhibit maxima at 350 and 257 nm
5

and minima at 313 and 235 nm. These maxima andminima do not shift significantly over the concentra-
tion range of 20-100 mg K2Cr207/l. This is con-
sidered a practical range for most applications since it
yields absorbances of about 0.1-1.5 for a 10 mm cuvet.
The molar absorptivities of HCrOj and C^Of at 350,
313, 257, and 235 nm were determined by the pro-
cedure described above and are given in table 6. Thee(HCrOj) values are estimated to be accurate to
± 0.5 percent. Because of the imprecision of the K3
determination, the uncertainty of the dichromatemolar absorptivity values may be as large as ± 5
percent.
Table 6. Molar absorptivities, e, of HCrO^ and Cr 20^at 25 °C
e, 1 mol-1 cm -1
350 nm 313 nm 257 nm 235 nm
HCrO; 1576 711 2100 1804
1/2 Cr 0= 1788 823 3156 2688' 2 7
Table 7 shows the agreement between the experi-
mental and calculated apparent molar absorptivities
for five concentrations of potassium dichromate in
dilute perchloric acid (pH = 2.92 ± 0.02). The experi-
mental values are the averages obtained on five
individual samples measured at each concentration.
The 95 percent confidence limits for any given set of
measurements was 0.1 percent. The a values used are
also given. These are seen to vary nearly linearly over
the range of chromium concentrations employed.
d. Optimum pH and Choice of Acid. Thechromium (VI) solutions used in this study were pre-
pared in dilute perchloric acid media having a pH of
about 3. This acidity was selected because the existing
equilibria data indicated this pH limited the formation
of either H 2Cr04 or CrOl to less than 0.1 percent of
the total Cr (VI) concentration. Perchloric acid waschosen instead of sulfuric to prevent the formation of
chromate-sulfate complexes. Tong and King [24] andDavies and Prue [25] noted slight differences in the
absorbances of dilute perchloric and sulfuric acid
solutions after correcting for differences in ionic
strength. They attributed these differences to mixedcomplex formation. More recently, Haight et al. [26]
have shown that the conversion of HCrOj" to CrSOf is
quantitative in 1 M HSO? solutions and that absorption
spectrum of this complex is significantly different fromthe HCrOj spectrum.
Because most of the previous work reported in
literature has been done in sulfuric acid, it was con-
sidered of interest to intercompare these two systems.
The results are shown in each acid between pH 2 and 3.
At 350 nm the results obtained in perchloric acid are
consistently 0.1-0.2 percent higher than in sulfuric;
at 235 nm, they are lower. The relatively large increase
in absorptivity at 235 nm at pH 1.90, together with the
above considerations, suggest the formation of addi-
tional chromium (VI) species in systems employing
dilute sulfuric acid solutions. (See table 8.)
e. Effect of Temperature. The absorbances of a
solution containing 60 mg K2Cr2 07/l in dilute perchloric
acid (pH = 3) were measured over the temperaturerange of 17 to 37 °C. The percentage change in absorb-
ance for wavelengths of 350, 313, 257, and 235 nm is
shown in figure 8. The results are uncorrected for
Table 7. Experimental and calculated values (E, C) of the apparent molar absorptivity of K2Cr207 at 25 °C;
PH= 2.9(HC10 4 )
em , 1 mol _1 cm" 1
K2Cr207 Cone.
mg/1 a 350 nm 313 nm 257 nm 235 nm
20.22 0.0090 E
CDiff.
1577.6
1577.9
-0.3
713.5
711.9
+ 1.6
2113.6
2108.7
+ 4.9
1814.7
1812.1
+ 2.6
40.09 0.0178 E
CDiff.
1579.9
1579.8
+ 0.1
713.3
713.0
+ 0.3
2120.8
2118.8
+ 2.0
1820.2
1819.7
+ 0.5
60.12 0.0262 E
CDiff.
1581.4
1581.5
-0.1
713.8
713.8
0.0
2127.2
2126.7
+ 0.5
1827.1
1827.2
-0.1
80.17 0.0344 E
CDiff.
1584.0
1583.3
+ 0.7
715.0
714.8
+ 0.2
2137.6
2135.3
+ 2.3
1835.8
1834.4
+ 1.4
99.92 0.0423 EC
Diff.
1585.5
1584.0
+ 1.5
715.6
715.0
+ 0.6
2144.0
2143.7
+ 0.3
1841.5
1841.4
+ 0.1
58

Table 8. Apparent absorptivities, a, of sulfuric andperchloric acid solutions of K2Cr207 at
25 °C; K2Cr207 cone. = 0.050 g/1
a, 1 g-1 cm -1
pH 350 nm 313 nm 257 nm 235 nm
H 2S0 4 1.90 10.71o 4.83, 14.444 12.43 7
1.98 10.71 2 4.83 9 14.44o 12.41 8
2.20 10.72 2 4.839 14.429 12.402
3.00 10.733 4.844 14.42 7 12.38,
HC10 4 1.99 10.72, 4.848 14.448 12.396
3.08 10.740 4.845 14.434 12.383
Table 9. Apparent molar absorptivity of potassiumchromate in 0.05 M Na2HP04 and 0.05 M
KOH at 25 °C
0.05 M Na2HP04
€m , 1 mol-1 cm-1
K2Cr0 4 Cone, '
M X 10s pH 373 nm 274 nm
7 9.2 482 7 3703
14 9.1 4820 369,
21 9.1 481 3 3692
0.05 M KOH
7 4830 3705
14 482 4 3698
21 481 4 369,
0.6
-0.8
1 1 11
•v.-V.
Vs. 31 3 nmNT***
1 \
1
^\350S257nmN. \.
1
N
J 1 1
235 nm1
15 20 25 30 35 40TEMPERATURE, °C
FIGURE 8. Change in absorbance with temperature for acidic
solutions of K2Cr20 7 ; pH = 3 (HC104 ).
thermal expansion of the solvent. The absorption
minimum at 313 nm exhibits the smallest temperaturedependence (— 0.02 percent per °C) while the maximaat 350 and 257 nm and the minimum at 235 nm havetemperature coefficients of — 0.05 percent per °C over
the range 20 to 30 °C.
f. K2O2O7 in 0.5 M Na2HP04 and 0.05 M KOH.To overcome some of the difficulties in handling
strongly alkaline chromate solutions, Johnson [27] hasrecommended dissolving K2Cr2 07 in 0.05 M Na2HP04
at pH 9. The apparent molar absorptivities obtained in
this medium and in 0.05 M KOH are given in table 9.
As seen from the data, both systems appear to exhibit
deviations from Beer's law of about three parts perthousand over the concentration range studied. Al-
though this deviation is the same magnitude and direc-
tion predicted from uncompensated internal multiple
reflections discussed previously, we have not been able
to demonstrate experimentally that such reflections
are responsible for the observed results. Studies in
which the cuvet windows are coated with various anti-
reflection layers are continuing however.
From a consideration of the equilibrium data, the
absorbances in the two systems should be nearly
identical. The ionic strength of the 0.05 M Na2HP04
is 0.15 and, from Neuss and Rieman's work [22], the
ionization constant for the reaction HCrOi = H+ + CrO 4
is approximately 9X10⁻⁷mol/liter. Thus, at pH 9.1,
only about 1 in 1000 chromium atoms is present as
HCrO?. Since this species is less absorbing than
CrOj at 373 and 274 nm, the apparent molar absorp-
tivities in 0.05 M Na2HP04 should agree with those
obtained in 0.05 M KOH to within 0.1 percent.
The absorbance of alkaline chromate solutions de-
creases with increasing temperature at both absorption
peaks. Between 17 and 37 °C, the temperature co-
efficient at 373 nm is — 0.09 percent per °C; at 274 nm,it is -0.06 per °C.
2. Potassium Nitrate. Aqueous solutions of potas-
sium nitrate exhibit a nearly symmetrical absorption
peak with \max at 302 nm. This system has beenstudied extensively by Vandenbelt [14] and by the
British Photoelectric Spectrometry Group in twocollaborative tests [28, 29]. Molar absorptivities re-
ported vary from 7.06 to 7.20 liter mol-1 cm-1. This
range of values undoubtedly results in part from the
fact that KNO3 solutions deviate significantly fromBeer's law.
Careful reexamination of this system has yielded
the following apparent molar absorptivities (table 10).
These are seen to decrease rather markedly with
increasing potassium nitrate concentration. Several
factors conceivably contribute to. this behavior. In
addition to possible multiple reflection effects already
discussed some ionic interactions are undoubtedly
possible in this system because of the relatively high
concentrations of solute required coupled with the
fact that the N — O bond in the nitrate ion has somepolar character.
The potassium nitrate used in the above study wasanalyzed for commonly encountered impurities. After
drying at 110 °C, the water content was less than 0.02
percent. Flame emission analyses [31] indicated the
following levels of alkali and alkaline earth impurities
59

(in parts-per-million): Li (< 0.2); Rb (13); Mg (0.2);
Ca (1); Sr(4) and Ba (< 2).
At 302 nm, the absorbance of KN03 solutions de-
creases with increasing temperature. Over the range
17 to 37 °C, the temperature coefficient is —0.14 per-
cent per °C.
Solutions stored for up to six months showed no
measurable change (=s 0.1 percent) in absorbance.
Edisbury [29] has cautioned, however, that some solu-
tions may develop bacterial whiskers on standing.
Sterilization may be effected by prior boiling of the
distilled water.
Table 10. Apparent molar absorptivity, em , of aqueoussolutions of potassium nitrate at 25 °C
em , 1 mol-1 cm -1
KN03 Conc.,M 302 nm
0.028 7.160
.056 7.14 2
.084 7.12 7
.112 7.106
.140 7.09,
a Spectral bandpass = 1.0 nm
i 3. Potassium Hydrogen Phthalate. High purity
potassium hydrogen phthalate (KHP) is readily availa-
ble. It is presently issued by the National Bureau of
Standards as a primary acidimetric standard. Its usein the preparation of buffer solutions of known pH is
well established. It has also been used as a spectral
standard in the comparative evaluation of spectro-
photometers [11, 32].
The absorbance of KHP solutions is dependent onacidity, as shown in figure 9. In the present study,
dilute perchloric acid solutions were employed to
minimize changes in ionic composition as a function
of pH. Acid concentrations much above 0.1 A' could
not be used because of the precipitation of potassiumperchlorate. Subsequently, all solutions were preparedto contain 10 ml of perchloric acid per liter with a
pH of 1.3.
Ringbom [21] has given the first ionization constant
of phthalic acid as 1.6 X 10⁻³ at 25 °C at an ionic
strength of 0.1. At the pH used, the absorbing systemconsisted of 97 percent phthalic acid and 3 percenthydrogen phthalate ions. Table 11 summarizes the
absorptivity values obtained on these solutions.
Absorbance decreases at the 275.5 nm maximum andincreases at the 262 nm minimum with increasing
temperature. Over the range 17 to 37 °C the tempera-ture coefficients are —0.05 percent and +0.05 percent
per °C, respectively.
Perchloric acid solutions of KHP (NBS-SRM 84g)
were examined for possible fluorescence, using a high
sensitivity spectrofluorometer. With 280 nm excitation,
a faint fluorescence was detected with A.max at approxi-
mately 350 nm. The possible effects of this fluorescence
on the absorbance data remain to be established.
WAVELENGTH , nm
FIGURE 9. Absorption spectra of KHP solutions at different
acidities.
Table 11. Apparent absorptivity, a, of potassium hydro-
gen phthalate in dilute perchloric acid
at 25 °C; 10 ml HC10 4/liter
a, 1 g_1 cm -1
NBS SRM 84g
Cone, g/1 275.5 nm 262 nm
0.034 6.332 4.494
.142 6.31 9 4.489
4. Cobalt and Nickel Sulfates and Perchlo-rates. Aquo cobalt (II) and nickel (II) ions have rela-
tive broad absorption peaks with A.max at 512 and 394nm, respectively (fig. 10). Solutions of either may serve
; .|
as useful absorbance standards. Most of the attention,
^to date, however, has been directed at cobalt sulfate
^which was first recommended by Gibson [1].
In this study, the apparent molar absorptivities of ;, f
Co(H20)^ 2 and Ni(H20)^ 2 were examined in sulfate and 1
perchlorate media. All solutions were prepared from i
the high purity metals by dissolution in H2SO4-HNO3[
or HCIO4-HNO3 acids. Nitrate was removed by I 1
repeated fuming until the acidity was reduced so that i
on dilution to volume, a pH of 1 could be obtained. The I
results obtained in the two acid media are given ini
Jit
table 12. The values in sulfate solution are signifi-j
cantly higher than in perchlorate media for both I
cobalt and nickel, suggesting that some complexation\1
4
of these ions by SO 4 or HSO7 has occurred. A differ- I >.
60

0.020
400 500WAVELENGTH, nm
600
Figure 10. Absorption spectra of Ni(H 20)+ 2 and Co(H 20)+2.
6 6
Table 12. Apparent molar absorptivities, em of acidic
solutions of cobalt and nickel ions
at 25 °C; pH = 1.0
Co Cone.
g/1
2.4
12.0
Ni Cone.
g/1
2.3
11.5
em (512 nm)1 mol~' cm-1
Sulfate Perchlorate
4.88,
4.869
4.803
4.79,
Cm (394 nm)
I moH cm-1
Sulfate Perchlorate
5.167
5.154
5.09 0
5.07,
ential spectrum of 0.2000 molar cobalt solution in
sulfate against the same cobalt concentration in
perchlorate media is shown in figure 11. In sulfate
solution, the formation of a second cobalt species with
\ max= 528 nm is indicated. Similar behavior was also
observed for nickel.
The absorbances of cobalt and nickel solutions at
their maxima are temperature dependent and increasewith increasing temperature. Between 17 and 37 °Cthe temperature coefficients are 0.18 and 0.14 percentper °C at 512 and 394 nm, respectively. To explaintheir nuclear magnetic resonance data on cobalt(II)
solutions, Swift and Connick [33] have suggested that
the octahedral Co(H20)6+2 complex is in equilibrium
with the tetrahedral Co(H20)| 2 complex and that for-
mation of the latter is favored by increasing tempera-ture. By analogy with halide complexes, the tetrahedra 1
AA0.010 -
400 500
WAVELENGTH, nm
600
FIGURE 11. Differential spectrum of cobalt sulfate versus cobalt
perchlorate; 10 mm cuvets; pH = 1.
configuration would be expected to be approximatelyone hundred times more absorbing than the octahedral
complex. A very small shift in this equilibrium couldresult in a relatively large change in absorbance andthereby account for the large temperature coefficient
of this system. The same explanation may also bevalid for nickel solutions.
C. Liquid Filters of Improved Optical Neutrality
Two approaches have been used in an attempt to
improve the optical neutrality and extend the wave-length range of liquid filters. One is based on the useof empirical mixtures, while the other employs water-
soluble, organic "black" dyes.
In 1946, Thomson [34] described the preparationof a grey inorganic solution consisting of chromic, cobal-
tous and cupric sulfates and potassium dichromate.This solution, however, does not transmit below 300nm. To extend the wavelength range farther into the
ultraviolet, a second exploratory solution (henceforthreferred to as the NBS composite) was prepared in
which the cupric and potassium dichromate compo-nents of the Thomson mixture were replaced by p-
nitrophenol. The absorption spectra of these solutions
are compared in figure 12 to a commonly used glass
filter (Chance ON-10). The NBS composite was pre-
pared in dilute sulfuric acid and had a pH of 1. Nofluorescence was observed under these conditions.
Over the range 250-600 nm, the NBS compositeexhibits several broad maxima and minima whoseabsorbances are less dependent on spectral bandpassthan the Chance ON-10 glass. Examples are givenin figure 13 at two wavelengths for each.
The possible use of either Thomson solution or
the NBS composite as an absorbance standard is
limited by two factors, both of which arise from the
presence of chromium (III) in these mixtures. First,
61

<
OCOm
1.0
0.5
I
CHANCE ON -10
THOMSON SOLUTIONNBS COMPOSITE
\
300 400
WAVELENGTH , n m500
Figure 12.
0.340
Absorption spectra of Thomas solution,
composite and a Chance ON-10 glass.
600
NBS
0.330
0.320
g 0.310oCOCD< 0.300
0.290 -
0.280
"1 T
ON-10 (445 nm)
0N-I0(560 nm)
NBS (460 nm)
I I
10 20 30 40 50 60
SPECTRAL BANDPASS, nm70 80
Figure 13. Variation of absorbance with spectral bandpass for
NBS composite and Chance ON-10 glass.
an initial "aging" of 6-8 weeks period is needed in
order to achieve adequate spectral stability at roomtemperature. Secondly, and even more critical for
our purpose, is that the absorbances of the agedsolutions exhibit a nonreversible temperature de-
pendence. They must therefore always be stored at
the temperature at which they were aged.
Hall and Eyring [35] have studied the constitution
of chromic salts in aqueous solution and have sug-
gested that during the aging process Cr(H 20)J3 ions
polymerize to yield species of the type
rH r
I (H 20)5Cr—O—Cr(H 2 0)5
J,
[(H 20) 4Cr
and
(H 2 0)5
H0—Cr(H 20) 4
-
H
r(H 20)„] +4
-O—Cr(H20)5
in which the observed increase in acidity is explainedby the formation of —OH bridges. Recent studies [36]
have shown that temperature, initial pH and the typeof anion present significantly affect the equilibriumcomposition. Although refluxing can reduce the agingperiod from several months to several hours, this is
of no practical advantage since the high temperatureproducts, on cooling, are no longer stable.
In addition to the investigation of empirical mixtures,
several water-soluble organic dyes have also beenstudied. Some typical absorption spectra are shownin figure 14. All of these dyes have high absorptivities
and the concentrations used were of the order of 50milligrams per liter.
<CD<X
o00<
0.5 -
-- NEOLAN BLACK- CIBALAN BLACK— ALIZARIN LIGHT GREY
\ LUXOL FAST BLACK L /\ NIGROSINE
..
200 300 400
WAVELENGTH , nm500 600
k
Figure 14. Absorption spectra of aqueous solutions of selected dyes.
Cibalan Black [37], Neolan Black [37] and Alizarin
Light Grey [38] were selected for further evaluation.
Aqueous solutions of these dyes were found insensitive
to pH over the range 2-9, not affected by heat and
relatively light fast. Solutions continuously exposed
to fluorescent light exhibited an absorbance change of
about 1 percent over a period of two months. Theseinitial results appeared sufficiently promising to
warrant purification and more extensive testing.
Members of the Organic Chemistry Section have
assisted in this effort. The purification of these dyes
has proven extremely difficult, however, and yields of
only a few hundred milligrams of each have been
obtained. Much larger quantities are needed if these
dyes are to be used as Standard Reference Materials.
More efficient purification procedures are presently
being sought.
D. Standard Reference Material (SRM) 931
The first liquid absorbance standard to be issued by
the National Bureau of Standards is SRM 931. TheI
preparation and certification of this Standard Ref-
erence Material are described below.
The filters were prepared by dissolving high purity
cobalt and nickel in a mixture of nitric and perchloric
acids. The weights of cobalt and nickel were chosen so
that the absorbances of their aquo complexes were
approximately equal at their absorption maxima.
The absorbance of nitrate was adjusted to a com-
parable level by evaporation and subsequent addition
62

400 500
WAVELENGTH, nm
600 700
FlCURE 15. Typical absorption spectrum of SRM 931.
of small amounts of nitric acid. The final pH of these
mixtures was about 1.
An absorption spectrum of a typical filter is shownin figure 15. The peaks at 302 and 512 nm are due to
absorption by NOj and Co(H 20)^ 2,
respectively.
The peak at 395 nm and the plateau at 650-700 nmare due to Ni(H 20)+ 2
.
The filters are supplied in 10 ml ampoules which
have been prescored for easy opening. An SRM unit
consists of three sets of filters, each set containinga "Blank" (0.1N perchloric acid) and three absorbancelevels of the filter. Each set is packaged in an individual
tray for added convenience.
The filters were calibrated by randomly selecting
ampoules from each lot. The certified absorbancesare as follows:
Table 13. Certification of NBS SRM 931
Net absorbance 3
Filter
Wavelength and (Bandpass), nm
302(1.0) 395(1.7) 512(2.0) 678(6.5)
"A' - 'Blank' 0.307 ±0.003 0.304 ±0.003 0.303 ±0.003 0.1 15 ±0.002
"B" -'Blank' 0.608 ±0.005 0.605 ±0.005 0.606 ±0.005 0.229 ±0.003
"C" - 'Blank' 0.906 ±0.007 0.907 ±0.007 0.911 ±0.007 0.345 ±0.003
a Net absorbances "A" — 'Blank,' "B" —'Blank,'
mm cuvets at 25.0 °C.
and "C"— 'Blank' were determined using 10.00
The uncertainties are given at the 95 percent confi-
dence level and include a possible systematic error of
±0.5 percent.
Absorbances are certified at 25.0 °C. Absorbancesat other temperatures in the range 17 to 37 °C may be
r' calculated using the formula:
A t= A 25[l + CA (t-2S)]
where: A t—Absorbance at temperature t (°C)
A25 — Absorbance certified at 25.0 °C
Ca — Fractional change in absorbance per °C
.11
The values of Ca at the four wavelengths are given
below.
A, nm CA
302 -0.0014395 + 0.0014
512 + 0.0018
678 + 0.0014
The absorbances of these filters will also depend on
the spectral bandpass used. To insure that the meas-ured absorbances do not differ by more than ±0.1 per-
cent from the true values, the effective spectral
bandpass should not exceed 1.5, 2.0, 3.3, and 8.5 nm at
302, 395, 512, and 678 nm, respectively.
IV. Conclusion
The availability of well characterized materials
from which the analyst prepares his own solutions is
preferable to the issuance of ampouled liquids.
Although the former are not as convenient to use, they
offer potentially greater accuracy because of their
better stability.
The potassium dichromate and potassium hydrogenphthalate used in this study are issued by NBS as
primary oxidimetric and acidimetric standards (SRM136c and 84g, respectively). The potassium nitrate is
presently issued as a thermal analysis standard
(SRM 756). A product of comparable purity may be
63

obtained by repeated recrystallization of reagent-grade
material from distilled water. The cobalt and nickel
solutions are best prepared from the high purity metals
which are commercially available.
To certify absorptivities for these materials, one
must resolve the question as to how well these systems
obey Beer's law. For acidic potassium dichromate, the
increased dimerization of HCrO^ to Cr2Of with
increasing chromium concentration primarily accounts
for the relatively large deviations observed. Withpotassium nitrate, one can only speculate that ionic
interactions are enhanced at the higher concentra-
tions. In neither instance are these deviations suffi-
ciently large to limit the usefulness of these materials
as liquid absorbance standards. Such deviations do
require that the absorptivity data be used with proper
precautions.
Additional studies are needed to explain the 0.2-
0.3 percent deviations from Beer's law obtained for
the various concentrations of alkaline chromate, po-
tassium hydrogen phthalate, cobalt perchlorate and
sulfate, and nickel perchlorate and sulfate. Althoughinternal multiple reflection effects appear to be of the
proper magnitude to account for these differences,
initial attempts to measure such effects with mag-nesium fluoride-coated cuvets have not been success-
ful. While extremely durable, magnesium fluoride
reduces reflections by about 50 percent and moreefficient coatings will probably be needed to resolve
this problem. If internal reflections are responsible
for the observed deviations, the absorptivity data
given should not be corrected when using liquid
absorbance standards for checking the accuracy of
the photometric scale since these reflections are
included in every measurement. However, in the
determination of molar absorptivity, which is con-
sidered a fundamental property of the material, ap-
propriate corrections should be applied. Until this
question can be resolved, it is recommended that
these materials be used at concentrations which yield
an absorbance of at least 0.5 when measured in a 10
mm cuvet. With this restriction, it is believed that the
uncertainty of the absorptivity data does not exceed±0.5 percent at the 95 percent confidence level.
The authors wish to express their appreciation to
Radu Mavrodineanu for providing the calibrated
Schott filters and to David S. Bright for performingthe computer calculations on the HCrOr/C^Ofequilibrium.
V. References
[1] Gibson, K. S., Nat. Bur. Stand. Circular 484 (1949).
[2] Harrison, G. R., M.I.T. Wavelength Tables (John Wiley & Sons,
Inc., New York, N.Y., 1969).
[3] Meehan, E. J., 'Treatise on Analytical Chemistry', Kolthoff,
I. M., and Elving, P. J., Editors, Part 1, Volume 5, Chapter 54
(John Wiley & Sons, Inc., New York, N.Y., 1964).
[4] Hardy, A. C, and Young, F. M., J. Opt. Soc. Am. 39 , 365(1949) .
[5] Eberhardt, W. H.J. Opt. Soc. Am. 40, 172 (1950).
[6] Broderson.S.J. Opt. Soc. Am. 44,22(1954).
[7] Hogness, T. R., Zscheile, F. P., and Sidwell, A. E.. J. Phys.
Chem. 41,379(1937).
|8] Perry, J. W., Photoelectric Spectrometry Group Bull. 3, 40(1950) .
[9] Slavin, W., Anal. Chem. 35,561 (1963).
[10] Poulson, R. E., Appl. Opt. 3,99(1964).
[11] Goldring, L. S., Hawes, R. C, Hare, G. H., Beckman, A. O.,
and Stickney, M. E., Anal. Chem. 25, 869 (1953).
[12] British Standard 3875, British Standards Institution (1965).
[13] Mavrodineanu, R.. Nat. Bur. Stand. (U.S.), Tech. Note 584,
178 pages (1971), O. Menis and J. I. Schultz, Eds.
[14] Vandenbelt, J. M., Forsyth, J., and Garrett, A., Anal. Chem. 17,235 (1945).
[15] Haupt, G. W., J. Opt. Soc. Am. 42, 441 (1952).
[16] Haupt, G. W., J. Res. Nat. Bur. Stand. 48, 414 (1952).
[17] Vandenbelt, J. M., and Spurlock, C. H., J. Opt. Soc. Am. 45,967 (1955).
[18] Gridgeman, N. T., Photoelectric Spectrometry Group Bull. 4,
67(1951).
[19] Ketelaar, J. A. A., Fahrenfort, J., Haas, C, Brinkman, G. A.,
Photoelectric Spectrometry Group Bull. 8, 176 (1955).
[201 Va.idenbelt, J. M., J. Opt. Soc. Am. 50,24(1960).
[21] Ringbom, A., Complexation in Analytical Chemistry, (John
Wiley & Sons, Inc., New York, N.Y., 1963), p. 294.
[22] Neuss, J. D., and Rieman, W., J. Am. Chem. Soc. 56, 2238
(1934).
[23] Howard, J. R., Nair, V. S. K., and Nancollas, G. H., Trans.
Faraday Soc. 54, 1034(1958).
[24] Tong, J., and King, E. L., J. Am. Chem. Soc. 75, 6180 (1953).
[25] Davies, W. G., and Prue, J. E., Trans. Faraday Soc. 51, 1045
(1955).
[26] Haight, G. P., Richardson, D. C, and Coburn, N. H., J. Inorg.
Chem. 3,1777(1964).
[27] Johnson, E. A., Photoelectric Spectrometry Group Bull. 17,505 (1967).
[28] Edisbury, J. R., Photoelectric Spectrometry Group Bull. 1.
10(1949).
[29] Edisbury, J. R., Photoelectric Spectrometry Group Bull. 16,441 (1965).
[30] Malitson, I., private communication.
[31] Rains, T. C, private communication.
[32] Ewing, G. W., and Parsons, T., Anal. Chem. 20, 423 (1948).
[33] Swift, T. J., and Connick, R. E., J. Chem. Phys. 37. 307 (1962).
[34] Thomson, L. C, Trans. Faraday Soc. 42 , 663 (1946).
[35] Hall, H. T., and Eyring, H., J. Am. Chem. Soc. 72 , 782 (1950).
[36] Burke, R. W., and Deardorff, E. R., Nat. Bur. Stand. (U.S.),
Tech. Note 544, 153 pages (1970), O. Menis and J. I. Schultz,
Eds.
[37] Ciba Chemical and Dye Company, Fair Lawn, New Jersey.
[38] Industrial Chemicals Division, Allied Chemical Corporation,
Buffalo, New York.
(Paper 76A5-733)
64

APPENDIX III
Standard Reference Materials:
Standard Quartz Cuvettes
For High Accuracy Spectrophotometry
R. Mavrodineanu
Analytical Chemistry Division
Institute for Materials Research
and
J. W. Lazar
Optical Physics Division
Institute for Basic Standards
National Bureau of Standards
Washington, D.C. 20234
U.S. DEPARTMENT OF COMMERCE, Frederick B. Dent, Secretary
NATIONAL BUREAU OF STANDARDS, Richard W. Roberts, Director
Issued December 1973
65
Library of Congress Catalog Number: 73-600200
National Bureau of Standards Special Publication 260-32
Nat. Bur. Stand. (U.S.), Spec. Publ. 260-32, 26 pages (Dec. 1973)
CODEN: XNBSAV
U.S. GOVERNMENT PRINTING OFFICE
WASHINGTON: 1973
For sale by the Superintendent of Documents, U.S. Government Printing Office, Washington, D.C., 20402
(Order by SD Catalog No. CI 3. 10:260-32). Stock No. SN 003-003-0 121 3-1. Price 55 cents.
66

CONTENTSPAGE
I. INTRODUCTION 1
II. EXPERIMENTAL 2
III. APPLICATIONS 6
IV. REFERENCES 17
LIST OF TABLES
Table No. PAGE
1. Radiation pathlength expressed in mm anddetermined on 17 quartz cuvettes made at NBS. ... 5
2. Radiation pathlength expressed in mm anddetermined on 10 quartz cuvettes made by acommercial manufacturer 7
LIST OF FIGURES
Figure No. PAGE
1. Fused silica material and parts used forconstructing the cuvettes for high- accuracyspectrophotometry . . . 11
2a. Standard instrument for measuring the thicknessof plates and length of quartz segments ...... 12
2b. Close-up of figure 2a 13
3. General shape and nominal dimensions (mm) ofNBS quartz standard cuvette for spectro-photometry 14
4a. General view of the standard instrument used tomeasure the radiation pathlength of cuvettes. ... 15
4b. Close-up of figure 4a 16
67

STANDARD REFERENCE MATERIALS:
STANDARD QUARTZ CUVETTES FOR HIGH ACCURACY SPECTROPHOTOMETRY
R. Mavrodineanu
Analytical Chemistry DivisionInstitute for Materials ResearchNational Bureau of Standards
Washington, D. C. 20234
and
J. W. Lazar
Optical Physics DivisionInstitute for Basic StandardsNational Bureau of Standards
Washington, D. C. 20234
Accurate knowledge of lightpath and parallelism ofcuvettes used in spectrophotometry is one of the in-dispensable parameters which must be determined whenaccurate transmittance measurements of liquid materialsis considered. A description is given of the designand techniques developed at NBS for the production ofquartz cuvettes having a nominal radiation pathlengthof 10 mm +_ 0.03 mm. For each cuvette the pathlength andparallelism are certified with an uncertainty of +_ 0. 0005mm. The method and instrumentation used to determinethese parameters is also described in the paper.
Key words: Cuvette, spectrophotometry; lightpath;pathlength; quartz, cuvette; radiation pathlength.
68

I. INTRODUCTION
True transmi ttance values can be obtained only when
using accurate measuring techniques and by taking into
consideration all factors which can affect and distort
the data [1]. Since transmittance is the ratio. of two
radiation flux intensities, it is necessary that the
photometric scale of the spectrophotometer used be
accurate. Other important conditions which must be
satisfied are: wavelength accuracy, use of adequate
spectral bandpass, use of collimated radiation, freedom
from reflections (interreflection),fluorescence, polarization,
light scatter, optical interferences, particulate matter.
Surface conditions and the temperature at which the
measurements are performed must be defined, and the material
subjected to measurements must be homogeneous (freedom
of strain) and stable.
When liquid samples are measured the pathlength of
the radiation passing through the solution must be
accurately known. This last condition is particularly
important, not only when accurate transmittance measure-
ments are contemplated, but also when the molar absorptivity
of a chemical species is sought. In these cases, an un-
certainty of 0.1 mm in a nominal radiation pathlength of
10 mm for instance, will result in an error of 1 percent
in the absorbance measurements, and, similarly, an un-
certainty of 0.01 mm will result in an error of 0.1 percent
absorbance. The object of the work discussed in this
paper is to describe the procedures developed and used
in the construction of quartz cuvettes having a nominal
radiation pathlength of 10 mm + 0.03 mm, parallelism
between the two transparent plates within 0.002 mm,
plate flatness of 2 to 3 fringes (mercury green line)
and parallelism of these plates within 0.002 mm over
the whole length of the plates.
69

Additional conditions to be met were free from
fluorescence and strain, and the use of fused silica of
optical grade.
The fulfillment of these specifications wouldpractically eliminate the radiation pathlength error when
absorbance measurements are performed at an uncertainty
level of 0.1 percent. Such an accuracy seems to be
at the limit obtainable *by the present state of the art
when measurements of absorbance are performed on liquid
samples, and include the errors of sample preparation and
handling, as well as the instrument uncertainty.
II. EXPERIMENTAL
Several designs were contemplated for constructing
quartz cuvettes which would satisfy the rather tight
specifications mentioned above. The technique illustrated
in figure 1 was finally selected, and was developed in
association with E. P. Muth of NBS Optical Shop, who also
made all the parts required for the cuvettes discussed in
this work. The final assembly was performed by E. I. Klein
from NBS Glassblowing Shop.
A rectangular- shaped fused-silica structure 48.0 mm
high, 13.5 mm wide and 300 mm long was used to make the body
of the cuvettes. Segments approximately 13 mm long were
cut from this material and ground and polished, using conven-
tional optical shop techniques, to produce a rectangular
segment 10 mm +_ 0.03 mm long. The rectangular edges of
each segment were finished to a flatness of 1 to 2 fringes
(mercury green line) , and at one end a small orifice was-
provided to permit air expansion during the assembly
operation.
The length of every segment was checked for accuracy
with a standard measuring instrument, illustrated in
70

figure 2a and b, capable of determining this length with an
accuracy of +_ 0.5 ym.
Two plates made of non-fluorescent fused silica 51 mm
long, 16 mm wide and 2 mm thick were ground and polished
in a similar manner to a width of 12.5 mm, a thickness
of 1.1 mm with a parallelism of 0.002 mm and a flatness
of about 2 fringes (mercury green line) as shown in figure 1.
These plates were checked for thickness with the instru-
ment illustrated in figure 2a, b and were attached to the
rectangular body by careful welding with city gas-oxygen
torch using a needle shape flame.
The top of the assembled unit was then cut to produce
a cuvette 43 mm high, and a rectangular fused silica block
of 6, mm was attached to the open end of the cuvette by
fusion. This block was provided with a standard tapered
opening with a diameter of 10 mm at the top. A standard-
taper Teflon stopper was used to provide tight closure of
the cuvette (fig. 1) . The cuvette was finished by
grinding the two side walls and bevelling the edges. Its
nominal dimensions are given in figure 3. The unit was
stress-released by proper annealing.
The cuvette was then measured to determine the radiation
pathlength and the parallelism of the unit. For this purpose
the instrument illustrated in figure 4a and b was used, all
measurements being performed at a temperature of 20° +_
0 o 05 °C. The measurements were made as described below.
The cuvettes were lightly clamped in a fixture which
was bolted to the table of a Moore No. 3 Measuring Machine*
The identification of commercial instruments and productsis given only to permit reproduction of the work described inthis paper. In no instances does such identification implyrecommendation or endorsement by the National Bureau ofStandards, nor does it imply that the particular equipment orproduct is necessarily the best available for the purpose.
71

and were adjusted until the two plates which define the
radiation path length were vertical within the limits of
their parallelism. An electronic lever type gage, with
a resolution of 0.125 ym was mounted on the spindle. To
reach the bottom of the cuvette, a longer lever was
fabricated and mounted on the gage. Use of the longer
lever required that a correction factor be applied to all
measurements which decreased the resolution of the gaging
system to 0.312 ym.
As shown in Figure 4b, a combination of gage blocks
and end plates were wrung together so that the distance
between the inside faces of the end plates was 10.0000 +_
0.0001 mm. The gage blocks were then positioned beneath
the center of the spindle and the gage lever was offset
from the center of rotation of the spindle so that when
the spindle was rotated 180° and the lever contacted' each end plate the meter readout of the gaging system was
at its null (zero) position.
The machine table was then moved to position the
cuvette beneath the spindle. The spindle was lowered
until the gage lever was at its first measuring position
inside the cuvette. The table was moved until the lever
contacted the face of the cuvette and the meter was at its
zero position. The spindle was rotated 180° until the
gage lever contacted the opposite side of the cuvette. The
meter reading multiplied by the correction factor plus the
nominal 10 mm path length gave the true pathlength at
that point. Measurements were made approximately every 4 mm
by lowering the spindle.
Seventeen quartz cuvettes were made and measured at
NBS according to the procedures described in this paper,
and the values found are presented in table 1.
72

-ac«
exo
eo
<4-l
co
oft
eo(-1
c
r-l
n)
CD
T3TO
e
CD
a) <u
5 <->
4->
t/> O+J >C D0) ueCD "4-1
o3i/> Ew oCD
Eo
o•H EJC o
M-(+J
CO EE
10
C cn?
o•H «+J to•H rH
O Ca, o
c oo c
•i-i
<-> jzcd +J
U -|H
•H S4-1
•rH DO4-> CC -Ha) is•3 C»H CD
O oo <N1 in r~- cn CO 00 cn cn o rH cno o ai o cn cn cn cn cn oo cn oo cn o o cn
03 o cn o cr> cn cn CTi CTi en cn ai cn o o CTI
oE—
<u o> iS3C_>
OO CO
cn o cn cn cn cn
to oo oo r~ cni
O r-~ i—
(
o cn ocd cn cd
cn cn cn cn cn cn
i—i lo cn i—i >o cn>* r- cn cn LO LO CO r- cn o o COcn cn cn cn cn cn CO cn cn CO cn o o cnCTi Cn cn Cn cn cn cn cn cn cn cn o o cn
cn cncncncncncncncncncncno
to co lo -a- cnooo
cncn
cncn
cncncn
oo cn oo lo ^3- i—ivocn
cn cn cn
cn eg r- r~ LO oo o o COcn cn cn CO cn cn oo cn o o cncn cn cn cn cn cn cn cn o o cn
cn cn cn cn cn cn cn cn o o cn
to lo cni
o cno cn
co cd cn cni to i—4voolocncn
cncn
cn cn >* CNI vO \o cn o o r-cn cn cn cn oo cn cn CO cn CD o a>cn cn cn cn cn cn cn cn cn o o cn
Kl W N N NOO cn
cno cncd • cn
cncn
o 00 rHo cn o cno cn o cncncn
h t M rN ocncncn
o cno cncncn
cn cn o cn
cn oo o locn cn o cncn cn o cn cn
cncncn
[ CD LOcn o cncn o cn
oo m t N NCO C* LOcn cn cn cncn cn cn cn
cn cn cn cn
i-i lo r-. ooo r-~ cn vocn cn cn cncn cn cn cn
cn cn cn cn cn
eg o ooCOcncn
t-~. o vocn o cncn o cn
00 co co co» N CO CO1 Oi Ci cn% cn o cn
cncn
cn cn
cn cn cn cn cn cn cn cn cn o o cnrH rH
i-H r- r-. to to cncn cn -a- i-H co t^ LO cn O O \ocn cn cn cn CO cn cn 00 cn o o cncn cn cn cn cn cn cn cn cn o o cn •
a>
cn cn cn cn cn cn cn cn cn o o cn orH rH c
n)+->
rH i-H LO LO to rH to to cn (Xcn cn r-- i—i CO o cn o O VO <Dcn cn cn cn oo cn cn CO cn o O cn Ocn cn cn cn cn cn cn cn cn o CD cn (J
cd
cn cn cn cn cn cn cn cn cn o O cnrH rH rl
oi—i oo r» LO to cn co CNl CO vO
cn oo ^J- i—
t
cc t-^ CO 00 cn cn vOcn cn cn cn CO cn cn OO cn cn cn cn ocn cn cn cn cn cn cn cn cn cn cn cn <>H
cn cn cn cn cn cn cn cn cn cn cn cn <Ho
-3- i-H tvi r»- i-H i—i rH (NJ rH to vO. wCO CO i—i cn CO cn cn o vdcn cn cn cn CO cn cn CO cn cn o cncn cn cn cn cn cn cn cn cn cn o cn +J
•Hcn cn cn cn cn cn cn cn cn cn o cn 6
rH •H
rH LO CNl o cn i-H rH CO rH to CDCO i-H oo CO cn cn cn vOcn cn cn cn CO cn cn CO cn cn cn cn +->
cn cn cn cn cn cn cn cn cn cn- cn cn
cn cn cn cn cn cn cn cn cn cn cn CD
4J
oX
-3- vO o to CO i-H rH co oo tovo LO o i-( CO CO cn t-~ CO cn VO
cn cn cn cn CO C7> cn oo cn cn cn cn tn
cn cn cn cn cn cn cn cn cn cn cn cn cu
•fj
cn cn cn cn cn cn cn cn cn cn cn cn 4->
CD
>o to o CO CO CO rH CO to 3LO LO vO CNJ oo cn r-~ CO CO O
cn cn cn cn CO cn cn oo cn cn cn cncn cn cn cn cn cn cn cn cn cn cn cn CD
VI
cn cn cn cn cn cn cn cn cn cn cn cn CD
rC+->
r- o vO co «3- •3- o LO *3- CO ooo "J- LO to oo co o CO co vOcn cn cn cn oo cn cn cn cn cn cn cn ocn cn cn cn cn cn cn cn cn cn cn cn <4-l
cn cn cn cn cn cn cn cn cn cn cn cn 3CD
cHrH In. vO \o •>3- \o co 00 cd
cn LO \o LO LO OO cn rH r-- CO oo \o +-)
cn cn cn cn CO cn cn cn cn cn cn cncn cn cn cn cn cn cn cn cn cn cn cn o
cn cn cn cn cn cn cn cn cn cn cn cn in
CD
3«>
« « «vO oo cn o rH to <* to VD CD
CS1 CNJ «N1 CNJ CNl CNl CNl rC
73

From these data it can be concluded that only three
of the 17 cuvettes, or less than 18 percent of the NBS
cuvettes, were below the specifications established for
acceptance
.
The same measurements were performed on 10 quartz
cuvettes of commercial origin. The results assembled in
table 2 show that only 4 of the 10 cuvettes were acceptable
by the standards established in this paper, which indicate
a rejection of 60 percent. It must be noted, however, that
9 of 10 cuvettes were within the specifications of the
manufacturer which indicate a tolerance of nominal light-
path of 10 mm +_ 0.01 mm.
III. APPLICATIONS
As a result of these measurements, it was decided to
produce at NBS a number of quartz cuvettes, identical
to those described in this work, and to certify them
for radiation pathlength and parallelism. These cuvettes
would then constitute a Standard Reference Material (SRM)
in spectrophotometry, and be made available to the public
as SRM 932. Each cuvette will have a certificate of
calibration of which a reproduction is given here.
74

pj
O4-> i—
1
rH o oo to to CNl
i i+—
'
l j CD CD r* jvHtu
o rH rH o rH rH rH o rH orH o O O o O O O o O ofH (—
1
p^i p~) p^ p^) p~) ( ) rnLJ p^ fH,
( , j 1p_{
t | p_
|
__j
rH1 )+H
•H oo rH to to to CNl CNl LOi
NOI J to LJ 1 rn OO \T LaJ
' | | rH p~) rH p-) CNJ p^) rH p~^
o
.
CTi f—
a
p~) p~~) p^ p~j p~) p~) P^ p~)
(—
1
tr\ d 1U] tU p; •t: • p~) p~) P*^ p~) (—
)
f—
i
CD rnLJdl flltu tU o dit_^ tu rH rH rH | j p_j rH rH flltu
+-* ,5. rH LJJ J J 1 U_j i> (—*HCL) 0 (11 OO CO to OO to CNl ctJ
^ pi -MJ . j vO L-O l J p^ [-^ CO °^ CO ii^—
'
H.J fH iHf CsJ rH rH rH rH rH p~-) rH Q pi
LJ LJ cc f~^ pj) pj) PJ^ p~) pj^ p~) f—
)
p-) p~^l d itu
CD r iLJm p?isj p; Lj U—lrH Ti PJ} CD (
—
) PJ) p~) pjj p~) (—
)
pj~) PJ^ f jLJrrt r~i
1 rH t | P^j 1 p_j ,I p_( rrj
(. p\M lJ i i
t—
'
rrt U_JtO T< tn p: (.HH Cj.—> rH oo CO CO CO CO pitun- diLJ tU T—
'
rH \LJ \LJ CNl ry*>WJ lO ^—
)
fHp» fl 1 J i J _j p*1 rH CD rH p~j
j
1rHp-> rrH r~1 f—
j
p^) ^—
)
CD p~j p^) p~^ p~) rHturH CD rrt Qto '
dltu
t~4 9 c-.P. fPj p_j p^ P^> P^j CD' Q fH •H
)—1 tO L.U cSPJ ,
(,—j
( j p_( p_| P_^ rH p_f L|_)
Pi olj u di (~itu W •HM H r iLJ
LJ HH 1—
J
CD OO LO f*T\LJ ) to CNl LO to flltud i p1 rvi rH vO LO NO
I ) LO CTi vPi^U \ HLLJ tu 1rH p,
V-» tu p!P; r^ IrH L_*> rH L_J rn rHLJ CHLJ rH CO
'1—1 p; tn p: vO f—
j
P3 pj2 pj^ Pjj p^ CD pjj
S ^ w If)
fH rvi p~) pj-i p^ p~) pj~) p*~) p~) PJ-^ P*^ 4-*
tU ,J flltl>* rH ( P_j _J p__|
j P_j •H4-* C/) C/l PJ ^p; p:
ill rrt flltU tO tU CD CD •Hrrj 0 ,!_) Lj i—JfH r-i 00 oo p^ P_j CNl to rH
p: rrtPI TO f—
^
l-O \T to rnLJ vH vO LJ )
TJ r—
1
f fl fHt/j . rH rH rH rH rH CD O CD CD
c* di PiH LJ i-H rrt Pito w (—
)
pj-j C—
^
P^ p^ P~) pjj CD rnLJ p^) fH
rrt H CD 'rH 4-*
p: a_)P; +-J P3 p-j p-j p~) p~j p^ p^j p~)
p; h • i-i j t ) p_I yJ p_I rH p_) rriLJ
p! (11P; ^ f-1
r/i(— i t* j
flltu• LjH flltu
H L-i rrtt—I H tO vPi to i fiLLJ CO LO CNl f 1LJ
n tu >—m fH[ LO LO to LO CTi to 00 \ f™iUJ CO "J
rS
Jh (/)fH rH rH CD rH CD rH CD CD CD d ltu
LJ ,J t—
i
I) p~) p^ p^j p~) (—
)
P^j rnL_J p-|j (-—
)
rnLJd i j_j rrttu t—' to j ) t|_j V)r/\ 11 * ,w J LJ rH rrt >to ^ pjj) p-~) p~-) p~) p~) (—
)
P*^ rnL—
'
p^ p^ flltufa rrt ' *t/j to H
—
,—
1
rH rH p_-i p_| .
( p_( rH . JI )
f ri ri/1 j >
Lj h niM ,j tu l-l t—
1
d ituO H fH f~1 . 1—
J
CN] L-O CT> en to p_) CD CO r-*
V rrt J_)rS to ' \0 O") to tu 00 Hi-J
(11 p:tU p;1 1 fH
1 p^ p_j rn rn '
—
> CD p~^ (J1 1 .T1 rH CD to p^ p^ P1~) LJ CD rHL_J rnLJ CD fH
f"' r—1 PIr1—i >i LJ d 1tuj ) rrt p~) p~) CD p^j P~) rnt_j rHL_J rn CD rnLJ If)
, p-j rv rH rH rH p_I rH p_| P^ 1 rH rH CDfH f i nih U W rrtto fHhHW n u 1 1 ] j >
j CD to* PI PIL/ M-t \ piMj \j LJ ) LO rnLJ CNl p~>
H—i K ^H t—
'
p-^ rv~iL*J LO i ; vO CTi LO \Htu CNl p~^ c.fHi cp
+-* P;fH J_J
1rH rH pjU rH CD I—
1
rn<-J CD rH p.LJ
cti O rH LJ p^i p^> pj^ P^i fH
—
1p-) p~-) p^j p^ M-f
O f 1 rrtt—M <J to •r-l p;
t—
t
LJ pjj ^—
)
CD rnL_J P^j p*~) Pjj pj5 LJd rrt Lj>_, to M rrt S_itu M rH . j P_j p_
j. jrH rH jrH rH p_j dltu
pi riiLJ tu f 1 ti—
J
LJ ^tH fH1H
•f~1 +H rH *rH
T-' ^1—> f—
i
U-l p:^h p- 00 «H-^-tJ rH CNl tO OO cri
tp_iM p;^—
j
fx] .—;- LO v pivu P_j CTi t 1SH• rH CD j j or-H P_j (—
)
rH rn . j PJ-) LJ (—
)
r~\
(H o o o o o o o o o o o orrt rrtto to t-^—i
fl 1tu r__i
ry; H jj n—i i iLJ H—
'
p~) f
—
) rnL_J p^> rnL_J p~^ rnLJ p~^
, JfHj p_l p_I rH rH p_l P_j pj dituHH
rHCn] (11tu rrtTO
i 1T—
'
r*CD •
i—
1
CD o * * * 4: 4< CD
rQ > rH CXI LO oo o H^o5 rH HH lJ
75

National Bureau of Standards
CERTIFICATE
STANDARD REFERENCE MATERIAL 932QUARTZ CUVETTE FOR SPECTROPHOTOMETRY
R. Mavrodineanu and J. W. Lazar
This Standard Reference Material is intended as a
reference source when production of accurate spectro-
photometry data on liquid samples is considered. It
consists of an all-quartz rectangular cuvette designed
to fit the holder of conventional spectrophotometers. It
is provided with two optically transparent and parallel
windows defining a nominal radiation pathlength of 10 mm
+_ .03 mm. The inner surfaces of the windows are parallel
within .002 mm. The pathlength and parallelism are
certified with an uncertainty of +_ 0.0005 mm as determined
by measurements at positions equally spaced 2 mm from the
bottom to within 6 mm of the stopper top. These measure-
ments are made at 20 °C, and the distance between each
position is about 4 mm.
Position ofMeasurement
RadiationPathlength, mm
Bottom
Top9
8
7
6
5
4
3
2
1
9.9999.99910.0009.999
10.0009.9999.9989.9989.9989.9979.997
76

The general shape and nominal dimensions of the
cuvette are illustrated in the figure.*
The cuvette must be handled with great care and should
be held only by the frosted quartz side windows. When not
in use, it should be stored in the container provided for this
purpose. Extended exposure to laboratory atmosphere and
dusty surroundings is to be avoided.
The overall direction and coordination of the technical
measurements leading to certification were performed under
the chairmanship of 0. Menis and J. A. Simpson.
The technical and support aspects involved in the
preparation, certification and issuance of this Standard
Reference Material were coordinated through the Office
of Standard Reference Materials by T. W. Mears.
J. Paul Cali, ChiefOffice of Standard Reference Materials
Washington, D. C. 20234
March 1, 1973
*Note : This figure is identical with figure 3 of this paper.
77

The cuvette was designed and produced at the National
Bureau of Standards by special techniques and from non-
fluorescent optical -quality fused silica. The transparent
windows are attached to the body of the cuvette by direct
fusion, and the unit was strain-released by proper
annealing. The overall flatness of the transparent windows
is within two fringes (546-nm Hg line) , and their parallelism
is within two micrometers. The radiation pathlength measure-
ments were performed before and after the assembly of the
cuvette using electronic feeler- gage type instruments
capable^ of a resolution of 5 parts in 10 . SRM 932 is a
result of the combined efforts of the Analytical Chemistry
Division, Institute for Materials Research, the Optical
Physics Division of the Institute for Basic Standards,
and the Instrument Shops Division.
E. P. Muth and E. I. Klein designed and assembled the
cuvette respectively. The radiation pathlength measure-
ments were performed by E . G. Erber.
SRM 932 was developed to meet the needs expressed by
the Standards Committee of the American Association of
Clinical Chemists under the chairmanship of George N. Bowers,
Jr., M. D., Hartford Hospital, Hartford, Connecticut.
This work was initiated and performed with the approval
and encouragement of 0. Menis, Section Chief, Analytical
Chemistry Division.
78

u
u
uuai
A
uO
CO
cu+->+->
cu
>
oCD
5
ti•1-1
+->
oE3
U+jco
aOu
uo
T><D
co
co4->
a
arj
i—
i
nj•r-l
14
CD-(->
nJ
a
nj
CO
(1)
CO
CD
• i-f
-l->
CD
O+>o
Cuo4-»
oCD
aCO
79

80


K 10—
«
II
J
t-A$—h 10 k-
/r
RADIATIONPATHLENGTH"
1.25"
7V6
12.5 k
i!
TOP
SIDE
48(FROSTED)
FRONT(TRANSPARENT)
BOTTOM
6
k—
z
i_TOPMEASUREMENTLEVEL
.25
I k-io -H-H I 12.5 I
L_i2
I
BOTTOMMEASURMENTLEVEL
I I
r12.5
1_INCIDENT RADIATION BEAM
Figure 3. General shape and nominal dimensions (mm) of NBSquartz standard cuvette for spectrophotometry.
82

Figure 4a. General view of the standard instrument usedto measure the radiation pathlength of cuvettes.
83


IV. REFERENCES
Mavrodineanu , R. , An Accurate Spectrophotometer for
Measuring the Transmittance of Solid and Liquid
Materials, J. Res. Nat. Bur. Stand. (U.S.), 76A,
405-425 (1972).
Clarke, F. J. J., High-Accuracy Spectrophotometry, J.
Res. Nat. Bur. Stand. (U.S.), 76A, 375-403 (1972).
Mielenz, K. D., Physical Parameters in High-Accuracy
Spectrophotometry, J. Res. Nat. Bur. Stand. (U.S.), 76A,
455-467 (1972)..
Burke, R. W.,Deardorff, E. R. and Menis, 0., Liquid
Absorbance Standards, J. Res. Nat. Bur. Stand. (U.S.), 76A,
469-482 (1972).
Burnett, R. W. , Accurate Measurement of Molar
Absorptivity, J. Res. Nat. Bur. Stand. (U.S.), 76A,
483-489 (1972).
a U. S. GOVERNMENT PRINTING OFFICE : 1973— 5^2-651/94
85

mm

APPENDIX IV
JOURNAL OF RESEA RCH of the National Bureau of Standards—A. Physics and ChemistryVol. 80A, No. 4, July-August 1976
Acidic Potassium Dichromate Solutions as
Ultraviolet Absorbance Standards*
R. W. Burke and R. Mavrodineanu
Institute for Materials Research, National Bureau of Standards, Washington, D.C. 20234
(May 18, 1976)
The absorbanees of five concentrations of potassium dichromate in 0.001 M perchloricacid have been determined at eight wavelengths in the ultraviolet on the National Bureauof Standards Institute for Materials Research high-accuracy spectrophotometer. Four of thewavelengths—235, 257, 313, and 350 nm—correspond to absorbance maxima or minima in
the HCr04~ spectrum and are useful wavelengths for checking the accuracy of the absorbance
scale of narrow bandpass spectrophotometers. Although partial dimerization of HCr04
~
to Cr207= produces small positive deviations from Beer's law at these wavelengths, the ap-
parent absorptivities calculated for each concentration are reproducible to one part in athousand. The estimated uncertainties in the absorptivity values are ±0.7 percent at 0.1
absorbance (A) and ±0.2 percent near A = l. These uncertainties include all known sourcesof possible systematic error and the 95 percent confidence level for the mean. The remainingfour wavelengths used for measurement are near two predicted isosbestic points in theHCr0 4~/Cr2 07~ spectra. The absorptivities at 345 nm are sufficiently independent of con-centration that this wavelength can be used for checking absorbance linearity to one partin a thousand over the range ^4 = 0.2-1.
Key words: Absorbance linearity; accuracy; acidic potassium dichromate solutions; calibra-
tion of ultraviolet spectrophotometers; liquid filters; transfer standards; ultraviolet absorb-ance standards.
I. Introduction
At present, there are no certified standardsvariable from the National Bureau of StandardsS'BS) for checking the accuracy of the absorbance;iale of spectrophotometers throughout the ultra-violet. The number of analytical applications inlis important region of the spectrum, however,mtinues to increase relatively sharply and theJed for such standards is becoming increasinglylute.
The area with perhaps the most serious need fortraviolet absorbance standards at the moment is
inical chemistry. Workers in this field, for example,equently use molar absorptivity as an index ofirity of their biological standards. Only recently,urnett [1]
1 has discussed the importance of ac-lrate molar absorptivity measurements in theinical laboratory. He especially emphasizes the3ed for spectrophotometry accuracy in clinical
lzymology. Not only must the molar absorptivitythe substrate or enzyme-catalyzed reaction
"oduct be known accurately but also the individualJsorbance measurements on the test sample must5 accurate. This dual requirement for accuracy
'This work was supported in part by the National Institute of Generaltdical Sciences.: Figures in brackets indicate the literature references at the end of this paper.
in this instance arises because high-purity and well-
characterized enzyme preparations are not yet
routinely available for use as standards.
A program has been under way at NBS in the
Institute for Materials Research (IMR) since 1969
for the development and issuance of visible andultraviolet transfer standards for use as Standard
Reference Materials (SRM's). Two such standards
are currently available: (1) SRM 930, consisting of a
set of three neutral Schott NG glass filters and (2)
SRM 931, an empirical inorganic solution available
at three concentrations in 10-ml ampoules. Neither of
these SRM's meets the present needs for absorbance
standards in the ultraviolet. The glass filters do not
transmit below about 350 nm while the inorganic
solution is certified only at one wavelength in the
ultraviolet (302 nm) and with an uncertainty of ± 1
percent. Transfer standards capable of being cer-
tified throughout the range of 200-350 nm and with a
smaller uncertainty are being investigated, however.
The most promising solid filter at the moment for
this purpose is the metal-on-quartz type. Somerecent experiences with this filter are discussed in the
paper immediately following [2]. Of the chemical or
liquid-type filters that have been proposed, the
weakly' acidic potassium dichromate system is
considered the best. A critical evaluation of this
S3rstem, as well as several other candidate materials,
was presented in a previous paper [3].
214-427 0-76-6

In this paper, we present absorptivity values for
five concentrations of potassium dichromate in
0.001 M perchloric acid. These concentrations effec-
tively span the absorbance range of A— 0.1-1.5
when measured in 10 mm cuvettes. The absorptivi-
ties were calculated from transmittance measure-ments at eight wavelengths in the ultraviolet on the
IMR high-accuracy spectrophotometer. Four of the
wavelengths—235, 257, 313 and 350 nm—correspondto absorbance maxima and minima in the HCr04
-
spectrum and are iiseful wavelengths for checkingthe accuracy of the absorbance scale of narrowbandpass spectrophotometers. Although partial di-
merization of HCr04~ to Cr20 7
= produces small posi-
tive deviations from Beer's law at these wavelengths,the apparent absorptivities calculated for each con-centration are reproducible to one part in a thousand.The estimated uncertainties in the absorptivity
values are ±0.7 percent at 0.1 absorbance (A) and±0.2 percent near A=l. These uncertainties includeall known sources of possible systematic error andthe 95 percent confidence level for the mean. Theremaining four wavelengths used for measurementare near two predicted isosbestic points in theHCr0 4
_/Cr20 7
=spectra. The absorptivities at 345 nm
are sufficiently independent of concentration thatthis wavelength can be used for checking absorbancelinearity to one part in a thousand over the rangeA=0.2-l.
II. Experimental Procedure
The potassium dichromate (K2Cr20 7) used in this
study was a special lot of analytical reagent gradematerial obtained from the J. T. Baker ChemicalCompany. 2 Drying studies performed at 105 °Cindicated that the surface moisture of this materialwas less than 0.01 percent. No measurement of
possible occluded water was made. HoAvever, arecent paper [4] by Yoshimori and Sakaguchi hasshown that K2Cr20 7 typically contains 0.01 to 0.02percent occluded water which can be removed onlyby crushing and drying at 350 °C.
Coulometric assay of the undried potassiumdichromate gave a purity, expressed as an oxidant,of 99.972 ±0.005 percent at the 95 percent con-fidence level. Emission spectroscopy indicated thatthe only significant elemental impurities presentwere sodium and rubidium. Their concentrationswere estimated to be 0.02 and 0.03 percent,respectively.
The concentrations of the K2Cr20 7 solutions usedthroughout this study are expressed on a weight/weight basis. Milligram samples of K2Cr20 7 wereweighed to the nearest microgram on a microbalance.After dissolution in distilled water shown to be freeof reducing impurities (see Discussion), 1 ml of 1 Mperchloric acid was added and the solutions were
1 In order to describe materials and experimental procedures adequately, it isoccasionally necessary to identify the sources of commercial products by 1hemanufacturer's name. In no instance does such identification imply endorsementby the National Bureau of Standards, nor does it imply that the particularproduct is necessarily the best available for that purpose.
diluted approximately to volume in 1 -liter voir'
metric flasks. Each flask was fitted with a doubl<ribbed Teflon stopper (Kontes Glass CompanyVineland, New Jersey) to prevent evaporation. Thweight of each solution was determined on a single
pan top-loading balance having a sensitivity of 0.01£
NBS-calibrated weights were used to establish th :
accuracy of the balances. The concentrations of th
solutions were then calculated after correcting a
weights to vacuum. A solvent blank was prepared b
diluting 1 ml of 1 M perchloric acid to 1 liter witij
distilled water.The Institute for Materials Research high
accuracy spectrophotometer was used for performinthe transmittance measurements. which, in turn, weiconverted to absorbance. The design and construt
tion of this instrument have been described in detaby one of us (RM) in reference [5] and will not b]
repeated here. Similarly, the quartz cuvettes use
are also of NBS design and construction and ha\been described previously [6]. These cuvettes ai
currently available through the NBS Office <
Standard Reference Materials as SRM 932. Eaccuvette is certified for path length and parallelism t
±0.0005 mm.Prior to use the cuvettes were cleaned by soakir
in concentrated (18 M) sulfuric acid for several hourIn order to minimize the heat of mixing, they wei
then transferred consecutively to 12, 6 and 3 i
sulfuric acid before rinsing with distilled water. Afti
rinsing thoroughly, the cuvettes were air-dried undi
an inverted Petri dish that served as a dust-protecti^
cover.
For sample measurements, five calibrated cuvetti
were placed in separate holders in the rotatin
sample compartment [5] of the IMR high-accuracspectrophotometer and a reference filter (incone
on-quartz) was placed in a sixth position. Tl
cuvettes were left in their respective holders f(
the duration of the experiment. All transmittanci!
absorbance measurements were made relative t
air in a temperature-controlled room at 23.5 ±0°C. The transfer of solvent blank and sample soh
tions to and from these cuvettes was made by meaiof borosilicate, Pasteur-type, disposable pipette
After being rinsed with the test solution, a fin
transfer for measurement could be made in 10-1
seconds, after which time the cuvette was immdiately stoppered with a snugly-fitting Teflc
stopper.
Six sets of solutions having nominal concentr;
tions of 20, 40, 60, 80 and 100 mg K2Cr20 7/l
were prepared. Each concentration within a si]
was measured a minimum of six times at the eigl
wavelengths of interest. The absorbance, A= — icj
(^sampie/TBiank), was computed for each wavelengl
and concentration from the average of the s
transmittance measurements (T). Absorptiviti
were then calculated after correcting the absorbancfor systematic errors due to cuvette path lengt
beam geometry and internal multiple reflection
No correction was applied for the reflections di
cussed by Mielenz and Mavrodineanu [7] fro
88

internal components such as the lenses and slit
jaws because these are adequately compensatedfor by the blank. A detailed account of these correc-
tions and calculations will be given in an NBS 260
Special Publication which is now in preparation.
III. Discussion and Results
The ultraviolet absorbance spectrum of a 40 mgkg
-1solution of potassium dichromate in 0.001 M
perchloric acid is shown in figure 1. The four wave-lengths selected for certification of absorptivity of
this absorbing system, namely 235, 257, 313 and350 nm, are also indicated. The maxima and minimaare sufficiently broad that serious restrictions are
not placed upon instrumental spectral bandwidthrequirements. The half bandwidths of the 257 and
1 350 nm peaks, for example, are approximately 601 nm so that an instrumental spectral bandwidth of
3 nm or less is sufficient for obtaining at least 0.999
'of the maximum peak intensities.
1.0I i i
K2Cr
2 0 y= 40 mg/kg
257
I
350
i
\ 313 / \
i i
250 300 350
WAVELENGTH, nm
Figure 1. Absorbance spectrum of K 2Cr20 7 in 0.001 M per-chloric acid.
The first experiment performed on the IMR high-accuracy spectrophotometer was the determinationof the rinse behavior and reproducibility of thetransmittance/absorbance measurements of the sol-
vent blank. In the initial studies, measurementswere made at 235 nm only, since any problemsassociated with the transfer of solution were expectedto be the greatest at the shortest wavelength used.The results obtained for the five cuvettes employedare shown in figure 2. All exhibit a similar rinse
pattern, attaining a minimum and constant absorb-ance value after 5-6 rinses (the term rinse as usedhere and throughout the remainder of this paperrefers to the exchange of one cuvette volume for asecond one). Once the blank measurements were incontrol, similar absorbance measurements werethen made on the first series of K 2Cr207 solutions.Five concentrations having nominal concentrationsof 20, 40, 60, 80 and 100 mg K 2Cr20 7/kg weremeasured. Table I summarizes the results of these
measurements together with the final solvent blankvalues for 235 nm. The cycle of measurements shownhere was then extended to the other seven wave-
4.90 1
1 2 3 4 5 6 7
NO. OF RINSES
Figure 2. Apparent absorbances of the blank solvent in the five
curvettes used—Nos. 14, 16, 18, 25, and 26 ref. [6].
Table I. Reproducibility of absorbance measurements at 235 nm for a cycle of solvent and sample runs
Solvent Sample Sample SolventCuvette No.
After 5 rinses After 5 rinses After 7 rinses After 5 rinses
14 0. 05198 0. 30128 0. 30141 0. 0521316 . 05099 . 55052 . 55057 . 0509318 . 05310 . 80066 . 80074 . 0532125 . 05002 1. 04863 1. 04855 . 0502226 . 05064 1. 30351 1. 30333 . 05065
Ref. filter «. 55913 . 55925 . 55936 . 55922
° Inconel-on-quartz.
89

lengths of interest. In all, six sets of K2Cr 20 7 solu-
tions were measured. Typically, two volleys consist-
ing of three transmittance/absorbance measurementswere made on each of the 30 solutions. The first
volley was made after rinsing the cuvettes, initially
containing solvent, with five rinses of sample andwas repeated again after two additional rinses.
Since no systematic increase in absorbance was everobserved when the results of the first volley of
measurements were compared to the second, the six
measurements were invariably averaged. The ab-
sorbances were obtained by subtracting the solvent
blank values from the sample readings. After apply-
ing appropriate corrections for beam geometry andinternal multiple reflections, the corrected absorb-ances C4 corr) were used to calculate the desired
absorptivities, using the relationship
Absorptivity=^4 corr/6c,
where b= internal light path in cm and c= concentra-tion of K 2Cr20 7 solution in g kg -1
. The absorptivities
computed for the five concentrations of K 2Cr207
solutions used are summarized in table II. The valuestabulated were determined from least-squares plots
of the experimental values and were subsequentlynormalized to the concentrations shown. Theuncertainties given include all known sources of
possible systematic error and the 95 percent (2a)
confidence interval for the mean. The randomcomponent of these uncertainties, based on standarddeviations computed from residuals resulting fromfitting the data to the various concentration levels
for each wavelength, is 0.07 percent at the 2a level.
It is observed that all absorptivities in table II
increase with increasing K 2Cr 20 7 concentration.
These deviations from Beer's law are produced by the
fact that, in weakly acidic media, chromium (vi) ions
exist as two distinct absorbing species—HCrOr andits dimerization product, Cr20 7
=. The equilibrium be-
tween these two species ma,y be represented as
and the corresponding dimerization constant, KD , is
given by[Cr2Q 7
=]
D~[HCr04-] 2
•(2)
Although eq. (2) predicts that the formation of Cr20 7
=
is strictly a quadratic function of K 2Cr 207 concen-tration, the value of i^D=32.9 (mol kg -1
)
-1 obtainedpreviously [3] is of such magnitude that the percent-
age of total chromium present as the Cr207
=ion is
very nearly a linear function of the K 2Cr207 con-centration for the range of solutions studied. Calcu-lated values of HCr0 4
_/Cr20 7
=speciation in this
system are given in table III.
Table III. HCrO^/C^Or speciation in 0.001 M perchloric
acid solutions of K2Cr207.
K 2Cr20 7 Percent Cr as Percent Cr as
Cone, g kg-' HCr04
- Cr20 7=
0. 020 99. 10 0. 90. 040 98. 22 1. 78. 060 97. 38 2. 62
. 080 96. 56 3. 44
. 100 95. 77 4. 23
2HCrOr= Cr20 7=+H20 (1)
The direction and magnitude of the expected
deviations from Beer's law for the acidic potassiumdichromate system can be ascertained when the
speciation data in table III are combined with the
spectral characteristics of the two chromium (vi)
species. Figure 3 shows the relation of the absorbance
spectra of the HCrO\T and Cr20 7
=ions. At wave-
lengths of 235, 257, 313 and 350 nm, the Cr?0 7
= ion
is shown always to have a larger absorptivity than
the HCrOr ion. Hence, the measured absorptivities
at these wavelengths should increase with increasing
K2Cr20 7 concentration.
From the same argument, the data in figure 3 also
suggest that there are two wavelengths near 320 and
345 nm where Beer's law is obeyed. In an attempt to
determine these isosbestic points experimentally,
absorbance measurements were also made on the
Table II. Absorptivities of K 2C 20 7 in 0.001 M perchloric acid at 23.5 °C
Absorptivity, kg g-'em" 1
K2Cr207
Cone, g kg" 1
235(1.2)«nm 257(0.8)nm 313(0.8)nm 350(0.8)nm Uncertainty c
"0. 020 12. 243 14. 248 4. 797 10. 661 0. 034. . 040 12. 291 14. 308 4. 804 10. 674 d
. 022. 060 12. 340 14. 369 4. 811 10. 687 d
. 020. 080 12. 388 14. 430 4. 818 10. 701 d
. 020. 100 12. 436 14. 491 4. 825 10. 714 d
. 019
a Nominal concentration; all weights corrected to vacuum.b Wavelength and, ( ), spectral bandwidth.e Includes estimated systematic errors and the 95 percent confidence interval for the mean.d For wavelength of 313 nm, the uncertainty is reduced to half of these values for K 2Cr20 7 concentrations of 0.040, 0.060,
0.080 and 0.100 g kg-'.
90

4000
> 2000
5os
250 300 350
WAVELENGTH, nm
400
Figure 3. Absorbance spectra of the HCr04
_ion and its dimeri-
zation product, Cr%0^
same solutions used above at 322, 323, 345 and 346nm. The corresponding absorptivity values are given
in table IV. Although small systematic deviations
from Beer's law are still present, the absorptivities
calculated for 345 nm are sufficiently constant that
the acidic K2Cr20 7 system can be used at this wave-length, over the concentration range shown, to checkthe absorbance linearity of narrow bandpass spectro-
photometers to one part in a thousand.The variation of absorptivity of the acid K 2Cr20 7
system with temperature is the smallest that wehave observed for any liquid filter that we havestudied to date. For the four wavelengths recom-mended for checking the accuracy of the absorbancescale—235, 257, 313, and 350 nm—the absorptivities
decrease with increasing temperature. Over the range20-30 °C, the corrections are, respectively, —0.05,
—0.05, —0.02, and —0.05 percent per degree Celsius.
The —0.02 percent correction found at 313 nm cor-
responds closely to the correction predicted from the
thermal expansion of the solvent. Until further eval-
uation can be made of the temperature dependenceof 345 nm wavelength recommended for checkingabsorbance linearity, measurements should be re-
stricted to 23.5 ±1 °C.Several considerations were involved in the selec-
tion of perchloric acid for acidifying the K 2Cr20 7
solutions. First, perchloric acid was preferred overthe sulfuric acid which has been used traditionally
because perchlorate ion, unlike sulfate, has no tend-ency to form mixed complexes with chromium (vi)
species. Secondly, the choice of 0.001 M acid rather
than 0.01 M was based on two factors : (1) the 0.001 Macid represented a practical compromise for mini-mizing conversion of HCr0 4
~ to either H 2Cr0 4 orCr0 4
=and (2) the lower acid concentration substan-
tially lowered the oxidation potential (~13 percent)of the chromium (vi) ions and hence improved thesolution stability of the proposed K 2Cr20 7 standards.A final point that needs to be emphasized concerns
the quality of the distilled water used for preparingthe standard solutions. Acidic potassium dichromateis a potential oxidant and consequently the distilled
water used must be shown to be free of reducingimpurities in order that the absorptivity data givenin this paper be valid. A simple but yet definitive
test is outlined in figure 4. In this study a 500-folddilution of a 100 rag kg -1 standard solution of
K2Cr20 7 was made with the distilled water in ques-tion and its absorbance measured at 350 nm. Notonly did the measured absorbance agree with thepredicted value, thus indicating no reduction of
chromium (vi), but also subsequent measurementsshowed that this K2Cr20 7 solution standard shouldbe stable for at least two months provided it is ade-quately protected against evaporation. In instanceswhere this test shows the distilled water to be sus-
pect, it is recommended that the water be redistilled
from alkaline potassium permanganate in order to
preoxidize the impurities.
Finally, the general use of solid and liquid transfer
standards for calibrating the absorbance scale of aprecision commercial spectrophotometer is illus-
trated in figure 5. The measurements on the glass
0.0025 r
0.0020
CD E
£ I 0.0015o ovi—
m.
500—FOLD DILUTION OF 100 mg K2Cr
20/kg
12 14 ^2 4 6 8 10 12 14 ' I 30
DAYS AFTER PREPARATION
m
Figure 4. Test of the distilled water for reducing impurities.
Table IV. Absorptivities of K2O2O7 in 0.001 M perchloric acid near two predicted isosbestic wavelengths; temperature 23.5 °C
Absorptivity, kg g_1 cm-1
K 2Cr20 7 322 (0.8) b nm 323 (0.8) nm 345 (0.8) nm 346 (0.8) nmCone, g kg" 1
» 0. 020 5. 845 6. 065 10. 593 10. 615. 040 5. 842 6. 062 10. 595 10. 621
. 060 5. 838 6. 059 10. 598 10. 627
. 080 5. 835 6. 056 10. 600 10. 632
. 100 5. 831 6. 053 10. 602 10. 638
"Nominal concentration; all weights corrected to vacuum.bWavelength and, ( ), spectral bandwidth.
91

8r
ABSORBANCE
Figure 5. Correction AA for the absorbance scale of a precision
commercial spectrophotometer.
filters were performed at 440 nm while the K2Cr20 7
measurements were made at 350 nm. At both wave-lengths the absorbances measured on the precision
spectrophotometer are high and should be corrected
by subtracting the appropriate AA values.
IV. Conclusion
Following widespread use in the collaborative
testing of spectrophotometers for more than 25 years,
the absorptivities of the acidic potassium dichromatesystem have now been determined with a knownaccuracy from measurements performed directly onthe NBS Institute for Materials Research high-
accuracy spectrophotometer. Later this year, crystal-
line K2Cr20 7 ,together with detailed instructions on
preparing solutions from it, will be available fromNBS through its Office of Standard Reference
Materials as an SRM. In conjunction with the cali-
brated quartz cuvettes previously issued (SRM 932),it is believed that this material will provide a validcheck of the accuracy of the absorbance scale of
narrow bandpass spectrophotometers in the ultra-violet from 235-350 nm.
The authors gratefully acknowledge the assistanceof the following persons at NBS during variousphases of this work: K. D. Mielenz, for helpful
discussions of fundamental spectrophotometric pa-
rameters; G. Marinenko, for performing the cou-
lometric assay; J. A. Norris, for the the emission
spectrographic analyses; H. H. Ku, for the statistical
analysis of the data; and R. W. Seward, for supply-
ing through the Office of Standard Reference Mate-rials the samples of potassium dichromate.
V. References
[1] Burnett, R. W., J. Res. Nat. Bur. Stand. (U.S.), 76A(Phys. and Chem.), No. 5, 483-489 (Sept.-Oct. 1972).
[2] Mavrodineanu, R., J. Res. Nat. Bur. Stand. (1976), inpress.
[3] Burke, R. W., Deardorff, E. R., and Menis, O., J. Res.Nat. Bur. Stand. (U.S.), 76A (Phys. and Chem.),No. 5, 469-482 (Sept.-Oct. 1972).
[4] Yoshimori, T. and Sakaguchi, N., Talanta 22, 233-238(1975).
[5] Mavrodineanu, R., J. Res. Nat. Bur. Stand. (U.S.), 76A(Phys. and Chem.), No. 5, 405-425 (Sept.-Oct. 1972).
[6] Mavrodineanu, R., and Lazar, J. W., Nat. Bur. Stand.(U.S.), Spec. Publ. 260-32, 26 pages (Dec. 1973), andin Clin. Chem. 19, 1053-1057 (1973).
[7] Mielenz, K. D., and Mavrodineanu, R., J. Res. Nat.Bur. Stand. (U.S.), 77A (Phys. and Chem.), No. 6,
699-703 (Nov.-Dec. 1973).
(Paper 80A4-908)
92

APPENDIX V
UNITED STATES DEPARTMENT OF COMMERCE • Lewis L. Strauss, Secretary
NATIONAL BUREAU OF STANDARDS • A. V. Astin, Director
Testing of Glass Volumetric Apparatus
J. C. Hughes
National Bureau of Standards Circular 602
Issued April 1, 1959
[Supersedes Circular 434]
Available as COM 73-10504 from the National Technical Information Services
Springfield, VA 22161
93

Foreword
This Circular is a revision of NBS Circular 434, by Elmer L. Peffer (de-
ceased) and Grace C. Mulligan. Its purpose is to bring up to date the specifi-
cations for glass volumetric apparatus of precision grade, the description of the
test methods used, and the directions for submitting apparatus for test.
Specifications for newly developed items have been added, while others
have been changed to improve the usefulness of items or to take into consid-
eration new manufacturing methods.
A. V. Astin, Director.
94

ContentsForeword m1. Introduction—purpose and scope 1
2. Standard specifications for glass volumetric apparatus 1
2.1. Types of apparatus which will be regularly admitted for test 1
2.2. General specifications 1
a. Units of capacity 1
b. Standard temperature 1
c. Material and annealing 1
d. Design and workmanship 1
e. Graduation lines 2f. Inscriptions 2
2.3. Special requirements 2a. Flasks 2b. Cylindrical graduates 3c. Transfer pipets 4d. Burets and measuring pipets 4e. Buret and pipet tips 4
2.4. Special Apparatus 4a. Giles flasks 4b. Specific gravity flasks ' 5c. Sugar-testing flasks (Bates) 6d. Babcock milk-test apparatus 6e. Dilution (hemacytometer) pipets 6f. Sahli hemoglobin pipets 7
g. Immunity unit cylinders and pipets 7h. Special-purpose volumetric flasks 7i. Other special apparatus 7
2.5. Tolerances 7a. Flasks 7b. Transfer pipets 7c. Burets and measuring pipets 7d. Cylindrical graduates 8e. Delivery time 8f. Special apparatus 8
3. Special rules for manipulation 83.1. Test liquid 83.2. Method of reading 8
a. Using water or other wetting liquid 8b. Using mercury 9
3.3. Cleanliness of apparatus 93.4. Flasks and cylinders 9
a. Conical graduates 103.5. Burets 103.6. Measuring and transfer pipets 103.7. Special apparatus 10
4. Tests performed by the Bureau 114.1. Nature of tests 114.2. Precision stamp 114.3. Certificates and reports of capacity 114.4. Special tests 11
5. Directions for submitting apparatus for test 115.1. Application for test — 115.2. Shipping directions 115.3. Breakage 125.4. Address 125.5. Remittances 12
6. Appendix 126.1. Temperature corrections for volumetric solutions 126.2. Tables for determining the true capacities of glass vessels from the weight
of water in air 136.3. Change in capacity caused by change in temperature 13
95

Testing of Glass Volumetric Apparatus
J. G. Hughes
This Circular contains specifications and tolerances for glass volumetric apparatus ofprecision grade. Detailed information is given as to dimensions, graduations, inscriptions,
and tolerances for burets, pipets, flasks, cylindrical graduates, and certain kinds of specialapparatus.
A description of test methods used and the reports furnished and directions for sub-mitting apparatus are included.
1. Introduction—Purpose and Scope
This Circular presents, to manufacturers andusers, information on the design, construction, andverification of glass volumetric apparatus andindicates the facilities available at the Bureau for
this verification.
The specifications and tolerances given herein
apply to burets, flasks, pipets, and other glass
volumetric apparatus of precision grade.Information is given on the method of reading,
the test liquid used, and the methods of test. Adescription of the tests performed and the reports
furnished and directions for submitting apparatusare included.
2. Standard Specifications for Glass Volumetric Apparatus
The primary purpose of these specifications is to
define the requisite qualifications for precision
apparatus.The Bureau aims to encourage excellence in
quality by cooperating with makers and users of
apparatus, and to this end endeavors to assist
manufacturers in establishing standards and per-
fecting their methods. In order that users of
standarized apparatus may fully benefit by thefacilities of the Bureau, it is necessary for themwhen purchasing apparatus to be submitted for
test to.require that the apparatus shall comply
with the specifications of the Bureau. By ad-mitting for test only apparatus conforming to
these standards, the work of testing is confined to
apparatus whose utility is sufficient to justify the
labor expended in its accurate calibration. Cer-tain of the specifications, such as those regardingquality of glass and process of annealing before
calibration, are largely dependent on the integrity
of the maker for their fulfillment. Only bysupporting conscientious makers, in giving con-sideration first to quality and second to cost, canusers of standardized apparatus secure a highdegree of excellence.
2.1. Types of Apparatus That Will BeRegularly Admitted for Test
Precision grade apparatus of the following typeswill be accepted for test on written request:transfer pipets and capacity pipets, without sub-divisions; burets, measuring pipets, and dilution
pipets, with partial or complete subdivisions;volumetric flasks, cylindrical graduates, and spe-cific gravity flasks.
Other types of apparatus should not be sub-mitted without prior arrangement.
2.2. General Specifications 1
a. Units of Capacity
A liter is equal to the volume occupied by the
mass of 1 kg| of pure water at its maximumdensity (at a temperature of 4° C, practically).
A milliliter (ml), 2is the one-thousandth part of
the liter.
b. Standard Temperature
Although 20° C has been almost universally
adopted as the standard temperature for glass
volumetric apparatus, many chemists are of the
opinion that 25° C more nearly approximates the
average laboratory temperature in the UnitedStates. The Bureau therefore will calibrate glass
volumetric apparatus marked either 20° or 25° C.
c. Material and Annealing
The material should be of best quality glass,
transparent and free from striae, surface irregu-
larities, and other defects which may distort the
appearance of the liquid surface or the portion of
the graduation line seen through the glass. All
apparatus should be thoroughly annealed before
being graduated.
d. Design and Workmanship
The cross section must be circular and the
shape must permit complete emptying and drain-
ing and thorough cleaning.
Instruments having a base or foot must stand
solidly on a level surface. For all instruments
1 The Bureau reserves the right to reject any apparatus on points affecting
its accuracy or utility not covered by these specifications.2 The terms "milliliter" and "cubic centimeter" are sometimes used inter-
changeably. While they are not exactly equal (1 ml=1.000028 cm'), the
difference is seldom of consequence in volumetric analysis.
96

except small flasks (below 25 ml) the base shall
be of such size that the instrument, empty andwithout stopper, will stand on a plane inclined15° to the horizontal. Flasks smaller than 25 mlshall stand on a 10° incline.
Stoppers and stopcocks must be ground or fitted
so as to work easily and prevent leakage.
Apparatus which is manifestly fragile or other-
wise defective in construction will not be accepted.
The parts on which graduations are placedmust be cylindrical for at least 1 cm on each side
of every mark (except on certain small flasks andspecial apparatus), but elsewhere may be enlargedto provide the desired capacities in convenientlengths.
Two scales are not permitted on the same piece
of apparatus. For example, apparatus should notbe graduated in both fluid ounces and milliliters.
In the case of two units, one of which is an exactmultiple of the other, such, for example, as dramsand fluid ounces, there is no objection to havingthe 8-dr line, 16-dr line, etc., marked respectively,
1 fl oz, 2 fl oz, etc., provided that the two series of
numbers are placed on opposite sides of theapparatus and the value of each subdivision is
suitably indicated.
e. Graduation Lines
Graduation lines shall be fine, clean, permanent,continuous, and of uniform width, perpendicularto the axis and parallel to the base of the apparatus.Line width should not exceed 0.3 mm for subdi-vided apparatus and 0.4 mm for single-line
apparatus.All graduations must extend at least halfway
around; and on subdivided apparatus at least
every 10th mark, and on undivided apparatus,all marks must extend completely around thecircumference. Subdivided apparatus must beprovided with a sufficient number of lines of suit-
able length to facilitate reading.
The clear space between two adjacent marksmust be not less than 1 mm wide. The spacingof marks on subdivided apparatus must show noapparent irregularities, and sufficient divisionsmust be numbered to readily indicate the intendedcapacity of any interval.
f. Inscriptions
Every instrument must bear in permanentlegible characters the capacity, the temperatureat which it is to be used, the method of use—thatis, whether to contain or to deliver—and on instru-ments which deliver through an outflow nozzle,the time required to empty the total nominalcapacity with unrestricted outflow. Etching is
preferred for inscriptions, although engraved orfused marking is acceptable provided such mark-ing is neat and clear. Grit-blasted serial numberswill be permitted with the same provision.Every instrument must bear the name or trade-
mark of the maker. Every instrument must beara permanent identification number, and detach-
able parts, such as stoppers, stopcocks, etc., be-longing thereto, if not interchangeably ground,must bear the same number. Interchangeableground-glass parts shall be marked on both mem-bers with the proper standard taper symbol andthe size designation, in accordance with Com-mercial Standard CS 21-57.
Figure 1 illustrates several arrangements of
designating marks that are considered suitable.
Marks may be placed elsewhere on apparatus if
they are easily readable and do not interfere withthe proper use of the apparatus.
Figure 1. Examples of inscriptions suitable for volumetricapparatus.
2.3. Special Requirements
a. Flasks
The limiting dimensions for precision-grade vol-umetric flasks are given in table 1. For flasks
smaller than 5-ml capacity, the limits on locationof the graduation line will be the same as shownfor a 5-ml flask.
Stopper sizes should be so chosen that thesmallest diameter of the ground zone in the flask
neck is approximately equal to the inside diameterat the graduation line. The inside diameter ofthe neck at the graduation line should neverexceed the smallest diameter of the ground zoneby more than 1.5 mm. The shoulder at the baseof the ground zone should be smoothly rounded topermit complete drainage.
97

Table 1. Limiting dimensions for volumetric flasks
(In millimeters)
Inside diameter of neck Minimum distance betweenat graduation line graduation line and:
Capacity Top of flask
Minimum Maximum Bulb »
Stoppered Unstop-type pered type
ml5 6 7 22 22 5
10 6 8 28 28 7
25 6 8 35 30 10
50_ 6 10 40 30 10
100 8 12 40 30 10
200 9 14 55 45 10
250 10 15 55 45 10
500. 12 18 60 60 201,000 14 20 70 60 20
2,000 18 25 70 60 20
• The distance between the graduation line and the bulb is measured tothe point where the neck begins to expand into the bulb (on outside).
A flask may be graduated both to contain andto deliver, provided the intention of the different
marks is clearly indicated and provided the dis-
tance between the two marks is not less than1 mm.
b. Cylindrical Graduates
Cylinders may be graduated either to containor to deliver, but a scale numbered both up anddown the length of the graduate is not permitted,as it is obvious that the same graduate cannot becorrect both to contain and to deliver.
The relation of the height to the diameter mustbe such that the graduation marks are not less
than 1 mm apart, and also that the graduatedheight is at least five times the inside diameter.In the case of the 10-ml cylinder subdivided to
0.1 ml, and the 25-ml cylinder subdivided to
0.2 ml, it will be found necessary to make thegraduated height considerably more than five
times the inside diameter in order to give a
separation of 1 mm to the graduation marks. Toavoid excessive height, the subdivisions on 10-ml,25-ml, and 50-ml cylinders may be 0.2 ml, 0.5
ml, and 1.0 ml, respectively.Subdivision lines shall be omitted between the
base and the first numbered line. This will
eliminate readings near the base which aredifficult and not always accurate. (See fig. 2.)
The numbers indicating the capacity of thegraduate at its different points should be placedimmediately above the marks to which they refer.
Method of use—Graduates that are to be useddry to receive and measure liquids should be cali-
brated to contain.Graduates that are to be used to pour water into
other measures, and those which are to be usedwet to contain water from other measures, shouldbe calibrated to deliver. For example, a graduatethat is to be used in testing milk bottles, either bypouring water from the graduate into the bottlesor from the bottles into the graduate without dry-ing the graduate between bottles, should be call-
No 4
Maker
T D
20°C
ml
500
450
400
350
300
250
200
1 50
100
50
Figure 2. Examples of cylindrical graduates.
brated to deliver. After having been wet thegraduate will, on successive fillings and emptyings,deliver the same quantity that is poured into it.
In ordering graduates, the purchaser shouldconsider the use to which they are to be put andshould specify accordingly whether they should becalibrated to contain or to deliver.
Basis oj graduation—Graduates in customaryunits should be graduated in accordance with thefollowing relations:
60 minims= 1 fl dr8 fl dr= 1 fl oz
32 fl oz=l liq qt4 liq qt= 1 U. S. gal
1 U. S. gal=231 in. 3
For conversion to the metric system, the rela-
tion is:
1 fl oz=29.5729 ml
Table 2. Limits of distance from highest graduation to top
of graduate
Total Distance of highestnominal graduation from top Total nominalcapacity capacity
(customary (metric units)units) Minimum Maximum
Minims cm cm ml60 2 4 5
120 2 4 10
fl oz1_ _ 2 5 25
2. 3 5 50
4_ 3 6 100
8 4 8 25016 5 10 500
32. 5 10 1,000
98

Table 3. Minimum neck diameter of cylinders with stoppers
Capacity ml.. 5 10 25 50 100 250 500 1,000Minimum diameter
of neck mm.. 6 7 8 9 10 12 15 18
c. Transfer Pipets
Pipets for delivering a single volume are desig-
nated "transfer" pipets.
The suction tube of each transfer pipet must beat least 16 cm long, and the delivery tube must benot less than 3 cm nor more than 25 cm long. Thetop of the suction tube must be finished with asmooth plane surface, at right angles to the axis.
The outside diameter of the suction and deliverytubes of transfer pipets, exclusive of the tip, mustbe not less than 5 mm. Limits of inside diameterat the capacity mark are given in table 4.
The capacity mark on transfer pipets must benot more than 6 cm from the bulb.The outlet of any transfer pipet must be of such
size that the free outflow shall last not more than1 min and not less than the times shown in table 5
for the respective sizes.
Table 4. Inside diameter of transfer pipets at capacitymark
Capacity of pipets (in milliliters) up to andincluding .. .... .. 25 50 200
Diameter (in millimeters) : Max. 4 5 6Min 2 2 2
Table 5. Minimum delivery times for transfer pipets
Capacity (in milliliters) up to and in-
cluding... 5 10 50 100 200Outflow time (in seconds) 15 20 30 40 50
d. Burets and Measuring Pipets
Only those burets emptying through a nozzlepermanently attached at the bottom are acceptedfor test.
Side tubes, unless provided with stopcocks, arenot permitted on burets.
So-called Schellbach burets—that is, those hav-ing a milk-glass background with a colored centerline—will not be accepted for test on account ofpossible errors resulting from parallax.
The distance between the extreme graduationsmust not exceed 70 cm on burets nor 35 cm onmeasuring pipets.
The rate of outflow of burets and measuringpipets must be restricted by the size of the tip, andfor the graduated length the time of free outflowmust be not more than 3 min nor less than thetimes shown in table 6.
The upper end of any measuring pipet mustbe not less than 10 cm from the uppermost markand the lower end not less than 4 cm from thelowest mark.On 50- and 100-ml burets, the highest gradua-
tion mark should be not less than 4 cm nor morethan 10 cm from the upper end of the buret.
Table 6. Minimum delivery times for burets and measuringpipets
Length Time of out- Length Time of out-graduated flow not less graduated flow not less
than— than—
cm sec cm sec
15 30 45 8020 35 50 9025 40 55 105
30 50 60 120
35 60 65 140
40 70 70 160
On burets having a capacity of 25 ml or less this
distance should be not less than 3 cm nor morethan 6 cm. (These requirements do not apply to
burets where the "zero" is at the end of an over-
flow tip.)
e. Buret and Pipet Tips
Buret and pipet tips should be made witha gradual taper of from 2 to 3 cm, the taper at
the extreme end being slight.
A sudden contraction at the orifice is not per-
mitted, and the end of the tip must be groundperpendicular to the axis of the tube. The out-
side edge should be beveled slightly and all groundsurfaces polished.
In order to facilitate the removal of drops andto avoid splashing, the tip of a buret may be bentslightly.
Approved forms of tips for burets, measuringpipets, and transfer pipets are shown in figure 3.
2.4. Special Apparatus
a. Giles Flasks
The~permissible error in the volume at the first
mark shall be the tolerance allowed for a flask
of that capacity. The permissible error in the
volume at the second mark shall be the tolerance
at the first mark plus the tolerance for a flask of
capacity equal to the difference between the twomarks, provided, however, that the error in the
volume between the two marks shall not exceedthe permissible error in the volume indicated bythe first mark.At the capacity mark the inside diameter of
the neck shall be within the limits given in table 7.
The neck shall be cylindrical on each side of
every graduation mark for at least the distances
given in table 8.
On account of the bulb in the neck of a Giles
flask it is more unstable or topheavy than a flask
of the ordinary type. For that reason it has beenthought advisable to allow a somewhat shorter
minimum length for the cylindrical portion of theneck, on each side of the graduation mark, thanis allowed on ordinary flasks. In other respects
the same general specifications apply to the Giles
flasks as to other volumetric apparatus.
99

Figure 3. Types of buret and pipet tips.
Table 7. Neck diameters of Giles flasks
Inside diameter of neckCapacity
Minimum Maximum
ml mm 771771
25 to 27.5. _ 6 950 to 55 6 11
100 to 110 8 13
200 to 220.. 9 15500 to 550 - 12 18
1,000 to 1,100 14 202,000 to 2,200 18 25
Table 8. Minimum length of cylindrical portions of neckon Giles flask
Above Between Between Belowupper upper lower lower
Capacity graduation graduation graduation graduationmark mark and mark and mark
bulb bulb
ml cm cm cm cm25 to 27.5 3 0.8 1 1
50 to 55 3 .8 1 1
100 to 110 3 .8 I 1
200 to 220 4 .8 1.5 2500 to 550 4 1.0 1.5 21,000 to 1,100 5 1.0 1.5 2
2,000 to 2,200 5 1.0 1.5 2
b. Specific Gravity Flasks
Material and annealing—The material fromwhich the flanks are made shall be glass of the bestquality, transparent, and free from striae. Itshall adequately resist chemical action and havesmall thermal hysteresis. The flasks shall bethoroughly annealed before being graduated.They shall be of sufficient thickness to insurereasonable resistance to breakage.
Design—The cross section of the flask shall becircular, and the shape and dimensions shall con-
form to the diagram shown in figure 4. Thisdesign is intended to insure complete drainage of
the flask on emptying and stability of standing ona level surface, as well as accuracy and precision
of reading. There shall be a space of at least
1 cm between the highest graduation mark andthe lowest point of the grinding for the glass
stopper.
Capacity—The flask should contain approxi-mately 250 ml when filled to the zero graduationmark.
Graduations—The neck shall be graduated from0 to 1 ml and from 18 to 24 ml into 0.1 -ml divisions.
There shall be two 0.1 -ml graduations below the 0
and two above the 1-ml graduation.Standard temperature—The flasks shall be stand-
ard at 20° C. The indicated specific gravities will
then be at 20° referred to water at 4° as unity
—
that is, density at 20° in grams per milliliter.
Inscriptions—Each flask shall bear a permanentidentification number and the stopper, if not inter-
changeably ground, shall bear the same number.The standard temperature shall be indicated andthe unit of capacity shall be shown by the letters
"ml" placed above the highest graduation mark.Tolerance—The error of any indicated capacity
shall be not greater than 0.05 ml.
Interpretation of the specification—The foregoing
specification is intended to represent the mostdesirable form of specific-gravity flask for use in
testing cements. Variations of a few millimeters
in such dimensions as total height of flask, diameterof base, etc., are to be expected and will not beconsidered sufficient cause for rejection. Therequirements in regard to tolerance, inscriptions,
and the length, spacing, and uniformity of gradu-ations will, however, be rigidly observed.
56302S—60 2100

GROUND GLASSSTOPPER
HAVE TWO. 0.1 ml GRADUATIONSEXTEND ABOVE 1 ml AND BELOW0 MARK
CAPACITY OF BULBAPPR0X.250ml
Figure 4. Specific-gravity flask.
c. Sugar-Testing Flasks (Bates)
The flask shall have a height of 130 mm, and theneck shall be 70 mm in length ; a tolerance of ± 5
mm is allowed for each. The internal diametershall be not less than 11.5 mm and not more than12.5 mm. The upper end of the neck shall beflared, and the graduation mark shall be not less
than 30 mm from the upper end and 15 mm fromthe lower end of the neck. The flask shall bestandardized to contain 100 ml at 20° C with atolerance of 0.08 ml.
d. Babcock Milk Test Apparatus
Because most of the States now require that all
Babcock glassware used in the State be approvedby officials of that State, the National Bureau of
Standards no longer accepts Babcock bottles andpipets for calibration, except when specifically
requested by a State to settle a dispute. Specifica-
tions for Babcock glassware may be found in
official procedures of the Association of Official
Agricultural Chemists and certain dairyassociations.
e. Dilution (Hemacytometer) Pipets
The pipets should be of good quality glass, free
from bubbles and other defects, and sufficiently
strong to withstand normal usage. Tubing withmilk-glass backing is permissible. The capillary
should be of uniform diameter, except that the tip
of a white cell pipet may be tapered slightly. Theinside diameter at the tip should be between 0.3
and 0.5 mm. On all pipets the tip should beground smooth and at right angles to the axis of
the pipet, and beveled so that the external di-
ameter at the end does not exceed 2.0 mm. All
ground surfaces should be polished to restore
transparency.The bulb or mixing chamber should contain a
small, nonspherical glass bead to aid in mixing theblood and diluting fluid. Pipets for red blood cells
may be designated by a red bead, by a red stripe
running parallel to the axis, or both. White cell
pipets should have white or clear beads.The bulb should be So shaped that it can be
filled without entrapping air bubbles. The ca-
pacity of the bulb is usually about 0.8 to 1 .2 ml for
the red cell pipet, and 0.2 to 0.4 ml for the whitecell pipet.
The pipet should be so graduated as to give
dilution ratios of 1 to 10, or 1 to 100, and may befurther graduated to give ratios of 0.1, 0.2, 0.5,
etc., to 10, and to 100; that is, the interval 0 to 1
may be subdivided to 0.1 or 0.5. The sub-divisions, when present, should be uniformlyspaced along the capillary tube. The graduationsat 0.5, 1.0, 11, and 101 should be numbered.
All numbered graduation lines should extend at
least halfway around' the pipet, diametrically
opposite to the milk-glass backing. Etched lines
are preferred, but engraved or fused lines are
acceptable provided they meet the requirementsof paragraph 2.2. e. The "1" line shall be locatednot less than 2 mm nor more than 5 mm below thebulb, and the "11" (or "101") line shall be notless than 2 mm nor more than 4 mm above thebulb. Measurement is from the points where thecapillaries begin to expand into the bulb.
Dilution pipet tolerances—If V represents thevolume between the marks immediately above andbelow the bulb, «i represents the volume of thecapillary between the tip and the line marked "1",
and v2 represents the volume of the capillary be-tween the tip and the line marked "0.5", the toler-
ances may be expressed as follows:
101

Red cell pipets—nominal ratio 100:1,
V/Vi must be not less than 95 and not morethan 105
V/v2 must be not less than 190 and not morethan 210.
White cell pipets—nominal ratio 10:1,
V/vi must be not less than 9.65 and not morethan 10.35
V/v2 must be not less than 19.30 and not morethan 20.70.
In an effort to give more exact information as to
accuracy, certain manufacturers have markeddilution pipets with a so-called "correction factor".
This is usually written simply "+ 2", "— 1", etc.
Because of the possibility that such a correction
will not be applied as the manufacturer intended,
and because mass-production test methods can-not always be relied upon to fix the corrections
within 1 percent, the Bureau does not recommendthis practice. In those cases where greater accu-racy is required than is provided by the application
of the prescribed tolerances (±5% for red cell
pipets and ±3.5% for white cell pipets), it is
suggested that the purchaser specify the desired
limits of error. This would provide the neededaccuracy without the application of corrections.
The Bureau does not accept for test pipets
bearing a "correction factor" except in very special
^cases and only in small quantities.
f. Sahli Hemoglobin Pipets
The capacity tolerance for Sahli pipets is ±2percent of the nominal volume.
g. Immunity Unit Cylinders and Pipets
These instruments were designed by the Hy-gienic Laboratory of the U. S. Public HealthService (USPHS) for use in the measurement of
toxin and serum dilutions. Specifications may befound in USPHS Hygienic Laboratory Bulletin 21.
The instruments are made to conform in generalwith the specifications contained in this Circular,but with certain modifications necessary to adaptthem to the specific application.The pipets are of three types: (1) Capacity or
"wash-out" pipets, calibrated to contain the nomi-nal volume; (2) delivery pipets, calibrated to
deliver the nominal volume when the residue inthe tip after free outflow has ceased is blown outand added to the initial delivery; (3) graduateddelivery pipets, called Ehrlich pipets, calibratedto deliver the contents in the same manner astransfer pipets.
Tolerances for the first two types of pipetsnamed are the same for ordinary transfer pipets;for the Ehrlich delivery pipets, the tolerance is
0.01 ml. For the cylinders, the tolerances are:For capacities less than and including 50 ml—0.05ml; for capacities over 50 ml and including 100ml—0.08 ml.
h. Special-Purpose Volumetric Flasks
Certain types of special-purpose volumetricflasks such as the Engler viscosity flask and theKohlrausch and Stift sugar flasks, while not in
conformity with all the special requirements for
volumetric flasks listed in section 2. 3.a because of
their specific applications, will be calibrated andmarked with the precision stamp if they are in
satisfactory conformity with the general specifi-
cations in section 2.2 and the errors in capacity donot exceed the tolerances for volumetric flasks
given in section 2.5.
i. Other Special Apparatus
Other types of special-purpose instruments maybe calibrated and marked with the precision stampif they conform with the general specifications
(section 2.2) and the errors in capacity do notexceed the applicable tolerances in section 2.5.
Permanent identification numbers are requiredon all glass volumetric apparatus submitted for
certification.
Instruments obviously not capable of precision
measurements, as for example, centrifuge tubes,
are not accepted because the time expended in
their calibration is not warranted by the degree of
accuracy required in their use.
2.5. Tolerances
a. Flasks
The capacity tolerances for flasks are given in
table 9.
Table 9. Capacity tolerances for volumetric flasks
Capacity (in mil-liliters) less thanand including
—
Limit of error
If to contain— If to deliver—
ml ml1 0.013 .0155 .0210 .02 0. 0425 .03, .05
50 .05 .10100 .08 HUB200 .10 .20300 .12 .25500 .15 .30
1,000 .30 .502,000 • .50 1.00
Above 2,000 1 part in 4,000 1 part in 2,000
b. Transfer Pipets
The capacity tolerances for transfer pipets are
given in table 10. These tolerances are applicable
to pipets of similar design made to contain the
nominal volumes.
c. Burets and Measuring Pipets
The capacity tolerances for burets and measur-ing pipets are given in table 1 1
.
102

Table 10. Capacity tolerances for transfer pipets Table 12. Capacity tolerances for cylindrical graduates
Capacity (in milliliters)
less than and including
—
Limit oferror
2ml0.006.01
.02
.03
.05
.08
.10
5103050100200._._
Table 11. Capacity tolerances for burets and measuringpipets
Capacity (in milliliters)
of total graduated por-tion less than and in-
cluding—
Limit of error of total
or partial capacity
Burets Measuringpipets
ml ml2... 0. 015 _ ... 0. 01 .0210 .02 .0330 .03 .0550 .05 .08100 .10 .15
d. Cylindrical Graduates
The capacity tolerances for cylindrical gradu-ates are given in table 12.
e. Delivery Time
The actual delivery time of any instrumentmust be within the limits prescribed in section 2.3,and the error in the marked delivery time mustnot exceed the limits given in table 13.
Metric units
Capacity of
totalgraduatedportion less
than andincluding—
Maxi-mumdiam-eter
ml510....2550....100...
250...500...
1,000.
2,000.
mm11
1419
2329
405063
Limit of errorof total or
partial capacity
If to
con-tain—
ml0. 05.08.14.20.35
.651.1
2.03.5
If tode-
liver-
ml0.06.10.18.26.40
1.32.55.0
Customary units
Capacity oftotal
graduatedportion less
than andincluding
—
Maxi-mumdiam-eter
Minims60120
fl OZ1 (8 fl dr)
.
2481632
Limit of errorof total or
partial capacity
in.
%Vi
in.
%1
1MW«l'Me27A*
If tocon-tain—
Min-ims0.61.0
fl oz0. 005
.008
.014
.021
.035
.060
If to
de-liver—
Min-ims
0.71.3
fl oz0. 006
.010
.017
.027
.045
.080
Table 13. Limits of error in marked delivery tit
Delivery time (in Limit of errorseconds) less than in markedand including— delivery
time
sec
15 320 430 650 8100 15200 20
f. Special Apparatus
Capacity tolerances for the special purpose in-
struments described in section 2.4 are included in
the appropriate parts of that section.
3. Special Rules for Manipulation
These rules indicate the essential points in themanipulation of volumetric apparatus which mustbe observed in order that the conditions necessaryto obtain accurate measurements may be repro-duced.
3.1. Test Liquid
Apparatus will ordinarily be calibrated with dis-tilled water, and the capacity determined willtherefore be the volume of water contained ordelivered by an instrument at its standard tem-perature.
Certain special types of apparatus, such aspipets having a capacity of 0.01 ml or less, aremore accurately calibrated with mercury. Instru-ments designed to deliver their contents shouldalways be calibrated with water.
3.2. Method of Reading
a. Using Water or Other Wetting Liquid
In all apparatus where the volume is limited bya meniscus, the reading or setting is made on the
lowest point of the meniscus. In order that thelowest point may be observed, it is necessary to
place a shade of some dark material immediatelybelow the meniscus, which renders the profile of
the meniscus dark and clearly visible against a
light background. A convenient device for this
purpose is a collar-shaped section of thick blackrubber tubing, cut open at one side and of suchsize as to clasp the tube firmly.
The position of the lowest point of the meniscuswith reference to the graduation line is such thatit is in the plane of the middle of the graduationline. This position of the meniscus is obtained bymaking the setting in the center of the ellipse
formed by the graduation line on the front and theback of the tube as observed by having the eyeslightly below the plane of the graduation line.
This is illustrated in figure 5. The setting is accu-rate if, as the eye is raised and the ellipse narrows,the lowest point of the meniscus remains midwaybetween the front and rear portions of the gradua-tion line. By this method it is possible to observethe approach of the meniscus from either above or
below the line to its proper setting.
103

L iquid
Figure 5. Method of setting water meniscus.
b. Using Mercury
In setting a mercury meniscus on a graduationline, the instrument must be tapped sharply in
order that the meniscus may assume a normalshape. The highest point of the meniscus is set onthe middle of the graduation line by employingthe principles outlined for water, but observingfrom above the line.
3.3. Cleanliness of Apparatus
Apparatus must be sufficiently clean to permituniform wetting of the surface and to minimizecontamination of the liquid surface.
Of the various cleaning agents in common use,
the Bureau prefers fuming sulfuric acid or a
chromic-sulfuric acid mixture. For removal of
oil and grease, an organic solvent is used and thecleaning completed with one of the above agents.
When drying is required before calibration, it is
done with unheated compressed air which is
cleaned and dried by passing through concentratedsulfuric acid and a drying compound such as
calcium chloride.
3.4. Flasks and Cylinders
In filling flasks, the entire interior of the flask
below the stopper will be wetted; in the case ofcylinders, the liquid is allowed to flow down oneside only. After filling to a point slightly belowthe graduation line, these instruments are allowedto drain for about 2 min. They are then placedbelow a buret having a long delivery tube and a
bent tip, and the filling is completed by dis-
charging water from the buret against the wall of
the flask or cylinder about 1 cm above the gradu-ation line, and rotating the receiving vessel tore-wet the wall uniformly.
Flasks and cylinders which are to be used to
deliver are filled approximately to the test point,
then emptied by gradually inclining them, avoid-ing as much as possible agitation of the contentsand re-wetting of the walls. Allow half a minutefor emptying. When the continuous outflow hasceased, the vessel should be nearly vertical andshould be held in this position for another half-
minute. The adhering drop is removed by con-tact with the wetted wall of the receiving vessel.
The rest of the calibration is performed in the samemanner as in calibrating to contain.
In calibrating a flask or cylinder to contain it is
only necessary, after cleaning and drying theapparatus, to weigh it empty, fill it accurately to
the graduation mark, and again weigh. Table 16or table 17 may be used to determine the capacityat 20° C from the weight of the water contained at
a known temperature.In case flasks are to be tested in large numbers,
a volumetric method may be used to advantage.The Bureau uses a series of volumetric standardpipets (illustrated in fig. 6) each having a capacityslightly less than that of the flask it is intendedto test. The water delivered from the appro-priate standard pipet fills the flask nearly to the
graduation mark. After the 2-min drainageperiod, the filling is completed from an accurately
calibrated buret. The capacity of the flask is
then found from the known volume delivered bythe standard pipet and the additional volumedelivered by the buret. The standard pipets andburets are themselves calibrated by weighing the
water delivered.
VFigure 6. Standard pipet for flask calibrations.
104

a. Conical Graduates
The conical graduate is not classed as a precision
volumetric measure, and is not recommendedfor use in checking the accuracy of other volu-
metric apparatus. The Bureau does not accept
these graduates for calibration except when re-
quested by a State weights and measures official.
Conical graduates are calibrated in the samemanner as cylindrical graduates, except that in
calibrating "to deliver", the emptying time is
reduced from 30 sec to 10 sec and the drainage
time (after emptying) is also reduced to 10 sec,
following customary methods of use.
3.5. Burets
Burets are calibrated in a vertical position.
After cleaning, they are filled with distilled waterto about 1 cm above the zero line. They are
allowed to stand for about 30 min to check for
leakage, not only at the tip but also around the
stopcock plug. The water is then allowed to
discharge with unrestricted outflow and the
delivery time is noted and recorded. Thisflushing serves to equalize the temperatures of
apparatus and water. The water temperatureis taken on the next filling by inserting a ther-
mometer in the buret or, if it is not large enough to
receive a thermometer, in a plain glass tube of
larger diameter mounted near the buret.
If the temperature was taken in the buret, the
thermometer is then removed and enough wateradded to raise the level to about 1 cm above the
zero line. Any water on the outside of the tip is
removed with absorbent paper. The setting of
the meniscus on the zero line is made by allowingthe water to run out slowly. After the setting is
made, any excess water on the tip is removed bytouching the tip with the wetted wall of a beakeror other vessel. The very small quantity of waterwhich remains on the extreme end, or ground por-
tion, of the tip is not removed, as the same quan-tity of water will remain after delivery into theweighing flask.
Delivery of the water into the weighing flask
is made with the buret tip in contact with theinside of the flask neck, the flask being inclined at
an angle of about 20°. When delivery has beencompleted, the weighing flask is immediatelyremoved horizontally from contact with theinstrument being calibrated. The flask is thenstoppered and weighed. The buret and ther-
mometer tube (if used) are refilled preparatory to
measuring the next interval.
Buret stopcocks should be completely openduring delivery until the water level is only a fewmillimeters above the test point, when the dis-
charge must be slowed in order to make an ac-curate setting.
In making the weighings it is both convenientand accurate to use the method of substitution.By this method a constant tare is kept on onepan of the balance, while on the other pan is
placed the object to be weighed and with it suffi-
cient weights to secure equilibrium. In testing
volumetric apparatus, the receiving flask is first
weighed empty and then again after having de-livered into it the water from the interval undertest. The difference between the two weights is
the weight of the water delivered.
Suppose, for example, that with a certain tareon the right-hand pan and the empty flask onthe left a load of 151.276 g is required in additionto the flask to restore equilibrium, and that after
the water from the 10-ml interval of the buretunder test is delivered into the flask, only 141.310
g are required, and that the water is at a temper-ature of 23.4°C. The weight of the water addedis then 151.276 -141.310= 9.966 g. From table
16 (appendix), it is seen that to determine thecapacity of a 10-ml soft glass vessel at 20°Cfrom the weight of water delivered at 23.4°C,0.035 must be added to the weight; that is, thecapacity of the 10-ml interval of the buret undertest at 20°C is 9.966 +0.035= 10.001 ml.
3.6. Measuring and Transfer Pipets
Measuring and transfer pipets are calibrated in
much the same manner as burets, except that
the tip must be in contact with the wet wall of
a beaker or other vessel when the setting is madeon the zero line of a measuring pipet or the ca-
pacity mark of a transfer pipet. Also, the de-livery time of a transfer pipet is measured withthe tip in contact with the vessel.
In calibrating transfer pipets, the water surface
must be observed closely as it approaches the tip
to make certain that outflow has ceased beforethe weighing flask is removed . On the other hand,if the flask removal is unduly delayed, after-
drainage will affect the result.
The water remaining in the tip of a pipet is
not blown out unless, as in the case of certain
types of special-purpose pipets, there is a wideband or two narrower bands permanently markednear the top of the instrument.The water temperature is measured in the beaker
from which the pipet is filled (by suction).
3.7. Special Apparatus
The flasks and cylinders mentioned in section
2.4 are calibrated in the manner described in
section 3.4, except that the inside of the neck is
wetted for a distance of only about 1 cm or less
above the test point.
A specific gravity flask is calibrated at the 1?
18, and 24 ml graduations.Capacity pipets made to contain the nominal
volume are calibrated by weighing before andafter filling.
In calibrating "blow-out" pipets, the waterremaining in the tip after free outflow has ceasedis blown out, without waiting for drainage, andadded to the quantity delivered. The blow-outis accomplished by a single strong puff, with thepipet tip in contact with the neck of the weighingflask.
105

4. Tests Performed by the Bureau
4.1. Nature of Tests
Apparatus submitted for test is first examinedas to its conformity with the specifications con-
cerning quality and workmanship, design, mark-ings, outflow time, etc.
If the apparatus meets these requirements, it is
calibrated either to ascertain whether the capacity
is correct within the prescribed limits of error or
to determine the correction for use in precise
measurements.
4.2. Precision Stamp
If the results of the preliminary examinationindicate a satisfactory conformity with the spe-
cifications, and the error in capacity is within the
prescribed tolerance, the official precision stamp,consisting of the letters NBS and the year date,
surrounded by a circle, is etched on the instru-
ment as shown below:
4.3. Certificates and Reports of Capacity
Burets will be calibrated for at least five inter-
vals, and if found to conform with the specified
requirements will, in addition to the precision
stamp, be marked with an NBS identification
number as shown below:
NBS No. 12341958
A certificate will be issued giving the volumesdelivered from the intervals tested.
Only in special cases will certificates of capacitybe issued for apparatus other than burets. Whenthe measurements depending upon the use of thevolumetric glassware are required to be so precise
that a statement to the effect that the apparatusis within the tolerances prescribed in this Circulardoes not give sufficiently exact information, cer-
tificates may be issued. The request for cer-
tificates, when required, should be made at thetime the apparatus is submitted for test.
Reports of capacity may be issued under thefollowing circumstances :
(a) For burets when the error in capacity is
greater than, but not more than twice, thetolerance.
(b) When certificates are requested for otherapparatus, and the error in capacity exceeds, butis not more than twice, the prescribed tolerance.
(c) For special types of volumetric apparatusnot covered by the specifications in this Circular.
When a report of capacity is issued, a number is
applied as shown above, but the precision stampis omitted.
4.4. Special Tests
The Bureau will gladly cooperate with scientific
investigators, manufacturers of apparatus, andothers in the calibration of precision volumetricapparatus not covered by the specifications in
this Circular, as far as the regular work of the
Bureau will permit. Tests of instruments notincluded in the current fee schedules should bearranged for by correspondence before shipmentof the apparatus; the application should state
fully the purpose for which the apparatus is to beused, the need for the test, and the precision
desired.
5. Directions for Submitting Apparatus for Test
5.1. Application for Test
The request for test should be made in writingand should include a complete list of the appa-ratus and a statement of the nature of the test
desired. Representatives of state institutions en-titled to tests free of charge must make applica-tion in writing for each test in order to availthemselves of the privilege.
Unless otherwise requested, burets will beexamined and the capacity of five intervals tested.
If in satisfactory conformity with the require-ments, the results of the test are certified. If
more than five intervals are to be tested, therequest must so state.
Patrons should always examine apparatus care-
fully before submitting it for test to ascertain if it
complies with the construction specifications. Delayand cost of transportation on apparatus not en-titled to verification will thus be avoided.
The Bureau does not sell volumetric apparatus.It may be purchased from manufacturers, im-porters, or jobbers, and submitted to the Bureaufor test.
Purchasers of apparatus to be submitted to the
Bureau for test should so specify to the dealer in
order to avoid unnecessary delays and misunder-standings.
5.2. Shipping Directions
The apparatus should be securely packed in
cases or packages which will not be broken in
transportation and which may be used in returningthe tested material to the owner. Great care
should be taken in packing. Clean, dry excelsior
is a suitable packing material in most cases. Eachinstrument should also be wrapped in strong paperor other covering to prevent dust and excelsior
from getting into it,.
106

Transportation charges are payable by the partyrequesting the test. The charges for shipment to
the Bureau must be prepaid; and, unless otherwise
arranged, articles will.be returned or forwarded byexpress "collect".
After the material is received at the Bureau, the
shipper will be notified of the test number assigned.
This number should be mentioned in any corre-
spondence pertaining to the test.
5.3. Breakage
A considerable number of pieces of glassware are
received broken, either on account of improperpacking or rough treatment in transportation, or
both. Some are broken in return shipment. Asmall percentage is broken in the testing labora-
tory.
There is no legal way in which the Bureau canmake reimbursement for breakages of this kind.
It is therefore a matter of necessity, and not of
choice, that the Bureau makes those who sendapparatus for test assume all the risks involved.
Under the circumstances, all that the Bureau cando is to make every effort to reduce such breakageto the absolute minimum.
5.4. Address
Articles and communications should be ad-dressed, "National Bureau of Standards, Washing-ton 25, D.C."; delays incident to other forms of
addresses will thus be avoided. Articles delivered
personally or by messenger should be left at thereceiving office of the Bureau, and should be ac-
companied by a written request for test.
5.5. Remittances
Payment of test fee should be made promptlyupon receipt of bill. Remittances may be madeby money order or check drawn to the order of the
"National Bureau of Standards".Copies of the current Test Fee Schedules may
be obtained from the Bureau upon request.
6. Appendix
Tables 14 and 16 are reprints of tables 38 and 43from NBS Circular 19, 6th edition, StandardDensity and Volumetric Tables. They are in-
cluded in this Circular for the convenience of users
of volumetric glassware. Tables 15 and 17 havebeen added because of the increasing popularity of
borosilicate glass apparatus.
6.1. Temperature Corrections for VolumetricSolutions
Table 14 gives the correction to various observedvolumes of water, measured at the designatedtemperatures, to give the volume at the standard
Table 14. Temperature corrections for water
Measured in soft glass apparatus having a coefficient of cubical expansionof 0.000025/°C
temperature, 20° C. Conversely, by subtractingthe corrections from the volume desired at 20° C,the volume that must be measured at the desig-
nated temperatures in order to give the desired
volume at 20° C will be obtained. It is assumedthat the volumes are measured in glass apparatushaving a coefficient of cubical expansion of 0.000-
025/° C. The table is applicable to dilute aqueoussolutions having the same coefficient of expansionas water.
Table 15 gives temperature corrections for
water, when measured in borosilicate glass ap-paratus having a coefficient of cubical expansionof 0.000010/° C.
Table 15. Temperature corrections for water
Measured in borosilicate glass apparatus having a coefficient of cubicalexpansion of 0.000010/°C
Capacity of apparatus in milliliters at 20° CTempera-
ture ofmeasure- 2,000 1,000 500 400 300 250 150ment
Correction in milliliters to give volume of water at 20° C
0 C15 +1.54 +0. 77 +0. 38 +0. 31 +0.23 +0. 19 +0. 1216 _ +1.28 +.64 +.32 +.26 +.19 +.16 +. 1017 +.99 +.50 +.25 +.20 +. 15 +.12 +.0718 +.68 +.34 +. 17 +. 14 +. 10 +.08 +.0519 +.35 +.18 +.09 +.07 +.05 +.04 +.03
21 -.37 -.18 -.09 -.07 -.06 -.05 -.0322 -.77 -.38 -.19 -.15 -.12 -.10 -.0623 -1.18 -.59 -.30 -.24 -. 18 -.15 -.0924 -1.61 -.81 -.40 -.32 -.24 -.20 -.1225 -2. 07 -1.03 -.52 -.41 -.31 -.26 -.15
26 -2.54 -1.27 -.64 -.51 -.38 -.32 -.1927 -3.03 -1.52 -.76 -.61 -.46 -.38 -.2328 -3. 55 -1.77 -.89 -.71 -.53 -.44 -.2729 -4.08 -2.04 -1.02 -.82 -.61 -. 51 -.3130 -4.62 -2. 31 -1. 16 -.92 -.69 -.58 -.35
Capacity of apparatus in milliliters at 20° CTempera-
ture of
measure- 2,000 1,000 500 400 300 250 150ment
Correction in milliliters to give volume of water at 20° C
° C15 _ +1.69 +0.84 +0.42 +0. 34 +0. 25 +0.21 +0. 1316 +1. 39 +.70 +.35 +.28 +• 21 +.17 +. 1017 +1.08 +.54 +.27 +.22 +. 16 +. 13 +. 0818 +0.74 +. 37 +.19 +. 15 +.11 +.09 +.0619 +.38 +• 19 +. 10 +.08 +.06 +.05 +.03
21 -.40 -.20 -.10 -.08 -.06 -.05 -.0322 -.83 -.41 -.21 -.17 -.12 -.10 -.0623 -1.27 -.64 -.32 -.25 -. 19 -.16 -.1024 -1. 73 -.87 -.43 -.35 -.26 -.22 -.1325 -2.22 -1.11 -.55 -.44 -.33 -.28 -.17
26 -2.72 -1.36 -.68 -.54 -.41 -.34 -.2027 -3.24 -1.62 -.81 -.65 -.49 -.41 -.2428 -3. 79 -1.89 -.95 -.76 -.57 -.47 -.2829 -4.34 -2. 17 -1.09 -.87 -.65 -.54 -.3330 -4. 92 -2.46 -1.23 -.98 -.74 -.62 -.37
107

In using the above tables to correct the volumeof certain standard solutions to 20° C, more accu-
rate results will be obtained if the numerical values
of the corrections are increased by the percentages
given below:
SolutionNormality
N JV/2 N/W
HNOs- 50 25 6H 2SO ( 45 25 5NaOH.__ 40 25 5KOH 40 20 4
6.2. Tables of Corrections for Determining theTrue Capacities of Glass Vessels From theWeight of Water in Air
Table 16 gives, for a nominal capacity of 100 mland observed temperatures from 15° C to 32.9° C,the amounts to be added to the apparent weight in
grams (in air against brass weights) of the watercontained in or delivered by a glass vessel to givethe capacity in milliliters at 20° C. It is calculatedon the following data assumed as approximatingordinary conditions: Observed barometric pres-
sure—-760 mm; relative humidity—50 percent;coefficient of expansion of glass—0.000025/° C.> Example of use of table. Determination of ca-
pacity of glass volumetric flask marked "Tocontain 100 ml at 20° C".
Apparent weight of water at theobserved temperature, 24.5° C__ 99. 615 g
From table 16, correction +0. 372
Actual capacity at 20° C 99. 987 ml
For capacities other than 100 ml, the correctionsgiven must be multiplied by the appropriate
factor. For example, the correction for 500 mlwould be five times the correction for 100 ml.For borosilicate glass having a coefficient of
cubical expansion of approximately 0.000010/° C,Table 17 should be used.
6.3.\Change in Capacity Caused by Change ofTemperature
Having determined the capacity at 20°"C, if it is
desired to know what the capacity of the samevessel will be at another temperature, the followingformula may be used
:
V,=V20[l+ a(t-20)],
where
Vt= capacity at t° C,
V2o= capacity at 20° C,a= coefficient of cubical expansion of material of
which the instrument is made. (For soft
glass 0.000025/° C)
This formula is applicable to instruments ormeasures made of any material of which the coeffi-
cient of cubical expansion is known. A few mate-rials commonly used in volumetric apparatus andtheir approximate coefficients are:
Coefficient ofcubical
expansion 4
per deg CSoft glass 0. 000025Pyrex or KG-33 . 000010Copper . 000050Brass . 000054Steel . 000035Stainless steel . 000031
* Coefficients shown are averages, but are sufficiently accurate for volu-metric determinations.
Table 16. Table of corrections for determining the true capacities of glass vessels from the weight of water in air
(Soft glass, coefficient of cubical expansion 0.000025/° C)
Indicated capacity 100 ml
Tenths of degreesTemperature
0 1 2 3 4 5 6 7 , 8 9
° C•
15_ 0.207 0.208 0. 210 0. 211 0. 212 0. 213 0. 215 0. 216 0.217 0. 21916 .220 .221 .223 .224 .225 .227 .228 .230 .231 .23217 .234 .235 .237 .238 .240 .241 .243 .244 .246 .24718 _. .249 .250 .252 .253 .255 .257 .258 .260 .261 .26319. .265 .266 .268 .270 .272 .273 .275 .277 .278 .280
" 20..- .282 .284 .285 .287 .289 .291 .293 .294 .296 .29821 .300 .302 .304 .306 .308 .310 .312 .314 .315 .31722 .319 .321 .323 .325 .327 .329 .331 .333 .336 .33823 .340 .342 .344 .346 .348 .350 .352 .354 .357 .35924.... .361 .363 .365 .368 .370 .372 .374 .376 .379 .381
25.... .383 .386 .388 .390 .392 .395 .397 .399 .402 .40426. — .406 .409 .411 .414 .416 .418 .421 .423 .426 .42827 .431 .433 .436 .438 .440 .443 .446 .448 .451 .45328. .456 .458 .461 .463 .466 .469 .471 .474 .476 .47929.. .482 .484 .487 .490 .492 .495 .498 .501 .503 .506
30 .509 .511 .514 .517 .520 .522 .525 .528 .531 .53431 .536 .539 .542 . 545 .548 .551 .554 .556 .559 .56232 .565 .568 .571 .574 .577 .580 .583 .586 .589 .592
108

Table 17. Table of corrections for determining the true capacities of glass vessels from the weight of water in air
(Borosilicate glass, coefficient of cubical expanson 0.000010/° C)
Indicated capacity 100 ml
TemperatureTenths of degrees
0 1 2 3 4 5 O 7 Q Qy
° C15... 0. 200 0. 201 0. 202 0. 204 0. 205 0. 207 0. 208 n oi n
U.n OilU. Zi
1
n 9i 9
16 . 214 . 215 . 217 . 218 . 220 . Liu 99Q. ZZo . ZZO 99ft
. ZZO 228
17 . 229 . 231 . 232 . 234 . 236 . 237 . zoy 9/11. Z^l 9/19 9/1/1
18. . 246 . 247 . 249 . 251 . 253 . 254 ORft 9£Q. Zoo 9ftn 9ft 1
19 . 263 . 265 . 267 . 269 . £1 1 . Z7Z 97ft. ZfO 97ft 9ftn
20 . 282 . 284 . 286 . 288 . 290 . 292 9Qft. zyo OQQ
. oUU21_... . 302 . 304 . 306 . 308 . 310 . 312 . 314 . olO Q1 Q
. olo Q9n
22 .322 .324 . 327 .329 .331 . 333 .335 .338 . o4U . O^tZ
23 .344 .346 .349 .351 .353 .355 .358 .360 .362 .365
24 .367 .369 .372 .374 .376 .379 .381 .383 .386 .388
25 .391 .393 .396 .398 .400 .403 .405 .408 .410 .413
26 .415 .418 .420 .423 .426 .428 .431 .433 .436 .43827 .441 .444 .446 .449 .452 .454 .457 .460 .462 .46528 .468 .470 .473 .476 .479 .481 .484 .487 .490 .492
29 .495 .498 .501 .504 .506 .509 .512 . 515 .518 .521
30 .524 . 526 . 529 .532 .535 .538 .541 .544 .547 .55031 . 553 . 556 . 559 . 562 .565 .568 .571 . 574 .577 .580
32 . 583 . 586 .589 .592 . 595 .598 .602 .605 .608 .611
Washington, September 24, 1958.
109U. S. GOVERNMENT PRINTING OFFICE : 1959


APPENDIX VI
NBSIR 74-461
THE CALIBRATION OF SMALL VOLUMETRIC
LABORATORY GLASSWARE
Josephine Lembeck
Institute for Basic Standards
National Bureau of Standards
Washington, D. C. 20234
December 1974
Final
Prepared for
Optical Physics Division
Institute for Basic Standards
Washington, D. C. 20234
U. S. DEPARTMENT OF COMMERCE. Frederick B. Dent, Secretary
NATIONAL BUREAU OF STANDARDS. Richard W. Roberts. Director
111

The Calibration of Small Volumetric Laboratory Glassware
by
Josephine Lembeck
1. INTRODUCTION
This article describes an acceptable procedure for calibratingburets, pipets and volumetric flasks of the types shown in figure1. The physical characteristics of these items are indicated in
Interim Federal Specifications NNN-B-00789a (GSA-FSS) , NNN-P-00395a (GSA-FSS} NNN-F-00289a (GSA-FSS), and NBS Handbook 105-2.
The general procedure is based upon a determination of the volumeof water either contained in or delivered by the vessel. Thisvolume of water is based upon knowledge of its measured mass andits tabulated density. Inasmuch as these calibration volumes,especially the delivery volume, may be altered by the manner in
which the vessels are used, it is imperative that the user of thevessel employ the same techniques as those employed duringcalibration. The techniques of importance here are:
1. reading and adjusting meniscus
2. filling the vessel
3. draining the vessel.
These three topics will be covered in detail.
2. CLEANING PROCEDURES
It is important that glassware be thoroughly cleaned before beingtested or used. Apparatus must be sufficiently clean to permituniform wetting of the surface. When clean, the walls will beuniformly wetted and the water will adhere to the glass surfacein a continuous film. Imperfect wetting causes irregularities incapacity by distorting the meniscus and allowing nonuniformwetting of the interior surfaces to occur.
The liquids usually used for cleaning glassware are sodiumdichromate sulphuric acid cleaning solution (commerciallyavailable from laboratory supply houses), nitric acid, fumingsulphuric acid, alcohol and water. The choice of cleaning agentto be used depends on the nature of the contaminant. Aftercleaning with the cleaning solution and thoroughly rinsing withtap water, the vessel should be rinsed with distilled water. If
112

the vessel is marked "TO CONTAIN V it should additionally be
rinsed with ethyl alcohol and dried with clean air at room
temperature. NBS uses bottled breathing air and a drying rack
shown in figure 2. It is not necessary to dry any vessel marked"TO DELIVER" . When cleaning small articles such as pipets, it is
usually easier to fill them with cleaning solution by suction,
vacuum, if available, or a small rubber bulb, but never by mouth.
The solution should be sucked through the pipet several times
until the entire inside surface is evenly coated. Rinse
thoroughly with tap water and then with distilled water.
For cleaning flasks, pour in enough cleaning solution whilerotating so that a film of solution will cover the entire
interior surface. A break in the film indicates a contaminatedarea. For filling a buret with cleaning solution, it should be
held in a vertical position and filled by pouring into the top.
Open the stopcock to drain. Regardless of the type of vessel,always rinse thoroughly, first with tap water and then withdistilled water.
3. FILLING AND DRAINING THE VESSEL
Pipets, burets and flasks have at least one index mark engravedon their glass bodies which serves to define their referencevolume . Calibration consists of determining the volume of waterrequired to fill the vessel to the index mark (containmentvolume), or the volume of water which can be drained from thevessel under specified conditions after filling (deliveryvolume)
.
The difference between containment volume and delivery volume is
significant. Since these volumes are determined in weighingexperiments, it is essential to avoid splashing droplets of wateron to supposedly dry surfaces and it is equally important to
assure that a surface is uniformly wetted when required by theprocedure.
In all cases, it is necessary to fill the reference volume of thetest vessel with water. This involves adjusting the height of
the liquid surface to coincidence with the horizontal planethrough the defining index mark.
This surface, or meniscus, is not flat; it is concave— that is,
its lowest point is in the center of the surface as shown infigure 3. There are several criteria for deciding whencoincidence is achieved. Inasmuch as differing criteria resultin different surface heights, it is important that the samecriteria be employed during use of the vessel as was employedduring calibration. Experience has shown that the followinggenerally used technique is easy to apply and adequately
113

reproducible. In this procedure, the lowest point in the
meniscus is brought to the same horizontal level as the
horizontal plane through the engraved index line on the glassvessel.
In order to observe the lowest point, it is necessary to place a
shade of some dark material immediately below the meniscus. This
renders its profile dark and clearly visible against a light
background. A method or device for this purpose is a collar-
shaped section of thick black rubber tubing, cut open at one sideand of such size as to clasp the tube firmly, as shown in figures4 and 4A. The position of the lowest point of the meniscus withreference to the graduation line is such that it is in the planeof the middle of the graduation line. This position of themeniscus is obtained by making the setting in the center of theellipse formed by the graduation line on the front and the backof the tube, as observed by having the eye slightly below theplane of the graduation line. The setting, the procedures for
which will be discussed later, is accurate if, as the eye israised and the ellipse narrows, the lowest point of the meniscusremains midway between the front and rear portions of thegraduation line. By this method, it is possible to observe theapproach of the meniscus from either above or below the line to
its proper setting.
The foregoing procedure applies when the index line runscompletely around the neck of the vessel. On some vessels, suchas measuring flasks, figure 1, some of the lines go only one-halfway around the neck. Under these conditions the operator hasonly one-half of an ellipse to assist him in defining thehorizontal plane through the index line. Experience has shownthat, although the 360° index line is most convenient for theoperator, there is insignificant difference between theachievable reproducibility from this complete index, and onewhich extends only 180° around the neck.
On some graduated neck vessels the lines are very short indeed,extending less than one-fourth the way around the neck. Underthese circumstances, there is no reference line behind themeniscus to help the operator in estimating the vertical positionof the horizontal index plane. When faced with this problem, itis necessary for the operator to place his eye in hisbest estimate of the horizontal index plane while observing themeniscus. With experience, an operator should be able to judgethe position of this plane to within one or two centimeters. Theoperator's eye will be (perhaps) twenty-five centimeters in frontof the short index line while the center of the meniscus will beonly one centimeter behind this line, (for a two centimeter neckon the vessel) . The geometry of this situation dictates that thevertical position error of the meniscus will be only one twenty-
114

fifth of the operator's error in estimating the position of the
horizontal index plane. Although an optical system (e.g. a
bubble level cathetometer) could reduce this error to
insignificance, there is little point to such a calibrationprocedure unless a similar system were employed by the user of
the vessel.
Having filled the reference volume of the test vessel using the
meniscus observation technique procedure described above, the
problem is to determine the volume of water contained, or the
volume which can be drained out under specified conditions. This
volume is calculated from the density of the water from table 2
and its measured mass.
In the case of a flask "to contain," this mass is the difference
between the mass of the empty flask and its mass after filling as
described above. For the flask "to deliver" it is the differencebetween the mass of the filled flask and the mass after thespecified drainage period, 30 seconds, has occurred but beforethe walls have had a chance to become dry .
It is not necessary to weigh burets and pipets because they are
"delivery" instruments. Under these circumstances their deliveryvolume is drained into a weighing flask. Weighing this flask,
before and after loading, provides the mass of water delivered bythe buret or pipet.
The detailed procedures in use at NBS for filling and drainingthe various test vessels are given in the following paragraphs.
A. BURETS
Clamp the buret vertically on a support stand; also clamp a plainglass tube, large enough to hold a thermometer, near the buret if
the buret is of such a size that is not large enough to insert a
thermometer in the top for observing the temperature of thewater. A typical setup is shown in figure 5. Fill the buretfrom the top to the zero mark with distilled water from a
reservoir or storage bottle. Drain and record the delivery time.
Delivery time is determined by the unrestricted outflow of thewater from the zero mark to the lowest graduation mark with thestopcock fully open. Refill the buret to approximately 1 cmabove the zero mark and fill the plain glass tube that holds thethermometer; record the temperature. Set a meniscus on the zeromark using the buret stopcock to lower the liquid level and touchthe tip with the wetted wall of a beaker to remove any excesswater. A weighing flask which has been lightly stoppered andweighed empty is placed with the inside of the neck in contactwith the tip of the buret (the flask will be at a slight angle)
.
The stopcock must be fully open until the water is only a few
115

millimeters above the line being tested and then slowed so as to
make an accurate setting. When the setting has been completed,move the flask horizontally, breaking contact with the buret.The flask is then stoppered and weighed a second time, afterwhich the thermometer tube is refilled and the next intervaltested in the same manner as the first one - from the zero markto the next interval needed.
B. PIPETS
Fill pipet with distilled water by suction to the index mark and
measure delivery time with the tip in contact with the glasssurface or the internal side of a beaker as shown in figure 6.
Refill by suction slightly above index line. Record thetemperature of the distilled water in the beaker from which the
pipet is filled. Any water on the outside of the tip is removedwith filter paper after the filling is completed. The meniscusis then slowly lowered to the index using either the stopcock or
hose clamp for "fine control." The tip must be in contact withthe wet wall of a beaker while the setting is made on the indexline. Any water remaining on the tip at this time is notremoved. The pipet is held in a vertical position while water is
delivered into a previously weighed weighing flask with the tip
in contact with the inside wall of the neck of the flask asindicated in the figure 6A. Contact is broken immediately afteroutflow ceases. The flask is now stoppered and weighed with itscontained load.
C. FLASKS (TO CONTAIN)
After cleaning and drying, weigh the empty flask including thestopper. Place an appropriate sized funnel in the flask to
discharge the water below the stopper. Fill from beaker orsupply line to a point slightly below the graduation line,maneuvering the funnel so as to wet the entire neck below thestopper. Let stand for about two minutes to allow the walls to
drain. Place the flask under the buret and complete filling andsetting the meniscus and place stopper in neck to lessenevaporation and weigh. A pipet or dropper with a finely drawntip may be used instead of the buret. Determine the temperatureby placing a thermometer in the filling beaker or in one whichhas been filled from the supply line. The temperature may betaken after final weighing by placing a thermometer directly inthe flask, provided the flask is of sufficient size toaccommodate it.
D. FLASKS (TO DELIVER)
Flasks calibrated to deliver are not dried prior to the test.Fill slightly below the index line and empty in 30 seconds bygradually inclining the flask so as to avoid splashing of the
116

walls as much as possible. When the main drainage stream hasceased, the flask will be nearly vertical. Hold in this positionanother 30 seconds and touch off the drop of water adhering to
the top of the flask. Place a stopper, or cap, on the flask to
reduce evaporation and weigh immediately. Take water temperatureand fill the flask, and make the meniscus setting on the indexline. Place a cap, or stopper, on the filled flask and weigh.
4. WEIGHING PROCEDURE AND CALCULATIONS
Most laboratories employ single-pan direct-reading balances for
their weighing work. Although the manufacturers' instructionsfor us£ differ in minor detail from brand-to-brand, the majoroperating features are essentially the same. Most instrumentsare equipped with a screen upon which an image is projected of a
small reticle attached to the beam. Under - ordinarycircumstances, a slight "zero" adjustment is made to the screenreading with the balance pan empty. When the pan is loaded bythe unknown object, the operator manipulates dials whichmechanically add or remove built-in weights from the internalbalance structure. On some balances, the screen readings will be"off-scale," either high or low, depending upon whether theoperator should increase or decrease the dial-operated load.When the screen is "on-scale" the balance is ready to read. Somebalances have colored lights to indicate whether an increase ordecrease of built-in load is called for. The more sensitivedirect-reading balances are constrained from swinging freelyuntil the proper dial-operated load is in place. This conditionis called "partial arrestment." On the other hand, therelatively insensitive top-loading balances (used when thephysical size of the weighing flask is large) are never arrestedexcept when the balance is being moved.
When the manual adjustment of the dial-operated load is complete,the numerical balance indication should be observed in accordancewith the manufacturer's instructions. The coarse decades areusually observed on the weight manipulation dials, and the lasttwo (or three) decades are projected on the screen. There aretwo such indications, Ig referring to the empty vessel, and IL ,
the loaded vessel. The indication referring to the water isobtained by subtraction:
I = IT ~ It,w L E
If l£ and Ij^ are observed under the same conditions the zeroadjustment, called for in the operating instructions, may beeliminated
.
These numerical indications are normally not the mass of theunknown. They are a measure on an arbitrary scale called
117

Apparent Mass (see appendix) of the load of built-in weights
which exert the same force on the balance as the unknown load
under the ambient conditions existing at the instant of the
weighing. We can write an equation indicating the equality of
the forces exerted on the balance by the water and the built-in
weights associated with Iw - After eliminating "g" from both
sides, we have
rpa"
Mw
i - —pw_
- "b PB
(1)
where MR and p B are the mass and density of the built-in weights,
m the mass of water, and p. the air density at the instant of
measurement. If we rearrange terms and divide both sides by the
density of water, we obtain an expression for the sought after
volume of water, V.
V = M.
Pw - pA1 -
PA(2)
Although the volume, V, in equation (2) is the volume of water inthe weighing flask at the instant of the weighing, it is also the
calibrated volume of the vessel under test at temperature, T. Toobtain this volume at 20 °C (the usual reference temperature) re-quires multiplication by the thermal expansion factor, K, whichinvolves the test temperature, T, and the temperature coefficientof cubical expansion, a, of the material from which the vessel is
made, thus,K = 1 - a(T-20)
and
V = M20 B Pw ~ PA
1 - K (3)
As explained in the appendix, the mass of the balance weights,
Mb, which exert the same force as the water is given by theproduct of the balance indication for the water, 1^, and theapparent mass conversion factor, Q, where
w L E
Q =
and
V20
P BD2Q
- .0012pB
PBD2Q
- .0012D20
"L Pw " pA
Pal - —
p BK (4)
Equation (4) shows the numerical value of the calibration, Vto be the product of five easily evaluated terms.
20
118

TERM 1
I. - I,
is the difference obtained by subtracting the
balance indication in grams associated with the
empty weighing flask from that associated with the
loaded flask.
[Q]
TERM 2 is the apparent mass conversion factor. An accept-able value may be found in table 3 based upon thedensity of the balance weights, Pg, and the apparentmass scale to which they are adjusted, D20 . Both Pgand D
2Qmay be obtained from the manufacturer of the
balance if the information is not on the name plate.This value need be calculated only once for eachbalance
.
TERM 3
1
Pw - pa
TERM 4
i-!a
There are two density terms which require knowledgeof air density, p^, water density, pw , and thedensity of the balance weights, Pg. Air density maybe adequately estimated by table 1. Water densityis obtained from table 2. The density of thebalance weights, pg, is obtained from the balancemaker. His quoted value will be the density at
20°C. Inasmuch as the test temperature, T, will benear 20° and the coefficient of expansion is smallthe quoted value is adequate for this work.
TERM 5 The thermal expansion factor is obtainable fromtable 4 based upon water temperature, Tw , assumed
K equal to test temperature, T, and the coefficient ofJ expansion of the vessel, a.
A sample calculation based on typical data is shown on the flowdiagram, figure 7.
Examination of these numerical values shows that the value of
V20 ,equation 4, is primarily dependent upon the term showing the
two balance indications, II - Ig • The other four terms, allnear unity, are corrections to the balance term for the variousfactors mentioned above. For calibration work which is satisfiedby an uncertainty of a percent or so, these four terms may beignored
.
Use of this complete format is a tedious task which requires theuse of four tables and the performance of a five-multiplierproduct. This is because the format is designed to accommodate a
very wide range of input data. However, this format offers a
number of advantages:
119

a. It satisfies the requirements for the calibrationof fused silica vessels of enormous thermalstability as well as plastic vessels of extremethermal sensitivity.
b. It accepts data from the rather old direct-readingbalances which were equipped with brass weights as
well as the modern instruments with steel weights.
c. It is adaptable to balances having built-in weightsadjusted to the old apparent mass vs 8.3909 scaleand the new apparent mass vs 8.0 scale.
There are few, if any, calibration laboratories which work onsuch a wide variety of vessels with so many types of instruments.The data reduction may be grossly simplified to one table and theperformance of one multiplication by restricting its applic-ability to the work most frequently performed.
For example, the vast majority of vessels which are submitted to
NBS for calibration are made of borosilicate glass so we mayeliminate a as a variable and assign to it a constant value of
0.000 010/ °C so that K becomes a single-valued function oftemperature,
K = 1 - 0.000 010 (T-20).
Additionally, all balances in the glassware calibrationlaboratory have built-in weights whose densities at 20 °C arevery nearly 7.78 g/cm 3
, so we may eliminate as a variable,assigning to it the constant value
pfi
= 7.78 g/cm 3.
The built-in weights of these balances have all been adjusted toapparent mass vs 8.3909, so that we may eliminate Q as avariable, assigning to it a constant value of
Q = 1.000 011 2.
Without significant error we may assign values for the density ofair and of water of
. 0.464554B - 40(.00252T - 0.020582)PA 1000(T + 273.16)
where B = barometric pressure in millimeters of mercury andthe value of relative humidity is assumed tobe 40%. [1]*
* Numbers in brackets refer to similarly numbered references atthe end of this paper.
120
(T - 3.9863) 2 T + 288.9414"
508929.2 T + 68.12963(0.999973)
which is the Tilton-Taylor formula [2] expressed in g/cm 3.
The four correction terms given in equation 4 are now reduced to
experimental constants or quantities which may be expressed in
terms of measured barometric pressure, B, and/or measured
temperature, T. If Z is the product of these four terms
The right member of equation 5 may be put into the form of a
numerical table entered with measured values of temperature and
pressure from which a value of Z may be selected, then
The table of values of Z must necessarily span the temperaturerange found in the calibration laboratory. Table 5 is an abbre-viated form of the table used in NBS glassware calibration. Forthe restricted conditions mentioned above (i.e. borosilicateglass vessels calibrated by balances with weights of 7.78 g/cm 3
density adjusted to apparent mass vs. 8.3909) table 5 and equa-tion 6 may be used with no loss of accuracy.
5. THE USE OF EQUAL-ARM BALANCES
Laboratories which employ equal-arm balances in the calibrationof glassware may find adequate procedures in NBS Circular 602
"Testing of Glass Volumetric Apparatus" by J.C. Hughes.*
* This publication is out-of-print but is available for loan atmost Government Depository Libraries throughout the country.
- 0.000 010(T-20)
121

Appendix 1. Apparent Mass
Apparent mass scales (there are two in current use) are attemptsto simplify the calibration and use of weights. They arediscussed in detail by Pontius [3]. Their background is of nointerest here but the concept should be understood because thebuilt-in weights of direct-reading balances are adjusted tonominal values of apparent mass. If water volumes are to becalculated from knowledge of density and the results of weighingtests, the weighing results must be in mass, not apparent mass.
The observed numerical indication, I, obtained from a measurementon a direct-reading balance is the apparent mass of the effectivedial-operated load pertaining to that measurement. The effectiveload is the sum of the active built-in weights plus a smalladditional amount observed on the screen. It is necessary to
convert observed values of I from units of apparent mass intounits of mass. This conversion follows directly from thedefinition of apparent mass.
DEFINITION : When, under specified ambient conditions,an unknown object exerts the same force on a balance asmass, M, of a specified hypothetical reference material,the object is said to have an apparent mass versus thereference material equal to M*, where M* is numericallyequal to M. The specified ambient conditions are (1)
temperature = 20°C, (2) air density = 0.0 01 2 g/cm 3. The
hypothetical reference material is completely specifiedby its density at 20°C. For the older apparent massscale, this specified density at 20°C, D
2Q , is 8.3909g/cm 3
, and for the more recent scale, 8.0.
By convention M* is used when the apparent mass scale is referredto density 8.3909 material, and M** when referred to 8.0 densitymaterial.
In the conversion procedure, the "unknown object" referred to in
the definition is the effective dial-operated load whose mass, M,
is to be calculated. The defining equality between the forcesexerted by the effective dial-operated load and by the mass, I,
of the hypothetical reference material is
where p B is the density of the built-in weights. The 0.0012 is
the specified air density which must exist during the defining
equality. The mass of the effective dial-operated load is then
122

M = I
PBD2Q
- .0012pB
P BD2Q
- .0012D20
Values of Pg and D20 > not snown ^n tne balance instruction
book, are available from the manufacturer.
If Q =P B
D2Q
- .0012pB
PBDw
- .0012D2Q
then M = IQ
Values of Q for various values of pB
and D2Q are given in table 3,
123

Appendix 2
The nominal values of the reference volumes of vessels are etchedon the glass walls, and may be in units of milliliters or cubiccentimeters. While, strictly speaking, milliliters are no longeran acceptable unit, for the purposes of this report, they will beconsidered as identical to cubic centimeters. The basic SI unitof volume is the cubic meter, M . Due to its large size, it is
rarely employed in glassware calibration work.
Experience has shown that a competent operator should repeatvolumetric calibrations within the limits indicated below.
VESSEL NOMINAL SIZE REPRODUCIBILITY*
Transfer Pipet 1 cm 3 0 002 3
c. .002
5 .002
10 .003
15 .005
25 .005
50 .007
100 .010
Flasks 10 3cm J 0.005 3cm J
25 .005
50 .007
100 .011200 .014
250 .017
500 .021
1000 .042
Burets 10 cm 3 0.003 cm 3
25 .005
50 .007
100 .012
* The term "reproducibility" means the maximum deviation expectedbetween two independent determinations of the volume. Todetermine the reproducibility of one's process one shouldrecalibrate one of his own vessels periodically (e.g. once amonth) to obtain a sequence of values V,, V 2 ,
V3 , V"n . From
these values one can compute an average V and a standarddeviation s.d. = VS(V-V) 2
/ (n-1) and use the quantity 3(/2)(s.d.)as the reproducibility of his process. It is essential that therecalibration be done far enough apart in time to be trulyindependent and representative of the process and the randomerrors which affect it.
124

The volumetric error associated with a
observation is a function of the magnitude of
error and the cross section area of the vessel's
Some typical values are given below.
ErrorMeniscus
in
Position 0.5 cmTypical Neck Diameters
1 cm 2 cm 3 cm
0.005 cm 0.001 cm 3 .004 cm 3 .016 cm 3 .035 cm 3
0.01 ti .002ii
.008 ii .031 " .071 "
0.05 ii
.010ii
.039ii .157 " .353 "
0.10 ii
.020it .078 ii
.314 ". 707
"
0.20 n.039 n .157 ti .628 " 1.414 "
REFERENCES
[1] Bowman, H.A. and Schoonover, R.M. , Procedure for High
Precision Density Determinations by Hydrostatic
Weighing, J. Res. Nat. Bur. Stand. (U.S.), 71C (Eng.
and Instr.), No. 3, pp. 179-198, (July-Aug. 1967).
[2] Tilton, L.W. and Taylor, J.K., Accurate Representation
of the Refractivity and Density of Distilled Water as a
Function of Temperature, J. Res. Nat. Bur. Stand.
(U.S.), 18, RP971, pp. 205-213 (Feb. 1937).
[3] Pontius, P.E., Mass and Mass Values, Nat. Bur. Stand.
(U.S.) Monogr. 133, 33 pages (1974).
faulty meniscusthe observationneck.
USCOMM-NBS-DC
125

TABLE 1
Air Density
TABLE 1A.
Listed below in table 1A are the approximate average Winter(January) and Summer (June-July) air densities for a groupof selected cities throughout the continental United States.These densities are for an assumed temperature of 23°C and
are based on information about the barometric pressure andrelative humidity supplied by the Weather Bureau.
It should be remembered that these are average air densitiesand that the actual air density at a given time and placemay differ from that given by as much as 3 percent in eitherdirection, which may result in errors in V 20 of 0.05%.
This data may be used as a guide in estimating values ofrequired for the calculation of V20 , equation 4.
NOTE CAREFULLY
in equation 4 must be expressed in g/cm 3 and the valuestabulated below are in mg/cm 3
. Therefore, tabulated valuesmust be multiplied by 0.001 (1.18 mg/cm 3 becomes 0.00118g/cm 3
)
.
This table is taken from Appendix 1 in NBS Monograph 133,Mass and Mass Values, by Paul E. Pontius.
TABLE IB.
This table provides values of air density calculated fromtemperature, barometric pressure and assumed relative humid-ity of 40%. Errors in V20 which result from use of thistable are insignificant.
126

TABLE 1A
Place
City
Birmingham..
Montgomery..
Flagstaff..
Phoenix...
Tucson...
Yuma
Little Rock.
Los Angeles....
Oakland
San Diego
San Francisco
.
Denver
Grand Junction..
Pueblo
Hartford
Washington
.
Jacksonville..
Key West
Miami
Tampa
Atlanta
Augusta
(Aiken. S.C.)
Savannah
Boise
Cairo
Chicago
Moline
Springfield.
Fort Wayne..
Indianapolis..
Burlington
Des Moines..
Dubuque
Sioux City...
Concordia...
Dodge City.
Topeka
Wichita
LouisviUe..
New Orleans.
Shreveport
Eastport..
Boston
Alpena
Detroit
Grand Rapids
Marquette
Saull Ste. Marie .
Duluth
Minneapolis
St. Paul (Airport)..
Vicksburg..
Kansas City.
St. LouUSpringfield...
Havre...
Helena..
Kalispell
Air density
Winter Summer
Place
("if/t"')
1.16
1.18
0.92
1.15
1.08
1.19
1.18
1.17
1.19
1.18
1.18
0.98 .
1.00
1.00
1.18
1.19
1.19
1.19
1.19
1.19
LIS
1.18
1.19
1.07
1.18
1.16
1.17
1.16
1.15
1.15
1.16
LIS
1.16
1.15
1.13
1.08
LIS
1.14
1.17
1.19
1.18
1.18
1.18
1.16
1.16
1.15
1.13
1.16
1.14
1.15
LIS
1.18
LIS
1.17
1.14
1.03
1.02
1.03
(mx/cmJ)
1.16
118
0.93
1.14
1.08
1.18
1.16
1.16
1.18
1.18
0.98
1.00
LOO
l.ia
1.1a
1.18
1.18
1.18
1.18
1.14
1.18
118
1.07
1.17
1.16
1.17
1.16
1.15
1.15
1.15
LIS
LIS
1.13
1.12
1.08
LIS
1.13
1.17
1.18
1.18
1.18
1.18
1.16
1.15
LIS
1.15
1.16
1.14
LIS
LIS
1.18
LIS
1.16
1.13
1.08
1.02
1.03
Slate
Nebraska.
Nevada..
New Hampshire .
New Jersey
New Mexico
New York
North Carolina..
North Dakota..
Ohio.
Oklahoma.
.
Oregon..
Pennsylvania. ...
Rhode Island
South Carolina
.
South Dakota...
Tenn
Texas..
Utah
Vermont..
Virginia...
Washington .
West Virginia..
Wisconsin
.
Wyoming..
City
Lincoln
North Platte..
Ely
Las V egas .
Concord
Newark
Albuquerque..
Albany
Buffalo
Hatteras.
Raleigh...
Bismarck
Devils Lake..
Fargo
WiUiston
Cincinnati
.
Dayton
Cleveland..
Oklahoma City
.
Baker
Medford...
Portland...
Roseburg..
Philadelphia..
Providence....
Charleston....
Columbia
Huron
Rapid City....
Knoxville (Oak
Ridge).
Memphis
Nashville
Abilene
Amarillo
Austin
Brownsville ..
Fort Worth...
El Paso
Houston
San Antonio..
Salt Lake City..
Burlington
Norfolk
Richmond
Seattle
Spokane
Walla Walla..
Elkins
Parkersburg..
Green Bay..
Madison
Milwaukee..
Casper
Cheyenne.
Sheridan...
Air density
Winter Summer
1.14
1.07
0.95
111
1.17
1.19
1.00
1.18
1.16
1.18
1.18
1.11
1.12
1.15
1.11
1.16
LIS
LIS
1.14
1.04
1.13
1.18
1.17
1.18
1.18
1.19
1.18
1.14
1.05
1.16
1.18
1.17
1.12
1.04
1.17
1.19
1.16
1.04
1.18
1.17
1.02
1.17
1.19
1.18
1.18
1.19
1.15
1.11
1.16
1.16
LIS
1.16
0.97
0.94
1.03
127

BAROMETRICPRESSURE(MM OF HG) 16°C
C f\ f\600 0 .00096C AC605 0* 00097610 0.00098615 0.00098
co a6tU n nnnc\t\0 .00099COS. A AA 1 AA0.00 100630 0.00101635 0.00102
C A A640 A AA 1 AO0 .001 02C A R645 A AA 1 A X0 . 00 1 03650 0.00104655 0.00105
CC A66 U A AA 1 A^0 .001 06c c *»665 a aa i nc0 . 00 1 06670 0.00107675 0.00108
can A A A 1 AnU .U01 096S5 A AA 1 1 A0.001 10690 0.001 10695 0.0011 1
inn#00 0 .001 12*? ac705 0.001 13710 0.001 14715 0.001 15
720 0.001 15725 0.001 16730 0.001 17735 0.00118
740 0.001 19745 0.001 1
9
750 0.00120755 0.00121
760 0.00122765 0.00123770 0.00123775 0.00124
780 0.00125785 0.00126790 0.00127795 0.00127
18°C 20 °C
0.00095 0.000950.00096 0.000950.00097 0.000960.00098 0.00097
0.00099 0.000980.00099 0.000990.00100 0.000990.00101 0.00100
0.00102 0.001010.00103 0.001020.00103 0.001030.00104 0.00103
0.00105 0.001040.00106 0.001050.00107 0.001060.00107 0.00107
0.00108 0.001070.00109 0.001080.001 10 0.001090.00110 0.00110
0.00111 0.001100.00112 0.001110.00113 0.001120.00114 0.00113
0.001 14 0.001 140.00115 0.001140.001 16 0.001 150.00117 0.00116
0.001 18 0.001 170.00118 0.001180.001 19 0.001 180.00120 0.00119
0.00121 0.001200.00122 0.001210.00122 0.001220.00123 0.00122
0.00124 0.001230.00125 0.001240.00126 0.001250.00126 0.00126
TABLE IB
22 °C 24 °C
0.00094 0.000930.00095 0.000940.00096 0.000950.00096 0.00096
0.00097 0.000960.00098 0.000970.00099 0.000980.00099 0.00099
0.00100 0.001000.00101 0.001000.00102 0.001010.00103 0.00102
0.00103 0.001030.00104 0.001030.00105 0.001040.00106 0.00105
0.00107 0.001060.00107 0.001070.00108 0.001070.00109 0.00108
0.00110 0.001090.00110 0.001100.00111 0.001100.00112 0.0011 I
0.00113 0.001120.00114 0.001130.00114 0.001140.00115 0.00114
0.00116 0.001150.00117 0.001160.001 18 0.001 17
0.00118 0.00118
0.001 19 0.001 180.00120 0.001190.00121 0.001200.00122 0.00121
0.00122 0.001210.00123 0.001220.00124 0.001230.00125 0.00124
26 °C 28 °C
0.00093 0.000920.00093 0.000930.00094 0.000930.00095 0.00094
0.00096 0.000950.00096 0.000960.00097 0.000970.00098 0.00097
0.00099 0.000980.00100 0.000990.00100 0.001000.00101 0.00100
0.00102 0.001010.00103 0.001020.00103 0.001030.00104 0.00103
0.00105 0.001040.00106 0.001050.00107 0.001060.00107 0.00107
0.00108 0.001070.00109 0.001080.00110 0.001090.00110 0.00110
0.00111 0.001100.00112 0.001110.00113 0.001120.00114 0.00113
0.00114 0.001130.00115 0.001140.00116 0.001150.00117 0.00116
0.00117 0.001170.00118 0.001170.00119 0.001180.00120 0.00119
0.00121 0.001200.00121 0.001200.00122 0.001210.00123 0.00122
128

j 0.0°C 0. 1°C 0.2^: 0 . 3 °C 0 .4°C 0.5°C 0.6°C 0. 7°C 0. 8°C 0. 9° C
.0 .999840 .999846 . 999853 .999859 .999865 . 999871 .999877 .999883 .999888 .9993931.0 .999899 .999903 .999508 .955913 .9599 17 .999521 .999925 .999929 .999933 . 999937c «v Q QQQ4
n
• 7 777 ** U . 99994
3
. 999945 . 999949 . 99995 2 . 999954 .999956 9 999959 .99996 i .9999633.0 .999964 .999966 . 99996 7 # 999968 . 999959 . 999970 m 99997
l
. 99997
1
. 999972 . 9999724. 0 • 9 999 72 , 999972 . 999972 . 999971 . 99 gg 7
1
. 999970 ,999969 . 999968 .999957 . 99996 5
5.0 .999964 .999962 .999960 .999958 .999956 . 999954 .99995
1
.999949 .999946 . 9999436.0 •9S9940 .995937 . 999933 .999930 . 999926 .999922 .999918 .999914 .999910 . 9999067 fi . g 9990
1
• 7 7 Q 7 O cog QQ1• 777 O' tZ. . 99966 7 . 9996 81 . 909876 . 99 Q 8 7 1 . 99966 5 9 99 860• 7 J ' <J VJ \J . 9996 54fa n . 99984 8 m 999 2 • 9996 3 5 5 99629 .999822 . 9598 16 . 999 80 9 .999802 . 999795 . 9997 g 7
9.0 « 9 99780 oqq T 7 ~\• 7 7 7 I 1 J . 999765 QQQ7 S 7 . 999749 . 999741 .999 73 3 . 99 97 25 .99971
6
. 999707
10.0 .999699 .999690 .999681 .959672 .999662 .999653 .999643 .999634 .999624 . 55961411.0 .999604 .999594 .999583 .999573 .999562 .999552 .999541 •999530 .999519 . 59550712 «0 . 999496 5594 85 m 999 47 3 .999461 • 999449 .999437 .99942 5 .99941
3
. 99940
1
. 9993 8813 .0 .9 9937 6 .999363 . 999 350 . 999337 . 999324 . 9993 1
1
. 999297 . 999284 .999270 .99925614.0 •999243 . 9592 29 . 99921
5
.999200 .999186 . 9991 72 .999 157 . 999142 . 9991 28 • 9991 I 3
15.0 .999098 .999083 .999067 .999052 .999036 .999021 .999005 .998989 .998973 .99895716.0 .998941 .998925 .998908 .998892 .996375 .598858 .958841 .998824 .998807 .99879017.0 . 998773 . 998755 . 998738 .99872 0 . 998"'02 . 998684 .998666 . 99 364 8 .998630 . 99861218 .0 .998593 .998575 .998556 .998537 . 998519 . 998500 .998480 .998461 .998442 . 99842 2
19.0 . 998403 . 958383 . 998364 . 998344 .998324 . 998304 .998284 .993263 .998243 . 998222
20.0 .998202 .998181 .998160 .996139 . 998118 .998097 .998076 .998055 .998033 .99801221.0 .997990 .997968 .997947 .997925 .997903 .997881 .997858 .997836 .957814 . 99779122.0 •997768 .997746 • 997723 . 997700 .997677 . 997654 .997630 .997607 .597584 . 99756023.0 .99753 6 •9975 13 .997 489 .9 97465 •997441 • 997417 • 997 39 2 . 997368 .997344 . 9973 1
9
24.0 •997294 • 9972 70 • 99724 5 .997220 • 997195 . 9971 70 • 997 14 5 .997 119 •997094 . 7 7 1 \J O O
25.0 .997043 .997017 . 996991 .996966 .996940 .996913 .996887 .996861 .996835 . 99680826.0 .996782 .996755 .996723 .996702 .996675 . 996e48 .996621 .996593 .996566 .996539C i . u Q Q AS 1 1 QC AZi AZ* oc A4 o a Q C ,'i 1.77 OtU 1 CQa7 7"2
. 7 7O .3 / Z>C c A "X A. *\ • 7 7 O J lO • 7 70 C. O 0 . 7 7 O <L O U
? ft n Q Q A 7 ^ 3. 7 7 D C. J i. • 770£ qqj: ITS 7701HO QQ A I 1 7 • 77 O UO U • 99603
1
QQAfifl 1 QCi S Q 7 9. 7 7 J 7 / C.
29 .0 • 995943 •9959 14 •995684 •995855 . 7 7 JO £ J . 995795 • 9 95 76 5 QQS77, a. 7 7 JJ IOO • 995 70 6 • 99 56 76
30.0 . 995645 . 99561
5
. 995 58 5 . 9 95554 . 995524 . 595493 .995463 .995432 •99540
1
. 99537031.0 .995339 .995308 .995277 .995246 .995214 . 995183 .995151 .995120 .995088 .99505632.0 .995024 . 994992 . 994560 .954528 .994896 .9948o4 .994831 .994799 '.994766 . 99473433.0 .994701 .994668 .994635 .994602 .994569 .9945 36 .994503 •994470 .994436 • 99440334.0 .994369 .994336 . 994302 .994268 .994234 . 994201 .994 167 . 994132 .994098 . 994064
35.0 .994030 .993995 . 9939ol .993926 . 993891 .993857 .993322 .993787 .993752 .99371736.0 .993682 .993647 .99361
1
.993576 .993541 .993505 .993469 . 993434 .593398 .99336237.0 .993326 .993290 .993254 .993218 .993182 .993146 .993109 .993073 .993036 . 99300038.0 .992563 .992926 .992889 .992652 .992815 .592778 .992741 •992704 .992667 . 99262939.0 .992592 .992554 .992517 .992479 . 992442 . 992404 .992366 .992328 .992290 •992252
TABLE 2: Density of Air Free Water in g/cm 3 as a Function of the CelsiusTemperature Scale, Based on the Work by H. Wagenbreth and W.Blanke, PTB-Mitteilungen 6-71.
129

PB
Q when 1^ wrien
= o.UUOO g/cm J20 o.jyuy g/cm
7,70 1.0000058 1.00001287,72 1.0000054 1.00001247.74 1.0000050 1.00001207.76 1.0000046 1.00001 16
7.78 1.0000042 1.00001 12
7.80 1.0000038 1.00001087.82 1.0000035 1.00001047.84 1.0000031 1.00001017.86 1.0000027 1.00000977.88 1.0000023 1.00000937.90 1.0000019 1.00000897.92 1.0000015 1.00000857.94 1.000001
1
1.00000817.96 1.0000008 1.00000777.98 1.0000004 1.00000748.00 1.0000000 1.00000708.02 0.9999996 1.00000668.04 0.9999993 1.00000628.06 0.9999989 1.00000598.08 0.9999985 1.00000558.10 0.9999981 1.00000518.12 0.9999978 1.00000488.14 0.9999974 1.00000448.16 0.9999971 1.00000408.18 0.9999967 1.000003 7
8.20 0.9999963 1.00000338.22 0.9999960 1.00000308.24 0.9999956 1.00000268.26 0.9999953 1.00000238.28 0.9999949 1.00000198.30 0.9999946 1.00000168.32 0.9999942 1.00000128.34 0.9999939 1.00000098.36 0.9999935 1.00000058.38 0.9999932 1.00000028.40 0.9999929 0.9999998
TABLE 3: Values of the apparent mass conversion factor,
Q, defined in the appendix as
PB (D 20- .0012)
Q =D 20 (P
B- .0012)
when is the density of the balance weightsin g/cm-*, and D 20 is the apparent mass scaleto which the weights are adjusted.
130

Fused Boro- Poly- Poly-
Water Silica Silicate Soft propylene CarbonateTemp (Quartz) Glass Glass Plastic Plastic
(°c) ot=l . 6 a=10 a=25 a=240 a=450
i s a i aaaaax1 . uuu uuo i nr\r\no c\
I . U UUUt
u
1
•
UUUUj
u
i n A r\ a a A 1 AAAQAD1 a s1 O . J i aaaaa^ i a aa a i s l O AA A\
o
1 AAA ^£ A 1 AAA67 S
i o a i aaaaai>1 • UUUUU6 t aaa a i n
1 . UUUU I
u
1 AAAA9S 1 AAA94A 1 0004501 9 5i y »
i aoaaai i aaaaas 1 AAA A 1 X 1 AAA 120 1 00022520-0 1 .0000001 • w VSw Is 1/ U 1 000000 1 000000 1 0000001 . w W w vW \J 1 .00000020.5 >j»yyyyyy 0 QQQ0Q5w. y yy yy j 0 QQOOBR» y y y yo o 0 90QRBA 0 99977521.0 0.999998 0.999990 0.999975 0.999760 0.99955021.5 0.999998 0 .999985 0 . 999963 0. 999640 0.99932522.0 0 .999997 0 . 999980 0.999950 0 . 999520 0.999 10022.5 0 .999996 0.999975 0 . 99993R 0.999400 0 99RR7523.0 0.999995 0.999970 0.99992 5 0 9992R0 0 99R650vy « y yg vy v23.5 0 . 999965 0 9999 1
^
\j*yyyy\*j 0 999 160\j * y y y ivju 0 99B42524.0 0 . 999Q94 0 0000RA A 0900AA A 000040 0 . 99B 20024.5 a o oo o s
s
A OOOSBBu
.
yy? oo d A O OH 09 A 0 QQ7975\j » y y 1 y 1
? 5 a A QQQQQ9 A O OO OS A A Q O o a 7 S A Q OB BAA 0 QQ775025 5 A Q OO O O
1
U
.
y y
y
BOO A QOBfiBA 0 QQ75259& a A QOQQQH A o o a D S A A O OB S£ A
<J » y yo -'O u A 00 7 ^on
26.5 0.999990 0.999935 0.999838 0.998440 0.99707527.0 0.999989 0.999930 0.999825 0.998320 0.99685027.5 0.999988 0.999925 0.999813 0.998200 0.99662528.0 0.999987 0.999920 0.999800 0.998080 0.99640028.5 0.999986 0.999915 0.999788 0.997960 0.99617529.0 0.999986 0.999910 0.999775 0.997840 0.99595029.5 0.999985 0.999905 0.999763 0.997720 0.99572530.0 0.999984 0.999900 0.999750 0.997600 0.995500
TABLE 4 : Values of the expansion factor K as a function of Cesttemperature for various materials from which laboratory wareis made. The numerical values of a, the volumetriccoefficient of thermal expansion, given in the columnheadings are parts per million per degree centigrade. In
plastics, columns 4 and 5, this coefficient may vary frombatch-to-batch, and the values stated are typical, mid-rangevalues. In the text K is defined as
K = 1 - a(T-20)
131

TEMP BAROMETRIC PRESSURE (MM OF HQ)( °C) 620 640 660 680 700
16.5 1 .002390 1.002418 1.002446 1.002473 1.00250119.0 1 .002480 1.002508 1.002536 1.002564 1.00259219.5 1 .002573 1.002601 1.002629 1.002657 1 .00268520.0 1.002669 1.002697 1.002725 1.002753 1.00278020.5 1.002768 1.002795 1.002823 1 • 0028 5
1
1.00287921 .0 1 .002869 1.002897 1.002924 1.002952 1.00298021 .5 1.002973 1.003000 1.003028 1.003056 1 .00308322.0 1 .003079 1.003107 1.003134 1.003162 1.00319022.5 1.003188 1.003216 1.003243 1.003271 1.00329823.0 1.003299 1.003327 1.003354 1.003382 1.00341023.5 1.003413 1.003441 1.003468 1.003496 1 .00352324.0 1 .003530 1.003557 1.003585 1.003612 1.00364024.5 1.003649 1.003676 1.003704 1.003731 1.00375825.0 1.003770 1.003797 1.003825 1.003852 1.00388025.5 1 .003894 1.003921 1.003949 1.003976 1 .00400326.0 1 .004020 1 .004047 1.004075 1 .004102 1.00412926.5 1.004149 1.004176 1.004203 1.004231 1.00425827.0 1.004280 1.004307 1.004334 1.004361 1.00438927.5 1.004413 1.004440 1.004467 1.004495 1.00452228.0 1 .004549 1.004576 1.004603 1.004630 1.004657
TEMP BAROMETRIC PRESSURE (MM OF HG)(°C) 720 740 760 780 800
18.5 1 .002529 1 .002557 1.002585 1.002613 1.00264119.0 1 .002620 1 .002647 1.002675 1.002703 1.00273119.5 1 .002713 1 .002740 1.002768 1.002796 1.00282420.0 1 .002808 1 .002836 1.002864 1 .002892 1.00291920.5 1 .002906 1 .002934 1.002962 i .002990 1.00301721.0 1 .003007 1 .003035 1 .003063 1.003091 1.00311821,5 1 .00311 1 1.003139 1.003166 1.003194 1.00322222.0 1 .003217 1 .003245 1.003272 1.003300 1.00332822.5 1 .003326 1 .003353 1.003381 1.003409 1.00343623.0 1 .003437 1 .003 465 1.003492 1.003520 1 .00354723.5 1 .003551 1 .003578 1.003606 1.003633 1.00366124.0 1 .003667 1 .003695 1.003 722 1.003 750 1.00377724.5 1 .003 786 1 .003813 1.003841 1.003868 1.00389625.0 1 .003 907 1.003934 1.003962 1.003989 1.00401725.5 1 .00403
1
1 .004058 1.004085 1.004113 1.00414026.0 1 .004157 1 .004184 1.00421
1
1.004239 1 .00426626.5 1 .004285 1 .004312 1.004340 1.004367 1 .00439427.0 1 .004416 1 .004443 1.004470 1.004498 1.00452527.5 1 .004549 1 .004576 1.004603 1.004631 1.00465828.0 1 .004685 1 .004712 1.004 739 1.004 766 1.004793
5: Values of Z (equation 6) as Explained in the Text.
132

nINDEXLINE
TO CONTAIN
NOMINALVOLUME
TODELIVER
TD
lzo°C
DELIVERYTIMEIN
SECONDS
635*3
113
SEC
#0VOLUMETRIC
FLASK PIPET BURET
^57
SO.
100 •
to*10 SICONA<N
MEASURINGFLASK
10* c
10 ticDM* in
: 80
CYLINDRICALGRADUATE
FIGURE 1
SHOWN HERE ARE THE VARIOUS TYPESOF VOLUMETRIC APPARATUS WHICHMAY BE CALIBRATED BY -THE TECHNI-QUES DESCRIBED IN THIS REPORT.
133

FIGURE 2
DRY AIR BOTTLES AND DRYING RACKUSED TO DRY VOLUMETRIC GLASSWARE
PRESSURE IS ABOUT 1 LB PER SQ IN.
DRYING USUALLY TAKES LESS THAN 10 MINUTES
134

MENISCUS SURFACEBRIGHTLY ILLUMINATEDSCREEN —
FRONT SIDE OFINDEX LINE
REAR SIDE OFINDEX LINE
EXAGGERATED CURVATUREMENISCUS SURFACE
CIRCUMFERENTIAL INDEXLINE ON VESSELLINE - OF -SIGHT TOFRONT SIDE OF INDEX
OBSERVERS EYE
LINE-OF- SIGHT TOREAR SIDE OF INDEX
LINE-OF-SIGHT TOMENISCUS
OBSERVER'S VIEW FROM SLIGHTLYBELOW THE HORIZONTAL LEVEL OF
THE INDEX LINE.
BLACK RUBBER OPAQUE SCREENPLACED A FRACTION OF AMILLIMETER BELOW THE INDEXLINE.
SIDE VIEW
FIGURE 3
THESE DIAGRAMS ILLUSTRATE THE PROCEDURE FOR OBSERVINGTHE MENISCUS POSITION DESCRIBED IN THE TEXT.
II
135

FIGURE 4
VARIOUS RUBBER COLLARS USED TO ASSISTIN THE MENISCUS SETTING DURING THECALIBRATION OF BURETS, PIPETS AND FLASKS
136

I
FIGURE 4A
A FLASK WITH A COLLAR-SHAPED PIECE OF BLACKRUBBER TUBING IN PLACE BELOW THE INDEX LINEWHICH RENDERS THE PROFILE OF THE MENISCUSCLEARLY VISIBLE AGAINST A LIGHT BACKGROUND
137

FIGURE 5
APPARATUS USED IN THE CALIBRATION OF A 50ML BURET. THE U-SHAPED TUBE AT THE TOP IS CONNECTED TO A DISTILLED WATERSUPPLY LINE USED TO FILL THE BURET. THE WEIGHING FLASKUNDER THE BURET IS IN POSITION, WITH ITS TIP IN CONTACTWITH THE NECK OF THE FLASK TO RECEIVE THE MEASURED VOLUME.THE BLACK COLLARS AT THE TOP OF THE BURET ARE AN AID INSETTING THE MENISCUS. THE THERMOMETER IS USED TO OBTAIN AMEASURE OF THE TEMPERATURE, OF THE WATER IN THE BURET.
138

FIGURE 6
A
THE PIPET IS DELIVERING ITS MEASURED VOLUME INTOA WEIGHING FLASK, WITH ITS TIP IN CONTACT WITHTHE NECK OF THE FLASK. WHEN THE OUTFLOW HASCEASED THE FLASK IS REMOVED, STOPPERED AND WEIGHED.
139

FIGURE 6
TRANSFER PIPET CLAMPED VERTICALLY ON A STAND IN FRONT OF AFROSTED GLASS LIGHT BOX. THE TIP IS IN CONTACT WITH A PIECEOF FROSTED GLASS WHILE THE SETTING OF THE MENISCUS IS MADE.THE HOSE ON THE GLASS TUBE ABOVE THE STOPCOCK IS CONNECTEDTO A TRAP BOTTLE WHICH, IN TURN, IS CONNECTED TO THE VACUUMLINE. THE HOSE CLAMP IS USED TO SLOW THE FLOW WHILE MAKINGTHE MENISCUS SETTING. THE STOPWATCH IS FOR TIMING THEDELIVERY OF THE PIPET. THE TEMPERATURE OF THE DISTILLEDWATER IS TAKEN IN THE BEAKER FROM WHICH THE PIPET IS FILLED.
140

INPUT DATA ITEMS
VOLUMETRIC EXPANSIONa COEFFICIENT OF VESSEL
UNDER TEST
T WATER TEMPERATURE
GEOGRAPHIC TEST SITE*
MANUFACTURER ESTIMATE
P B OF DENSITY OF BUILT-
IN BALANCE WEIGHTS
APPARENT MASS SCALE
D20 TO WHICH BALANCEWEIGHTS ARE ADJUSTED
I BALANCE INDICATION FORLOADED WEIGHING FLASK
TYPICAL VALUES
IBALANCE INDICATION FOREMPTY WEIGHING FLASK
1THE CALIBRATION VOLUME,
VQ
, IS THE PRODUCT OF
THESE FIVE TERMS
.000010
T = 24.9 °C
TABLE4
K = .999951K = .999951
TABLE2
Pw= .997068 g/cm-
Washington , D.C. TABLE1A
PA= .00118 g/cro 3
'B = 7.78 g/cm ;
D2 0 = 8.3909 g/cm 3
Pw " PA
1-^°B
= 1.004129
IL - 93.1056 g
TABLE Q = 1.000011
3 [ ]
IE - 83.1513 g
TL~ h
* AIR DENSITY VALUES BASED UPON GEOGRAPHIC LOCATIONARE QUITE ADEQUATE FOR THIS WORK. FOR A BETTERVALUE, TABLE IB PROVIDES AN ESTIMATE BASED UPONMEASURED TEMPERATURE AND BAROMETRIC PRESSURE ANDASSUMED RELATIVE HUMIDITY.
cnr
= .999848
1.000011
= 9.9543 g
V2Q
- 9.9935 cm 3
FIGURE 7
141


143

U.S. Department of Commerce a nnrMmv \/ttJuanita M. Kreps ArrC.INDIA Vll
Secretary
National Bureau of StandardsErnest Ambler, Acting Director
Rational ££ttram of jltatulartte
Certificate
Standard Reference Material 935
Crystalline Potassium Dichromate
for Use as an Ultraviolet Absorbance Standard
R. W. Burke and R. Mavrodineanu
This Standard Reference Material consists of crystalline potassium dichromate of established purity. Solutions
of known concentrations of this SRM in 0.001 N perchloric acid are certified for their apparent* specific
absorbances**, Ca , at 23.5 °C.
This SRM is intended to be used as a reference standard for the verification of the accuracy and linearity of the
absorbance scale of absorption spectrometers that can provide an effective spectral bandpass of 1.2 nm or less
at 235 nm, and 0.8 nm or less at 257, 313, 345, and 350 nm. Such verification is accomplished by comparing the
measured apparent absorbances, Aa , to the Aa calculated from the certified €a values as described under
"Instructions for Use."
Table 1 gives the certified values of Ca in kgg -cm1
for five concentrations of the SRM 935 potassium
dichromate in 0.001 N perchloric acid at 23.5 °C and the indicated wavelengths and spectral bandpasses for a
1-cm internal pathlength.
Table 1. 6a , Apparent Specific Absorbance,3
kg g' cm
Nominal Wavelength and (Bandpass) nmConcentration
Uncertaiig'kg-
'
235.0(1.2) 257.0(0.8) 313.0(0.8) 345.0(0.8)b
350.0(0.8)
0.020 12.260 14.262 4.805 10.604 10.672 ± 0.034
.040 12.304 14.318 4.811 10.603 10.682 ± .020d
.060 12.347 14.374 4.816 10.602 10.692 ± .020d
.080 12.390 14.430 4.821 10.601 10.701 ± .020d
.100 12.434 14.486 4.827 10.600 10.711 ± .020d
6 a values are given to the third decimal place to preserve the smooth variation of the data with concentration, although the
uncertainties are in the second decimal place.
Wavelength 345.0 nm is near one of the two isosbestic points in HCrOJ/CnO? spectra. Because it is on the slope of the composite
spectrum, reproduction of the 6a values is dependent on wavelength accuracy. Measurements at this wavelength should be made only for
verification of the linearity of the absorbance scale.
6a values are not corrected for the effects of internal multiple reflections within the cuvette, nor have the weights been cor-
rected to vacuum. With these two exceptions, the uncertainties given include all known systematic errors and the 95 percent confidence
interval of the mean.
At wavelength 313.0 nm, the uncertainty is reduced to ±0.010.
*The term "apparent" is used because no corrections have been applied to the data for the effects of internal multiple reflections within the
cuvette or for buoyancy, i.e., the weights used to express concentrations have not been corrected to vacuum. These combined corrections
do not exceed 0.2 percent. The specific absorbances are given in reference 1.
"The nomenclature used in this certificate is that recommended by K. D. Mielenz, Anal. Chem. 48, 1 093-1 094 ( 1976), which is reproduced
in the Appendix of NBS Special Publication 260-54.
Washington, D.C. 20234 J. pau l Cali, ChiefJune 1, 1977 Office of Standard Reference Materials
(over)
144

The overall direction and coordination of the technical measurements leading to this certificate were per-
formed under the joint chairmanship of I. L. Barnes and J. R. DeVoe.
The technical and support aspects involved in the preparation, certification, and issuance of this Standard
Reference Material were coordinated through the Office of Standard Reference Materials by R. W. Seward.
We wish to acknowledge:The contributions of K. D. Mielenz, NBS Analytical Chemistry Division, for his many
valuable discussions and suggestions, and H. H. Ku, NBS Applied Mathematics Division, for his statistical
treatment of the data; the cooperation and early support of the National Institute of General Medical Sciences in
the research leading to this SRM; and the encouragement of George N. Bowers, Jr., M.D., Hartford Hospital,
Hartford, Conn., and Royden N. Rand, Ph.D., Eastman Kodak Co., Research Laboratories, Rochester, N.Y.
PREPARATION AND CERTIFICATION
The details of the preparation and certification of SRM 935 are provided in NBS Special Publication 260-54,
Certification and Use of Acidic Potassium Dichromate Solutions as an Ultraviolet Absorbance Standard [2].
This publication should be referred to every time SRM 935 is to be used. Briefly, the transmittance, T, of the
solutions prepared from the undried, as received, material were measured with the NBS Institute for Materials
Research high-accuracy transmission spectrometer [3].
The €a values were calculated for each wavelength using the relation:
ea "TTT~"bTr (1)
where:
€a = apparent specific absorbance
Aa = apparent absorbance
Ds= transmittance density of the sample solution, -logioTs
Db= transmittance density of the blank solution, -logioTb
b = internal cuvette pathlength, cmc = concentration, by weight, of K.2Cr207 solution, g kg
The crystalline potassium dichromate used for SRM 935 is a special lot of analytical reagent grade material
obtained from the J. T. Baker Chemical Co., Phillipsburg, N.J.
Assay: A coulometric assay of the purity of the undried material was performed by G. Marinenko of the NBSAnalytical Chemistry Division. The purity ofSRM 935, expressed as an oxidant, was found to be 99.972 ± 0.005
percent where the uncertainty figure represents the 95 percent confidence interval for the mean based on 1
1
degrees of freedom. In addition, the material was examind by optical emission spectrometry for trace elemental
impurities by J. A. Norris of the NBS Analytical Chemistry Division. The only significant impurities detected
were sodium and rubidium. Their concentrations were estimated to be in the range of 0.02 and 0.03 percent,
respectively. Drying at 105 °C for 12 hours showed that the surface moisture of this material was less than
0.01 percent.
Stability:
Solutions prepared from SRM 935 in the concentration range indicated in table 1 and made according to the
instructions given in NBS SP 260-54 have been found to be stable within the uncertainties given in table 1 for at
least six months when stored at room temperature and protected from evaporation and exposure to light.
INSTRUCTIONS FOR USE
The use of SRM 935 as an absorbance standard requires the careful preparation of a series of solutions of
known concentrations, c, of the potassium dichromate in 0.001 N perchloric acid. These solutions are trans-
ferred to a quartz cuvette of known pathlength, b, and their apparent absorbances measured at wavelengths
235, 257, 313, and 350 nm, using the spectral bandpass requirements given in table 1. The preparation andmeasurement of these solutions are described in detail in Section 5 of NBS SP 260-54.
145

The accuracy of the absorbance scale of the spectrometer being tested is ascertained by comparing the measured
apparent absorbances, Aa , of a series of 0.001 N perchloric acid solutions containing 0.020 to 0.100 gram
K^C^Cb/kgto the Aa values calculated from the certified 6a values. Although the data in table 1 are given for
nominal concentrations of 0.020, 0.040, 0.060, 0.080, and 0. 100 g K 2Cr207/kg, the €a values for concentrations
between these nominal concentrations can be determined by linear interpolation. Using the appropriate €a
values, the calculated Aa values at 23.5 °C are obtained from the expression:
Aa = 6a x b x c (2)
An example of the calculation of Aa for one concentration of KjCnCb under a specified set of conditions is
shown below. Calculations of Aa for other concentrations and wavelengths are performed in a similar manner.
Conditions: Wavelength = 350 nm, spectral bandpass 0.8 nm or less
b = 0.9982 cmc = 0.04375 gkg
1
t = 23.5 °C
From column 6, table 1, the €a for concentrations of 0.040 and 0.060 g-kg"1
are 10.682 and 10.692, respectively.
The corresponding €a for c = 0.04375 g-kg is:
fa = 10.682 + y (.0.692 -.0.682)
Ca = 10.682 + 0.0019
Ca = 10.684
The calculated apparent absorbance, Aa , from equation 2, is:
Aa = 10.684 x 0.9982 x 0.04375
Aa = 0.4666
The uncertainty, AAa , in the calculated Aa is determined from the combined uncertainties in €a , b, and c in
equation 2, provided no other systematic errors are present. Thus:
AAa = be|A€a |
+ eac |Ab
|+ €ab |
Ac|
(3)
To evaluate AAa , A€a is taken from column 7 of table 1 and the Ab and Ac values must be determined experi-
mentally.
In the experiments performed to obtain the 6a values in table 1 , the uncertainties for b and c did not exceed 1 part
in 10 and 2 parts in 10 , respectively.
The solution of equation 3 gives:
AAa = 1(0.044) (0.020) + 10.7(0.044) (0.0001) + 10.7(1) (0.0000088)
= 0.0010
Thus, the uncertainty of Aa , for the above set of conditions, is ±0.0010.
The correction of the absorbance scale of the absorption spectrometer under test is determined by plotting the
differences between Aa measured and Aa calculated as a function of absorbance. A typical plot of such a graph
is shown in figure 1. The apparent absorbances measured on this instrument at 350 nm are accurate when the
indicated correction is subtracted from the corresponding absorbance scale reading, provided that the
conditions of wavelength accuracy, spectral bandpass, and absence of stray light are fulfilled as specified in
NBS SP 260-54. Correction curves for wavelengths 235, 257, and 313 nm are obtained in a similar manner.
146

Figure 1. Correction curve for the absorbance
scale of a precision spectrometer. The error bars
are the sum of the errors arising from the uncertain-
ties in the certified apparent specific absorbances,
€a , cuvette pathlength, b, and concentration, c.
0.2 0.4 0.6
Absorbance
0.8 1.0
Temperature Correction:
Although ea values in table 1 are certified at 23.5 °C, SRM 935 can be used as an absorbance standard at other
temperatures in the range 20 to 30 °C provided corrections are made to the €a values. Over this range the
apparent specific absorbances decrease linearly with increasing temperature for all the wavelengths given in
table 1. The corresponding temperature coefficients, k, for these wavelengths are given in table 2.
Table 2. Variation of €a with Temperature Over the Range 20 to 30 °C.
A, nm Temperature Coefficient, k
Percent per degree Celsius
235
257
313
345
350
-0.05
-0.05
-0.02
-0.08
-0.05
The value of 6a at any temperature in the range 20 to 30 °C can be calculated from the certified value and the
appropriate temperature coefficient using the relation:
t = 23.5Ca — Ca
[1+7o^- 23 - 5
>]
where: Ca = apparent specific absorbance at temperature t (°C)
23 5
Ca' = apparent specific absorbance certified at 23.5 °C.
k = temperature coefficient, percent per °C.
REFERENCES
1. Burke, R. W., and Mavrodineanu, R., Acidic Potassium Dichromate Solutions as Ultraviolet Absorbance
Standards, J. Res. Nat. Bur. Stand. (U.S.), 80A (Phys. and Chem.), No. 4, 631-636 (July-Aug. 1976).
2. Burke, R. W., and Mavrodineanu, R., Certification and Use of Acidic Potassium Dichromate Solutions as
an Ultraviolet Absorbance Standard, NBS Spec. Publ. 260-54 (1977). Copies may be obtained from the
Office of Standard Reference Materials, National Bureau of Standards, Washington, D.C. 20234.
3. Mavrodineanu, R., An Accurate Spectrophotometer for Measuring the Transmittance of Solid and Liquid
Materials, J. Res. Nat. Bur. Stand. (U.S.), 76A (Phys. and Chem.), No. 5, 405-425 (1972).
147

NBS-114A (REV. 7-73)
U.S. DEPT. OF COMM.BIBLIOGRAPHIC DATA
SHEET
1. PUBLICATION OR REPORT NO.
NBS SP-260-54
2. Gov 't AccessionNo.
3. Recipient's Accession No.
4. title and subtitle standard Reference Materials:
Certification and Use of Acidic Potassium
Dichromate Solutions as an Ultraviolet
Absorbance Standard—,Sf?M 935
5. Publication Date
August 19776. Performing Organization Code
7. AUTHOR(S)
R. W. Burke and R. Mavrodineanu8. Performing Organ. Report No.
9. PERFORMING ORGANIZATION NAME AND ADDRESS
NATIONAL BUREAU OF STANDARDSDEPARTMENT OF COMMERCEWASHINGTON, D.C. 20234
10. Project/Task/Work Unit No.
11. Contract/Grant No.
12. Sponsoring Organization Name and Complete Address (Street, City, State, ZIP)
Same as Item 9
13. Type of Report & PeriodCovered
14. Sponsoring Agency Code
15. SUPPLEMENTARY NOTES
Library of Congress Catalog Card Number: 77-600027
16. ABSTRACT (A 200-word or less factual summary of most significant information. If document includes a significant
bibliography or literature survey, mention it here.)
The apparent specific absorbances of 0.001N perchloric acid
solutions of a high purity potassium dichromate salt, Standard
Reference Material (SRM) 935, have been certified at four wavelengths in
tlie ultraviolet—235 , 257, 313 and 350 nm. This publication describes in
detail the measurements leading to the certification, and discusses the
use of this SRM as a transfer standard for verifying the accuracy of the
absorbance scale of narrow bandpass absorption spectrometers in this
important wavelength region. Apparent specific absorbance data are also
reported near two predicted isosbestic wavelengths in the acidic
HCrCU /Cr 2 07 system. The apparent specific absorbances at 345 nm are
sufficiently independent of concentration that absorbance measurements at
this wavelength can be used for verifying absorbance linearity to about
one part in a thousand.
17. KEY WORDS (six to twelve entries; alphabetical order; capitalize only the first letter of the first key word unless a proper
name; separated by semicolons) Absorbance linearity; accuracy of transmittance orabsorbance scale; acidic potassium dichromate solutions; calibration ofultraviolet spectrometers; certification of apparent specific absorbancesisosbestic wavelengths; liquid filters; Standard Reference Material;
18. AVAILABILITY [^Unlimited transfer standards
IFor Official Distribution. Do Not Release to NTIS
p? Order From Sup. of Doc, U.S. Government Printing OfficeWashington, D.C. 20402, SD Cat. No. CI\ 10: 2bQ- t
)4
1 !Order From National Technical Information Service (NTIS)Springfield, Virginia 22151
19. SECURITY CLASS(THIS REPORT)
UNCLASSIFIED
20. SECURITY CLASS(THIS PAGE)
UNCLASSIFIED
21. NO. OF PAGES
157
22. Price
$3.00
ft U. S. GOVERNMENT PRINTING OFFICE: 1 977.-21*0-848/287 USCOMM-DC 29042-P74

NATIONAL BUREAU OF STANDARDS
The National Bureau of Standards 1 was established by an act of Congress March 3, 1901. The Bureau's overall goal is to
itrengthen and advance the Nation's science and technology and facilitate their effective application for public benefit. To this
:nd, the Bureau conducts research and provides: (1) a basis for the Nation's physical measurement system, (2) scientific and:echnological services for industry and government, (3) a technical basis for equity in trade, and (4) technical services to pro-
note public safety. The Bureau consists of the Institute for Basic Standards, the Institute for Materials Research, the Institute
:or Applied Technology, the Institute for Computer Sciences and Technology, the Office for Information Programs, and the
Dffice of Experimental Technology Incentives Program.
THE INSTITUTE FOR BASIC STANDARDS provides the central basis within the United States of a complete and consist-
;nt system of physical measurement; coordinates that system with measurement systems of other nations; and furnishes essen-
:ial services leading to accurate and uniform physical measurements throughout the Nation's scientific community, industry,
and commerce. The Institute consists of the Office of Measurement Services, and the following center and divisions:
Applied Mathematics — Electricity — Mechanics — Heat — Optical Physics — Center for Radiation Research — Lab-oratory Astrophysics 2 — Cryogenics 2 — Electromagnetics 2 — Time and Frequency 3
.
THE INSTITUTE FOR MATERIALS RESEARCH conducts materials research leading to improved methods of measure-
ment, standards, and data on the properties of well-characterized materials needed by industry, commerce, educational insti-
tutions, and Government; provides advisory and research services to other Government agencies; and develops, produces, anddistributes standard reference materials. The Institute consists of the Office of Standard Reference Materials, the Office of Air
and Water Measurement, and the following divisions:
Analytical Chemistry — Polymers — Metallurgy — Inorganic Materials — Reactor Radiation — Physical Chemistry.
IHE INSTITUTE FOR APPLIED TECHNOLOGY provides technical services developing and promoting the use of avail-
able technology; cooperates with public and private organizations in developing technological standards, codes, and test meth-
ods; and provides technical advice services, and information to Government agencies and the public. The Institute consists of
the following divisions and centers:
Standards Application and Analysis — Electronic Technology — Center for Consumer Product Technology: Product
Systems Analysis; Product Engineering — Center for Building Technology: Structures, Materials, and Safety; Building
Environment; Technical Evaluation and Application — Center for Fire Research: Fire Science; Fire Safety Engineering.
THE INSTITUTE FOR COMPUTER SCIENCES AND TECHNOLOGY conducts research and provides technical services
esigned to aid Government agencies in improving cost effectiveness in the conduct of their programs through the selection,
cquisition, and effective utilization of automatic data processing equipment; and serves as the principal focus wthin the exec-
live branch for the development of Federal standards for automatic data processing equipment, techniques, and computer
anguages. The Institute consist of the following divisions:
Computer Services — Systems and Software — Computer Systems Engineering — Information Technology.
THE OFFICE OF EXPERIMENTAL TECHNOLOGY INCENTIVES PROGRAM seeks to affect public policy and process
o facilitate technological change in the private sector by examining and experimenting with Government policies and prac-
ces in order to identify and remove Government-related barriers and to correct inherent market imperfections that impede
le innovation process.
THE OFFICE FOR INFORMATION PROGRAMS promotes optimum dissemination and accessibility of scientific informa-
tion generated within NBS; promotes the development of the National Standard Reference Data System and a system of in-
formation analysis centers dealing with the broader aspects of the National Measurement System; provides appropriate services
to ensure that the NBS staff has optimum accessibility to the scientific information of the world. The Office consists of the
following organizational units:
Office of Standard Reference Data — Office of Information Activities — Office of Technical Publications — Library —Office of International Standards — Office of International Relations.
1 Headquarters and Laboratories at Gaithersburg, Maryland, unless otherwise noted; mailing address Washington, D.C. 20234.2 Located at Boulder, Colorado 80302.

U.S. DEPARTMENT OF COMMERCENational Bureau of StandardsWashington. D.C. 20S34
OFFICIAL BUSINESS
Penalty for Private Use. $300
POSTAGE AND FEES PAIDU.S. DEPARTMENT OF COMMERCE
COM-215
SPECIAL FOURTH-CLASS RATE
BOOK