NBER WORKING PAPER SERIES GLOBAL DEMOGRAPHIC CHANGE ...
45
NBER WORKING PAPER SERIES GLOBAL DEMOGRAPHIC CHANGE: DIMENSIONS AND ECONOMIC SIGNIFICANCE David E. Bloom David Canning Working Paper 10817 http://www.nber.org/papers/w10817 NATIONAL BUREAU OF ECONOMIC RESEARCH 1050 Massachusetts Avenue Cambridge, MA 02138 September 2004 Paper presented at the Federal Reserve Bank of Kansas City Symposium on Global Demographic Change: Economic Impacts and Policy Challenges. Jackson Hole, Wyoming August 26-28, 2004. The authors would like to thank their discussant Joel Mokyr and other Symposium participants for comments. Fifi Gosali also provided a useful comment. Financial support for this paper was provided by the MacArthur Foundation. The views expressed herein are those of the author(s) and not necessarily those of the National Bureau of Economic Research. ©2004 by David E. Bloom and David Canning. All rights reserved. Short sections of text, not to exceed two paragraphs, may be quoted without explicit permission provided that full credit, including © notice, is given to the source.
Transcript of NBER WORKING PAPER SERIES GLOBAL DEMOGRAPHIC CHANGE ...
NBER WORKING PAPER SERIES
GLOBAL DEMOGRAPHIC CHANGE:DIMENSIONS AND ECONOMIC SIGNIFICANCE
David E. BloomDavid Canning
Working Paper 10817http://www.nber.org/papers/w10817
NATIONAL BUREAU OF ECONOMIC RESEARCH1050 Massachusetts Avenue
Cambridge, MA 02138September 2004
Paper presented at the Federal Reserve Bank of Kansas City Symposium on Global Demographic Change:Economic Impacts and Policy Challenges. Jackson Hole, Wyoming August 26-28, 2004. The authors wouldlike to thank their discussant Joel Mokyr and other Symposium participants for comments. Fifi Gosali alsoprovided a useful comment. Financial support for this paper was provided by the MacArthur Foundation. Theviews expressed herein are those of the author(s) and not necessarily those of the National Bureau ofEconomic Research.
©2004 by David E. Bloom and David Canning. All rights reserved. Short sections of text, not to exceed twoparagraphs, may be quoted without explicit permission provided that full credit, including © notice, is givento the source.

Global Demographic Change: Dimensions and Economic SignificanceDavid E. Bloom and David CanningNBER Working Paper No. 10817September 2004JEL No. J11, O40
ABSTRACT
Transitions from high mortality and fertility to low mortality and fertility can be beneficial to
economies as large baby boom cohorts enter the workforce and save for retirement, while rising
longevity has perhaps increased both the incentive to invest in education and to save for retirement.
We present estimates of a model of economic growth that highlights the positive effects of
demographic change during 1960-95. We also show how Ireland benefited from lower fertility in the
form of higher labor supply per capita and how Taiwan benefited through increased savings rates.
We emphasize, however, that the realization of the potential benefits associated with the
demographic transition appears to be dependent on institutions and policies, requiring the productive
employment of the potential workers and savings the transition generates. Economic projections
based on an "accounting" approach that assumes constant age-specific behavior are likely to be
seriously misleading.
David E. BloomHarvard UniversityDepartment of Population and International HealthBuilding I, Room 1110B677 Huntington Ave.Boston, MA 02115and [email protected]
David CanningHarvard [email protected]

3
I. Introduction
Until the early 18th century, global population size was relatively static and the lives of
the vast majority of people were “nasty, brutish, and short.”2 Since then, the size and
structure of the global population have undergone extraordinary change. Over three
decades have been added to life expectancy, with a further gain of close to two more
decades projected for this century. World population has increased by an order of
magnitude to over 6 billion, and is projected to reach 9 billion by mid-century. Past and
projected additions to world population have been, and will increasingly be, distributed
unevenly across the world. The disparities reflect the existence of considerable
heterogeneity in birth, death, and migration processes, both over time and across national
populations, races, and ethnic groups. Coupled with the projected increase in global
population is a complicated set of age structure dynamics, including a near quadrupling
of the population aged 60 and over by the year 2050.
Demographic realities are substantially determined by economic and social
circumstances and institutions. But they also influence those circumstances and
institutions through a variety of potential channels. The microeconomic links between
various demographic indicators and economic outcomes have been extensively studied.
By contrast, the links that run from demographics to economics and that operate at the
level of national economies are far less certain. Some of these links arise partly as
accounting identities, such as the effect of population size on GDP, or the effects of
population age structure on aggregate labor supply and savings. Other links, such as the
effect of fertility decline on female labor supply, and the effect of longevity on the
incentives to save and to retire, are fundamentally behavioral in nature.
The objective of this paper is to explore the implications of demographic change
for macroeconomic performance. Section II reviews major features of the global
demographic scene and its evolution. Section III sets out a simple model of economic
growth that allows for possible demographic effects. The parameters of this model are
estimated using cross-country panel data during 1960-95. Insofar as the estimates suggest
plausible and powerful links that run from population age structure and health to
2 This phrase comes from Thomas Hobbes (1588-1679), the English moral and political philosopher, writing about life in an unregulated state of nature in Leviathan (1660).
4
economic growth, we turn in Section IV to examining the labor supply, savings, and
education channels through which these demographic factors may affect economic
growth, either because of accounting or behavior. Special attention is paid to population
health and age structure as missing factors in a unified explanation of such disparate
phenomena as East Asia’s “economic miracle” and Sub-Saharan Africa’s economic
debacle. We also examine the contribution of demographic change to Ireland’s
emergence as the “Celtic Tiger”. Finally, Section V looks to the future and stresses the
role that market and non-market institutions can play, at both the national and global
levels, in allowing economies to cushion adverse macroeconomic impacts of
demographic changes and to magnify and capture the beneficial impacts.
II. Global Demographic Change
Improvements in health and the related rise in life expectancy are among the most
remarkable demographic changes of the past century. For the world as a whole, life
expectancy more than doubled from around 30 years in 1900 to 65 years by 2000 (and is
projected to rise to 81 by the end of this century; Lee 2003). Most of the historical rise
reflects declines in infant and child mortality due to public health interventions related to
water and sanitation, and to medical interventions such as vaccine coverage and the use
of antibiotics. By contrast, the life expectancy gains observed over the past few decades
(especially in high-income countries) and projected into the future are predominantly
associated with reductions in age-specific death rates at the middle and older ages. These
reductions are typically associated with improvements in medical technology, life-style
changes, and income growth.
Figure 1 shows the historical demographic transition for Sweden, one of the few
countries for which we have long time-series’ of fairly good demographic data.
Concentrating first on the death rate, we see that before 1800 death rates in Sweden were
consistently high, with periodic spikes caused by epidemics of disease and famines. Life
expectancy in this period was between 20 and 30. However, starting around 1820 we see
a long term decline in death rates and while some spikes in death rates after 1820 remain
(the last spike being the 1918-19 influenza epidemic) they are considerably attenuated.
The beginning of the historical decline in mortality in Europe after 1820 preceded the

5
germ theory of disease, and widespread provision of clean water and sanitation systems
in cities in the second half of the 19th century, and may be due to rising living standards.
The slight upturn in the crude death rate after 1960 is due to population aging and high
death rates among the elderly as independent data show that age specific mortality rates
continue to decline and life expectancy continues to rise.
This pattern of declining death rates is common throughout Europe.3 In a world
wide perspective, Bloom and Canning (2001) show that mortality rates were high across
the world in the 19th century, with little difference between poor and rich countries. In the
first half of the 20th century a wide differential opened up, with rich countries enjoying
low infant mortality while rates remained very high in developing countries. The second
half of the 20th century saw large improvements in infant mortality, even in very poor
countries. While there is undoubtedly a gradient between income and health with higher
incomes leading to better health and lower mortality (Preston (1975), Pritchett and
Summers (1996)), the most important effect has been the downward movement of the
whole relationship over time, with improvements in health at every income level.
Along with gains in nutrition, relatively inexpensive public health measures
aimed at disease prevention initially, and medical interventions for the prevention and
treatment of infectious disease later, were the basis for early improvements in health.
More recently, improvements in health have relied on the treatment of non-infectious
disease, such as cardiovascular disease and cancer, requiring medical interventions that
are more costly.
Turning to the birth rate, we see a fairly high level historically in Sweden. While
fertility rates within marriage were high, Europe before 1870 was exceptional in the
world in having late marriage for women, with ages at marriage in the late 20s being
common. After 1870 (there is some evidence of an effect from around 1800 in France)
we see a large decline in fertility rates within marriage throughout Western Europe, with
Sweden following this pattern. The European Fertility project (Coale and Watkins
(1986)) found that this decline was quite widespread, and seems to have been fairly
independent of economic factors.
3 One exception is the precipitous fall in life expectancy in Russia in the 1990's (see Bennett, Bloom, and Ivanov (1998)).

6
In developing countries, the pattern has been for fertility to remain high for a
considerable period of time, but when fertility rates start falling they tend to fall at a
relatively rapid pace. Fertility remains high initially due to high desired family size. The
causes of the fertility decline in low income countries can be ascribed to falling infant
mortality rates, and high levels of female education and labor market opportunities that
reduce desired fertility, together with the provision of family planning services (Schultz
(1997)).
The historic pattern of the fertility transition we see in Figure 1 has been repeated
in many countries, with the declines in death occurring first followed at a later stage by
declines in the birth rate. But the pace of these declines is occurring more rapidly in
today’s developing countries than it did historically. Insofar as the gap between the birth
rate and the death rate in Figure 1 is the rate of population growth (assuming no net
migration), one immediate consequence of the demographic transition, since death rates
tend to decline prior to the birth rate, is a period of rapid population growth.
On the strength of an annual growth rate of 1.7%, world population more than
doubled from 1950 to 2000, increasing from 2.6 to 6 billion. The growth rate is projected
by the United Nations Population Division to drop sharply during the next half century
(to under 0.8 percent) as birth rates decline, but an additional 3 billion people will
nevertheless be added to the planet. 4
But population growth is not the only result of the demographic transition.
Changes also occur in the age structure of the population. The initial fall in mortality
rates creates a "boom generation," in which there are more people at the young ages than
in earlier generations because survival rates – mainly infant and child survival -- are
higher. After a period of time, fertility rates fall as people realize they do not need as
many births to reach their desired family size, or as desired fertility abates as a result of
4 It has been asserted in recent years that the world no longer faces a “population problem”. This assertion has a variety of sources, including a series of downward revisions of global population projections by the United Nations over the past 10 years (from 10 billion to slightly under 9 billion by 2050). The assertion also reflects the toll of AIDS mortality and evidence that fertility decline has proceeded faster than previously assumed. While there is some truth to the view that world population has lost its “explosive” character, an increase of 3 billion in this half century is still exceedingly large by historical standards. It corresponds, for example, to total world population as recently as 1960. It also corresponds to adding nearly three populations the current size of India, or almost 5 populations the size of Sub-Saharan Africa.

7
some combination of educational development, income growth, and the expansion of
women’s opportunities to work outside the home. Improved access to family planning
supplies and services may also be an important factor (Bongaarts, 1994, 1997; though
Pritchett 1994 argues otherwise). At that point, the baby boom stops. But the age
structure of the population then shows a "bulge" that is created by the non-synchronous
falls in mortality and fertility. The bulge is particularly pronounced if the drops in
mortality and fertility are large and if the period between mortality and fertility decline is
short.5 The bulge works its way through the age structure and, for a period of time, the
share of the population that is of working age (generally taken to be 15-64) can be
significantly higher than it was previously and than it will be in the future. Eventually the
bulge will reach the older ages (as reflected in the UN population projections noted
above).
In Europe and the United States the demographic transition was relatively slow
and produced mild age structure effects. The major reason for the demographic
imbalances in these countries is the baby boom that followed World War II. This boom
has several explanations, including an echo effect of the baby boom that followed the
high mortality rates of the influenza epidemic of 1918-19 (probably to replace children
lost during the epidemic, or reflecting childbearing that was postponed during World War
I), the postponement in childbearing due to the economic hardships and uncertainties of
the Great Depression, and spousal separation associated with World War II. The post-
World War II baby boom and its echo (a subsequent baby boom after 25 years, as the
boomers themselves had children) profoundly destabilized the age structures, for variable
periods of time, in many developed countries.
Figures 2-5 illustrate this process in more detail for Japan. Figure 2 shows that the
crude birth rate (i.e., the number of births per 1000 population), following Japan's post-
World War II baby boom, fell by more than half between 1950 and 2000. The bump in
1970 reflects the echo effect of Japan’s baby-boom, which occurred during 1946 to 1951.
Figure 2 also shows that the birth rate is projected to remain low, and cross below the
crude death rate, during the present decade. The crude death rate is itself projected to rise. 5 The experience of different regions of the developing world in the latter half of the 20th century shows that the time lag between the onset of the fall in mortality rates and the corresponding decline in fertility rates can occur within widely different time frames, from 15 years upwards.

8
This rise, which seems at first sight to be at odds with the projected rise in life expectancy
(Figure 3), reflects the dominance of the increasingly elderly age distribution projected
for Japan as the relatively large cohorts born during 1946 to the early 1970s reach the
older ages. This baby-boom can be seen in Figure 4, which represents a succession of
cross-sectional population age distributions (e.g., the first slice represents the age
distribution in 1950, the second slice represents the age distribution in 1960, etc.). In the
absence of mortality and migration, the population aged a at time t will become the
population aged a+10 at time t+10. Thus, the diagonals in Figure 4 represent true birth
cohorts.6 In this connection, note that the diagonal ridges observed in Figure 4 represent
Japan’s baby boom cohorts. These ridges begin to reach the older ages in 2010,
corresponding to the rise in the rate of elderly dependency in Japan.
Figure 5 offers a two-dimensional view of this secular “age wave” process by
plotting the ratio of the working-age population to the non-working-age population (i.e.,
the ratio of 15-64 years olds to the sum of those below age 15 and those ages 65 and
over). Declining fertility in Japan is associated with a sizable rise in the working age
share (from 1.5 in 1950 to about 2.3 in the 1990s). But going forward, population aging
will dominate and the working age share will recede steadily from its recent peak (falling
to roughly 1.0 at mid-century, which is slightly below the current level in Sub-Saharan
Africa).
In fact, population aging in Japan may be more extreme than this. The United
Nations' projections assume that fertility will gradually rise to replacement levels of 2.1
children per woman, but there is no guarantee that this will happen, and indeed,
continued low fertility or even further fertility declines seem more likely.
The world as a whole is also in the midst of a period of change in its age structure.
The world’s population aged 60 and over, which currently represents slightly more than
half the number of 15-24 year olds (over 1 billion people), is rising sharply and projected
to surpass 1 billion within two decades (and to overtake the 15-24 age group). The
population aged 80 and over is projected to increase at an annual rate of 3.4% from 2000
to 2050, corresponding to an increase from 1 to 4 percent in the global population share
6 There is, however, a small exception to note here since, starting in 1990, the age grouping reported by the UN changed from 85+ to 85-89, 90-94, 95-99, and 100+.

9
of the “oldest old”. Moreover, the process of population aging is accelerating. During the
last 50 years, the number of people aged 60 or over in the world rose by 350 million (to
550 million); in the next 50 years a 1.5 billion increase is projected. Figure 6 shows, for
the world as a whole, the overall dependency ratio: the ratio of the young (0- 14 years
old) and the old (65 years old or more) to those of working age (15 to 64 year olds). From
around 1970 the overall dependency rate has being falling due to falling fertility and
youth dependency. However, old age dependency has being rising and from 2010
onwards we see a projected upward trend in the overall dependency rate for the world as
increasing numbers of elderly outweigh the decline in the number of children.
Cross-country heterogeneity is among the most salient features of the global
demographic profile. For example, virtually all of the increase projected in world
population to 2050 will occur among today’s low and middle income countries. By
contrast, population aging will be most rapid in Western Europe, the United States, and,
in particular, Japan, where 42% of the population is projected to be aged 60 or over by
2050, with 16% aged 80+. Japan has recently become the first country in history with an
average age of over 40. Japan is projected to have nearly one million centenarians (1% of
the population) by 2050.
Demographic heterogeneity is considerable not just between, but also within,
country income groups. For example, fertility rates are well below replacement in
Europe, whereas they have been hovering at replacement levels in the United States since
1990. Net migration to Europe has been relatively slow in the past decade, whereas net
migration to United States has given a sizable boost to its population (including the echo
effect of above-average fertility among migrants and their children). According to current
projections, which reflect the implications of recent fertility and net migration
differences, the population of the United States will overtake that of Europe by 2040.
Figure 7 shows the ratio of working age to non working age population in East
Asia, South Asia, Europe, Sub-Saharan Africa, and the United States. It shows that the
working-age to non-working-age population ratio rose fastest in East Asia, a consequence
of its rapid and pronounced demographic transition. But it also shows that East Asia,
which experienced the most rapid declines in fertility, will exhibit the most sizable drop
in this ratio given its projected age structure dynamics in the decades ahead. Europe will

10
follow a path similar to that of East Asia as a consequence of rapid population aging,
while the trajectory of the United States will be qualitatively similar but far less dramatic,
with the ratio being supported by somewhat higher fertility and by immigration. Fertility
decline is well under way in South Central Asia, most notably in India and Bangladesh,
and its working age ratio already shows signs of increase. Similarly, North Africa and
the Middle East are now well into the fertility reduction phase of the demographic
transition.
At the other end of the demographic spectrum, Sub-Saharan Africa continues to
experience an extremely sluggish demographic transition. In most countries of Sub-
Saharan Africa, children continue to be viewed as a valuable source of labor and
insurance for old age. As a result, traditionally high fertility rates and large family sizes
have persisted in the face of improvements in infant and child mortality, and now the
ravages of HIV/AIDS are depleting the working-age population.7 As a result, the
average age of the population has remained low, as has the proportion of working-age
people.8 The projection of a rise in the working age ratio in Figure 7 for Sub-Saharan
Africa is contingent on the projections of fertility decline in the region actually taking
place.
While population aging is occurring in developed countries, it is also likely to
come about in developing countries over the next 50 years. Indeed, given the pace of
advances in health and lower mortality, and declines in fertility (particularly in China,
due to the one child policy), large scale population aging is likely in developing
countries before they reach high levels of income. The window of opportunity created by
the potential demographic dividend that occurs when birth rates and youth dependency
rates fall is temporary, and is replaced by old age dependency as the baby boom cohort
ages.
7With respect to mortality, nearly one fourth of all deaths in Sub-Saharan Africa are now due to HIV/AIDS, a rate that is overwhelmingly in excess of the corresponding rate in all other developing regions (UNAIDS 2004). This has a potentially large effect on these economies, given the fact that deaths from AIDS are concentrated among prime age workers, and insofar as the rise in orphans, and decline in prospective longevity, may reduce investments in human capital. 8 Some African nations —notably those in southern Africa, including Namibia, Botswana, South Africa, and Zimbabwe—are beginning to show reductions in fertility.

11
III. Effects of Demographic Change on Economic Growth
Background and Concepts
Although it is often argued that rapid population growth has a negative effect on the
growth rate of income per capita, compelling evidence on this point has been rather
elusive and counterarguments abound. Most studies find little cross-country evidence of a
significant effect, holding constant myriad other influences on the rate of economic
growth. Whether this result reflects the true unimportance of population growth,
offsetting negative and positive influences of population growth on economic growth,
inadequate control variables or other model specification errors, poor data, or reverse
causality, continue to be open questions. Nonetheless, this body of empirical research has
tended to support what has come to be known as the population neutralist view:
population growth neither systematically impedes nor promotes economic growth. This
view has been the dominant academic belief in this area since the early 1980s and
contributed to the marginalization of population and reproductive health as an instrument
of economic development among key development agencies like the World Bank. (See
Ahlburg (2002), Birdsall, Kelley, and Sinding (2001), Bloom, Canning, and Sevilla
(2002), Kelley (1988, 2001), and Kelley and Schmidt (2001)).
New evidence and thinking has emerged in the past few years that challenges, and
is beginning to unseat, this longstanding view. This new evidence relates to the
importance of population age distribution in the determination of macroeconomic
performance.
There are two main ideas here. The first, as detailed in the preceding section, is
that population growth and changes in the age structure of the population are both
consequences of the demographic transition. The second is that people’s economic needs
and contributions vary over the life cycle. For example, young people tend to be net
consumers, while working-age people tend to be net producers and savers, with the
elderly falling somewhere in between. This implies that the age structure of a population
may be very consequential for its economic performance – as measured by income per
capita. Large youth and elderly cohorts might slow the pace of economic growth, while
large working-age cohorts might speed it.

12
Contrary to the neutralist view, the emerging evidence indicates that population
does matter to economic growth, with age structure playing a central role. As the
dependency ratio falls, opportunities for economic growth tend to rise, creating what is
now referred to as a “demographic dividend”.
East Asia’s macroeconomic performance is tracked very closely by its
demographic transition and resulting changes in age structure. Estimates indicate that as
much as one-third of its “economic miracle” can be accounted for as a “demographic
dividend (Bloom and Williamson (1998), Bloom, Canning, and Malaney (2000), and
Mason (2001)). By contrast, the absence of demographic change also accounts for a large
portion of Africa’s economic debacle (Bloom, Canning, and Sevilla (2002) and Bloom
and Sachs (1998)). In addition, the introduction of demographics has reduced the need for
the argument that there was something exceptional about East Asia or idiosyncratic to
Africa. Most models of economic growth have significant region dummies, usually
negative for Sub-Saharan Africa and positive for East Asia, indicating that the poor
performance of Africa and the exceptionally good growth performance of East Asia
cannot be explained within the models. Once age structure dynamics are introduced into
an economic growth model, these regions are much closer to obeying common principles
of economic growth (Bloom and Canning (2001), Bloom, Canning, and Malaney (2000))
and the statistical significance of the region dummy variables disappears.
It is also clear, both theoretically and empirically, that there is nothing automatic
about the link from demographic change to economic growth (Bloom and Canning
(2001), Bloom, Canning, and Sevilla (2002), and Bloom and Canning (2003a)). Age
distribution changes merely create potential for economic growth. Whether or not this
potential is captured depends on the policy environment, as reflected, for example, by the
quality of governmental institutions, labor legislation, macroeconomic management,
openness to trade, and education policy. This realm is where Latin America seems to
have stumbled. During 1965 to 1990, its demographics resembled those of East Asia, but
its economic performance lagged well behind. Episodes of high inflation, political
instability, adversarial labor relations, and an inward orientation with respect to trade

13
through much of the period appear to have prevented many Latin American countries
from exploiting its demographic window of opportunity, at least in its early phases.9
Model, Data, and Empirical Results
Theoretical model
Income per capita is the major focus of most empirical models of economic growth. It is
a convenient summary of the standard of living and a useful measure of the level of
economic development. However, in theoretical terms, models of income growth usually
rely on a production function that links factor inputs and total factor productivity to
output. Dividing the production function through by labor gives us a relationship in
which output per worker is due to the level of inputs per worker and the productivity with
which inputs are used. Letting 0z be the initial level of income per worker, we can write
the growth rate of income per worker zg as
0( * )zg z zλ= −
where z* is the steady state level of income per worker and λ is the speed of
convergence. The steady state level of income per worker depends on any factors (such
as capital stock and education levels per worker, and total factor productivity levels) that
may affect labor productivity. We write the vector of variables that can affect steady
state labor productivity as X, which gives us *z X β= and so
0( )zg X zλ β= −
This type of growth model is discussed extensively in Barro and Sala-I-Martin (1995).
We now wish to develop a theory of the growth of income per capita. We start
with an accounting identity that links income per capita (Y/N) to income per member of
the working age population (Y/WA)
Y Y L WAN L WA N
=
In this identity WA represents the population of working age, L is the labor force, and N
the total population. The identity merely states that the level of income per capita equals
the level of income per worker, times the participation rate, times the ratio of working 9 As discussed below, Ireland is, like much of East Asia, an example of a country whose policy environment enabled it to take advantage of its demographic dividend.

14
age to total population. If we assume that the participation rate is constant10, in growth
rate terms this implies that
/ / /Y N Y WA WA Ng g g= +
and making the following substitutions,
log , log , log , logY Y WA L
y z w pN L N WA
= = = =
we can derive (remembering that p, the participation rate, is assumed constant)
y z wg g g= +
Hence we have (since 0 0 0y z p w= + + )
0 0( )y wg X p w y gλ β= + + − +
This final equation is similar in form to the standard regressions run in economic growth
analyses. It relates growth in income per capita to a range of variables, X, and the initial
level of income per capita, 0y . We assume that the participation rate p is captured in the
constant term of the regression. However, several other terms appear. The ratio of
workers to total population appears both as a level term and as a growth term. Due to the
identity used to derive this regression, the coefficients on these terms are fixed (equal
to λ , or minus the coefficient on initial income per capita for the level term and equal to
one for the growth term).
Data
We construct a panel of countries observed every 5 years from 1960 to 1995. Data on
GDP per capita are obtained from the Penn World Tables version 6.0 (this data set is an
update of Heston and Summers (1991). Data on the working age (those 15 to 64 years
old) and total population come from United Nations (1998).
In addition to these variables, we include in our regressions a number of
indicators that potentially explain labor productivity differences across countries (the
variables in our vector X in the theory section above). Schooling is measured by the
average total years of schooling of the population aged 15 years and older from Barro and
10 Bloom and Canning (2003b) attempt to use the participation rate in such a regression but are rather unsuccessful, perhaps due to problems in measuring labor force participation across countries.

15
Lee (2000). Life expectancy data are from the United Nations (1998). We use these as a
proxy for the health of the workforce, even though they measure mortality rates rather
than morbidity. Higher life expectancy is generally associated with better health status
and lower morbidity (Murray and Chen 1992; Murray and Lopez 1997). Schooling and
health can be thought of as indicators of the quality of labor.
We also include a range of geographic and institutional variables that may affect
factor productivity. Our governance variable is based on the index created by Knack and
Keefer (1995), which gives an average indicator of the quality of public institutions. The
index is based on data for 1982 and does not vary within a country over the period we
analyze. Data on the percentage of land area in the tropics and a dummy for being
landlocked come from Gallup, Sachs, and Mellinger (1999). We include some country-
specific variables that may affect the long-run level of total factor productivity. We also
use a measure of ethno-linguistic fractionalization from Easterly and Levine (1997), and
the Sachs and Warner (1995) measure of openness to trade (which also depends on a
country’s market institutions to some extent).
Empirical results
We explain growth in per capita output in the five-year period by a fairly standard set of
explanatory variables but adding our demographic variables, for a panel of countries over
the period 1965-1995. The results are reported in Table 1. In column 1 we report the
results of estimating the relationship by ordinary least squares. We find that open
economies, with good institutions and fairly homogeneous populations (i.e., low ethno-
linguistic fractionalization), have higher rates of economic growth. In this regression,
being landlocked is not statistically significant; neither is being located in the tropics.
The average years of schooling of the workforce does not appear to be significant either,
though better health in the form of higher life expectancy does have a significant positive
effect on growth. The coefficient on the initial level of income per capita is negative,
indicating catch-up to a steady state defined by the other variables as set out in the theory
section.
We find that the coefficient on the log of the working age over the total
population has a positive and significant sign as expected. In terms of growth rates, the

16
growth of the ratio of working-age to total population has a positive sign and is very close
to the expected value of one.
Most of the explanatory variables in this specification are measured at the start of
each five-year period and are therefore prior to the economic growth being explained.
However, the growth in the ratio of working-age to total population is contemporaneous
with the economic growth being explained and may therefore be endogenously
determined. It seems quite reasonable to expect periods of strong economic growth to
induce a higher ratio of working-age to total population, partly through migration effects
but also through an effect on fertility and therefore the youth dependency rate. To try to
control for this potential endogeneity we repeat the analysis reported in column 1 but
instrument the growth rate of working age to total population with its lagged value (from
the previous five-year period). The results, shown in column 2, do not change much
except that now the negative effect on growth of being located in the tropics appears to be
statistically significant.
The estimated coefficients of the demographic variables in Table 1 are, at first
sight, difficult to interpret. Since their inclusion comes from an identity (see the theory
section above) we could exclude them from the estimation by imposing the parameter
restrictions directly from the identity. However, the theoretical accounting model
assumes that behavior remains unchanged while the working age ratio changes, and that
all potential workers are productively employed. Increases in the ratio of working-age to
total population increase the potential labor force. Provided the measures of human
capital (such as health and education) in our model capture any changes in the quality of
the labor force during this inflow of workers, and the participation rate of the working
age group remains the same, the coefficients from the identity are correct. However, it
seems likely that large expansions of the labor force will lead to changes in average
quality in ways we do not measure, and in addition there may be a participation rate
effect. In particular we might expect that as youth and old age dependency rates decline
(and the working age to non-working age ratio rises) the need for care of dependents at
home will fall allowing labor force participation to rise. We estimate, rather than impose,
the coefficients on our demographic variables allowing these labor quality and
participation rate effects to potentially be included in our estimates.

17
The effect of increases in the working-age population on labor supply is to give a
supply-side boost to potential output. However, the availability of extra workers will have
little effect if they are not employed. In column 3 of Table 1 we report estimates of the
parameters of a regression model that is specified to include an interaction effect between
the ratio of working-age to total population and the degree of openness of the economy.
This allows us to test whether the effect of increasing the working-age ratio depends on
the flexibility of the economy as measured by its openness.
We find a large positive coefficient on this interaction term, indicating that a
completely open economy (openness equal to one in our measure) will enjoy nearly twice
the growth impact of demographic change as an average country. In addition, the results
in column 3 indicate that a country with a closed economy (openness equal to zero) will
have no gain from demographic change (the coefficient on the growth in the working-age
ratio in column 3 is negative but not statistically different from zero). This indicates that
the impact of demographic change may be to increase labor supply, but how well this
extra supply of workers is put to productive employment depends on the economic
system and policies being used.
IV. Effects of Demographic Change on Labor Supply, Savings, and Education
Table 1 suggests two demographic effects on macroeconomic performance. The first is
the effect of age structure, particularly the ratio of the working age to the total population.
The second is the effect of longevity, as measured by life expectancy. We find
demographic variables to have positive and large effects on economic growth. In this
section we discuss the mechanisms through which these demographic factors appear to
operate.
The two mechanisms on which we focus initially relate to the effects of
demography on labor supply per capita and on savings. Given well-established life-cycle
variations in behavior, it is reasonable to suppose that changes in age structure will have
effects on aggregate outcomes. For example, since labor supply tends to follow an
inverted U-shaped pattern with respect to age, changes in the age composition of the
population are likely to have effects on aggregate labor supply. Savings rates also vary

18
with age, with the highest rates occurring for 40 to 70 year olds, implying that changes in
the age structure will affect aggregate savings rates.
However, in addition to these "accounting" effects (assuming age-specific
behavior remains unchanged we can simply calculate the consequences of age structure
change mechanically) there are also behavioral effects. Generational crowding (i.e., being
born into a large cohort) may have effects on relative wages and individual labor supply
(Easterlin 1980, Bloom, Freeman, and Korenman 1987; Korenman and Neumark 2000).
In addition, the decision to reduce fertility and youth dependency rates may be linked to
labor market participation, particularly among women.
The effect of life expectancy that we find can be due to a number of mechanisms.
One is that higher life expectancy goes hand in hand with better health, and better health
may improve worker productivity (Bloom, Canning, and Sevilla 2004). However, there
may also be a demographic effect as a longer prospective life span can change life-cycle
behavior, leading to a longer working life or higher savings for retirement (Bloom,
Canning, and Graham 2003; Bloom, Canning, and Moore 2004).
We examine these issues more closely by focusing on two particular cases. The
first case relates to the role of demographic factors in the emergence of the "Celtic
Tiger": Ireland's remarkable economic boom during the 1990's. In particular, we focus
on the effect of age structure changes in Ireland on its labor market and macroeconomic
performance. The second case involves the contribution of demographic factors to the
savings boom in Taiwan over the period 1960 to 2000.
Labor supply and the Celtic Tiger
Ireland has been slow to complete the demographic transition. The death rate in
Ireland, which drifted down only slightly during the period 1950-2000, has been
relatively low by international standards (in the neighborhood of 10 per thousand) and
comparable to the rest of Europe. By contrast, the birth rate was much higher through the
early 1980s (over 20 per thousand). Indeed, Ireland has long been seen as a demographic
outlier within Europe, since its fertility rate was still moderately high when those in other
European countries had fallen to near, or below, replacement level. Figure 8 shows a
comparison of the total fertility rate in Ireland and the United Kingdom; comparisons

19
with other European countries would look similar. The difference between a high birth
rate and a low death rate would have led to rapid population growth were it not for
Ireland's historically high rate of out-migration.
One reason for Ireland's high fertility rate was undoubtedly the legal ban on the
use of contraception. From the founding of the Irish State in 1922 until 1979, Ireland
placed severe restrictions on access to contraception, importation of contraceptives, and
the circulation of literature about contraception. Irish women and some medical
institutions resisted these restrictions and by the late 1960s women were increasingly
obtaining oral contraceptives under the legally-acceptable guise of regulating their
menstrual cycles. The Irish women's movement took up this issue and in 1973 the Irish
Supreme Court ended the ban on contraception by legalizing the importation of
contraceptives for personal use; this change was not, however, formally legally
implemented until 1979 (see Murphy-Lawless and McCarthy, 1999). In that year, the sale
of contraceptives for use in family planning was made legal upon presentation of a
doctor’s prescription. From 1985 on contraceptives could be sold to all those aged 18 and
over without a prescription. Legalization of contraception was not a sudden or
unexpected shock. It arose out of women's struggles for reproductive freedom and from
Ireland's gradual incorporation into a broader cultural world in which contraception was
widely available and sexual mores were changing. Nevertheless, legalization was
important, as it codified societal norms and, as suggested by the data, seems to have been
tightly connected to a rapid fall in fertility.
In the aftermath of societal and legal changes regarding contraception, the decline
in fertility rates in Ireland accelerated after 1979 and the crude birth rate fell sharply
during the 1980's, from 21.0 per thousand to 14.2 per thousand. To some extent Ireland
represents a "natural experiment" in which the legalization of contraception catalyzed a
large demographic change, independent of economic activity rates.11
Ireland’s rapidly falling birth rate led to falling youth dependency and a higher
share of working-age people. Figure 9 shows the ratio of the working age (15-64) to the
non-working age (<15 or >64) population in Ireland from 1950 to 2000 (and projected to
11 As pointed out to us by Yale biologist Robert Wyman, the legalization of abortion in Japan in 1951 appears to account for the end of its relatively short baby boom, representing another “natural experiment” of sorts.

20
2050 using UN population projections). Comparative data for the United Kingdom are
also shown. It is clear from this Figure that the dependency burden (i.e., the reciprocal of
the indicator in Figure 9) in Ireland mirrored that in East Asia through the mid-1970s (see
Figure 7). At that point, East Asia’s fertility transition, which had begun in the mid-
1960s, was well underway and its dependency burden was falling sharply. By contrast,
Ireland’s dependency burden shows signs of sharp decline by the latter portion of the
1980s, as a consequence of a declining birth rate during the 1980s. By the mid-1990s the
dependency burden in Ireland had dropped to a level below that in the United Kingdom.
From 1960 to 1990, the growth rate of income per capita in Ireland was
approximately 3.5 percent per annum. In the 1990s, the growth rate jumped to 5.8
percent, which is well in excess of any other European economy, thereby giving rise to
the notion of the “Celtic Tiger.” This boost in the growth rate coincides closely with the
falling dependency rate in Ireland. Thus, the raw data are consistent with the view that
demographic change contributed to Ireland’s economic surge in the 1990s. Bloom and
Canning (2003b) examine this argument more closely and argue that the economic boom
that occurred in Ireland in the 1990's is well predicted by estimates of a model similar to
that shown in Table 1. As part of their analysis, they also show that the growth in the
working age to total population ratio was matched by an increase in labor supply per
capita.
Economic growth in Ireland was also fueled by two additional demography-based
factors that increased labor supply per capita. While male labor force participation rates
remained fairly static, the period 1980–2000 saw a substantial increase in female labor
force participation rates, particularly in the 25-40 year old age group (see Figure 10).
While one would expect rapid economic growth to encourage female labor participation,
it seems likely that at least some of the increase was due to the availability of
contraception and women’s increased freedom to choose between working and rearing
children. In addition, Ireland has historically had high levels of outward migration of
young adults (around 1 percent of the population per year) due to the inability of its
economy to absorb the large inflows of young workers created by its high fertility rate.
The loss of these young workers of course exacerbated the problem of the high youth
dependency rate. The decline in youth cohort sizes and rapid economic growth of the

21
1990s led to a reversal of this flow, resulting in net in-migration of workers, made up
partly of return migrants but also for the first time substantial numbers of foreign
migrants.
It is important to note that Ireland, like the “miracle” economies of East Asia, had
in place economic and social policies that favored its taking advantage of the
demographic shifts it experienced. Two key policies appear to have been at work in
Ireland. First, in the late 1950s, there was recognition that the “closed economy” model
of development had failed in Ireland. This led to new polices with an emphasis on
encouraging direct foreign investment in Ireland and promoting exports. Second, from
the mid-1960s, free secondary education was introduced, leading to a large increase in
school enrollments and subsequent expansions in higher education. The resultant high
levels of education, combined with export-oriented economic policies, seem to be
powerful factors in ensuring that the benefits of the demographic transition are realized.12
The Savings Boom in Taiwan
Central to our understanding of the East Asian "miracle" has been Alwyn Young's
work (Young 1994; Young 1995) showing that rapid economic growth in the region was
mainly due to increases in factor inputs-- notably labor, capital, and education-- and not
to improvements in total factor productivity. In order to understand the rise in income
levels in East Asia we must therefore understand the driving forces behind the growth in
these inputs.
All of the Asian "Tiger" economies enjoyed a surge in savings and investment
during their period of rapid economic growth. We focus here on Taiwan, for which there
are fairly good data on household savings. The private savings rate in Taiwan rose from
around 5% in the 1950's to well over 20% in the 1980's and 1990's. Savings rates vary by
age, being highest in Taiwan for households with heads in the 50-60 year old range. We
would therefore expect changing age structure to be a possible explanation of this
increase in aggregate saving. Studies that examine the link between demographic
structure and national savings rates do find a strong connection (Fry and Mason (1982),
12 Although we use "openness" in Table 1 as a factor that may magnify the impact of the demographic dividend, we interpret this variable as a proxy for liberal economic policies in general, not as a specific endorsement of export orientation.

22
Higgins (1998), Higgins and Williamson (1997) , Kelley and Schmidt (1996), Leff
(1969), Mason (1987, 1988)) and suggest that a large part of the savings boom in East
Asia can be explained by the age structure in the population.
However, Deaton and Paxson (2000) show that based on household saving data
for Taiwan, changes in age structure account for only a modest increase in the overall
savings rate, perhaps 4 percentage points. They show that the rise in the aggregate
savings rate has not been mainly due to changes in the age composition of the population
but, rather, to a secular rise in the savings rates of all age groups.
The question then arises as to why savings rates rose at each age. One possible
explanation, proposed by Lee, Mason, and Miller (2000) is that increased savings rates
are due to rising life expectancy and an increasing need to fund retirement income. Tsai,
Chu, and Chung (2000) show that the timing of the rise in household savings rates
matches the increases in life expectancy of the population.
With a fixed retirement age we would expect such a savings effect. However,
Deaton and Paxson (2000) argue that in a flexible economy, without mandatory
retirement, the main effect of a rise in longevity will be on the span of the working life,
with no obvious prediction for the rate of saving. Bloom, Canning, and Moore (2004)
formalize this argument to show that under reasonable assumptions the optimal response
to an improvement in health and a rise in life expectancy is to increase the length of
working life, though less than proportionately, with no need to raise saving rates at all
(due to the gains from enjoying compound interest over a longer life span).
While in theory a longer life span should be associated with a longer working life,
in practice this may not be the case. Bloom, Canning, and Graham (2003) find that, even
allowing for age structure effects, longer life expectancy is strongly associated with
higher national savings rates across countries, which suggests that there is a savings
effect.13 This savings effect could of course be due to mandatory retirement systems,
which prevent workers from lengthening their working lives. Even in the absence of
mandatory retirement, Gruber and Wise (1998) argue that many national social security
systems produce strong financial incentives to retire at particular ages and that workers
13 The earlier studies of national savings referenced above omit the life expectancy effect, suggesting that their age structure effects may be biased since longer life expectancy is highly correlated with an older population.

23
respond to these incentives. For example, the social security system in Taiwan takes
5.85% of earnings (jointly from employers and workers), pays a lump sum at retirement
of at most 50 months salary, and takes contributions, but provides no additional benefits,
for workers after 35 years of work who are over 65 years old.
While the optimal response with perfect markets may be for workers to have a
longer working life as their health improves and they have longer life expectancies,
mandatory or conventional retirement ages, coupled with the strong financial incentives
to retire that are inherent in many social security systems, seem to result in early
retirement and increased needs for saving for old age.
Education
Demography can affect educational investments through several mechanisms.
Perhaps the most important is the quantity–quality tradeoff whereby fertility choices and
human capital investment decisions are jointly made. This framework points to lower
fertility being both a cause and a consequence of increased educational investments, with
both fertility and schooling determined as well by a common set of factors that affect
families’ incentives.
Notwithstanding families’ desired fertility, actual fertility in the absence of
contraception may be much higher. The provision of family planning services to
populations in which desired fertility is low can both lower fertility outcomes and
increase schooling levels. This effect may be particularly pronounced for girls’ schooling
because with high fertility girls are frequently kept out of school to help care for their
younger siblings. Foster and Roy (1997) show how a randomized trial providing family
planning services in Bangladesh affected both fertility outcomes and children's schooling
levels.
The quantity-quality tradeoff can also appear to some extent at the national level
if schooling is publicly funded. Smaller youth cohorts can increase the availability of
educational funding per child and can lead to an expansion of public education (Kelley
1996).
One reason for an increased incentive to invest in education may be the rise in life
expectancy. A longer life increases the time over which education investments can be

24
recouped. Kalemli-Ozcan, Ryder and Weil (2000) argue that the effect of improved
health and longevity on educational investments has played a large role in economic
growth over the last 150 years. This incentive effect, however, is clearly linked to the
prospective working life rather than total lifespan, suggesting that education levels may
be linked to planned retirement ages and social security incentives.
V. Discussion
For most of the 20th century the dominant issue in population was the explosion in
population numbers caused by the lowering of mortality rates coupled with continuing
high fertility rates. The predicted negative consequences of high population densities, and
a high population growth rate, seem not to have been borne out. Many of the predictions
made about the immiserizing effects of population growth seem in retrospect to have
been unduly alarmist.
Following the 1986 National Academy of Sciences’ report on population growth,
the revisionist position came to dominate economists’ thinking on population (Kelley
(2000)). While rapid population growth posed problems, the report argued that market
mechanisms and non-market institutions were usually sufficiently flexible to ameliorate
those problems. In particular, projections of the effects of population growth based on
unchanged behavior elsewhere in the economy might give a very bleak picture but in
general would be very misleading. Changing incentives through price changes, and
changing non-market institutional arrangements to promote new behaviors, could have
large effects and produce responses that would alleviate the problems associated with
population growth.
The population debate focused on population numbers and missed to a large
extent the issue of age structure changes. Population growth caused by rising fertility, and
population growth caused by falling mortality, are likely to have quite different economic
consequences because they have different age structure effects. We have examined some
of these consequences above. However, it is important to remember the lessons of the
earlier debate. Analysis based on "accounting effects", in particular on the assumption
that age-specific behavior remains unchanged as the age structure evolves, may be
misleading. When this type of analysis predicts large reductions welfare we should be
25
particularly suspicious since these are exactly the conditions that will produce incentives
for behavioral change.
The historical experience with which we are familiar is of reductions in infant and
child mortality that produce a "baby boom" and that lead to a large working age cohort.
Subsequent reductions in fertility reduce the dependency ratio. This change in the age
structure appears to produce a demographic dividend that is overwhelmingly positive in
terms of potential economic outcomes. Labor supply per capita rises when the large baby-
boom cohort enters the working ages and with the increase in female labor force
participation that is typically associated with fertility decline. The large working age
cohort saves for retirement, perhaps at a higher rate than before due to its longer life
expectancy, producing potential resources for investment. The longer span and reduced
mortality rate may also encourage investments in education.
The potential of this "demographic dividend" is not always realized; economic
growth is not an automatic outcome of changes in the population age structure. A large
working-age population requires a matching demand for labor if the demographic
dividend is to be enjoyed. Without appropriate policies the extra labor supply can result
in unemployment or underemployment, with political instability, elevated rates of crime,
and the deterioration of social capital a possible further consequence.
In our empirical modeling the benefits of the demographic dividend depend on
good policies. We use openness of the economy as a proxy for good policies, but
emphasize it is good policies in general that appear to be beneficial, not just openness to
trade. We get similar results if we replace openness with a measure of the quality of
governmental institutions. Macroeconomic data are not sufficiently rich to distinguish
exactly which policies matter most during the transition.
Intuitively, the key determinants of whether a country will capitalize on its
demographic opportunity are how flexible the economy is and its ability to absorb a
rapidly increasing labor force. A comparison between Latin America and East Asia is
instructive here. Latin America has a demographic history that is similar to that of East
Asia (although its fertility reduction was less rapid), but the latter experienced rapid
economic growth, while Latin America stagnated for long periods of time.

26
Demographic opportunity alone has been insufficient for Latin America. We put
forward three possible hypotheses to account for this. First, East Asia has found ways to
engage in international trade that have helped to keep their large cohorts of workers
productively employed. The enabling changes involved a phased, careful, and partial
opening of economies to international markets, with governments striving to ensure that
integration would have coherent, and quickly visible, effects on the local economy and
people. In Latin America, too, governments have tried to integrate with the world
economy, but they have often done so inconsistently and many countries have suffered
long periods of poor macroeconomic management. The results, in terms of economic
growth and poverty reduction, have been disappointing. Meanwhile, internal markets
have not been sufficiently dynamic to provide employment to the large working-age
cohort.
Second, in comparison with Latin America, East Asia has had, in general, less
restrictive labor laws. Laws providing protection to workers – e.g., minimum wages, the
right to organize, and restrictions on firing – have been very important in many countries
in steering clear of some of the worst abuses of workers. At the same time, less restrictive
labor regimes in East Asia – although perhaps initially harmful to workers – may have
assisted the absorption of the baby boom cohort of workers.
Finally, the financial markets of East Asia may have done a better job of
mobilizing the potential saving of the baby boom generation towards productive
investments. In Latin America, weaker private sector financial institutions, large public
sector deficits, and the recurrent risk of loss of savings through hyper-inflation may all
have contributed to a wasted economic opportunity.
Well-chosen and effectively implemented policies in these areas – engagement
with the global economy, labor practices, and capital markets (and education14) – are all
potential complements to the demographic dividend.
14 Many countries in East Asia have successfully worked to educate the majority of young people and to do so in a fashion that has prepared them for an economy in which workers need to be able to learn new tasks. In an era when production methods change quickly in response to international demands and trends, better-educated workers are more able to adapt to new circumstances and contribute to the success of a wide range of industries and firms. The focus in numerous Asian countries on building a cadre of young people with good general education and technical skills

27
Many developing regions, particularly South Asia and North Africa, and in the
more distant future Sub-Saharan Africa, can look forward to this demographic dividend.
But the future for developed countries is somewhat different. The continuation of
improvements in health and reductions in mortality into old age, and continuing
reductions in fertility, coupled with the aging of the baby boom generation, are set to
produce a new age structure with high levels of old age dependency. How well these
countries cope with the challenge of population aging will likely depend to a large extent
on the flexibility of their markets and the appropriateness of their institutions and
policies.
It is important to remember that the projected changes in age structure and falling
population numbers expected in the developed countries are unparalleled in history.
While we have extensive experience of high rates of youth dependency, and of high
ratios of working age to total population, developed countries are set to experience high
rates of old age dependency and rapidly declining population numbers for the first time.
While we can make projections for this it should be borne in mind that there is little
previous evidence to serve as a guide.
One view is that population aging in the developed countries is likely to have a
large effect, reducing income per capita, mainly through the fall in labor supply per capita
that will accompany the reduction in the share of working age population.
However, even if this occurs, it may not be as harmful as it at appears, for three
reasons. First, income per capita is not a welfare measure. Nordhaus (2003) estimates that
over the 20th century improvements in longevity made a contribution to increasing
welfare in the United States of roughly the same magnitude as the rise in consumption
levels. The longer life expectancies that lead to aging can be thought of as improving
welfare directly. Even if rising life expectancy were to lead to reduced consumption
levels per period, it is difficult to argue that the net effect of increased longevity on
welfare will be negative.
Second, welfare depends on consumption, not income. Typically household
income falls at retirement, but consumption may remain relatively high. It follows that
has been invaluable. Although not as remarkable as East Asia, educational development in Latin America has also been impressive.

28
we could have two populations, each enjoying the same consumption stream over the
same life span, but the population with a larger elderly age cohort will have lower per
capita income. For example, the accounting identity given in Section III is compatible
with income per worker remaining constant while movements in income per capita are
driven by the contemporaneous age structure. However, this means that the wage rate and
life cycle income and consumption of each person may remain unchanged while the
income per capita at each point in time moves with age structure. It follows that while
we predict a reduction in income per capita as a result of population aging, to the extent
that this is an accounting effect based on age structure at each point in time it may not
affect the welfare of each cohort.
Third, old age "dependency" is something of a misnomer. Lee (2000) shows that,
in all pre-industrial societies for which he was able to assemble evidence, the flow of
transfers is from the middle aged and old to the young. In developed countries, on the
other hand, both the young and the old benefit from government transfers, and the net
pattern of transfers is towards the elderly. However, at the household level in the United
States, elderly households make significant transfers to middle aged households, undoing
to some extent the effects of government policy. The dependency burden of the elderly is
a function of the institutional welfare systems that are in place rather than an immutable
state of affairs.
While the consequences of a fall in per capita income may not be all that bad for
welfare, it is not even clear that population aging will lead to a fall in per capita income.
Increases in life expectancy in the United States over the last two centuries have been
associated with reductions in the age-specific incidence of disease, disability, and
morbidity (Costa 1998; Fogel 1994, 1997). Mathers and others (2001) show that health-
adjusted life expectancy (each life year weighted by a measure of health status) rises
approximately one for one with life expectancy across countries. This implies that the
length of period of ill health at the end of life appears to be fairly constant and as life
expectancy rises health status improves proportionately.
Given longer life spans, people can either work longer or consume less. If they
work longer they can keep their consumption levels high and need only save at the same
rate as before for old age. If they decide to take extra leisure and retire at the same age as

29
before they will have lower consumption levels throughout their life and will need higher
savings rates while working. Bloom, Canning, and Moore (2004) examine this issue
theoretically and argue that when health improves and longevity rises the optimal
response is likely to be a longer worker life, without the need for higher savings. The
tendency towards early retirement is explained by an income effect with people wanting
more leisure time as incomes rise.
To the extent that working lives lengthen in response to longer life spans there is
no reduction in income levels. Indeed average income and consumption per capita can
remain high. The fixed definition of the working age population (15-64 years of age) we
used in our analysis in Section III (like our assumption of a fixed participation ratio for
this group) assumes no behavioral change when in fact such changes may occur.
While projections based on fixed labor supply may suggest a labor shortage, this
is exactly the situation in which market responses may be expected to ameliorate the
situation. Rising wages will tend to increase labor market participation, particularly of
women and the younger elderly and may also to some extent induce inward migration. If
these supply responses are sufficiently elastic the required rise in wages may be small,
implying the command of the elderly over labor resources out of their retirement income
is not diminished significantly.
A greater challenge is to ensure than non-market institutions are capable of
responding to the problems that arise with an aging population. The two major issues are
labor supply and saving. In terms of labor supply, any institutional factors that prevent a
supply response to rising wages need to be addressed.
Of particular concern are social security systems that encourage early retirement
and financially penalize a longer working life. Gruber and Wise (1998) show that labor
market participation of the elderly is quite responsive to social security incentives.
Belgium, Italy, France Germany and the Netherlands have large incentives to retire early,
with implicit tax rates (taking account of taxes and lost benefits) on earnings around age
65 in excess of 60%, and corresponding low participation rates of the 55 to 65 age group.
On the other hand, the United States, Canada, Sweden, and in particular Japan have much
lower effective tax rates on older workers and correspondingly higher labor force
participation. Ideally, tax revenues should be raised in the least distortionary manner

30
possible. In light of the evidence of a large labor supply response to high effective tax
rates on older workers, the policy environment seems to afford much scope for
improvement (for example, by making social security systems in Europe actuarially
neutral, so that workers who work for longer receive higher benefits when they do retire,
based on their contributions and life expectancy at that point).
Labor shortages and rising wages due to population aging can also be alleviated
by allowing greater immigration from less developed countries. The large wage gaps that
exist between countries, and the fact that the demographic transitions in different regions
are out of phase, creates an incentive for such migration.
Figure 11 shows the number and age structure of migrants to the United States
between 2000 and 2003. The migrants are overwhelmingly of working age. Figure 12
shows the age structure of the United States population in 2003 and separates out the
native and foreign born populations. The age structure of the foreign born is concentrated
in the working age group, though this is less pronounced than the age structure of recent
migrants reflecting the aging of earlier migrants to the United States. In-migration has
made a significant contribution to improving the ratio of workers to non-workers in the
United States. For example, in 2003, the US ratio of working age to non-working age
population was 1.89; in the absence of inward migration (that is, counting only the native
born) this figure would have been 1.72.
Over the next 50 years, population aging in Western Europe will be more rapid
than in the United States, due to a lower birth rate and to lower levels of immigration. It
seems clear that the incentives to increase labor supply will become large in Western
Europe, to provide workers to supply labor intensive services to the elderly, and to shore
up to some extent the tax base for social security transfer systems. While there may be
resistance to longer working lives, or large scale immigration, the economic incentives
for one or both of these responses may grow very strong. Hatton and Williamson (2001,
2002) discuss the increasing pressures for migration from developing to developed
countries that are likely to occur due to demographic change.
For both saving and labor supply, however, markets are not the main mechanisms
that need to be addressed. Rather, policy responses are required. In the case of a longer
working life, we have already discussed the negative incentives currently in place and

31
argued for a more encouraging tax regime for older workers. In the case of migration the
policy issues are more complex. It is clear that the large wage gaps between rich and poor
countries mean that there are large potential gains to migration. These gains largely
accrue to the migrants themselves. There are, however, negative externalities to the
receiving country and possibly to the sending country. Competition for jobs may depress
wages, harming workers in the receiving country, while the loss of working age people,
and the human capital they embody (the "brain drain" effect), may depress income levels
in the sending country. A second issue with migration is its effect on national culture and
public goods provision. Alessina and Spolare (2004) make the point that societies that are
heterogeneous in terms of ethnic, linguistic, and religious composition appear to be worse
at providing efficient levels of public goods. Levitt (2001) explores the concept of social
remittances that coincide with international migration.
The challenge with migration is to devise institutions that turn a large potential
efficiency gain into a Pareto improvement by compensating those who lose from the
process. Such a scheme would not only help improve welfare but might also remove
much of the political opposition to migration by ensuring that it is a win-win proposition.
Similar issues occur with trade in commodities and lessons from that arena may well be
applicable to migration.
A second central issue in population aging involves the provision of income to the
elderly. The disequilibrium dynamics of the age structure mean that providing for the
elderly through a transfer system based on rigid sets of tax rates on workers and benefit
rates to retirees is not sustainable. The support of large numbers of elderly will require
real resources to be accumulated today to supply their needs in the future.
Social security transfer systems actually undermine this accumulation of
resources by reducing the need for workers to save. However social security systems in
some form appear to be essential. There is a widespread lack of foresight about the need
to save for retirement perhaps due to time inconsistency in preferences (Feldstein 1985;
Laibson 1998; Laibson and others 1998). There may also be in some countries capital
market imperfections (Hubbard and Judd 1987) that may make saving for retirement
unappealing.

32
There is general agreement among academics about the need for institutional
changes in developing countries to move away from pay-as-you-go pension systems to at
least partially-funded systems. There are however two difficulties with such policies. The
first is that large-scale savings may lower the return on savings to the point where it
becomes difficult for a large cohort to generate sufficient resources for retirement. This is
partly a case of a low return on investment. As savings surge, investment opportunities
become scarce, and there is a worsening in the inter-temporal terms of trade as the low
wages of the large baby boom generation are replaced by the high wages of the
succeeding small cohort. However, Poterba (2004) argues that demographic factors
appear to have had only a small effect on real rates of return historically.
A more worrying prospect than a fall in the long run rate of return may be a large
and long lasting financial crisis that reduces the returns to a particular cohort. The
prospect of such a crisis creates aggregate uncertainty regarding the value of capital,
against which neither markets nor governments can provide insurance.

33
References
Ahlburg, D. A. 2002. “Does Population Matter?” Population and Development Review,
28(2).
Alessina, A., and E. Spolare. 2004. The Size of Nations. Cambridge, MIT Press.
Barro, R., and J. Lee. 2000. "International Data on Educational Attainment: Updates and
Implications." Working Paper no. 42. Harvard University, Center for International
Development, Cambridge, Massachusetts.
Barro, R., and X. Sala-I-Martin. 1995. Economic Growth. New York: McGraw-Hill.
Bennett N.G., Bloom D.E., and Ivanov S.F. 1998. "Demographic Implications of the
Russian Mortality Crisis, World Development, 26:1921-1937.
Birdsall N., A. C. Kelley, and S. W. Sinding, eds. 2001. Population Matters:
Demography, Growth, and Poverty in the Developing World. New York: Oxford
University Press.
Bloom, D., and D. Canning. 2001. “Demographic Change and Economic Growth: The
Role of Cumulative Causality.” In N. Birdsall, A. C. Kelley, and S. W. Sinding,
eds. Population Does Matter: Demography, Growth, and Poverty in the
Developing World. New York: Oxford University Press. pp. 165–97.
Bloom, D., and D. Canning. 2003a. “From Demographic Lift to Economic Liftoff: The
Case of Egypt”, Applied Population and Policy, September 1(1): 15-24.
Bloom, D., and D. Canning. 2003b. ‘Contraception and the Celtic Tiger’, Economic and
Social Review, Winter 2003, Vol. 34, No. 3, pp. 229-247.
Bloom, D., D. Canning, and B. Graham. 2003. "Longevity and Life-Cycle Savings."
Scandinavian Journal of Economics 105: 319–38.
Bloom, D., D. Canning, and P. Malaney. 2000. “Demographic Change and Economic
Growth in Asia.” Population and Development Review, 26: 257–90.
Bloom, D., D. Canning, and M. Moore. 2004. “Health, Longevity, and Optimal
Retirement.” NBER Working Paper. August.
Bloom, D., D. Canning, and J. Sevilla. 2002. The Demographic Dividend: A New
Perspective on the Economic Consequences of Population Change. Santa Monica,
California: RAND, MR–1274.

34
Bloom, D., D. Canning, and J. Sevilla. 2004. “The Effect of Health on Economic Growth:
A Production Function Approach.” World Development, Vol. 32, No. 1, pp. 1-13.
Bloom, D., R. Freeman and S. Korenman. 1987. “The Labor Market Consequences of
Generational Crowding”, European Journal of Population, 1987, 131–176.
Bloom, D., and J. D. Sachs. 1998. “Geography, Demography and Economic Growth in
Africa”. Brookings Papers on Economic Activity, 2: 207–95.
Bloom, D., and J. G. Williamson, 1998. “Demographic Transitions and Economic
Miracles in Emerging Asia”. World Bank Economic Review, 12: 419–56.
Bongaarts J. 1994. "The Impact of Population Policies: Comment,” Population and
Development Review 20, 616–620.
Bongaarts J. 1997. “The Role of Family Planning Programmes in Contemporary Fertility
Transitions,” in Gavin W. Jones, Robert M. Douglas, John C. Caldwell, and
Rennie M. D’Souza (eds.), The Continuing Demographic Transition. Oxford:
Clarendon Press, 422–444.
Coale, A. J., and S. C. Watkins, 1986, The Decline of Fertility in Europe: the Revised
Proceedings of a Conference on the Princeton European Fertility Project.
Princeton University Press, 1986.
Costa, D. L. 1998a. The Evolution of Retirement: An American Economic History, 1880–
1990. National Bureau of Economic Research Series on Long-Term Factors in
Economic Development. Chicago: University of Chicago Press.
Deaton A. and Paxson C. (2000), "Growth, Demographic Structure, and National Saving
in Taiwan," Population and Development Review 26, Supplement: 141-173.
Easterlin, R. 1980. Birth and Fortune: The Impact of Numbers on Personal Welfare. New
York: Basic Books.
Easterly, W., and R. Levine (1997) "Africa's Growth Tragedy: Policies and Ethnic
Divisions," Quarterly Journal of Economics, 112(4), November: 1203-50.
Feldstein, M. S. 1985. "The Optimal Level of Social Security Benefits." Quarterly
Journal of Economics 10: 303–20.
Fogel, R. W. 1994. "Economic Growth, Population Theory, and Physiology: The Bearing
of Long-Term Processes on the Making of Economic Policy." American
Economic Review 84: 369–95.

35
Fogel, R. W., 1997. "New Findings on Secular Trends in Nutrition and Mortality: Some
Implications for Population Theory." In M. Rosenzweig and O. Stark, eds.,
Handbook of Population and Family Economics, vol. 1A. Amsterdam: Elsevier.
Foster, A., and N. Roy. 1997. "The Dynamics of Education and Fertility: Evidence from
a Family Planning Experiment". Unpublished manuscript.
Fry, M. and Mason, A. (1982), The Variable Rate of Growth Effect in the Life-Cycle
Model, Economic Inquiry 20, 426-42.
Gallup, J. L., J. D. Sachs, and A. Mellinger. 1999. "Geography and Economic
Development." International Regional Science Review 22: 179-232.
Gruber, J., and D. Wise.1998. "Social Security and Retirement: An International
Comparison." American Economic Review 88: 158–63.
Hatton, T. J. and Williamson, J. G. (2001), “Demographic and Economic Pressure on
Emigration Out of Africa,” NBER Working Paper 8124, National Bureau of
Economic Research, Cambridge, MA.
Hatton, T. J. and Williamson, J. G. (2002), “What Fundamentals Drive World
Migration?", NBER Working Paper 8124, National Bureau of Economic
Research, Cambridge, MA.
Heston, A., and R. Summers. 1991. "The Penn World Table (Mark 5): An Expanded Set
of International Comparisons, 1950-1988." Quarterly Journal of Economics 106:
327-68.
Higgins, M. (1998), Demography, National Savings, and International Capital Flows,
International Economic Review 39, 343-69.
Higgins, M. and Williamson J. (1997), Age Structure Dynamics in Asia and Dependence
on Foreign Capital, Population and Development Review 23, 261-93.
Hubbard, R. G., and K. L. Judd. 1987. "Social Security and Individual Welfare:
Precautionary Saving, Borrowing Constraints, and the Payroll Tax." American
Economic Review 77: 630–46.
Kalemli-Ozcan, S., H. Ryder, and D. N. Weil. 2000. "Mortality Decline, Human Capital
Investment, and Economic Growth." Journal of Development Economics 62: 1–
23.

36
Kelley, A. C., 1988. “Economic Consequences of Population Change in the Third
World”. Journal of Economic Literature, 27:1685–728.
Kelley, A. C. 1996, "The Consequences of Population Growth for Human Resource
Development: The Case of Education." In D. A. Ahlburg, A. C. Kelley and K.
Oppenheim Mason, The Impact of Population Growth on Well-being in
Developing Countries, Berlin: Springer-Verlag, pp. 67-137.
Kelley, A. C. 2001. “The Population Debate in Historical Perspective: Revisionism
Revised”. In N. Birdsall, A. C. Kelley, and S. W. Sinding, eds. Population
Matters: Demographic Change, Economic Growth, and Poverty in the
Developing World. Oxford University Press. 24–54.
Kelley, A. C., and Schmidt, R.M. (1996), Saving, Dependency, and Development,
Journal of Population Economics 9, 365-86.
Kelley, A. C. and R. Schmidt. 2001. “Economic and Demographic Change: A Synthesis
of Models, Findings, and Perspectives.” In N. Birdsall, A. C. Kelley, and S. W.
Sinding, eds. Population Matters: Demographic Change, Economic Growth, and
Poverty in the Developing World. Oxford University Press.
Knack, S., and P. Kiefer. 1995. "Institutions and Economic Performance: Cross-Country
Tests Using Alternative Institutional Measures." Economics and Politics 7: 207-
27.
Korenman, S. and D. Neumark. “Cohort Crowding and Youth Labor Markets: A Cross-
National Analysis,” In Youth Employment and Joblessness in Advanced
Countries, D. G. Blanchflower and R. B. Freeman, eds. University of
Chicago/NBER, 2000, pp. 57-105.
Laibson, D. 1998. "Life-Cycle Consumption and Hyperbolic Discount Functions."
European Economic Review 42: 861–71.
Laibson, D. I., A. Repetto, J. Tobacman, R. E. Hall, W. G. Gale, and G. A. Akerlof.
1998. "Self-Control and Saving for Retirement." Brookings Papers on Economic
Activity 1998: 91–196.
Lee, R. D. 2000. "Intergenerational Transfers and the Economic Life Cycle: A Cross
Cultural Perspective", in A. Mason and G. Tapinos (eds.), Sharing the Wealth:

37
Demographic Change and Economic Transfers between Generations, Oxford
University Press.
Lee, R. D. 2003. "The Demographic Transition: Three Centuries of Fundamental
Change." Journal of Economic Perspectives 17: 167–90.
Lee, R. D., A. Mason, and T. Miller. 2000. "Life-Cycle Saving and the Demographic
Transition: The Case of Taiwan." Population and Development Review 26,
Supplement: 194–219.
Leff, N.H. (1969), Dependency Rates and Savings Rates, American Economic Review 59,
886-96.
Levitt, P. 2001. The Transnational Villagers, Berkeley: University of California Press.
Mason, A. (1987), National Saving Rates and Population Growth: A New Model and
New Evidence, in D. G. Johnson and R.D. Lee (eds.), Population Growth and
Economic Development: Issues and Evidence, University of Wisconsin Press,
Madison.
Mason, A. (1988), Saving, Economic Growth, and Demographic Change. Population and
Development Review 14, 113-44.
Mason, A., ed. 2001. Population Change and Economic Development in East Asia:
Challenges Met, Opportunities Seized. California: Stanford University Press.
Murphy-Lawless, J., and J. McCarthy. 1999. “Recent Fertility Change in Ireland and the
Future of Irish Fertility’. In Below Replacement Fertility, Population Bulletin of
the United Nations, Special Issue Nos. 40/41, 1999. NewYork: United Nations:
pp. 235-246.
Murray, C. J. L., and L.C. Chen. 1992. "Understanding Morbidity Change." Population
and Development Review 18: 481-503.
Murray, C. J. L., and A. D. Lopez. 1997. "Regional Patterns of Disability-Free Life
Expectancy and Disability Adjusted Life Expectancy: Global Burden of Disease
Study." Lancet 349: 1347-52.
Mathers, C. D., R. Sadana, J. A. Salomon, C. J. L. Murray, and A. D. Lopez. 2001.
"Healthy Life Expectancy in 191 Countries, 1999." Lancet 357(9269):1685–91.
Nordhaus, W. 2003. “The Health of Nations: The Contribution of Improved Health to
Living Standards.” In K. H. Murphy and R. H. Topel, eds., Measuring the Gains

38
from Medical Research: An Economic Approach. Chicago: University of Chicago
Press.
Poterba J. M., 2004, "Impact of Population Aging on Financial Markets in Developed
Countries," paper presented to the Symposium on Global Demographic Change,
Federal Reserve Bank of Kansas.
Preston S. (1975). "The Changing Relation between Mortality and Level of Economic
Development," Population Studies, Vol. 29, pp. 231-248.
Pritchett, L. H., 1994. “Desired Fertility and the Impact of Population Policies.”
Population and Development Review 20(1): 1-55.
Pritchett, L. H., and Lawrence H. Summers. 1996. "Wealthier is Healthier." Journal of
Human Resources 31(4):841-868.
Sachs, J. D., and A. Warner, 1995, Economic Reform and the Process of Global
Integration, Brookings Papers on Economic Activity, 1:1-118, Washington:
Brookings Institution.
Schultz, T. P., 1997, "The Demand for Children in Low Income Countries," Handbook of
Population and Family Economics, Vol. 1A, Chapter 8, (eds.) M.R. Rosenzweig
and O. Stark, Amsterdam: North-Holland Publishing.
Tsai I-J, C.Y.C. Chu and C-F Chung. 2000. "Demographic Transition and Household
Saving in Taiwan," Population and Development Review 26, supplement: 174-
193.
UNAIDS. 2004. AIDS Update 2004. Geneva Switzerland.
United Nations. 1998. Demographic Indicators 1950-2050. New York.
Young, A. 1994. "Lessons from the East Asian NIC’s: A Contrarian View." European
Economic Review 38: 964-73.
Young, A. 1995. "The Tyranny of Numbers: Confronting the Statistical Realities of the
East Asian Growth Experience." Quarterly Journal of Economics 110: 641-80.

39
Table 1 Estimates of the Determinants of the Growth Rate of Income Per Capita
1 2 3 OLS 2SLS 2SLS Constant 0.607***
(3.58) 0.650***
(3.73)
0.531*** (2.84)
Openness
0.070*** (3.96)
0.067*** (3.86)
0.029 (1.19)
Institutional Quality
0.008* (1.73)
0.008* (1.69)
0.009* (1.90)
Ethno-linguistic Fractionalization
-0.049* (1.71)
-0.048* (1.73)
-0.046 (1.60)
Landlocked
-0.013 (0.72)
-0.011 (0.58)
-0.005 (0.27)
Tropical Area
-0.032 (1.57)
-0.035* (1.71)
-0.029 (1.44)
Initial average years of schooling
-0.002 (0.48)
-0.002 (0.45)
-0.002 (0.37)
Initial life Expectancy
0.005*** (3.41)
0.005*** (2.93)
0.007*** (3.33)
Log initial income per capita
-0.096*** (5.48)
-0.095*** (5.50)
-0101*** (5.58)
Log initial working age over total pop
0.205* (1.71)
0.241* (1.89)
0.165 (1.17)
Growth of working age over total pop
0.996*** (3.06)
1.394** (2.49)
-0.310 (0.27)
Growth of working age times openness
2.524** (2.08)
R squared 0.321 0.318 0.313 Based on 507 observations, from 5 year panel of countries, over the period 1965-1995. Time dummies included but not reported. Heteroskedasticity-consistent standard errors are reported in parentheses below the coefficient estimates.

40
Figure 1 - The Demographic Transition in Sweden
0
10
20
30
40
50
60
1730 1750 1770 1790 1810 1830 1850 1870 1890 1910 1930 1950 1970 1990 2010
Year
Rat
e pe
r 100
0Birth Rate
Death Rate
Figure 2 - Japan: Birth and Death Rates
0
5
10
15
20
25
1950 1960 1970 1980 1990 2000 2010 2020 2030 2040 2050Year
Rat
e pe
r 10
00
Birth Rate
Death Rate

41
Figure 3 - Japan Life Expectancy
60
65
70
75
80
85
90
1950 1960 1970 1980 1990 2000 2010 2020 2030 2040 2050Year
Yea
rs
0 -
45
- 9
10 -
14
15 -
19
20 -
24
25 -
29
30 -
34
35 -
39
40 -
44
45 -
49
50 -
54
55 -
59
60 -
64
65 -
69
70 -
74
75 -
79
80 -
84
85 -
89
90 -
94
95 -
99
100+
2050
2030
2010
19901970
1950
0
2
4
6
8
10
12
Population (Millions)
Age Group
Year
Figure 4 - Japan: Population by Age and Year
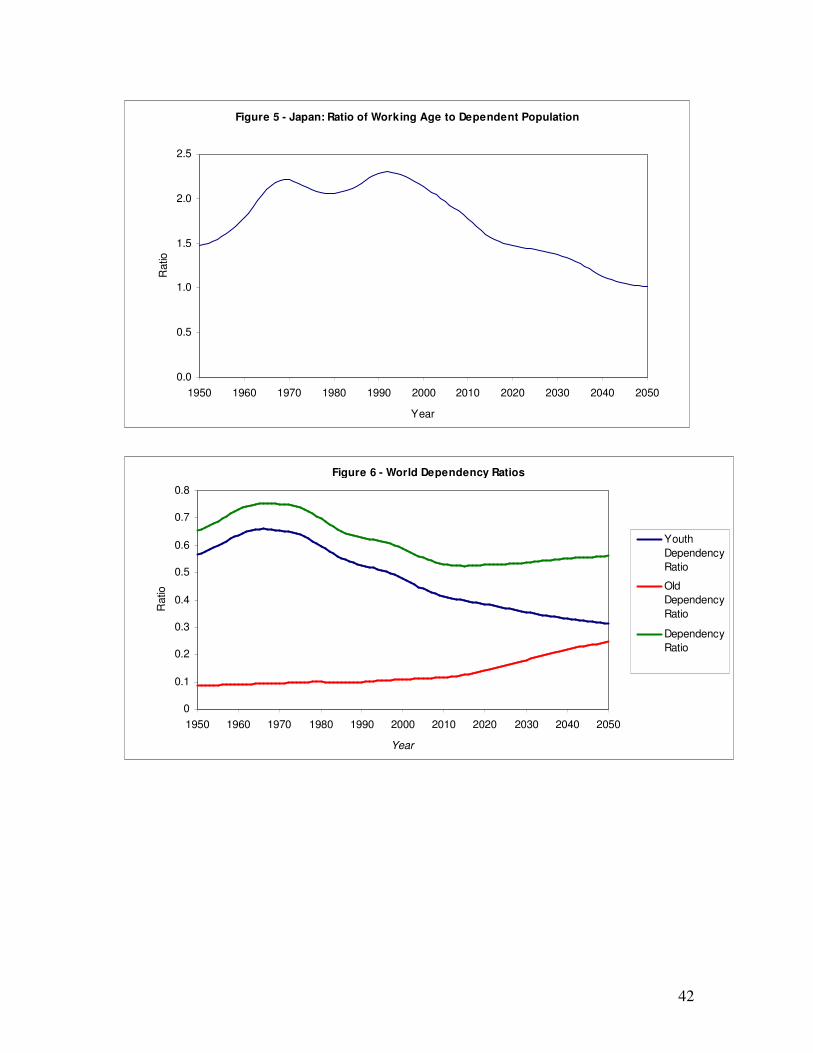
42
Figure 5 - Japan: Ratio of Working Age to Dependent Population
0.0
0.5
1.0
1.5
2.0
2.5
1950 1960 1970 1980 1990 2000 2010 2020 2030 2040 2050
Year
Rat
io
Figure 6 - World Dependency Ratios
0
0.1
0.2
0.3
0.4
0.5
0.6
0.7
0.8
1950 1960 1970 1980 1990 2000 2010 2020 2030 2040 2050
Year
Rat
io
YouthDependencyRatio
OldDependencyRatio
DependencyRatio

43
Figure 7 - Ratio of Working Age to Dependent Population
0.0
0.5
1.0
1.5
2.0
2.5
1950 1960 1970 1980 1990 2000 2010 2020 2030 2040 2050
Year
Rat
io
East AsiaUSASub-Saharan AfricaSouth AsiaEurope
Figure 8 - Total Fertility Rate, Ireland and U.K.
1.5
2
2.5
3
3.5
4
4.5
1960 1965 1970 1975 1980 1985 1990 1995 2000
Year
Rat
e
Ireland
United Kingdom

44
Figure 9 - Ratio of Working Age to Dependent Population, Ireland and UK
0.0
0.5
1.0
1.5
2.0
2.5
1950 1960 1970 1980 1990 2000 2010 2020 2030 2040 2050
Year
Rat
io
Ireland
United Kingdom
Figure 10: Ireland - Female Labor Market Participation
0
10
20
30
40
50
60
70
80
20 25 30 35 40 45 50 55 60age group
rate
1950
1960
1970
1980
1990
2000

45
Figure 11: Age Distribution of Foreign Born in the US entered 2000-2003
0
100
200
300
400
500
600
700
800
900
1,000
0 10 20 30 40 50 60 70 80 90
Age
Th
ou
san
ds
Figure 12: US Population by Age 2003
0
5
10
15
20
25
0 10 20 30 40 50 60 70 80 90
Age
Mill
ions
Total
Foreign Born
Native Born