NBER WORKING PAPER SERIES “WILL SOCIAL SECURITY BE … · How Americans Perceive Their Benefits...
48
NBER WORKING PAPER SERIES “WILL SOCIAL SECURITY BE THERE FOR YOU?”: HOW AMERICANS PERCEIVE THEIR BENEFITS Jeff Dominitz Charles F. Manski Jordan Heinz Working Paper 9798 http://www.nber.org/papers/w9798 NATIONAL BUREAU OF ECONOMIC RESEARCH 1050 Massachusetts Avenue Cambridge, MA 02138 June 2003 This research was supported in part by National Institute on Aging Grant 2 P01 AG10179-04A1 and a grant from the Searle Fund. We are grateful to the University of Wisconsin Survey Center for enabling collection of the telephone survey data and to Jora Stixrud for assistance in performance of the face-to-face survey. We have benefited from the comments of participants in seminars at the Hebrew University of Jerusalem, Northwestern University, University College London, and the University of Pennsylvania; participants in the TMR Savings and Pensions Workshop held August 2001 in Evian, France; participants in the Conference on Survey Research on Household Expectations and Preferences held November 2001 in Ann Arbor, Michigan; and participants in the Institute for Research on Poverty 2002 Summer Workshop. An early version of this paper was distributed as "Social Security Expectations and Retirement Savings Decisions," National Bureau of Economic Research Working Paper w8718, January 2002. The views expressed herein are those of the authors and not necessarily those of the National Bureau of Economic Research. ©2003 by Jeff Dominitz, Charles F. Manski, and Jordan Heinz. All rights reserved. Short sections of text not to exceed two paragraphs, may be quoted without explicit permission provided that full credit including © notice, is given to the source.
Transcript of NBER WORKING PAPER SERIES “WILL SOCIAL SECURITY BE … · How Americans Perceive Their Benefits...

NBER WORKING PAPER SERIES
“WILL SOCIAL SECURITY BE THERE FOR YOU?”:HOW AMERICANS PERCEIVE THEIR BENEFITS
Jeff DominitzCharles F. Manski
Jordan Heinz
Working Paper 9798http://www.nber.org/papers/w9798
NATIONAL BUREAU OF ECONOMIC RESEARCH1050 Massachusetts Avenue
Cambridge, MA 02138June 2003
This research was supported in part by National Institute on Aging Grant 2 P01 AG10179-04A1 and a grantfrom the Searle Fund. We are grateful to the University of Wisconsin Survey Center for enabling collectionof the telephone survey data and to Jora Stixrud for assistance in performance of the face-to-face survey. Wehave benefited from the comments of participants in seminars at the Hebrew University of Jerusalem,Northwestern University, University College London, and the University of Pennsylvania; participants in theTMR Savings and Pensions Workshop held August 2001 in Evian, France; participants in the Conference onSurvey Research on Household Expectations and Preferences held November 2001 in Ann Arbor, Michigan;and participants in the Institute for Research on Poverty 2002 Summer Workshop. An early version of thispaper was distributed as "Social Security Expectations and Retirement Savings Decisions," National Bureauof Economic Research Working Paper w8718, January 2002. The views expressed herein are those of theauthors and not necessarily those of the National Bureau of Economic Research.
©2003 by Jeff Dominitz, Charles F. Manski, and Jordan Heinz. All rights reserved. Short sections of textnot to exceed two paragraphs, may be quoted without explicit permission provided that full credit including© notice, is given to the source.

“Will Social Security Be There For You?: How Americans Perceive Their BenefitsJeff Dominitz, Charles F. Manski, and Jordan HeinzNBER Working Paper No. 9798June 2003JEL No. H55, D84, E2
ABSTRACT
Americans may be uncertain of their future Social Security benefits for several reasons, including
uncertainty about their future labor earnings, the formula now determining Social Security benefits,
and the future structure of the Social Security system. To learn how Americans perceive their
benefits, we have elicited Social Security expectations from respondents to the Survey of Economic
Expectations. We have also performed a more intensive face-to-face survey on a small sample of
respondents. We find clear and striking evidence of substantial uncertainty and heterogeneity of
beliefs about the long-term existence of the Social Security system and about the level of benefits
provided should the system survive.
Jeff Dominitz Charles F. ManskiH. John Heinz II School of Public Policy Department of Economicsand Management and Institute for Policy ResearchCarnegie Mellon University Northwestern University5000 Forbes Avenue 2001 Sheridan RoadPittsburgh, PA 15213 Evanston, IL [email protected] and NBER
[email protected] HeinzUniversity of Pennsylvania Law School3400 Chestnut StreetPhiladelphia, PA [email protected]

1. Introduction
Americans may be uncertain of their future Social Security benefits for several reasons,
including uncertainty about their future labor earnings, the formula now determining benefits,
and the future structure of the Social Security system. Structural uncertainty is particularly
pertinent today, as Congress and the President contemplate possibly radical revision of a Social
Security system declared by President Bush’s Commission to Strengthen Social Security to have
“reached retirement age.”1 Some proposed revisions, notably those calling for private
investment of OASDI taxes, could increase uncertainty about future benefits. Other proposals,
notably those calling for the government to create a “Social Security lockbox” of guaranteed
benefits, could reduce uncertainty. The Social Security Administration (SSA) calls the public’s
attention to the possibility of future change in its document The Future of Social Security, which
begins: “Will Social Security be there for you? Absolutely. The only real question is what kind
of Social Security system we will have.” 2
Although uncertainty about Social Security benefits should be widespread, there is reason
to think that the degree and nature of this uncertainty varies systematically across the population.
Under the existing formula with a benefit cap, older workers with histories of consistently high
levels of earnings should face less uncertainty about their benefit levels than do those with
histories of fluctuating earnings.3 Younger workers should face more labor earnings uncertainty
1 Richard W. Stevenson, New York Times, July 20, 2001. 2 Social Security Administration Publication No. 05-10055, August 2000. http://www.ssa.gov/pubs/10055.html 3 Expectations of benefits under the existing Social Security system may be influenced by the annual statements that workers now receive from the Social Security Administration. Beginning in October 1999, SSA has mailed workers of age 25 and older annual point estimates of their prospective benefits. Previously, a Personal Earnings and Benefit Estimate Statement had been available on request since 1988. See Section 5.3 for further discussion.

2
than older workers, and also more uncertainty about the future structure of the system.
Research aiming to understand the impact of Social Security policy on labor supply,
retirement savings, and other household decisions has been hampered by a dearth of empirical
evidence on Social Security expectations. Respondents to the Retirement History Survey and to
the Health and Retirement Study have provided point forecasts of their future benefits (see
Bernheim, 1988; Gustman and Steinmeier, 1999, 2001). However, respondents’ uncertainty
about benefits has not been measured. Nor have attempts been made to learn the process by
which persons form their expectations.
From summer 1999 through fall 2002, we elicited probabilistic expectations of Social
Security retirement benefits from respondents to our national Survey of Economic Expectations
(SEE), which began in 1993 and continued through 2002 (see Dominitz and Manski, 1997a,
1997b). Moreover, in the summer of 2001, we performed a more intensive face-to-face survey
on a small sample of respondents. This paper presents the empirical findings.
To motivate interest in Social Security expectations, Section 2 observes how information
on such expectations is necessary to understand retirement savings decisions. Section 3
describes the data on Social Security expectations that we have collected in the SEE and in the
face-to-face survey. In Section 4, we present empirical findings that document striking
uncertainty and heterogeneity of beliefs about the long-term existence of the Social Security
system and about the level of benefits provided should the system survive. Younger Americans,
particularly those under 45, perceive a high probability of ineligibility for receipt of benefits at
age 70. Conditional on receipt of benefits at 70, expectations for the level of benefits do not vary
much by age, but substantial heterogeneity and uncertainty exist at all ages. Responses to open-
ended survey questions about the sources of information and reasons for these beliefs provide a

3
fuller picture of the formation of expectations about Social Security benefits. Section 5 draws
conclusions.
2. Social Security Expectations and Retirement Savings
Optimal Savings Decisions in a Two-Period World
An idealized two-period model makes evident the role of Social Security expectations as
a determinant of retirement savings. Suppose that a person lives for two periods, working in the
first period and retiring in the second. In the first period, the person receives labor earnings and
other income Y1 > 0, which he must allocate between consumption and retirement savings.
Savings may be invested in part in a mutual fund, with uncertain real rate of return, and in part in
a risk-free asset. Let Sm ≥ 0 denote savings in the mutual fund and Sf ≥ 0 denote risk-free
savings. In the second period, the person consumes his Social Security retirement benefit Y2 ≥ 0
and realized savings (1 + rm)Sm + (1+rf)Sf, where rm is the realized rate of return on the mutual
fund and rf is the risk-free rate of return. Thus, consumption in the two periods must satisfy the
budget constraints
C1 = Y1 - Sm - Sf
C2 = Y2 + (1 + rm)Sm + (1+rf)Sf.
The utility associated with consumption of the bundle (C1, C2) is U(C1) + βU(C2), where β is the

4
discount rate.
Suppose that, when facing the consumption-savings decision in the first period, the
person knows his contemporaneous income Y1, but does not know either his future Social
Security benefit Y2 or the return rm on the mutual fund. Suppose that he forms a subjective
distribution P(Y2, rm) and acts to maximize expected utility. Then, in the first period, the person
chooses retirement savings to solve the problem
( ) ),()1()1()(max 221,
mffmmfm
SSrYdPSrSrYUSSYU
fm ∫ +++++−− β
Thus, a person’s retirement savings decision depends on his first-period income Y1, his
preferences [U(.), β], and his expectations P(Y2, rm) of Social Security benefits and mutual fund
returns.
Social Security Policy and Expectations
In the context of this model, social security policy affects the retirement savings decision
by influencing the person’s expectations. Policy changes may affect the joint distribution P(Y2,
rm), but it is perhaps easiest to speculate on the changes to the marginal distribution P(Y2).
Consider creation of a “Social Security Lockbox” that guarantees future benefits to
persons now working. Such a guarantee would presumably reduce the size of the left tail of
P(Y2), as workers are relieved of the present-day concern with a catastrophic collapse of the
Social Security system. However, the specific effect of the policy change on expectations would
likely depend on the nature of the government guarantee. A government commitment to

5
maintain present benefit levels may well have different effects on expectations than would a
guarantee of some minimum benefit level.
Revision of the Social Security system to include private investment of a portion of
OASDI taxes in a personal retirement account would change Social Security from a system of
defined benefits to one with a defined-contribution component. When considering private
pensions, it is commonly thought that such a change should increase the dispersion of benefit
expectations and move their central tendency rightward. However, the effect on Social Security
expectations may well depend on the specific form of the private-investment component and on
other considerations. For example, Merton (1983) notes that a system combining defined
benefits and defined contributions may yield a smaller total risk than a system of defined benefits
alone or one of defined contributions alone. Feldstein and Liebman (2001) cite diversification as
a leading argument offered by advocates of a mixed system.
The Need for Empirical Evidence on Expectations
A recent NBER volume on the risk aspects of investment-based Social Security reforms
(Campbell and Feldstein, 2001) highlights the role of benefit expectations. Yet this volume
contains no direct empirical evidence on these expectations. McHale (2001) attempts to infer the
“political risks” of defined benefit systems from international evidence on changes in benefit
rules. Campbell et al. (2001) connect defined-benefit uncertainty to labor income uncertainty
through the Social Security benefit formula. Feldstein et al. (2001) suppose that defined benefits
are known with certainty and use historical data on the performance of a diversified portfolio of
securities to assess the financial risks of an investment-based system.
In the absence of empirical evidence, one can only speculate about how changes in Social

6
Security policy would affect expectations, and thence retirement savings. A natural first step in
assembling the necessary empirical evidence is to learn the expectations that Americans
presently hold for Social Security benefits. This is the purpose of the surveys described in
Section 3.
3. Eliciting Expectations of Social Security Benefits
3.1. The Survey of Economic Expectations
The Survey of Economic Expectations, a periodic module in a continuous national
telephone survey conducted by the University of Wisconsin Survey Center (UWSC), was begun
in 1993 and continued through 2002.4 Dominitz and Manski (1997a, 1997b), Dominitz (1998,
2001), and Manski and Straub (2000) describe the survey design and report findings on
expectations of income, job loss, and other outcomes one year into the future.
Beginning in 1999, the survey included a series of questions eliciting expectations of
Social Security benefits from persons of ages 18 – 69.5 This part of the survey begins with a
brief description of the Social Security program and a request for the respondent to predict his
eligibility for benefits when he is 70 years old, as follows:6
4 UWSC discontinued the continuous survey in mid-2002. The SEE module of questions was then included as a module in the UWSC “national omnibus survey” in fall 2002. See http://www.wisc.edu/uwsc/national.htm 5 The national omnibus survey elicited the year of birth rather than age. For respondents to these interviews in fall 2002, we calculate age as 2002 minus year of birth. 6 These introductory instructions are intended to stimulate the respondent to consider the range of possible outcomes. It is possible that the instructions convey information that respondents use to form expectations.

7
Politicians and the news media have been talking recently about the future of the Social
Security retirement system, the federal program providing benefits to retired workers.
The amount of benefits for which someone is eligible is currently determined by the
person’s retirement age and by earnings prior to retirement. There has been much
discussion of changing the form of the Social Security system, so the future shape of the
system is not certain.
With this in mind, I would like you to think about what kind of Social Security retirement
benefits will be available when you are older. In particular, think ahead to when you are
about to turn 70 years old and suppose that you are not working at that time.
What is the PERCENT CHANCE that you will be eligible to collect any Social Security
retirement benefits at that time?
Respondents who report a positive probability are then asked a series of questions
designed to elicit their subjective distribution of benefits, conditional on eligibility. This series
follows the format of the income-expectations questions that have been asked in SEE since its
inception (see Dominitz and Manski, 1997a). That is, respondents are first asked to report the
lowest and highest possible levels of their future benefits. The responses are then used to set
thresholds for up to six probabilistic questions about the level of benefits.7 The series has this
form:8
Assessment of such effects based on systematic experimentation with alternative sets of instructions is a worthy subject for future research. 7 For interviews conducted prior to April 2001, respondents were asked this series of probabilistic questions only if they gave valid responses to the questions eliciting lowest and highest possible values. Subsequently, we relaxed this requirement. However, to maintain comparability, we discard those probabilistic responses in the present analysis. 8 Instructing respondents to ignore inflation in the introductory statement below is potentially important, because we are asking respondents to forecast as much as fifty-two years into the future. Similar instructions were given to respondents in our exploratory study of student expectations of the returns to schooling (Dominitz and Manski, 1996).

8
Suppose you are eligible to collect Social Security benefits when you turn 70. Please
think about how much money you would be eligible to collect EACH YEAR. When
considering the dollar value, please ignore the effects of inflation or cost-of-living
increases. That is, please respond as if a dollar today is worth the same as a dollar when
you turn 70.
What do you think is the LOWEST amount of Social Security benefits, per year, that you
would be eligible to receive?
What do you think is the HIGHEST amount of Social Security benefits, per year, that you
would be eligible to receive?�
What is the percent chance (or chances out of 100) that you would be eligible to receive
over ${Y},000 of Social Security benefits per year, when you turn 70?
The responses to these questions may be used to estimate person-specific subjective
probability distributions of benefit levels, conditional on eligibility for benefits, as will be
explained in Section 4.3. In combination with the reported probability of eligibility, we
may estimate unconditional subjective distributions of benefits.9
3.2. Face-To-Face Interviews
The more intensive face-to-face interviews were designed to complement the national
telephone survey. A random sample of staff members at a midwestern university were asked
9 For respondents who report a zero probability of eligibility, the unconditional distribution is necessarily degenerate at $0. We do not elicit conditional probabilities of benefit levels from respondents who reported a zero chance of eligibility. These respondents are instead posed an open-ended question asking: “Why is that? (Why do you think there is no chance you will be eligible to collect any Social Security retirement benefits?)” We analyze responses to this question in Section 4.2.

9
essentially the same questions as the SEE respondents, plus additional open-ended questions
intended to explore how they went about forming their expectations.10 In particular, following
the questions eliciting expectations of Social Security benefits, respondents were asked
Having answered these questions, please describe as best you can the considerations you
had in mind when you were attempting to predict your Social Security retirement
benefits.
The interview also includes a new segment eliciting perceptions of the current maximum
annual Social Security benefit. Following an introductory statement, respondents were asked for
their subjective probabilities of the maximum benefit exceeding various thresholds and then for a
best point estimate.11 The segment closed with two open-ended questions. Here is the text:
Now think about Social Security benefits today. In particular, imagine a person who is
now 70 years old. Suppose that this person retired from work at age 65 and began
collecting benefits after working full time for 40 years. Suppose that, while working, this
person had high enough income to be eligible for the maximum Social Security benefit
that is currently paid.
10 The one difference between the questions in SEE and in the face-to-face interviews concerned the thresholds for the probabilistic questions on benefit levels. The CATI software used in SEE enables application of a person-specific branching algorithm, but this was difficult to implement with the pencil-and-paper format of the face-to-face interviews. Hence the same thresholds, ranging from $5,000 to $25,000, were posed to all respondents. 11 SEE elicits subjective probabilities only on the occurrence of future events, not on the value of objective quantities such as the current maximum Social Security benefit. However, the Bayesian idea that persons express uncertainty through subjective probabilities applies equally well to objective quantities and to future events.

10
What is the PERCENT CHANCE that this person currently receives over ${Y},000 of
Social Security benefits per year?
If you had to choose one number, what would be your best estimate of the benefits that
this person receives per year?
Describe as best you can the current system that the government now uses to determine
social security benefits. What are the main factors in calculating the size of the benefit?
And so on.
When thinking about the previous question, please describe as best you can the sources
from which you drew your information.
�
The interview concludes with a sequence of questions about expected income at age 70
from sources other than Social Security. Respondents report up to six probabilities
corresponding to threshold values ranging from $10,000 to $100,000. An open-ended question
concerning how these expectations were formed is asked as well. We do not analyze these data
in this paper.
4. SEE Findings
4.1. Sample Size, Response Rates, and Response Patterns
The analysis in this paper is based on the 2850 SEE interviews completed from summer
1999, when the Social Security questions were introduced, through fall 2002. Of the 2850

11
respondents, 2457 were age-eligible (i.e., under 70) for the Social Security questions.12 Of these,
2384 reported their chance of eligibility for benefits at age 70; thus the response rate to the
eligibility question was 0.97. Of these 2384 persons, 223 reported zero chance of receiving
benefits. Hence 2161 persons were asked the questions eliciting lowest and highest possible
benefits and the probabilities of benefits exceeding specified thresholds, conditional on
eligibility. Of these 2161 persons, 1398 gave responses that could be used to estimate person-
specific subjective distributions; thus the response rate to this sequence of questions was 0.65. In
all, we have unconditional subjective distributions of benefits for 1621 (223 + 1398) persons.
Our analysis focuses on these respondents, who constitute 0.66 of the age-eligible SEE sample
members.
The overall response rate of 0.66 to the sequence of Social Security expectations
questions is considerably lower than those that we have experienced asking SEE respondents to
forecast simple binary events (typically 0.95 or more) and somewhat lower than our experience
eliciting income expectations one-year-ahead (typically 0.80). About 80 percent (664 out of
836) of the non-response occurs when respondents do not report lowest/highest possible benefits.
Another 14 percent did not respond to all of the probability questions asked, and the remaining 6
percent gave complete reports that could not be used to estimate person-specific subjective
distributions.
With one-third of the sample having at least partially missing data, it is important to
understand the cross-sectional pattern of non-response to the degree possible. Table 1 shows that
respondents and non-respondents have similar mean age. However, non-respondents are more
12 The first 2278 interviews were conducted as part of the UWSC continuous national telephone survey. The final 572 interviews were conducted as part of the UWSC omnibus survey in fall 2002.

12
likely to be female, less likely to be non-Hispanic whites, less likely to be labor force
participants, less likely to be married, and less likely to be high school or college graduates.
Figure 1 presents a kernel-smoothed estimate of the probability of non-response
conditional on age. Here and elsewhere in the paper, we report bootstrap 90% confidence
intervals based on 100 bootstrap samples. The estimated confidence intervals tend to be tight,
because we have many observations and condition on only one regressor. Hence, we focus on the
point estimates in our discussion. The figure shows a non-monotone pattern. The estimated non-
response rate falls from a maximum of about 0.47 at age 21 to a minimum of about 0.27 at age
35. It then rises to a second maximum of about 0.40 at age 57 and falls again to about 0.28 at
age 69. We have no ready explanation for this age pattern.
Comparison with HRS Response Rates
The rate of non-response to the SEE Social Security questions, while troubling to some
degree, compares favorably with the rate of non-response to Social Security expectations
questions posed in the Health and Retirement Study (HRS). The HRS questions were asked only
of the most “financially knowledgeable” member of the household, and then only if this person
was not receiving benefits at the time of interview. Each such respondent was first asked if he or
she expects to receive a benefit “at some time in the future.” If the response is “yes,” the
respondent is asked the expected age of inception of benefits (i.e., retirement age) and the
expected amount of benefits “in today’s dollars” conditional on receipt at that age. A graphical
depiction of the comparison of response rates is appended to this paper.
In the year 2000 survey, 4337 HRS respondents born after 1930 (i.e., under 70) were
asked the yes/no expectations question, and 3745 said “yes.” Of these, 3565 reported a valid

13
retirement age, but only 2412 reported the expected level of benefits. Thus, information on the
expected level of benefits was obtained from only 0.56 (2412/4337) of the respondents queried
about their Social Security expectations.13
Although differences in sampling frames and question sequences preclude precise
comparison of the HRS and SEE response rates, we think that the difference stems largely from
the HRS practice of eliciting expected benefit levels only from respondents who answer “yes” to
the eligibility question.14 We have more to say about this below.
4.2. Eligibility Expectations
Among the 2384 SEE respondents who report a valid probability of eligibility for
benefits at age 70, the mean subjective probability of eligibility is 0.57 and the median is 0.60.
Figure 2 presents kernel-smoothed quantiles of eligibility probabilities conditional on age. The
overall pattern is striking, with older respondents tending to report much higher probabilities of
eligibility than do younger ones. For example, the estimated median probability of eligibility is
0.40 at age 30, 0.50 at age 40, 0.70 at age 50, 0.90 at age 60, and 1.00 at age 65. Thus, older
Americans tend to be almost certain that, in one form or another, the Social Security system will
13 Other evidence on HRS response rates has been reported by Gustman and Steinmeier (1999, 2001), who analyze the Social Security expectations data collected in the 1992 interview. They report a response rate of 0.49 among those who (1) say “yes” to the eligibility question, regardless of age, (2) give permission to link Social Security Administration (SSA) data on their earnings histories, and (3) actually have their records linked (Gustman and Steinmeier, 2001). Approximately three-fourths of HRS respondents are said to satisfy the latter two criteria. Hence, about two-thirds of those who responded “yes” to the eligibility question and who had linkable records reported an expected level of benefits. 14 SEE respondents are adults who live in households with telephones, while respondents to the HRS Social Security expectations questions are “financially-knowledgeable” individuals who are not receiving Social Security and live in households satisfying HRS age restrictions.

14
survive at least ten more years. However, younger Americans have no such confidence in the
continuation of the system until their retirement.
The first two columns of Table 2 present least absolute deviations (LAD) estimates of
best linear predictors that describe the cross-sectional variation of eligibility probabilities with
demographic and economic covariates of the respondents. The estimates in the first column of
the table are based on the 2202 SEE respondents who report their eligibility probability and
covariates, while those in the second column are based on the smaller sample of 1516
respondents who answer the entire sequence of expectations questions. Clearly age is the
dominant predictor variable; in the two samples, the predicted chance of eligibility for benefits
increases by 1.28 and 1.54 percentage points for every one-year increase in age. The other
covariates have relatively little predictive power.
Comparison with HRS Eligibility Expectations
It is of interest to juxtapose the SEE and HRS eligibility questions and to compare the
responses. The respective questions are:
SEE: Think ahead to when you are about to turn 70 years old and suppose that you are
not working at that time. What is the PERCENT CHANCE that you will be eligible to
collect any Social Security retirement benefits at that time?
HRS: Do you expect to receive Social Security benefits at some time in the future?
The questions and samples of respondents differ in several respects, but the main
distinction is that the SEE question asks for a subjective probability while the HRS question asks

15
for a yes/no response. Focusing on this distinction and abstracting from the others, responses to
the two questions may be compared if we suppose that respondents asked the HRS question
report best point predictions of benefit eligibility, obtained by minimizing the expected value of
some symmetric loss function. As pointed out in Manski (1990), each respondent will answer
“yes” if his or her subjective probability of eligibility exceeds a threshold that depends on the
loss function and “no” if this probability is below the threshold. If the loss function is
symmetric, the threshold probability is 0.5. So a SEE respondent with subjective probability
above 0.5 would report “yes” if asked the HRS question and one with subjective probability
below 0.5 would report “no.”
Figure 3 presents the actual fraction of HRS respondents of different ages who answer
“yes” to the HRS eligibility question. The figure applies the reasoning of the paragraph above to
estimate the fraction of SEE respondents who would have reported “yes” if they had been asked
the HRS question.15 Comparison of the two plots shows that they are quite close to one another
at all ages. The deviation narrows from about 0.06 at age 53 to basically 0 at age 61 and never
reaches 0.02 at higher ages
This close correspondence suggests that HRS respondents who report “yes” may
reasonably be interpreted as having subjective eligibility probabilities in the range [0.5, 1] and
those who report “no” as having probabilities in the range [0, 0.5]. This interpretation calls into
question the HRS practice of not eliciting expected benefit levels from those who report “no.”
Such persons, particularly those with non-negligible subjective probabilities of eligibility, may
15 The estimates based on SEE data are kernel-smoothed. The HRS sample is large enough to eliminate the need for smoothing, so the actual year-by-year data are plotted. The HRS plot includes persons who currently receive benefits and assumes that such persons would have responded “yes” had they been asked the eligibility question. Among those who do not report “yes” are 741 respondents who report “no” and 80 who report “don’t know.”
16
have well-formed beliefs regarding the benefits they would receive conditional on being eligible.
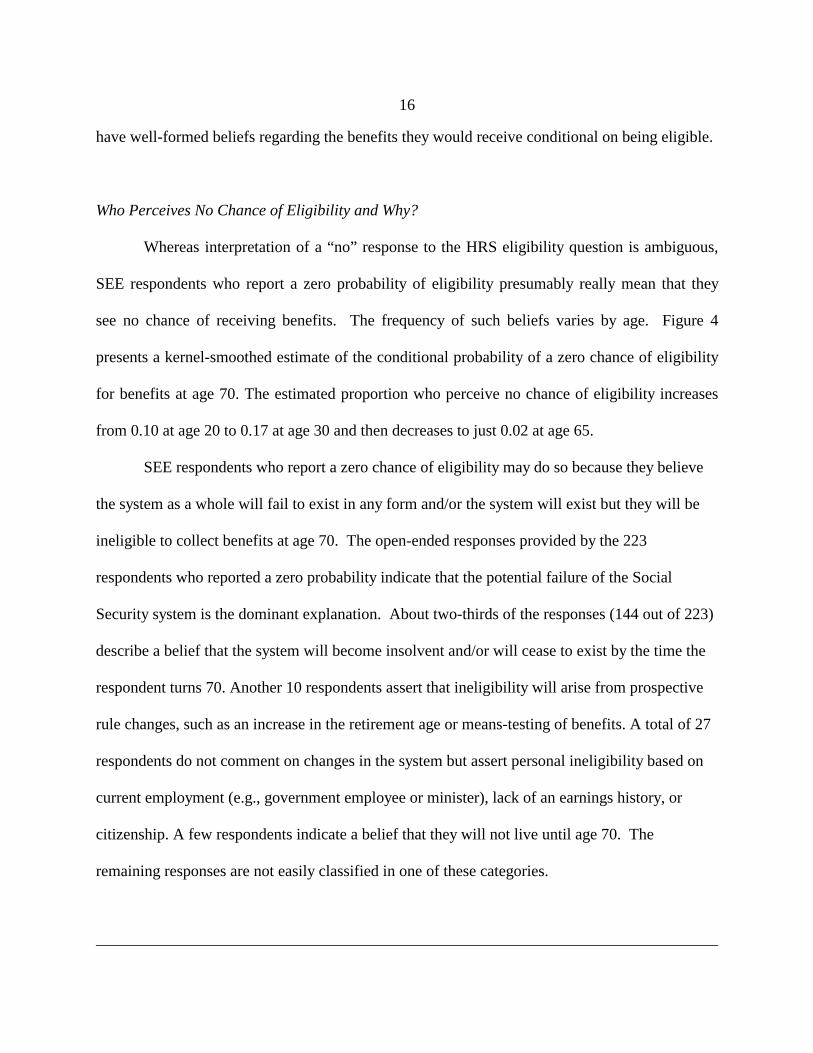
Who Perceives No Chance of Eligibility and Why?
Whereas interpretation of a “no” response to the HRS eligibility question is ambiguous,
SEE respondents who report a zero probability of eligibility presumably really mean that they
see no chance of receiving benefits. The frequency of such beliefs varies by age. Figure 4
presents a kernel-smoothed estimate of the conditional probability of a zero chance of eligibility
for benefits at age 70. The estimated proportion who perceive no chance of eligibility increases
from 0.10 at age 20 to 0.17 at age 30 and then decreases to just 0.02 at age 65.
SEE respondents who report a zero chance of eligibility may do so because they believe
the system as a whole will fail to exist in any form and/or the system will exist but they will be
ineligible to collect benefits at age 70. The open-ended responses provided by the 223
respondents who reported a zero probability indicate that the potential failure of the Social
Security system is the dominant explanation. About two-thirds of the responses (144 out of 223)
describe a belief that the system will become insolvent and/or will cease to exist by the time the
respondent turns 70. Another 10 respondents assert that ineligibility will arise from prospective
rule changes, such as an increase in the retirement age or means-testing of benefits. A total of 27
respondents do not comment on changes in the system but assert personal ineligibility based on
current employment (e.g., government employee or minister), lack of an earnings history, or
citizenship. A few respondents indicate a belief that they will not live until age 70. The
remaining responses are not easily classified in one of these categories.

17
4.3. Expectations of Benefit Levels
Central Tendency
For each of the 1398 SEE respondents with complete expectations data and a positive
subjective probability of eligibility for benefits, we fit a person-specific log-normal distribution
to the elicited probabilities that benefits exceed different thresholds, conditional on eligibility. A
succinct way to characterize these subjective distributions is through their medians, to express
the central tendencies of respondents’ expectations, and their interquartile ranges, to express
respondents’ uncertainty. In what follows, m denotes the median of a person’s fitted log-normal
distribution and q denotes its interquartile range.16
The cross-sectional median value of m across the sample of 1398 respondents is $11,195.
According to SSA records, the average monthly benefit received in March 2001 by all
beneficiaries age 65 or older was $817, which equates to $9804 annually.17 Among retired
workers over age 65, the average benefit in March 2001 was $854, or $10,248 on an annual
basis. These average figures for persons over 65 are not directly comparable to our cross-
sectional median of m for benefits at age 70. However, the similarity of values does indicate that
respondents have a reasonable general sense of the benefits they would receive, conditional on
eligibility.
Figure 5 presents kernel-smoothed 0.25, 0.50, and 0.75-quantile regressions of m on age.
16 It has been traditional in the literature on consumption and savings to measure central tendency and uncertainty by the mean and variance of subjective log-income. We could transform our elicited Social Security benefit expectations into expectations of log-benefits, but we see no good reason to do so. Characterization of the central tendency and uncertainty by the subjective median and interquartile range of benefits seems to us much more natural and informative.

18
Observe that the 0.25-quantile rises from about $2,800 to $5,000 as age increases from 23 to 35
and then remains close to $5,000 as age increases from 35 to 60, before rising to $7,500. The
0.50-quantile dwells in the range $8,500 - $10,000 for persons of age 22-35 and then in the range
$10,000 - $13,500 for persons older than 35. The 0.75-quantile remains in the range $15,000 -
$20,000 for all persons older than 20.
The main impression that we draw from Figure 5 is that the central tendencies of persons’
expectations of benefit levels vary relatively little with age, but for a tightening of the cross-
sectional distribution of m above age 45. In contrast, Figures 2 and 4 showed that expectations
of eligibility rise dramatically with age. Juxtaposing these findings, we conclude that younger
persons tend to be much less confident than older ones that Social Security will continue to exist
when they retire but, conditional on continued existence of the system, they tend to expect that
benefits will remain near current levels.
Figure 5 also makes plain that expectations of benefit levels vary substantially among
persons of any given age. For example, the interquartile range of m is about $14,500 ($20,000 -
$5500) at age 40, about $11,000 ($17,000 - $6,000) at age 60, and $7,500 ($15,000-$7,500)
above age 65. This heterogeneity in expectations presumably reflects a combination of real and
perceptual factors. On the real side, the current system makes benefits vary with a person’s own
earnings and, in the case of survivor benefits, with the earnings of spouses; hence expectations
should vary with personal and spousal past and expected labor earnings. On the perceptual side,
persons may vary in their knowledge of how the Social Security system currently operates and in
their expectations for the future structure of the system.
17 Available at http://www.ssa.gov/statistics/cos/pdf/2000/1b3.pdf.

19
The third column of Table 2 presents LAD estimates of best linear predictors that
describe the cross-sectional variation of m with various demographic and economic covariates of
the respondents. Echoing Figure 5, we find that m varies little with age, increasing by only $45
for every one-year increase in age. The variation with gender and schooling is more pronounced.
Conditioning on other covariates, the predicted value of m is almost $4,000 less for a women
than for a man. According to SSA records, the average monthly benefit received in March 2001
by beneficiaries age 65 or older was $232 higher for men than for women, which equates to a
difference of $2,784 annually.18 Conditioning on other covariates, individuals with schooling
beyond high school are predicted to have subjective medians more than $3,000 dollars higher
than are individuals with no such schooling. This variation in expected benefits may reasonably
arise from variation with schooling in life-cycle earnings streams. The predicted subjective
median is about $4400 higher for those who are widowed than for those who are married and
more than $4500 higher than for others, conditioning on other covariates. Of course, those who
are widowed may obtain survivor benefits based in part on the earnings of the departed spouse.
Uncertainty
Across the sample of 1398 SEE respondents with complete expectations data and a
positive probability of eligibility for benefits, the cross-sectional median of the subjective
interquartile range q is $7,140. Figure 6 presents kernel-smoothed 0.25, 0.50, and 0.75-quantile
regressions of q on age. The figure shows that subjective uncertainty about the magnitude of
Social Security benefits is very substantial among young persons but decreases continuously
with age. The 0.25-quantile of q dwells near $5,000 up to age 40 and then falls to zero by age
18 Available at http://www.ssa.gov/statistics/cos/pdf/2000/1b3.pdf

20
57. Similarly, the 0.50-quantile dwells near $10,000 up to age 40 and falls to zero at age 67.
The 0.75-quantile falls very sharply (roughly from $29,000 to $20,000) from age 20 to 25, and
continues to fall steadily thereafter, reaching a limit of about $3,100 at age 69.
That uncertainty about benefit levels should decrease with age makes much sense,
because uncertainty about future labor earnings and about the future structure of Social Security
should decrease as retirement nears. However, we take the main message of Figure 5 to be that
even middle-aged persons who are nearing retirement tend to be rather uncertain of their future
benefit levels, conditional on eligibility. For example, the median value of q is $6,100 among
respondents of age 55, who are typically only ten years from retirement.19
The final column of Table 2 presents LAD estimates of best linear predictors that
describe the cross-sectional variation of q with various demographic and economic covariates of
the respondents. The strong variation with age echoes Figure 6; the predicted value of q
decreases by $235 dollars for every one-year decrease in age. The other covariates mainly have
little predictive power. It appears that married individuals are more uncertain about their
benefits, with a predicted interquartile range that is $2000 wider than for those who are neither
married nor widowed, conditioning on other covariates. The predicted range is $2400 wider for
those who are widowed.
19 Analyzing the point expectations of future benefits elicited in the HRS, Gustman and Steinmeier (1999, 2001) conclude that respondents tend to misperceive the magnitude of the benefits they will receive. The pervasive uncertainty that SEE respondents reveal when questioned probabilistically makes us think that this conclusion is premature. We simply do not know how respondents who are uncertain of their future benefits choose point values when queried. Continuing the reasoning applied earlier to elicitation of eligibility, it may be that a person asked to provide a point prediction of his or her benefit level chooses a value that minimizes expected loss with respect to some loss function. If so, the reported value necessarily depends on the loss function used; the mean under square loss, the median under absolute loss, and so on.
21
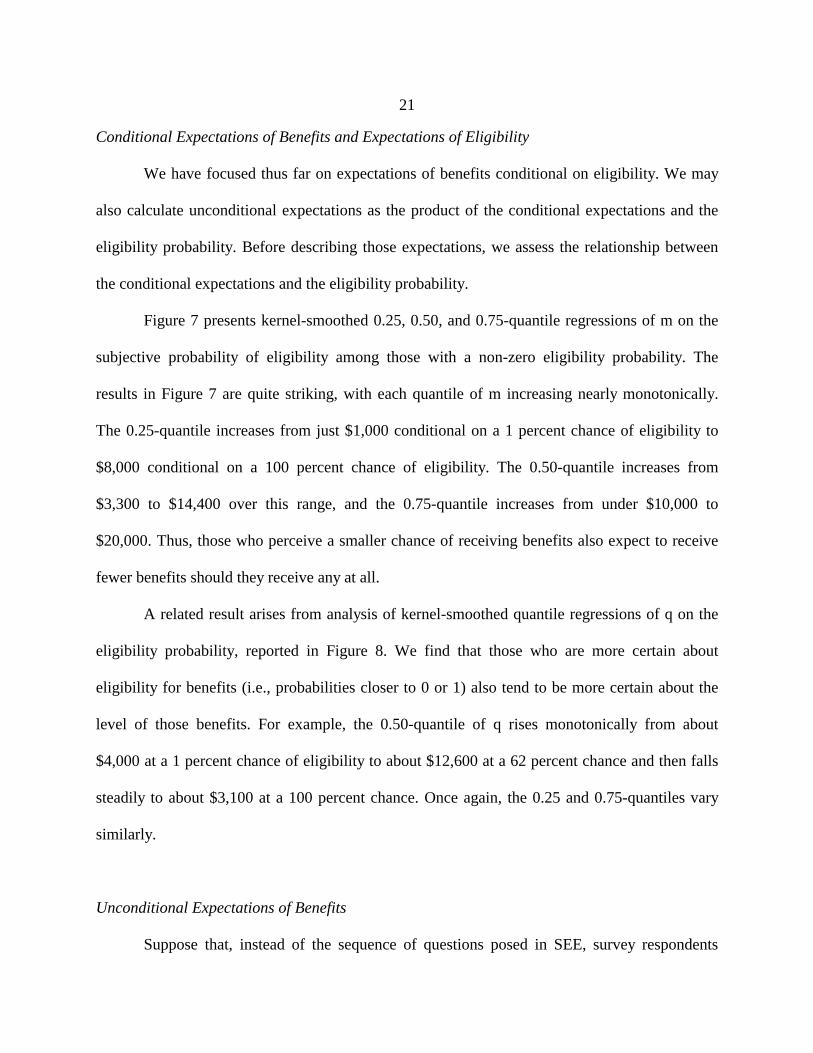
Conditional Expectations of Benefits and Expectations of Eligibility
We have focused thus far on expectations of benefits conditional on eligibility. We may
also calculate unconditional expectations as the product of the conditional expectations and the
eligibility probability. Before describing those expectations, we assess the relationship between
the conditional expectations and the eligibility probability.
Figure 7 presents kernel-smoothed 0.25, 0.50, and 0.75-quantile regressions of m on the
subjective probability of eligibility among those with a non-zero eligibility probability. The
results in Figure 7 are quite striking, with each quantile of m increasing nearly monotonically.
The 0.25-quantile increases from just $1,000 conditional on a 1 percent chance of eligibility to
$8,000 conditional on a 100 percent chance of eligibility. The 0.50-quantile increases from
$3,300 to $14,400 over this range, and the 0.75-quantile increases from under $10,000 to
$20,000. Thus, those who perceive a smaller chance of receiving benefits also expect to receive
fewer benefits should they receive any at all.
A related result arises from analysis of kernel-smoothed quantile regressions of q on the
eligibility probability, reported in Figure 8. We find that those who are more certain about
eligibility for benefits (i.e., probabilities closer to 0 or 1) also tend to be more certain about the
level of those benefits. For example, the 0.50-quantile of q rises monotonically from about
$4,000 at a 1 percent chance of eligibility to about $12,600 at a 62 percent chance and then falls
steadily to about $3,100 at a 100 percent chance. Once again, the 0.25 and 0.75-quantiles vary
similarly.
Unconditional Expectations of Benefits
Suppose that, instead of the sequence of questions posed in SEE, survey respondents

22
were simply asked: “How much do you expect to receive in Social Security benefits at age 70?”
Suppose further that these respondents try to provide a point prediction by minimizing expected
absolute loss. Then, the best response would be the median of the unconditional subjective
distribution of benefits at age 70.
Figure 9 presents kernel-smoothed quantile regressions of the unconditional median of
benefit expectations on age. The results here are very different from those presented in the Figure
5 for the conditional median. In particular, the 0.25 and 0.50-quantiles equal $0 until ages 57 and
45 respectively, at which point they increase sharply. The 0.75-quantile increases tenfold from
$1,500 at age 25 to $15,000 at age 69. In contrast, the estimated quantiles of the conditional
median in Figure 5 vary little with age.
This comparison highlights the extra information that is extracted by eliciting conditional
expectations and the probability of the conditioning event, as opposed to direct elicitation of the
unconditional expectations. By following the latter approach, one would have no idea that the
increase of unconditional benefit expectations with age is driven mainly by systematic variation
in perceptions of the probability of survival of the Social Security system as opposed to
expectations of its generosity should it continue to exist.
5. Face-To-Face Interview Findings
In this section, we analyze survey responses obtained from 49 staff members at a
midwestern university. The face-to-face interviews provide two important kinds of information
not obtained from the SEE respondents. First, they provide respondents’ expectations regarding

23
the magnitude of current Social Security benefits. Second, they provide responses to open-ended
questions through which we seek to learn about respondents’ information sources and thought
processes.
5.1. Sample Size and Response Rates
Originally, 123 individuals were randomly selected from the university’s staff directory
and were solicited by e-mail to participate in a study of perceptions of the Social Security
retirement system and its future. The message stated that the face-to-face interview would take
no longer than 20-30 minutes and that $15 compensation would be paid. Forty percent of the
persons solicited (49/123) agreed to be interviewed. The persons interviewed responded to
essentially all of the questions posed.20
Although the face-to-face survey suffered none of the item response problems
encountered in the SEE telephone interviews, it did run up against another problem that SEE
largely avoids. As noted in Section 3.2, respondents to the face-to-face survey were asked to
report probabilities that Social Security benefits exceed a series of predetermined thresholds
ranging from $5,000 to $25,000, rather than the SEE series of person-specific thresholds
generated by responses to the earlier questions on smallest and largest possible benefits. We
found that some of the 49 respondents place high probability on benefits exceeding our top
threshold of $25,000. We were able to estimate the subjective distributions of these respondents
20 Two respondents declined to report the smallest and largest possible Social Security benefits that they might receive at age 70. However, these and all other respondents did answer the subsequent sequence of questions asking for the probability that their benefits would exceed various predetermined thresholds.

24
poorly, if at all.
5.2. Expectations of Maximum Current Social Security Benefits
Central Tendency
We measure expectations of current benefits by eliciting respondents’ subjective
distributions of the amount now paid to a 70-year-old retired worker who is “eligible for the
maximum Social Security benefit” after retiring at age 65. We were able to estimate subjective
distributions for 43 of the 49 respondents. We were not able to estimate distributions for the
remaining 6 respondents, each of whom reported a 100 percent chance that the current maximum
exceeds $25,000.
Among the 43 respondents with fitted subjective distributions of maximum benefits, the
cross-sectional median value of the subjective median is about $18,500. The cross-sectional
median of respondents’ point “best estimate” of the maximum benefit is $16,000 for these 43
respondents, and $18,000 for all 49 respondents. Based on information available from the SSA,
we calculate the actual value of the maximum benefit to be $16,860.21 Thus, the central
tendencies of respondents’ expectations tend to be reasonably in line with the facts.
In Section 4.3, we noted the absence of empirical evidence on how persons choose point
estimates for quantities about which they are uncertain (see footnote 19). We can shed a bit of
light on this matter by comparing the subjective medians and best estimates reported by the 43
21 A person who retired in 1996 at age 65 and was eligible for the maximum benefit received $1248 per month at that time (see www.ssa.gov/OACT/COLA/exampleMax.html). Application of the yearly cost-of-living-adjustment (COLA) from 1996 onward shows that in 2001 this person, now 70 years old, received $1405 per month, or $16,860 per year.

25
respondents for whom we have complete data. Figure 10 displays the 43 pairs of (subjective
median, best estimate) values. The reader should focus on the cases in which the subjective
median is greater than our lowest threshold of $5000 and less than our top threshold of $25,000.
In this region, a forty-five degree line through the origin provides a reasonably good overall fit to
the data, with residuals that rarely exceed $5000.
Uncertainty
Figure 11 displays the subjective interquartile ranges of respondents’ subjective
distributions, along with their subjective medians. The striking conclusion is that respondents
tend to be very uncertain about the current maximum benefit, with most values being above
$5000, and many being above $10,000. There is no evident association between respondents’
subjective medians and subjective interquartile ranges.
Expectations of Own Future Benefits and Maximum Current Benefits
Figures 12 and 13 compare respondents’ expectations of maximum current benefits with
their expectations of their own future benefits. Figure 12 plots respondents’ subjective medians
for these two quantities, while Figure 13 plots their subjective interquartile ranges.
Figure 12 shows a clear positive relationship between the two subjective medians. In
most cases, the data lie somewhat below the 45-degree line, indicating that respondents expect
their own benefit to be smaller than current benefits. This makes sense for two reasons. First,
should the future formula remain the same as today’s, some respondents may believe that their
life-cycle earnings will not qualify them for the maximum benefits. Second, to the extent that
respondents believe the future formula will differ from today’s, the tenor of the recent public

26
discussion of Social Security makes it reasonable to expect that benefits will fall rather than rise.
Figure 12 offers a glimpse of the relationship between “formula uncertainty” (i.e.,
uncertainty about the current amount paid to a retired worker with a specific earnings history)
and the total uncertainty an individual perceives about benefits to be paid at age 70, conditional
on eligibility. The latter uncertainty includes not only formula uncertainty, but also earnings
uncertainty and uncertainty about the future structure of the system. The figure indicates a weak
positive relationship between formula uncertainty and total uncertainty. However, we do not
find that total uncertainty generally exceeds formula uncertainty. As often as not, the
interquartile range of maximum current benefits exceeds that of own future benefits.
5.3. Open-Ended Responses
In response to open-ended questions, subjects described for us their understanding of the
Social Security system, as well as the information on which their understanding is based. The
dominant source of information reported by respondents is the annual statement that workers
now receive from the SSA. Fully 43 of the 49 respondents indicated that they based their
expectations on SSA mailings, with the majority clearly describing the annual report. Other than
these documents, no strong pattern emerged. Several respondents indicated that they infer the
level of benefits from observation of or conversations with relatives or acquaintances currently
collecting benefits.
Our introduction to the module on future benefit expectations informed respondents that
current benefits are “determined by retirement age and by earnings prior to retirement.” When
later asked to describe the factors that currently determine benefits, more than half of the

27
respondents indicated a link between earnings histories and benefits. However, the responses
rarely suggested a full understanding of the formula. Some respondents expressed a belief that
benefits are based on earnings at retirement or over the preceding few years, as is common in
employer-provided defined-benefit pension plans. Six respondents expressed a belief that
benefits are mean-tested, and one speculated that benefits would be means-tested in the future.
6. Conclusion
The empirical findings reported in Sections 4 and 5 add substantially to the rather limited
empirical evidence that was previously available on Social Security expectations. The SEE
findings on the variation of expectations with age are particularly interesting. We found that
younger persons tend to be much less confident than older ones that Social Security will continue
to exist when they retire. We estimate the median subjective probability of eligibility for
benefits to be 0.40 at age 30, 0.50 at age 40, 0.70 at age 50, 0.90 at age 60, and 1.00 at age 65.
Moreover, a sizeable fraction of Americans perceive no chance of eligibility, especially those
under age 45 who foresee insolvency of Social Security in the next 25-50 years. We also found
that, conditioning on continued existence of the system, younger persons and older ones both
tend to expect that benefits will remain near current levels. Hence the prevalent concern among
younger persons appears to be that the Social Security system will collapse entirely, not that
benefits will be reduced to keep the system going.
Also notable is the extent of uncertainty about benefit levels. The SEE data show that
even middle-aged persons who are nearing retirement tend to have large subjective interquartile

28
ranges for their future benefit levels, conditional on eligibility. These persons face relatively
little uncertainty about their future labor earnings or about the future structure of the Social
Security system, so the main source of their uncertainty about benefits must be uncertainty about
the formula determining current benefits. Our face-to-face interviews provide direct empirical
evidence that formula uncertainty is substantial.
The expectations data analyzed here provide some of the empirical evidence necessary to
forecast how proposed changes in Social Security policy would affect retirement savings and
labor supply decisions. We would like to use these data to provide some sense of the impacts that
may occur, but realistic forecasting of policy impacts requires other empirical evidence (as well
as a less idealized decision model than the one presented in Section 2). For one thing, we need
to know the expectations that persons hold for the returns to private savings. For another, we
need to understand how changes in policy would affect the expectations that persons hold. And,
of course, forecasting labor supply and savings decisions requires empirical evidence on
preferences.

29
References
Bernheim, B. D. (1988). “Social Security Benefits: An Empirical Study of Expectations and Realizations,” in R.R. Campbell and E. Lazear, eds., Issues in Contemporary Retirement, Stanford, CA: Hoover Institution. Campbell, J. and M. Feldstein, eds. (2001), Risk Aspects of Investment-Based Social Security Reform, Chicago: University of Chicago Press. Campbell, J., J. Cocco, F. Gomes, and P. Maenhout (2001). “Investing Retirement Wealth: A Life-Cycle Model,” in J. Campbell and M. Feldstein, eds., Risk Aspects of Investment-Based Social Security Reform, Chicago: University of Chicago Press. Dominitz, J. (1998), "Earnings Expectations, Revisions, and Realizations," Review of Economics and Statistics, 80, 374-388. Dominitz, J. (2001). “Estimation of Income Expectations Models Using Expectations and Realizations Data,” Journal of Econometrics, 102, 165-195. Dominitz, J. and C. Manski (1996). “Eliciting Student Expectations of the Returns to Schooling,” Journal of Human Resources, 31, 1-26. Dominitz, J. and C. Manski (1997a). “Using Expectations Data to Study Subjective Income Expectations,” Journal of the American Statistical Association, 92, 855-867. Dominitz, J. and C. Manski (1997b). “Perceptions of Economic Insecurity: Evidence from the Survey of Economic Expectations,” Public Opinion Quarterly, 61, 261-287. Feldstein, M., and J. Liebman (2001). “Social Security,” NBER Working Paper 8451. Feldstein, M., E. Ranguelova, and A. Samwick (2001). “The Transition to Investment-Based Social Security When Portfolio Returns and Capital Profitability are Uncertain,” in J. Campbell and M. Feldstein, eds., Risk Aspects of Investment-Based Social Security Reform, Chicago: University of Chicago Press. Gustman, A. and T. Steinmeier (1999). “What People Don’t Know About Their Pensions and Social Security: An Analysis Using Linked Data from the Health and Retirement Study,” NBER Working Paper 7368. Gustman, A. and T. Steinmeier (2001). “Imperfect Knowledge, Retirement, and Savings,” NBER Working Paper 8406. Manski, C. (1990). “The Use of Intentions Data to Predict Behavior: A Best-Case Analysis,” Journal of the American Statistical Association, 85, 934-940.

30
Manski, C. and J. Straub (2000), “Worker Perceptions of Job Insecurity in the Mid-1990s: Evidence from the Survey of Economic Expectations,” Journal of Human Resources 35, 447-479. McHale, J. (2001). “The Risk of Social Security Benefit-Rule Changes: Some International Evidence,” in J. Campbell and M. Feldstein, eds., Risk Aspects of Investment-Based Social Security Reform, Chicago: University of Chicago Press. Merton, R. (1983). “On the Role of Social Security as a Means for Efficient Risk Sharing in an Economy Where Human Capital is Not Tradable,” in Z. Bodie and J. Shove, eds., Financial Aspects of the United States Pension System, Chicago: University of Chicago Press.

Variable sample mean sample mean sample mean
Age (years) 42.18 42.39 41.79Female 0.52 0.49 0.59
In Labor Force 0.80 0.81 0.78High School Graduate 0.92 0.94 0.89
Bachelor’s Degree or More 0.39 0.41 0.37White, Non-Hispanic 0.81 0.83 0.77
African-American, Non-Hispanic 0.07 0.07 0.08Married and Residing with Spouse 0.54 0.56 0.49
Widowed 0.03 0.03 0.03
All Age Eligible (2457 observations)
Respondents (1621 observations)
Non-Respondents (836 observations)
Table 1. Descriptive Statistics: Survey of Economic Expectations 1999-2002
Other than Age, all variables are dichotomous indicators (=1 if yes).

Age (years) 1.28 1.54 45.04 -235.78(0.08) (0.11) (24.21) (62.89)
Female -8.56 -7.69 -3923.10 521.65(1.75) (2.49) (570.82) (1243.04)
Labor Force Participant -4.24 -2.31 -626.53 779.39(2.37) (3.24) (805.31) (1866.45)
-0.44 1.54 3132.23 122.39(2.41) (3.76) (756.38) (1404.48)
3.16 6.15 3185.62 1016.26(2.28) (3.88) (733.14) (1165.84)
White, Non-Hispanic 1.68 7.69 1530.53 594.79(3.80) (6.28) (1198.52) (1161.58)
0.36 4.62 608.53 3226.54(5.79) (7.50) (1733.65) (2311.18)
-5.00 -3.08 135.11 2073.53(1.94) (2.55) (640.38) (1013.31)
Widowed 4.76 6.15 4549.64 2398.50(2.97) (3.92) (2182.76) (1784.90)
Intercept 15.52 -10.77 6693.26 14730.96(6.53) (9.65) (1884.18) (4882.65)
2202 1516 1323 1323Number of Observations
Median m of Benefits ($), Conditional on
Eligibility
IQR q of Benefits ($), Conditional on
EligibilityPredictor Variable
Married and Residing with Spouse
Percent Chance of Eligibility at Age 70 (all respondents)
Table 2. Best Linear Predictors of Social Security Expectations: LAD Estimates
Some School After High School
Bachelor’s Degree or More
African American, Non-Hispanic
Percent Chance of Eligibility at Age 70 (respondents with
complete data)
Bootstrap standard errors are reported in parentheses. Other than Age, all predictors are dichotomous.

Conditional probabilities estimated using gaussian kernel with bandwidth of two years (2457 observations). Solid curve depicts point estimates. Dashed curves depict bootstrap 90% confidence intervals.
Figure 1. Nonresponse Probability for Social Security Expectations Questions,Conditional on Age
0.0
0.1
0.2
0.3
0.4
0.5
0.6
0.7
0.8
0.9
1.0
20 25 30 35 40 45 50 55 60 65 70
Current Age
Pro
bab
ility
90% confidence interval
point estimate ofconditional probability

Conditional quantiles estimated using gaussian kernel with bandwidth of two years (2384 observations). Solid curves depict point estimates. Dashed curvesdepict bootstrap 90% confidence intervals.
Figure 2. Quantiles of Probability of Receiving Social Security Benefits at Age 70,Conditional on Current Age
0.0
0.1
0.2
0.3
0.4
0.5
0.6
0.7
0.8
0.9
1.0
20 25 30 35 40 45 50 55 60 65 70
Current Age
Pro
bab
ility
0.75-quantile
0.50-quantile
0.25-quantile

* HRS: "Financially-knowledgeable" respondents who report "yes," "no," or "don’t know." If currently receives benefits, "yes" is imputed.SEE: Conditional probabilities estimated using gaussian kernel with bandwidth of 2 years.
Figure 3. Probability of "Yes" Response to Dichotomous Social Security Eligibility Question: Health and Retirement Study (HRS) and Survey of Economic Expectations (SEE)
0.50
0.55
0.60
0.65
0.70
0.75
0.80
0.85
0.90
0.95
1.00
53 54 55 56 57 58 59 60 61 62 63 64 65 66 67 68 69 70
Current Age
Pro
bab
ility SEE, simulated response with threshold probability of 0.5
HRS, actual responses*

Conditional probabiliities estimated using gaussian kernel with bandwidth of two years (2384 observations). Solid curve depicts point estimates. Dashed curves depict bootstrap 90% confidence intervals.
Figure 4. Probability of No Chance of Eligibility for Social Security,Conditional on Age
0.00
0.05
0.10
0.15
0.20
0.25
0.30
0.35
0.40
0.45
0.50
20 25 30 35 40 45 50 55 60 65 70
Current Age
Pro
bab
ility
point estimate ofconditional probability
90% confidence interval

Conditional quantiles estimated using gaussian kernel with bandwidth of two years (1398 observations). Solid curves depict point estimates. Dashed curvesdepict bootstrap 90% confidence intervals.
Figure 5. Quantiles of Subjective Median of Benefits at Age 70, Conditional on Current Age
$0
$5,000
$10,000
$15,000
$20,000
$25,000
$30,000
20 25 30 35 40 45 50 55 60 65 70
Current Age
0.75-quantile
0.50-quantile
0.25-quantile

Conditional quantiles estimated using gaussian kernel with bandwidth of two years (1398 observations). Solid curves depict point estimates. Dashed curvesdepict bootstrap 90% confidence intervals.
Figure 6. Quantiles of Subjective IQR of Benefits at Age 70,Conditional on Current Age
$0
$5,000
$10,000
$15,000
$20,000
$25,000
$30,00020 25 30 35 40 45 50 55 60 65 70
Current Age
0.75-quantile
0.50-quantile
0.25-quantile

Conditional quantiles estimated using gaussian kernel with bandwidth of five percentage points (1398 observations). Solid curves depict point estimates. Dashed curves depict bootstrap 90% confidence intervals.
Figure 7. Quantiles of Subjective Median of Benefits at Age 70, Conditional on Probability of Eligibility
$0
$5,000
$10,000
$15,000
$20,000
$25,000
$30,000
0.0 0.1 0.2 0.3 0.4 0.5 0.6 0.7 0.8 0.9 1.0
pr(eligible for Social Security at 70)
0.75-quantile
0.50-quantile
0.25-quantile

Conditional quantiles estimated using gaussian kernel with bandwidth of five percentage points (1398 observations). Solid curves depict point estimates. Dashed curves depict bootstrap 90% confidence intervals.
Figure 8. Quantiles of Subjective IQR of Benefits at Age 70, Conditional on Probability of Eligibility
$0
$5,000
$10,000
$15,000
$20,000
$25,000
$30,000
0.0 0.1 0.2 0.3 0.4 0.5 0.6 0.7 0.8 0.9 1.0
pr(eligible for Social Security at 70)
0.75-quantile
0.50-quantile
0.25-quantile

Conditional quantiles estimated using gaussian kernel with bandwidth of two years (1398 observations). Solid curves depict point estimates. Dashed curvesdepict bootstrap 90% confidence intervals.
Figure 9 Quantiles of Unconditional Subjective Median of Benefits at Age 70, Conditional on Current Age
$0
$5,000
$10,000
$15,000
$20,000
$25,000
$30,000
20 25 30 35 40 45 50 55 60 65 70
Current Age
0.75-quantile
0.50-quantile
0.25-quantile

Source: 43 respondents to face-to-face interviews.
Figure 10. Expectations of Current Benefits: Subjective Median and "Best Estimate"
$0
$5,000
$10,000
$15,000
$20,000
$25,000
$30,000
$35,000
$40,000
$0 $5,000 $10,000 $15,000 $20,000 $25,000 $30,000
med(current maximum benefit)
"bes
t es
tim
ate"
of
curr
ent
max
imu
m b
enef
it
>$30,000
>$40,000

Source: 43 respondents to face-to-face-interviews.
Figure 11. Expectations of Current Benefits: Subjective Median and Subjective IQR
$0
$5,000
$10,000
$15,000
$20,000
$25,000
$30,000
$35,000
$40,000
$0 $5,000 $10,000 $15,000 $20,000 $25,000 $30,000
med(current maximum benefit)
IQR
(cu
rren
t m
axim
um
ben
efit
)
>$30,000
>$40,000

Source: 43 respondents to face-to-face interviews.
Figure 12. Expectations of Current and Prospective Benefits: Subjective Medians
$0
$5,000
$10,000
$15,000
$20,000
$25,000
$30,000
$35,000
$40,000
$0 $5,000 $10,000 $15,000 $20,000 $25,000 $30,000
med(current maximum benefit)
med
(fu
ture
ben
efit
s|re
ceip
t at
ag
e 70
)
>$30,000
>$40,000

Source: 43 respondents to face-to-face interviews.
Figure 13. Expectations of Current and Prospective Benefits: Subjective IQRs
$0
$5,000
$10,000
$15,000
$20,000
$25,000
$30,000
$35,000
$40,000
$0 $5,000 $10,000 $15,000 $20,000 $25,000 $30,000
IQR(current maximum benefit)
IQR
(fu
ture
ben
efit
s|re
ceip
t at
ag
e 70
)
>$30,000
>$40,000

2457 respondents under age 70
2384 report valid % chance 73 do not give valid response
223 2161 report >0% chance
1497 664 do not complete
1450 47 do not complete sequence
1398 52
Overall Response Rate 1621 out of 2457 = 0.66
4337 respondents under age 70 not collecting benefits
3745 report "yes" 592 do not report "yes"
3565 report valid age 180 do not report valid age
2412 1153 do not report valid amount
Overall Response Rate 2412 out of 4337 = 0.56
responses used to fit subjective distribution
responses cannot be used to fit distribution
Response Rate to HRS (2000) Questions
Response Rate to SEE Questions
Percent Chance Eligible for Benefits
Lowest/Highest Amount of Benefits
Percent Chance Benefits Exceed $Y
complete
complete sequence
report 0% chance
report valid amountExpected Amount of
Benefit Payments
Expect to Receive Benefits
Expected Age When Start Collecting Benefits