NAYARA ENERGY LIMITED€¦ · Essar Oil Trading Mauritius Ltd Nayara Energy Ltd Vadinar Oil...
32
NAYARA ENERGY LIMITED Corporate Presentation September 2018 1
Transcript of NAYARA ENERGY LIMITED€¦ · Essar Oil Trading Mauritius Ltd Nayara Energy Ltd Vadinar Oil...

NAYARA ENERGY LIMITED
Corporate Presentation
September 2018
1

2
Legal Disclaimer
NOT FOR PUBLICATION OR DISTRIBUTION, DIRECTLY OR INDIRECTLY, IN OR INTO THE UNITED STATES
This presentation and the information contained herein are not an offer of the securities for sale in the United States and are not for publication or distribution to persons in the United States. The presentation is being made to you on the
basis that you have confirmed you are not located or resident in the United States. No securities have been, nor will they be, registered under the US Securities Act of 1933 (the “US Securities Act”) or the securities laws of any state or
other jurisdiction of the United States. No securities may be offered or sold in the United States unless those securities have been registered under the US Securities Act or are offered or sold pursuant to an exemption from, or in a
transaction not subject to, the registration requirements of the US Securities Act and applicable state securities laws. There will be no public offer of securities in the United States.
THIS PRESENTATION DOES NOT CONSTITUTE OR FORM PART OF AN OFFER OR SOLICITATION OF AN OFFER TO PURCHASE OR SUBSCRIBE FOR ANY SECURITIES AND SHALL NOT FORM THE BASIS OF OR BE
RELIED ON IN CONNECTION WITH ANY CONTRACT OR BINDING COMMITMENT WHATSOEVER.
This presentation is confidential and has been prepared by Nayara Energy Limited (the “Company”) solely for information purposes.
This presentation is the sole responsibility of the Company and has been prepared by the Company based on information and data which the Company considers reliable. The Company does not make any representation or warranty,
express or implied, whatsoever, and no reliance shall be placed on, the truth, accuracy, completeness, fairness and reasonableness of the contents of this presentation, which have not been independently verified. This presentation may
not be all-inclusive and may not contain all of the information that you may consider material. The Company expressly excludes any liability in respect of the contents of, or any omission from, this presentation. Opinions and estimates
constitute the sole judgment of the Company as of the date of this presentation and are subject to change without notice.
This presentation contains statements about future events and expectations that constitute “forward-looking statements.” These forward-looking statements include words or phrases such as the Company or its management “believes”,
“expects”, “anticipates”, “intends”, “plans”, “foresees”, “targets”, “aims”, “may”, “would”, “could” or other words or phrases of similar import. Similarly, statements that describe the Company's objectives, plans or goals are also forward-
looking statements. All such forward-looking statements are subject to known and unknown risks and uncertainties that could cause actual results to differ materially from those contemplated by the relevant forward-looking statement.
Such forward looking statements are made based on management’s current expectations or beliefs as well as assumptions made by, and information currently available to, management. These forward-looking statements speak only as
at the date of this presentation and nothing contained in this presentation is or should be relied upon as a promise or representation as to the future. There is no obligation to update or revise any forward-looking statements, whether as a
result of new information, future events or otherwise. You should not place undue reliance on forward-looking statements, which speak only as of the date of this presentation.
The historical financial information in this presentation was prepared and presented in accordance with International Financial Reporting Standards (“IFRS”) and have not been audited or reviewed by an independent auditor.
Consequently, such financial statements should not be relied upon to provide the same type or quality of information associated with information that has been subject to an audit or review by an independent auditor. None of the
Company nor any of its affiliates, directors or advisors make any representation or warranty, expressed or implied, regarding the accuracy of such consolidated financial statements or their sufficiency for an assessment of the Company.
Caution must be exercised when using such data to evaluate the Company’s financial condition and results of operations.
The historical financial information in this presentation also includes financial information that is not presented in accordance with IFRS. These non-IFRS financial measures are not measures of financial performance in accordance with
IFRS and may exclude items that are significant in understanding and assessing the Company’s financial results. Accordingly, these non-IFRS financial measures may be considered in addition to IFRS financial information, but should not
be considered in isolation or used as substitutes for the corresponding IFRS measures. Non-IFRS measures in this presentation may be calculated in a way that is not comparable to similarly titled measures reported by other companies.
This presentation is being furnished to you solely for your information and may not be reproduced or redistributed to any other person. In particular, this presentation may not be taken or transmitted into the United States, Canada or
Japan or any other jurisdiction where to do so would be illegal or distributed, directly or indirectly, in the United States, Canada or Japan or any other such jurisdiction.
The information contained in this presentation is not to be taken as any recommendation made by the Company or any other person to enter into any agreement with regard to any investment.
By accepting to access any copy of the information presented, you agree to be bound by the foregoing limitations.

Strong parentage and governance framework
Integrated business value chain
Consistent track record of operational excellence
High complexity refinery
Crude sourcing and procurement advantage
Predictable product offtake through downstream presence and strong distribution
Attractive industry dynamics
Experienced management team with proven track record
3
Introduction
Key Highlights
Financial Overview
A
B
D
Near Term Strategic PlansC
Table of Contents

Introduction
4

Evolution and Key Milestones
5
2003 2004 2006 2008 2012 2013 2016 2017 2018
2004
Enters into Corporate
Debt Restructuring
(“CDR”); construction of
refinery recommences
along with captive
power plant and port
2012
EOL completes expansion and
optimisation projects; capacity
increased to 20 MMTPA
Commissioned 510 MWe coal
fired captive power plant
2016
EOL delisted
2006
Vadinar refinery
commences
operations on a
trial basis
2008
Vadinar refinery
commences
commercial
operations with
nameplate
capacity of 10.5
MMTPA
2013
EOL exits CDR loan
facility in March 2013;
improvement in local
credit rating1 by two
notches from BBB- to
BBB+
2018
Name changed to
Nayara Energy Limited
(“Nayara”)
Local credit rating1
upgraded by three
notches to “AA”
2017
Acquisition of VOTL and VPCL
and divestment of E&P assets
Acquisition of 98.26% stake by
Rosneft and Kesani, a
consortium led by Trafigura and
UCP, at an enterprise value of
US$ 12.9bn in August 2017
2003
Essar Oil Limited
(“EOL”) commences
building its network of
franchised retail
petrol stations
Pre-Nayara regime Nayara regime
1 Refers to CARE long term rating
2018
Refinancing of INR
Debt for optimization of
capital structure
Raised INR 2,400cr (c.
US$ 355mn) through its
placement of non-
convertible debentures
2015
2015
Major turnaround
completed;
commissioning of
VGO MHC

Ownership Structure
6
PJSC Rosneft Oil Company
Rosneft Singapore Pte Ltd Minority ShareholdersKesani Enterprises Company
Ltd (Cyprus)
Trafigura Holdings Pte Ltd
UCP PE Investment Ltd
Oil Holdings Ltd1
Vadinar Power Company Ltd2
Nayara Energy Properties Ltd2
Essar Oil Trading Mauritius Ltd
Nayara Energy Ltd
Vadinar Oil Terminal Ltd3
Coviva Energy Terminals Ltd
Enneagon Ltd
1 Previously known as Essar Power Holdings Ltd2 Vadinar Power Company Limited and Nayara Energy Properties Limited are being merged with Nayara Energy Limited; merger application filed 3 Merger of Vadinar Oil Terminal Limited with Nayara Energy Limited being evaluated
49.13%1.74%49.13%
98.00%
75.00%
100.00%
100.00%
100.00%
100.00%
100.00%
25.00%
49.00%
49.00%
2.00%

Company Overview
7
Integrated refinery with dedicated infrastructure and proven track record – well positioned to cater to domestic and international demand
Highly complex
refinery
Captive power
plant
Captive port
with single
point mooring
Strong retail
business chain
• Co-generation power plants with a capacity of
1,010 MWe owned and operated through Vadinar
Power Company Ltd (wholly owned subsidiary)
• Meets captive requirements of steam and power
for the refinery
• 4,473 operational retail stations and 2,688 retail
stations under implementation across India
• Domestic sales account for 57% while exports
account for 43% of FY18 sales
• India's second largest single location refinery –constitutes c. 8% of Indian refinery capacity1
• High complexity index of 11.8, capable of processingultra-heavy, heavy and light crudes across globalmarket
• Strategically located on Indian west coast, proximityto Middle East and high consumption domestic aswell as export markets
• Fully captive port with Single Point Mooring
(Vadinar Oil Terminal Ltd)
• End-to-end infrastructure including storage
facilities, water intake facilities, product jetty and
dispatch facilities by rail, road, port and pipelines
1Source: Ministry of Petroleum and Natural Gas, Government of India - annual report 2017-18

Key Highlights
8

Key Highlights
9
Crude sourcing and procurement advantage
5
High complexity refinery4
Consistent track record of operational excellence3
Predictable product offtake through downstream presence and strong distribution6
Attractive industry dynamics7
Strong parentage and governance framework
1
Experienced management team with proven track record8
Integrated business value chain
2

10
Shareholders
Effective ownership
in Nayara Energy Summary description
49.13%
• World’s largest publicly traded petroleum company - c. 6% of world oil production and a market capitalization of US$69.6bn1
• Ownership structure2: Russian Government - ~50%, BP - 19.75%, QH Oil Investments – 18.93%, Public / others – ~11.32%
• Credit rating: S&P - BB+ (Positive outlook), Moody’s - Baa3 (Stable outlook)
• FY2017 key figures (as at 31 December 2017) 3: Revenue - US$104.3bn, Total Assets - US$212.0bn
24.07%
• One of the leading commodity traders in the world and the largest independent LNG trader4
• Two main lines of business: physical trading and industrial assets portfolio
• FY2017 key figures (as at 30 September 2017): Revenue - US$136.4bn, Total Assets - US$48.6bn4
24.07%
• Independent, private investment group established in 2006
• Focused on investing in high-growth private companies or mature enterprises with proven business model and stable cash-flow
• Total assets under management exceed US$3bn
1. Source: Rosneft website; market cap as of September 19, 2018
2. As of September 18, 2018
3. FX – 1 US$ = 57.68 RUB, as of 31 Dec 2017
4. Source: Trafigura website
1 High Quality and Experienced Shareholders
FY 2017 key figures (as at 31 December 2017)Strong
Parentage
Integrated Business &
Strategic Location
Consistent
Track Record
High
Profitability
Experienced
Management
Input
Flexibility
Robust Product
Distribution
Attractive
Industry Dynamics
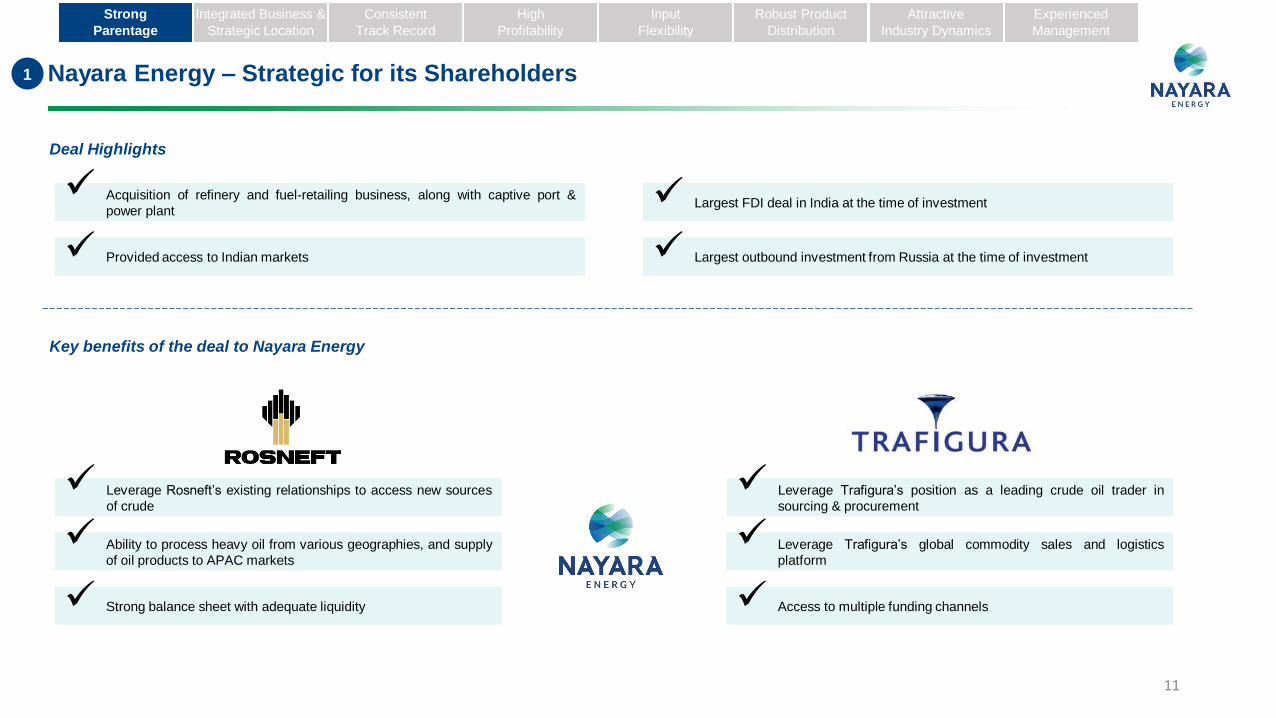
1 Nayara Energy – Strategic for its Shareholders
Leverage Rosneft’s existing relationships to access new sources
of crude
Acquisition of refinery and fuel-retailing business, along with captive port &
power plant
Ability to process heavy oil from various geographies, and supply
of oil products to APAC markets
Provided access to Indian markets
Largest FDI deal in India at the time of investment
Strong balance sheet with adequate liquidity
Leverage Trafigura’s position as a leading crude oil trader in
sourcing & procurement
Leverage Trafigura’s global commodity sales and logistics
platform
Access to multiple funding channels
Key benefits of the deal to Nayara Energy
Deal Highlights
Largest outbound investment from Russia at the time of investment
11
Strong
Parentage
Integrated Business &
Strategic Location
Consistent
Track Record
High
Profitability
Experienced
Management
Input
Flexibility
Robust Product
Distribution
Attractive
Industry Dynamics

12
BoD to have at least 2 independent directors1 No control of any single shareholder4 4 2 2
12
Krzysztof
Zielicki Antoni
Non Executive Director
• Over 37 years of experience in oil and gas
industries; worked with BP
• BSc and MSc, Mathematics
A Balgarnie
Non Executive Director
• Advisor to the CEO of Rosneft Oil Company
• Over 30 years of experience in finance and
natural resources industry
• BA Hons. and Morehead–Cain scholar -
University of North Carolina, Chapel Hill, USA
Didier Casimiro
Non Executive Director
• Held top management position at BP since
1996 and thereafter at TNK-BP since 2005
• Over 25 years of experience
• Rosneft board member since June 2012
• Graduated - Ghent University, Belgium
Alexander Romanov
Non Executive Director
• Vice President for Refining & Petrochemicals in
Rosneft Oil Company
• Over 21 years of experience in oil and gas
companies in refining and petrochemical
• Degree in Chemical Engineering, Economics
Chin Hwee Tan
Non Executive Director
• Director and Head of Asia Pacific in Trafigura
• Over 23 years of experience
• CFA, CA (Australia and Singapore) with
Masters’ degree - Yale University, Post
Graduate - Harvard University
Jonathan Kollek
Non Executive Director
• President of Trafigura Eurasia LLC
• Over 35 years of experience in oil industry
• B.Sc., Economics and International Relations
E Sapozhnikova
Non Executive Director
• Partner at United Capital Partners
• Over 18 years of experience
• LLM - New York University, Law degree -
Moscow State University
Charles A. Fountain
Executive Chairman
• Non-Executive Director in ATCO Group
• Over 34 years of experience
• BSc, Economics & International Studies -
Warwick University, MPhil, Economics - Oxford
Rosneft RepresentativesKesani Representatives
1 Representation of all Major Shareholders on the Board…
Rosneft Kesani IndependentExecutive /
Nominee
Board of Directors (BoD) Composition
Strong
Parentage
Integrated Business &
Strategic Location
Consistent
Track Record
High
Profitability
Experienced
Management
Input
Flexibility
Robust Product
Distribution
Attractive
Industry Dynamics
1 As per Companies Act

1313
C Manoharan
Director & Head of Refinery
• Over 40 years of refining industry
experience with key assignments across
operations, maintenance and tech
• Was Executive Director with IOCL at
Panipat Refinery
• Chemical Engineer
R Sudarsan
Nominee of LIC
• Executive Director (Inspection) of LIC
• Served in various offices of LIC across
regions
• Masters Degree in Economics
Naina Lal Kidwai
Independent Director
• Worked with organizations like PWC,
ANZ Grindlays Bank PLC, Morgan
Stanley and HSBC
• Chartered Accountant, MBA - Harvard
Business School
Deepak Kapoor
Independent Director
• Fellow Member of ICAI, Fellow Member of
ICSI and member of Institute of Certified
Fraud Examiners, USA
• Commerce graduate - Delhi University
(ranked 3rd)
1 …With Eminent Industry Professionals as Independent and Executive Directors
Audit Committee Banking & Finance CommitteeTrading and Risk Management
CommitteeOther Committees
Management Committee of
Executives
Governance structure
2 Independent + 1 Nominee 1 Independent + 2 NomineeChairman of the Board + 2
Nominee
CSR, Safety & Sustainability
Committee Meeting; Nomination
& Remuneration Committee;
Stakeholders’ Relationship
Committee
CEO + CFO + CCO + CMO +
CDO + Director & Head of
Refinery
Strong
Parentage
Integrated Business &
Strategic Location
Consistent
Track Record
High
Profitability
Experienced
Management
Input
Flexibility
Robust Product
Distribution
Attractive
Industry Dynamics

14
2
Retail
sales
Single Point Mooring
(SPM) System
Pipeline network connecting port
terminal to refinery
World-class
refinery
Offtake via water,
road and rail
• Ability to handle VLCCs 8 kms
in the sea
• Natural deep draft available
throughout the year
• Extensive network of pipelines
helps transport crude to refinery
• High complexity resulting in
sustainable profitability
• Strategic location provides
advantage in sourcing and offtake
• Captive coal based power plants
with back-up of liquid/gas based
gas turbines/boilers boosts refinery
profits by providing substantial
savings
• 2 jetties, loading facilities and
gantry allow for product offtake
through multiple channels
• Strong network of 4,473
operational retail stations
Fully captive
power plant
Integrated facilities provide operational efficiency at reduced cost
Port availability through the year – no disruption
Reduces dependence on third-party service providers
Flexibility to maximize value across the entire value chain
Integrated Business Value Chain with Dedicated End-to-End Infrastructure
Strong
Parentage
Integrated Business
& Strategic Location
Consistent
Track Record
High
Profitability
Experienced
Management
Input
Flexibility
Robust Product
Distribution
Attractive
Industry Dynamics
15
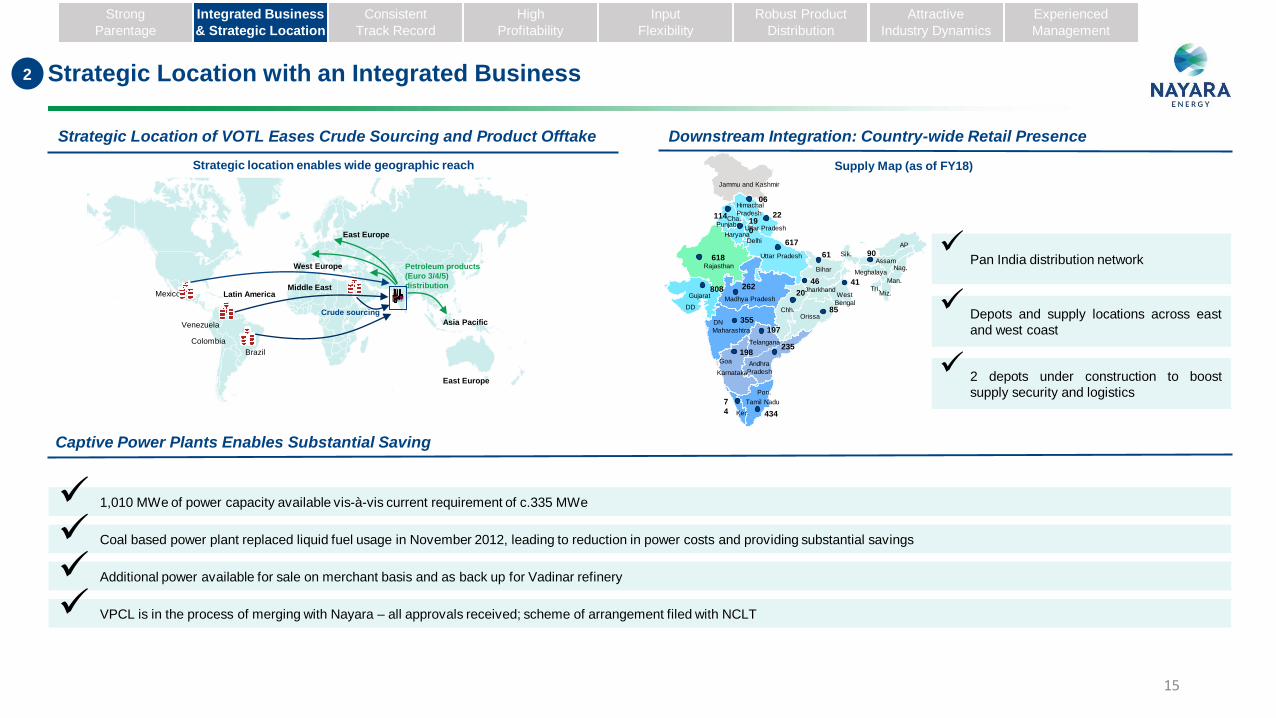
Strategic Location of VOTL Eases Crude Sourcing and Product Offtake Downstream Integration: Country-wide Retail Presence
Captive Power Plants Enables Substantial Saving
Mexico
Venezuela
Colombia
Asia Pacific
Latin AmericaMiddle East
East Europe
West Europe Petroleum products
(Euro 3/4/5)
distribution
Brazil
East Europe
Crude sourcing
617
355
262808
618
19
0
22 114
197
198235
434
7
4
46
61 90
41
20
85
06
Jammu and Kashmir
Himachal
Pradesh
Uttar Pradesh
Cha.Punjab
HaryanaDelhi
Uttar Pradesh Sik.
BiharRajasthan
Madhya Pradesh
JharkhandWest
Bengal
Tri.Miz.
Man.
Nag.Assam
Meghalaya
AP
Chh.Orissa
Telangana
Gujarat
DD
DN
Maharashtra
Goa Andhra
PradeshKarnataka
Pon.
Tamil Nadu
Ker.
Pan India distribution network
Depots and supply locations across east
and west coast
2 depots under construction to boost
supply security and logistics
Strategic location enables wide geographic reach Supply Map (as of FY18)
2 Strategic Location with an Integrated Business
1,010 MWe of power capacity available vis-à-vis current requirement of c.335 MWe
Coal based power plant replaced liquid fuel usage in November 2012, leading to reduction in power costs and providing substantial savings
Additional power available for sale on merchant basis and as back up for Vadinar refinery
VPCL is in the process of merging with Nayara – all approvals received; scheme of arrangement filed with NCLT
Strong
Parentage
Integrated Business
& Strategic Location
Consistent
Track Record
High
Profitability
Experienced
Management
Input
Flexibility
Robust Product
Distribution
Attractive
Industry Dynamics

Confederation of Indian Industry: First Prize in CII Safety, Health and
Environment Excellence & Innovation Award, 2017
16
• Refinery started in May 2008 with 10.5 MMTPA of nameplate capacity & complexity of 6.1
• Capacity presently stands at 20 MMTPA with a complexity of 11.8
• Two Crude Distillation Units (CDUs): CDU-I and CDU-II with a capacity of 18 MMTPA and
2 MMTPA respectively, with both operating at over 99% reliability since commercial
operation in 2008
• CDU refining units had less than 5 days of unplanned shutdowns each year since inception
12.013.5
14.813.5
19.8 20.2 20.519.11
20.9 20.7
114%
129%
141%
129%
101% 101% 102%96%
105% 104%
FY09 FY10 FY11 FY12 FY13 FY14 FY15 FY16 FY17 FY18
Throughput (MMTPA) Capacity utilization
3 High Capacity Utilization Maintained Consistently since Inception
Consistently operating above 100% of capacity since commencement Key highlights
1 Throughput was low due to refinery shutdown
Skoch BSE Award: Merit of Certificate for Petroleum Refining in the category of
Occupational Health and Safety, 2017
Government of India: National Safety Award for Performance Year 2015 based
on Accident-free Year, 2017
British Safety Council: International Safety Award in the category of Health and
Safety Management, 2016
Key safety awards won over the past 2 years
Major Fire-
free Days:
3,327(1st July 2018)
Lost-Time
Injury-free
Days:
3,742(1st July 2018)
Standard
Operating
Procedures:
3,412(1st July 2018)
Strong
Parentage
Integrated Business &
Strategic Location
Consistent
Track Record
High
Profitability
Experienced
Management
Input
Flexibility
Robust Product
Distribution
Attractive
Industry Dynamics

17
19%
61% 62%
53%
33% 31%
28%
6% 7%
FY12 FY15 FY18
Ultra Heavy Heavy Light
31%
15% 15%
42%61% 58%
27% 24% 27%
FY12 FY15 FY18
Heavy Middle Light
Crude mix geared towards ultra heavy crudes… …while the product mix is geared towards light and middle distillates
69% 85%
4
85%
• High complexity allows the
crude mix to be geared
towards ultra heavy crude,
enabling superior Gross
Refining Margin (GRMs)
• Tech allows production of
light and middle distillates
from the heavy and ultra
heavy crudes, which
boosts profitability
12.7 12.6 12.2 11.8
9.8 9.7 9.1 8.8 8.6
6.6 6.4
Reliance HMEL IOCLParadip
Nayara Thai Oil SK Corp BPCL Bina Sinopec IRPC Esso StarPetroleum
Complexity index for refineries
Profitable Crude and Product Mix Achieved due to High Complexity Index
• Superior complexity enables processing crude ranging
from 15-60 API with an average API of 24
• Capable of producing high quality of Euro 4 and 5
specifications of petroleum products
• Refinery expected to be Euro 6 compliant post
shutdown1 in FY19
1 A major shutdown of 25-30 days is conducted at the refinery once every 3 years
Strong
Parentage
Integrated Business &
Strategic Location
Consistent
Track Record
High
Profitability
Experienced
Management
Input
Flexibility
Robust Product
Distribution
Attractive
Industry Dynamics
Source: Publically available sources on the respective companies’ websites

In FY 2018, high value-added products, MS and HSD, accounted for c. 70% of total
production
18
Nayara has consistently outperformed the Singapore benchmark GRM
4 Industry Leading GRMs with Focus on High Value-added Products
3.9
6.1 6.0 5.56.7
5.7 5.77.0
9.410.0
8.69.7
8.9 8.6
Q2 FY17 Q3 FY17 Q4 FY17 Q1 FY18 Q2 FY18 Q3 FY18 Q4 FY18
Singapore GRM Nayara CP GRMGross Refining Margin
(GRM) ($/bbl)
3.1
Delta of Nayara CP GRM
over Singapore GRM
3.3 4.0 3.1 3.0 3.2 2.9
x.x
Diversified product slate (FY18)
5.0
1.5 2.2
1.0 0.4 0.3
5.4
1.8 0.1
-1.0 0.8
0.1 -
1.0
2.0
3.0
4.0
5.0
6.0
7.0
8.0
9.0
10.0
11.0
HSD MS Petcoke LPG Naphtha SKO/ATF Bitumen Sulphur VGO
MM
T
Domestic Export
13.8 MMT
Domestic Sales accounted for more than 50% of total sales
High complexity enables Nayara to optimize product mix as per market
requirements
Ability to produce Euro 6 compliant product with nominal investment
Strong
Parentage
Integrated Business &
Strategic Location
Consistent
Track Record
High
Profitability
Experienced
Management
Input
Flexibility
Robust Product
Distribution
Attractive
Industry Dynamics

19
5
Strategic location• Located in the Gulf of Kutch region in Gujarat, with natural deep draft availability (SPM - 32m & Jetties – 20m, 16m)
• Proximity to Middle East countries helps reduces freight cost and lead time
Current
long-term supply
contracts
• Long-term contracts exist with reputable suppliers
• Special arrangements for procurement and processing of indigenous Mangala crude
Regionally diversified
crude sourcing
• Nayara has a geographically diversified crude sourcing strategy, which helps in minimizing risk of disruption in supply
• Rosneft and Trafigura provide additional optionality for crude sourcing which can be leveraged by Nayara in the future
Engagement in spot
and long-term
arrangements
• Crude oil secured through both long term and spot arrangements to maintain balance between security of supply and optimization based on market conditions
Middle East50%
Latam33%
India8%
Other regions
9%
34% 26% 16% 30%
66% 74% 84% 70%
FY15 FY16 FY17 FY18
Term (%)
Spot (%)
FY18 crude sourcing mix
Crude Sourcing & Procurement Advantage for Nayara Energy
Strong
Parentage
Integrated Business &
Strategic Location
Consistent
Track Record
High
Profitability
Experienced
Management
Input
Flexibility
Robust Product
Distribution
Attractive
Industry Dynamics

Robust Product Distribution / Offtake Network Along with an Asset-light Retail Model
20
Export sales• Export of gas oil, jet fuel and Naphtha to over 15 countries
• Contracts are generally for six months or less with variable pricing terms
Domestic sales to
oil marketing
companies
• Current contracted oil offtake of 5.9 MMTPA with domestic OMCs
• LPG offtake by PSU OMC is around 1 MMTPA
Domestic retail
sales• Current network of 4,473 operational retail fuel stations
Domestic bulk
sales
• Include both spot and term sales for primarily HSD, fuel oil, sulphur and bitumen
• Customers typically have a tenor of 1 year and include direct commercial users,
railways & defence segments and petroleum product traders
6
7% 6% 15%
12% 18%
17%
36% 22%
26%
45% 55%
43%
FY16 FY17 FY18
Bulk Retail PSUs Export
19.0 21.421.1
x.x Total Sales in MT
Marquee Customers in India and Globally
PSUs Global Oil Majors International Petroleum Traders National Oil Companies1
Sales Mix Trend (FY16-18)
1Supply to the National Oil Companies of countries such as UAE and Saudi Arabia
Nayara has achieved rapid expansion through an asset-light model with small format ROs located at secondary highways and tier 2/3 towns
Strong
Parentage
Integrated Business &
Strategic Location
Consistent
Track Record
High
Profitability
Experienced
Management
Input
Flexibility
Robust Product
Distribution
Attractive
Industry Dynamics
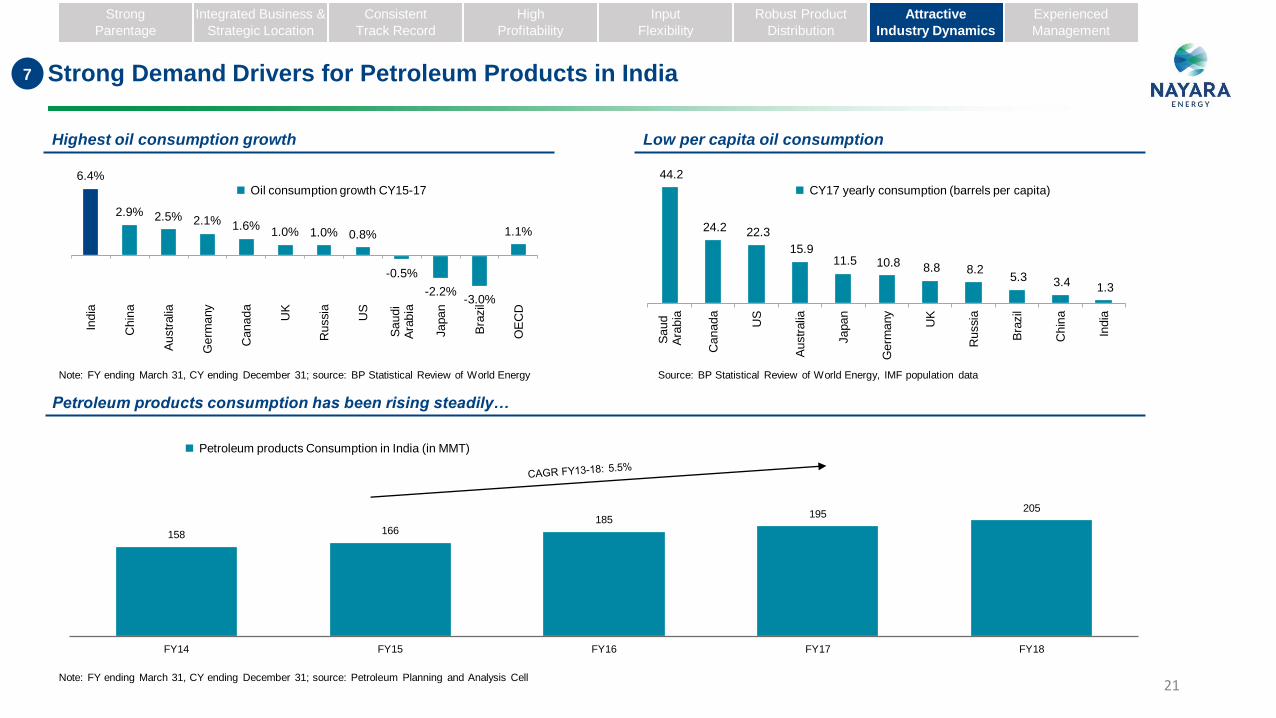
Petroleum products consumption has been rising steadily…
21
Oil consumption growth CY15-17 CY17 yearly consumption (barrels per capita)
158 166185
195205
FY14 FY15 FY16 FY17 FY18
Petroleum products Consumption in India (in MMT)
7 Strong Demand Drivers for Petroleum Products in India
Low per capita oil consumptionHighest oil consumption growth
Note: FY ending March 31, CY ending December 31; source: Petroleum Planning and Analysis Cell
Strong
Parentage
Integrated Business &
Strategic Location
Consistent
Track Record
High
Profitability
Experienced
Management
Input
Flexibility
Robust Product
Distribution
Attractive
Industry Dynamics
Note: FY ending March 31, CY ending December 31; source: BP Statistical Review of World Energy
44.2
24.2 22.3
15.9 11.5 10.8 8.8 8.2
5.3 3.4 1.3
Saud
Ara
bia
Canada
US
Austr
alia
Japan
Germ
any
UK
Russia
Bra
zil
Chin
a
India
Source: BP Statistical Review of World Energy, IMF population data
6.4%
2.9% 2.5% 2.1% 1.6%1.0% 1.0% 0.8%
-0.5%
-2.2%-3.0%
1.1%
India
Chin
a
Austr
alia
Germ
any
Canada
UK
Russia
US
Saudi
Ara
bia
Japan
Bra
zil
OE
CD

22
Indian Refining Capacity & Product Specifications
• Out of an installed capacity of c.248 MMTPA in India, 63 MMTPA capacity refineries
are more than 20 years old
• Domestic consumption of petroleum products is c.205 MMTPA with a 5-year CAGR
of 5.5%
• Nayara is well placed to capitalise on growing domestic market for cleaner fuels as
mandated by the government
Euro Norms 2008 2009 2010 2011 2012 2013 2014 2015 2016 2017 2018
European Union Euro 4 Euro 5 Euro 6
India (NCR+ 13 Cities) Euro 3 (BS III) Euro 4 (BS IV)
India (Nationwide) Euro 2 (BSII) Euro 3 (BSIII) BSIV
Hong Kong3 Euro 4 Euro 5 Euro 6
South Korea Euro 4 Euro 5 Euro 6
China (Beijing)4 Euro 2 Euro 3 Euro 4 Euro 5
Singapore5 Euro 4 Euro 5 Euro 6
Malaysia Euro 2 Euro 4
Thailand Euro 3 Euro 4
Philippines Euro 2 Euro 4
Bangladesh (gasoline) Euro 2 Euro 3
Bangladesh (Diesel) Euro 1 Euro 2
7
BSVI - 2020
Industry refining capacity split and outlook1
As India moves towards BS-VI, Nayara is capable of producing high quality petroleum products meeting fuel standards2
BSVI - 2019
Strong retail annual volume growth achieved by Nayara post deregulation of diesel prices in October 2014
Strong
Parentage
Integrated Business &
Strategic Location
Consistent
Track Record
High
Profitability
Experienced
Management
Input
Flexibility
Robust Product
Distribution
Attractive
Industry Dynamics
1,644 2,797
4,500
7683
93
40
60
80
100
-
1,000
2,000
3,000
4,000
5,000
FY16 FY17 FY18
Volume (TKL) - LHS TPO - RHS
65% CAGR since FY16
• On 18th October, 2014, the Union Cabinet Committee of Economic Affairs, formally
announced deregulation of diesel prices
• The biggest benefit could be through higher marketing margins
• Deregulation to lead to market-linked pricing and encourage private oil refiners to
foray into domestic oil marketing space
Note:
1. Source: Petroleum Planning and Analysis Cell
2. Compiled from various sources including Delphi Worldwide Emission Standards, The Air Pollution Control (Vehicle Design Standards) (Emission)(Amendment) Regulation 2017, National Environment Agency report Singapore, CIMB equity research
3. Hong Kong commenced Euro 6 for private car and taxi from 2017. For light bus and goods vehicle, Euro 6 commenced from 2018
4. In Beijing, Euro 5 was implemented in 2013 for PI without IUPR and CI / for PI with IUPR, it was implemented in 2015
5. For diesel-run vehicles

23
B Anand
Chief Executive Officer
C Manoharan
Director & Head of Refinery
Anup Vikal
Chief Financial Officer
Alan McGown
Chief Marketing Officer
Evgeny Storozhuk
Chief Commercial Officer
Sergey Denisov
Chief Development Officer
23
Vastly Experienced Management with Substantial Execution Experience in the Petroleum Sector
• Experience in corporate finance, strategy, investment banking and commodity trading
• Previously was the CFO of Trafigura India Private Limited; prior to Trafigura, was Group Director of Finance for Future Group and held
senior positions with Vedanta Resources Group
• Handled variety of assignments in key positions in Refining Operations, Maintenance and Technical Services at Gujarat Refinery, Panipat
Refinery as well as Head Office (Refinery Division)
• Prior to Nayara Energy, he was Executive Director with IOCL at the Panipat Refinery
• Rich experience in Banking and Finance industry
• Prior to Nayara Energy, he was the CFO of Snapdeal and has held senior positions with Aircel, Interglobe Aviation, COLT Telecom & Bharti
Airtel
• Holds Mechanical Engineering and MBA degree
• Experience in the Oil Marketing sector; he holds a degree in Business Studies Finance and Post Graduate Diploma in Marketing
• Prior to Nayara Energy, he worked with Rosneft, BP &TNK BP in various key positions in Poland, US, China and Russia
• Vast Experience in Oil and Gas industry
• Prior to Nayara Energy, he worked with Rosneft and TNK-BP in Russia and Ukraine
• Holds degree in Economics and Management, MBA and has completed his post-graduation in Accounting
• Experience in the area of Upstream Field Development, Project Management, Refining Commercial and Downstream Strategy
• Prior to Nayara Energy, he has worked with BP, TNK BP and Sidanco in Russia, Ukraine, Netherlands, UK and Germany
• Holds a degree in Mechanical Engineering
8
30+
40+
26+
25+
20+
20+
xx Years of experience
Strong
Parentage
Integrated Business &
Strategic Location
Consistent
Track Record
High
Profitability
Experienced
Management
Input
Flexibility
Robust Product
Distribution
Attractive
Industry Dynamics

Near Term Strategic Plans
24

Near Term Strategic PlansSecuring the Base
Optimization of capital
structure
• Plans implemented
o Achieved refinancing of INR term loans at favourable terms with lower spreads
o INR Bond of INR 2,400cr (c. US$ 355mn) availed and in process of availing long term prepayments for converting short term liabilities into
long term debt
o Aiming at further reduction in interest cost by availing synthetic full currency swaps
o Entered into a US$750mn long term export advance facility to reduce reliance on short term debt
Margin Improvement
Projects
• CCR Unit Revamp (Increase in capacity from 3.2 KTPD to 3.7 KTPD)
o Improves GRM by upgrading Hydro-Treated Heavy Naphtha from NHT to high value octane rich Reformate
• New SRU (Sulphur Recovery Unit) and SWS (Sour Water Stripper) Units
o Expected to lead to enhancement of crude blend window with respect to Sulphur and Nitrogen, and optimizing Crude basket on a
sustained basis
• NHT and ISOM Revamp
o NHT revamp improves the margins by upgrading sour Naphtha to Gasoline and Diesel; NHT can supply incremental Hydro-Treated
conditioned feed to match revamps of ISOM unit and CCR unit which is expected to eventually produce more of high value Octane barrels
o Higher incremental Isomerate volumes are expected to improve flexibility to upgrade incremental naphtha into Gasoline, and produce
Incremental high octane and low Sulphur Gasoline grades
• Retail Expansion
o Leverage existing ready retail platform for further expansion to capitalize on deregulation of gasoline prices
o 4,473 operational retail stations and 2,688 retail stations under implementation across India
o Plan to setup 5 depots across strategic locations in the country to improve supply security and reduce dependency on PSUs
o Automation of all retail stations under implementation in phased manner
Retail expansion and
automation
Low cost
projects with low
payback period
Asset light model
for value
creation
Saving in
interest cost and
extension of
maturity
25

Restoration of Sanctions on Iran by US Administration
Alternate Plans of Nayara Energy
• In May 2018, US announced discontinuation of its participation in the Joint Comprehensive Plan of Action (JCPoA)
• 180 days wind-down period until 4th Nov 2018 given to demonstrate the reduction of trade with Iran and Iranian counterparties
• Nayara’ s position:
• Shall always remain complaint with the US Sanctions imposed on Iran
• If the Govt. of India negotiates a waiver / exemptions with Govt. of USA, Nayara shall remain in compliance with Sanctions and such exemptions read together
Restoration of Sanctions on Iran : Nayara Energy’s Plans Going Forward
26
Compliance with Sanctions Laws
Secure suitable replacement crudes from Middle East and Latin America through combination of spot and term volumes
Leverage on established relationships with all major suppliers
Nayara plans to have replacement contracts to minimize the economic hit

Financial Overview
27

28
Nayara’s Financial Performance (Provisional unaudited IFRS financials)
Particulars FY16 FY17 FY18 3mFY18 3mFY19
(in US$mn1, unless stated otherwise)
(12 months ended
Mar 2016)
(12 months ended
Mar 2017)
(12 months ended
Mar 2018)
(3 months ended
Jun 2017)
(3 months ended
Jun 2018)
Throughput - Million Tons 19.11 20.95 20.70 5.13 5.24
Throughput - Million Barrels 133 145 144 36 37
INCOME
Revenue from Operations 9,405 11,117 13,148 3,241 4,024
Other Income 345 519 110 133 12
Total Income 9,750 11,637 13,258 3,374 4,036
EXPENDITURE
Cost of Goods Sold (COGS)2 6,395 7,497 9,145 2,106 2,937
Excise Duty 1,475 1,730 2,260 730 632
Other Expenditure3 611 574 634 182 155
Total Expenditure 8,481 9,800 12,039 3,017 3,724
EBITDA4 924 1,317 1,108 224 300
Interest & Finance Charges 415 583 508 101 83
Depreciation 236 258 260 56 64
Exceptional Items Gain / (Loss) (107) (801) (155) (144) (4)
Share of Gain / (Loss) of associates - (8) - - -
Net Exchange Rate differences (138) - (64) 1 (107)
Profit before Tax (PBT) 373 187 231 57 54
(Loss) from Discontinued Operations (38) (341) (14) (14) -
Tax Expense 198 227 139 70 20
Profit after Tax (PAT) 137 (381) 78 (27) 34
Note:
1. USDINR rates used: FY16 – 66.33; FY17 – 64.84; FY18 – 65.04; 3mFY18 – 64.74; 3mFY19 – 68.58
2. COGS = Cost of raw materials consumed + Purchases of stock-in-trade (petroleum products) + Changes in inventory of finished goods, stock-in-trade and work-in-progress
3. Other Expenditure = Employee benefits expense + Other expenses (does not include net exchange rate differences)
4. EBITDA = Revenue from operations – COGS – Excise duty – Other Expenditure

0.63x
0.60x 0.60x
0.64x
FY16 FY17 FY18 Jun-18
29
Revenue from Operations (US$mn) EBITDA (US$mn)
Leverage Profile
Key Financial Metrics (Provisional unaudited IFRS financials)
Note:
1. USDINR rates used: FY16 – 66.33; FY17 – 64.84; FY18 – 65.04; 3mFY18 – 64.74; 3mFY19 – 68.58
2. Gross Debt (Debt) = Non-current Interest-bearing loans and borrowings + Current Interest-bearing loans and borrowings + Interest accrued but not due to borrowing
3. Gross Debt for June-18 includes additional debt of c. US$ 1,105mn which Nayara has undertaken after 30 June 2018 i.e. Export advance facility of US$ 750mn and INR Bond of INR 2,400cr (c. US$ 355mn)
4. Net Debt = Gross Debt – (Cash and short term deposits + Investments in mutual funds)
5. Gross Debt / EBITDA and Net Debt / EBITDA for Jun-18 have been calculated using LTM Jun 2018 EBITDA = FY18 EBITDA + 3mFY19 EBITDA – 3mFY18 EBITDA
9,405
11,117
13,148
FY16 FY17 FY18
3,241
4,024
3mFY18 3mFY19
224
300
3mFY18 3mFY19
924
1,317
1,108
FY16 FY17 FY18
5.06x
3.14x
3.79x4.08x
4.80x
2.75x3.13x
3.58x
FY16 FY17 FY18 Jun-18
Gross Debt / EBITDA Net Debt / EBITDA
33

01/01/10 09/16/11 05/31/13 02/14/15 10/29/16 07/15/18
BBB
BBB+
A-
A
A+
AA-
BBB-
AA
Acquisition
(Aug-2017)
Continuous Improvement in Local Credit Rating
30
Improvement by three notches (“A” to “AA”) post acquisition
Strong market position of consortium promoters
Strong operational profile with one of the highest complexities across refineries in India
Relatively higher Gross Refining Margins (GRMs) than peers in the industry
Crude throughput more than rated capacity of 20 MMTPA
Strategic location of refinery along with captive port terminal and power plant
Adequate debt coverage metrics
CARE Long
term rating
Source: CARE rating rationale, as of 25 May 2018

31
List of Abbreviations
Abbreviation Nomenclature
API American Petroleum Institute gravity
ATF Aviation Turbine Fuel
BBL Barrel (unit)
Bn Billion
BP British Petroleum
BPCL Bharat Petroleum Corporation Limited
CAGR Compounded Annual Growth Rate
CCR Continuous Catalytic Regeneration Unit
CCO Chief Commercial Officer
CDO Chief Development Officer
CDR Corporate Debt Restructuring
CDU Crude Distillation Unit
CI Compression Ignition Engine
CII Confederation of Indian Industry
CMO Chief Marketing Officer
E&P Exploration and Production
GRM Gross Refining Margin
HMEL HPCL-Mittal Energy Limited
HPCL Hindustan Petroleum Corporation Limited
HSD High Speed Diesel
IOCL Indian Oil Corporation Ltd.
ISOM Isomerization Unit
IUPR In Use Performance Ratio
Abbreviation Nomenclature
KTPD Kilo Tonnes per Day
LIC Life Insurance Corporation of India
LNG Liquefied Natural Gas
LPG Liquefied Petroleum Gas
MHC Mild Hydrocracker Project
MMT Million Metric Tonnes
MMTPA Million Metric Tonnes Per Annum
MS Motor Spirit (Petrol) or Gasoline
MWe Megawatt Electric
NCLT National Company Law Tribunal
NHT Naphtha Hydro-Treater unit
OMC Oil Marketing Companies
PPAC Petroleum Planning & Analysis Cell
PSU Public Sector Undertaking
SRU Sulphur Recovery Unit
SWS Sour Water Stripper
TNK Tyumenskaya Neftyanaya Kompaniya, Tyumen Oil Company
TKL Total Kilo Litres
TPO Throughput per Outlet
VGO Vacuum Gas Oil
VLCC Very Large Crude Carriers
VOTL Vadinar Oil Terminal Limited
VPCL Vadinar Power Company Limited

Thank You
32