NAVAL POSTGRADUATE SCHOOL Monterey, California · 7a naval postgraduate school monterey, california...
55
7A NAVAL POSTGRADUATE SCHOOL Monterey, California AD.A2 7 4 964 DTIC LECTE AN2T194 THESIS AN ANALYTICAL APPROACH TO ASSESSING THE VULNERABILITY OF BOMB SHELTERS TO AERIAL BOMBING AND ARTILLERY ATTACK by Yeo Gim Koon September, 1993 Thesis Advisor: Jmes Esary Approved for public release; distribution is unlimited. c•\ 94-02745 94 -1 26 180
Transcript of NAVAL POSTGRADUATE SCHOOL Monterey, California · 7a naval postgraduate school monterey, california...
7A
NAVAL POSTGRADUATE SCHOOLMonterey, California
AD.A27 4 964
DTICLECTE
AN2T194
THESISAN ANALYTICAL APPROACH TO ASSESSING THE
VULNERABILITY OF BOMB SHELTERS TO AERIALBOMBING AND ARTILLERY ATTACK
by
Yeo Gim Koon
September, 1993
Thesis Advisor: Jmes Esary
Approved for public release; distribution is unlimited.
c•\ 94-02745
94 -1 26 180
Unclassified
Security Classification of this page
REPORT DOCUMENTATION PAGE
s Report Security Clusificalon: Unclassified lb Restuictive Markings
2a Security Classification Authority 3 Distribution/Availability of Report2b Declassification/Downgading Schedule Approved for public release; distribution is unlimited.
4 performing Organization Report Number(s) 5 Monitoring Organization Report Number(s)6. Name of Paerforing Organization 6b Office Symbol 7& Name of Monitoring OrgamizionNaval Postgraduate School rif applicable) "52 Naval Postgraduate School
6c Ad"s (city, state, and ZIP code) 7b Address (city, state, and ZIP code)Monterey CA 93943-5000 Monterey CA 93943-5000ga Name of Funding/Sponsoring Organization 6b Office Symbol 9 Procurement Instnment Identification Number
Iif qpicat) _
Address (city, state, and ZIP code) 10 Source of Funding Numbers
Program Element No Projec No jTask No 1Work Unit Accession
II Tide (include secwity clanification) AN ANALYTICAL APPROACH TO ASSESSING THE VULNERABILITY OF BOMBSHELTERS TO AERIAL BOMBING AND ARTILLERY ATTACK
12 Personal Author(s) Yeo Gim Koon
l3a Type of Report I13b Time Covered 14 Date of Report (war, monthl day) 15 Page Count 55Master's Thesis From To 1993, September 5
16 Supplementary Notation The views expressed in this thesis are those of the author and do not reflect the official policy orposition of the Department of Defense or the U.S. Government.
17 Cosati Codes 18 Subject Terms (continue on reverse if necessary and identify by block number)
Field IGroup [Subgroup munition shelters, vulnerability, damage assessment, survivability, weaponseffectiveness
19 Abstract (continue on reverse itfnecessary and identify by block number)This study examines the vulnerability of bomb shelters to aerial bombing and artillery attack, by modelling the bomb dump, i.e., the area within which thebomb shelters are located, as a cellular target. The stochastic process of hitting the dump with aerial bombs or artillery shells is modelled using suitableprobability distributions, depending on the scenarios. Two measures of effectiveness we used:
(!) The expected proportion of damage to the bomb dump by n weapons (bombs or shells) that are directed at the bomb dump, and
(2) The probability that the ith shelter will be damaged due to an attack by n weapons that are directed at the bomb dump.
A generalized shelter hardness and vulnerability model is derived. Conditions under which shelter probability of kill and dump expected proportion ofdamage coincide and are independent of the relative shelter values are discussed. The effectiveness of various defender's and attacker's strategies isconsidered
20 Distribution/Availability of Abstract 21 Abstract Security ClassificationS unclassified/unlimited _ same as report - DTIC users Unclassified
22a Name of Responsible Individual 22b Telephone (Include Area Code) 22c Office SymbolJames Esary .408-656-2780 [OR/Ey
DD FORM 1473,84 MAR 83 APR edition may be used until exhausted security classification of this 2aWe

I I I l II I I [ l
Approved for public release; distribution is unlimited.
An Analytical Approach to Assessing the Vulnerability of Bomb Shelters to Aerial Bombing
and Artillery Attack
by
Yeo Gim Koon
Project Engineer, Ministry of Defence, Singapore
B.Eng (Hons) National University of Singapore
Submitted in partial fulfillment
of the requirements for the degree of
MASTER OF SCIENCE IN OPERATIONS RESEARCH
from the
NAVAL POSTGRADUATE SCHOOL
September 1993
Author:
Yeo Gim Koon
Approved by: ¶"ja s. Ery, Thesis Advisor
G.F.L" y, Sond Reader
Peter Purdue, Chairman
Department of Operations Research
ABSTRACT
This study examines the vulnerability of bomb shelters to
aerial bombing and artillery attack, by modelling the bomb
dump, i.e., the area within which the bomb shelters are
located, as a cellular target. The stochastic process of
hitting the dump with aerial bombs or artillery shells is
modelled using suitable probability distributions, depending
on the scenarios. Two measures of effectiveness are used:
(1) The expected proportion of damage to the bomb dump
by n weapons (bombs or shells) that are directed
at the bomb dump, and
(2) The probability that the ith shelter will be
damaged due to an attack by n weapons that are
directed at the bomb dump.
A generalized shelter hardness and vulnerability model is
derived. Conditions under which shelter probability of kill
and dump expected proportion of damage coincide and are
independent of the relative shelter values are discussed. The
effectiveness of various defender's and attacker's strategies
is considered.AmuuloN Forw
DTIIC QUTAL1 MTNSECTED 8 NIm GRA&I 1D•IC TAJ 03Vnannouneed
Jus 1t .. .. .
Mi DistributiaopAvailabiýIty •e
K ; and-/o'Net SP64i1a
TABLE OF CONTENTS
I INTRODUCTION .................... 1
II APPROACH . . . . . . . . . . . . . . . . . . . . . 5
III SCENARIO 1 . . . . . . . . . . . . . . . . . . . . 8
A. KILL CRITERIA 1: ONE BOMB TO KILL A SHELTER 8
B. KILL CRITERIA 2: x BOMBS TO KILL A SHELTER 11
C. ANALYSIS OF DEFENDER'S STRATEGY ... ........ .. 14
1. Hardening the Shelters .... ........... .. 15
2. Spreading the Shelters over a Larger Area 17
3. Spread vs Hardening of Shelters ..... ...... 18
D. ANALYSIS OF ATTACKER'S STRATEGY ... ........ .. 19
E. SUMMARY OF ANALYSIS ........ .............. 21
IV SCENARIO 2 ............. .................... 23
A. KILL CRITERIA 1: ONE SHELL HIT ON ANY SECTION TO
KILL A SHELTER ......... ................ 23
B. KILL CRITERIA 2: x HITS ON ANY SUBCELL REQUIRED
TO KILL A SHELTER ........ .............. 25
C. ANALYSIS OF DEFENDER'S STRATEGY ... ........ .. 28
1. Hardening the Shelters .... ........... .. 29
2. Spreading the Shelters over a Larger Area 30
iv
3. Size of Shelters ....... ............. 32
4. Size vs Spread vs Hardness of Shelters . 33
D. ANALYSIS OF ATTACKER'S STRATEGY .......... 34
E. SUMMARY OF ANALYSIS ........ .............. 36
V DISCUSSIONS ............... .................... 38
A. GENERALIZED SHELTER HARDNESS AND VULNERABILITY
MODELLING .............. ................... 38
B. CONDITIONS UNDER WHICH SHELTER PROBABILITY OF
KILL AND DUMP EXPECTED PROPORTION OF DAMAGE
COINCIDE ............... ................... 41
VI CONCLUSIONS .............. .................... 44
LIST OF REFERENCES ............. .................. 45
INITIAL DISTRIBUTION LIST ........ ............... 46
v
ECECUTIVE SUNIKRY
This study examines the vulnerability of bomb shelters to
aerial bombing and artillery attack by modelling the bomb
dump, i.e., the area within which the bomb shelters are
located, as a celluar target with m cells. The stochastic
process of hitting the dump with aerial bombs or artillery
shells is modelled using suitable hit probability
distributions depending on the scenarios. Two measures of
effectiveness are used:
(1) The expected proportion of damage to the bomb dump
by n weapons (bombs or shells) that are directed
at the bomb dump, and
(2) The probability that the ith shelter will be
damaged due to an attack by n weapons that are
directed at the bomb dump.
Two scenarios are used to examine the effectiveness of
various strategies that can be adopted by a defending force or
attacking force:
Scenario 1: High Level Aerial Bombing Using Large "Dumb"
Bombs, Each aircraft will carry only one bomb. Each shelter is
the same size, but is assigned an arbitrary weight (the
proportion of the total value of the dump). Two subscenarios
are examined, defined by the kill criteria or number of bombs
to kill a shelter:
Kill Criteria 1: One hit to kill a shelter, and
vi
Kill Criteria 2: x hits to kill a shelter.
Since each aircraft releases only one bomb, each bomb will hit
the dump independently with a probability p. Also, since high
level bombing is adopted, it is assumed that each bomb is
equally likely to hit any region in the dump.
Scenario 2: An Artillery Attack Scenario, Each shelter is
the same size, but is assigned an arbitrary weight (the
proportion of the total value of the dump). Since a shell is
small in comparison to the size of a shelter, each artillery
shell may only damage a small section of the shelter. Two
kill criteria are examined:
Kill Criteria 1: One hit on any section of a shelter
required to kill the shelter, and
Kill Criteria 2: x hits on the same section (any section)
of a shelter required to kill the shelter.
Each shell will hit the dump independently with a probability
p and is equally likely to hit any region in the dump.
The models derived for Scenarios 1 and 2 lead to a
generalized model which can be used for examining more
sophisticated kill criteria based on an engineering analysis
of shelter hardness and vulnerability to weapons.
It is shown that if a weapon that hits the dump is equally
likely to hit any shelter in the dump and if the shelters are
of the same size and have the same kill criteria, then two
useful conclusions apply:
vii
(1) The expected proportion of damage to the bomb dump and
the probabilities of kill for the shelters do not
depend on the weights assigned to the shelters, and
(2) The probabilities of kill for the shelters are the
same, and are equal to the expected proportion of
damage to the dump.
viii
I INTRODUCTION
Weapons and ammunition are the jaws and claws of any
fighting force. These high valued assets are housed in "bomb
shelters". Bomb shelters are located in an area called a "bomb
dump". Thus bomb dumps are often regarded as high value
targets whose destruction will have a serious impact on the
outcome of any conflict.
An attacking force will be concerned with what tactics to
use, how many sorties to fly, or how many shells to fire to
inflict a required level of damage. It will also be interested
in how improved weapons accuracy will affect performance.
A defending force will be interested in knowing if
survivability is improved by spacing out shelters over a
larger area, or using harder shelters that are more difficult
to defeat, or by building more shelters of smaller sizes.
This study addresses the above questions by examining two
different scenarios using two measures of effectiveness:
(1) E(D) - The expected proportion of damage to the dump
by n weapons (bombs or shells) that are
directed at the dump, and
(2) PKl - The probability that a particular bomb
shelter, the ith, will be damaged by n weapons
that are directed at the dump.
1
The two scenarios are:
Scenario 1: High Level aerial bombing using larcie "dumb"
bombs. Each aircraft will carry only one bomb. Each shelter is
the same size, but is assigned an arbitrary weight (the
proportion of the total value of the dump). Two kill criteria
are examined:
Kill Criteria 1: One hit to kill a shelter, and
Kill Criteria 2: x hits to kill a shelter.
Since each aircraft releases only one bomb, each bomb will hit
the dump independently with a probability p. Also, as high
level bombing is adopted, it is assumed that each bomb is
equally likely to hit any region in the dump.
Scenario 2: An artillery attack scenario. Each shelter is
the same size, but is assigned an arbitrary weight (the
proportion of the total value of the dump). Since a shell is
small in comparison to the size of a shelter, each artillery
shell may only damage a small section of the shelter. Two kill
criteria are examined:
Kill Criteria 1: One hit on any section of a shelter
required to kill the shelter, and
Kill Criteria 2: x hits on the same section (any section)
of a shelter required to kill the shelter.
Each shell will hit the dump independently with a
probability p and is equally likely to hit any region in the
dump.
2
The scenarios examined are of course not exhaustive.
However, the methodology used in modelling the dump and hit
distributions can be used to examine other scenarios as the
need arises.
The shelter kill criteria used in Scenarios 1 and 2 are
based on simple assumptions about shelter size and
vulnerability. A method for introducing more sophisticated
kill criteria based on engineering analysis of shelter
hardness and vulnerability to weapons directed against it is
discussed in Chapter V.
Both scenarios assume that a weapon that hits the dump is
equally likely to hit any region in the dump, and since the
shelters are all the same size, equally likely to hit any
shelter. The relative values of the shelter contents (weights
w.) may differ, but the kill criteria is the same for each
shelter. The derivation of the expected proportion of damage,
E(D), to the dump and the probabilities, PKi, that individual
shelters are killed for the two scenarios leads to two useful
observations about these and similar scenarios:
(1) E(D) and the PK1 do not depend on the weights w,
assigned to the shelters, and
(2) Each PK, is the same and equal to E(D).
A basic hypothesis under which these observations apply is
presented in Chapter V. The second observation can offer a
convenient shortcut in the computation of E(D), as illustrated
in the analysis of Scenario 1, Kill Criteria 2.
3

Chapter II will describe bomb dumps and the weapons hit
distributions.
4
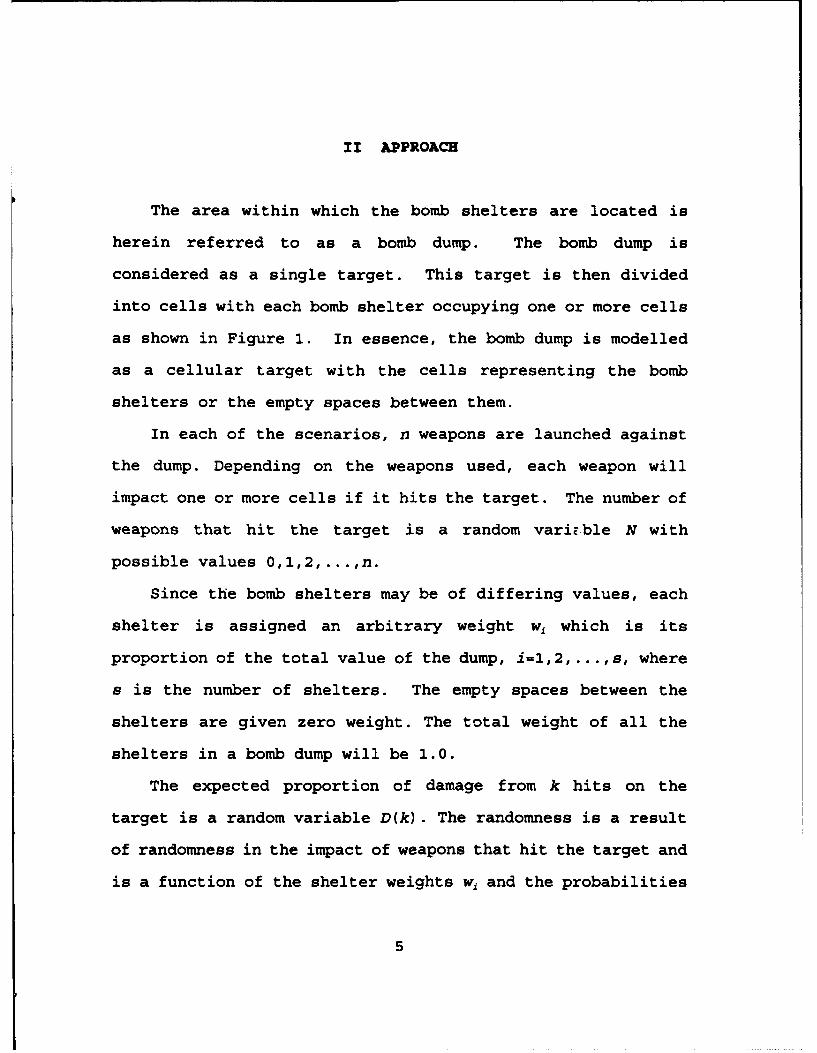
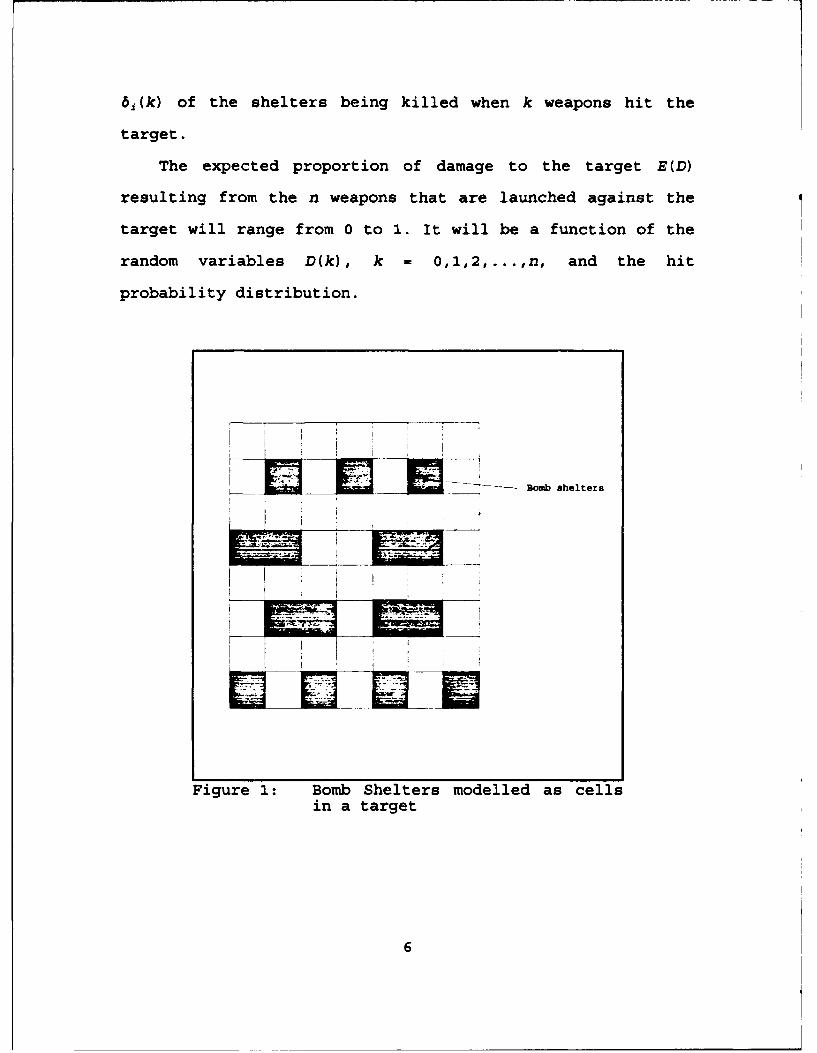
II APPROACH
The area within which the bomb shelters are located is
herein referred to as a bomb dump. The bomb dump is
considered as a single target. This target is then divided
into cells with each bomb shelter occupying one or more cells
as shown in Figure 1. In essence, the bomb dump is modelled
as a cellular target with the cells representing the bomb
shelters or the empty spaces between them.
In each of the scenarios, n weapons are launched against
the dump. Depending on the weapons used, each weapon will
impact one or more cells if it hits the target. The number of
weapons that hit the target is a random varizble N with
possible values 0,1,2,...,n.
Since the bomb shelters may be of differing values, each
shelter is assigned an arbitrary weight w, which is its
proportion of the total value of the dump, i=1,2, . . .,s, where
s is the number of shelters. The empty spaces between the
shelters are given zero weight. The total weight of all the
shelters in a bomb dump will be 1.0.
The expected proportion of damage from k hits on the
target is a random variable D(k). The randomness is a result
of randomness in the impact of weapons that hit the target and
is a function of the shelter weights w1 and the probabilities
5
61(k) of the shelters being killed when k weapons hit the
target.
The expected proportion of damage to the target E(D)
resulting from the n weapons that are launched against the
target will range from 0 to 1. It will be a function of the
random variables D(k), k = 0,1,2,...,n, and the hit
probability distribution.
A -iE- Bomb shelters
Figure 1: Bomb Shelters modelled as cellsin a target
6

Chapter III will illustrate how Scenario 1 is modelled and
how the effectiveness of various defender's and attacker's
strategies may be evaluated.
7
III SCENARIO 1
Scenario 1 is a high level bombing scenario in which the
attacker uses a large "dumb" bomb. Each attacking aircraft
will carry only one bomb. Each bomb will impact exactly one
cell. Each shelter is assigned an arbitrary weight w.. Two
kill criteria are examined:
Kill Criteria 1: One hit to kill a shelter, and
Kill Criteria 2: x hits to kill a shelter.
Since each aircraft releases only one bomb, each bomb
will hit the dump independently with probability p. Also, as
high level bombing is adopted, it is assumed that each hit is
equally likely to impact any cell in the target. The target is
divided into m cells of equal size.
A. KILL CRITERIA 1: ONE BOMB TO KILL A SHELTER
Since the bomb is equally likely to hit any cell in the
target, the probability that shelter i will not be hit when a
bomb lands on the target is
(U - Cj/M),
where ci is the number of cells that shelter i occupies.
Therefore the probability of at least one bomb hitting
shelter i when k bombs have hit the target area is
8
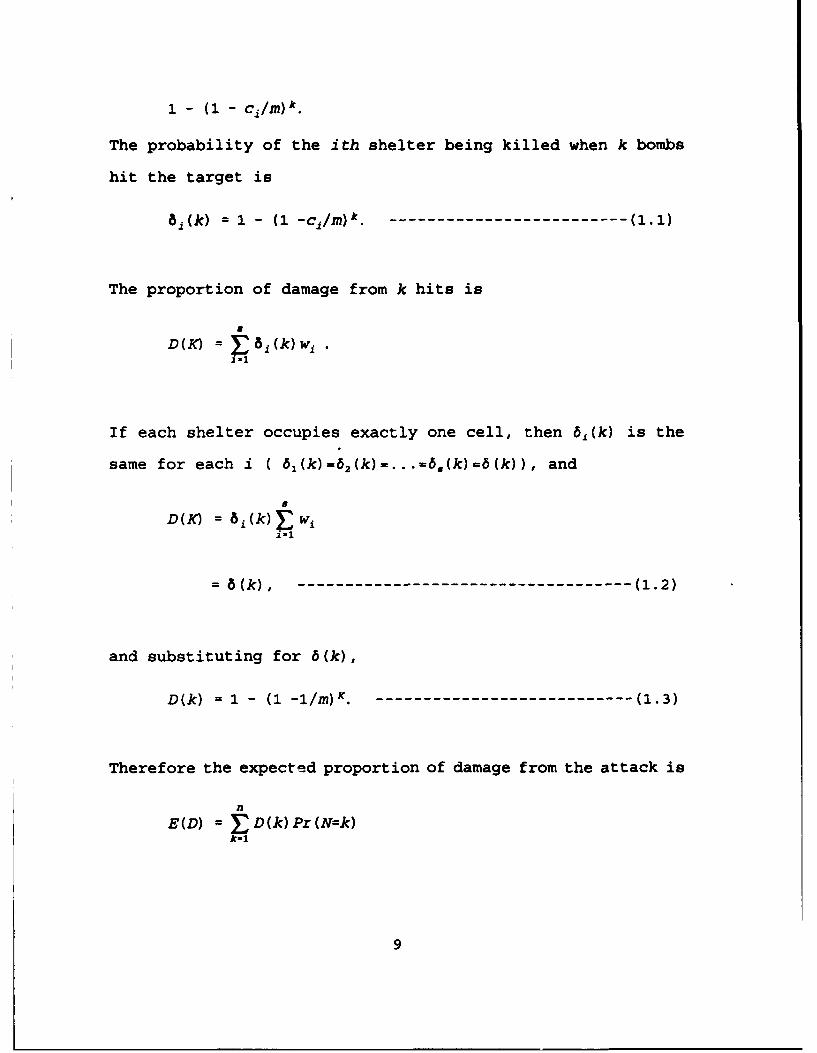
. - (1 - c/1 m) k.
The probability of the ith shelter being killed when k bombs
hit the target is
8i(k) - 1 - (1 -cim)k. - -------------------------- )
The proportion of damage from k hits is
a
D(K) = (k) w.
If each shelter occupies exactly one cell, then 6,(k) is the
same for each i ( 62(k)=6 2 (k)= ... =6.(k)=6(k)), and
D(K) = j W)wii-1=
= 6(k), - ----------------------------------- (1.2)
and substituting for 6(k),
D(k) U 1 - (1 -1/m).K ----------------------------- (1.3)
Therefore the expected proportion of damage from the attack is
n
E(D) = D(k)Pr(N=k)k-1
9
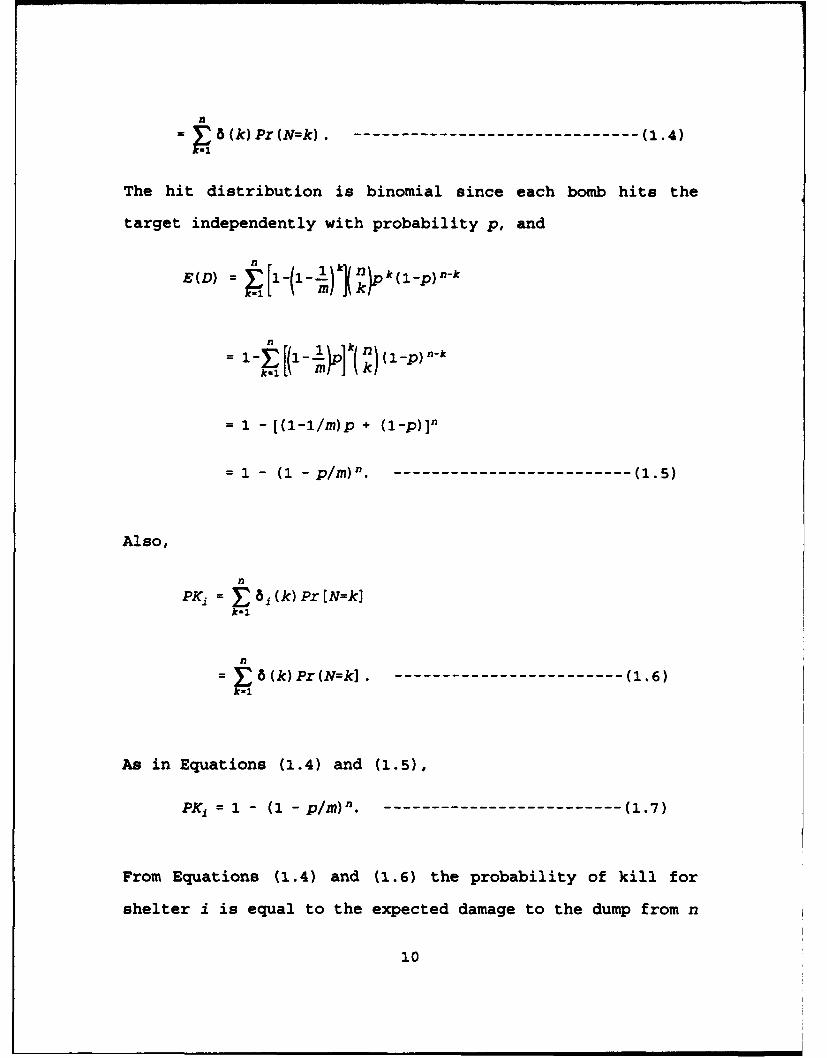
- 8(k) Pr(N=k). ------------------------------- (1.4)
The hit distribution is binomial since each bomb hits the
target independently with probability p, and
n
E(D) 1 =k( p -
n- 1€ -1 I. k( n 1 • -p) o-i
= 1 - [(1-1/m)p + (1-p)l]
= 1 - (1 - p/)". ------------------------- (1.5)
Also,
PKi = i (k) Pr [N=k]
k12
= 8 (k)Pr(N=k] . ----------------- (1.6)k-1
As in Equations (1.4) and (1.5),
PKl = 1 - (I - p/m)-. ------------------------- (1.7)
From Equations (1.4) and (1.6) the probability of kill for
shelter i is equal to the expected damage to the dump from n
10
bombs and is not dependent on the relative weight of each
shelter wi. This is true regardless of the hit probability
distribution Pr(N-k), k-0,1,...,n. The only condition for the
PK, to be the same as the expected damage E(D) is for the
6W(k)'s to be the same for each shelter i, and this will be
true if each shelter is of the same size and a bomb that hits
the target is equally likely to hit any shelter in the dump.
B. KILL CRITERIA 2: x BOMBS TO KILL A SHELTER
Again if each shelter occupies exactly one cell, then the
probability of the ith shelter being hit when one bomb lands
in the target area = 1/m.
Out of k hits on the target, the probability that the ith
cell is hit by j bombs is
(k[_] 1 kl-J
Therefore,
61 (k) = Pr[shelter i killedik hits on the dump]
= Pr[out of k hits on the dump,at least x
bombs land on shelter i]
= x( k)[1j] 1-1 k i = ( )-1---------------(1.8)
M I 11
Therefore the proportion of damage when k bombs hit the dump
is
a
D(k) = wi6i(k)
-- (k)•. w.
= 6(k). (.9
8 6(k) ------------------------------------- (1.9)
The expected proportion of damage is
n
E(D) = £D(k)Pr(N=k)k-O
n
=T 8 (k) Pr (N=k), - ----------------------- (1.10)
and
n
PKi = 8j (k) Pr (N=k)k-I
nE 8(k)Pr(N=k) ----------------- (1.11)k-i
12
Assuming the hit probability to be binomial with probability
p and substituting for 6(k), then
n kPLC1 = E (D) 4k ~( f]i ]k1 k(1-)nk-------(1.12)
Again the expected damage and the probability of kill for
shelter i are the same regardless of the hit distribution as
shown by Equations (1.10) and (1.11), and independent of w,.
This will be true as long as the probability 6,(k) of kill for
shelter i given k hits on the target is the same for all
shelters.
Equation (1.12) can be further simplified by combining the
hit probability p on the dump and the hit probability 1/m on
the shelter given a hit on the dump, as shown in Figure 2.
Since a bomb is equally likely to hit any shelter if it
hits the dump, the probability of a hit on shelter i will then
be p/m. Therefore
PK, - Pr [out of n bombs, at least x bombs hit shelter i]
n _(l[PAp]n2-,-- -- -- -- -- ---- ---- ---- -- ------(1.13)
Since E(D) = PKl,
13
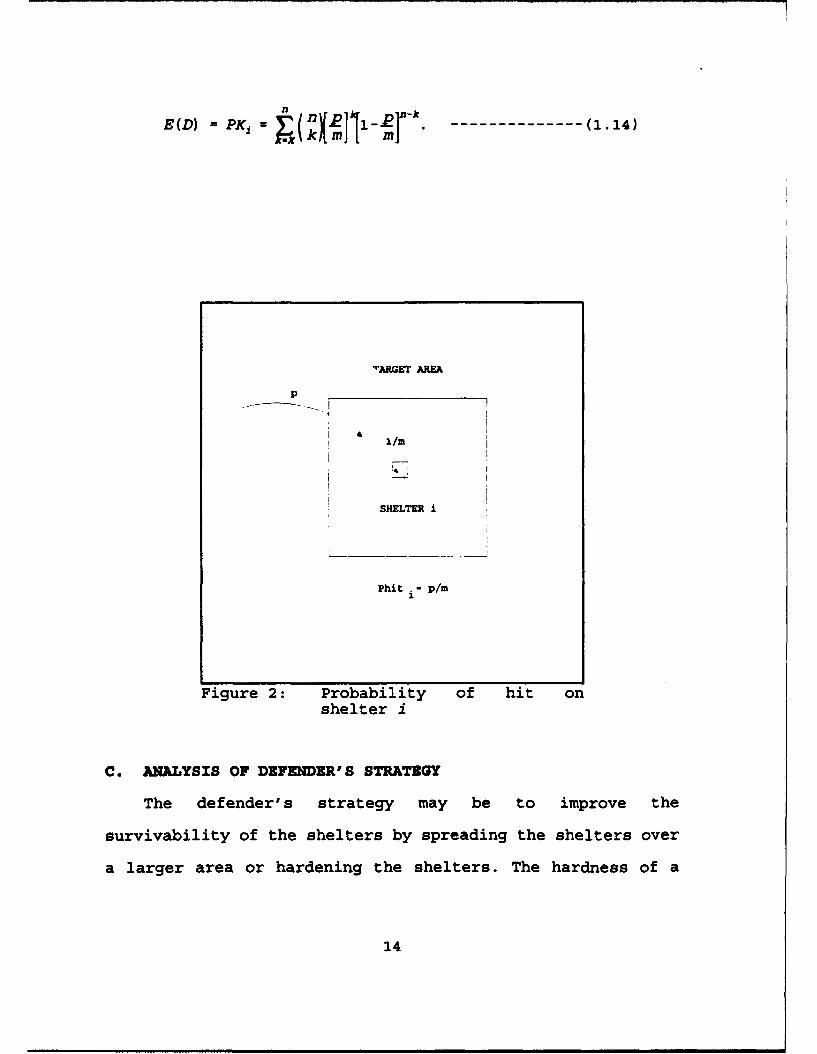
n
E(D) =PlC1 = T.(ný_EjjI_~.2r. -.......(1.14)
'rARGET AME
1/rn
SHELTER i
Phit ." p/rm
Figure 2: Probability of hit onshelter i
C. ANALYSIS OF DEFENDER'S STRATEGY
The defender's strategy may be to improve the
survivability of the shelters by spreading the shelters over
a larger area or hardening the shelters. The hardness of a
14
shelter is defined by x, the number of hits required to kill
the shelter. The spread of the shelters is defined by m, the
number of cells in the target area (many of the cells will
just be empty spaces between the shelters).
1. Hardening the Shelters
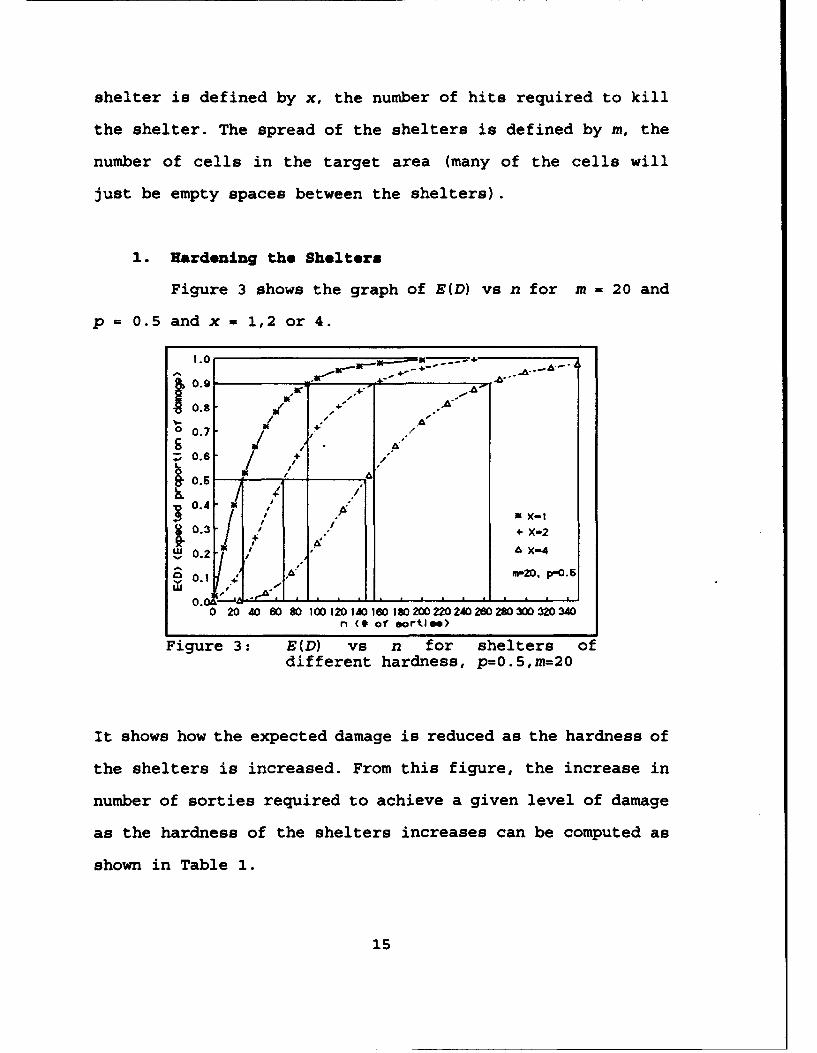
Figure 3 shows the graph of E(D) vs n for m - 20 and
p = 0.5 and x - 1,2 or 4.
1.0 , •-"
0.6 " .+.•
/ +/
0.4 "/ i N X-t
0 .3 4/J + X-
I I
A M-20. p-0.C 0.1 4 "
-I - " x
0 20 40 60 80 100120140160180200220240260280300320340n (0 of" sortie.)
Figure 3: E(D) vs n for shelters ofdifferent hardness, p=0.5,mn=20
It shows how the expected damage is reduced as the hardness of
the shelters is increased. From this figure, the increase in
number of sorties required to achieve a given level of damage
as the hardness of the shelters increases can be computed as
shown in Table 1.
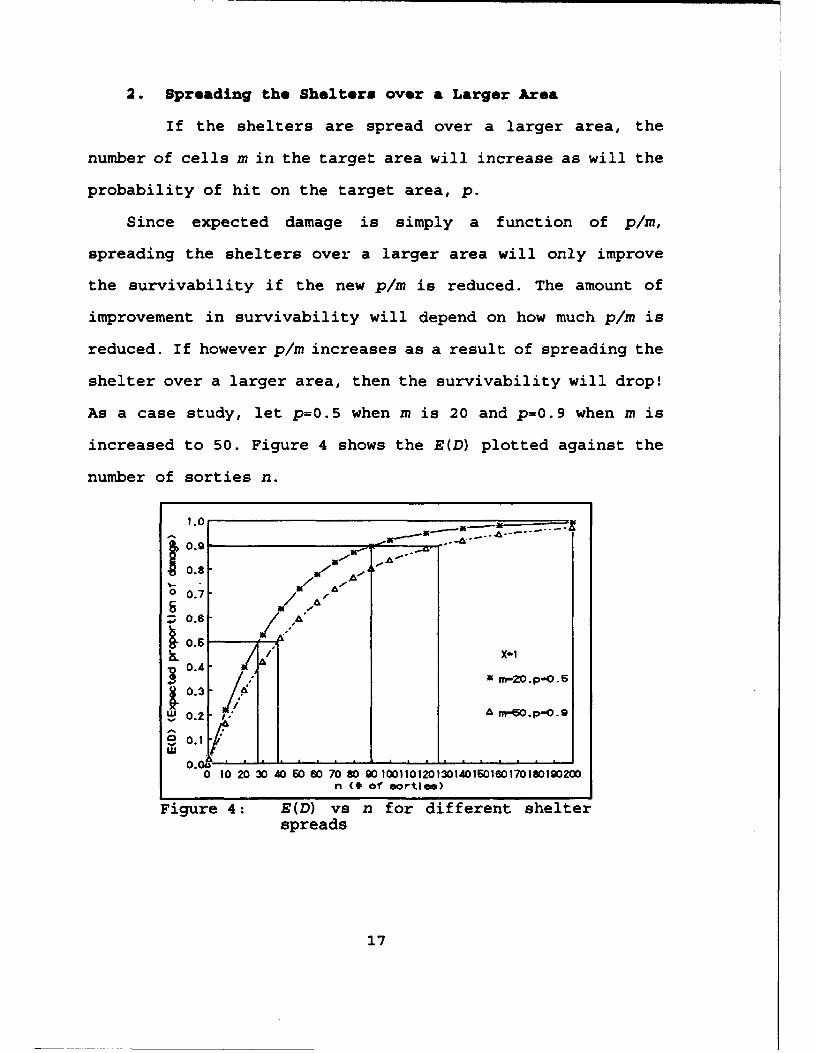
15
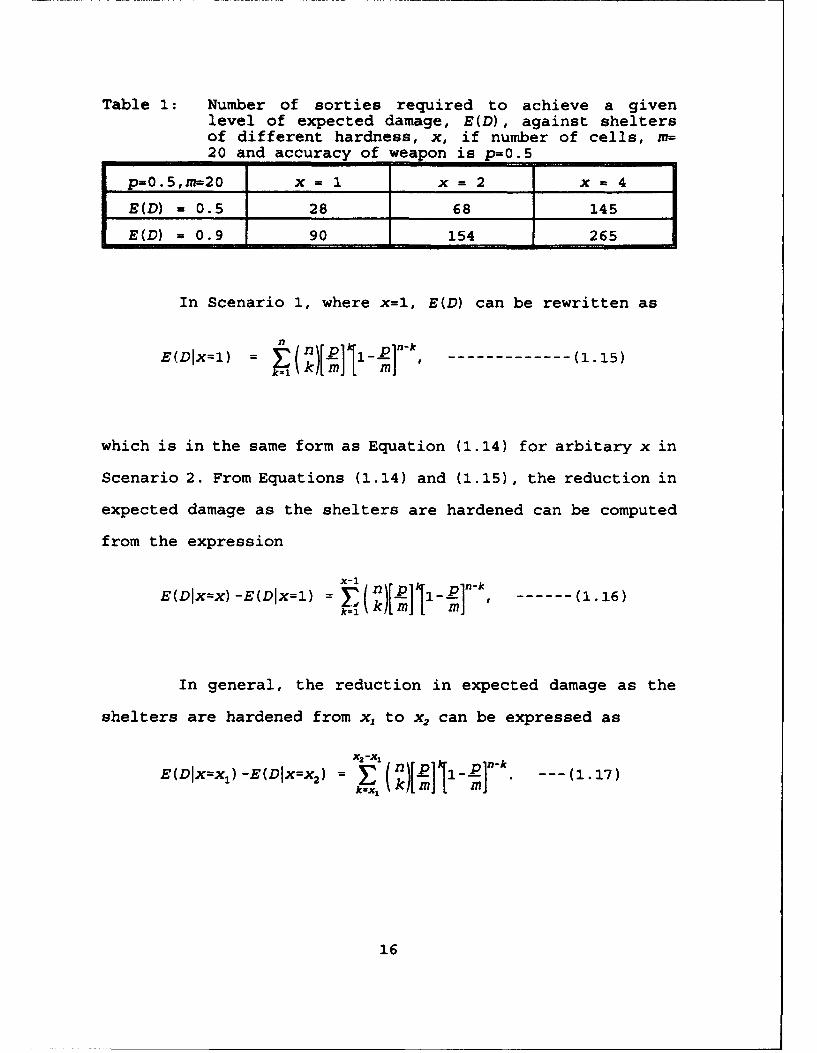
Table 1: Number of sorties required to achieve a givenlevel of expected damage, E(D), against sheltersof different hardness, x, if number of cells, m=20 and accuracy of weapon is p=0.5I p-0.5,m=20 x = 1 x = 2 x = 4
E(D) = 0.5 28 68 145
E(D) = 0.9 90 154 265
In Scenario 1, where x=1, E(D) can be rewritten as
E(Dlx=l) : •(i)[E2k1iE]k-- ------------- (1.15)
which is in the same form as Equation (1.14) for arbitary x in
Scenario 2. From Equations (1.14) and (1.15), the reduction in
expected damage as the shelters are hardened can be computed
from the expression
E(DIx=x) -E(Dlx=1) = ([ ]------- (1.16)
In general, the reduction in expected damage as the
shelters are hardened from x, to x2 can be expressed as
x2 -x1
E(DIx=x1 )-E(Dlx=x2 ) = X (n)[.2]'{_--].-k --- (1.17)I~x kL mL m]x1
16
2. Spreading the Shelters over a Larger Area
If the shelters are spread over a larger area, the
number of cells m in the target area will increase as will the
probability of hit on the target area, p.
Since expected damage is simply a function of p/m,
spreading the shelters over a larger area will only improve
the survivability if the new p/m is reduced. The amount of
improvement in survivability will depend on how much p/m is
reduced. If however p/m increases as a result of spreading the
shelter over a larger area, then the survivability will drop!
As a case study, let p=0.5 when m is 20 and p=0.9 when m is
increased to 50. Figure 4 shows the E(D) plotted against the
number of sorties n.
S0.0"9w•
0.800.7 m A
0.60. X-10.4
0.3- m-ZQ.p-,.5
S0.3 /- A m-O.pO.9
0.1kUi 0.0 .. ' , I . . . , . . . I . . . . . . ,
0 10 20 30 40 60 60 70 80 90 1001101201301401601W070180190200n (# of sortile>
Figure 4: E(D) vs n for different shelterspreads
17
It shows how the expected damage is reduced as the shelters
are spread over a larger area. From this figure the increase
in number of sorties required to achieve a given level of
damage as the shelters are spread over a larger area can be
computed as shown in Table 2
Table 2: Number of sorties required to achieve a givenlevel of expected damage, E(D), against sheltersof different shelter spreads as defined by thenumber of cells m and the hit probability p if thehardness of each shelter is x=1
x=1 p=0.5,m=20 p=0.9,m=50
E(D) = 0.5 28 68
E(D) = 0.9 90 154
3. Spread vs Hardening of Shelters
Since it is not possible to increase the hardness of
the shelters infinitely and neither is it possible to spread
the shelters over a infinitely large area, there will be upper
bounds on x and m. As a case study, let x=1, m=20, and p=0.5.
Two possible defender's strategies are examined:
(1) Increase hardness of all shelters to x=2, and
(2) Increase the shelter spread by 50% from m=20
to m=30 whereby in so doing, p increases from
0.5 to 0.6.
From Figure 5, increasing hardness to x=2 is a better
option since E(D) is lower for a given number of sorties if
p=0.6 for m=30. Even if the probability of hit stays at 0.5
18
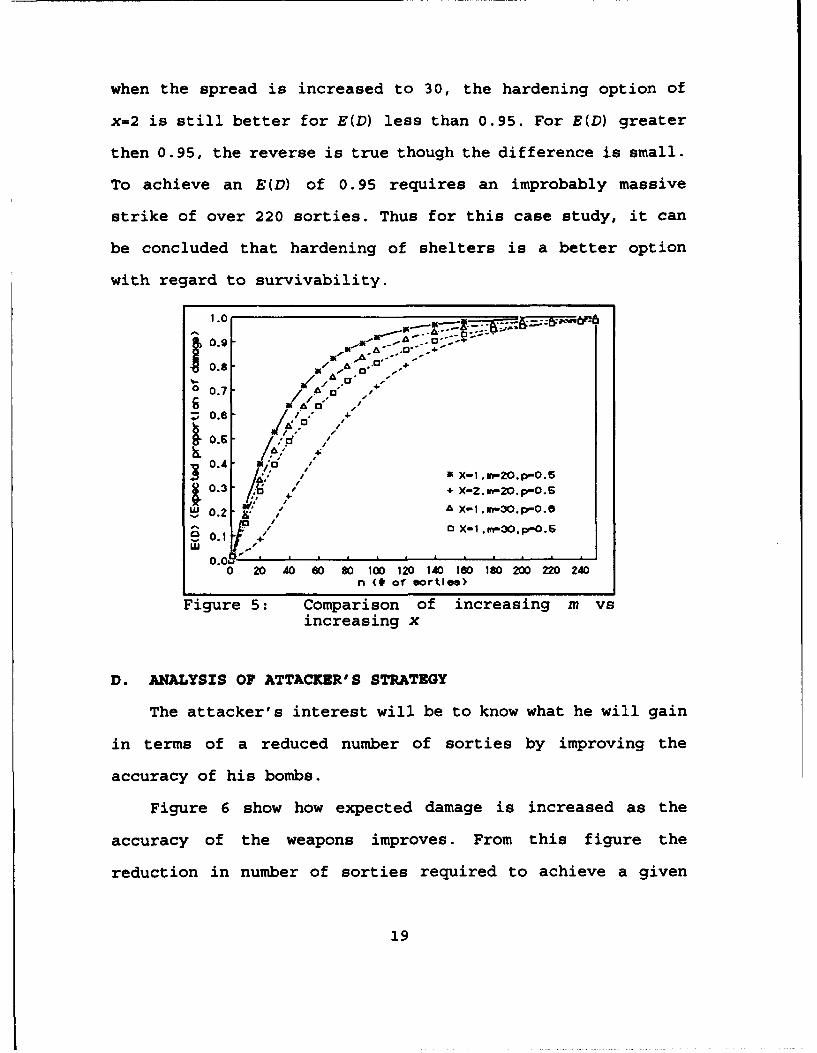
when the spread is increased to 30, the hardening option of
x=2 is still better for E(D) less than 0.95. For E(D) greater
then 0.95, the reverse is true though the difference is small.
To achieve an E(D) of 0.95 requires an improbably massive
strike of over 220 sorties. Thus for this case study, it can
be concluded that hardening of shelters is a better option
with regard to survivability.
1.0
0.9./ / A .0 -
0.u/ A , 4
*A °
A"
16 4:S0.4 ,-,o . X-.-20.P-0.5
0.3+0.3 /+c I, + X-2.m-20.p-0.6
0. c ' A X-I .m-3.p-0.O
0 X-1 .m-30,pP-0.60.1 +
0.0 , - A - L -
0 20 AO 60 80 100 120 140 180 180 200 220 240n (I0 of sorties)
Figure 5: Comparison of increasing m vsincreasing x
D. ANALYSIS OF ATTACKER'S STRATEGY
The attacker's interest will be to know what he will gain
in terms of a reduced number of sorties by improving the
accuracy of his bombs.
Figure 6 show how expected damage is increased as the
accuracy of the weapons improves. From this figure the
reduction in number of sorties required to achieve a given
19
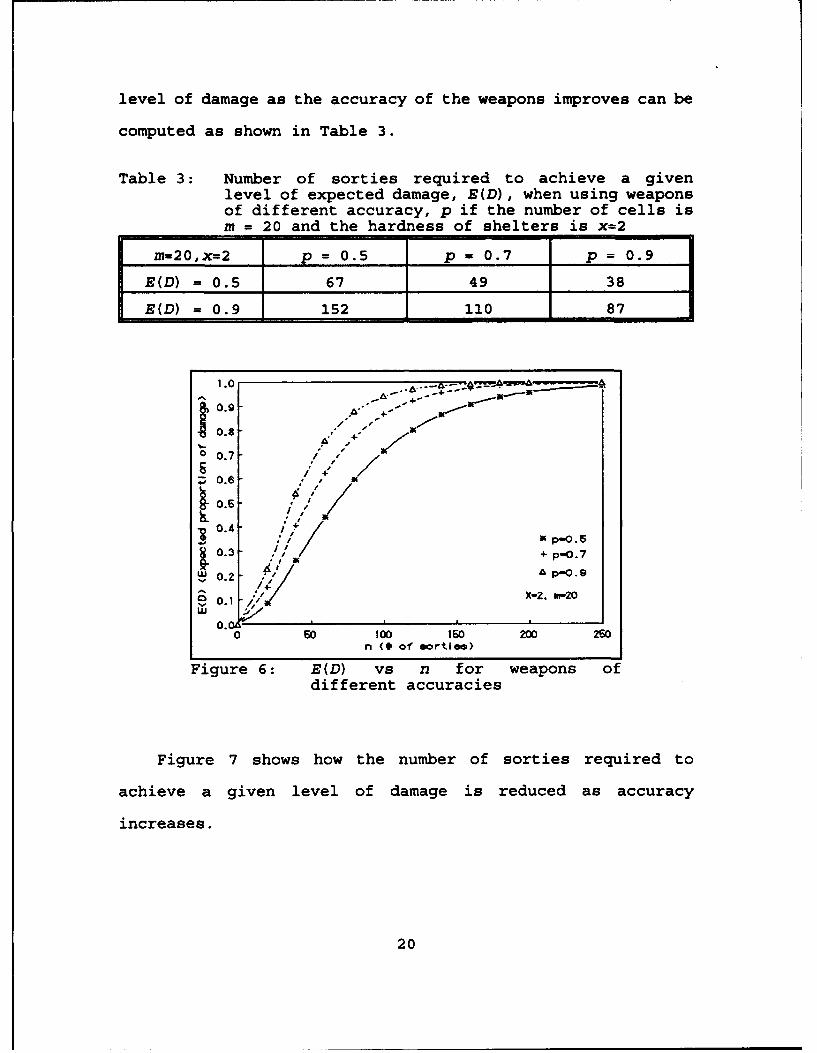
level of damage as the accuracy of the weapons improves can be
computed as shown in Table 3.
Table 3: Number of sorties required to achieve a givenlevel of expected damage, E(D), when using weaponsof different accuracy, p if the number of cells ism = 20 and the hardness of shelters is x=2
m=20,x=2 p = 0.5 p = 0.7 p = 0.9
E(D) = 0.5 67 49 38
E(D) = 0.9 152 110 87
1.0 .
0.9/o 0.7 9 "
'0.7o, -
80.6 '
0.1 //�•XZ. m-20
0.,
0 60 100 16o 200 2O0n (0 of sortie.>
Figure 6: E(D) vs n for weapons ofdifferent accuracies
Figure 7 shows how the number of sorties required to
achieve a given level of damage is reduced as accuracy
increases.
20
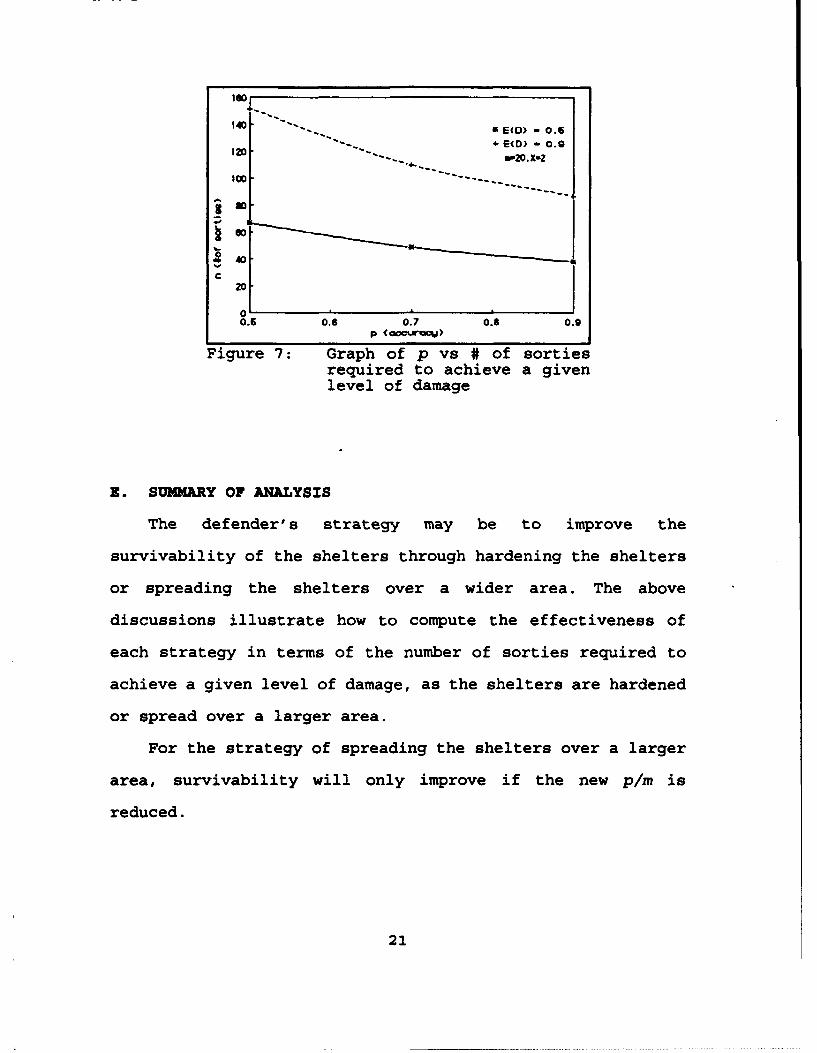
140 - s*E(D) - 0.5I E(D) - 0.0
&P2.0-
C
0.0.6 0.7 0.8 0.p (aoua•)
Figure 7: Graph of p vs # of sortiesrequired to achieve a givenlevel of damage
K. SUMMARY OF ANALYSIS
The defender's strategy may be to improve the
survivability of the shelters through hardening the shelters
or spreading the shelters over a wider area. The above
discussions illustrate how to compute the effectiveness of
each strategy in terms of the number of sorties required to
achieve a given level of damage, as the shelters are hardened
or spread over a larger area.
For the strategy of spreading the shelters over a larger
area, survivability will only improve if the new p/r is
reduced.
21
The above discussions also illustrate how the option of
hardening or spreading the shelters may be compared using the
mathematical models derived.
From the attacker's point of view, the effectiveness of
increasing weapons accuracy on the number of sorties required
to achieve a given level of damage may be readily computed, as
illustrated in the preceeding discussion.
In the same manner, Chapter IV will examine the artillery
attack Scenario 2.
22
IV SCENARIO 2
Scenario 2 is an artillery attack scenario in which each
shell will hit the target independently with a probability p
and is equally likely to hit any region in the target area.
Each shelter is assigned an arbitrary weight. Since the shell
is small in comparison to the size of the shelter, each
artillery shell will only damage a small section of the
shelter. Two kill criteria are examined:
Kill Criteria 1: One hit on any section of the shelter is
sufficient to kill the shelter, and
Kill Criteria 2: x hits on the same section (any section)
of the shelter are required to kill the
shelter.
The bomb dump target is cellular with m cells. Each
shelter is assumed to occupy one cell. Each cell is in turn
divided into a subcells or subsections. For a target area, the
number of possible subcells m times a is constant.
A. KILL CRITERIA 1: ONE SHELL HIT ON ANY SECTION TO KILL A
SHELTER
For the first kill criteria, any hit on the shelter will
kill the shelter. This is essentially the same as Scenario 1,
under its Kill Criteria 1.
23
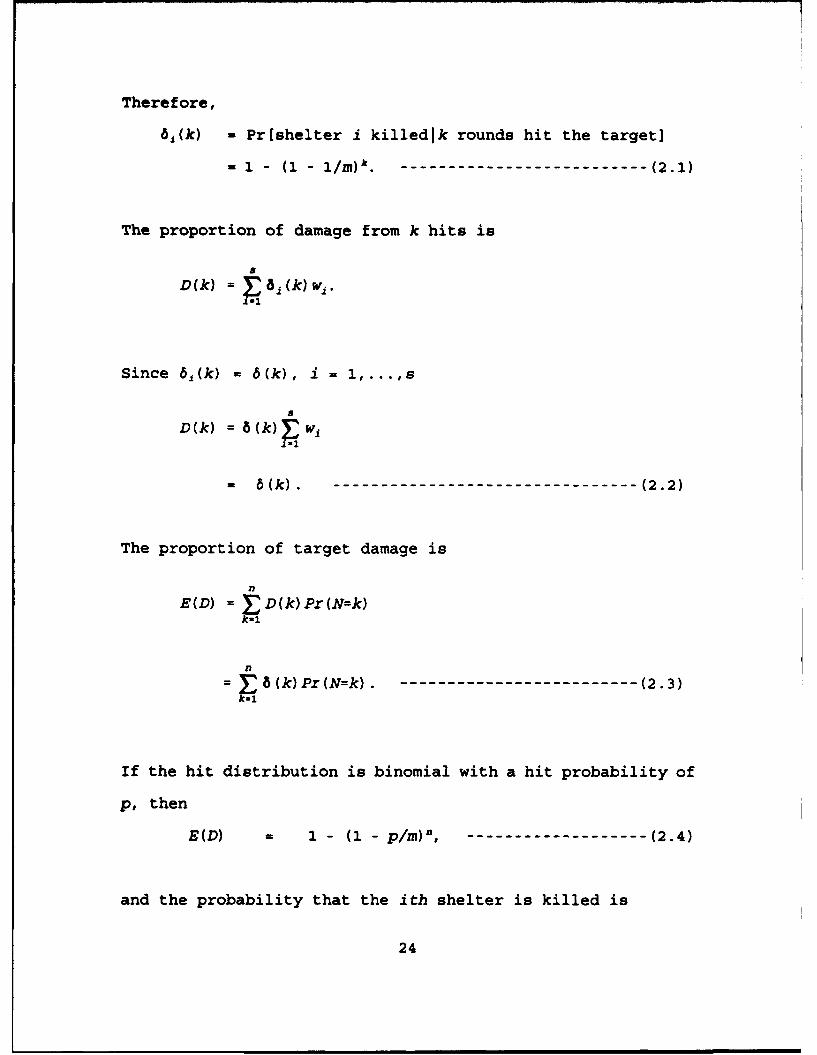
Therefore,
6,(k) = Pr(shelter i killedlk rounds hit the target]
= 1 - (1 - 1/m)k ----------------------------- (2.1)
The proportion of damage from k hits is
D(k) =T .82 (k) w2 .
Since 6,(k) = 6(k), i ,
D(k) = 6(k) •. 1
= 6(k). - -------------------------------- (2.2)
The proportion of target damage is
E(D) T. D(k)Pr(N=k)
nn 8(k)Pr(N=k) - ----------------- (2.3)
If the hit distribution is binomial with a hit probability of
p, then
E(D) U 1 - (i - p/m)", -------------------- (2.4)
and the probability that the ith shelter is killed is
24
n
PKl = j.1 (k)Pr(N=k) = E(D) = 1-(1-p/m)n. -------- (2.5)
Again from Equation 2.5, the probability of kill for shelter
i is equal to the expected damage to the dump from n bombs and
is not dependent on the relative weight of each shelter w.
This is true regardless of the hit probability distribution
Pr(N-k), k-o,1,...,n. The only condition for PK, to be the
same as the expected damage E(D) is for the 6.(k)'s to be the
same for each shelter i and this will be true if each shelter
is of the same size and a bomb that hits the target is equally
likely to hit any shelter in the dump.
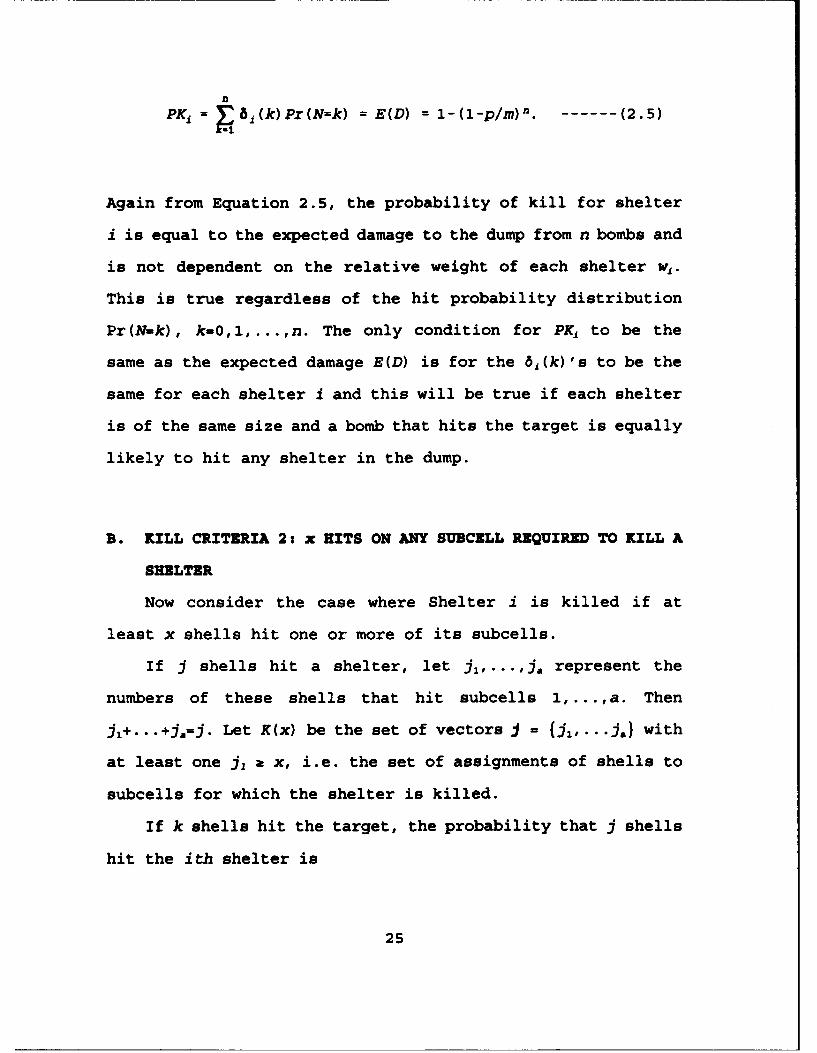
B. KILL CRITERIA 2: x HITS ON ANY SUBCELL REQUIRED TO KILL A
SHELTER
Now consider the case where Shelter i is killed if at
least x shells hit one or more of its subcells.
If j shells hit a shelter, let Jl,...,J. represent the
numbers of these shells that hit subcells 1,...,a. Then
j,+...+j.=j. Let K(x) be the set of vectors J - {j, .... j) with
at least one j, & x, i.e. the set of assignments of shells to
subcells for which the shelter is killed.
If k shells hit the target, the probability that j shells
hit the ith shelter is
25
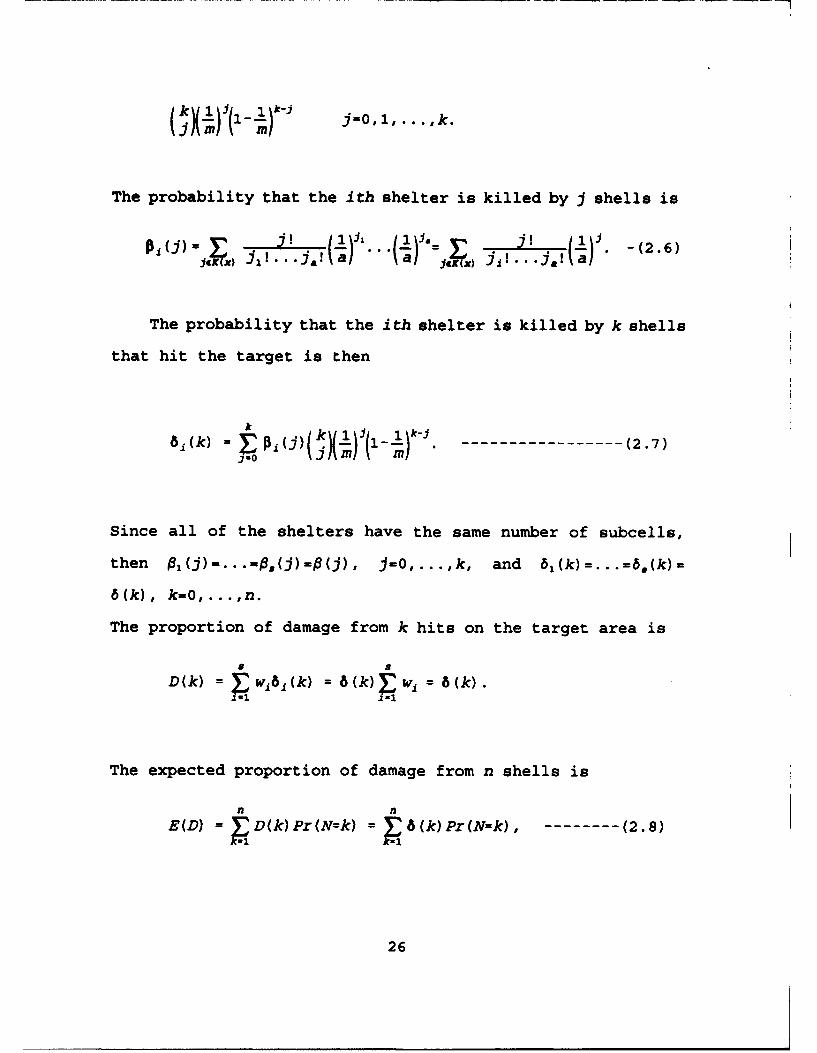
The probability that the ith shelter is killed by j shells is
~ 1aI 6P J .ja! aI -(2.6)
The probability that the ith shelter is killed by k shells
that hit the target is then
k k-
8i (k) 1: P ()( X-)(-)-- -------------------(2.7)
Since all of the shelters have the same number of subcells,
then P(j)-...-P.(j)=#(j), j-O,...,k, and 61 (k)= ... 6,(k)-
6(k), k-o,...,n.
The proportion of damage from k hits on the target area is
D (k) w.8 • Wik := 6(k)Z w. = 6(k)
The expected proportion of damage from n shells is
n nE(D) = D(k) Pr(N=k) = 8 (k) Pr(N=k) ,- -------- (2.8)
k-I
26
The probability of shelter i being killed is
n n2
PK1 = ~81 (k) Pr (N=k) T ~8(k) Px (N=k) -.------- (2.9)
nk
Reversing the order of summation,
PK = E (D) .. ~~)()(_1)i(l1)kij(nflp k(1-p) n-k.
Let r-k-j. Then
PK2 E E(D) = ni-kill_ I~--i!_p 1-pJE.O' k P()E31(-* m k(n-k)!
=P(j) * (n- (p) [(1-mi" ( -) -
0 n-~ m j(k-j) ! (n-k)! 1)m(n
27
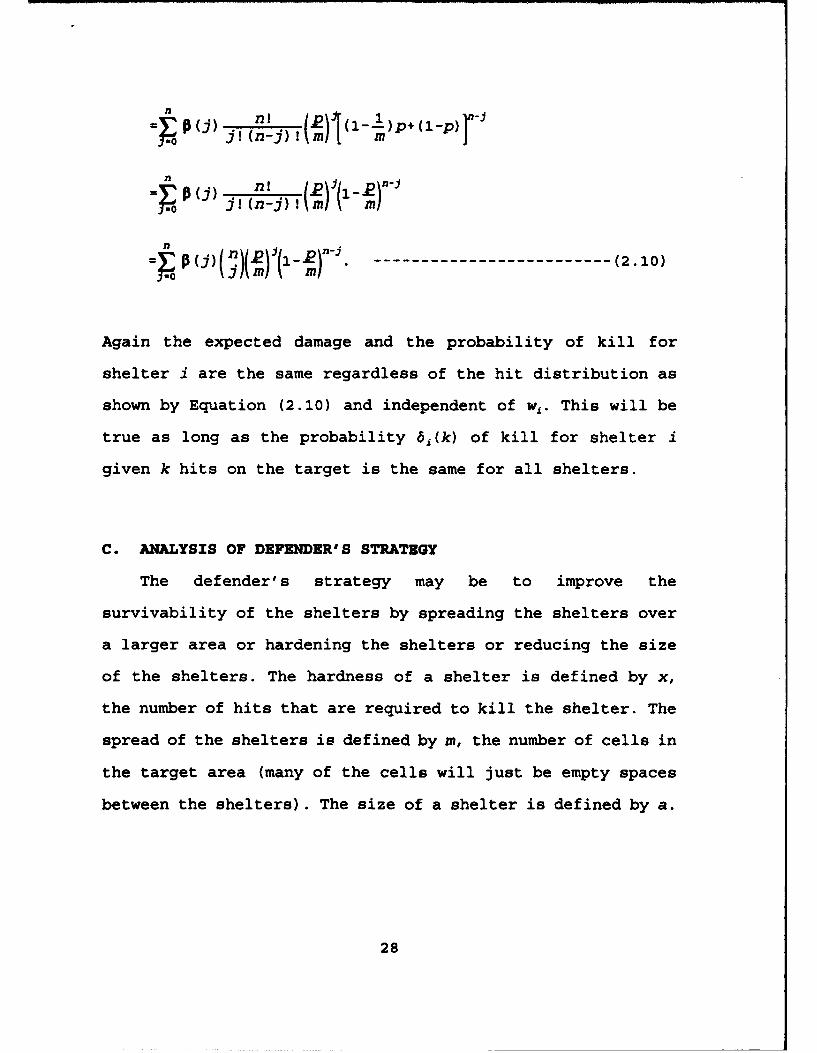
(j (n-j) ! m [mon j, (n-!)!
n=•P (P (3A.n'l•ll-j l-" ! m2 lO
Again the expected damage and the probability of kill for
shelter i are the same regardless of the hit distribution as
shown by Equation (2.10) and independent of w.. This will be
true as long as the probability 6,(k) of kill for shelter i
given k hits on the target is the same for all shelters.
C. ANALYSIS OF DEFENDER'S STRATEGY
The defender's strategy may be to improve the
survivability of the shelters by spreading the shelters over
a larger area or hardening the shelters or reducing the size
of the shelters. The hardness of a shelter is defined by x,
the number of hits that are required to kill the shelter. The
spread of the shelters is defined by m, the number of cells in
the target area (many of the cells will just be empty spaces
between the shelters). The size of a shelter is defined by a.
28
1. Hardening the Shelters
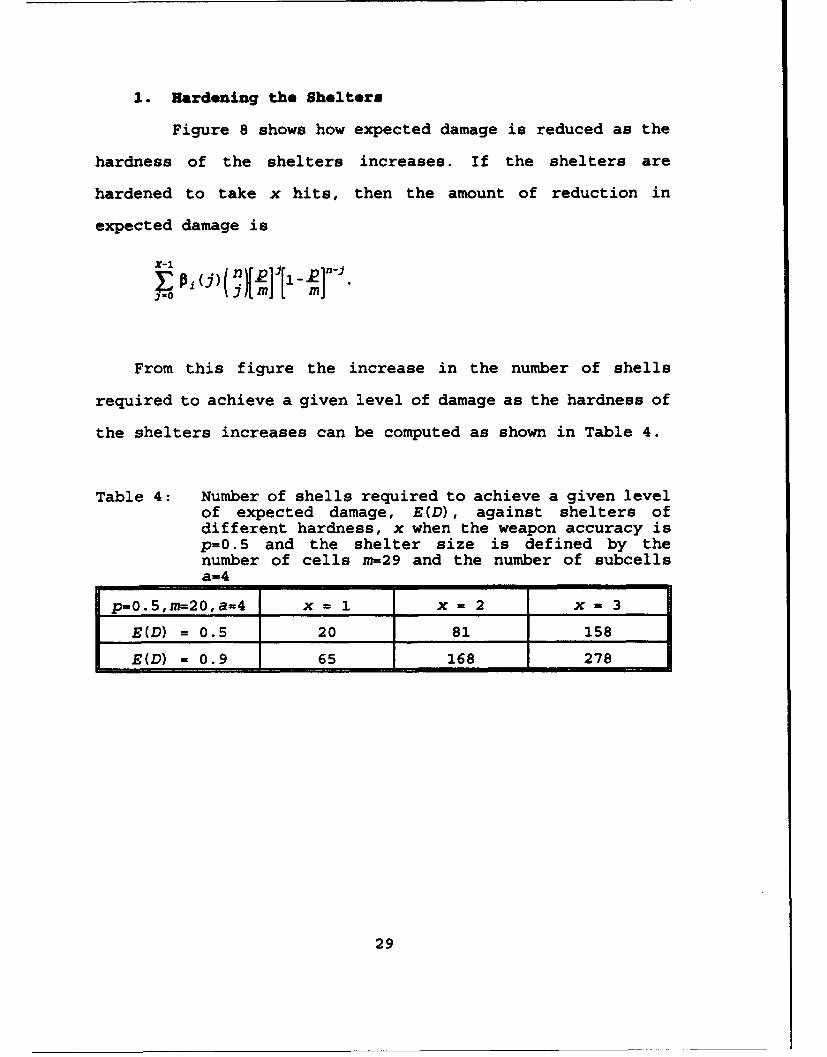
Figure 8 shows how expected damage is reduced as the
hardness of the shelters increases. If the shelters are
hardened to take x hits, then the amount of reduction in
expected damage is
X-1 jj (n[2 [1 n-
From this figure the increase in the number of shells
required to achieve a given level of damage as the hardness of
the shelters increases can be computed as shown in Table 4.
Table 4: Number of shells required to achieve a given levelof expected damage, E(D), against shelters ofdifferent hardness, x when the weapon accuracy isp=0.5 and the shelter size is defined by thenumber of cells m=-29 and the number of subcellsa=4
p=0.5,m=-20,a=4 x = 1 x - 2 x = 3
E(D) = 0.5 20 81 158E(D) = 0.9 65 168 278
29
1.0
0.9 _ _ _ _ __ _ 4.--5...... -
0.4.
007A
,h /I A"
L/ ,1°o I
0 0.7/4:
0.2 A X-
ILI
.0.3~'~ ~ w-___0._ ___ -___ _. _ 7,0 4 -
0 16 30 A6 0 76 g 1C6120136601861801052102262A0262706300n (* of orties)
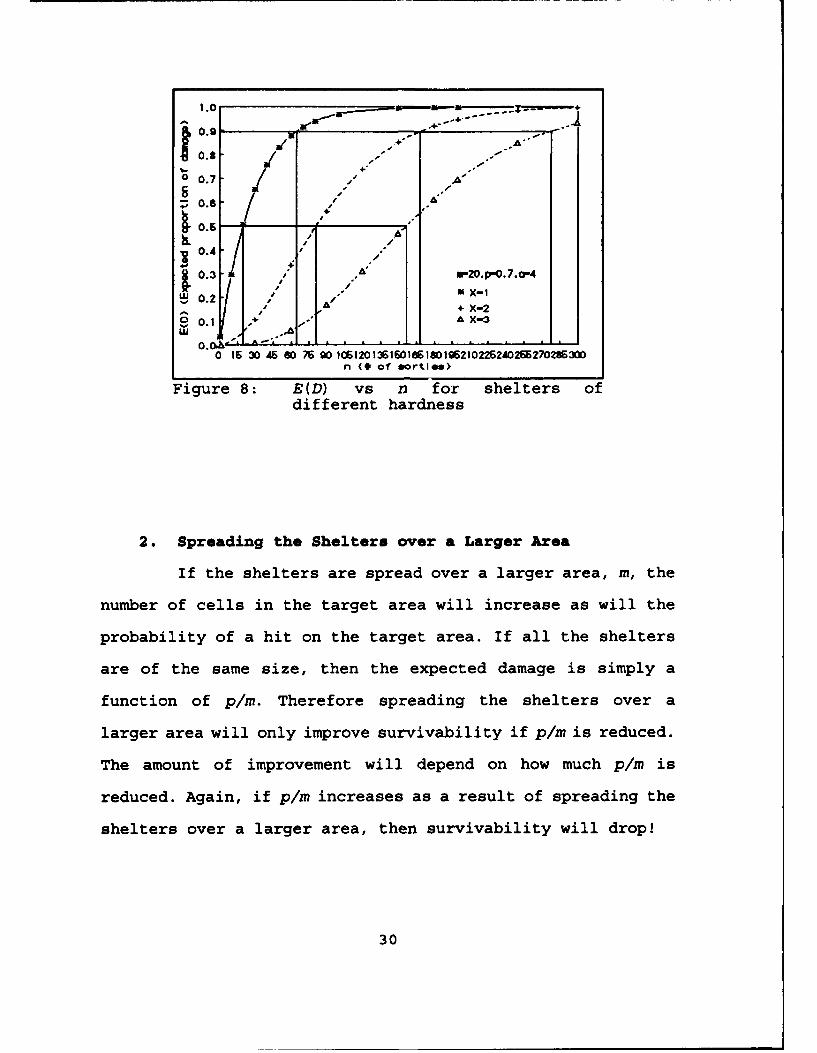
Figure 8: E(D) vs n for shelters ofdifferent hardness
2. Spreading the Shelters over a Larger Area
If the shelters are spread over a larger area, m, the
number of cells in the target area will increase as will the
probability of a hit on the target area. If all the shelters
are of the same size, then the expected damage is simply a
function of p/m. Therefore spreading the shelters over a
larger area will only improve survivability if p/m is reduced.
The amount of improvement will depend on how much p/m is
reduced. Again, if p/m increases as a result of spreading the
shelters over a larger area, then survivability will drop!
30
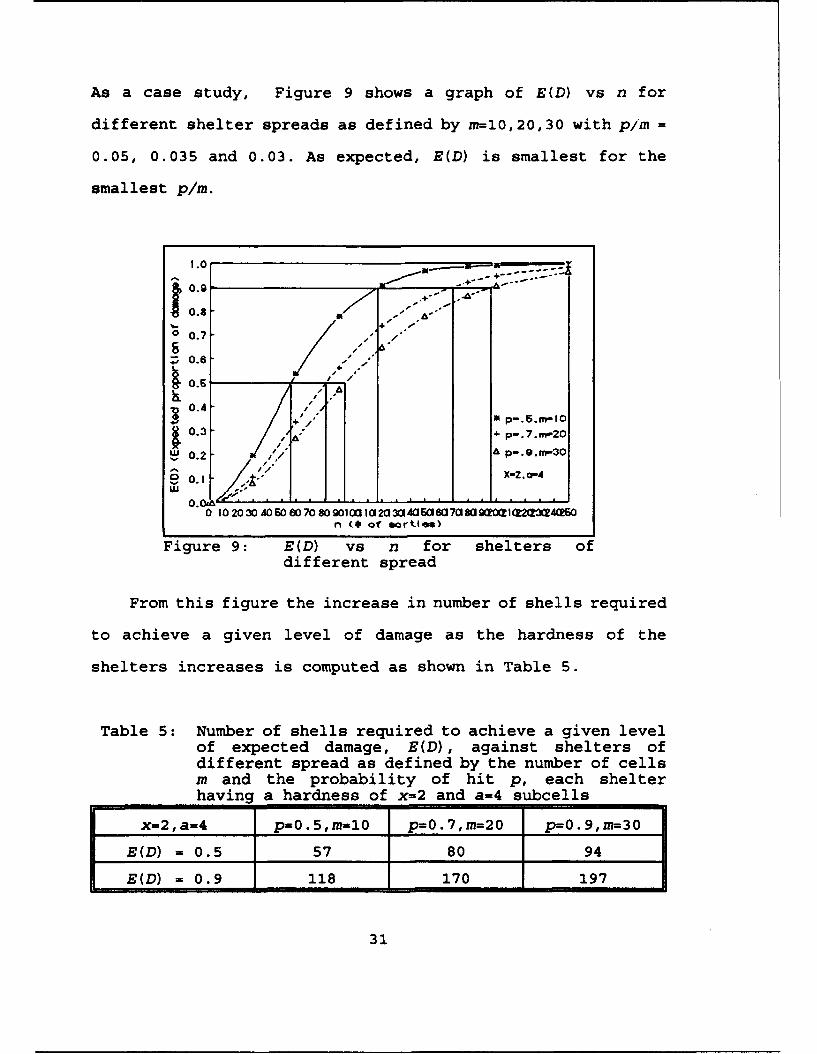
As a case study, Figure 9 shows a graph of E(D) vs n for
different shelter spreads as defined by m=10,20,30 with p/m =
0.05, 0.035 and 0.03. As expected, E(D) is smallest for the
smallest p/m.
1.0 7n
0.8/ - ,"
0.7 "
0.6
0.4 ÷J/, mp-.5.M-IO
0.3 + - 4 p-.7.m-20
0.2 A p-.9.m-30
O-'' X-Z. a-4
0 10 20 30 40 60 60 70 80 90100 10 0 30140 6010 7a010 9MM0• I 2=o( 0n (# of .orte*)
Figure 9: E(D) vs n for shelters ofdifferent spread
From this figure the increase in number of shells required
to achieve a given level of damage as the hardness of the
shelters increases is computed as shown in Table 5.
Table 5: Number of shells required to achieve a given levelof expected damage, E(D), against shelters ofdifferent spread as defined by the number of cellsm and the probability of hit p, each shelterhaving a hardness of x=2 and a=4 subcells
x=2,a=4 p=0.5,m=10 p=0.7,rm=20 p=0.9,m=-30
E(D) = 0.5 57 80 94
E(D) = 0.9 118 170 197
31
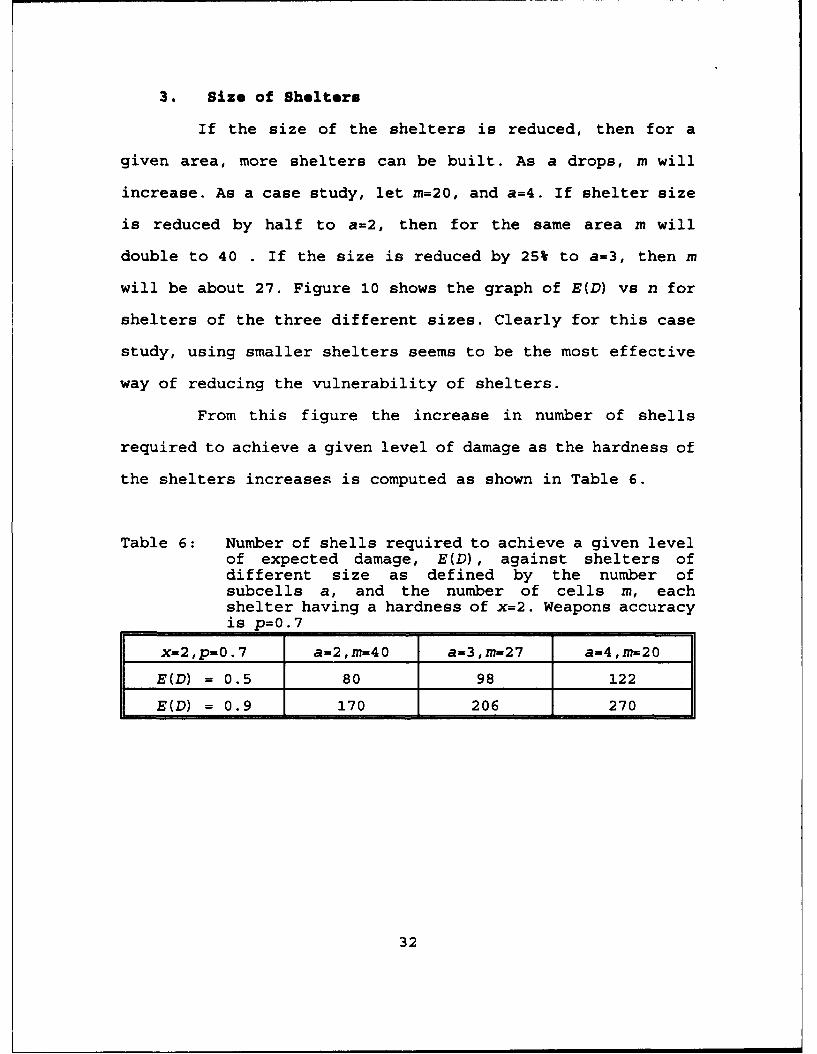
3. Size of Shelters
If the size of the shelters is reduced, then for a
given area, more shelters can be built. As a drops, m will
increase. As a case study, let m=20, and a=4. If shelter size
is reduced by half to a=2, then for the same area m will
double to 40 . If the size is reduced by 25% to a=3, then m
will be about 27. Figure 10 shows the graph of E(D) vs n for
shelters of the three different sizes. Clearly for this case
study, using smaller shelters seems to be the most effective
way of reducing the vulnerability of shelters.
From this figure the increase in number of shells
required to achieve a given level of damage as the hardness of
the shelters increases is computed as shown in Table 6.
Table 6: Number of shells required to achieve a given levelof expected damage, E(D), against shelters ofdifferent size as defined by the number ofsubcells a, and the number of cells m, eachshelter having a hardness of x=2. Weapons accuracyis p=0. 7
x=2,p=0.7 a=2,m=40 a=3,m=27 a=4,m=20
E(D) = 0.5 80 98 122
E(D) = 0.9 170 206 270
32
1.0
0.g
0.8 X-2.pQ.7 7+ m%-20.-4 ,,
o0.7 A tm-27. c-O /.7 m m-40.a2 / ,
0.6,'/ -
0.4 / ,
0.3
' -'
0.2 ,, ,
e0.10.0W• . ...
.
0 20 40 I0 80 100 120 140 160 180 200 220 240 2 M 0 300n (0 of eortle)
Figure 10: E(D) vs n for shelters ofdifferent size
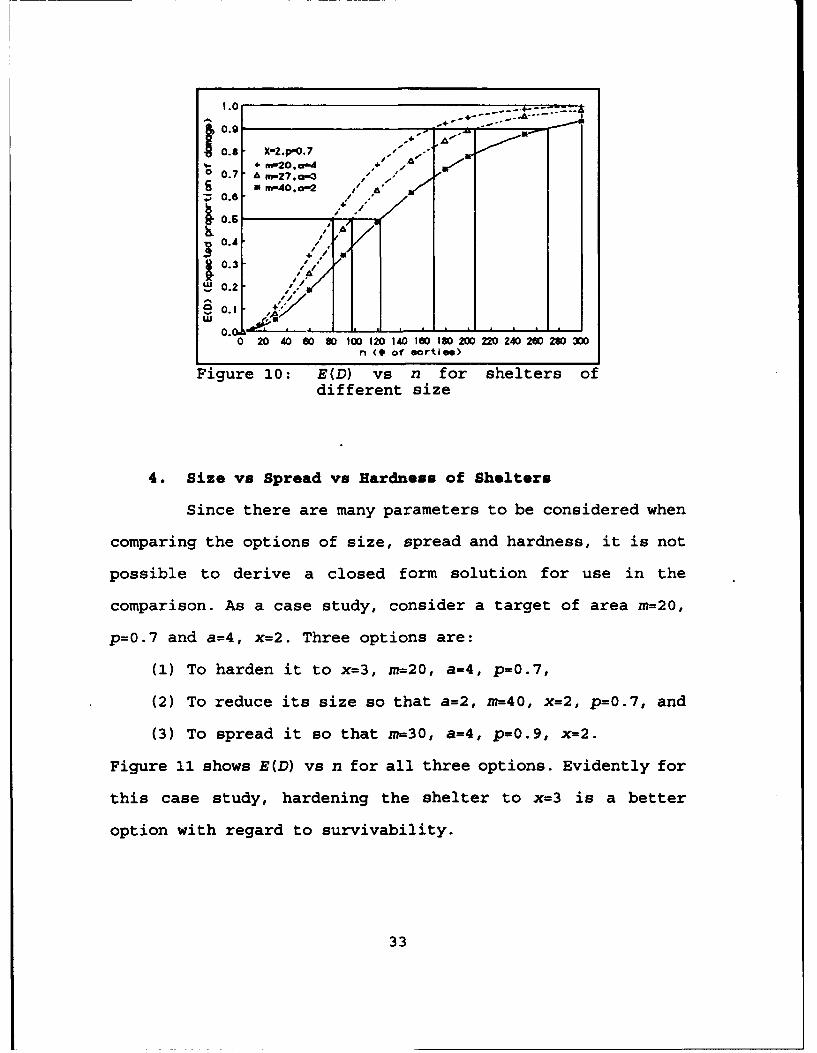
4. Size vs Spread vs Hardness of Shelters
Since there are many parameters to be considered when
comparing the options of size, spread and hardness, it is not
possible to derive a closed form solution for use in the
comparison. As a case study, consider a target of area m=20,
p=0.7 and a=4, x=2. Three options are:
(1) To harden it to x=3, m=20, a=4, p=0.7,
(2) To reduce its size so that a=2, m=40, x=2, p=0.7, and
(3) To spread it so that m=30, a=4, p=0.9, x=2.
Figure 11 shows E(D) vs n for all three options. Evidently for
this case study, hardening the shelter to x=3 is a better
option with regard to survivability.
33
1.0
00.7
rc
~0.4
0^ -°II---'
0.3/ ii o ,40.X2.p .7.2W0.2 / / IN m-. "X-2. P-0. .- 4
+/ - -20.X-2.p-0.7.c-4e 0.1 4 " A m-20.X-3.p-0.7.o-4LU o" I..• . ." .I
0.0;00 20 40 60 80 100 120 140 16 180 200 220 240 260 280 300
n (0 of eortls)
Figure 11: E(D) vs n for shelters ofdifferent size, spread andhardness
D. ANALYSIS OF ATTACKER'S STRATEGY
For the attacker, the immediate interest is to know how
improving accuracy affects performance. Figure 12 and
Figure 13 show how improving the accuracy of the weapons will
improve expected damage for a given number of shells used.
From these figures the increase in number of shells
required to achieve a given level of damage as the accuracy of
the weapons increases is computed as shown in Table 7.
34
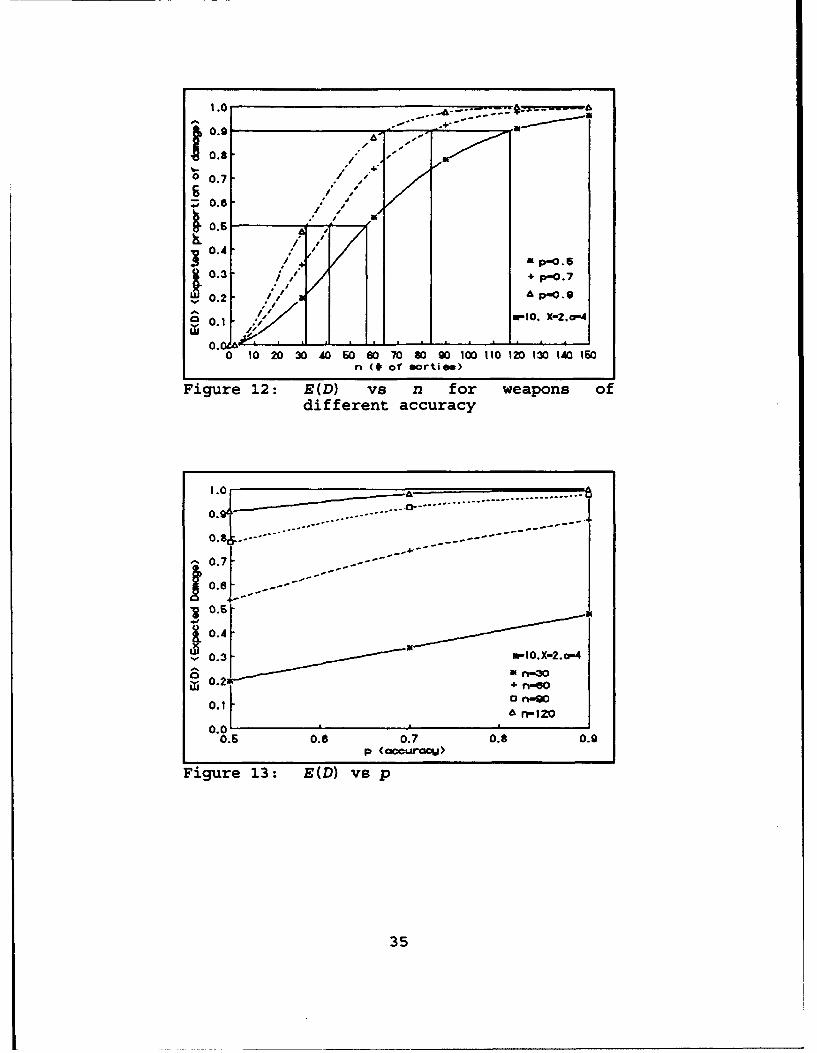
-%-.-" ÷..*- - - u, •
0.5 / .
O., 4.
0.40 / '
0..3 p-0.i
*'+s p/0. , A p-0O. _
0 I ,//• . w10. X-2,a-4
0 10 20 30 AO 60 80 70 80 90 100 110 120 130 140 1 GOn (0l of' eortice)
Figure 12 : E (D) vs n f or weapons ofdifferent accuracy
0.7
0.6 .....-. .
0.6-
0.4 *
0.3' 1 40.X-p.o-
,j 0.2 + rAp-O
0.01 an-W
Sn-1200.0 ' ' >
0.6 0.8 0.7 0.9 0.9
Figure 13: E(D) vs p
35
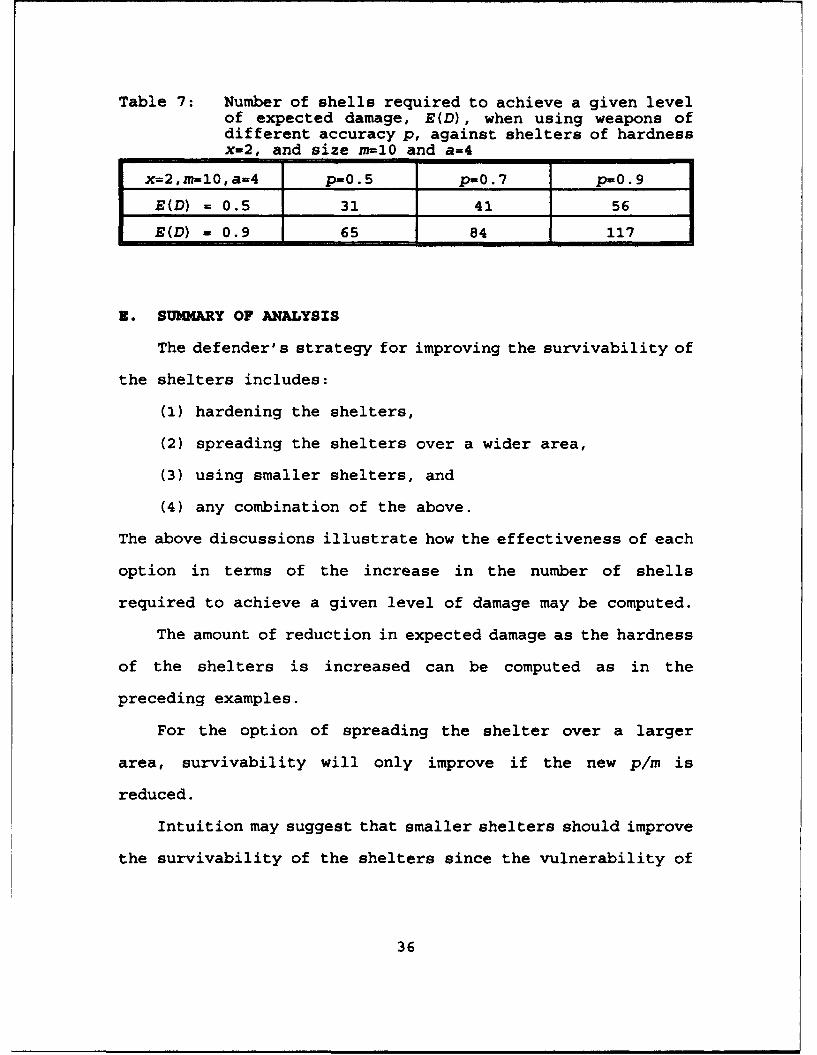
Table 7: Number of shells required to achieve a given levelof expected damage, E(D), when using weapons ofdifferent accuracy p, against shelters of hardnessx-2, and size m-10 and a-4
Ix=2,rm-10,a-4 p=0.5 p=0.7 p=0.9
E(D) - 0.5 31 41 56
E(D) - 0.9 65 84 117
Z. SMOIARY OF ANALYSIS
The defender's strategy for improving the survivability of
the shelters includes:
(1) hardening the shelters,
(2) spreading the shelters over a wider area,
(3) using smaller shelters, and
(4) any combination of the above.
The above discussions illustrate how the effectiveness of each
option in terms of the increase in the number of shells
required to achieve a given level of damage may be computed.
The amount of reduction in expected damage as the hardness
of the shelters is increased can be computed as in the
preceding examples.
For the option of spreading the shelter over a larger
area, survivability will only improve if the new p/m is
reduced.
Intuition may suggest that smaller shelters should improve
the survivability of the shelters since the vulnerability of
36

the shelters is in a sense spread out. The model presented in
Scenario 2 provides a means of investigating this possibility.
From the attacker's viewpoint, the effectiveness of
increasing weapons accuracy in terms of the reduction in
number of shells required to achieve a given level of damage
may be readily computed as illustrated in the above
discussions.
The next chapter will present a generalized shelter
hardness and vulnerability models resulting from the models
derived in Chapters III and IV, that can be use for more
realistic kill criteria based on engineering analysis of the
design of a shelter and the effects of the weapons to be
directed against it. In addition, useful conclusions
applicable to both models will be discussed.
37
V DISCUSSIONS
A. GENERALIZED SHELTER HARDNESS AND VULNERABILITY MODELLING
In Scenarios 1 and 2, E(D) and the PK, can be computed
from
n
E (D) = P14 P= ()pnj
where 0,(j) is the probability that shelter i is killed by j
hits on the target. For Scenario 1, Kill Criteria 1,
P,(0) = 0 and
P,(j -1, j a 1
for each shelter i = 1, . . . ,s. For Scenario 1, Kill Criteria 2,
p1(j) = 0, j x and
fli (j) 1, j a x
for each shelter. For Scenario 2, Kill Criteria 1, the P1(j) 's
are the same as in Scenario 1, Kill Criteria 1. For Scenario
2, Kill Criteria 2, the P1 (j)'s are computed using Equation
(2.6).
The preceding formulation and the examples of its
application point to the possibility of introducing other
shelter kill criteria based on engineering analysis of the
design of a shelter and the effects of the weapons to be
38
directed against it. The analysis would result in a shelter
hardness and vulnerability distribution P.(j), j=O,... which
could be used in the equation shown above, where as before,
f(j) is the probability that the ith shelter is killed by j
weapons that hit the shelter.
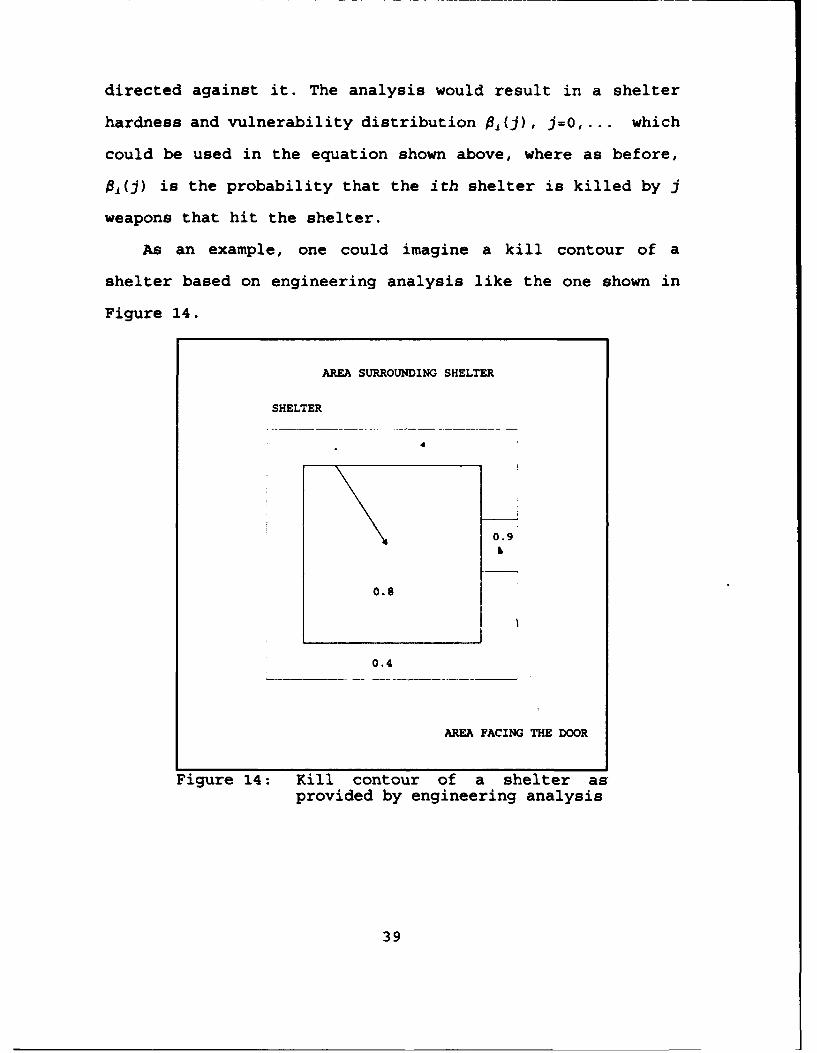
As an example, one could imagine a kill contour of a
shelter based on engineering analysis like the one shown in
Figure 14.
AREA SURROUNDING SHELTER
SHELTER
* 4
0.9
0.8
0.4
AREA FACING THE DOOR
Figure 14: Kill contour of a shelter asprovided by engineering analysis
39
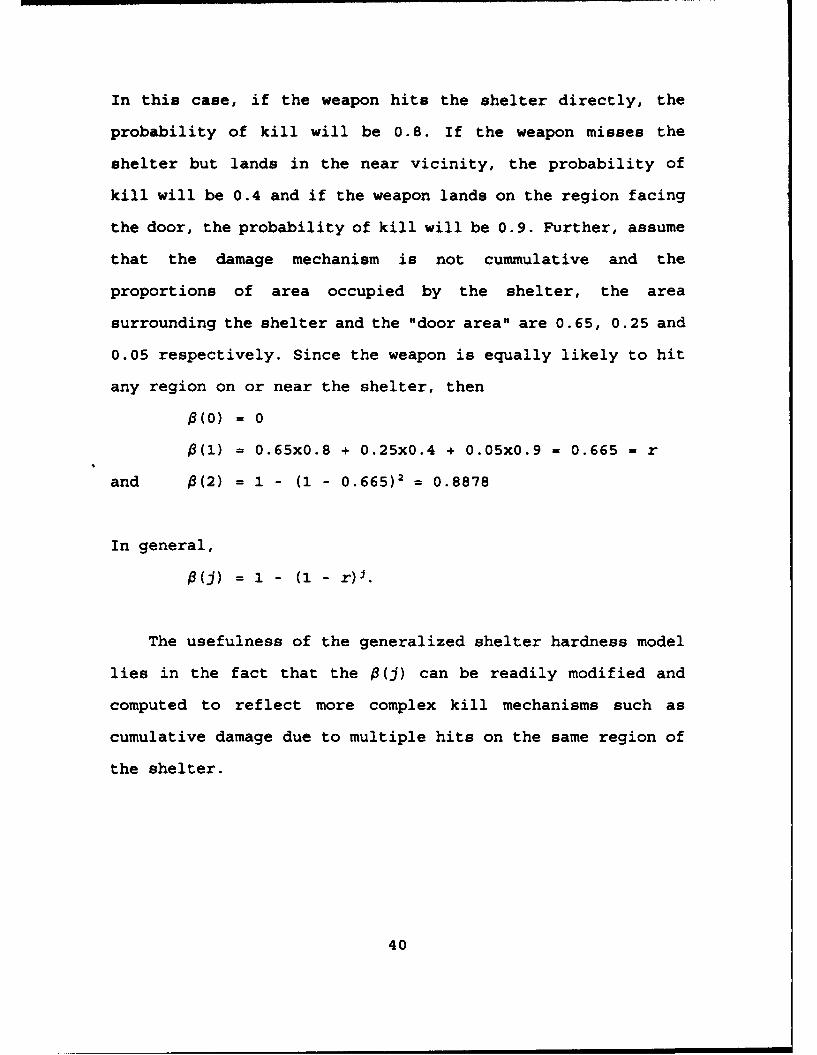
In this case, if the weapon hits the shelter directly, the
probability of kill will be 0.8. If the weapon misses the
shelter but lands in the near vicinity, the probability of
kill will be 0.4 and if the weapon lands on the region facing
the door, the probability of kill will be 0.9. Further, assume
that the damage mechanism is not cummulative and the
proportions of area occupied by the shelter, the area
surrounding the shelter and the "door area" are 0.65, 0.25 and
0.05 respectively. Since the weapon is equally likely to hit
any region on or near the shelter, then
6(0) = 0
P(1)= 0.65x0.8 + 0.25x0.4 + 0.05x0.9 = 0.665 = r
and P(2) = 1 - (1 - 0.665)2 = 0.8878
In general,
0 (j) = 1 - (1 - r).
The usefulness of the generalized shelter hardness model
lies in the fact that the P(j) can be readily modified and
computed to reflect more complex kill mechanisms such as
cumulative damage due to multiple hits on the same region of
the shelter.
40
B. CONDITIONS UNDER WHICH SHELTER PROBABILITY OF KILL AND
DUMP EXPECTED PROPORTION OF DAMAGE COINCIDE
In the models derived for Scenarios 1 and 2, weapons that
hit the dump impact uniformly over its target area. The
shelters within the dump are all of the same size and have the
same kill criteria. These symmetries in the attacks on the
shelters lead to the equalities
6,(k)-6,(k)-...=6.(k)- 6(k)
between the shelter kill probabilities 6,(k) ,6 2 (k), . .. ,6,(k) as
a result of k weapons that hit the dump, k=0,1,...,n, where n
is the number of weapons directed at the dump.
Taking the preceding equalities between conditional
shelter kill probabilities as a hypothesis, it follows that
the proportion of damage to the dump from k hits on the dump
is
BS S
D(k) = w.8 i(k) = j (k-) = 8(k) •w = 6(k),
k=O,1, ... ,n, where W,.., w, are the proportional value weights
assigned to the shelters. Then the expected proportion of
damage to the dump from the attack is
n nE(D) =,E D(k)Pr(N=k) = - 6(k)Pr(N=k).
41
where N is the number of hits on the dump.
Also, the probability that the ith shelter is killed by
the attack is
n n
P~j( = T61 Pr (N=k) T 6(W)Pr (N=k).
Thus the hypothesis 6 (k) =62 (k) .... 8 (k), k=O, . . .,n, leads
to the conclusions:
(1) The proportions of the dump damaged by k hits, D(k),
k=O, ... ,n and the expected proportion of the dump
damaged by the attack, E(D), do not depend on the
value weights w, i=1,.... s, assigned to the shelters,
and
(2) The shelter kill probabilities from the attack, PKj,
i=1,...,s, are all the same and equal to E(D), the
expected proportion of damage to the target.
The computational options offered by the second conclusion
are illustrated in the analyses of Scenarios 1 and 2 . For
Scenario 1, Kill Criteria 2, E(D) is arrived at by a direct
computation of PK., for a typical shelter. For Scenario 2, Kill
42
Criteria 2, the PKlCs are arrived at by a direct computation
of E(D), although the alternate option could be exercised.
43
VI CONCLUSIONS
The methodologies used to analyze Scenarios 1 and 2 can be
extended in a variety of ways to cover other scenarios.
Of particular interest is the possibility of incorporating
more sophisticated and realistic shelter hardness and
vulnerability models as indicated in Chapter V, Section A.
The uniformities in weapons impact and shelter size and
vulnerability assumed in Scenarios 1 and 2 have some
computationally convenient consequences which are summarized
in Chapter V, Section B. However, non-uniform models for
weapons impact can be introduced, and shelters of mixed size
and hardness can be considered.
44
LIST OF RZFERENCZS
[1] J.D.Esary. Studies on Damage Aggregation for Weapons
Salvos, Technical Report NPS55-90-16, Naval Postgraduate
School, July 1990.
[2] J.D.Esa.-y. Studies on Damage Aggregation for Weapons
Salvos II, Technical Report NPSOR-92-007, Naval Postgraduate
School, July 1991.
45
INITIAL DISTRIBUTION LIST
No. Copies1. Defense Technical Information Center 2
Cameron StationAlexandria VA 22304-6145
2. Library, Code 052 2Naval Postgraduate SchoolMonterey CA 93943-5002
3. Chief Defence Scientist 1Mindef Bldg, Gombak DriveOff Upper Bukit Timah RoadSingapore 2366
4. Director 1Defence Science Organisation20 Science Park DriveSingapore 0511
5. Head Operations Analysis Department 2Mindef Bldg, Gombak DriveOff Upper Bukit Timah RoadSingapore 2366
6. Head Operations Research Division 2Defence Science Organisation20 Science Park DriveSingapore 0511
7. Professor J.D.Esary (Code OR/Ey) 2Operations Analysis Dept.Naval Postgraduate SchoolMonterey, CA 93943
8. Professor G. Lindsay (Code OR/Ls) 2Operations Analysis Dept.Naval Postgraduate SchoolMonterey, CA 93943
9. Yeo Gim Koon 2Defence Science Organisation20 Science Park DriveSingapore 0511
46