
NAVAL POSTGRADUATE SCHOOL - Defense Technical … · · 2011-05-14IMPACT OF RADIO FREQUENCY...
106
NAVAL POSTGRADUATE SCHOOL MONTEREY, CALIFORNIA THESIS Approved for public release; distribution is unlimited IMPACT OF RADIO FREQUENCY IDENTIFICATION (RFID) ON THE MARINE CORPS’ SUPPLY PROCESS by Melissa D. Chestnut September 2006 Thesis Advisor: Kenneth Doerr Second Reader: Glen Cook
Transcript of NAVAL POSTGRADUATE SCHOOL - Defense Technical … · · 2011-05-14IMPACT OF RADIO FREQUENCY...

NAVAL POSTGRADUATE
SCHOOL
MONTEREY, CALIFORNIA
THESIS
Approved for public release; distribution is unlimited
IMPACT OF RADIO FREQUENCY IDENTIFICATION (RFID) ON THE MARINE CORPS’ SUPPLY PROCESS
by
Melissa D. Chestnut
September 2006
Thesis Advisor: Kenneth Doerr Second Reader: Glen Cook

THIS PAGE INTENTIONALLY LEFT BLANK

i
REPORT DOCUMENTATION PAGE Form Approved OMB No. 0704-0188
Public reporting burden for this collection of information is estimated to average 1 hour per response, including the time for reviewing instruction, searching existing data sources, gathering and maintaining the data needed, and completing and reviewing the collection of information. Send comments regarding this burden estimate or any other aspect of this collection of information, including suggestions for reducing this burden, to Washington headquarters Services, Directorate for Information Operations and Reports, 1215 Jefferson Davis Highway, Suite 1204, Arlington, VA 22202-4302, and to the Office of Management and Budget, Paperwork Reduction Project (0704-0188) Washington DC 20503. 1. AGENCY USE ONLY (Leave blank)
2. REPORT DATE September 2006
3. REPORT TYPE AND DATES COVERED Master’s Thesis
4. TITLE AND SUBTITLE: Impact of Radio Frequency Identification (RFID) on the Marine Corps’ Supply Process
6. AUTHOR(S) Melissa D Chestnut
5. FUNDING NUMBERS
7. PERFORMING ORGANIZATION NAME(S) AND ADDRESS(ES) Naval Postgraduate School Monterey, CA 93943-5000
8. PERFORMING ORGANIZATION REPORT NUMBER
9. SPONSORING /MONITORING AGENCY NAME(S) AND ADDRESS(ES) N/A
10. SPONSORING/MONITORING AGENCY REPORT NUMBER
11. SUPPLEMENTARY NOTES The views expressed in this thesis are those of the author and do not reflect the official policy or position of the Department of Defense or the U.S. Government. 12a. DISTRIBUTION / AVAILABILITY STATEMENT Approved for public release; distribution is unlimited
12b. DISTRIBUTION CODE
13. ABSTRACT (maximum 200 words) The purpose of this research is to determine the impacts of utilizing radio frequency identification (RFID) technology in order to implement in-transit visibility (ITV) into the Marine Corps’ Supply Process. I interviewed experts and users of the LTMITV/W2W at the Supply Management Unit (SMU), 1st
Combat Logistics Regiment, 1st Marine Logistics Group on the operational implementation of the system as well as benefits and opportunities for improvement. With the information I recovered and data I collected, I was able to create a small simulation of the supply process. I used the simulation to create various scenarios that have been encountered in the past including possible negative impacts of the lack of ITV at certain portions of the supply process. I made recommendations on how to improve the current supply process as well as recommendations for future research.
15. NUMBER OF PAGES 106
14. SUBJECT TERMS In-transit Visibility, RFID, LTMITV, Supply Process, Simulation
16. PRICE CODE
17. SECURITY CLASSIFICATION OF REPORT
Unclassified
18. SECURITY CLASSIFICATION OF THIS PAGE
Unclassified
19. SECURITY CLASSIFICATION OF ABSTRACT
Unclassified
20. LIMITATION OF ABSTRACT
UL
NSN 7540-01-280-5500 Standard Form 298 (Rev. 2-89) Prescribed by ANSI Std. 239-18

ii
THIS PAGE INTENTIONALLY LEFT BLANK

iii
Approved for public release; distribution is unlimited
IMPACT OF RADIO FREQUENCY IDENTIFICATION (RFID) ON THE MARINE CORPS’SUPPLY PROCESS
Melissa D. Chestnut
Captain, United States Marine Corps B.S., Clark Atlanta University, 1998
Submitted in partial fulfillment of the requirements for the degree of
MASTER OF SCIENCE IN INFORMATION TECHNOLOGY MANAGEMENT
from the
NAVAL POSTGRADUATE SCHOOL September 2006
Author: Melissa D. Chestnut Approved by: Kenneth Doerr
Thesis Advisor
Glen Cook Second Reader
Dan Boger Chairman, Department of Information Sciences

iv
THIS PAGE INTENTIONALLY LEFT BLANK

v
ABSTRACT
The purpose of this research is to determine the
impacts of utilizing radio frequency identification (RFID)
technology in order to implement in-transit visibility
(ITV) into the Marine Corps’ Supply Process. I interviewed
experts and users of the LTMITV/W2W at the Supply
Management Unit (SMU), 1st Combat Logistics Regiment, 1st
Marine Logistics Group on the operational implementation of
the system as well as benefits and opportunities for
improvement. With the information I recovered and data I
collected, I was able to create a small simulation of the
supply process. I used the simulation to create various
scenarios that have been encountered in the past including
possible negative impacts of the lack of ITV at certain
portions of the supply process. I made recommendations on
how to improve the current supply process as well as
recommendations for future research.

vi
THIS PAGE INTENTIONALLY LEFT BLANK

vii
TABLE OF CONTENTS
I. INTRODUCTION ............................................1 A. OVERVIEW ...........................................1 B. STATEMENT OF PROBLEM ...............................2 C. ORGANIZATION OF THESIS .............................4
II. BACKGROUND ..............................................7 A. RFID TECHNOLOGY ....................................7
1. Current Objectives of RFID Technology in the DoD ...........................................9
2. Benefits of RFID Technology ..................10 3. Limitations of RFID Technology ...............11
B. REASON FOR LTMITV/W2W IN THE MARINE CORPS .........12 III. OPERATIONAL EMPLOYMENT FOR LTMITV/W2W ..................17
A. CURRENT ARCHITECTURE/EMPLOYMENT FOR LTMITV/W2W ....17 1. Current Architecture .........................18 2. Current Employment of LTMITV .................21 3. Benefits of ITV ..............................23
B. MARINE CORPS SUPPLY PROCESS .......................24 IV. ANALYSIS ...............................................27
A. ASSUMPTIONS .......................................27 B. SIMULATON MODEL DESCRIPTION .......................30 C. METHODOLOY ........................................34
1. Data Collection ..............................35 D. VARIABLES AND PARAMETERS ..........................39
1. Total Demands Distribution ....................40 2. Courier and Process Delay Distributions .......41 3. Fill Rate Probability .........................42 4. Backorder Priority Probability ................44 5. ‘SMU OnHand’ Sub-Model Distributions ..........45 6. ‘Backorder by SMU’ Sub-Model Distributions ....47 7. ‘Backorder by SOS’ Distributions ..............49
E. SCENARIOS .........................................52 1. Base Case (As-Was): The Marine Corps’ Supply
Process Prior to ITV .........................53 2. Real-Time: Hypothetical Improvement Using a
Real-Time Order Processing System Vice a Batch Order Processing System ................56
3. As-Is: The Current Marine Corps Supply Process ......................................57

viii
4. To-Be: The Marine Corps Supply Process Using a Real-time Order Processing System Vice a Batch Order Processing System ................58
V. RESULTS ................................................69 A. SIMULATION RESULTS ................................69
1. Base Case (As-Was): The Marine Corps’ Supply Process Prior to ITV .........................69
2. Real-Time: Hypothetical Improvement Using a Real-Time Order Processing System Vice a Batch Order Processing System ................71
3. As-Is: The Current Marine Corps Supply Process with ITV .............................72
4. To-Be: The Marine Corps Supply Process Using a Real-time Order Processing System Vice a Batch Ordering Processing System .............74
VI. CONCLUSION .............................................77 A. RECOMMENDATIONS ...................................77 B. FUTURE RESEARCH ...................................78
APPENDIX A. UNIT PERFORMANCE REPORT ......................81 APPENDIX B. DAILY TRANSACTION LISTING ....................83 LIST OF REFERENCES ..........................................85 INITIAL DISTRIBUTION LIST ...................................87

ix
LIST OF FIGURES
Figure 1. Current Marine Corps ITV Architecture (From [9] p.32) .............................................20
Figure 2. System Interaction (From [10]) ....................21 Figure 3. Total demands distribution with normal
expression: NORM[825,508] (From [16]) .............41 Figure 4. Shipping Times for Low Priority Backorders with
expression: [[120 + EXPO(221)] (From [16]) ........48 Figure 5. Shipping Times for High Priority Backorders with
expression: [120 + 6.58e+003 * BETA(0.674, 2.21)] (From [16]) .......................................50
Figure 6. Simulation ........................................60 Figure 7. Sub-Model: SMU Onhand .............................61 Figure 8. Sub-Model: Backorder by SMU - Not on Hand & Low
Priority Backorder ................................62 Figure 9. Sub-Model: Backorder by SOS - Not on Hand & High
Priority Backorder ................................63 Figure 10. Modified ‘SMU OnHand’ sub-model for As-Was and
Real-Time Scenarios ...............................64 Figure 11. Modified ‘Backorder by SMU’ sub-model for As-
Was and Real-Time scenarios .......................65 Figure 12. Modified ‘Backorder by SOS’ sub-model for As-
Was and Real-Time scenarios .......................66 Figure 13. Real-Time and To-Be Modified Supply Process –
No Batch Ordering .................................67

x
THIS PAGE INTENTIONALLY LEFT BLANK

xi
LIST OF TABLES
Table 1. Summary of Distributions ..........................52 Table 2. Base Case (As-Was) Simulation Results .............70 Table 3. Real-Time: As-Was Using Real-Time Vice Batch
Ordering ..........................................71 Table 4. As-Is: The Current Marine Corps Supply Process
with ITV ..........................................73 Table 5. To-Be: The Marine Corps Supply Process Using a
Real-time Order Processing System Vice a Batch Order Processing System ...........................75

xii
--
THIS PAGE INTENTIONALLY LEFT BLANK

xiii
LIST OF ABBREVIATIONS AND ACRONYMS
AAC Activity Address Code
ATLASS I Asset Tracking for Logistics and Supply System
BCS3 Battle Command Sustainment Support System
DIC Document Identifier Code
DLA Defense Logistics Agency
DoD Department of Defense
F/AD Force Activity Designator
FOB Forward Operating Bases
FSSG Force Service Support Group
GAO General Accounting Office
I&L Installation and Logistics
ITV In-Transit Visibility
LTM Last Tactical Mile
LTMITV Last Tactical Mile In-Transit Visibility
MCAGCC Marine Corps Air Ground Combat Center
MCAS Marine Corps Air Station
MEF Marine Expeditionary Force
MEF Marine Expeditionary Force
MIMMS Marine Corps Integrated Management System
MLG Marine Logistics Group
MRO Material Release Order
NSN National Stock Number
OIC Officer-in-Charge
OIF Operation Iraqi Freedom
PM-AIT Program Manager-Automated Information Technology
RFID Radio Frequency Identification
RO Requisitioning Objective
RUC Reporting Unit Code
SASSY Supported Activities Supply System
SOS Source of Supply
SMU Supply Management Unit
TCN Transportation Control Number
TMO Traffic Management Office
W2W Warehouse to Warfighter

xiv
THIS PAGE INTENTIONALLY LEFT BLANK

xv
ACKNOWLEDGMENTS
I would like to first thank Dr. Kenneth Doerr for
guiding me through this process. Your insight, knowledge
and experience was crucial to my success. I would also like
to thank the Marines at the SMU for assisting me in my data
collection. Without your efforts I literally could not have
completed my thesis.

xvi
THIS PAGE INTENTIONALLY LEFT BLANK

1
I. INTRODUCTION
A. OVERVIEW
As a Company Commander in a Combat Service Support
(CSS) battalion during Operation Iraqi Freedom I(OIF-I), I
was bombarded with questions on a regular basis from
supported units as to the location of their repair parts.
Unfortunately once the items were in theater, trying to
locate parts ordered was nearly impossible. This was an
ongoing problem for all CSS units during OIF-I and what had
become the norm was now unacceptable. A General Accounting
Office (GAO) report (GAO-04-305R) dated 18 December 2003
acknowledged the military successes during combat
operations as well as identified substantial logistics
support issues in theater. The GAO report identified the
following issues:
• Inadequate asset visibility based on the backlog of hundreds of containers.
• A $1.2 billion gap between the amount of material shipped to the theater of operations, and the amount of material acknowledged upon receipt of shipment.
• Potential loss of millions of dollars in late fees on leased or replaced containers for the DOD, as a result of distribution backlogs or losses.
• Compromised readiness issues because of a lack of parts inventory, or parts that could not be located due to inadequate asset visibility.
• Duplication of requisitions, again due to the lack of asset visibility of parts previously ordered by the support units. [1]

2
All of these issues are of great importance but this
thesis will key-in on the inadequate asset visibility
issue. The GAO report also stated that “although U.S.
Central Command issued a policy requiring, whenever
feasible, the use of radio frequency identification (RFID)
tags to track assets shipped to and within the theater,
these tags were not used in a uniform and consistent
manner.” [1] In a nutshell once the assets were in theater
the asset visibility stopped at the port. The Marine Corps
had never traveled so far inland during combat operations
so OIF-I was completely new territory. The strain on the
logistics trains reinforced the need for a technology to
enable commanders to have asset visibility up and down the
supply chain. RFID technology is currently the answer to
this problem. The Marines of I Marine Expeditionary Force
(MEF) took on the responsibility of providing in-transit
visibility (ITV) down to the last tactical mile for supply
parts which led to the development of a software program
that was capable of providing some form of asset visibility
to the using unit as the supply part traveled from the
warehouse to the warfighter. The logistics modernization
initiative is referred to as the Last Tactical Mile In-
Transit Visibility (LTMITV) or Warehouse to Warfighter. In
partial support of the LTMITV initiative, this thesis will
attempt to address some of the impacts RFID technology has
on the supply process, and potential limitations of the
current system that might impact the efficacy of RFID
technology in the Marine Corps’ current supply process.
B. STATEMENT OF PROBLEM
It is always easier to provide logistics support in a
static environment than in a dynamic one. We need to have

3
accurate, complete and refined business processes in a
static environment before even considering implementing the
process in a dynamic one. That is why the author will
examine the step-by-step process of what happens to a
requisition once it is ordered by a unit and give
approximate delays and shipping times based on if the item
is on hand or is placed on backorder. Testing ITV in a
static or garrison environment is paramount in correcting
the problem of distribution and asset location during a
dynamic environment. 1st Marine Logistics Group (MLG), 1st
Supply Battalion, Supply Management Unit (SMU1) in Camp
Pendleton, CA is currently conducting real world tests from
Camp Pendleton to using units on the west coast. Their
goal is to employ an asset tracking/in-transit visibility
system that nearly mimics the system and processes used in
Iraq. Not all parts of the supply process allow in-transit
visibility for the end user. Are there certain locations
during the supply process where in-transit visibility is
needed? If so, how will this ITV benefit the user?
Currently there are two separate methods for tracking
parts that have been requisitioned; one is nodal,
visibility of a part can only be determined based on the
last known location, and the other is the use of the global
positioning system (GPS), visibility of a part is given by
a current grid coordinate.
1 SMU maintains, tracks, and issues repair parts to using units
throughout the Marine Corps. There is a SMU for each MEF.

4
Throughout this thesis the following questions will be
answered:
1 What is the typical supply flow process for a
requisition in the MEF supply chain?
a. How long will it take a unit to receive a part
if the SMU has the item on hand?
b. How long will it take a unit to receive a part
if the SMU does not have on hand?
c. What is the percentage of orders that are
immediately filled by the SMU?
d. What role does priority of the requisition
play in the supply process?
2. How does ITV improve the MEF supply chain?
3. At what point in the MEF supply chain does ITV
begin for the end user?
4. At what a point in the MEF supply chain does ITV
not exists?
5. How is the current LTMITV/W2W system configured?
6. How is the end user able to track their parts in
the current LTMITV?
C. ORGANIZATION OF THESIS
This thesis will start with a description of RFID
technology, how it works, along with some of its advantages
and disadvantages. Then it will examine the Marine Corps’
rationale for the use of the LTMITV/W2W system, the current
architecture of the system and how it is employed.
In order to determine the locations where in-transit
visibility (ITV) is most needed as well as estimate

5
shipping times for requisitions, a simulation will be
developed to model the current supply process. This model
will be described in detail and used to analyze the impacts
of RFID-enabled ITV on the Marine Corps’ supply process
from the perspective of the using unit. The benefits of
implementing ITV into the supply process will be
substantiated by using a base case scenario of what life
was without ITV and how life has improved since then.
Finally, based on the results of the simulation,
recommendations will be made as to how to improve the
current supply process and or the implementation of RFID
technology with the Marine Corps supply process, and
directions for future research on this topic will be
recommended.

6
THIS PAGE INTENTIONALLY LEFT BLANK

7
II. BACKGROUND
A. RFID TECHNOLOGY
Radio Frequency Identification (RFID) is an automatic
identification method that uses radio waves to identify
physical objects. It is a technology tool that holds the
promise of replacing existing identification technologies
like the bar code and providing improved asset visibility
for the DoD. Although the benefits of RFID technology are
substantial, implementing the technology, even at a minimal
compliance level, can be an overwhelming task. [2] A
logistics command that as been tasked with using RFID
technology must first understand the components of a RFID
system and how all these components interact. The mandatory
components of the RFID system are the tag, the reader, the
reader antenna, the controller, and the communication
infrastructure. The optional components are the sensor,
actuator, and annunciator, and the host or software system.
[3]
The RFID tag is a device that stores and transmits
data to a reader using radio waves. RFID tags fall into
three broad categories – passive, active, and semi-passive
(or semi-active). Passive tags require no internal power
source; instead it uses the power from the incoming signal
to energize itself and then transmits the stored data to
the reader. Active tags require a power source to transmit
data to a reader. Semi-passive tags use an internal power
source to monitor environmental conditions, but require
radio frequency energy transferred from the reader similar

8
to passive tags to power a tag response. The RFID tags can
be attached to a product or integrated into the product.
[3]
The RFID reader, or interrogator, is a device that can
read from and write data to compatible RFID tags. The
reader communicates with the RFID tag via radio waves and
passes the information in digital form to a computer
system. There are four types of readers: serial, network,
stationary, and handheld. Each has certain advantages and
disadvantages. The type of reader an organization would use
depends on the reliability of the communication length,
their dependence on the length of cable to connect the
reader to a computer, and the amount of money the
organization is willing to spend. A reader antenna is a
separate device that is physically attached to a reader and
is used by the reader to communicate to a tag. [3]
The other two mandatory components, the controller and
the communications infrastructure, possess features that
allow an organization to employ RFID technology
successfully. The controller allows an external entity,
either human or a computer program, to communicate with and
control a reader’s functions with the annunciators and
actuators associated with this reader. While the
communications infrastructure provides connectivity and
enables security and systems management functionalities to
different components of an RFID system. The optional
components; sensor, annunciator, and actuator and host and
software systems; are needed for external input and output
of the system. Even though these components are optional,
an RFID system is close to useless without them. [3]

9
All of these components of the RFID system come
together to make RFID technology work. First the tag is
attached to the object that needs to be identified. Unique
identification data about this tagged object is stored onto
the tag. When the tagged item is introduced in front of a
RFID interrogator, the tag transmits the data to the
interrogator. The interrogator will then read and forward
the data over a reliable communication channel to a
software application running on a computer. The software
application can then use the unique data to identify the
object presented to the reader. From here depending on the
type of software a variety of actions can be performed such
as updating the location of the information, sending an
alert to the warehouse personnel, or ignoring it. [3]
1. Current Objectives of RFID Technology in the DoD
Since the early 1990’s the DoD has been using RFID
technology to label shipping containers moving throughout
the DoD supply chain. [2] However both active and passive
RFID technologies have been in commercial business
applications from the late 1980s through today. The use of
passive RFID technologies is currently emerging in the DoD
following the finalization of the DoD RFID Policy in June
2004 that required suppliers to put passive RFID tags on
the lowest possible piece part/case/pallet packaging by
January 2005. [4] Active tags have been a staple in DoD
large scale packaging since the early 1990’s. The use of
the technology has addressed a major challenge that has
been noted at every node within the DoD Supply chain--lack
of visibility of item data. Steps have been taken by the
DoD through each military service to incorporate RFID in

10
their supply distribution chain in order to provide ITV
necessary for units on the ground.
It has also been proposed to use RFID technology for
point of sale (POS) store checkout to replace the cashier
with an automatic system which needs no barcode scanning.
However this is not likely to be possible without a
significant reduction in the cost of current tags and
changes in the operational process around POS. There is
some research taking place, however, this is some years
from being achieved.
The DoD is most interested in using RFID technology
to:
1) provide near real-time in-transit visibility for all classes of supplies and material, 2) provide “in the box” content detail for all classes of supplies and material, 3) provide quality, non-intrusive identification and data collection that enable enhanced inventory management, and 4) provide enhanced item level visibility. [5]
2. Benefits of RFID Technology
There are a number of benefits to RFID technology. One
benefit is that an RFID tag can be read without any
physical contact between the tag and the reader. An RFID
tag can have a read range as small as a few inches to as
large as more than 100 feet, although the reading distance
can also be considered a limitation. An RFID tag can store
from a few bytes of identification data to a large database
of item and environmental history. RFID tags can sustain
rough operational environmental conditions to a fair

11
extent. The most important benefit is that RFID is 100%
accurate, as long as the data is correctly input. [3]
Other benefits of RFID includes offering strategic
advantages to businesses by being able to track inventory
in the supply chain more efficiently, providing real-time
in-transit visibility, and monitoring general enterprise
assets. [2] These business advantages lead to even more
advantages such as reducing and possibly eliminating human
intervention in some business processes, having higher
throughput supply chains by allowing more items to be
counted simultaneously, providing real-time information
flow because as soon as an item changes its condition or
state, the information can be updated across the supply
chain and lastly by providing the ability to track
individual items with serialized data, meaning each item
has its own unique identifier or serial number. [2]
The benefits of central importance in this thesis are
the identification data the RFID tag can store which
enables the user to accurately identify the items that are
associated with a tag, the integration of RFID technology
with a communications infrastructure to provide in-transit
visibility, and the strategic business advantage of RFID
technology’s ability to monitor general enterprise assets.
3. Limitations of RFID Technology
Although there are substantial advantages to RFID
technology it is not the answer to all of our supply
distribution problems. RFID performs poorly with any
objects that are not transparent or opaque such as metal
and any objects that are absorbent, such as a liquid. RFID
solutions are also impacted by certain environmental

12
factors. Due to its poor performance with RF-absorbent
objects, when in an operating environment where there is
high human traffic, if a person is between a tag and a
reader, there is a good possibility that the reader cannot
read the tag before the person moves away. This is
primarily due to the fact that the human body contains a
large amount of water. [3] RFID tags are also susceptible
to electromagnetic interference from computing equipment,
lighting fixtures, etc. [6] While technological solutions
are being sought to these limitations, at least in the
short term, they remain an obstacle to the universal
application of RFID.
One main disadvantage of RFID technology and why many
businesses are slow to implement it is the cost of RFID,
relative to the incremental benefit of RFID over a bar code
system. Passive tags are currently discarded after the item
is sold. Therefore, the replacement cost of them can get
quite unaffordable. “Currently the cost of passive RFID
tags is approximately 40 cents, and if the tags are active,
the cost per tag might increase to a few dollars.” [7] Even
though the cost of RFID tags should continue to decline due
to economies of scale, the cost of the tags only represents
a very small fraction of the overall cost to implement an
RFID system.
B. REASON FOR LTMITV/W2W IN THE MARINE CORPS
The fog and friction of war is not only a constant
concern to the art and science of war but to the art and
science of logistics as well. In the opinion of the
author, lessons from Operations Desert Shield and Desert
Storm were not fully learned, and the logistical problems
faced during Operation Enduring Freedom and Operation Iraqi

13
Freedom (OEF/OIF) were similar to those faced in the
earlier conflicts. One primary lesson that should have
been learned from Operations Desert Shield and Desert Storm
in relation to logistics was the inadequate accountability
over material. After a GAO report was published to address
these accountability concerns, the DoD stated “it has
pledged a substantial amount of financial and managerial
resources, which it believes will improve handling,
shipping, and tracking in material in future
contingencies.” [8]
Shortly after this GAO report was released the RFID
initiative began and the DoD began using RFID technology to
keep better track of necessary supplies to make sure the
supplies reach the troops wherever they are needed. OIF
posed the same logistical problems as in Operations Desert
Storm and Desert Shield, except on a smaller scale. There
was no need to stockpile 30 – 60 days of supplies because
units were constantly on the move and they were only able
to carry 3-7 days of supplies. The DoD had solved the
problem of tracking supplies from the US to a foreign port
but once the supplies left the port their location could
not be tracked in-transit. There was now a need to track
the supplies down to the unit who requested it or down to
the last tactical mile. The location of the supplies needed
to be known while they were in-transit from the warehouse
who issued the gear to the warfighter who signed for the
gear. [9] Thus came a need, and the creation of the Marine
Corp’s Logistics Modernization movement, with the goal of
providing excellence in logistics to support excellence in
warfighting.
14
In a report submitted by the Commanding Officer,
Combat Service Support Group 15, to the DoD for
consideration to receive the 2004 Supply Chain Operational
Excellence Award, Brigadier General Edward Usher,
Commanding General, 1st Force Service Support Group (FSSG),
I Marine Expeditionary Force (MEF), OIF was quoted as
saying:
Our biggest shortfall during OIF-I was the lack of In-Transit Visibility information to incorporate in to our command and control efforts.... The lack of asset visibility on unit stocks and in-transit visibility on ordered items made it difficult to identify actual shortages, to locate needed items, within stocks for reallocation, and to direct and track the movement of ordered items to requesting units. This lack of visibility resulted in delays, shortages, and at times an inability to expedite critical parts. [9]
This delinquency in asset visibility as noted by the
1st FSSG Commanding General and the mandate by the DoD that
RFID technology will be used to track all cargo movement
prompted the supply chain experts of the Supply Management
Unit (SMU) of 1st Supply Battalion, 1st FSSG (now 1st Marine
Logistics Group (MLG)), 1st MEF to aggressively seek
available commercial RFID technology software and hardware
currently used by the Army. Although the Army’s current use
of the technology met the DoD’s mandate, their use fell
short of the tracking of requirements that were envisioned
by the SMU’s supply chain experts. The SMU supply chain
experts end state was that the Marine Corps would have the
ability to track all content level shipments down to the
“The Last Tactical Mile (LTM)”. Over time the supply chain
experts knew that nodal visibility would not be enough and

15
that eventually the warfighter would need near-real-time
visibility: the answer would be the Warehouse to Warfighter
(W2W) portal. The W2W portal does not rely on nodal
interrogators and gives the unit visibility and tracking
for what was dropped at a location, who received it and the
grid at which it was dropped. Overall a complete ITV
system would be able to do the following:
• Reduce excessive requisitions
• Improve the Commander’s ability to track critical items
• Optimize asset posture and accountability
• Allow for the recoverability of misdirected shipments [9]
The SMU conducted an analytical review following OIF-I
which determined that three aspects of the supply chain
required immediate process reform; asset visibility (on
hand and in-transit), asset availability, and order
management. [9] This thesis is primarily concerned with
asset visibility and therefore the majority of the work
will focus on ITV. Currently Headquarters Marine Corps,
Installation and Logistics (I&L) Command is in the process
of conducting a complete Logistics Modernization that would
ultimately replace current legacy supply and maintenance
systems; however, that operational architecture is still a
few years out. In the interim the SMU decided to employ
current commercial capabilities to help resolve ITV issues,
improve order management, and increase availability of
critical repair parts. [9]

16
THIS PAGE INTENTIONALLY LEFT BLANK
17
III. OPERATIONAL EMPLOYMENT FOR LTMITV/W2W
A. CURRENT ARCHITECTURE/EMPLOYMENT FOR LTMITV/W2W
Out of the three aspects of the supply chain (asset
visibility, asset availability, and order management) that
required immediate process reform, asset visibility or ITV
was considered the most critical factor behind the less
than adequate supply support capability during OIF-I. [9]
In August 2003 efforts began to create a more reliable and
extensive ITV, by using RFID tags and satellite tracking
devices. At that time SMU published a campaign plan that
stated by August of 2004, the following end state was
desired:
All assets managed by the SMU are visible to the supply chain in one location. Items moving in-transit through the supply chain will be visible down to [the] document number detail and the physical location of that material as it moves from node to node until final delivery to the supported unit. [9]
Due to the pressure to have a system in place by
OIF-II the SMU decided to use existing infrastructures
of the Army and the Defense Logistics Agency (DLA).
These two were already using SAVI© RFID tags and had
interrogators placed at key logistics and distribution
nodes. The SMU would then expand the infrastructure in
place, to include tactical Forward Operating Bases
(FOB) and Logistic Support Areas with I MEF Area of
Operations. [9] A Marine Corps specific system was
developed entitled Last Tactical Mile In-Transit
Visibility (LTMITV). This system only provides “nodal”
visibility. Soon the W2W portal was created which
18
provides longitude and latitude coordinates for a
specific RFID tag. The W2W portal is intended to
provide a near-real-time in-transit visibility.
Unfortunately the W2W hardware components are not
always 100% effective therefore instead of replacing
the LTMITV system the W2W has enhanced its capability.
In order to allow both system to work together the W2W
data feeds into the LTMITV system, transmitting the
GPS data to the website. [10]
1. Current Architecture
As data is written to an RFID tag, that information is
sent to an appropriate ITV server managed by the Program
Manager–Automated Information Technology (PM-AIT). PM-AIT
falls under the US Army as the executive service. As the
active RFID tags pass interrogators throughout the
distribution chain, the tag number (unique identifier) is
collected and transmitted to the appropriate ITV server.
This allows units to query the ITV servers and gain nodal
visibility of the last known distribution node in which the
USMC sustainment cargo has passed. Units are able to query
the ITV server using document numbers, National Stock
Numbers (NSN), Transportation Control Numbers (TCN), and
RFID tag numbers. [9]
Currently the Marine Corps’ ITV system is the
Automated Manifesting System – Tactical (AMS-TAC). This
system is designed to combine a user-friendly software
package and a state-of-the art hardware system into an
efficient, cost effective and compact shipping manifest
database management system. [11] All of the pertinent data
for the shipping container to include document numbers,
quantity, Activity Address Code (AAC) etc. is added to the

19
RFID tag using the AMS-TAC. AMS-TAC then sends the manifest
data to the US Army’s ITV web site, ‘RF-ITV Tracking
Portal.’ As RFID tags pass interrogators the interrogators
transmit the updated RFID tag location to the Army’s ITV
web site. SMU then extracts the data from the ITV server to
create a courier2 with AS1 (shipping) transactions in the
Supported Activities Supply System (SASSY),3 the primary
retail accounting system for the Marine Corps. The AS1
transactions will identify the key distribution nodes in
the distribution pipelines. The AS1’s signify certain
Combat Service Support Areas/Elements/Battalions/Groups
that are apart of the distribution chain and therefore have
an interrogator posted at their location. The courier is
then processed and posts on the units’ Due in and Status
File (DASF) where the using unit can track their assets.
At the same time that the RFID tag data is loaded onto
the AMS-TAC it is also loaded into the W2W/LTM kits. These
kits were designed to give the warfighter and maintainers
near-real-time visibility of supply status leaving the SMU,
down to the individual document level. [9] The data is
captured at each delivery point and posted to an
independent File Transfer Protocol (FTP) server. While the
tag is in-transit, GPS coordinate updates are sent to the
Marine Corps LTMITV site, developed by Sytex Corporation4.
The system also provides the user as to where the supplies
were delivered as well as who received them. If the gear is
2 A collection of transactions created by a using unit that includes
demands as well as other pertinent transactions. 3 SASSY provides retail supply accounting functions such as stock
replenishment, requirement determination, receipts, inventory, stock control and asset visibility.
4 Sytex, Inc. has since been purchased by Lockheed Martin.

20
delivered to the unit, an AS2 (shipping to unit)
transaction is created. If the gear is dropped off at a
camp along the way an AS1 is created. Once again a courier
is processed and posts to the DASF where the using unit can
check the status. The Army’s ITV server and the Marine
Corps’ LTMITV server feed into the Battle Command
Sustainment Support System (BCS3). This system allows you
to view multiple assets such as transporters, individual
document numbers, units and interrogators. See Figure 1 for
an upper level view of the architecture. [9] Figure 2 is a
simple view of how all the systems interact. [10]USMC Global
Figure 1. Current Marine Corps ITV Architecture (From [9]
p.32)

21
Figure 2. System Interaction (From [10])
2. Current Employment of LTMITV
Currently RFID technology is in daily use in Garrison
was well as in a theater of operation, specifically Iraq.
In order to suit a tactical environment Portable Deployment
Kits5 (PDK) are being used. A PDK is a self-contained
carrying case that delivers a fully mobile solution. The
kits address the Marine Corps’ need to provide visibility
where a RFID fixed reader infrastructure does not exist.
In garrison, specifically from the SMU at 1st Supply
Battalion in Camp Pendleton, CA all forms of the ITV system
are in place to include the W2W portal that feeds into the
Marine Corps’ LTMITV site, AMS-TAC which feed into the
5 Savi Technology, Inc. developed this RFID mobile solution to
directly support the war fighter deployed in the Area of Operations.
LTMTITV
Radio Frequency Identification Tag
AMS-TAC
In Transit Visibility Site
Interrogator Portable Deployment Kit
Early Entry Deployment Kit
AS1 from ITV with Location
DASF
Using Unit
W2W/LTM
LTMITV Site
AS1/AS2 from LTM
ITV Server
Battle Command Sustainment
Support System

22
Army’s ITV site, as well as PDK’s for units that are
conducting field training exercises. Assets are shipped
from the SMU on a regular basis in support of units on the
west coast as well as units overseas.
The SMU has targeted critical areas within the area of
operation (whether being Iraq to Kuwait or Camp Pendleton
to Yuma) to serve as visibility points for supplies flowing
throughout the distribution chain. To simplify data
collection and validation the author selected Camp
Pendleton as a test site and the main analysis will focus
on the implementation of ITV in Camp Pendleton. While
certainly there are field obstacles in an area of operation
such as Iraq which cannot be examined by looking at
Pendleton, neither data nor personnel were available to
support an analysis of operations in Iraq. Moreover,
Pendleton operations can be seen as a ‘base case’, in the
sense that benefits may be obtained more easily, at a lower
cost than in deployed operations. In other words, if the
system does not make sense at Pendleton, it is unlikely to
be viable in Iraq.
There are several interrogators located in Camp
Pendleton to include: the end of Warehouse road, the
Traffic Management Office6 (TMO), the front gate (Goes into
Interstate 5), Fallbrook gate, and Las Pulgas. Once off
base, interrogators are located at the entry points of the
Marine Corps Air Station (MCAS) Miramar, MCAS Yuma, and
Marine Corps Air Ground Combat Center (MCAGCC) Twenty-nine
(29) Palms, CA. The interrogators are used in conjunction
6 TMO is equivalent to the civilian sector’s UPS. They ship all
assets to using units on tractor trailers on a daily basis, except for holidays and weekends.

23
with the W2W GPS enabled kits, if there is no GPS data
available the unit will at least have the last known nodal
location of their assets. [10]
A new section at the SMU entitled the Process Reform
Center was created in order to assist the SMU in reforming
the three critical aspects of the supply chain (asset
visibility, asset availability, and order management). Some
responsibilities of the section include handling the day-
to-day operations of in-transit visibility of all assets
that leave the SMU, ensuring the hardware as well as web
applications works properly and training individual units
on the use of the system an equipment. This is the specific
section I visited while in Camp Pendleton for my data
collection.
3. Benefits of ITV
After interviewing several individuals at the SMU in
Camp Pendleton the author’s sense was that there existed an
overall consensus as to the main benefit of ITV in its
current state: an increase in the customer’s confidence in
the supply system. This particular benefit leads to other
factors that can improve the SMU’s ability to provide
excellent support to the supported unit. Once a customer
has an increased confidence level in the supply system the
rate of cannibalization7 will decrease. Also when a unit
knows that their requisitioned item is at least en route or
at a certain camp, the rate of multiple reorders will
decrease as well, which has the affect of saving the
government money as well as decreasing the demand on the
SMU.
7 Process of removing serviceable parts from a damaged item for use
in repair of other equipment of the same kind.

24
The Marines in the customer service section of the SMU
provide service primarily to units who are currently
deployed with a Marine Expeditionary Unit (MEU), therefore
are usually out to sea. These units do not have the access
to the ITV websites. The ITV system currently employed by
the Marine Corps has increased the SMU’s ability to provide
accurate information as to the current location of the
deployed unit’s gear. ITV also speeds up the movement of
supplies by eliminating the need to rummage through large
containers trying to find a part. If the movement of
supplies increases then we have a domino effect of assets
reaching units much quicker than anticipated thus
increasing the unit’s confidence in the supply system.
B. MARINE CORPS SUPPLY PROCESS
Units within I MEF use Asset Tracking for Logistics
and Supply System (ATLASS I) to keypunch their requisitions
and other related transactions to submit to the SASSY
update cycle. Each unit creates a courier that has to be
sent to the Operations section of the SMU by 1700 each day
via the Operations’ section email address, the FTP site, or
emailed directly to an Operations clerk. All couriers are
integrated and processed in Albany, GA where daily reports
are created and sent to each supporting unit. Each unit is
responsible for managing their reports as well as their
requisitions. The supporting unit must ensure each error
and exception is reviewed, corrected, and re-inducted as
required. [9]

25
The system checks SMU’s current warehouse on hands to
determine if a Material Release Order8 (MRO) will be
submitted to the SMU. If the item is on hand at the SMU’s
warehouse a MRO will be created and the Storage Section
Marines will ‘pick’ the item and prepare it for shipment.
Preparing the item for shipment involves pulling the item
from the warehouse location, packaging the item, labeling
the item and creating a manifest. Once the manifest is
created it is transferred onto an active RFID tag. Once
the identification data is loaded onto the RFID tag a using
unit can potentially go online to the LTMITV website and
see that the item they requisitioned is at the SMU and
ready for shipment. This is the point in which ITV or
simply asset visibility begins.
By 1500 all items that will be shipped the next
morning are taken over to TMO where they are staged on the
trailers overnight. The next morning, depending on the
destination, the parts will be transported to the using
unit at a certain time. While the parts are at TMO, ITV is
available as well. In other words, a unit can see that
their part is sitting at TMO waiting to be transported.
While the part is in-transit, if the W2W portal is not
working properly, the using unit will only be able to know
the last known location of the part based on the location
of the interrogators. Otherwise the using unit will have
the most recent GPS coordinates of their part. While the
items are in-transit from TMO to their destination the user
has ITV. After the part arrives at the destination it is
8 Document created each night once the couriers are processed. The MRO denotes that the SMU has the item on hand and gives the SMU the authority to release the item for issue. [10]

26
signed for by a designated individual at the using unit.
Once the part is signed for, the LTMITV site is updated to
reflect that the item is no longer in-transit.
If the SMU does not have the item on hand then based
on the priority of the item the requisition is either
automatically forwarded to an appropriate source of supply
(SOS) (high priority) or the SMU will maintain the
backorder (low priority) and wait until the item is shipped
to them. Once the item arrives it is included on a
manifest and the identification data is transferred to an
active RFID tag then it goes through the same process as
before. All items that are en route from the SOS to the SMU
are not tagged and therefore ITV does not exist. If a unit
has a high priority item then the only visibility they have
on the item is the status that is on their DASF. It is not
until the item reaches the SMU and the item is tagged that
ITV begins. [10]
27
IV. ANALYSIS
A. ASSUMPTIONS
Assumptions were critical in the analysis of the
simulation developed by the author. Where possible,
assumptions are supported by information received during
interviews, literature review or research that the author
conducted. However, several assumptions were based on the
opinion of the author due to her experience as a Supply
Officer. Due to the lack of access to resources (i.e.
equipment, using units, and data) and the fact that the
supply process has many moving parts, the author based the
simulation on a static environment vice a dynamic one.
There are several simplifying assumptions that are
made for the sake of parsimony. While the real-world
supply chain process does not exist in the perfect
environment suggested by these assumptions, they are
necessary to keep the simulation model tractable. The
author believes the simulation model built on these
assumptions can still inform decision making, but the
assumptions are detailed here so that the reader may form
their own judgment. The first assumption is that the
Marine Corps’ Supply System is available at all times,
meaning during the running of the simulation there was
never a malfunction or unintentional shut down. A second
assumption is that all pertinent resources are available to
process a request from a unit, to include: personnel,
packing and packaging equipment, transportation assets, and
RFID hardware/software. A third assumption is that the
using unit who requested the part(s) was available to

28
receive the item(s). Another assumption is that the ITV
system (web site and server) is available for view by the
SMU as well as the using unit at all times. A final
environmental assumption is that the simulation will model
the supply process in Camp Pendleton and not in Iraq this
is because Camp Pendleton has relevance for a deployed
setting as a best case scenario.
In addition to the environmental assumptions, a
simplifying assumption is also made based on the military’s
priority system. The type of priority number a unit can
use is determined by the unit’s Force Activity Designator
(F/AD) along with the Urgency of Need Designator. The F/AD
depends upon whether or not a unit is in combat, deployed,
maintaining combat readiness, or is a reserve unit; denoted
by Roman numerals I–V, with Roman numeral I being assigned
to a unit currently in combat. The Urgency of Need
Designator is determined by the requisitioning activity,
based upon the urgency in which that activity needs the
item; denoted by alphabets A-C, with A having the highest
urgency. [13] For this simulation the author assumes that
low priority designators are 07 – 15, while high priority
designators are 01 – 06. This assumption is reinforced by
the fact that at some point in the simulation the author
breaks the model into three separate sub-models: one sub-
model to continue the simulation if the SMU has the demand
on hand, a second sub-model to continue the simulation if
the SMU does not have it on hand and the priority is low,
and a third sub-model to continue the simulation if the SMU
does not have the demand on hand and the priority is high.

29
In addition to simplifying the priority structure,
other assumptions have been made to simplify the process in
ways which do not limit the essential applicability of the
analysis. A second assumption is that all parts are being
transported to the same location. The author assumes that
only Camp Pendleton units are ordering the parts. A third
assumption is that all requisitions are keypunched into
ALTASS I by 0730 and are batched until 1730 where they are
then further processed. In reality requisitions can be
keypunched from 0730 until it is time to create the
courier. The courier is a file that contains a list of
transactions, keypunched by each using unit’s supply clerk,
that need to be processed. The assumption that all
requisitions are keypunched at 0730 does not nullify the
simulation since transactions are not sent to the next step
until 1730 anyway. This assumption will be modified in two
of the scenarios by simulating a real-time ordering process
instead of this batch ordering process. A fourth and final
assumption to simplify the simulation is that once a part
is received by the SMU from a SOS (it was placed on
backorder), it will take at least 24 hours before the part
will be shipped to the using unit. The part will need to be
added to a container that has an active RFID tag then the
container has to be transported to TMO and await shipment.
This assumption is reinforced further due to the fact that
each day gear ready for shipment is staged at TMO and
leaves the next morning at 0800. Any items that arrive
after the truck has left must wait until the next day to be
shipped. The author understands that the time will vary
based on when the item was received but an assumption of 24
hours was logical.

30
As stated earlier in the thesis, increased customer
confidence has been found to be the primary impact ITV has
had on the Marine Corps’ Supply Process. It is assumed that
an increase in customer confidence will result in a
reduction in excessive requisitions or multiple re-orders.
The RFID technology itself has provided the SMU with the
ability to allow the commander to track critical items.
This in turn will increase the customer’s confidence in the
supply system because if they know where the critical items
are then they are less likely to consistently burden the
SMU and request the item on multiple occasions. In the
opinion of the author this advantage is only viable if the
SMU has the part on hand because, as of right now, if an
item goes on backorder the SMU will not have ITV on the
item until the SMU receives the item. The SOS will however
record a shipping transaction on the receiving unit’s DASF,
which lets them know that the part is at least on its way.
Some SOS’s even possess their own tracking system that is
not yet compatible with the Marine Corps’ LTMITV. It is
logically assumed that the lack of visibility from the time
the backordered part is ordered until it reaches the SMU
can potentially cause the using unit to return to old
habits of re-ordering a part or (worse) cannibalizing
another end item.
B. SIMULATON MODEL DESCRIPTION
Arena software was used to develop the simulation. The
simulation was built to model the current Marine Corps
Supply Process, or the As-Is. This model will be modified
for each scenario. The model shows the steps that a demand
goes through after it is inputted into the supply system.

31
Refer to Figure 6 for an overview of the entire simulation
and Figures 7, 8, and 9 for each sub-model respectively.
The simulation begins once a battalion creates a
demand and ends once the battalion has received the item.
The author will run 100, 1000-day periods of the simulation
model. It starts at 0730 in the morning and runs for 1000
days using 24 hours to equal one day. All times are
returned in hours to remain consistent throughout the
simulation.
At the start of the simulation battalions create
demands (denoted by ‘Battalions Create Demands’ create
module) and a variable is created to track the total number
of demands created in that day. These demands are stored on
the using units’ computer system until the courier is
created (denoted by ‘Create Courier’ delay module9) and sent
to the SMU Operations section by 1730 of that day. The
courier is a list of transactions submitted by each using
unit to the SMU Operations section. This courier can be
sent electronically (via email or a file transfer protocol
(ftp) site) or hand delivered (via a CD or diskette). The
SMU Operations section processes the courier overnight and
returns reports to the using units and/or created MRO for
the SMU by 0630 the next day. At this point one realizes
that the current supply system does batch processing vice
real time processing. Regardless of the priority of an item
it will take a minimum of about 23 hours before the unit
will even know that the item is available as noted by the
‘Batch Delay’ record module.
9 In Arena, modules are flowchart and data objects that define the
process to be simulated. [16]

32
Once the couriers are processed reports on the status
of a request are returned to the using units. If the demand
is on hand at the SMU, then an MRO will be created for each
demand for issue. If the demand is not on hand at the SMU
then it is placed on backorder. If the demand is on hand
then the simulation will continue with the ‘SMU OnHand’
sub-model (See Figure 7). Prior to entering the ‘SMU
OnHand’ sub-model the record module ‘# On Hand Parts’ will
count the number of parts that are on hand for that day.
The ‘Pull and Pack Request’ delay module includes the
storage section pulling all items that have an MRO,
packing, packaging, labeling, and adding the item to an
RFID manifest, as well as transporting the item to TMO. The
‘Pick and Batch Delay’ record module will return the
average delay of the batch as well as the time it takes
storage to pick the request. The ‘TMO Delay’ module is the
delay from the time the part arrives at TMO until 0800 the
next day when it is transported to the using unit. The
’Drive to Local Unit’ delay module is the transportation
time from TMO to the using unit. The last two record
modules are for data collection. Once the part has been
received by the unit the simulation ends.
At this point we return to the ‘On Hand at SMU’
decision module. If the demand is not on hand, the
simulation flows into the ‘Low Priority’ decision module.
If the priority is low the simulation then flows into the
‘Backorder by SMU’ sub-model (See Figure 8). Once again the
‘# Low Priority Backorders’ record module will count the
number of demands requested that were not on hand at the
SMU and were placed on backorder as well as are low
priority (priority 07-15). The ‘SMU Awaiting Delivery’

33
delay module represents the probable time delay it will
take a part to arrive, if it is placed on backorder by the
SMU. Once the SMU receives the demand, the item needs to
be tagged and shipped to the using unit. As you can see
there is no pick and pack delay because the SOS ships the
item directly to the SMU who then forwards it to the
appropriate using unit. (In other words, we do not model
the SOS warehousing operations, but treat them as a black
box.) After speaking to personnel at the SMU the author
determined that the time to add the part to an active RFID
tag’s current manifest and the wait time at TMO is 24
hours, thus the ‘TMO and RFID’ module delay is a
deterministic delay of 24 hours. The transportation to the
local units module (denoted by ‘Drive to Using
Unit_SMU_BO’) has the same distribution as the ‘SMU Onhand’
sub-model’s ‘Drive to Local Units’ delay module. Once
again, the final two record modules are for data collection
and the simulation ends when the unit receives the part.
Once again we return to the ‘On Hand at SMU’ decision
module, which is still false. Then flow to the ‘Low
Priority’ decision module, which is now false. This means
that the demand was not on hand at the SMU and the priority
was high. Another record module is used to count the
number of demands that are not on hand at the SMU and have
a high priority, entitled ‘# High Priority Backorders.’
Next the simulation flows into the ‘Backorder by SOS’ sub-
model (See Figure 9). Once the SOS receives the request
they will either send a shipping status to the requesting
unit (if they have it on hand) or a backorder status (if
the item needs to be manufactured, acquired etc…) to the
unit. The ‘SOS Manufacturing and/or Shipping to SMU’ delay

34
module represents the probable time delay it will take a
part to arrive if it is placed on backorder by the SOS. The
‘RFID and TMO’ and ‘Drive to Using_Unit_SOS_BO’ delay
modules are the same as the ‘Backorder by SMU’ sub-model.
Finally the two record modules are for data collection and
when the unit receives the part the simulation ends.
C. METHODOLOY
The author’s research methodology included a
literature review and background interviews from
individuals who assisted in the development of the ITV
system or individuals who are currently using the system.
Travel to Camp Pendleton allowed the author to witness
firsthand how the current system works; The author was able
to collect data as to the location of the interrogators,
the system the end users use to track their parts, the
current supply process, pertinent data associated with a
requisition as it goes through the process, and any
tangible or intangible benefits of using LTMITV/W2W in the
supply distribution process. The author was also able to
collect reports for over 30 days to use to develop
probability distributions for random time variables in the
simulation model. Finally a simulation tool (Arena) was
utilized to study the current supply process and point out
any weaknesses or possible improvements that need to be
made to the process, as it relates to ITV.
Several distributions were created in order to model
the time variances of the simulation. For the percentage
used to give a probable fill rate for orders placed by
using units, it is important to note that the author will
not be modeling detailed inventory positions and queues of
backlogged requests (which might be expected in a warehouse

35
simulation, for example) but will rather take a high level
view of availability across items, and will assume this can
be modeled adequately with a single random variable. This
is appropriate for this thesis because the point of the
analysis is the difference ITV makes given certain stocking
levels, not to investigate the quality of the stocking
levels. The author is also not going to model a detailed
order picking process, with individual picks or batches of
picks processed while other picks wait in queue. Rather,
the author will model only an aggregate completion time for
the order pick process. Both of these high-level views of
the supply process are sufficiently detailed to allow the
author to compare the scenarios.
1. Data Collection
The majority of the data for the thesis was collected
while the author visited the SMU the week of 22-25 March
2006. Subsequent data was acquired via email. The data was
needed in order to develop reasonable time estimates for
the simulation. The time it takes a part to traverse
through the supply process can be considered to be
deterministic at some points but must be modeled with a
random variable at other points. The one true known is that
all parts are born as requisitions that are keypunched
daily by supply clerks and only when the demanded part is
available for issue it becomes tangible and is able to be
tracked through the use of ITV. The working assumption with
ITV seems to be that visibility is only required once the
request has been translated into a tangible good. The
author believes that this working assumption may be flawed,
partly because of imperfect alignment with the SOS
information and material flows.

36
The Unit Performance Report10 (UPR) (Appendix A) was
used to create a probability distribution for the number of
demands created in a day from all the using units the SMU
supports and for the percentage of time the SMU will have a
demand on hand. The complete demands and complete fill
values were used for 41 different reports.
A cumulative recycle database was used to collect data
for the type of priority for each requisition. This Access
Database had a total of 255,053 transactions. Only 81,034
transactions were used to create the probability
distribution for the priority of the requisitions because
the other 174,019 transactions were submitted by the SMU.
The author only wanted to use those transactions that were
meant for a using unit.
Daily transaction listings (DTL) (See Appendix B) were
received via email on July 20, 2006 from the SMU. [15] The
DTL were received from one unit because the SMU does not
separately voucher AS1 transactions for all units. The DTL
covered October 2, 2005 – April 21, 2006 respectively. The
transactions from the DTL were used to gather sample data
for low priority and high priority backorder order ship
times. There were a total of 235 shipping (AS1)
transactions that had a low priority and were backorders
filled by the SMU. There were a total of 2800 AS1
transactions that were high priority and were backorders
filled by a SOS. In each case the number of data points
used were decreased because the order ship times were
either greater than one year or less than or equal to 72
10 The unit performance report provides the supply officer and commander with the number of transactions sent to the SMU, how many were rejected, fill rates, dollar value of gains and losses, the number of back orders, and additional data accumulated.[14]

37
hours. Since this thesis is focusing on the impacts of ITV
and not the supply acquisition process, the author felt
that order ship times over one year cover a separate
problem that requires its own research. Due to the fact
that AS1 transactions do not indicate if the item being
shipped is a backorder, the author assumed that order ship
times that were less than or equal to 72 hours were issues
instead of backorders. These order ship times will be used
in the scenario that will simulate the supply process prior
to ITV (As-Was) to demonstrate one of the impacts of
multiple reordering. It is reasonable to assume that an
increase in demands (due to multiple reordering) will
burden the supply process in some form. The burden will be
depicted as if the storage section was overwhelmed and
could not get all picks to TMO by 1500. In the scenario a
percentage of demands will not make it to TMO by 1500 and
consequently will be delayed for an additional 24 hours.
Another Access Database was used to collect data to
reinforce the statement that multiple reordering took place
during OIF I due to lack of visibility. On August 16, 2006
the author received a link to an ftp site to access the
data. The database included a list of the total demands
during OIF I from March 1, 2003 through May 5, 2003 that
the SMU had on file. Out of the 85,302 demands 70,757 were
placed on backorder. 22,551 of the 70,757 backorders were
multiple reorders. Some NSN’s were not only reordered twice
but three, four, five, and up to nine times, thus 32% of
the total backorders were multiple reorders. The 32%
increase will be used in two scenarios to represent
multiple reordering.

38
Expert opinion was used on many occasions to collect
data for the simulation. Some of the data collected via
expert opinion resulted in deterministic as well as
probability distributions. An expert opinion was used to
determine when and how couriers were submitted to the SMU.
It is essential to note that couriers are processed using a
batching system. All transactions are collected by each
using unit, and at the end of the day the courier is
submitted to the SMU Operations section for processing. The
courier has to be at the SMU at the same time each day
unless otherwise notified. Once the SMU receives the
couriers, the time it takes to process the couriers is
deterministic. [10] Data was also collected to determine
the time it takes for a part to be pulled from location,
packaged, and labeled. The list of items that have to be
pulled are referred to as ‘picks’ by the SMU Storage
Marines. These picks are created based on the number of
MROs that were processed the night prior. The Officer-In-
Charge (OIC) of the Storage Section gave the author the
best, worse, and most likely times that the section
completes all picks in a day. The OIC also informed the
author that once the items were ready for shipment they had
to be transported to TMO and staged. All items that are to
be shipped the very next day must be at TMO by 1500, unless
of course there is a last minute high priority request.
The final data collected using expert opinion related to
the transportation times from TMO to the using unit. These
times depend upon the location of the using unit. The SMU
supports units on the same base, Camp Pendleton, units
stationed at MCAS Miramar, MCAS Yuma, 29 Palms, and Iraq.

39
Only Camp Pendleton transportation times will be used in
the simulation.
Other miscellaneous data was collected to integrate
the entire simulation and develop a reasonable elapsed time
for a requisition throughout the process. These consisted
of the delay between the time the requisition was
keypunched until the courier was created, the delay time
while the items are at TMO awaiting shipment and the exact
locations within the simulation where ITV existed.
D. VARIABLES AND PARAMETERS
The simulation developed uses quantitative modeling to
demonstrate the Marine Corps’ Supply Process under varying
scenarios. The variables modeled must be either
deterministic or random. Choosing the way in which one
models a variable can sometimes be obvious. For example,
courier process time is a simple constant. Others are not
so clear, like number of demands the SMU gets in one day.
In those cases, Arena’s Input Analyzer can help in
developing probability distributions.[16] Each distribution
used in the simulation will be described from the beginning
of the simulation until the end. The reader can refer to
Figure 6 to view a snap shot of the modules in the
simulation. See Table 1 for a summary of all distributions.
Arena’s Input Analyzer has the choice of 12 different
distribution types to include Normal, Beta, Erlang, and
Triangular. After fitting a set of data to each of these
analytical distributions, it gives the p value as well as
test statistic (denoted by D) of the Kolmogorov-Smirnov
goodness-of-fit test. The user can choose the distribution
they prefer, however, the Input Analyzer will recommend the

40
best distribution to use based on the goodness-of-fit test.
The author has chosen to accept the recommended
distribution by Arena for three of the four random
distributions (total demands, fill rate, and high priority
shipping times) but not for the low priority shipping
times. The distribution chosen by the author in the latter
case had an acceptable fit to the data, and was a more
realistic indication of how the data reflects the supply
process.
1. Total Demands Distribution
Inside the ‘Battalions Create Demands’ (Figure 6)
module the number of demands the SMU receives in one day is
used to start the simulation. The data collection involved
getting 41 days of the SMU’s Unit Performance Report (See
Appendix A). The column of interest is entitled ‘Total
Demands’. The value to the right of the column was
different for each of the 41 days. It ranged from as low as
18 demands to as high as 2630 demands. A text file was
created which listed each demand from day 1 to day 41.
This text file was imported into Arena’s Input Analyzer and
a distribution was created. The Input Analyzer recommends
modeling the number of demands the SMU creates in a day
with a normal distribution that has a mean of 825 and a
standard deviation of 508 (see Figure 3). The corresponding
p value for the Kolmogorov-Smirnov Test was equal to 0.0203
with the test statistic (D) equaling .233. A Normal
Distribution is invoked in Arena using the expression NORM
[825,508].

41
Figure 3. Total demands distribution with normal
expression: NORM[825,508] (From [16])
The variables that are created to denote the total
demands are listed below:
• # On Hand Parts Delivered – denotes the number of
parts that the SMU had on hand and were delivered
to the unit
• # SMU Parts Delivered – denotes the number of low
priority backorders that were actually delivered
to the using unit
• # SOS Parts Delivered – denotes the number of
high priority backorders that were actually
delivered to the using unit
The goal of the supply process is that the number of
demands that are created equals the number of demands that
are eventually delivered.
2. Courier and Process Delay Distributions
Following along with Figure 6 and the simulation, the
next two parameters are deterministic. The first
deterministic parameter occurs upon the creation of the

42
courier (list of transactions), found in the ‘Create
Courier’ module. As stated in the assumptions all demands
will be created at 0730. Since the couriers have to be
submitted to the SMU Operations Section by 1730 each day
the delay time is 10 hours. This delay is denoted by the
variable ‘Courier.’
A second deterministic distribution is located in the
next delay module entitled ‘SMU Operations Processes
Couriers.’ Once each using unit submits their courier for
processing this module simulates the actual processing
time. Each morning by 0700 the results of the couriers are
posted in the form of reports to the using units. The delay
time is 13.5 hours. The 13.5 hours is derived from the
using unit’s submission of the courier at 1730 the previous
day and the courier processing completion at 0700 the
following day. This delay is denoted by the variable
‘Process Batch.’ These two delays: ‘Courtier’ and ‘Process
batch’ variables are collectively referred to as the total
batch delay. Two scenarios will be created to possibly
eliminate and/or reduce the batch ordering process by
simulating a real-time ordering process.
3. Fill Rate Probability
Continuing with the simulation found on Figure 6,
there is a decision module entitled ‘On Hand at SMU.’ The
UPR (Appendix A) was used once again to collect data in
order to determine the probability that the SMU would have
the demand on hand. This is denoted by the column entitled
‘Total Complete Fills’ on the UPR in Appendix A. The
complete fill or fill rate is the percentage of the number
of demands the SMU received versus what the SMU actually
has on hand. This value takes into consideration all

43
demands that come through the SMU, even those items that
the SMU never carries, such as an actual tank. If the SMU
carries an item they will have an RO or requisitioning
objective11 for it. There is another column entitled
‘Complete RO Fills’, this percentage is normally larger
than the complete fill percentage but it was not used
because this thesis is examining the supply process from
the using unit’s perspective. All the using unit has to do
is place the requisition and if the SMU does not carry the
item the request will be forwarded out of house to a SOS
who can supply the item. The probability was created by
taking the average fill rate of the 41 data points. Based
on the 41 days of UPRs an average fill rate of 61.3221% was
computed. The variables created to track the fill rate are
listed below:
• # On Hand Parts – denotes the number of parts
that the SMU will have on hand as determined by a
random number of demands requested
• # On Hand Parts Delivered – denotes the number of
parts that the SMU had on hand and were delivered
to the unit
The # On Hand Parts returns the number of demands that
are on hand at the SMU based on the value generated by the
total demands distribution. This is the initial fill rate.
The # On Hand Parts Delivered denotes the number of parts
that the unit actually received. This number could be
different from the # On Hand Parts based on the scenario.
This is the true fill rate since the simulation is from the
11 The SMU can carry a specific amount of an NSN in order to fill
demands. Value can easily be changed by the SMU.

44
point of view of the using unit. What should be seen is
that with ITV these two numbers should always be equal to
each other.
4. Backorder Priority Probability
At this point in the simulation a requisition can
follow three different paths: it can flow into the ‘SMU
Onhand’ sub-model, the ‘Backorder by SMU’ sub-model or the
‘Backorder by SOS’ sub-model. The requisition will flow in
the two latter sub-models only if the ‘On Hand at SMU’
decision module is false. If the SMU does not have the item
on hand then the ‘Low Priority’ decision module will be the
next step. This is where the next distribution is found.
Recall that a low priority requisition will have a priority
between 07 and 15 while a high priority requisition will
have a priority between 01 and 06. The type of priority
probability distribution was created by using the 81,034
transactions from the recycle database retrieved from the
SMU. The total number of each priority designator was used
to create a percentage based on low priority and high
priority. The probability or chance that the transaction
that is placed on backorder will have a low priority is
48.624%. Conversely the probability or chance that the
transaction that is placed on backorder will have a high
priority is 51.376%. The variables created to track this
distribution are listed below:
• # Low Priority Backorders - denotes the number of
parts that will be placed on backorder by the SMU
as determined by a random number of demands
requested

45
• # High Priority Backorders - denotes the number
of parts that will be placed on backorder by the
SOS as determined by a random number of demands
requested
If the ‘Low Priority’ decision module is true then the
simulation will increase the # Low Priority Backorders
variable by the number of demands that flow through that
route of the simulation, flowing into the ‘Backorder by
SMU’ sub-model. If the ‘Low Priority’ decision module is
false then the simulation will increase the # High Priority
Backorders variable, flowing into the ‘Backorder by SOS’
sub-model.
5. ‘SMU OnHand’ Sub-Model Distributions
At this point we will return to the ‘On Hand at SMU’
(see Figure 6) decision module and assume that the SMU does
have the demand on hand. If the SMU has the demand on hand
the simulation will flow into the first sub-model entitled
‘SMU OnHand.’ See Figure 7 for a detailed view of this sub-
model. There are three different delay modules, each with
their own distribution. The first delay module entitled
‘Pull and Pack Request’ represents the time it takes the
SMU storage section to pull, package, and label the part as
well as add the part to a RFID tagged container. Based on
expert opinion given by the Storage Section OIC the author
used a Triangular Distribution for the amount of time it
takes for the Marines to pull the gear, pack it, label it,
and load the manifest information into the active RFID tag.
The following data was given:
• Best case scenario: All ‘picks’ can be pulled,
labeled, packed, and manifested by 1000.

46
• Worse case scenario: All ‘picks’ can be pulled,
labeled, packed, and manifested by 1400.
• Most likely scenario: All ‘picks’ can be pulled,
labeled, packed, and manifested by 1100.
The distribution is given by the expression TRIA [3, 4, 7]
hours. Remember the MROs are available at 0700 each day.
This delay is denoted by the variable ‘Pick Delay.’
Continuing in the ‘SMU On Hand’ sub-model, all items
to be shipped the next day are to arrive at TMO by 1500
each day. Since the pick delay will determine when an item
will be sent to TMO the delay time at TMO was determined
also based on a triangular distribution. In order to
create the triangular distribution the author first
determined how many hours a part would sit at TMO if it
arrived there between 1000 and 1400. These times created a
distribution between 18 and 22 hours. Using the best, most
likely, and worse case values from the pick delay the
author determined the TMO delay has a Triangular
Distribution of 18, 21, and 22 hours, shown by expression
TRIA[18,21,22]. No variable is used to track the TMO delay.
The final distribution for the ‘SMU On Hand’ sub-model
is for the amount of time it takes the parts to be
delivered to the unit from TMO. This distribution is found
in the ‘Drive to Local Units’ delay module of Figure 7.
This distribution was based on expert opinion given to the
author by SMU personnel. The delay time was given with a
Uniform Distribution of two to four hours, using the
expression UNIF [2,4] hours. This distribution represents
the average travel time to a using unit if they were
located on Camp Pendleton. Travel time is important
47
because the further the destination the longer the trip and
the route the driver takes also affects travel time. All
supply distributors must consider the final destination
when estimating the receipt time of an item.
All of the distributions in the ‘SMU OnHand’ sub-model
including the courier, process couriers, and fill rate
distributions determine the final order ship time, denoted
by the outcome variable ‘On Hand OST.’ This variable is
given in hours and will return the amount of time it takes
a unit to receive a part that has been requested if the SMU
has the part on hand.
6. ‘Backorder by SMU’ Sub-Model Distributions
At this point we return to Figure 6 to the ‘On Hand at
SMU’ decision module. If this is false (i.e., if the
demanded item is not on hand) the simulation flows into the
‘Low Priority’ decision module. If this module is true then
the simulation will flow into the ‘Backorder by SMU’ sub-
model. See Figure 8 for a detailed view of the ‘Backorder
by SMU’ sub-model. As stated earlier this sub-model will
only be activated if the SMU does not have a demand on hand
and the priority is low. The type of priority is important
because the low and high priority distributions are
different. There are three different delay modules in this
sub-model: ‘SMU Awaiting Delivery’, ‘TMO and RFID’ and
‘Drive to Using Unit_SMU_BO.’ Each delay module has a
separate distribution.
The first delay module, ‘SMU Awaiting Delivery’
distribution relates to the how long it will take the SMU
to receive an item that was placed on backorder and has a
low priority. Arena’s Input Analyzer was used once again to

48
create the probability distribution. A total of 183 data
points were used to fit an Exponential Distribution,
denoted by the expression [120 + EXPO(221)]. The
corresponding p value for the Kolmogorov-Smirnov Test was
less than 0.01 with D equaling .146. See Figure 4.
Figure 4. Shipping Times for Low Priority Backorders with
expression: [[120 + EXPO(221)] (From [16])
A range of percentile estimates as well as an average
value of the 183 data points that were used to create this
distribution will be computed. The outcome variable ‘#SMU
Parts Delivered’ is directly associated with the low
priority order ship time because if the simulation is ran
for a long time (i.e., 1000 days) the value of this
variable should equal the ‘#Low Priority Backorders’ but if
the simulation is ran for a short time (i.e., 30 days) the
value of this variable will be less than the ‘#Low Priority
Backorders’ value due to the long order ship times.
The next delay module is the ‘TMO and RFID’ module. As
stated in the assumptions once the SMU receives the part
that it placed on backorder for the using unit a
deterministic delay of 24 hours was used to cover the
attachment of the RFID tag and the wait at TMO.

49
The final delay in this sub-model is the ‘Drive to
Using Unit_SMU_BO’ module which is the travel time from TMO
to the using unit. The travel time to the unit has the same
uniform distribution (UNIF [2,4] hours) as in the ‘SMU
OnHand’ sub-model.
All of the distributions in the ‘Backorder by SMU’
sub-model including the courier, process couriers, and
backorder priority distributions determine the final order
ship time, denoted by the outcome variable ‘SMU OST.’ This
variable is given in hours and will return the amount of
time it takes a unit to receive a part that has been
requested, which is not on hand at the SMU, and has a low
priority.
7. ‘Backorder by SOS’ Distributions
Once again we need to return to Figure 6 to the ‘On
Hand at SMU’ decision module. If this is false (i.e., if
the item demanded is not on hand) then the simulation flows
into the ‘Low Priority’ decision module. If this is false
as well (i.e., if the item demanded is high priority), then
the simulation will flow into the ‘Backorder by SOS’ sub-
model. See Figure 9 for a detailed view of the ‘Backorder
by SOS’ sub-model. As stated earlier this sub-model will
only be activated if the SMU does not have the demand on
hand and the priority is high. There are three different
delays modules in this sub-model: ‘SOS Manufacturing and or
Shipping to SMU’, ‘RFID and TMO’, and ‘Drive to
Using_Unit_SOS_BO.’ Each delay module has a separate
distribution.
The first delay module, ‘SOS Manufacturing and or
Shipping to SMU’ distribution will provide the approximate

50
delay of how long it will take an item to be received by
the SMU from the SOS if the item is originally not on hand
at the SMU and has a high priority. A total of 2361 data
points were used to fit a Beta Distribution denoted by the
expression [120 + 6.58e+003 * BETA(0.674, 2.21)]. The
corresponding p value for the Kolmogorov-Smirnov Test was
less than 0.01 with D equaling .122. See Figure 5.
Figure 5. Shipping Times for High Priority Backorders with
expression: [120 + 6.58e+003 * BETA(0.674, 2.21)] (From [16])
A range of percentile estimates as well as an average
value of the 2361 data points that were used to create this
distribution will be computed. The outcome variable ‘#SOS
Parts Delivered’ is directly associated with the high
priority order ship time because if the simulation is ran
for a long time (i.e., 1000 days) the value of this
variable should equal the ‘#High Priority Backorders’ but
if the simulation is ran for a short time (i.e., 30 days)
the value of this variable will be less than the ‘#High
Priority Backorders’ value due to the long order ship
times.

51
The next delay module is the ‘TMO and RFID’ module.
This delay module denotes the deterministic time delay of
placing the part in an RFID tagged container as well as the
wait at TMO for shipment. The delay time is the same as the
‘Backorder by SMU’ TMO and RFID delay which is 24 hours.
The final delay in this sub-model is the ‘Drive to
Using Unit_SOS_BO’ module which is the travel time from TMO
to the using unit. The travel time to the unit has the same
uniform distribution (UNIF [2,4] hours) as in the ‘SMU
OnHand’ sub-model.
All of the distributions in the ‘Backorder by SOS’
sub-model including the courier, process couriers, and
backorder priority distributions determine the final order
ship time, denoted by the outcome variable ‘SOS OST.’ This
variable is given in hours and will return the amount of
time it takes a unit to receive a part that has been
requested, which is not on hand at the SMU, and has a high
priority.
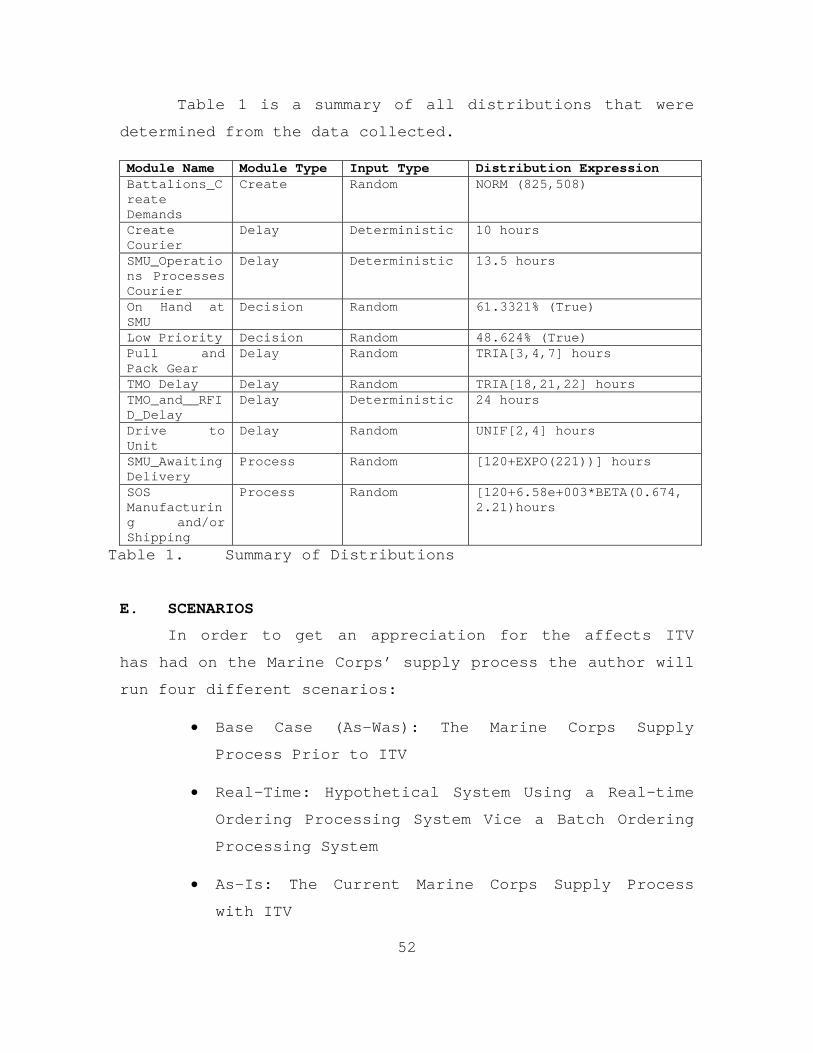
52
Table 1 is a summary of all distributions that were
determined from the data collected.
Table 1. Summary of Distributions
E. SCENARIOS
In order to get an appreciation for the affects ITV
has had on the Marine Corps’ supply process the author will
run four different scenarios:
• Base Case (As-Was): The Marine Corps Supply
Process Prior to ITV
• Real–Time: Hypothetical System Using a Real-time
Ordering Processing System Vice a Batch Ordering
Processing System
• As-Is: The Current Marine Corps Supply Process
with ITV
Module Name Module Type Input Type Distribution Expression Battalions_Create Demands
Create Random NORM (825,508)
Create Courier
Delay Deterministic 10 hours
SMU_Operations Processes Courier
Delay Deterministic 13.5 hours
On Hand at SMU
Decision Random 61.3321% (True)
Low Priority Decision Random 48.624% (True) Pull and Pack Gear
Delay Random TRIA[3,4,7] hours
TMO Delay Delay Random TRIA[18,21,22] hours TMO_and__RFID_Delay
Delay Deterministic 24 hours
Drive to Unit
Delay Random UNIF[2,4] hours
SMU_Awaiting Delivery
Process Random [120+EXPO(221))] hours
SOS Manufacturing and/or Shipping
Process Random [120+6.58e+003*BETA(0.674, 2.21)hours
53
• To-Be: The Marine Corps Supply Process Using a
Real-time Ordering Processing System Vice a Batch
Ordering Processing System
Each scenario will either depict an increase or
decrease in multiple reordering and the misrouting of
requisitions, since these two were found to be main
disadvantages due to a lack of visibility during OIF I. A
decrease in multiple reordering and the misrouting of
requisitions has been the positive effect that ITV has had
on the supply process. The author performed model
verification on all the scenarios to ensure that the input
parameters performed as expected.
After deciphering the entire supply process the author
noticed that the batching of the transactions is a
limitation of the Marine Corp’s Supply Process. Due to
batching, if a unit has a requisition that needs to be
filled immediately the using unit has to contact the SMU
and inform them that the requisition is being placed in the
system but it should not go through the normal channels.
The unit has to do what is referred to as a ‘walkthrough’,
so called because personnel from the requesting unit ‘walk’
the requisition ‘through’ the supply chain. In many cases
the using unit has to travel to the SMU in order to pick up
the part themselves. For two of the scenarios (Real-Time
and To-Be) the author will simulate using a real-time
ordering process instead of a batch process.
1. Base Case (As-Was): The Marine Corps’ Supply Process Prior to ITV
The lack of visibility of assets as well as
requisitions has caused serious problems in the supply
distribution community. The customer did not trust that
54
their requisitions would be received in a timely manner
thus before most major exercises the customer would on many
occasions order more parts than they actually needed for
their “just in case” stash. These extra orders placed a
huge burden on the supply system as well as assisted in the
inaccurate assessment of what units need when they deploy.
Now let’s combine the additional orders placed prior to
deploying to combat or prior to a major exercise, with
duplicate requisitions during a deployment due to a lack of
visibility. At some point it is difficult to assess which
parts are actually needed and which are backup. What you
have is an overloaded system, potentially exacerbated by
excess inventory due to reorders.
In order to simulate the multiple reordering the
author will modify the As-Is format of the simulation. The
first modification will be made to the ‘Battalions Create
Demands’ create module in which the number of demands
created (NORM[825,508]) will be increased by 32%. (Recall
from the author’s data collection that 32% of the total
backorders during OIF I were multiple reorders.) The
increase of the total demands as well as the variance by
32% is to conserve variance in the system. By increasing
the demands and variance by 32% the distribution for the
total demands will be represented by the expression
NORM[1089,583] for this scenario. A second modification
will be to the ‘SMU OnHand’ sub-model. As stated earlier it
is logical to assume that an increase in demands will
burden the supply process in some form. Using the DTL, 207
transactions were found to have an order ship time less
than or equal to 72 hours. These 207 transactions were
chosen because AS1 transactions do to indicate a backorder,

55
only a shipment, therefore the assumption was made that
order ship times less than or equal to 72 hours are issues
that were simply delayed due to the supply system being
over-burdened. A total of 3063 transactions were reviewed,
thus only 6.75% of the total demands will be delayed by 24
hours. This additional delay should increase the ‘On Hand
OST’ variable. See Figure 10 for the change to the ‘SMU
OnHand’ sub-model.
Misrouting of requisitions was the second major
problem due to lack of ITV. Per reference [9] an 11%
container recovery rate was attributed to the effective use
of ITV which allowed them to “locate loss or misrouted
Class IX12 sustainment containers that originated from Camp
Pendleton, CA.” [9] In order to depict misrouting of
requisitions the simulation will show that 11% of all
requisitions never reach the using unit. This change will
affect all three sub-models. See Figures 10, 11, and 12 for
the change to each sub-model. The additional variables that
will be tracked are listed below:
• # OnHand Parts Lost – number of parts that were
originally on hand at the SMU when the demands
was processed but was lost in-transit due to lack
of visibility
• # SMU Backorders Lost – number of backorders that
were filled by the SMU but were lost during
shipment to the using unit due to lack of
visibility
12Class IX supply refers to consumable repair parts as well as
secondary reparables.

56
• # SOS Backorders Lost - number of backorders that
were filled by the SOS but were lost during
shipment to the using unit due to lack of
visibility
These variables denote loss shipments due to lack of in-
transit visibility. In addition to loss shipments a lack of
ITV potentially causes parts to be delivered slower. In
order to show the slow travel time the author will also
increase the earliest and latest travel times by 12 hours
for each one of the sub-models to represent the lack of
ITV. This will increase the drive from the local unit’s
Uniform Distribution from UNIF[2,4] to UNIF[14,16] hours.
2. Real-Time: Hypothetical Improvement Using a Real-Time Order Processing System Vice a Batch Order Processing System
This scenario will take the Base Case (As-Was) and
replace the batch ordering process with a real-time
ordering process. The creation of the courier at the using
unit and the processing of the couriers cause an instant
delay of 23 hours before the unit even knows if the part is
on hand at the SMU or not. In order to simulate a real-time
order processing system the author will change the delay
time in the ‘Create Courier’ delay model from a
deterministic delay of 10 hours to a uniform random delay
of 0 to 10 hours, represented by the expression UNIF[0,10]
hours. The idea behind this distribution is that as soon as
a requisition is keypunched it will be processed from the
start of the simulation (simulation starts at 0730) until
1730. The ‘SMU Operations Processes Courier’ delay module
will be removed all together because with a real-time
ordering system the batching of the couriers no longer

57
exists. Also in a real-time ordering system the customer
can know immediately if the item is on hand, or if it will
be placed on backorder. The customer will also know if they
made an error in their request because the order would not
process correctly. Real-time processing could possibly
eliminate the need for a robust supply section in the
battalion. Potentially each section could order their
parts from their work station and use an intermediate
approval authority to ensure the funds were available
before the order was processed. Since there is still no
ITV, multiple reorders and misrouting of requisitions will
be simulated as well using the same parameters as the Base
Case (As-Was). The variables used to track the number of
parts lost will be tracked in this scenario and the order
ship times should be less than the As-Was scenario. See
Figure 13 for the modified simulation.
3. As-Is: The Current Marine Corps Supply Process
The current supply process has implemented ITV from
the SMU to the using unit. The implementation of ITV has
caused an overall increase in the customer’s confidence in
the supply process which has led to a reduction in multiple
reorders. The reduction can be attributed to the fact that
the using unit now has the ability to check the last known
location, using nodes of the LTMITV system, or the actual
location, using the GPS of the W2W system, of a
requisition. By knowing either one of these two, the using
unit has more confidence that their part will eventually
arrive. In order to simulate the reduction in multiple
reorders the author will run the simulation using the
original total demands distribution of NORM[825,508] vice
the 32% increase used in the As-Was and Real-Time

58
scenarios. If the author’s assumptions are correct there
should be a noticeable decrease in the order ship times.
Another advantage of ITV is the SMU’s ability to
locate misrouted containers, which contain requisitions.
The addition of ITV has enabled the Commander to be able to
track critical items. In order to simulate the reduction
or possible elimination of misrouting requisitions the 11%
loss requisitions will be reduced to 0%. Also the travel
time from TMO to the using unit will be reduced to a
uniform distribution of two to four hours. Figures 6
through 9 depict the As-Is scenario, which has been
described earlier as well.
4. To-Be: The Marine Corps Supply Process Using a Real-time Order Processing System Vice a Batch Order Processing System
It is commonly said that it is never a good idea to
incorporate technology into a flawed process. Usually
technology will only magnify the flaws. A completed study
for the Office of Force Transformation examined military
logistics during OIF in early 2003. The study found that
the “current logistics doctrine is not keeping up with the
technology.” [17] Not only is the Marine Corps’ supply
system outdated, but according to the 1st Marine Division’s
Lesson Learned report, as of May 2003 there was no one
standard Marine Corps Supply system because “I MEF uses
ATLASS I, II MEF uses ATLASS II, [ATLASS I and ATLASS II
are not compatible] and Blount Island Command uses a
different supply system for Maritime Prepositioning Force
(MPF) equipment.” [18] In order for ITV to work properly in
a combat environment I MEF and II MEF had to agree to use
ATLASS I. Since the Marine Corps had to deploy soon after

59
OIF I, in support of OIF II, the lack of visibility of
assets needed to be fixed now. Essentially the Marine Corps
is repairing the supply problem in a round about way.
Theoretically it could possibly take years to develop a
standardized real-time supply system that also incorporates
ITV. This next scenario will show the potential changes in
the supply process if ITV was used in conjunction with a
real-time ordering process.
In order to simulate ITV using real-time ordering
process vice a batch ordering process the author will
change the ‘Create Courier’ delay module’s delay time to a
uniform random delay represented by expression UNIF[0,10]
hours as well as remove the ‘SMU Operations Processes
Couriers’ delay module. The remainder of the simulation
will be the same as the As-Is scenario. See Figure 13 for
the modified simulation.

60
De m a n d sBa tta l i o n s Cre a te
Va ri a b l e sAs s i g n On Ha n d a t SM U
False
Pa rtsUn i ts Re c e i v e
B ac k order by S O S
S MU Onhand
Ba c k o rd e r b y SM U
Ba tc h De l a y
L o w Pri o ri tyTr ue
False
# On Ha n d Pa rts
Ba c k o rd e rs# L o w Pri o ri ty
Ba c k o rd e rs# Hi g h Pri o ri ty
Proc es s es CouriersSM U OperationsCreate Couriers
0
0
0
0 0
0
Figure 6. Simulation

61
RequestP ull and P ack
UnitDrive to Local
On Hand OST Delivered# On Hand PartsTMO DelayDelay
Pick and Batch
Figure 7. Sub-Model: SMU Onhand

62
TMO and RFID Unit_S MU_B ODrive to Using
SMU OST Delivered# SMU Parts
DeliveryS MU A waiting
Figure 8. Sub-Model: Backorder by SMU - Not on Hand & Low Priority Backorder

63
Using_Unit_S OS_B ODrive to
Delivered# SOS PartsSOS OSTRFID and TMO
S MUand or S hipping to
S OS Manufacturing
Figure 9. Sub-Model: Backorder by SOS - Not on Hand & High Priority Backorder

64
RequestP ull and P ack
UnitDrive to Local
On Hand OST Delivered# On Hand PartsTMO DelayDelay
Pick and Batch Ready For TMOTrue
False
Loss_ShipmentsTrue
False
Loss ShipmentsTMO
Not Ready For
Lost# On Hand Parts
0
0
0
0
0
Figure 10. Modified ‘SMU OnHand’ sub-model for As-Was and Real-Time Scenarios

65
TMO and RFID Unit_S MU_BODrive to Using
SMU OST Delivered# SMU Parts
DeliveryS MU A waiting Not Loss In_Transit_2
True
False
Backorders Lost# SMU Loss Shipments_2
0
0
0 Figure 11. Modified ‘Backorder by SMU’ sub-model for As-Was and Real-Time scenarios

66
Drive_to_Local_Units Delivered# SOS PartsSOS OSTdelay
RFID and TMO
to S MUand or S hippingManufacturing
S OSNot Loss In_Transis t_3
True
False
Backorders Lost# SOS Loss Shipments_3
0
0
0
Figure 12. Modified ‘Backorder by SOS’ sub-model for As-Was and Real-Time scenarios

67
DemandsBattalions Create
VariablesAssign On Hand at SMU
False
PartsUnits Receive
Backorder by SOS
S MU Onhand
Backorder by SMU
Real_Time Delay
Low Priori tyTrue
False
# On Hand Parts
Backorders# Low Priority
Backorders# High Priori ty
OrderingReal_Time
0
0
0
0
0
0
Figure 13. Real-Time and To-Be Modified Supply Process – No Batch Ordering

68
THIS PAGE INTENTIONALLY LEFT BLANK

69
V. RESULTS
A. SIMULATION RESULTS The simulation developed by the author covered a period of
1000 days, with each day equaling 24 hours. The simulation was
replicated 100 times to ensure the confidence intervals around
the estimates were sufficiently small.
1. Base Case (As-Was): The Marine Corps’ Supply Process Prior to ITV
Recall the Base Case (As-Was) scenario simulates the supply
process without ITV. The author increased the As-Is total
demands distribution (NORM[825,508]) by 32% (to NORM[1089,583])
in order to demonstrate multiple reordering. 11% of the
requisitions will be lost due to lack of visibility. In order
to show the added effects of a lack of ITV on the supply process
the travel time from TMO to the using unit was modified from
expression UNIF[2,4] to UNIF[14,16] hours. The increase in
travel time is what occurs when requisitions are misrouted due
to lack of ITV. See Table 2 for the results.

70
Demands Variable Result
(mean, confidence
interval)
Majority
Of
Order Ship
Times(OST)
NORM[1089,583] Requisitions
Satisfied by
SMU
54.66% ± 5.8% N/A
On Hand OST 63.32 ± 2.21 hours
2.6 days
99% were below 67
hours
SMU OST
(Low Pri)
392.66 ± 14.34 hours
16.4 days
95% were below 17
days
SOS OST
(High Pri)
1669.85 ± 69.56 hours
69.6 days
83% were below
80 days
Table 2. Base Case (As-Was) Simulation Results
The 54.66% fill rate is based upon the total demands
requested versus the ‘# On Hand Parts Delivered.’ Due to a lack
of ITV the SMU’s initial fill rate of 61.33% has been reduced by
approximately 7%. This reduction is attributed to parts being
lost en route due to a lack of visibility. The order ship times
range from 2.6 days if the part is on hand to a little over 16
days if it is a low priority (SMU fills backorder) to over 69
days if it is a high priority (SOS fills backorder).
In computing the frequency value (‘Majority of Order Ship
Times(OST)’ column in Table 2) for order ship times the author
found it difficult to arrive at a frequency percentage above 90%
for the high priority backorders. This is most likely due to the
variance in the data collected by the author. As one can see

71
from Table 2, the results of the simulation returned a frequency
of only 83%. Conversely the frequency percentage for the order
ship times of the low priority and on hand order ship times was
at least 95%.
2. Real-Time: Hypothetical Improvement Using a Real-Time Order Processing System Vice a Batch Order Processing System
In this scenario the author used the same number of demands
(32% increase from NORM[825,508] to NORM[1089,583]) and
increased the travel time (from UNIF[2,4] to UNIF [14,16] hours)
as in the As-Was scenario. In order to simulate a real-time
order process the Base Case (As-Was) scenario was modified by
changing the deterministic courier delay from 10 hours to a
uniform random delay of 0 to 10 hours (UNIF[0,10]). The
batching of the courier was completely eliminated. The results
are in Table 3.
Demands Variable Result
(mean, confidence
interval)
Majority
Of
Order Ship Times
NORM[1089,583] Requisitions
Satisfied by
SMU
55% ± 5.7% N/A
On Hand OST 45.33 ± 1.58 hours
1.87 days
99% were below
48 hours
SMU OST
(Low Pri)
372.10 ± 15.51 hours
15.5 days
95% were below 16
days
SOS OST
(High Pri)
1633.30 ± 70.12 hours
68 days
84% were below 80
days
Table 3. Real-Time: As-Was Using Real-Time Vice Batch Ordering

72
The fill rate in this scenario increased by one percentage
point over the As-Was scenario. Even though it is a small
increase that increase in supply distribution can have a huge
impact. The improvement of the order ship times should be noted.
Now if SMU has the part on hand the order ship time is
approximately 2 days vice 2.6 days in the As-Was scenario. The
low priority backorder’s order ship time has decreased from a
little over 16 days in the As-Was scenario to 15.5 days when
real-time order processing is implemented. The high priority
backorder’s order ship time has decreased from 69.5 days to 68
days. Although the decrease in each one the order ship times is
only one day, an improvement in other areas of the supply
process could potentially decrease the order ships times by much
more. The frequency of order ship times value for the on hand
and low priority demands show a slight decrease while the
frequency percentage remains the same. For demands that are on
hand in this scenario 99% of the demands will have an order ship
time less than 48 hours vice less than 67 hours (As-Was). For
the low priority backorders 95% of the order ships times will be
less than 16 days vice less than 17 days (As-Was). The high
priority backorders frequency order ship time is still less than
80 days for this scenario but the frequency percentage increased
from 83% to 84%.
3. As-Is: The Current Marine Corps Supply Process with ITV
In this next scenario the author will run the simulation
based on the current Marine Corps’ supply process. In this
scenario there should be a noticeable decrease in the multiple
reorders as well as an elimination of misrouted and/or lost
requisitions. Since there is no multiple reordering the original

73
total demand distribution was used (NORM[825,508]). Also since
there is not an increase in demands all picks will arrive at TMO
by 1500 thus there is no need for the 24 delay for 6.75% of the
demands. The original travel time (UNIF[2,4] hours) to the using
units will be used in addition to eliminating the possible
misrouting and lost requisitions. See Tables 4 for the results.
Demands Variable Result
(mean, confidence
interval)
Majority
Of
Order Ship Times
NORM[825,508] Requisitions
Satisfied by
SMU
61.7% ± 7.3% N/A
On Hand OST 48.42 ± 2.41 hours
2 days
99% were below
52 hours
SMU OST
(Low Pri)
371.85 ± 18.97 hours
15.5 days
94% were below
16.5 days
SOS OST
(High Pri)
1616.29 ± 84.53 hours
67.3 days
85% were below 80
days
Table 4. As-Is: The Current Marine Corps Supply Process with ITV
These results as compared to the two previous scenarios
have two separate distinctions. The fill rate has improved
compared to the As-Was and Real-Time scenarios by at least 6%,
which is significant improvement. The on hand order ship time
did increase from 1.8 days in the Real-Time scenario to 2 days
in the As-Is scenario. This increase in order ship time is
largely due to the batch ordering process currently being used
in the As-Is scenario. The low and high priority ship times

74
slightly decreased in comparison to the Real-Time scenario, but
not by much. The author deduces this decrease is due to less
multiple reordering, decreased travel times, and no loss
shipments. The high priority shipping times still have very long
lead times. The author should also note that the frequency
value for order ship times did improve slightly for parts on
hand at the SMU as well as an increase in the frequency
percentage for high priority backorders.
4. To-Be: The Marine Corps Supply Process Using a Real-time Order Processing System Vice a Batch Ordering Processing System
This last scenario will simulate the supply process with
ITV and a real-time ordering process. In order to simulate a
supply process with ITV and a real-time ordering system the
author slightly modified the As-Is scenario by changing the
courier delay from 10 hours to a uniform random delay of 0 to 10
hours (UNIF [0,10]). The author also eliminated the batching of
the couriers. See Table 5 for the results.

75
Demands Variable Result
(mean, confidence
interval)
Majority
Of
Order Ship Times
NORM[1089,583] Requisitions
Satisfied by
SMU
61.5 ± 7.3% N/A
On Hand OST 31.02 ± 1.54 hours
1.3 days
99% were below 36
hours
SMU OST
(Low Pri)
354.11 ± 18.23 hours
15.5 days
94% were below 16
days
SOS OST
(High Pri)
1609.67 ± 84.66 hours
67 days
86% were below
80 days
Table 5. To-Be: The Marine Corps Supply Process Using a Real-time Order Processing System Vice a Batch Order Processing System
Using a real-time ordering process as well as ITV the
improvements in the supply process are noted by the increased
fill rate from 54%(As-Was) to 61.5%, decreased order ship times
from 2.6 days(As-Was) to 1.3 days (SMU has On hand), decreased
order ship time from 17 days (As-Was) to 15.5 days (not on hand
and low priority) and a decreased order ship time from 69 days
(As-Was) to 67 days (not on hand and high priority). Although
these improvements are small numbers, in supply distribution,
small incremental improvements are seen as huge successes. In a
combat environment having the ability to get a part to a unit a
day early can have a huge impact on the success of the mission.
The author has noted the improvement from the As-Was to the To-
Be but it must be noted that the real-time ordering process has

76
better order ship times than the As-Is supply process as well.
Once again the improvements might not seem that significant but
for a combat unit, receiving a part in 2 days vice 3 days is
critical to mission accomplished. Finally implementing a real-
time ordering process in addition to ITV, 99% of the order ships
times for demands that are on hand will be less than 36 hours,
95% of the order ship times for low priority backorders will be
less than 16 days, and 86% of high priority backorders will be
less than 80 days.

77
VI. CONCLUSION
A. RECOMMENDATIONS
The current Marine Corps’ Supply Process is not perfect but
it is a definite improvement due to the LTMITV and W2W systems.
By developing the simulation the author was able to pinpoint
certain opportunities for improvement in the system that need to
be addressed. One opportunity for improvement is to replace the
legacy batch ordering system with a real time ordering system.
Another is the long order ship times for high priority
backorders. A final area for potential improvement is the lack
of ITV at the SOS.
One recommendation is that the Marine Corps develop a
standard real-time supply system across the Marine Corps that is
deployable and incorporates ITV at all levels of the supply
chain to include the SOS. This system should be web-based and
possess the ability to provide the user with an immediate
response as to the availability of the item they have requested.
This system should also provide estimated shipping dates for any
items that are on hand. Due to the fact that all requisitions
tie directly into the unit’s funds, the system must be
interoperable with the financial management system as well. One
of the most important aspects of the system is that it should be
deployable so the supply distributors of the Marine Corps can
live by the motto of ‘Train as we Fight.’
A second, simpler to implement recommendation is that the
Marine Corps aggressively pursue efforts to incorporate ITV at
the SOS. The added ITV at the SOS could help prevent multiple
reordering, decrease any possible loss shipments from the SOS to

78
the SMU, and further increase the using unit’s confidence in the
supply system. Per the scenarios there was a noticeable
improvement in the order ship times once ITV was added at the
SMU level, hopefully ITV at the SOS (available to view by the
using unit) will have an even greater benefit on the supply
process.
B. FUTURE RESEARCH
Future research needs uncovered during the initial
simulation efforts, which the author would have pursued were
data available, include: conducting a field exercise test which
incorporates the use a GPS system as well as nodal in a dynamic
environment, determine if mesh networking is a viable solution
of assisting in ITV, and the incorporation of passive RFID
technology as well as active in the supply process.
The field exercise test should be conducted because we know
that the supply process with ITV works in a static environment
(meaning combat as well as service support units are not
constantly moving in the area of operations) but what about in a
dynamic environment(i.e., the first three weeks of the war
during OIF I). How will this system hold up when the combat
units are constantly on the move as well as the intermediate
level combat service support units? Due to the three
opportunities for improvement identified, operating in a dynamic
environment could cause increased delays in the order ships
times and possibly cause shipments to be misrouted or even
worse, lost. This testing can determine where interrogators
should be set up, how a handoff should be accomplished if one
CSS unit is moving forward, how reliable is the GPS during
combat, if ITV starts with the supplier and ends at the tactical
level. The second area for possible future research involved the

79
use of a mesh network to implement ITV in a dynamic environment.
Mesh networking could allow units to be able to communicate
regardless of their location. Also each unit would have
visibility of the network and know when unit is not on the
network. This could be due to an equipment failure or the fact
that the unit is in transit. [20] This test could also be
conducted in a field exercise. Lastly the passive RFID
technology can assist in inventory management as well as
identifying the location of an item down to the lowest level
instead of a container. Currently the location of a part is
based upon how accurate the supply clerk is at loading items in
the container that has the active RFID tag attached. If someone
loads the wrong part into the wrong container then we have the
problem of misrouting of requisitions, with ITV.

80
THIS PAGE INTENTIONALLY LEFT BLANK

81
APPENDIX A. UNIT PERFORMANCE REPORT
Excerpt from the Unit Performance Report received by the
SMU. The author received 41 days of this report and pulled the
total demands and total complete fills data in order to create
probability distributions for the simulation. This data was
provided by the SMU in Camp Pendleton.
ACTIVITY: MMC100 GENERAL ACCOUNT PERFORMANCE REPORT DAILY TOTAL DEMANDS 00634 TOTAL COMPLETE FILLS 00425NUMBER TOTAL PARTIAL FILLS 00007INVENTORY GAINS (REV) 00000 % COMPLETE FILL 067.00INVENTORY LOSS (REV) 00000 % PARTIAL FILL 001.10VALUE INVENTORY GAINS 00040 DEMANDS FOR RO ITEMS 00436INVENTORY LOSS 00024 COMPLETE RO FILLS 00396REQN SUBMITTED W/FUNDS 00114 PARTIAL RO FILLS 00005REQN SUBMITTED W/OFUNDS 00000 % COMPLETE RO FILL 095.40CANCELS REQUESTED 00000 % PARTIAL RO FILL 001.10CANCELS CONFIRMED 00004 B/O CANCELLED 00000REQNS REJECTED 00008 REG. B/O REL (TOTAL) 00002PASSED DEMANDS 00201 0 REG. B/O REL (PART) 000001-2DAYS HOT ITEM B/O REL 00000WAREHOUSE ISSUE CONFIRMS 00010 RECEIPTS FROM DUE 00253SHIPMENT CONFIRMS 00000 RECEIPTS NOT DUE 00116 RECEIPTS CLOSED REC 00001 2-JanISSUES TO DISPOSAL 00000RECEIPT DATE THRU PUNCH 00253 CONDITION TRANSFERS 00000RECEIPT PUNCH THRU PROCES 00250 PURPOSE TRANSFERS 00000RECEIPT DATE THRU PROCESS 00250 WAREHOUSE DENIALS 00002 TOTAL REQNIN REJECT 000041-15DAY REDISTRIBUTIONS 00000NO. DAYS TO FIRST RECEIPT 00000 NUMBER BACKORDERS 00251NO. DAYS TO ALL RECEIPT 00248 REGULAR B/O ESTAB 00011 HOT ITEM B/O ESTAB 00048 SERIAL NUMBER COUNTER 7702
GENERAL ACCT FUNDS AVAILIABLE
$289,046 4.18

82
THIS PAGE INTENTIONALLY LEFT BLANK

83
APPENDIX B. DAILY TRANSACTION LISTING
Excerpt from a daily transaction listing in which the AS1
transactions were used to determine the probability distribution
for the delay time it takes from a backorder to be shipped once
the unit places the item on backorder. The DTL was used for low
priority and high priority backorders. The priority is denoted
by the first two numbers in the Priority/TCN/Status column. This
data was provided by the SMU in Camp Pendleton.
ACTIVITY M28349 DAILY HISTORY DATE:5280
DIC13 SOS NSN14 Document Number
Priority/TCN15/Status
AS1 S9CS 1005007162132 M2834952177009 M2834952177003XXX5 AE1 MC1S 1005009215004 M2834952797003 13310BA02790000860 AS1 MC1 1005009215004 M2834952797003 13PDC446129280 AE1 MC1S 1005014084361 M2834952797001 13310BA02790002794 AS1 MC1 1005014084361 M2834952797001 13PDC446129280 AE1 MC1S 1005014090144 M2834952797002 13310BA02790003015 AS1 MC1 1005014090144 M2834952797002 13PDC446129280 AS2 MC1 1005014679435 M2834951296061 13PDC44453279 D6T MC1S 1005014679435 M2834951296061 5280A1SYSTEMGEN AS2 MC1 1010011236705 M2834952557999 05PDC44163279 D6T MC1S 1010011236705 M2834952557999 5280A1SYSTEMGEN AE1 MC1S 2510005356797 M2834952796001 13310BA02790025795 AE1 MC1S 2510005356797 M2834952796005 13310BA02790025795 AE1 MC1S 2510005356797 M2834952796009 13310BA02790025795 AS1 MC1 2510005356797 M2834952796001 13PDC445799280 AS1 MC1 2510005356797 M2834952796005 13PDC445799280 AS1 MC1 2510005356797 M2834952796009 13PDC445799280 AE1 MC1S 2510005909734 M2834952796002 13310BA02790012700 AE1 MC1S 2510005909734 M2834952796006 13310BB52790012700 AE1 MC1S 2510005909734 M2834952796010 13310BB52790012700 AS1 MC1 2510005909734 M2834952796002 13PDC445799280 AS2 MC1 2510006930741 M2834952447006 13PDC43953280
13 Document Identifier Code, abbreviation to identify the type of
transaction. 14 National Stock Number, a 13-digit number used to identify an item of
material in the supply distribution system. 15 Transportation Control Number, used to identify how the item will be
shipped (i.e., ground, air, etc….)

84
THIS PAGE INTENTIONALLY LEFT BLANK
85
LIST OF REFERENCES
1. General Accounting Office Report No. GAO-04-305R, Defense Logistics: Preliminary Observations on the Effectiveness of Logistics Activities During Operation Iraqi Freedom, by Knouse, K., Russell, C., Winterlin, G., Venner, J., Nguyen, T., & Benco, N., 18 December 2003.
2. Sweeney II, Patrick J., RFID for Dummies, 1st ed., pp.10-45,
Wiley Publishing, 2005. 3. Lahiri, S., RFID Sourcebook, 1st ed., pp. 1-62, IBM Press,
2006. 4. Department of Defense. (2006). DoD Announces Radio
Frequency Identification Policy. Retrieved May 31, 2006. 5. Under Secretary of Defense. (2003). Radio Frequency
Identification Policy [Background on the Use of RFID in the DoD Supply Chain]. Washington, DC, Retrieved May 25, 2006, from http://www.acq.osd.mil/log/rfid/Policy/RFID_Policy_Oct03.pdf
6. Woronka, Dave, “The State of the Art in Apparel.”
[http://www.techexchange.com/thelibrary/rfid.html]. June 2006.
7. Heydary, Javed, “Legal Implications of Using RFID
Highlighted.” [http://www.technewsworld.com/story/40203.html]. June 2006.
8. General Accounting Office Report No. GAO/NSIAD-92-258,
Operation Desert Storm: Lack of Accountability Over Material During Redeployment, by Klotz, J. J., Taylor Jr., Harry E., Schmitt, D. A., Wren, J. C., & Schroder, S. L., September 1992.
9. United States Marine Corps, Combat Service Support Group-
15, Supply and Distribution: Bridging the Gap Between Warehouse and Warfighter, pp. 1-44, 2004.

86
10. Interview between K. Morales, Sergeant, SMU Process Reform Center, 1st Supply Battalion, 1st MLG, Camp Pendleton, CA, and the author, 22 – 25 March 2006.
11. “AMS-TAC, Automated Manifest System, Tactical.”
[http://www.marcorsyscom.usmc.mil/sites/Transfdpe/AMS-TAC_Main.asp]. June 2006.
12. Interview between Fitzsimmons, 1st Lieutenant, SMU Customer
Service Officer in Charge, 1st Supply Battalion, 1st MLG, Camp Pendleton, CA, and the author, 23 March 2006.
13. United States Marine Corps, Headquarters USMC, Marine Corps
Order 4400.16G (w/CH 1-3), pp.1-10. 1985. 14. United States Marine Corps, Headquarters USMC, UM 4400-124,
SASSY Using Unit Procedures (w/Ch4), 1984. 15. Interview between Katarzyna Ryzewska, Corporal, SMU
Operations Section, 1st Supply Battalion, 1st MLG, Camp Pendleton, Ca and the author 24 March 2006.
16. Kelton, D., Sadowski, R.P., and Sturrock, D.T., Simulation
With Arena, McGraw-Hill, 2004.
17. Costa, Keith J, ”New Study Looks For Evidence of Network-Centric Logistics in Iraq.” [http://www.oft.osd.mil/library/library_files/article_231_Inside%20The%20Pentagon.doc]. August 2006.
18. U.S. Department of Defense, United States Marine Corps,
Operation Iraqi Freedom Lesson Learned, p.26, [http://www.globalsecurity.org/military/ops/oif-lessons-learned.htm]. August 2006.
19. CRTC Telecommunications Industry Data Collection, “Glossary.” [http://www.crtc.gc.ca/dcs/eng/glossary.htm]. August 2006.
20. Akin, D. and Bardwell, J., Certified Wireless Network Administrator: Official Study Guide, McGraw Hill, 2005.

87
INITIAL DISTRIBUTION LIST
1. Defense Technical Information Center Ft. Belvoir, Virginia
2. Dudley Knox Library Naval Postgraduate School Monterey, California
3. D. C. Boger Naval Postgraduate School Monterey, California
4. Dr. Kenneth Doerr Naval Postgraduate School Monterey, California
5. Glen Cook Naval Postgraduate School Monterey, California
6. Commanding Officer 1st Supply Bn, 1st CLR, 1st MLC Camp Pendleton, California
7. Company Commander, SMU 1st Supply Bn, 1st CLR, 1st MLC Camp Pendleton, California
8. Jerry Rodgers PM J-AIT Support Contractor (INNOLOG) Newington, Virginia
9. Marine Corp Representative Naval Postgraduate School Monterey, California
10. Director, Training and Education, MCCDC, Code C46 Quantico, Virginia
11. Director, Marine Corps Research Center, MCCDC, Code C40RC Quantico, Virginia

88
12. Marine Corps Tactical Systems Support Activity(Attn: Operations Officer) Camp Pendleton, California


![W2W[Seniors] Guys Guide](https://static.fdocuments.us/doc/165x107/568caa771a28ab186da1b219/w2wseniors-guys-guide.jpg)