NAVAL POSTGRADUATE SCHOOL - apps.dtic.mil · xvi THIS PAGE INTENTIONALLY LEFT BLANK . 1 I....
99
NAVAL POSTGRADUATE SCHOOL MONTEREY, CALIFORNIA THESIS Approved for public release; distribution is unlimited ANALYSIS OF THE MARINE CORPS EDUCATIONAL TIER SYSTEM by Andrew L. Holmes March 2013 Thesis Advisor: Elda Pema Second Reader: Mark J. Eitelberg
Transcript of NAVAL POSTGRADUATE SCHOOL - apps.dtic.mil · xvi THIS PAGE INTENTIONALLY LEFT BLANK . 1 I....
NAVAL
POSTGRADUATE
SCHOOL
MONTEREY, CALIFORNIA
THESIS
Approved for public release; distribution is unlimited
ANALYSIS OF THE MARINE CORPS
EDUCATIONAL TIER SYSTEM
by
Andrew L. Holmes
March 2013
Thesis Advisor: Elda Pema
Second Reader: Mark J. Eitelberg

THIS PAGE INTENTIONALLY LEFT BLANK

i
REPORT DOCUMENTATION PAGE Form Approved OMB No. 0704-0188 Public reporting burden for this collection of information is estimated to average 1 hour per response, including the time for reviewing instruction,
searching existing data sources, gathering and maintaining the data needed, and completing and reviewing the collection of information. Send
comments regarding this burden estimate or any other aspect of this collection of information, including suggestions for reducing this burden, to Washington headquarters Services, Directorate for Information Operations and Reports, 1215 Jefferson Davis Highway, Suite 1204, Arlington, VA
22202-4302, and to the Office of Management and Budget, Paperwork Reduction Project (0704-0188) Washington DC 20503.
1. AGENCY USE ONLY (Leave blank)
2. REPORT DATE March 2013
3. REPORT TYPE AND DATES COVERED Master’s Thesis
4. TITLE AND SUBTITLE
ANALYSIS OF THE MARINE CORPS EDUCATIONAL TIER SYSTEM
5. FUNDING NUMBERS
6. AUTHOR(S) Andrew L. Holmes
7. PERFORMING ORGANIZATION NAME(S) AND ADDRESS(ES)
Naval Postgraduate School
Monterey, CA 93943-5000
8. PERFORMING ORGANIZATION
REPORT NUMBER
9. SPONSORING /MONITORING AGENCY NAME(S) AND ADDRESS(ES)
N/A 10. SPONSORING/MONITORING
AGENCY REPORT NUMBER
11. SUPPLEMENTARY NOTES The views expressed in this thesis are those of the author and do not reflect the official policy
or position of the Department of Defense or the U.S. Government. IRB Protocol number ____N/A____.
12a. DISTRIBUTION / AVAILABILITY STATEMENT Approved for public release; distribution is unlimited
12b. DISTRIBUTION CODE A
13. ABSTRACT
This thesis analyzes the effects of certain demographic characteristics on first-term attrition and fleet attrition from the
U.S. Marine Corps. The demographic characteristics studied include age, dependency status, gender, race, the Armed
Forces Qualification Test (AFQT) score, and educational credentials. The Marine Corps currently screens applicants
based on educational credential by utilizing the tier system. In 2012, the Marine Corps decided to shift the home
school educational credential to Tier I status. Thereafter, analysis was conducted to determine the effects of this shift.
Probit regression models were constructed to explain the likelihood of first-term and fleet attrition based on
educational credentials. The data draw from the USMC Total Force Data Warehouse for all enlisted cohorts between
fiscal years 2003 and 2007.
Model results show that educational tiers are inaccurate at predicting first-term and fleet attrition among
certain educational credentials and demographics. The model also shows that the tiers become less accurate once the
home school education credential is moved to Tier I status. Similarly, the results demonstrate that there are different
factors that predict first-term attrition when compared with the survivors of boot camp who attrite after reaching the
fleet. Results also show that gender, dependency status, and educational credentials are all significant factors in
predicting first-term and fleet attrition.
14. SUBJECT TERMS Attrition, Education Credentials, Tier System, Recruiting, Eligibility, Marine
Corps Recruit Command 15. NUMBER OF
PAGES 99
16. PRICE CODE
17. SECURITY
CLASSIFICATION OF
REPORT Unclassified
18. SECURITY
CLASSIFICATION OF THIS
PAGE
Unclassified
19. SECURITY
CLASSIFICATION OF
ABSTRACT
Unclassified
20. LIMITATION OF
ABSTRACT
UU
NSN 7540-01-280-5500 Standard Form 298 (Rev. 2-89)
Prescribed by ANSI Std. 239-18

ii
THIS PAGE INTENTIONALLY LEFT BLANK

iii
Approved for public release; distribution is unlimited
ANALYSIS OF THE MARINE CORPS EDUCATIONAL TIER SYSTEM
Andrew L. Holmes
Captain, United States Marine Corps
B.S., United States Naval Academy, 2006
Submitted in partial fulfillment of the
requirements for the degree of
MASTER OF SCIENCE IN MANAGEMENT
from the
NAVAL POSTGRADUATE SCHOOL
March 2013
Author: Andrew L. Holmes
Approved by: Elda Pema
Thesis Advisor
Mark J. Eitelberg
Second Reader
William R. Gates, Dean
Graduate School of Business and Public Policy

iv
THIS PAGE INTENTIONALLY LEFT BLANK

v
ABSTRACT
This thesis analyzes the effects of certain demographic characteristics on first-term
attrition and fleet attrition from the U.S. Marine Corps. The demographic characteristics
studied include age, dependency status, gender, race, the Armed Forces Qualification
Test (AFQT) score, and educational credentials. The Marine Corps currently screens
applicants based on educational credential by utilizing the tier system. In 2012, the
Marine Corps decided to shift the home school educational credential to Tier I status.
Thereafter, analysis was conducted to determine the effects of this shift. Probit regression
models were constructed to explain the likelihood of first-term and fleet attrition based on
educational credentials. The data draw from the USMC Total Force Data Warehouse for
all enlisted cohorts between fiscal years 2003 and 2007.
Model results show that educational tiers are inaccurate at predicting first-term
and fleet attrition among certain educational credentials and demographics. The model
also shows that the tiers become less accurate once the home school education credential
is moved to Tier I status. Similarly, the results demonstrate that there are different factors
that predict first-term attrition when compared with the survivors of boot camp who
attrite after reaching the fleet. Results also show that gender, dependency status, and
educational credentials are all significant factors in predicting first-term and fleet
attrition.

vi
THIS PAGE INTENTIONALLY LEFT BLANK
vii
TABLE OF CONTENTS
I. INTRODUCTION........................................................................................................1 A. PURPOSE AND BENEFITS OF THIS STUDY ...........................................3 B. RESEARCH QUESTIONS .............................................................................3
1. Primary Questions ...............................................................................4
2. Secondary Question .............................................................................4 C. ORGANIZATION OF THE THESIS ............................................................4
II. LITERATURE REVIEW ...........................................................................................5 A. ATTRITION AND EDUCATION..................................................................5 B. EDUCATION TIERS: SIMPLE IS NOT ALWAYS SIMPLE .................12
C. UNDERLYING ISSUES THAT AFFECT ATTRITION ..........................20
a. Enlistment Standards ..............................................................20
b. Political and Economic Unrest ...............................................21 c. Generational Influencers ........................................................21
D. THE WHOLE PERSON CONCEPT ...........................................................23 a. Non-Cognitive Measures ........................................................23
E. SUMMARY ....................................................................................................26
III. DATA AND METHODOLOGY ..............................................................................27 A. DATA ..............................................................................................................27
B. DESCRIPTIVE STATS FOR THE 2003–2007 SAMPLE .........................29 C. DESCRIPTIVE STATISTICS BY YEAR ...................................................32
D. SUMMARY ....................................................................................................40 E. METHODOLOGY ........................................................................................41
1. Variables .............................................................................................41
IV. ANALYSIS OF MARINE CORPS FIRST-TERM ATTRITION.........................45
A. RESULTS .......................................................................................................46 1. Attrition by Educational Tier ...........................................................46 2. Attrition by Education Credential ...................................................52
B. SUMMARY OF RESULTS ..........................................................................56
V. FLEET ATTRITION ANALYSIS ...........................................................................57
A. DATA ..............................................................................................................57 B. METHODOLOGY ........................................................................................58 C. VARIABLES ..................................................................................................58 D. RESULTS .......................................................................................................63
1. Fleet attrition Analysis by Education Tiers .....................................63 2. Fleet attrition Analysis by Education Credential ...........................66 3. Summary of Results ...........................................................................70
VI. SUMMARY, CONCLUSIONS AND RECOMMENDATIONS ...........................73 A. SUMMARY ....................................................................................................73
1. First-Term Attrition ..........................................................................73 2. Fleet Attrition .....................................................................................74
viii
B. CONCLUSION ..............................................................................................74
C. RECOMMENDATIONS ...............................................................................75 1. Reevaluate Educational Credentials ................................................75
2. Dependency Status .............................................................................76 3. ScreeNing by Individual Educational Credential ...........................76
D. FUTURE RESEARCH ..................................................................................77 1. Home School Education across States..............................................77 2. Non-Cognitive Screening for Tier II Credentials ...........................77
3. Drawdown Effects ..............................................................................77 E. FINAL REMARKS ........................................................................................78
LIST OF REFERENCES ......................................................................................................79
INITIAL DISTRIBUTION LIST .........................................................................................81

ix
LIST OF FIGURES
Figure 1. USMC Non-Prior Service Recruits: FY 2008 to FY 2012, FY 2013 to FY
2018 (projected) .................................................................................................1 Figure 2. Male and Female First-Term Attrition Rates: 4-Year Obligors .......................11 Figure 3. Street to Fleet: 73-Month Continuation Rates by Race/Ethnicity ...................12 Figure 4. Predicted Probability of First-Term Completion by AFQT Score and
Educational Status ............................................................................................18 Figure 5. Support of a Youth’s Decision to Join the Military, by Race/Ethnicity
(% strongly support and somewhat support) ...................................................22 Figure 6. Marine Corps Attrition Rates from 2003–2007 ...............................................30

x
THIS PAGE INTENTIONALLY LEFT BLANK

xi
LIST OF TABLES
Table 1. Percent of Enlisted Accessions Discharged for Failure to Meet Minimum
Behavior or Performance Criteria by Education and AFQT Category:
Fiscal 1971 Enlistees Separated As of June 20, 1973 (percent) ........................8 Table 2. Service Treatment of Secondary School Education Credentials for
Enlistment Purposes During FY 1983, by Service ..........................................13
Table 3. DoD Wide Educational Coding System, 1983 ................................................14 Table 4. Minimum Armed Forces Qualification Test (AFQT) Percentile Score and
Education Tier Required for Enlistment Eligibility in the Marine Corps,
Fiscal Year 2011 ..............................................................................................19 Table 5. Navy Computer Adaptaive Personaility Scales (NCAPS) Traits for High
Scores and Low Scores by Factor ....................................................................25
Table 6. Data Descriptions .............................................................................................28 Table 7. Descriptive Statistics for USMC Enlistees, Fiscal Years 2003–2007 .............31 Table 8. Cross Tabulation of USMC Enlistees by Marital Status, Fiscal Year, and
Gender ..............................................................................................................32 Table 9. Cross Tabulation of USMC Enlistees by Ethnicity, Fiscal Year, and
Gender ..............................................................................................................33 Table 10. Cross Tabulation of USMC Enlistees by Dependent Status, Fiscal Year,
and Gender .......................................................................................................35
Table 11. Cross Tabulation of USMC Enlistees by Age, Fiscal Year, and Gender ........36 Table 12. Cross Tabulation of USMC Enlistees by Attrition, Fiscal Year, and
Gender ..............................................................................................................37 Table 13. Cross Tabulation of USMC Enlistees by Attrition, Marital Status, and
Gender ..............................................................................................................38 Table 14. Cross Tabulation of USMC Enlistees by Attrition, Race, and Gender ............39
Table 15. USMC First Term Attrition by Old Educational Tier ......................................40 Table 16. USMC First Term Attrition by New Educational Tier ....................................40 Table 17. Education Credentials ......................................................................................42 Table 18. Model 1—Variable and Descriptive Statistics .................................................47
Table 19. Regression Results Using Old Education Tiers ...............................................48 Table 21. Regression Results Using New Education Tiers .............................................51 Table 22. Model 3–Variable and Descriptive Statistics of Education Credentials ..........52 Table 23. Model 3–Regression Results Without Tiers ....................................................54 Table 24. Fleet Attrition Rates by Old Educational Tiers................................................58
Table 25. Fleet Attrition Rates by New Educational Tiers ..............................................58
Table 26. Fleet Attrition Analysis—Variable and Descriptive Statistics of Education
Credentials .......................................................................................................59 Table 27. Fleet Attrition Analysis Model 1—Variable and Descriptive Statistics ..........60 Table 28. Fleet Attrition Analysis Model 2—Variable and Descriptive Statistics of
Education .........................................................................................................62 Table 29. Fleet Attrition Analysis—Regression Results Using Old Education Tiers .....64 Table 30. Fleet Attrition Analysis—Regression Results Using New Education Tiers ....65

xii
Table 31. Fleet Attrition Analysis—Variable and Descriptive Statistics of Education
Credentials .......................................................................................................67 Table 32. Fleet Attrition Analysis—Regression Results Without Tiers ..........................68
xiii
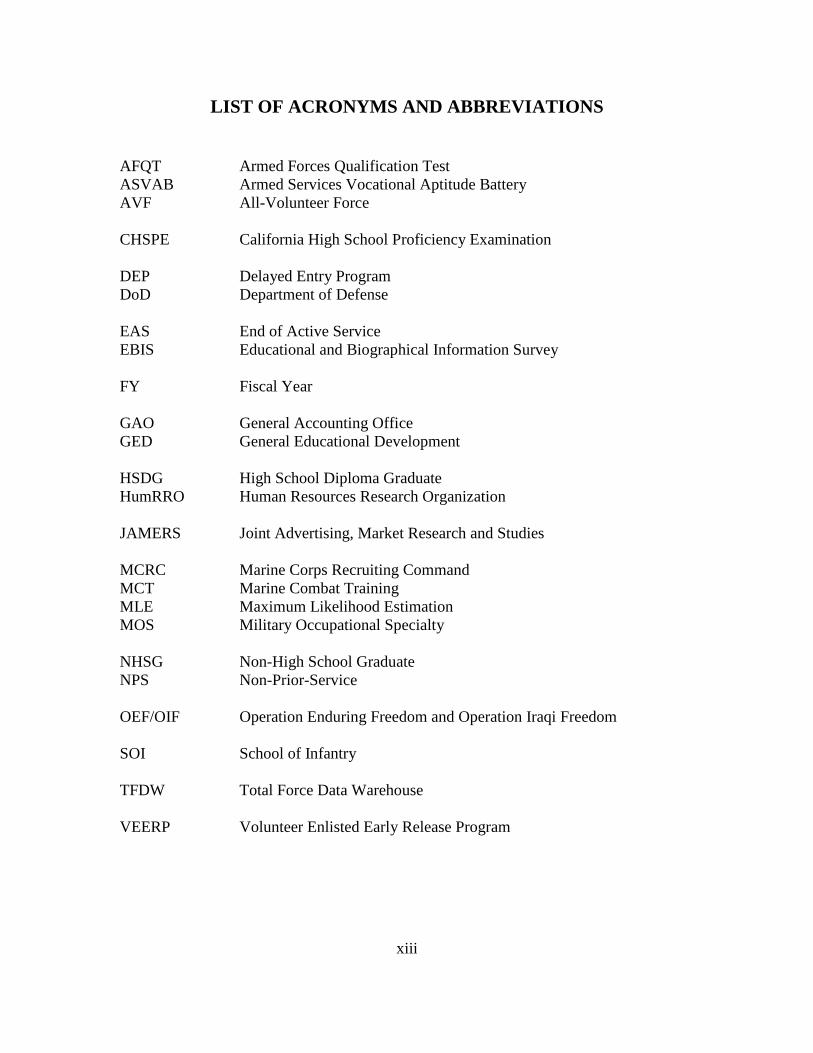
LIST OF ACRONYMS AND ABBREVIATIONS
AFQT Armed Forces Qualification Test
ASVAB Armed Services Vocational Aptitude Battery
AVF All-Volunteer Force
CHSPE California High School Proficiency Examination
DEP Delayed Entry Program
DoD Department of Defense
EAS End of Active Service
EBIS Educational and Biographical Information Survey
FY Fiscal Year
GAO General Accounting Office
GED General Educational Development
HSDG High School Diploma Graduate
HumRRO Human Resources Research Organization
JAMERS Joint Advertising, Market Research and Studies
MCRC Marine Corps Recruiting Command
MCT Marine Combat Training
MLE Maximum Likelihood Estimation
MOS Military Occupational Specialty
NHSG Non-High School Graduate
NPS Non-Prior-Service
OEF/OIF Operation Enduring Freedom and Operation Iraqi Freedom
SOI School of Infantry
TFDW Total Force Data Warehouse
VEERP Volunteer Enlisted Early Release Program

xiv
THIS PAGE INTENTIONALLY LEFT BLANK

xv
ACKNOWLEDGMENTS
I wish to thank my professors Elda Pema and Mark J. Eitelberg for their
unwavering support and timely review. Their attitudes were of immeasurable assistance
throughout the thesis process and could not have been completed without your guidance
and subject-matter expertise.
In addition, sincere thanks are extended to Tim Johnson of Total Forces Data
Warehouse. His assistance in providing the statistical data on multiple occasions is
appreciated, especially when my hard drive crashed and lost everything. I would also like
to thank my numerous editors and manpower colleagues for providing constructive
criticisms for my research thought process.
Last but not least, I would like to thank my wife, Shayla, and daughters, Kirsten
and Jayda, for their support, patience, and encouragement while writing this thesis.
Without their understanding and sacrifice, this thesis would have never been completed.
To my beautiful daughter Kirsten, Daddy is “finally done with his thesis.” I also thank
my parents for providing the best foundation a young man could wish for and being great
parents.

xvi
THIS PAGE INTENTIONALLY LEFT BLANK

1
I. INTRODUCTION
In today’s Marine Corps, a great amount of effort and manpower are expended to
recruit, equip and train Marines efficiently for combat. As a nation that has been involved
in two major military conflicts in the past 10 years, the amount of fiscal strain it costs for
a country to engage in such protracted conflicts is readily apparent. In addition to the
sheer manpower required to maintain a large fighting force such as the Marine Corps, it
takes ingenuity and motivation to operate the sophisticated and technologically advanced
systems currently used.
Each year, Congress sets the end strength for the Marine Corps. Through
recruiting efforts, the Marine Corps uses accessions to meet and maintain that end
strength goal. Historically, the Marine Corps has accessed between 30,000 and 40,000
non-prior-service (NPS) enlisted recruits annually.1 (See Figure 1)
Source: Commander, Marine Corps Recruiting Command, Fiscal Year 2012 Recruiting Report
(Quantico, VA: Commander, Marine Corps Recruiting Command, 2012).
Figure 1. USMC Non-Prior Service Recruits: FY 2008 to FY 2012, FY 2013 to FY
2018 (projected)
1 Commander, Marine Corps Recruiting Command, Fiscal Year 2012 Recruiting Report (Quantico,
VA: Commander, Marine Corps Recruiting Command, 2012).

2
The number of targeted accessions in a given year always depends on two specific
numbers. The first number that determines required accessions is the end-strength level
set for the current fiscal year. The second number that determines the Marine Corps
required accession is the number of losses from the previous year, such as attrites and
retirees. Variables, such as the state of the economy, military compensatory levels, and
civilian compensation also play major roles in predicting annual accessions and retention
numbers. Unlike other military services, the Marine Corps maintains a large first-term
force. First-term attrition losses have averaged between 40 percent and 56 percent of the
Marine Corps’ total losses in the past decade.2 Unfortunately, the Marine Corps is forced
to expend tens of millions of dollars annually to replace the number of recruits lost
through premature separation. Premature separation is a valid concern because the
Marine Corps does not receive the full value of its investment if an enlisted contract is
not entirely fulfilled.
Since 9/11, attrition rates have steadily decreased as a result of various economic
factors and initiatives aimed at reducing the loss of personnel during a recruit’s first term.
The Marine Corps successfully uses incentives, such as retirement transferability plans,
bonuses, and faster promotions, to decrease its number of first-term losses. However,
historical studies suggest that the Marine Corps would be able to cut significantly the
fiscal waste created by first-term attrition with more effective tools for screening its
applicants.
In 1959, Eli S. Flyer became the first researcher to discover the relationship
between attrition and education credentials. The Marine Corps currently utilizes a three-
tier educational system to screen prospective recruits. The United States Air Force first
introduced this system to the Department of Defense in the 1980s. The three-tier system
was then modified in the 1990s. That modification included a shift of adult education
credentials from Tier II to Tier I as a result of political pressure from Congress.3 As
2 Commander, Marine Corps Recruiting Command.
3 Eli S. Flyer, Factors Relating to Discharge for Unsuitability Among 1956 Airman Accessions to the Air Force, WADC-TN-59-201 (Lackland AFB, TX: Personnel Laboratory, Wright Air Development Center, 1959), 15.
3
educational credentials continue to evolve, the three-tier system must continue to be
flexible as more recruits obtain educational credentials from a wide array of educational
sources.
A. PURPOSE AND BENEFITS OF THIS STUDY
The primary purpose of this study is to evaluate the effectiveness of the current
three-tier education system by analyzing first-term attrition trends and probabilities of the
Marine Corps’ enlisted personnel. Recognizing that background factors, such as
education, can be highly correlated with attrition, those factors can be incorporated into
the current system. That incorporation would lead to an improved tier education system
equipped to predict attrition. An improved tier system would allow Marine Corps
recruiters to focus their efforts on high quality applicants with the lowest probability of
attrition.
A secondary purpose of this study is to analyze the educational credentials used
by the Marine Corps to screen prospective enlistees. If new education credentials are
identified that are highly correlated with first-term or delayed entry program attrition, the
credentials can be added or shifted within the tier classification system to strengthen its
predictability. If any aspects of the current screening system are determined to correlate
poorly with attrition, recommendations can be made to reclassify these education
credentials. These adjustments should ensure a reduction in fiscal waste caused by first-
term attrition.
B. RESEARCH QUESTIONS
Enlisted Marines serving under contract comprise a major part of the enlisted
fighting force. Very few enlisted Marines choose to reenlist for another 4-year obligation
once their initial contract term has expired. Once the Marine Corps trains and equips a
Marine for an entire enlistment period, it is important that the Marine Corps receives the
best return on its investment. One way for the Marine Corps recoup its investment is
through the time served by a member. Consequently, common traits that lead to attrition
should be identified and analyzed to determine a person’s probability of serving a
4
complete term of enlistment. The primary research questions also address the use of fleet
attrition to aid in predicting attrition once an enlistee graduates from boot camp. This will
additionally assist in reducing the first term loss of enlisted Marines.
1. Primary Questions
How does educational tier classification affect the first-term attrition of
Marine Corps accessions?
How does educational tier classification affect the first-term attrition of
Marine Corps accessions once they reach the Fleet?
Would shifting the home school credential to educational Tier I affect the
first-term attrition of Marine Corps accessions?
2. Secondary Question
What are some of the underlying issues and reasons why minorities attrite
from the Marine Corps?
C. ORGANIZATION OF THE THESIS
This thesis contains six chapters. Chapter II presents a comprehensive review of
previous studies related to first-term attrition, USMC education credentials, and
underlying issues that correlate with high levels of attrition. Chapter III describes the data
and methodology used throughout the study. It also presents and discusses descriptive
statistics from the dataset. Chapter IV describes the results of an analysis of Marine
Corps first-term attrition. Probit regression models are used on five years of data to
explain how educational credentials and background characteristics are predictors of first-
term attrition. Chapter V analyzes fleet attrition on five years of data to explain how
educational credentials and background characteristics are predictors of first-term
attrition. Chapter VI presents a summary of the findings and provides recommendations
for the Marine Corps and further research.

5
II. LITERATURE REVIEW
Over the years, the U.S. military has used many different screening techniques to
determine the qualifications and abilities of its enlisted applicants and potential draftees.4
Given the harsh and rugged nature of enlisted service, the earliest standards focused
simply on “youth and vitality.”5 As the required skills of the enlisted force expanded
along with the technology of defense, so did the need for more precise methods of
measuring the acquired knowledge, skills, and aptitudes of prospective recruits.
The present-day All-Volunteer Force (AVF) screens applicants for their medical
and physical condition, age, citizenship status, number of dependents, credit and finances,
criminal history, drug or alcohol use, as well as for their education and aptitude, which is
determined by test scores on the Armed Services Vocational Aptitude Battery (ASVAB).
More recently, military services have begun to experiment with other screening devices,
such as personality tests and behavioral or biographical questionnaires.6 Many of these
screening processes are used to predict a military applicant’s probability for successfully
completing a first term of service. A recruit’s failure to complete a first term of service is
called “attrition,” and it has been a defining factor in the way screening methods have
been applied since the early 1950s.
A. ATTRITION AND EDUCATION
Unfortunately, not all enlisted accessions are perfectly fit for the military way of
life. Many of these recruits are not able to complete basic training and their first military
occupational specialty (MOS) school. Even the enlisted recruits able to complete basic
training and MOS school may fall victim to disciplinary infractions or perform very
poorly in their job. These enlisted recruits are often promoted slowly and eventually exit
4 Thomas Trent and Janice H. Laurence, Adaptability Screening for the Armed Forces (Washington,
DC: Office of the Assistant Secretary of Defense [Force Management and Personnel], 1993), 14.
5 Maurice Matloff, American Military History (Washington, DC: Office of the Chief of Military History, U.S. Army, 1973).
6 Jennie W. Wegner, Expanding the Recruiting Market: Non-cognitive Testing (Alexandria, VA: Center for Naval Analyses, 2010), 5.

6
service before their initial contract obligation. The early exit from initial service, also
known as first-term attrition, is one of the most costly budget items in all four branches of
the military. In 1991, using a 1989-dollar metric, adverse first-term attrition was
estimated to be in the range of $200 million per year.7 In 1998, the General Accounting
Office (GAO) estimated that the average combined cost of basic and occupational
training for each enlisted service member was approximately $35,532.8 Based on
standard inflation calculations, this cost would total more than $38,000 per enlistee in
2012, which provides some idea of the military’s early investment in its recruits. These
cost estimates do not account for the expense of recruiting the enlistee, which is
significant, nor the turbulence and administrative costs caused by losing that enlistee and
the need to find a replacement. In 1959, an Air Force Personnel Laboratory technical
report by Eli S. Flyer concluded that the most effective way to predict first-term attrition
and reduce premature discharges is to require that all new Air Force recruits possess a
high school diploma.9 This study was the first to draw a solid connection between
attrition and education. Even though this pioneering study focused solely on the Air
Force, by 1965, all services were analyzing the connection between education level and
the probability of first-term attrition.
Education criteria were eventually combined with aptitude test scores for military
screening.10 Basically, to qualify for enlistment, applicants who did not possess a high
school diploma were required to achieve a higher minimum score on the Armed Forces
Qualification Test (AFQT) than those who graduated from high school or went on to
higher education. This requirement, called the education differential, was first introduced
by the Air Force in 1961, followed by the Army (1962), the Marine Corps (1965), the
7 Stephen Klein, Jennifer Hawes-Dawson, and Thomas Martin, Why Recruits Separate Early (R-3980-
FMP) (Santa Monica, CA: RAND Corporation, 1991).
8 U.S. Government Accounting Office, Military Attrition: Better Data, Coupled with Policy Changes, Could Help the Services Reduce Early Separations (GAO/NSAID-98-213), Washington, DC: GPO, 1998.
9 Flyer, Factors Relating to Discharge for Unsuitability Among 1956 Airman Accessions to the Air Force, 15.
10 Ibid., 4.

7
Department of Defense (DoD) (1965 under the draft), and the Navy (1972).11 Flyer’s
actual recommendation was to ban high school dropouts completely from enlisting or
being drafted, although such action would have been impractical and far too severe at the
time for all but possibly the Air Force.12
By the early 1970s, coincident with the end of conscription, direct references to
the General Educational Development (GED) certificate for high school equivalency
began to appear in the official aptitude standards of the military services. For example,
beginning in October 1972, the Navy began to differentiate its required minimum scores
on the AFQT by High School Diploma Graduate, GED, and Non-High School
Graduate.13 It should be noted that, at the official start of the AVF in 1973, the military
services continued to employ their own entry standards, as they still do currently.
However, they were also using a variety of aptitude testing instruments with their own
cut scores based on an applicant’s education, which was often defined differently from
service to service. In other words, in one service, a GED or similar equivalency
certificate might be treated separately from high school graduation or non-graduation,
while in another service; it could be treated as the practical equivalent of high school
graduation. As the number and type of secondary credentials increased, and without some
uniform method of defining them for enlistment purposes, the treatment of these
credentials from one service to another might appear almost haphazard.
Meanwhile, attrition rates continued to rise without conscription due to changes in
military separation policies for those who joined under strictly voluntary conditions.
Generally, it became easier for enlistees to fabricate a reason for separation or to be
discharged for good cause by the military branch. As it turned out, Flyer’s findings from
11 Eitelberg, Laurence, Waters, and Perelman, Screening for Service: Aptitude and Education Criteria
for Military Entry, Appendix A, 137–152.
12 Janice H. Laurence, Education Standards for Military Selection: From the Beginning (Alexandria, VA: Human Resources Research Organization, 1984).
13 Eitelberg, Laurence, Waters, and Perelman, Screening for Service: Aptitude and Education Criteria for Military Entry, 145.
8
decades earlier continued to hold true in the all-volunteer environment: on average, the
attrition rates for high school graduates were half as large as the attrition rates for recruits
who had dropped out of high school.14
In 1977, Cooper reevaluated Flyer’s findings regarding the importance of a high
school diploma and arrived at a similar conclusion. In fact, Cooper claimed that Flyer had
possibly underestimated the importance of the diploma, as Cooper’s own data showed
that high school dropouts were three-times more likely to be discharged for “failure to
meet minimum behavioral or performance criteria” during their first term of service.15
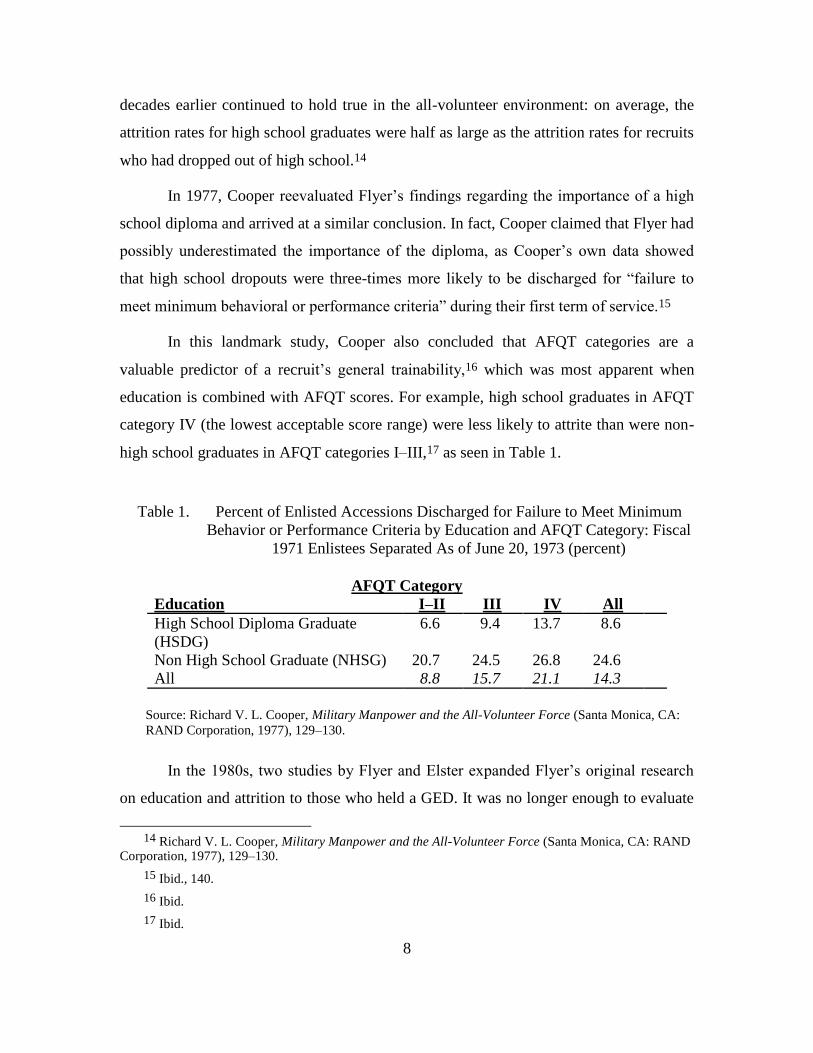
In this landmark study, Cooper also concluded that AFQT categories are a
valuable predictor of a recruit’s general trainability,16 which was most apparent when
education is combined with AFQT scores. For example, high school graduates in AFQT
category IV (the lowest acceptable score range) were less likely to attrite than were non-
high school graduates in AFQT categories I–III,17 as seen in Table 1.
Table 1. Percent of Enlisted Accessions Discharged for Failure to Meet Minimum
Behavior or Performance Criteria by Education and AFQT Category: Fiscal
1971 Enlistees Separated As of June 20, 1973 (percent)
AFQT Category
Education I–II III IV All
High School Diploma Graduate
(HSDG)
6.6 9.4 13.7 8.6
Non High School Graduate (NHSG) 20.7 24.5 26.8 24.6
All 8.8 15.7 21.1 14.3
Source: Richard V. L. Cooper, Military Manpower and the All-Volunteer Force (Santa Monica, CA:
RAND Corporation, 1977), 129–130.
In the 1980s, two studies by Flyer and Elster expanded Flyer’s original research
on education and attrition to those who held a GED. It was no longer enough to evaluate
14 Richard V. L. Cooper, Military Manpower and the All-Volunteer Force (Santa Monica, CA: RAND
Corporation, 1977), 129–130.
15 Ibid., 140.
16 Ibid.
17 Ibid.

9
education based on high school graduation alone, given the rapidly widening use by
young people of high school equivalency programs and other nontraditional avenues
toward obtaining a high school credential. Flyer and Elster found that GED credential
holders attrite at a rate twice as high as those with a traditional high school diploma.18
Thus, the attrition rates of GED holders were roughly comparable to those of high school
dropouts who did not possess a GED credential. The same result was found with GED
holders who had completed Job Corps training.19
Flyer and Elster again extended their research to include married and unmarried
recruits. They found that married recruits were more likely to attrite than were single
recruits.20 They also discovered that the attrition rate for recruits who enlisted at the age
of 17 was higher than for recruits between the ages of 18–22. Further, recruits older than
22 years of age tended to experience higher attrition rates.21 This finding was later
confirmed by Buddin, who found that the probability of first-term attrition increased by
one percent each year beyond the age of 17 years old at the time of enlistment.22
Flyer also conducted a study in 1984 that analyzed first-term attrition among
enlisted personnel grouped by race/ethnicity. At this point relatively little research had
been conducted to examine attrition by race or ethnicity. Indeed, certain ethnic identifiers
were not even available in the Defense Department’s automated databases until 1977.
Among persons who entered the military from 1973 through 1979, Flyer found that
Hispanic male recruits had lower attrition rates in all services and across all educational
18 Richard S. Elster and Eli S. Flyer, A Study of the Relationship Between Education Credentials and
Military Performance Criteria (Monterey, CA: Naval Postgraduate School, 1982), II–25.
19 Ibid., IV–3.
20 Eli S. Flyer and Richard S. Elster, First Term Attrition Among Non-Prior Service Enlisted Personnel: Loss Probabilities Based on Selected Entry Factors (Monterey, CA: Naval Postgraduate School, 1983), 43.
21 Ibid., 47.
22 Richard Buddin, Analysis of Early Military Attrition Behavior (Santa Monica, CA: RAND Corporation, 1984), 23.

10
levels.23 Also, attrition findings for Blacks in the Navy, Marine Corps, and Air Force
were much higher for white and Hispanic recruits, with the largest disparity occurring in
the Marine Corps.24
In 1990, Quester, North, and Kimble reported the results of research that built
upon previous attrition studies from the preceding decade. The study by Quester and her
associates was directly tailored to the United States Marine Corps, focusing on the
characteristics of enlistees that make them good Marines.25 Researchers measured
success using three criteria: (1) completing a first-term of enlistment; (2) promotion to
the rank of E-4; and (3) retention beyond the first term of service.26 The findings in this
study confirmed the findings of Flyer and Elster that first term recruits over the age of 20
years old are most likely to adapt successfully to the Marine Corps way of life. Other
recruit characteristics associated with success across all three criteria were possession of
a high school diploma, an AFQT score above the 50th
percentile, postponing entry into
active duty through the Delayed Entry Program (DEP), and meeting the in-service weight
standard for one’s height.27
More specifically, Quester et al. found that among overweight recruits, the
probability of first-term attrition was 15 percentage points higher for those who were not
overweight. Overweight recruits were also 7 to 16 percentage points less likely to reach
the rank of E-4, and retention beyond the first term of enlistment was 7 percentage points
lower for those recruits who met the weight standards for their height. Further,
participation in the DEP increased a recruit’s probability of successfully completing a
first term of enlistment by 7 to 9 percentage points. Additionally, recruits over the age of
20 were considerably more likely than others to reach the rank of corporal within the first
term of enlistment.
23 Eli S. Flyer, First Term Attrition Among Enlisted Personnel Grouped by Racial/Ethnic Background
(Monterey, CA: BDM Corporation, 1984), 11.
24 Ibid., 12.
25 Aline O. Quester, James H. North, and Theresa H. Kimble, Identifying Successful Marine Corps Recruits (Alexandria, VA: Center for Naval Analysis, 1990), 5.
26 Ibid.
27 Ibid., 21.

11
In 2010, Quester analyzed the correlates of first-term attrition among recruits who
entered the Marine Corps from 1979 to 2009. Quester found that first-term attrition rates
had fallen in recent years. This drop in attrition can be seen in Figure 1, and it is more
evident for women than for men.28 For the most recent cohorts, attrition rates among
women have averaged 34 percentage points higher than for their male counterparts. In
earlier years, such as 1989, female attrition was almost 20 percentage points higher than
the average rates for men.
Source: Aline O. Quester, Marine Corps Recruits: A Historical Look at Accessions and Bootcamp
Performance (Alexandria, VA: Center for Naval Analyses, 2010), 43.
Figure 2. Male and Female First-Term Attrition Rates: 4-Year Obligors
Quester also examined long-term behavior among racial groups. As depicted in
Figure 3, she found that 73-month continuation rates were highest for Black and Hispanic
Marines. Moreover, the continuation rates for Black men were the highest of any
racial/ethnic group. Continuation rates for Hispanic men were high, but generally below
those for Hispanic women, non-Hispanic Black women, and Black men.29
28 Aline O. Quester, Marine Corps Recruits: A Historical Look at Accessions and Bootcamp
Performance (Alexandria, VA: Center for Naval Analyses, 2010), 43.
29 Ibid., 47.

12
Source: Aline O. Quester, Marine Corps Recruits: A Historical Look at Accessions and
Bootcamp Performance (Alexandria, VA: Center for Naval Analyses, 2010), 47.
Figure 3. Street to Fleet: 73-Month Continuation Rates by Race/Ethnicity
B. EDUCATION TIERS: SIMPLE IS NOT ALWAYS SIMPLE
As previously observed, the expanded use of secondary school educational
credentials—along with no uniform standard for dealing with them—resulted in
markedly different enlistment criteria from one military service to the next. For example,
as seen in Table 2, in 1983, an applicant with a California High School Proficiency
Examination (CHSPE) Certificate was treated as a high school graduate in the Air Force,
but as a non-graduate in the three other services. (CHSPE recipients are often talented
high school juniors who seek to skip their senior year and attend college.) Conversely,
persons with a High School Attendance Certificate or a High School Completion
Certificate were treated as a non-graduate in the Air Force and a graduate in the other
three services.

13
Table 2. Service Treatment of Secondary School Education Credentials for
Enlistment Purposes During FY 1983, by Service
Secondary School
Credential
Treatment for Enlistment Purposes*
Army Navy Marine Corps Air Force
High School Diploma
(State Accredited) Grad Grad Grad Grad
High School Diploma
(Non-State Accredited) Grad Grad a Grad Non
High School Attendance
Certificate Grad Grad Grad Non
High School Completion
Certificate Grad Grad Grad Non
GED Certificate GED b GED b Non GED b
High School Diploma Based
on GED GED b GED b Non GED b
Adult High School Diploma Grad c Grad d Grad e Grad f
California High School
Proficiency Examination
(CHSPE) Certificate Non Non Non Grad
Correspondence School Grad g GED Grad g Grad h
*Grad is high school diploma graduate. GED is high school equivalency. Non is non-high school graduate.
a Enlisted as high school diploma graduates on a case-by-case waiver basis.
b Enlisted under standards separate from both high school diploma graduates and non-graduates but reported
as non-high school graduates.
c Enlisted as high school diploma graduates provided in the diploma was awarded or authorized by the state.
d Enlisted as high school diploma graduates provided that the program is recognized by the state.
e Only Individuals accessed as part of test programs (to determine success rates of adult high school
programs) are enlisted as high school diploma graduate3; all others are enlisted as non-high school graduates.
f Enlisted as high school diploma graduates provided that the diploma was not Issued as a result of the GED
test only.
g Enlisted as high school diploma graduates provided that the course/program is accredited by the National
Home Study Council.
h Enlisted as high school diploma graduates provided that the school is accredited by the state or jurisdiction.
Source: Eitelberg, Laurence, Waters, and Perelman, Screening for Service: Aptitude and Education
Criteria for Military Entry, 122.
At the Defense Department level, nineteen categories were developed to classify
applicants for enlistment or recruits by their education level. These categories are shown
in Table 3 and were intended to simplify treatment of secondary school credentials across
the services.

14
Table 3. DoD Wide Educational Coding System, 1983
Source: Trent and Laurence, Adaptability Screening for the
Armed Forces, 21.
At the same time, a number of studies were undertaken to differentiate among
these credentials and separate them by the predicted performance of recruits who
possessed the credentials. In 1983, DoD contracted with the Human Resources Research
Organization (HumRRO) to evaluate enlistment policies that affect secondary school
credentials.30 Data from the Educational and Biographical Information Survey (EBIS)
indicated that alternative credential holders, on average, did not adapt as well as high
school graduates to military life. Attrition rates, for example, were found to be
considerably higher for credential holders than for recruits with a traditional high school
diploma.31 In another study at the Naval Postgraduate School (NPS), Franke explored the
possibility of dividing education levels and credentials into separate categories by using
30 Trent and Laurence, Adaptability Screening for the Armed Forces, 16.
31 Ibid., 22.
Table 3: DOD Wide Educational Coding System, 1983
1 Less than High School Diploma
7 Correspondence School Diploma
8 Completed One Semester of College
9 Currently in High School
B Adult Education Diploma
C Occupational Program Certificate
D Associate Degree
E Test-Based Equivalency Diploma
G Professional Nursing Diploma
H Home Study Diploma
J High School Certificate of Attendance
K Baccalaureate Degree
L High School Diploma
M Credential Near Completion
N Master's Degree
R Post Master's Degree
S High School Senior
U Doctorate Degree
W First Professional Degree

15
first-term attrition probabilities as a guide.32 At the same time, Eitelberg recommended to
the Office of the Secretary of Defense that these separate education groups be called
“tiers” as a way to distinguish them from AFQT categories (and their component scores),
which would undoubtedly would be used in combined form during enlistment
screening.33
Research during this period consistently supported the findings of previous
studies showing that, on average, the attrition rates of GED holders were closer to those
of high school dropouts than to graduates.34 Apparently, based on measures of military
performance, the GED was less “equivalent” to a high school diploma than to no diploma
at all. These research results supported creating two education categories or “tiers,”
divided by those who possessed a traditional diploma and those who did not, regardless
of the GED. Although the research argued strongly for two tiers, it did not argue
convincingly. Placing GED holders in a tier with non-graduates would essentially say
that an important American institution, the Department of Defense, believes that a GED
is not the practical equivalent of actually finishing high school with a traditional diploma.
On the other side of the argument, GED Testing Service representatives charged that the
DOD was not using the GED educational credential for what it was originally intended to
do. According to the GED Testing Service, a GED credential was not designed to predict
attrition.35 The GED Testing Service claimed that enlistees with GEDs had comparable
education skills to those of school graduates. In 1982, the Educational and Biographical
Information Survey (EBIS) was asked to evaluate existing education enlistment policies.
Once the EBIS results were published, it was discovered that, on average, enlistees with
an alternative educational credential did not adapt to military life as well as enlistees with
a traditional diploma. With pressure from the GED industry and other defenders of
32 David B. Franke, “An Evaluation of Marine Corps Educational Credentials” (master’s thesis, Naval
Postgraduate School, 1983).
33 Memo from Professor Mark Eitelberg to Director, Accession Policy, Office of the Secretary of Defense, 1983. The term “tier” was chosen to differentiate it from AFQT “categories,” which are used in reporting AFQT scores.
34 Trent and Laurence, Adaptability Screening for the Armed Forces, 6.
35 Ibid., 10.

16
equivalency certificates, GEDs were eventually singled out as a separate category with
minimum aptitude test scores set between those of non-graduates and traditional
graduates.36
In 1987, after considerable study and coordination with the military services, DoD
introduced the tier classification system for educational credentials. The tiers were
structured as follows.
Tier I: High School Diploma Graduate (HSDG)
Traditional high school graduates
Completed one Semester of College
Tier II: Alternative Credential Holder
Test-Based Equivalency Diploma
Adult Education Diploma
Correspondence School Diploma
Occupational Program Certificate
Home Study Diploma
Tier III: Non-High School Diploma Graduate (NHSDG)
In 1997, research by Laurence, Ramsberger, and Arabian examined yet again the
first-term attrition rates of recruits with various education credentials and aptitude. The
researchers found that, on average, recruits with an alternative education credential had
an attrition rate of 35 percent, while those with a traditional diploma had a rate of 22.5
percent.37 This study supported the tier system then in practice, except for adult education
credential holders and persons without a traditional high school diploma who completed
one semester of college.38 Indeed, the results suggested that adult education holders and
those with one semester of college should be in Tier II, rather than in Tier I, based on
their performance and probability of first-term attrition.39
36 Trent and Laurence, Adaptability Screening for the Armed Forces, 7.
37 Janice H. Laurence, Peter F. Ramsberger, and Jane M. Arabian, Education Credential Tier Evaluation (Arlington, VA: Human Resources Research Organization, 1997), 12.
38 Ibid.
39 Ibid., 13.

17
Thirty years after Flyer’s original research connecting attrition to education, he
conducted another comprehensive study using enlisted cohorts from 1980 through 1995.
Similar to the study by Laurence et al. discussed above, Flyer found that recruits with an
adult education diploma and those who were high school dropouts but attended one
semester of college had first-term attrition rates high enough to argue against placing
them in Tier I.40 Flyer recommended that the credential holders of adult education and
one semester of college be subject to increased screening to mitigate their attrition rates.
In 2004, a Naval Postgraduate School Master’s thesis by Christopher Bownds
studied attrition and education credentials to ascertain if the three-tier classification was
outdated. In his study, Bownds confirmed the work of Laurence et al. and Flyer in finding
that recruits with adult education credentials and those with one semester of college but
no traditional high school diploma have attrition rates that do not justify their being
placed in Tier I. Bownds recommended that these two education credentials be placed in
Tier II because their attrition rates are more in line with Tier II and Tier III recruits.41
Bownds then developed a screening matrix for analyzing incremental AFQT scores and
educational credentials with a probable completion rate that would provide more accurate
predictability.42 This screening matrix can be seen in Figure 4.
40 Eli S. Flyer, Educational Credentials and First-Term Attrition, (Unpublished: Directorate for
Accession Policy Office of the Assistant Secretary of Defense [Force Management], 2002), 1.
41 Christopher D. Bownds, Updating the Navy’s Recruit Quality Matrix: An Analysis of Educational Credentials and the Success of First-Term Sailors (master’s thesis, Naval Postgraduate School, 2004), 41.
42 Ibid., 53.

18
Source: Bownds, “Updating the Navy’s Recruit Quality Matrix,” 53.
Figure 4. Predicted Probability of First-Term Completion by AFQT Score and
Educational Status
A 2007 master’s thesis by Jon K. Neuhalfen examined early attrition from the
military by focusing on the DEP and Bootcamp training. Neuhalfen’s study confirmed
previous research showing that education credentials and AFQT scores are highly
correlated with Bootcamp and DEP attrition. Similar to Bownds, Neuhalfen discovered
the current screening system of tiers and AFQT scores are not as accurate as possible in
predicting attrition.43 Further, his findings included variables, such as married recruits,
recruits without a job designation, and female recruits who had higher rates of attrition.
In 2009, another Naval Postgraduate School thesis by John J. Andrew studied the
effects of educational credentials on first-term attrition in the U.S. Navy. Essentially,
Andrew found that the current educational tier system is flawed with respect to education
credential assignment and attrition predictability. Through a survival analysis, he also
discovered different factors correlate with attrition during the first 90 days of
43 Jon K. Neuhalfen, “Analysis of Recruit Attrition from the Navy’s Delayed Entry Program and
Recruit Training Command” (master’s thesis, Naval Postgraduate School, 2007), 135–139.

19
enlistment.44 As a replacement to the current screening method, Andrew proposed three
screening tables to improve the predictability of first-term attrition in the Navy.
Interestingly, Andrew found that the demographic variable with the strongest correlation
to first-term attrition was “single with dependents.”45
Currently, the U. S. Marine Corps uses a combination AFQT scores and
educational credentials to screen and determine an enlistee’s eligibility for service, as
well as any special enlistment programs or monetary bonuses. As seen in Table 4, an
enlistee’s education level is cross-tabulated with minimum AFQT and GT scores to
qualify for enlistment.
Table 4. Minimum Armed Forces Qualification Test (AFQT) Percentile Score and
Education Tier Required for Enlistment Eligibility in the Marine Corps,
Fiscal Year 2011
If an applicant is a: Then the minimum
AFQT score required
is…
and the minimum GT score
required is…
(Not waiverable)
Tier I
High School Graduate
21 80
Tier II
Alternative Credential
31 90
Tier III
Non-high school graduate
50 90
Tier I
High School Senior
21 80
Source: Adapted from U.S. Marine Corps, Marine Corps Order P1100.72C, Military Procurement Manual,
Volume 2, Enlisted Procurement (Short title: MPPM ENLPROC) (Washington, DC: U.S. Department of
the Navy, 2004), 3.75.
44 John J. Andrew, “Improved Screening for Navy Enlistment” (master’s thesis, Naval Postgraduate
School, 2009), 63.
45 Ibid., 66.

20
C. UNDERLYING ISSUES THAT AFFECT ATTRITION
The U. S. Marine Corps and other services emphasize the importance of a high
school diploma in predicting a recruit’s adaptability to military life. However, even
though the high school diploma is a strong predictor of first-term attrition, a number of
other background or demographic factors tend to correlate with a person’s likelihood of
successful performance in service.
This section discusses external influences or underlying reasons for attrition
across demographics. It is important to understand these other influences so that
manpower administrators are better equipped to improve policy, procedures, and
recruiting efforts to increase the quality of recruits.
a. Enlistment Standards
Although the high school diploma is one of the most accurate predictors of
first-term attrition, this factor has historically been one of the major disqualifiers for
many Black and Hispanic youth who desire to serve in the military. Hispanic youth have
much higher high school dropout rates than do white and Black youth. Given that
approximately 95 percent of recruits are high school graduates, low graduation rates
among certain demographics present a major obstacle for some youth.46 For instance
Hispanics have one of the lowest attrition rates among all other racial/ethnic groups. It is
further shown in Quester’s study for CNA that, once Hispanic enlistees enter the military
they have a higher probability of completing their first term of enlistment and continuing
service beyond their initial obligation.47 If these enlistment standards are mitigated by
extra screening efforts, then proportionately more persons in certain demographic groups
may be able to enlist despite not having a high school diploma.
Another disqualifying factor that may affect first-term attrition differently
for certain demographic groups is the military’s height and weight standards. Hispanic
46 Nolan and Bicksler, Minorities in the Enlisted Force: Is the U.S. Military Representative of the
Nation It Defends?, 22.
47 Aline O. Quester, Marine Corps Recruits: A Historical Look at Accessions and Bootcamp Performance (Alexandria, VA: Center for Naval Analyses, 2010), 47.

21
and Black youth, on average, are more overweight than their white counterparts.
Approximately 71 to 88 percent of Hispanic males and 69 to 86 percent of Black males
meet the military’s weight standards. By comparison, 79 to 91 percent of white males
meet the military’s weight standards. Thus it clear to see how the weight standard affects
these racial/ethnic groups differently, yet, would it be possible to refine the standard or
apply it in combination with other criteria, to achieve both lower attrition and improved
fairness for racial/ethnic minorities who may be otherwise highly qualified to serve in the
nation’s military?48
b. Political and Economic Unrest
The state of the civilian economy also has a strong impact on attrition
rates. Historically, high-quality enlistments rise during periods of high unemployment
because of the challenges youth face finding employment in the civilian sector.49 A study
by Armor and Gilroy found that the proportion of Black enlistees during periods of high
unemployment actually declines during periods of high unemployment because of a
“crowding out” effect by increased numbers of white youth seeking to join the military or
remain in service.50 Consequently, young men and women who are already serving in
military become less likely to attrite or otherwise leave service for fear of not being able
to provide for their families due to the relatively poor civilian job market.
c. Generational Influencers
The parents and relatives of young people along with other adults in their
lives, are especially influential when these young men and women are considering
military enlistment. Many of the so-called “influencers,” in recruiting jargon, were less
prone to recommend military service during the height of the wars in Iraq and
Afghanistan. For example, in 2003, 46 percent of white influencers indicated that they
48 Nolan and Bicksler, Minorities in the Enlisted Force: Is the U.S. Military Representative of the
Nation It Defends?, 23.
49 Ibid.
50 Davis Armour and Curtis L. Gilroy, Changing Minority Representation in the U.S. Military (Armed Forces and Society, 2009), 223–246.

22
would recommend military service; by 2010, this figure had fallen to 33 percent.51
Among Blacks, the likelihood of recommending military service dropped from 35 percent
to 24 percent; and among Hispanics, the rate dropped from 49 percent to 32 percent.52 As
shown in Figure 10, a Joint Advertising, Market Research and Studies (JAMRS) poll
reported a decline in parental support of youths’ decisions to join the military from 70
percent in 2005 to 63 percent in 2008 among whites, and a drop from 62 percent to 56
percent among Blacks.53 At the same time, the study reported a sizable increase in
parental support among Hispanic households from 62 percent to 73 percent. Thus, it is
easy to see how generational support can play an important role in military recruiting or
enlistment outcomes, and this role may differ across demographic groups. In terms of
attrition, one may speculate whether youth are generally less likely to stay in the military
if their service is not fully supported by parents and other important influencers in their
lives.
Source: Department of Defense, Influencer Poll 10: Overview Report, 19.
Figure 5. Support of a Youth’s Decision to Join the Military, by Race/Ethnicity
(% strongly support and somewhat support)
51 Nolan and Bicksler, Minorities in the Enlisted Force: Is the U.S. Military Representative of the
Nation It Defends?, 25.
52 Nolan and Bicksler, Minorities in the Enlisted Force: Is the U.S. Military Representative of the Nation It Defends?, 25.
53 Department of Defense, Influencer Poll 10: Overview Report (Arlington, VA: Joint Advertising and Market Research and Studies Program, 2008), 19.

23
D. THE WHOLE PERSON CONCEPT
While the high school diploma remains a strong predictor of first-term attrition, a
number of additional background or demographic factors also correlate with a person’s
likelihood of successful performance in military service. These factors include non-
cognitive characteristics that are predictors of first-term attrition. The use of non-
cognitive factors during enlistment screening supports the notion of looking beyond
narrow criteria and taking into account the “whole person.”
a. Non-Cognitive Measures
Non-cognitive attributes pertain to an individual’s emotional and
volitional processes such as behavior, personality, motivation, and interest. These traits
are subjective and are difficult to capture due to their qualitative nature. Although non-
cognitive testing is not a perfect science, when applied correctly, it can be an accurate
predictor of first-term attrition. One important purpose for non-cognitive testing is to
identify prospective enlistees who may fall into a high-risk category, such as high school
dropout, but still possess a strong ability to succeed in the military based on other
personal attributes. This would allow the military to pursue individuals with intangible
assets and qualities actively who significantly increase their likelihood of successfully
adapting to military life. With high dropout rates among certain demographics, non-
cognitive measures provide a way the military can expand the number of prospective
enlistees. The U.S. Army was the first branch to experiment with non-cognitive screening
tools to predict attrition and revocation. For the past decade, the Army Research Institute
for the Behavioral and Social Sciences (ARI) has studied the emerging need to
incorporate non-cognitive attributes in screening and fully optimize the pool of potential
enlistees.
In 2000, ARI implemented the Assessment of Individual Motivation
(AIM) test to expand the market of enlistment screening tools under the “GED Plus”
program. Under this program, non-high school diploma graduates who were typically
ineligible for service were able to enlist if they could score high enough on the AIM.
Prior to the AIM test, non-cognitive tests were not effective due to the susceptibility for

24
prospective enlistees to fake answers on the exam. However, with the development of the
AIM test, the Army was able to predict first-term attrition for some educational
credentials.
In 2005, a selection screen called the Tier Two Attrition Screen (TTAS)
was developed by the U.S. Army. DOD placed a 10-percent cap on enlistees who entered
the military with Tier II status. Therefore, ARI developed a screen that combined the
ASVAB, body mass index (BMI), and AIM to better evaluate the “whole person.” The
TTAS successfully predicted first-term attrition because the soldiers who passed the
TTAS attrited at a rate that was 10 percentage points less than those who failed the
screen. Since 2005, an additional 25,000 qualified soldiers have been able to enlist in the
military due to development of TTAS.
In 2010, Wegner completed a comprehensive study on the AIM program
and concluded that AIM is a useful tool for selecting GED credential holders who are
most likely to complete their first-term of service. AIM is also useful in predicting early-
term attrition for high school diploma graduates in the early months of service.
Another non-cognitive test used by the military is the Tailored Adaptive
Personality Assessment System (TAPAS). This test is different from the AIM because
there are no correct or incorrect answers, and the test is highly resistant to “fake”
responses. Each individual exam varies depending upon an enlistee’s response. This test
is currently being used at the Military Entrance Processing Stations (MEPS), along with
the ASVAB, to identify prospective enlistees with a low risk of first-term attrition.
The U.S. Marine Corps has been involved with non-cognitive screening
and using it as a predictor of attrition. The Marine Corps and Navy Personnel Research,
Studies, and Technology (NPRST) group are utilizing Navy Computer Adaptive
Personality Scales (NCAPS) to measure job performance in air traffic controller and
intelligence-oriented MOSs. Table 5 shows the personality traits the NCAPS evaluates by
factor. A 2012 master’s thesis by Trey McBride examined how non-cognitive screening
can be used to predict first-term attrition within the Marine Corps Air Traffic Controller
MOS. McBride recommended that non-cognitive screening be utilized prior to

25
prospective air traffic controllers receiving a guaranteed air traffic controller MOS.
Further, NCAPS can be used by recruiters to fill manpower vacancies by prospective
enlistees who qualify.
Table 5. Navy Computer Adaptaive Personaility Scales (NCAPS) Traits for High
Scores and Low Scores by Factor
Factor High Scorer Low Scorer
Achievement Sets challenging goals; strives for
excellence
Avoids challenging projects; gives
up easily
Adaptability/Flexibility Willing to change approach; likes
variety at work
Difficulties adjusting to new
situations and people
Attention to Detail Exacting, precise, accurate; spots
minor errors, dislikes clutter
Sloppy, imprecise; misses important
details; makes carless errors; state
of disarray
Dependability Reliable, well organized, orderly,
plans well
Unreliable, undependable, falls
behind in duties, misses deadlines
Dutifulness/Integrity Strong moral sense of duty and
integrity
Rebellious, contemptuous; not
accountable for own actions
Leadership Orientation Willing to lead, take charge, offer
opinions and direction, and to
mobilize others; is confident,
forceful, firm, and decisive
Prefers to let others assume
leadership roles; is indecisive; does
not enjoy being the center of
attention; is submissive and readily
falls into the role of “follower”
Perceptiveness/Depth of Thought Interested in pursuing topics in
depth and enjoys abstract thought;
has a need to understand how
things work; seeks to understand
the “big picture”
Takes little time for reflection; is
not comfortable engaging in
abstract thought; has little desire to
think things through in depth or to
probe for new insights; takes a
shortsighted, shallow view of things
Self-control/Impulsivity Tends to act on the “spur of the
moment;” speaks and vents
emotions and engages in behaviors
without thinking through possible
consequences
Suppresses negative emotions and
inappropriate behaviors, even in
situations where it is difficult to do
so; thinks before acting
Social Orientation Outgoing, warm, likeable,
sociable; values connections with
others
Shy, reserved, aloof, prefers to be
alone; creates friction when around
others
Self Reliance Self-sufficient, resourceful, likes
to make own decisions
Relies on others to get things done;
depends on others
Stress Tolerance Maintains composure and thinks
clearly under stress; can easily put
aside worries
Becomes indecisive or makes poor
decision under stress; prone to
worry
Vigilance Alert to environment Experiences lapses in attention
Willingness to Learn Learns from mistakes; seeks
learning opportunities; takes
advice
Avoids training opportunities; does
not seek clarification; narrow range
of interests
Source: Amanda O. Lords, Ronald M. Bearden, Hubert Chen, & Geoffrey Fedak, Navy Computer Adaptive
Personality Scales: Initial Results (Millington, TN: NPRST, 2006), 2.

26
E. SUMMARY
Studies on attrition and education credentials generally arrive at the same
conclusion. As can be seen in the literature review, education credentials are one of the
most important factors in predicting premature separation from the military. The
dichotomy of high school credential holders and non-high school diploma credential
holders is still prevalent in today’s screening process. The process becomes considerably
more complicated and less precise when one considers alternative credentials designed to
“substitute” for a traditional high school diploma. For example, accessions with an adult
high school education or those with one semester of college tend to have relatively high
rates of attrition over the past 20 years.
The educational tier system was developed to standardize a process of
categorizing alternative credentials across the military services. Over the years, research
has shown that the system is far from perfect in practice. Additionally, many external
factors can affect attrition and military participation rates by youth from different
demographic backgrounds; these include certain enlistment standards, political and
economic conditions, and generational influencers of today’s youth. These factors are
generally less predictable or controllable. At the same time, non-cognitive testing has
shown great promise in helping to reduce first-term attrition and to improve the
effectiveness of identifying highly-qualified recruits. Thus, the U. S. Marine Corps has
taken a keen interest in non-cognitive testing to identify the traits, skills, and motivations
of applicants who possess a relatively high likelihood for succeeding as Marines.

27
III. DATA AND METHODOLOGY
A. DATA
The dataset used for this study was obtained from the Marine Corps Total Force
Data Warehouse (TFDW). The raw data file of enlistees contained 186,936 observations
for those who enlisted in the Marine Corps between fiscal years 2003–2007. These years
were selected to provide the most recent Marine Corps cohorts for this analysis,
considering the time required to study attrition behavior after entry into active duty.
Enlisted accession dates and end of active service (EAS) dates were used to
identify first-term attrites. Time spent in the Marine Corps was recorded in calendar days.
Any Marine who exited service under a 4-year obligation is considered to have attrited
for purposes of this study. However, Marines who exited service before their EAS who
qualified for the volunteer enlisted early release program (VEERP) were not classified as
attrites. Mortally wounded Marines were also not considered to be attrites. Observations
with missing or unreliable data were removed from the dataset. Enlistees who had a
percentile score of 30 or below on the AFQT were removed from the sample, as
potentially erroneous. Variables obtained at the time of enlistment, including ethnicity,
gender, age, AFQT scores, and marital status were recorded and used in the statistical
analysis. The final sample included 163,744 observations. Table 6 describes the variables
used in the dataset.

28
Table 6. Data Descriptions
Variable Description
ATTRITE = 1 If attrite from USMC, = 0 if otherwise
AFQT = AFQT score, continuous variable from 31-99
AFQT_1 = 1 if enlistee AFQT was over 92, = 0 otherwise
AFQT 2 = 1 if enlistee’s AFQT was between 65-92, = 0 otherwise
AFQT 3A = 1 if enlistee’s AFQT was between 50-64, = 0 otherwise
AFQT 3B = 1 if enlistee’s AFQT was between 31-49, = 0 otherwise
MALE = 1 if enlistee was male, = 0 otherwise
FEMALE = 1 if enlistee was female, = 0 otherwise
MARRIED = 1 if enlistee was married, = 0 otherwise
SINGLE = 1 if enlistee was single, = 0 otherwise
DEPENDENTS Number of dependents
AGE Age of enlistee at the time of enlistment
BLACK
= 1 if enlistee was Black or African American, = 0
otherwise
APINA
= 1 if enlistee was Native Hawaiian or Pacific Islander, = 0
otherwise
OTHER RACE
= 1 if enlistee was Hispanic, Alaska Native or Did not
respond
WHITE = 1 if enlistee was White, = 0 otherwise
ASIAN = 1 if enlistee was Asian, =0 otherwise
NATIVE = 1 if enlistee was American Indian, =0 otherwise
EDUC CODE Enlistee's education code at time of enlistment
OLD TIER I
= 1 if enlistee's education code was in Tier I, under old
classification, =0 if otherwise
OLD TIER II
= 1 if enlistee's education code was in Tier II, under old
classification, =0 if otherwise
OLD TIER III
= 1 if enlistee's education code was in Tier III, under old
classification, =0 if otherwise
UPDATED TIER I
= 1 if enlistee's education code was in Tier I, under new
classification, =0 if otherwise
UPDATED TIER
II
= 1 if enlistee's education code was in Tier II, under new
classification, =0 if otherwise
UPDATED TIER
III
= 1 if enlistee's education code was in Tier III, under new
classification, =0 if otherwise
FY Fiscal Year of enlistment
FY_03
= 1 if entered the USMC in fiscal year 2003, =0 if
otherwise
FY_04
= 1 if entered the USMC in fiscal year 2004, =0 if
otherwise

29
Variable Description
FY_05
= 1 if entered the USMC in fiscal year 2005, =0 if
otherwise
FY_06
= 1 if entered the USMC in fiscal year 2006, =0 if
otherwise
FY_07
= 1 if entered the USMC in fiscal year 2007, =0 if
otherwise
SEPARATION
CODE Reason why enlistee was separated from the Marine Corps
EAS End of active service
Source: U.S. Marine Corps Total Forces Data Warehouse (2013).
Note: Data manipulated by STATA statistical software.
B. DESCRIPTIVE STATS FOR THE 2003–2007 SAMPLE
Since the inception of the AVF, the Marine Corps has had a somewhat different
composition than the other services based on certain demographic measures. For
example, the Marine Corps tends to have the lowest proportions of Asian and Black
accessions of all the service branches.54 In 2010, the proportion of married accessions in
the Marine Corps stood at 2.6 percent. For that same year, the proportions of married
accessions in the other branches were 4.5 percent in the Navy, 11.2 percent in the Air
Force, and 17.7 percent in the Army.55 That same year, the Marine Corps had the highest
proportion of White enlisted accessions (85.1 percent) of any other service.56 These
variations in background characteristics may affect the attrition and reenlistment
decisions of a Marine differently from those of members in other services.
Figure 6 shows the attrition rates by year for the dataset obtained from TFDW.
From 2003 to 2006, attrition rates rose continuously. Previous studies have shown the
same pattern of first-term attrition when male and female attrition rates were combined.
54 Nolan and Bicksler, Minorities in the Enlisted Force: Is the U.S. Military Representative of the
Nation It Defends?, 21.
55 Population Representation in the Military Service, Fiscal Year 2010, Department of Defense, 2006, http://prhome.defense.gov/RFM/MPP/ACCESSION%20POLICY/PopRep2010/summary/summary.html, 2–14.
56 Ibid., B–10.
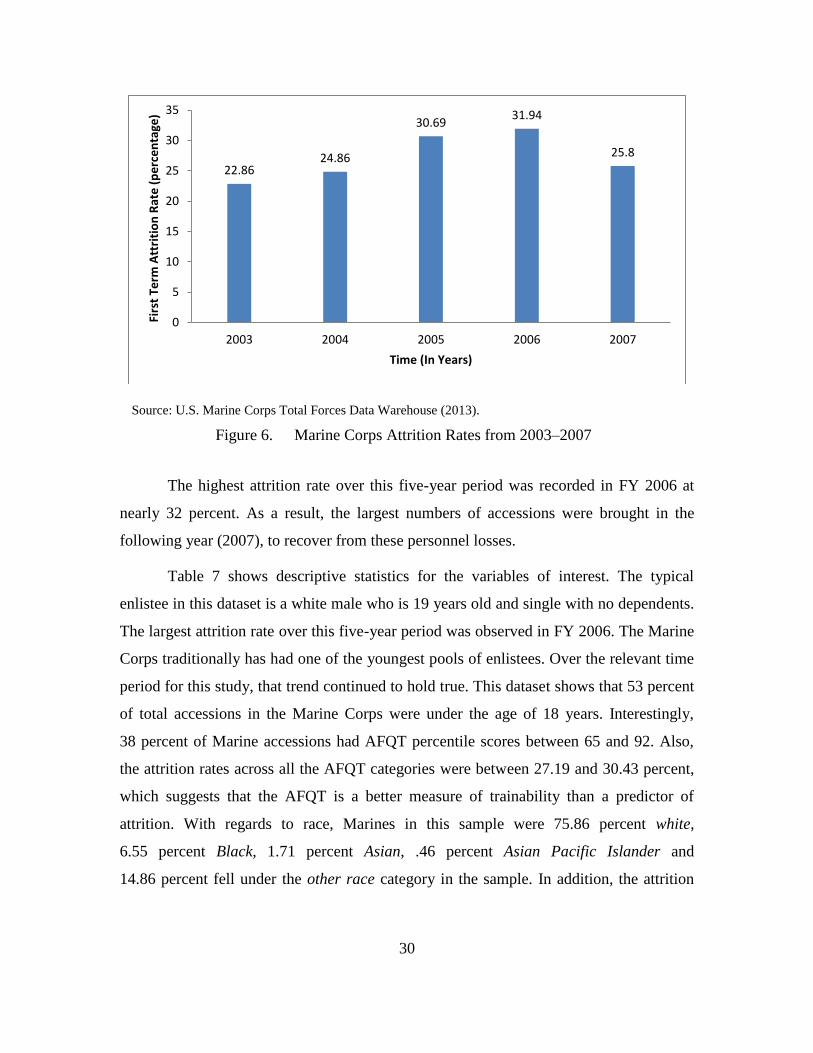
30
Source: U.S. Marine Corps Total Forces Data Warehouse (2013).
Figure 6. Marine Corps Attrition Rates from 2003–2007
The highest attrition rate over this five-year period was recorded in FY 2006 at
nearly 32 percent. As a result, the largest numbers of accessions were brought in the
following year (2007), to recover from these personnel losses.
Table 7 shows descriptive statistics for the variables of interest. The typical
enlistee in this dataset is a white male who is 19 years old and single with no dependents.
The largest attrition rate over this five-year period was observed in FY 2006. The Marine
Corps traditionally has had one of the youngest pools of enlistees. Over the relevant time
period for this study, that trend continued to hold true. This dataset shows that 53 percent
of total accessions in the Marine Corps were under the age of 18 years. Interestingly,
38 percent of Marine accessions had AFQT percentile scores between 65 and 92. Also,
the attrition rates across all the AFQT categories were between 27.19 and 30.43 percent,
which suggests that the AFQT is a better measure of trainability than a predictor of
attrition. With regards to race, Marines in this sample were 75.86 percent white,
6.55 percent Black, 1.71 percent Asian, .46 percent Asian Pacific Islander and
14.86 percent fell under the other race category in the sample. In addition, the attrition
22.86 24.86
30.69 31.94
25.8
0
5
10
15
20
25
30
35
2003 2004 2005 2006 2007
Firs
t Te
rm A
ttri
tio
n R
ate
(p
erc
en
tage
)
Time (In Years)

31
rate among the other race category was 8.94 percent. The actual ethnic groups included
in the other race category cannot be specified.
Table 7. Descriptive Statistics for USMC Enlistees, Fiscal Years 2003–2007
CATEGORY VARIABLES Percent of
Sample (%)
Attrition Rate
(%)
Enlistment Year FY 2003 11.09 22.86
FY 2004 20.52 24.35
FY 2005 21.66 30.69
FY 2006 22.76 31.94
FY 2007 23.97 25.8
Gender Male 93.23 32.33
Female 6.77 27.29
Age Age 17 and 18 53.66 25.71
Age 19 and up 46.34 29.86
Mean 19.09
AFQT Score AFQT_1 5.74 30.43
AFQT_2 38.35 27.57
AFQT_3A 25.89 27.19
AFQT_3B 29.84 27.59
Race White 75.86 31.27
Black 6.55 27.67
Asian Pacific
Islander
0.46 25.5
Asian 1.71 30.82
Other Race 14.86 8.94
Dependent No Dependents 98.64 27.65
With
Dependents
1.36 26.62
Marital Status Single 96.07 27.65
Married 3.93 27.22
Source: U.S. Marine Corps Total Forces Data Warehouse (2013).
Note: Data manipulated by STATA statistical software.
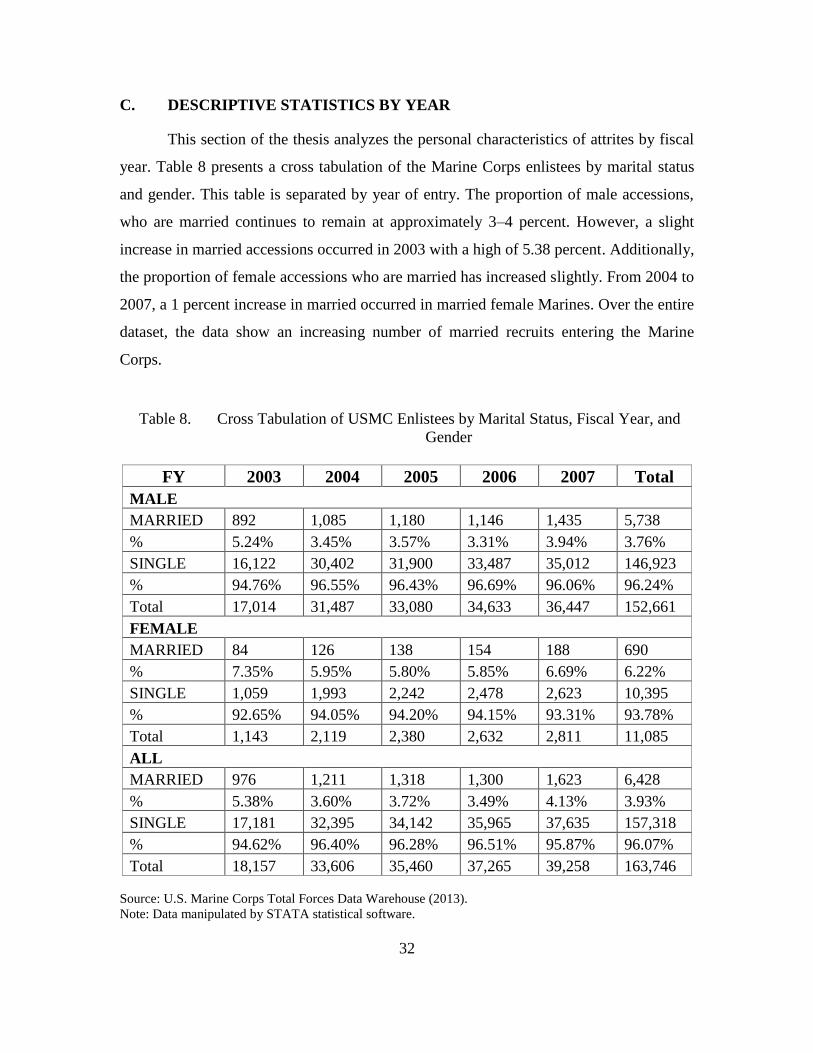
32
C. DESCRIPTIVE STATISTICS BY YEAR
This section of the thesis analyzes the personal characteristics of attrites by fiscal
year. Table 8 presents a cross tabulation of the Marine Corps enlistees by marital status
and gender. This table is separated by year of entry. The proportion of male accessions,
who are married continues to remain at approximately 3–4 percent. However, a slight
increase in married accessions occurred in 2003 with a high of 5.38 percent. Additionally,
the proportion of female accessions who are married has increased slightly. From 2004 to
2007, a 1 percent increase in married occurred in married female Marines. Over the entire
dataset, the data show an increasing number of married recruits entering the Marine
Corps.
Table 8. Cross Tabulation of USMC Enlistees by Marital Status, Fiscal Year, and
Gender
FY 2003 2004 2005 2006 2007 Total
MALE
MARRIED 892 1,085 1,180 1,146 1,435 5,738
% 5.24% 3.45% 3.57% 3.31% 3.94% 3.76%
SINGLE 16,122 30,402 31,900 33,487 35,012 146,923
% 94.76% 96.55% 96.43% 96.69% 96.06% 96.24%
Total 17,014 31,487 33,080 34,633 36,447 152,661
FEMALE
MARRIED 84 126 138 154 188 690
% 7.35% 5.95% 5.80% 5.85% 6.69% 6.22%
SINGLE 1,059 1,993 2,242 2,478 2,623 10,395
% 92.65% 94.05% 94.20% 94.15% 93.31% 93.78%
Total 1,143 2,119 2,380 2,632 2,811 11,085
ALL
MARRIED 976 1,211 1,318 1,300 1,623 6,428
% 5.38% 3.60% 3.72% 3.49% 4.13% 3.93%
SINGLE 17,181 32,395 34,142 35,965 37,635 157,318
% 94.62% 96.40% 96.28% 96.51% 95.87% 96.07%
Total 18,157 33,606 35,460 37,265 39,258 163,746
Source: U.S. Marine Corps Total Forces Data Warehouse (2013).
Note: Data manipulated by STATA statistical software.
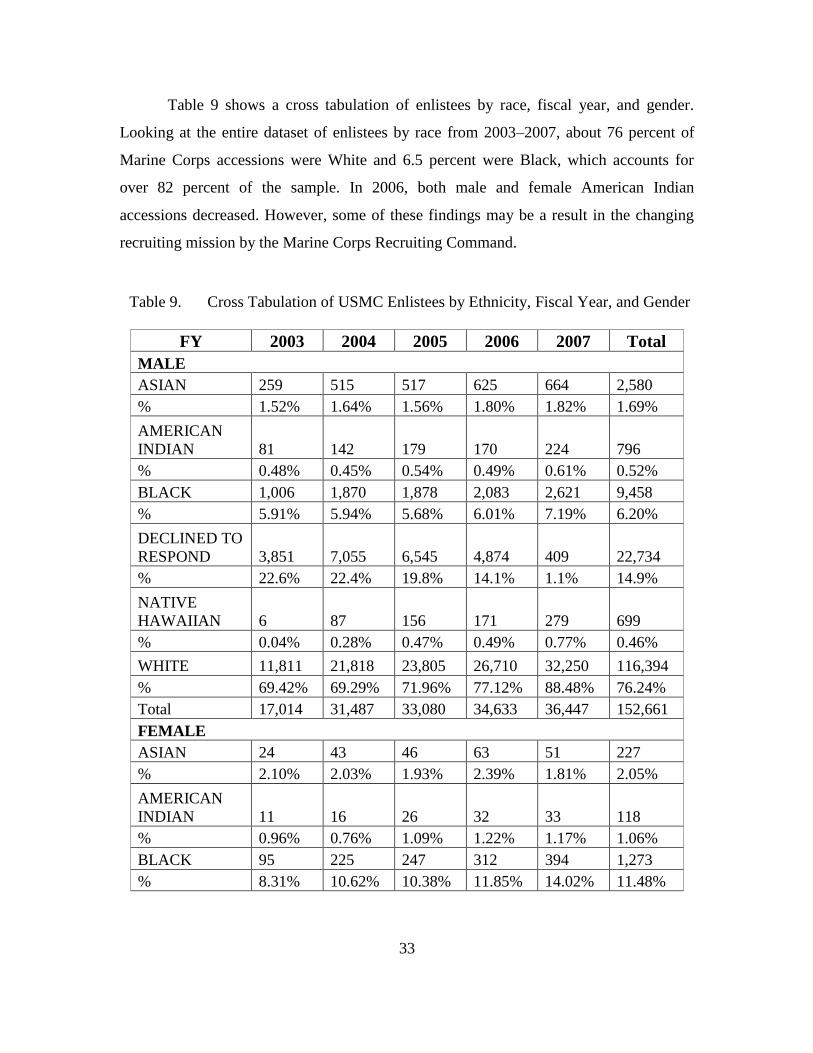
33
Table 9 shows a cross tabulation of enlistees by race, fiscal year, and gender.
Looking at the entire dataset of enlistees by race from 2003–2007, about 76 percent of
Marine Corps accessions were White and 6.5 percent were Black, which accounts for
over 82 percent of the sample. In 2006, both male and female American Indian
accessions decreased. However, some of these findings may be a result in the changing
recruiting mission by the Marine Corps Recruiting Command.
Table 9. Cross Tabulation of USMC Enlistees by Ethnicity, Fiscal Year, and Gender
FY 2003 2004 2005 2006 2007 Total
MALE
ASIAN 259 515 517 625 664 2,580
% 1.52% 1.64% 1.56% 1.80% 1.82% 1.69%
AMERICAN
INDIAN 81 142 179 170 224 796
% 0.48% 0.45% 0.54% 0.49% 0.61% 0.52%
BLACK 1,006 1,870 1,878 2,083 2,621 9,458
% 5.91% 5.94% 5.68% 6.01% 7.19% 6.20%
DECLINED TO
RESPOND 3,851 7,055 6,545 4,874 409 22,734
% 22.6% 22.4% 19.8% 14.1% 1.1% 14.9%
NATIVE
HAWAIIAN 6 87 156 171 279 699
% 0.04% 0.28% 0.47% 0.49% 0.77% 0.46%
WHITE 11,811 21,818 23,805 26,710 32,250 116,394
% 69.42% 69.29% 71.96% 77.12% 88.48% 76.24%
Total 17,014 31,487 33,080 34,633 36,447 152,661
FEMALE
ASIAN 24 43 46 63 51 227
% 2.10% 2.03% 1.93% 2.39% 1.81% 2.05%
AMERICAN
INDIAN 11 16 26 32 33 118
% 0.96% 0.76% 1.09% 1.22% 1.17% 1.06%
BLACK 95 225 247 312 394 1,273
% 8.31% 10.62% 10.38% 11.85% 14.02% 11.48%
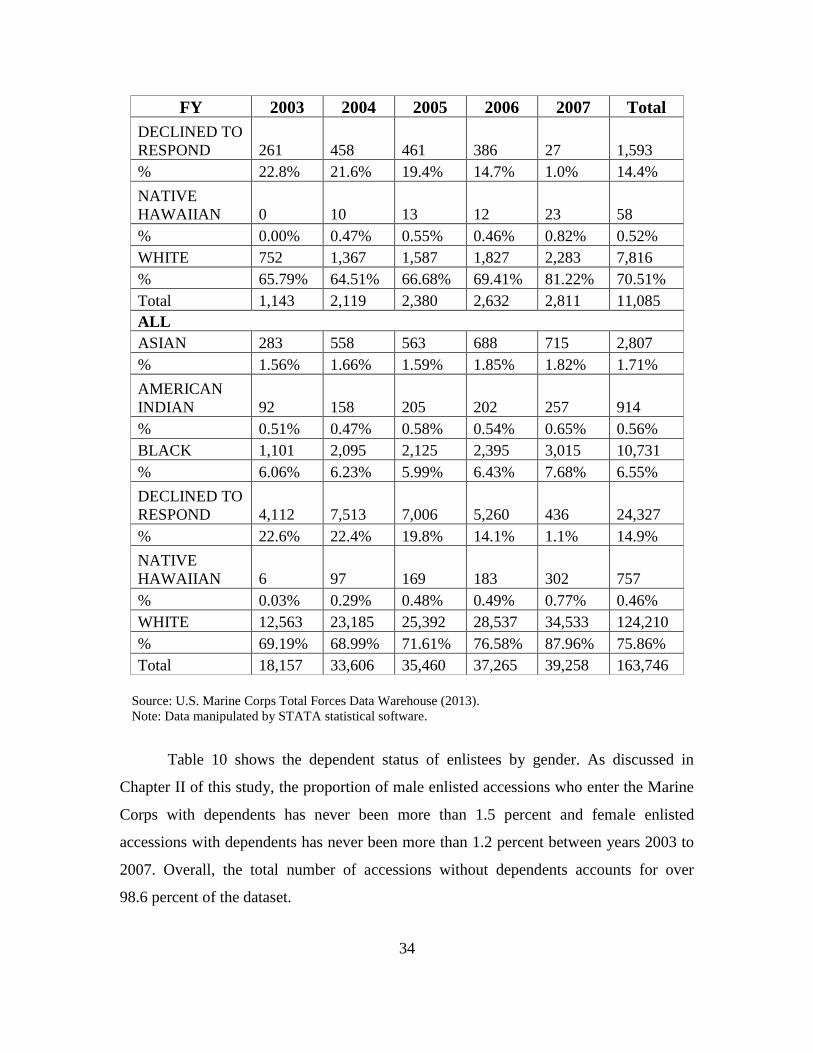
34
FY 2003 2004 2005 2006 2007 Total
DECLINED TO
RESPOND 261 458 461 386 27 1,593
% 22.8% 21.6% 19.4% 14.7% 1.0% 14.4%
NATIVE
HAWAIIAN 0 10 13 12 23 58
% 0.00% 0.47% 0.55% 0.46% 0.82% 0.52%
WHITE 752 1,367 1,587 1,827 2,283 7,816
% 65.79% 64.51% 66.68% 69.41% 81.22% 70.51%
Total 1,143 2,119 2,380 2,632 2,811 11,085
ALL
ASIAN 283 558 563 688 715 2,807
% 1.56% 1.66% 1.59% 1.85% 1.82% 1.71%
AMERICAN
INDIAN 92 158 205 202 257 914
% 0.51% 0.47% 0.58% 0.54% 0.65% 0.56%
BLACK 1,101 2,095 2,125 2,395 3,015 10,731
% 6.06% 6.23% 5.99% 6.43% 7.68% 6.55%
DECLINED TO
RESPOND 4,112 7,513 7,006 5,260 436 24,327
% 22.6% 22.4% 19.8% 14.1% 1.1% 14.9%
NATIVE
HAWAIIAN 6 97 169 183 302 757
% 0.03% 0.29% 0.48% 0.49% 0.77% 0.46%
WHITE 12,563 23,185 25,392 28,537 34,533 124,210
% 69.19% 68.99% 71.61% 76.58% 87.96% 75.86%
Total 18,157 33,606 35,460 37,265 39,258 163,746
Source: U.S. Marine Corps Total Forces Data Warehouse (2013).
Note: Data manipulated by STATA statistical software.
Table 10 shows the dependent status of enlistees by gender. As discussed in
Chapter II of this study, the proportion of male enlisted accessions who enter the Marine
Corps with dependents has never been more than 1.5 percent and female enlisted
accessions with dependents has never been more than 1.2 percent between years 2003 to
2007. Overall, the total number of accessions without dependents accounts for over
98.6 percent of the dataset.

35
Table 10. Cross Tabulation of USMC Enlistees by Dependent Status, Fiscal Year, and
Gender
FY 2003 2004 2005 2006 2007 Total
MALE
WITH
DEPENDENTS 192 375 488 520 529 2,104
% 1.13% 1.19% 1.48% 1.50% 1.45% 1.38%
NO
DEPENDENTS 16,822 31,112 32,592 34,113 35,918 150,557
% 98.87% 98.81% 98.52% 98.50% 98.55% 98.62%
Total 17,014 31,487 33,080 34,633 36,447 152,661
FEMALE
WITH
DEPENDENTS 8 19 25 30 34 116
% 0.70% 0.90% 1.05% 1.14% 1.21% 1.05%
NO
DEPENDENTS 1,135 2,100 2,355 2,602 2,777 10,969
% 99.30% 99.10% 98.95% 98.86% 98.79% 98.95%
Total 1,143 2,119 2,380 2,632 2,811 11,085
ALL
WITH
DEPENDENTS 200 394 513 550 563 2,220
% 1.10% 1.17% 1.45% 1.48% 1.43% 1.36%
NO
DEPENDENTS 17,957 33,212 34,947 36,715 38,695 161,526
% 98.90% 98.83% 98.55% 98.52% 98.57% 98.64%
Total 18,157 33,606 35,460 37,265 39,258 163,746
Source: U.S. Marine Corps Total Forces Data Warehouse (2013).
Note: Data manipulated by STATA statistical software.
The Marine Corps traditionally has a high percentage of younger enlistees when
compared with the other services. As seen in Table 11, 53.7 percent of enlistees were
between 17 and 18 years old. The peak year for younger enlisted accessions occurred in
2004. During 2004, males between the ages 17 and 18 accounted for 59.6 percent, while
females in this younger age category accounted for 59.1 percent of all enlisted
accessions.

36
Table 11. Cross Tabulation of USMC Enlistees by Age, Fiscal Year, and Gender
FY 2003 2004 2005 2006 2007 Total
MALE
Age 17 & 18 8,004 18,770 18,028 18,292 18,535 81,629
% 47.04% 59.61% 54.50% 52.82% 50.85% 53.47%
Age Over 18 9,010 12,717 15,052 16,341 17,912 71,032
% 52.96% 40.39% 45.50% 47.18% 49.15% 46.53%
Total 17,014 31,487 33,080 34,633 36,447 152,661
FEMALE
Age 17 & 18 592 1,253 1,405 1,407 1,574 6,231
% 51.79% 59.13% 59.03% 53.46% 55.99% 56.21%
Age Over 18 551 866 975 1,225 1,237 4,854
% 48.21% 40.87% 40.97% 46.54% 44.01% 43.79%
Total 1,143 2,119 2,380 2,632 2,811 11,085
ALL
Age 17 & 18 8,596 20,023 19,433 19,699 20,109 87,860
% 47.34% 59.58% 54.80% 52.86% 51.22% 53.66%
Age Over 18 9,561 13,583 16,027 17,566 19,149 75,886
% 52.66% 40.42% 45.20% 47.14% 48.78% 46.34%
Total 18,157 33,606 35,460 37,265 39,258 163,746
Source: U.S. Marine Corps Total Forces Data Warehouse (2013).
Note: Data manipulated by STATA statistical software.
Table 12 shows a cross tabulation of enlistees by fiscal year and gender who have
not completed their first contractual term of service, also known as first-term attrition. As
discussed in Chapter II, the attrition rates of enlisted female accessions are higher than
those of their male counterparts. When attrition rates are calculated across all five
cohorts, the attrition rate of enlisted females is 5 percentage points higher than enlisted
male attrition rates.
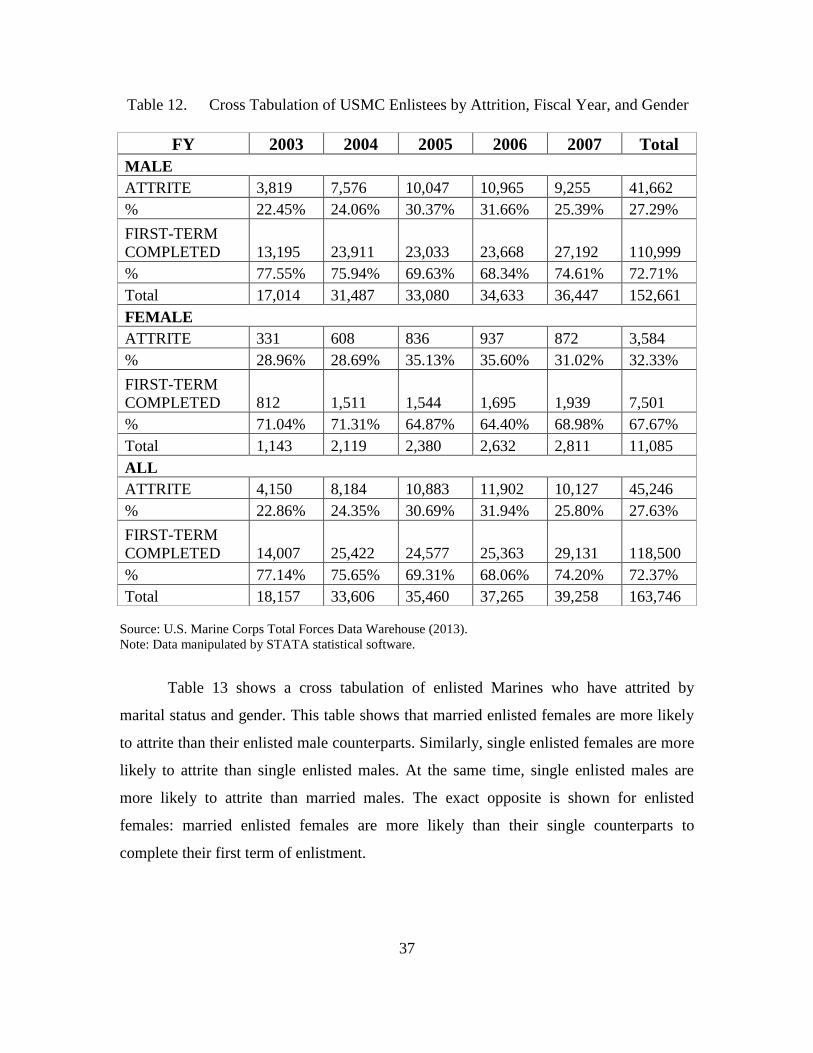
37
Table 12. Cross Tabulation of USMC Enlistees by Attrition, Fiscal Year, and Gender
FY 2003 2004 2005 2006 2007 Total
MALE
ATTRITE 3,819 7,576 10,047 10,965 9,255 41,662
% 22.45% 24.06% 30.37% 31.66% 25.39% 27.29%
FIRST-TERM
COMPLETED 13,195 23,911 23,033 23,668 27,192 110,999
% 77.55% 75.94% 69.63% 68.34% 74.61% 72.71%
Total 17,014 31,487 33,080 34,633 36,447 152,661
FEMALE
ATTRITE 331 608 836 937 872 3,584
% 28.96% 28.69% 35.13% 35.60% 31.02% 32.33%
FIRST-TERM
COMPLETED 812 1,511 1,544 1,695 1,939 7,501
% 71.04% 71.31% 64.87% 64.40% 68.98% 67.67%
Total 1,143 2,119 2,380 2,632 2,811 11,085
ALL
ATTRITE 4,150 8,184 10,883 11,902 10,127 45,246
% 22.86% 24.35% 30.69% 31.94% 25.80% 27.63%
FIRST-TERM
COMPLETED 14,007 25,422 24,577 25,363 29,131 118,500
% 77.14% 75.65% 69.31% 68.06% 74.20% 72.37%
Total 18,157 33,606 35,460 37,265 39,258 163,746
Source: U.S. Marine Corps Total Forces Data Warehouse (2013).
Note: Data manipulated by STATA statistical software.
Table 13 shows a cross tabulation of enlisted Marines who have attrited by
marital status and gender. This table shows that married enlisted females are more likely
to attrite than their enlisted male counterparts. Similarly, single enlisted females are more
likely to attrite than single enlisted males. At the same time, single enlisted males are
more likely to attrite than married males. The exact opposite is shown for enlisted
females: married enlisted females are more likely than their single counterparts to
complete their first term of enlistment.

38
Table 13. Cross Tabulation of USMC Enlistees by Attrition, Marital Status, and
Gender
GENDER FEMALE MALE Total
MARRIED
ATTRITE 232 1,518 1,750
% 33.62% 26.46% 27.22%
FIRST-TERM
COMPLETED 458 4,220 4,678
% 66.38% 73.54% 72.78%
Total 690 5,738 6,428
SINGLE
ATTRITE 3,352 40,144 43,496
% 32.25% 27.32% 27.65%
FIRST-TERM
COMPLETED 7,043 106,779 113,822
% 67.75% 72.68% 72.35%
Total 10,395 146,923 157,318
ALL
ATTRITE 3,584 41,662 45,246
% 32.33% 27.29% 27.63%
FIRST-TERM
COMPLETED 7,501 110,999 118,500
% 67.67% 72.71% 72.37%
Total 11,085 152,661 163,746 Source: U.S. Marine Corps Total Forces Data Warehouse (2013).
Note: Data manipulated by STATA statistical software.
In Table 13, a cross tabulation shows the attrition rates of enlisted Marines by
race and gender. As shown in numerous previous studies, the attrition rate of enlisted
Black male accessions is higher than that of enlisted American Indian and Native
Hawaiian male accessions.57 Overall, American Indian male and female attrition rates are
the lowest in the dataset.
57 Aline O. Quester, Marine Corps Recruits: A Historical Look at Accessions and Bootcamp
Performance (Alexandria, VA: Center for Naval Analyses, 2010), 34.

39
Table 14. Cross Tabulation of USMC Enlistees by Attrition, Race, and Gender
FY ASIAN
AMERICAN
INDIAN BLACK
DECLINED TO
RESPOND
NATIVE
HAWAIIAN WHITE Total
MALE
ATTRITE 790 176 2,592 2,032 179 35,893 41,662
% 30.62% 22.11% 27.41% 8.94% 25.61% 30.84% 27.29%
FIRST-TERM
COMPLETED 1,790 620 6,866 20,702 520 80,501 110,999
% 69.38% 77.89% 72.59% 91.06% 74.39% 69.16% 72.71%
Total 2,580 796 9,458 22,734 699 116,394 152,661
FEMALE
ATTRITE 75 30 377 142 14 2,946 3,584
% 33.04% 25.42% 29.62% 8.91% 24.14% 37.69% 32.33%
FIRST-TERM
COMPLETED 152 88 896 1,451 44 4,870 7,501
% 66.96% 74.58% 70.38% 91.09% 75.86% 62.31% 67.67%
Total 227 118 1,273 1,593 58 7,816 11,085
ALL
ATTRITE 865 206 2,969 2,174 193 38,839 45,246
% 30.82% 22.54% 27.67% 8.94% 25.50% 31.27% 27.63%
FIRST-TERM
COMPLETED 1,942 708 7,762 22,153 564 85,371 118,500
% 69.18% 77.46% 72.33% 91.06% 74.50% 68.73% 72.37%
Total 2,807 914 10,731 24,327 757 124,210 163,746
Source: U.S. Marine Corps Total Forces Data Warehouse (2013).
Note: Data manipulated by STATA statistical software.
Tables 14 and 15 show the Marine Corps attrition rate by educational tier for
fiscal years 2003–2007. These data demonstrate that the attrition rates for all persons in
all tier categories steadily increased from FY 2004 until FY 2007. A comparison of
attrition rates in these tables also show that the attrition rates in Tier I basically remained
the same after shifting 1,222 enlistees from Tier II to Tier 1. Yet, the effect on Tier II was
a slight increase in the attrition rate for all annual cohorts.

40
Table 15. USMC First Term Attrition by Old Educational Tier
Variable N FY2003 FY2004 FY2005 FY2006 FY2007
Old Tier I 157,765 22.9% 24.2% 30.5% 31.7% 25.6%
Old Tier II 5,796 31.6% 36.2% 40.4% 41.7% 29.9%
Old Tier III 185 22.7% 30.8% 52.0% 37.2% 27.3%
Source: U.S. Marine Corps Total Forces Data Warehouse (2013).
Note: Data manipulated by STATA statistical software.
Table 16. USMC First Term Attrition by New Educational Tier
Variable N FY2003 FY2004 FY2005 FY2006 FY2007
Updated Tier I 158,987 22.9% 24.3% 30.5% 31.7% 25.6%
Updated Tier II 4,574 33.5% 37.5% 42.7% 43.3% 31.6%
Updated Tier III 185 22.7% 30.8% 52.0% 37.2% 27.3%
Source: U.S. Marine Corps Total Forces Data Warehouse (2013).
Note: Data manipulated by STATA statistical software.
D. SUMMARY
The proportions of married Marines in the entry cohorts for the present study have
remained about the same over time, although the actual numbers have increased.
Additionally, the composition of enlisted accessions by race reveals that over 82 percent
of the dataset is composed of Black and White enlisted accessions. Another interesting
result is seen in the ages of enlisted accessions: more than half of those in the dataset
were between the ages of seventeen and eighteen when they entered active duty.
Furthermore, the attrition rates of enlisted female accessions are much higher than those
of enlisted male accessions. As revealed by previous studies, the attrition rate of
American Indian accessions is much lower than that of any other racial/ethnic group
represented in the dataset. When further analyzing the attrition rates, single females are
slightly less likely to attrite than married females. Conversely, married men are slightly
less likely to attrite than single men.

41
E. METHODOLOGY
In this analysis, an enlistee who enters the Marine Corps can only exit the system
by two means, successfully completing a first term of service or by attrition. For the rest
of the analysis in this study, attrite is a binary dependent variable defined as follows:
Yi = 0, if enlistee i completes his/her first term of enlistment
Yi = 1, if enlistee i attrites from the Marine Corps before completing the first term
The effect of the explanatory variables on the probability to attrite will be estimated via
probit.
1. Variables
The variables of primary concern are education credentials, AFQT score, and
educational tier classification. These variables determine enlistment eligibility by the
Marine Corps Recruiting Command (MCRC). Twenty education credentials are shown in
the original dataset. However, only 19 categories have sufficient sample sizes for
statistical analysis. No enlistees from fiscal years 2003–2007 possess a nursing degree
educational credential. The data include 12 Tier I variables: 15 college credits or job
corps + GED, probationary HS senior, adult/alternate HS diploma graduate, associate’s
degree, high school diploma but failed exit exam, bachelor’s degree, high school diploma
graduate, enrolled in other than HS program, master’s degree, traditional high school
senior, post-baccalaureate degree. Tier II consists of seven: non-traditional high school
credential, correspondence school diploma, occupational program, GED, home school,
attendance based high school diploma, and National Guard Youth Challenge. Tier III
only consists of one variable, non-high school graduate. Other variables that are highly
correlated with first-term attrition were included in the models. These variables include
age, gender, marital status, dependency status, ethnicity, AFQT score, and cohort year.
Table 17 presents descriptions of each education variable and the associated tier
classification.

42
Table 17. Education Credentials
Variable Code Tier Variable
Name
Variable Description
Non-High School
(HS) Grad
1 III ed_1 Not currently attending HS or
alternative education and hold neither
a Tier I or Tier II credential
Other non-
traditional
5 II ed_5 Credential issued for completing
alternative school that differs in
curriculum from traditional HS
program
Correspondence
school diploma
7 II ed_7 Diploma or certificate awarded upon
completion of correspondence school,
distance learning, or independent
study
15 college credits
or Job Corps +
GED
8 I ed_8 Completion of 15 semester credits, 22
quarter credits, or 675 clock hours of
instruction from an accredited post-
secondary institution. Alternately,
earning a GED while completing Job
Corps program
Probationary HS
senior
9* I ed_9 HS seniors enrolled in Tier I program
who have not completed at least 70
percent of credits required to graduate
Adult/alternate HS
diploma grad
B I ed_B Diploma awarded on the basis of
completing an alternative,
continuation, adult, or charter program
whose curriculum satisfies grad
requirements of traditional HS
Occupational
program
certificate/diploma
C II ed_C Certificate/diploma for non-
correspondence vocational, technical,
or proprietary secondary school
program, plus completion of at least
11 years of traditional school
Associate’s degree D I ed_D Postsecondary degree–Associate’s
GED E II ed_E Test-based equivalency diploma, GED
certificate
HS diploma but
failed exit exam
F I ed_F Completed all necessary credits for
graduation but did not pass state
mandated exit exam(s)
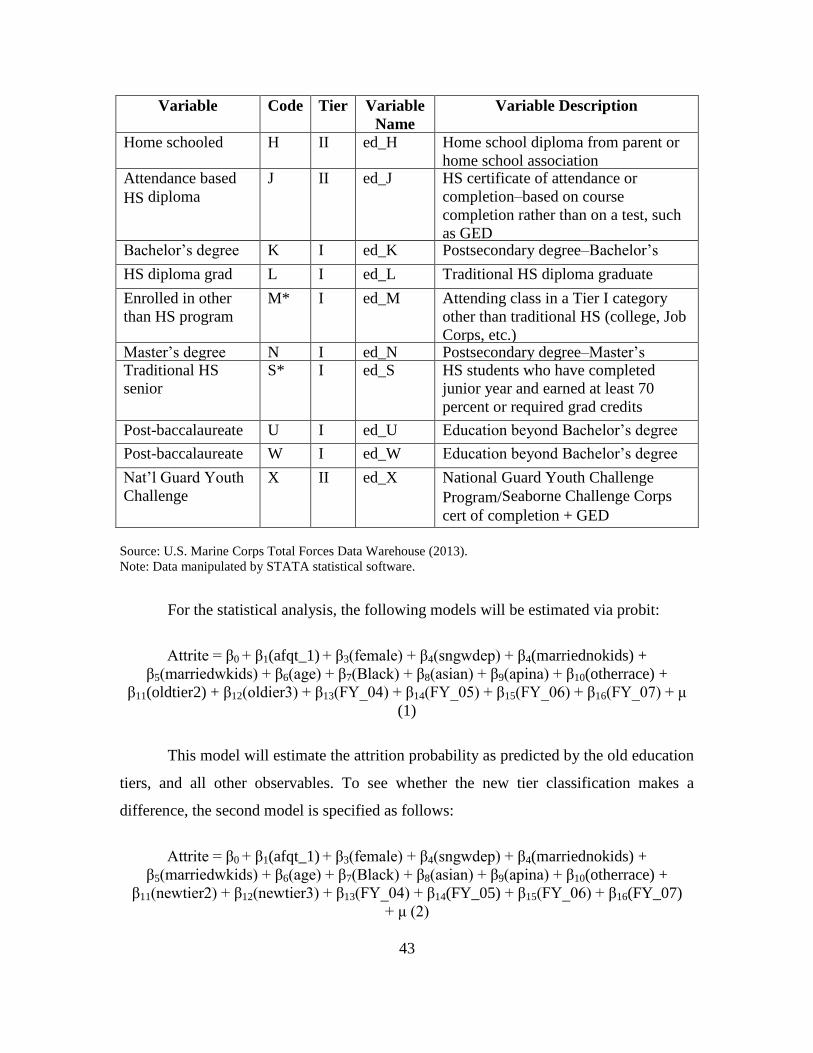
43
Variable Code Tier Variable
Name
Variable Description
Home schooled H II ed_H Home school diploma from parent or
home school association Attendance based
HS diploma
J II ed_J HS certificate of attendance or
completion–based on course
completion rather than on a test, such
as GED Bachelor’s degree K I ed_K Postsecondary degree–Bachelor’s
HS diploma grad L I ed_L Traditional HS diploma graduate
Enrolled in other
than HS program
M* I ed_M Attending class in a Tier I category
other than traditional HS (college, Job
Corps, etc.) Master’s degree N I ed_N Postsecondary degree–Master’s Traditional HS
senior
S* I ed_S HS students who have completed
junior year and earned at least 70
percent or required grad credits
Post-baccalaureate U I ed_U Education beyond Bachelor’s degree
Post-baccalaureate W I ed_W Education beyond Bachelor’s degree
Nat’l Guard Youth
Challenge
X II ed_X National Guard Youth Challenge
Program/Seaborne Challenge Corps
cert of completion + GED
Source: U.S. Marine Corps Total Forces Data Warehouse (2013).
Note: Data manipulated by STATA statistical software.
For the statistical analysis, the following models will be estimated via probit:
Attrite = β0 + β1(afqt_1) + β3(female) + β4(sngwdep) + β4(marriednokids) +
β5(marriedwkids) + β6(age) + β7(Black) + β8(asian) + β9(apina) + β10(otherrace) +
β11(oldtier2) + β12(oldier3) + β13(FY_04) + β14(FY_05) + β15(FY_06) + β16(FY_07) + μ
(1)
This model will estimate the attrition probability as predicted by the old education
tiers, and all other observables. To see whether the new tier classification makes a
difference, the second model is specified as follows:
Attrite = β0 + β1(afqt_1) + β3(female) + β4(sngwdep) + β4(marriednokids) +
β5(marriedwkids) + β6(age) + β7(Black) + β8(asian) + β9(apina) + β10(otherrace) +
β11(newtier2) + β12(newtier3) + β13(FY_04) + β14(FY_05) + β15(FY_06) + β16(FY_07)
+ μ (2)

44
More insights can be gained into the effectiveness of categorizing individuals into
tiers if we look into all separate educational categories:
Attrite = β0 + β1(afqt_1) + β3(female) + β4(sngwdep) + β4(marriednokids) +
β5(marriedwkids) + β6(age) + β7(Black) + β8(asian) + β9(apina) + β10(otherrace) +
β11(Education Category)j + β13(FY_04) + β14(FY_05) + β15(FY_06) + β16(FY_07)
+ μ (3)
All these models will be estimated for the entire sample of recruits, and also for
the subset of recruits who survive boot camp. The reason for this is to determine if
similar variables are found to be correlated between first term attrition and fleet attrition.

45
IV. ANALYSIS OF MARINE CORPS FIRST-TERM ATTRITION
The ability of an enlistee to complete his or her initial service contract is one of
three important measures of success (the other two being promotion and reenlistment).58
This particular measure is even more important during the era of the All-Volunteer Force.
Once an enlistee has completed the first term, the Marine Corps has essentially recovered
an important return on investment from that individual. For the Marine Corps to recoup
the money that has been invested into each recruit through boot camp, MOS school,
equipment, time, salaries, administration, and other expenses, each recruit must complete
approximately four years of service.
In many instances, the military loses its initial investment due to enlistees not
completing their first term of enlistment, which is known as first-term attrition. Attrition
can be attributed to various factors, such as conduct violations, poor performance, and an
inability to adapt to the military way of life. When attrition occurs, it is a drain on the
Department of Defense (DoD) budget. DoD is also forced to adjust its recruiting tactics
to replace the Marines who attrite. To mitigate high levels of attrition, manpower analysts
study the characteristics of recruits and how they might relate to various trends from one
year to the next. More importantly, it is essential to understand that attrition is not
necessarily a negative consequence if it occurs during the DEP or boot camp. During
these preliminary screening stages, the military has made a relatively smaller financial
investment in the recruit. One could also argue that it is better to remove a person who
might not be suited for the military lifestyle as early as possible. In financial terms as
well, it is easy to see that attrition is more detrimental when it occurs after the Marine has
reached a first duty station. Therefore, it is important to observe and analyze the
characteristics, demographics, and education credentials of enlistees to determine if fleet
attrition can be predicted.
This chapter evaluates first-term attrition over the course of the entire first term of
enlistment by education tier credential. This chapter also examines the characteristics of
58 Quester, North, and Kimble, Identifying Successful Marine Corps Recruits, 5.

46
the Marine Corps educational tier system based on education codes in each tier prior to
June 1, 2012. After June 1, 2012, the Marine Corps decided to change the “home school”
educational code to Tier I. Consequently, the analysis focuses on the educational tier
system after June 1, 2012 to ascertain if that modification improved the overall
predictability of the tier system. Subsequently, an analysis is conducted on educational
credentials that have neglected to be classified within the tier system.
A. RESULTS
This section provides the results of first-term attrition by educational credentials
of the tier classification system before and after June 1, 2012, and also by individual
education codes.
1. Attrition by Educational Tier
This section analyzes the attrition rates of each of the three educational tiers based
on education credentials prior to June 1, 2012.
Using Maximum Likelihood Estimation (MLE), an attrition model was estimated
via probit to test the statistical significance of the educational tiers. Similar to the analysis
by Andrew (2009), variables identified in Table 7 are acknowledged as having significant
effects on first-term attrition.59 The model was based on an average recruit that enlisted
in the Marine Corps in FY 2003. An “average-aged recruit” is a 19-year-old white male,
with a Tier I education credential, no dependents, and an AFQT percentile score of 61.
First, the study estimates Model (1), replicated below:
Attrite = β0 + β1(afqt_1) + β3(female) + β4(sngwdep) + β4(marriednokids) +
β5(marriedwkids) + β6(age) + β7(Black) + β8(asian) + β9(apina) + β10(otherrace) +
β11(oldtier2) + β12(oldier3) + β13(FY_04) + β14(FY_05) + β15(FY_06) + β16(FY_07) + μ
(1)
All descriptive statistics of the specified model are shown in Table 18.
59 Andrew, “Improved Screening for Navy Enlistment,” 31.

47
Table 18. Model 1—Variable and Descriptive Statistics
Variable Description Mean Std. Dev.
Attrite = 1 If attrite from USMC,
= 0 if otherwise
0.2763 0.4472
AFQT = AFQT score, continuous variable
from 31–99
61.7816 18.6060
Female = 1 if enlistee was female, = 0
otherwise
0.0677 0.2512
Single with Dependents = 1 if marital status is “single” and
dependents >= 1, 0 otherwise
0.0046 0.0679
Married with no Kids = 1 if marital status is “married” and
dependents
< 1, 0 otherwise
0.0320 0.1759
Married with Dependents = 1 if marital status is “married” and
dependents
>= 1, 0 otherwise
0.0033 0.0570
Age = Age of enlistee at the time of
enlistment
19.0908 2.3257
Black = 1 if enlistee was Black or African
American, = 0 otherwise
0.0655 0.2475
Asian = 1 if enlistee was Asian,
=0 otherwise
0.0171 0.1298
Asian Pacific Islander = 1 if enlistee was Native Hawaiian
or Pacific Islander,
= 0 otherwise
0.0046 0.0678
Other race = 1 if enlistee was American Indian,
Hispanic, Alaska Native or Did not
respond
0.1486 0.3557
Old Tier II = 1 if enlistee's education code was
in Tier II, under old classification,
=0 if otherwise
0.0354 0.1848
Old Tier III = 1 if enlistee's education code was
in Tier III, under old classification,
=0 if otherwise
0.0011 0.0336
Fiscal Year 2004 = 1 if entered the USMC in fiscal
year 2004,
=0 if otherwise
0.1974 0.3980
Fiscal Year 2005 = 1 if entered the USMC in fiscal
year 2005,
=0 if otherwise
0.2120 0.4087
Fiscal Year 2006 = 1 if entered the USMC in fiscal
year 2006,
=0 if otherwise
0.2265 0.4185
Fiscal Year 2007 = 1 if entered the USMC in fiscal
year 2007,
=0 if otherwise
0.1619 0.3683
Source: U.S. Marine Corps Total Forces Data Warehouse (2013).
Note: Data manipulated by STATA statistical software.

48
The estimates of Model (1) are shown in Table 19. They show that females have
higher attrition probabilities than men (by about 6 percentage points). The findings also
show that all ethnicities have a higher probability of completing their initial service
contract when compared to whites.
All education tiers appear significant. As hypothesized, Tier II and Tier III
individuals had higher attrition rates than did Tier I enlistees. More specifically, Tier II
individuals have a probability of attriting that is 7 percentage points higher than Tier I
recruits. Similarly, Tier III recruits have a probability of attriting that is 10 percentage
points higher than Tier I recruits. The Tier system was developed precisely for this
reason. Both of these variables are highly significant at the 1% significance level.
Table 19. Regression Results Using Old Education Tiers
Variables Probit Coefficients Partial Effects
AFQT -0.0003 -0.0001
(0.000) (0.000)
Female 0.1711*** 0.0588***
(0.012) (0.004)
Single with Dependents -0.1961*** -0.0605***
(0.049) (0.014)
Married with no Kids 0.1027*** 0.0348***
(0.017) (0.006)
Married with Dependents -0.1105** -0.0351**
(0.054) (0.017)
Age 0.0645*** 0.0212***
(0.001) (0.000)
Black -0.0915*** -0.0294***
(0.013) (0.004)
Asian 0.0013 0.0004
(0.024) (0.008)
Asian Pacific Islander -0.1926*** -0.0595***
(0.046) (0.013)
Native American -0.2489*** -0.0753***
(0.043) (0.012)

49
Variables Probit Coefficients Partial Effects
Other race -0.8412*** -0.2177***
(0.012) (0.002)
Old Tier II 0.2045*** 0.0711***
(0.017) (0.006)
Old Tier III 0.2772*** 0.0983***
(0.090) (0.034)
Fiscal Year 2004 0.1311*** 0.0443***
(0.011) (0.004)
Fiscal Year 2005 0.2825*** 0.0976***
(0.011) (0.004)
Fiscal Year 2006 0.2071*** 0.0706***
(0.010) (0.004)
Fiscal Year 2007 -0.0377*** -0.0123***
(0.010) (0.003)
Constant -1.8451***
(0.028)
Observations 163,746 163,746
Standard errors in parentheses
*** p<0.01, ** p<0.05, * p<0.1
Source: U.S. Marine Corps Total Forces Data Warehouse (2013).
Note: Data manipulated by STATA statistical software.
The second model is similar to the first model with the same demographic
variables. The only difference between the two models is that the second model includes
the home schooled recruits into Tier I:
Attrite = β0 + β1(afqt_1) + β3(female) + β4(sngwdep) + β4(marriednokids) +
β5(marriedwkids) + β6(age) + β7(Black) + β8(asian) + β9(apina) + β10(otherrace) +
β11(newtier2) + β12(newtier3) + β13(FY_04) + β14(FY_05) + β15(FY_06) + β16(FY_07)
+ μ (2)
Table 20 shows the variables and descriptive statistics for model (2).

50
Table 20. Model 2–Variable and Descriptive Statistics
Variable Description Mean Std. Dev. Min Max
Attrite = 1 If attrite from USMC,
= 0 if otherwise
0.2763 0.4472 0 1
AFQT = AFQT score, continuous variable from 31–99 61.7816 18.6060 30 99
Female = 1 if enlistee was female, = 0 otherwise 0.0677 0.2512 0 1
Single w/Depend = 1 if marital status is “single” and dependents
>= 1, 0 otherwise
0.0046 0.0679 0 1
Married
w/no Kids
= 1 if marital status is “married” and dependents
< 1, 0 otherwise
0.0320 0.1759 0 1
Married
w/Depend
= 1 if marital status is “married” and dependents
>= 1, 0 otherwise
0.0033 0.0570 0 1
Age = Age of enlistee at the time of enlistment 19.0908 2.3257 16 34
Black = 1 if enlistee was Black or African American,
= 0 otherwise
0.0655 0.2475 0 1
Asian = 1 if enlistee was Asian,
=0 otherwise
0.0171 0.1298 0 1
Asian Pacific Islander = 1 if enlistee was Native Hawaiian or Pacific Islander,
= 0 otherwise
0.0046 0.0678 0 1
Other race = 1 if enlistee was American Indian, Hispanic, Alaska
Native or Did not respond
0.1486 0.3557 0 1
New Tier II = 1 if enlistee's education code was in new tier II,
under old classification,
=0 if otherwise
0.0279 0.1648 0 1
New Tier III = 1 if enlistee's education code was in new tier III,
under old classification,
=0 if otherwise
0.0011 0.0336 0 1
Fiscal Year 2004 = 1 if entered the USMC in fiscal year 2004,
=0 if otherwise
0.1974 0.3980 0 1
Fiscal Year 2005 = 1 if entered the USMC in fiscal year 2005,
=0 if otherwise
0.2120 0.4087 0 1
Fiscal Year 2006 = 1 if entered the USMC in fiscal year 2006,
=0 if otherwise
0.2265 0.4185 0 1
Fiscal Year 2007 = 1 if entered the USMC in fiscal year 2007,
=0 if otherwise
0.1619 0.3683 0 1
Source: U.S. Marine Corps Total Forces Data Warehouse (2013).
Note: Data manipulated by STATA statistical software.
Table 21 presents the estimation results for model (2). When comparing the two
regression results listed in Tables 19 and 21, it is evident that classifying home-schooled
recruits as Tier I has increased the predictability and significance of Tier II enlistees.
When the Tier classification system was modified, the goodness-of-fit did not improve.
Table 21 shows that the second model yielded minor, but better effects to the current tier
system.

51
Table 21. Regression Results Using New Education Tiers
Variables Probit Partial Effects
AFQT -0.0002 -0.0001
(0.000) (0.000)
Female 0.1713*** 0.0589***
(0.012) (0.004)
Single with Dependents -0.1966*** -0.0606***
(0.049) (0.014)
Married with no Kids 0.1035*** 0.0351***
(0.017) (0.006)
Married with Dependents -0.1090** -0.0347**
(0.054) (0.017)
Age 0.0643*** 0.0212***
(0.001) (0.000)
Black -0.0921*** -0.0296***
(0.013) (0.004)
Asian 0.0005 0.0002
(0.024) (0.008)
Asian Pacific Islander -0.1923*** -0.0594***
(0.046) (0.013)
Native American -0.2494*** -0.0755***
(0.043) (0.012)
Other -0.8410*** -0.2177***
(0.012) (0.002)
Updated Tier II 0.2455*** 0.0862***
(0.019) (0.007)
Updated Tier III 0.2768*** 0.0981***
(0.090) (0.034)
Fiscal Year 2004 0.1311*** 0.0443***
(0.011) (0.004)
Fiscal Year 2005 0.2822*** 0.0975***
(0.011) (0.004)
Fiscal Year 2006 0.2071*** 0.0706***
(0.010) (0.004)
Fiscal Year 2007 -0.0363*** -0.0119***
(0.010) (0.003)
Constant -1.8431***

52
Variables Probit Partial Effects
(0.028)
Observations 163,746 163,746
Standard errors in parentheses
*** p<0.01, ** p<0.05, * p<0.1
Source: U.S. Marine Corps Total Forces Data Warehouse (2013).
Note: Data manipulated by STATA statistical software.
2. Attrition by Education Credential
For the third regression model, instead of using the traditional tiers to group
education codes, with each education credential is analyzed separately. Model (3) is
replicated below:
Attrite = β0 + β1(afqt_1) + β3(female) + β4(sngwdep) + β4(marriednokids) +
β5(marriedwkids) + β6(age) + β7(Black) + β8(asian) + β9(apina) + β10(otherrace) +
β11(Education Category)j + β13(FY_04) + β14(FY_05) + β15(FY_06) + β16(FY_07)
+ μ (3)
Table 22 shows the descriptive statistics for the new variables included in this
model.
Table 22. Model 3–Variable and Descriptive Statistics of Education Credentials
Variable Description Mean Std. Dev.
Non-High School
(HS) Grad
= 1 if educ credential “1”,
0 otherwise
0.0011 0.0335
Other non-traditional = 1 if educ credential “5”,
0 otherwise
0.0017 0.0418
Correspondence
school diploma
= 1 if educ credential “7”,
0 otherwise
0.0012 0.0347
15 college creds or
Job Corps + GED
= 1 if educ credential “8”,
0 otherwise
0.0211 0.1439
Probationary HS
senior
= 1 if educ credential “9”,
0 otherwise
0.0000 0.0034
Adult/alternate HS
diploma grad
= 1 if educ credential “B”,
0 otherwise
0.0111 0.1051
Occupational
program
= 1 if educ credential “C”,
0 otherwise
0.0000 0.0081

53
Variable Description Mean Std. Dev.
certificate/diploma
Associate’s degree = 1 if educ credential “D”,
0 otherwise
0.0045 0.0672
GED = 1 if educ credential “E”,
0 otherwise
0.0216 0.1456
HS diploma but failed
exit exam
= 1 if educ credential “F”,
0 otherwise
0.0007 0.0277
Home schooled = 1 if educ credential “H”,
0 otherwise
0.0074 0.0860
Attendance based HS
diploma
= 1 if educ credential “J”, 0
otherwise
0.0012 0.0356
Bachelor’s degree = 1 if educ credential “K”,
0 otherwise
0.0062 0.0788
Master’s Degree = 1 if educ credential “M”,
0 otherwise
0.0099 0.0993
Enrolled in other than
HS program
= 1 if educ credential “N”,
0 otherwise
0.0003 0.0179
HS diploma grad = 1 if educ credential “S”,
0 otherwise
0.3848 0.4865
Traditional HS senior = 1 if educ credential “W”,
0 otherwise
0.0001 0.0104
Post-baccalaureate = 1 if educ credential “X”,
0 otherwise
0.0019 0.0442
Source: U.S. Marine Corps Total Forces Data Warehouse (2013).
Note: Data manipulated by STATA statistical software.
It is important to analyze the educational codes separately to see how education
codes within each tier vary relative to predicted attrition rates. When the educational tiers
are separated, the results show which education credentials are individually significant.
Table 23 shows the results of Model (3) and indicates that by separating the educational
codes, the model predicts attrition more accurately.
As found in previous attrition studies, individuals with college credits or Job
Corps (Tier I) continue to display high attrition rates. The enlistee who earns 15 college
credits with a GED or alternative degree tends to have a higher likelihood of attrition than
do many Tier II enlistees.

54
As hypothesized, recruits who possess higher levels of education beyond high
school show promising trends of attrition predictability. The educational code with the
lowest attrition probability is an enlistee with a Master’s degree (Tier I).
The rest of the demographics have the same estimated results shown by previous
research on attrition. For example, females appear more likely to attrite (by 5 percentage
points). Also Blacks, Asians, and Native Americans have lower levels of attrition when
compared to white recruits.
Table 23. Model 3–Regression Results Without Tiers
Variables Probit Partial Effects
AFQT -0.0003** -0.0001**
(0.000) (0.000)
Female 0.1612*** 0.0552***
(0.012) (0.004)
Single with Dependents -0.2008*** -0.0617***
(0.049) (0.014)
Married with no kids 0.1285*** 0.0437***
(0.017) (0.006)
Married with Dependents -0.0869 -0.0278*
(0.054) (0.017)
Age 0.0446*** 0.0147***
(0.002) (0.001)
Black -0.0934*** -0.0299***
(0.013) (0.004)
Asian 0.0033 0.0011
(0.024) (0.008)
Asian Pacific Islander -0.1977*** -0.0608***
(0.046) (0.013)
Native American -0.2506*** -0.0756***
(0.043) (0.012)
Other Race -0.8379*** -0.2164***
(0.012) (0.002)
Less than HS 0.1947** 0.0676**
(0.090) (0.033)

55
Variables Probit Partial Effects
Non traditional HS 0.3173*** 0.1133***
(0.074) (0.028)
Correspondence Diploma 0.1471 0.0504
(0.090) (0.032)
1 Semester of College -0.0386* 0.0128*
(0.022) (0.007)
Probation HS Senior 1.1592* 0.4375**
(0.611) (0.211)
Adult Diploma 0.0307 0.0102
(0.030) (0.010)
Occupational Certificate -0.4698 -0.1295
(0.444) (0.097)
Associate Degree -0.1960*** -0.0603***
(0.048) (0.014)
GED 0.1603*** 0.0551***
(0.022) (0.008)
Exam Fail -0.1312 -0.0413
(0.113) (0.034)
Home Study -0.0352 -0.0114
(0.037) (0.012)
Attendance Certificate 0.2309*** 0.0809**
(0.085) (0.031)
Bachelors -0.1714*** -0.0532***
(0.041) (0.012)
Near HS Comp -0.1621*** -0.0505***
(0.032) (0.009)
Master's Degree -0.4611** -0.1276***
(0.180) (0.040)
HS Senior -0.2109*** -0.0684***
(0.008) (0.003)
1st Professional Degree 0.2554 0.0900
(0.291) (0.108)
GED National Guard Youth
Challenge
0.1815** 0.0628**
(0.074) (0.027)
Fiscal Year 2004 0.1329*** 0.0448***
(0.011) (0.004)
Fiscal Year 2005 0.2812*** 0.0969***

56
Variables Probit Partial Effects
(0.011) (0.004)
Fiscal Year 2006 0.2056*** 0.0700***
(0.010) (0.004)
Fiscal Year 2007 -0.0396*** -0.0129***
(0.010) (0.003)
Constant -1.3729***
(0.035)
Observations 163,746 163,746
Standard errors in parentheses
*** p<0.01, ** p<0.05, * p<0.1
Source: U.S. Marine Corps Total Forces Data Warehouse (2013).
Note: Data manipulated by STATA statistical software.
B. SUMMARY OF RESULTS
In conclusion, it is probable that the home school education code was switched to
Tier I status because a progression of performance was seen for enlistees who obtained
the home school educational code. It may even be assumed that more oversight from the
government occurred to standardize testing and teaching standards to help improve the
legitimization of home schooled individuals. However, when home schooled individuals
are pooled with the Tier I credential holders, a more accurate predictor of attrition is
evident. The military may have based their decision to alter the tier system based on the
civilian labor market since the performances of home-schooled individuals are
comparable to HS graduates. The alteration may be a product of political pressures
similar to those placed on DoD by the GED testing services in the 1990s as discussed in
Chapter II. Indeed, when the education codes are separated and evaluated independently,
home-schooled recruits have attrition rates that are similar to high school diploma
graduates.

57
V. FLEET ATTRITION ANALYSIS
This chapter examines boot camp attrition and factors that lead to fleet attrition.
As discussed in Chapter I, fleet attrition causes a financial burden on the Marine Corps
due to the monetary investment of basic training, MOS training, and various other costs.
With that in mind, it is imperative that analysis be completed on enlistees beyond the
event of boot camp. More importantly, many of the Marines that attrite from Marine
Corps boot camp are not for adaptability reasons. Many enlistees, specifically women,
have historically not been able to avoid physical injuries due to the rigorous training and
constant physical stress placed on them during the first 60 to 75 days of boot camp. When
analysis is done on individuals that have completed boot camp, we are able to look at
reasons outside of medical discharges, which are where majority of these types of
discharges occur.
This chapter examines demographics and personal characteristics to determine if
these traits can be used to predict future attrition. The objective of this section is to
analyze the enlistees who survive boot camp to identify what causes the expensive
premature separation from the Marine Corps.
A. DATA
The dataset used for this chapter is the same data from TFDW that has been used
throughout the thesis. However, Marines who attrite in less than 120 days of service were
removed from the sample. The author chose to remove Marines who attrite in less than
120 days because boot camp for the Marine Corps lasts approximately 90 days. After an
enlisted Marine exits boot camp, Marines usually take a short period of leave and then
transition to advanced training, known as Marine Combat Training (MCT), or the School
of Infantry (SOI) for Marines in the infantry. This time period is on average under 120
days unless the individual is on medical hold for a serious injury from boot camp that
requires medical surgery or extensive rehabilitation. Once a Marine has exited boot camp,
that individual is then considered to be a Fleet Marine. After the appropriate

58
modifications were made, the dataset was reduced to 152,476 observations. Tables 24
and 25 show the attrition rates of Marines who completed boot camp by educational tier.
Table 24. Fleet Attrition Rates by Old Educational Tiers
Variable N FY2004 FY2005 FY2006 FY2007 FY2007
Old Tier I 67,218 20.1% 20.9% 25.7% 24.9% 18.8%
Old Tier II 2157 25.6% 32.0% 32.1% 31.2% 20.9%
Old Tier III 63 22.7% 28.0% 42.9% 12.9% 13.5%
Source: U.S. Marine Corps Total Forces Data Warehouse (2013).
Note: Data manipulated by STATA statistical software.
Table 25. Fleet Attrition Rates by New Educational Tiers
Variable N FY2003 FY2004 FY2005 FY2006 FY2007
Updated Tier I 67,835 20.1% 20.9% 25.7% 25.0% 18.8%
Updated Tier II 1,833 27.0% 33.2% 33.9% 32.0% 21.2%
Updated Tier III 68 22.7% 28.0% 42.9% 12.9% 13.5%
Source: U.S. Marine Corps Total Forces Data Warehouse (2013).
Note: Data manipulated by STATA statistical software.
B. METHODOLOGY
Similar to the dataset utilized in Chapter III, enlisted cohorts from 2003–2007
were used to analyze fleet attrition. The same demographics, such as tier classification,
gender, AFQT score dependency status, race, and marital status were used. These results
were then compared with the results of the probit analysis found in Chapter IV to
determine if their characteristics of attrition were similar once boot camp attrites were
removed from the dataset.
C. VARIABLES
Variables used in Chapter III are similar to the variables used in previous
chapters. The variables are identical in this dataset for two reasons. To fully analyze the
difference in fleet attrition to early service attrition, all variables must remain constant. If
not, the analysis is subject to omitted variable bias. Additionally, identical variables are

59
used to compare the predictability of the two models. The same tiers and educational
codes are used as well. See table 15 for a detailed analysis of the educational codes. Table
26 shows updated descriptive statistics for the fleet attrition analysis.
Table 26. Fleet Attrition Analysis—Variable and Descriptive Statistics of Education
Credentials
Variable Description Mean Std. Dev.
Non-High School (HS) Grad = 1 if educ credential “1”,
0 otherwise 0.0010 0.0320
Other non-traditional = 1 if educ credential “5”,
0 otherwise 0.0016 0.0406
Correspondence school
diploma = 1 if educ credential “7”,
0 otherwise 0.0011 0.0337
15 college creds or Job Corps
+ GED = 1 if educ credential “8”,
0 otherwise 0.0205 0.1419
Probationary HS senior = 1 if educ credential “9”,
0 otherwise 0.0000 0.0036
Adult/alternate HS diploma
grad = 1 if educ credential
“B”, 0 otherwise 0.0107 0.1033
Occupational program
certificate/diploma = 1 if educ credential
“C”, 0 otherwise 0.0000 0.0080
Associate’s degree = 1 if educ credential
“D”, 0 otherwise 0.0045 0.0675
GED = 1 if educ credential
“E”, 0 otherwise 0.0203 0.1410
HS diploma but failed exit
exam = 1 if educ credential “F”,
0 otherwise 0.0007 0.0273
Home schooled = 1 if educ credential
“H”, 0 otherwise 0.0074 0.0861
Attendance-based HS
diploma = 1 if educ credential “J”,
0 otherwise 0.0012 0.0347
Bachelor’s degree = 1 if educ credential
“K”, 0 otherwise 0.0063 0.0794
HS diploma grad = 1 if educ credential
“L”, 0 otherwise 0.5203 0.4995
Enrolled in other than HS
program = 1 if educ credential
“M”, 0 otherwise 0.0096 0.0976
Master’s degree = 1 if educ credential
“N”, 0 otherwise 0.0003 0.0181
Traditional HS senior = 1 if educ credential “S”,
0 otherwise 0.3916 0.4881
Post-baccalaureate = 1 if educ credential
“U”, 0 otherwise 0.0000 0.0036

60
Variable Description Mean Std. Dev.
Post-baccalaureate = 1 if educ credential
“W”, 0 otherwise 0.0001 0.0105
Nat’l Guard Youth Challenge = 1 if educ credential
“X”, 0 otherwise 0.0019 0.0443
Source: U.S. Marine Corps Total Forces Data Warehouse (2013).
Note: Data manipulated by STATA statistical software.
The reference person is a 19-year-old white male, with a Tier I educational
credential, no dependents, an AFQT percentile score of 62, who enlisted in the Marine
Corps in FY 2003. The specified model is the same as model (1) presented in the
Methodology section. However, here, Model (1) is estimated with the subsample of
Marines who survive boot camp.
Table 27 shows all descriptive statistics of the specified model.
Table 27. Fleet Attrition Analysis Model 1—Variable and Descriptive Statistics
Variable Description Mean Std. Dev.
Attrite = 1 If attrite from USMC,
= 0 if otherwise 0.2244 0.4172
AFQT = AFQT score, continuous
variable from 31–99 61.90 18.59
Female = 1 if enlistee was female,
= 0 otherwise 0.0643 0.2453
Single with
Dependents
= 1 if marital status is
“single” and dependents
>= 1, 0 otherwise 0.0046 0.0679
Married with
no Kids
= 1 if marital status is
“married” and dependents
< 1, 0 otherwise 0.0314 0.1745
Married with
Dependents
= 1 if marital status is
“married” and dependents
>= 1, 0 otherwise 0.0032 0.0567
Age = Age of enlistee at the time
of enlistment 19.06 2.311
Black = 1 if enlistee was Black or
African American,
= 0 otherwise 0.0648 0.2462
Asian = 1 if enlistee was Asian,
=0 otherwise 0.0173 0.1304

61
Variable Description Mean Std. Dev.
Asian Pacific
Islander
= 1 if enlistee was Native
Hawaiian or Pacific Islander,
= 0 otherwise 0.0047 0.0683
Native = 1 if enlistee was American
Indian 0.0090 0.0687
Other race = 1 if enlistee did not respond 0.1589 0.3656
Old Tier II = 1 if enlistee's education
code was in Tier II, under old
classification,
=0 if otherwise 0.0338 0.1808
Old Tier III = 1 if enlistee's education
code was in Tier III, under old
classification,
=0 if otherwise 0.0010 0.0321
Fiscal Year
2004
= 1 if entered the USMC in
fiscal year 2004,
=0 if otherwise 0.2015 0.4011
Fiscal Year
2005
= 1 if entered the USMC in
fiscal year 2005,
=0 if otherwise 0.2097 0.4071
Fiscal Year
2006
= 1 if entered the USMC in
fiscal year 2006,
=0 if otherwise 0.2207 0.4147
Fiscal Year
2007
= 1 if entered the USMC in
fiscal year 2007,
=0 if otherwise 0.1586 0.3653
Source: U.S. Marine Corps Total Forces Data Warehouse (2013).
Note: Data manipulated by STATA statistical software.
In this section, three models were developed to analyze fleet attrition by education
credential. In the first model, the education credentials are grouped into tiers used prior to
moving home-schooled individuals to Tier I status as shown in Table 28. The second
model is similar to the first model and utilizes the same base variables. However, the
second model reflects the home school education variable being placed into Tier I status.
Table 28 shows the variable and descriptive statistics for model 2.
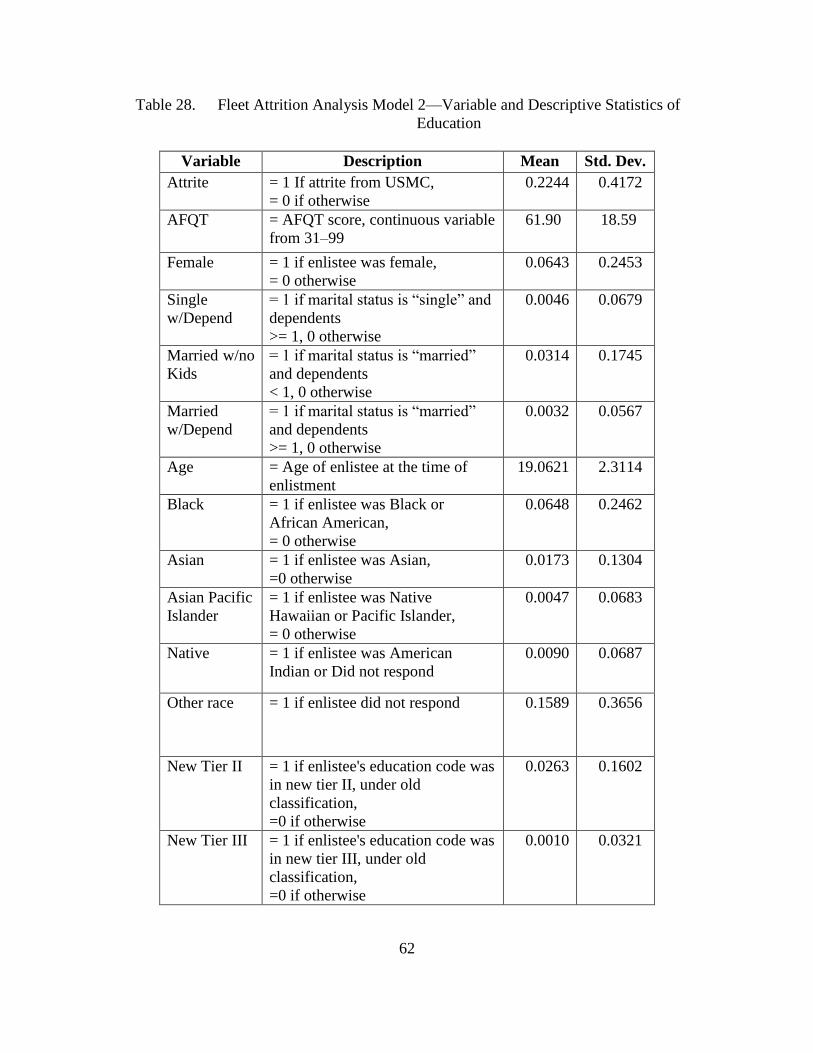
62
Table 28. Fleet Attrition Analysis Model 2—Variable and Descriptive Statistics of
Education
Variable Description Mean Std. Dev.
Attrite = 1 If attrite from USMC,
= 0 if otherwise
0.2244 0.4172
AFQT = AFQT score, continuous variable
from 31–99
61.90 18.59
Female = 1 if enlistee was female,
= 0 otherwise
0.0643 0.2453
Single
w/Depend
= 1 if marital status is “single” and
dependents
>= 1, 0 otherwise
0.0046 0.0679
Married w/no
Kids
= 1 if marital status is “married”
and dependents
< 1, 0 otherwise
0.0314 0.1745
Married
w/Depend
= 1 if marital status is “married”
and dependents
>= 1, 0 otherwise
0.0032 0.0567
Age = Age of enlistee at the time of
enlistment
19.0621 2.3114
Black = 1 if enlistee was Black or
African American,
= 0 otherwise
0.0648 0.2462
Asian = 1 if enlistee was Asian,
=0 otherwise
0.0173 0.1304
Asian Pacific
Islander
= 1 if enlistee was Native
Hawaiian or Pacific Islander,
= 0 otherwise
0.0047 0.0683
Native = 1 if enlistee was American
Indian or Did not respond
0.0090 0.0687
Other race = 1 if enlistee did not respond 0.1589 0.3656
New Tier II = 1 if enlistee's education code was
in new tier II, under old
classification,
=0 if otherwise
0.0263 0.1602
New Tier III = 1 if enlistee's education code was
in new tier III, under old
classification,
=0 if otherwise
0.0010 0.0321

63
Variable Description Mean Std. Dev.
Fiscal Year
2004
= 1 if entered the USMC in fiscal
year 2004,
=0 if otherwise
0.2015 0.4011
Fiscal Year
2005
= 1 if entered the USMC in fiscal
year 2005,
=0 if otherwise
0.2097 0.4071
Fiscal Year
2006
= 1 if entered the USMC in fiscal
year 2006,
=0 if otherwise
0.2207 0.4147
Fiscal Year
2007
= 1 if entered the USMC in fiscal
year 2007,
=0 if otherwise
0.1586 0.3653
Source: U.S. Marine Corps Total Forces Data Warehouse (2013).
Note: Data manipulated by STATA statistical software.
D. RESULTS
1. Fleet attrition Analysis by Education Tiers
The results of the first model, shown in Table 29, confirm that being female with
dependents, married or single, increases the probability of attrition. However, the
probability of a female not completing the first-term of enlistment decreases significantly
once the female enlistee has completed boot camp. Also, Blacks and Native Americans
have a higher probability of completing their initial service contract when they have
completed boot camp when compared to the base ethnicity.
Education tiers and AFQT scores were all significant variables. As hypothesized,
Tier II and Tier III individuals had higher attrition rates than Tier I enlistees. However,
when these results are compared with results displayed in Chapter IV, individuals who
hold Tier II and III credentials attrite at a lower rate once they have completed boot
camp. Therefore, the tier classification system is a better predictor of fleet attrition as
opposed to overall first term attrition that includes attrition from DEP or boot camp.

64
Table 29. Fleet Attrition Analysis—Regression Results Using Old Education Tiers
Variables Probit
Coefficients
Partial Effects
AFQT 0.0012*** 0.0004***
(0.000) (0.000)
Female 0.1263*** 0.0383***
(0.013) (0.004)
Single with Dependents -0.1662*** -0.0451***
(0.052) (0.013)
Married with no Dependents -0.2014*** -0.0542***
(0.019) (0.005)
Married with Dependents -0.1940*** -0.0520***
(0.060) (0.015)
Age 0.0062*** 0.0018***
(0.001) (0.000)
Black -0.1106*** -0.0309***
(0.013) (0.004)
Asian 0.0308 0.0091
(0.024) (0.007)
Asian Pacific Islander -0.1282*** -0.0354***
(0.048) (0.012)
Native American -0.2433*** -0.0638***
(0.046) (0.011)
Other -0.8334*** -0.1828***
(0.013) (0.002)
Old Tier II 0.1324*** 0.0404***
(0.018) (0.006)
Old Tier III 0.0096 0.0028
(0.097) (0.028)
Fiscal Year 2004 0.1208*** 0.0362***
(0.011) (0.003)
Fiscal Year 2005 0.2505*** 0.0771***
(0.011) (0.004)
Fiscal Year 2006 0.1381*** 0.0414***
(0.011) (0.003)
Fiscal Year 2007 -0.1512*** -0.0426***
(0.011) (0.003)

65
Variables Probit
Coefficients
Partial Effects
Constant -0.9337***
(0.030)
Observations 163,746 163,746
Standard errors in parentheses
*** p<0.01, ** p<0.05, *
p<0.1
Source: U.S. Marine Corps Total Forces Data Warehouse (2013).
Note: Data manipulated by STATA statistical software.
Table 30 shows that the second model yielded minor effects to the current tier
system, and in some cases, marginally worsened attrition rates.
Table 30. Fleet Attrition Analysis—Regression Results Using New Education Tiers
Variables Probit Partial Effects
AFQT 0.0012*** 0.0004***
(0.000) (0.000)
Female 0.1263*** 0.0383***
(0.013) (0.004)
Single with Dependents -0.1665*** -0.0452***
(0.052) (0.013)
Married with no Dependents -0.2009*** -0.0540***
(0.019) (0.005)
Married with Dependents -0.1931*** -0.0518***
(0.060) (0.015)
Age 0.0061*** 0.0018***
(0.001) (0.000)
Black -0.1110*** -0.0310***
(0.013) (0.004)
Asian 0.0302 0.0089
(0.024) (0.007)
Asian Pacific Islander -0.1280*** -0.0353***
(0.048) (0.012)
Native American -0.2436*** -0.0639***

66
Variables Probit Partial Effects
(0.046) (0.011)
Other -0.8332*** -0.1828***
(0.013) (0.002)
Updated Tier II 0.1551*** 0.0477***
(0.020) (0.006)
Updated Tier III 0.0093 0.0027
(0.097) (0.028)
Fiscal Year 2004 0.1208*** 0.0362***
(0.011) (0.003)
Fiscal Year 2005 0.2503*** 0.0771***
(0.011) (0.004)
Fiscal Year 2006 0.1381*** 0.0414***
(0.011) (0.003)
Fiscal Year 2007 -0.1502*** -0.0423***
(0.011) (0.003)
Constant -0.9325***
(0.030)
Observations 163746 163746
Standard errors in parentheses
*** p<0.01, ** p<0.05, * p<0.1
Source: U.S. Marine Corps Total Forces Data Warehouse (2013).
Note: Data manipulated by STATA statistical software.
When comparing the results of the two fleet attrition models shown in Tables 29
and 30, it is evident that moving the home school education code to Tier I status has
lessened the predictability and significance of Tier II enlistees. When the tier
classification system was modified, the goodness-of-fit did not improve.
2. Fleet attrition Analysis by Education Credential
For the third fleet attrition model, instead of using the traditional tiers to group
education codes, the education codes were separated from three groups and each
credential analyzed individually. Table 31 shows the descriptive statistics of this model.

67
Table 31. Fleet Attrition Analysis—Variable and Descriptive Statistics of Education
Credentials
Variable Description Mean Std. Dev.
Non-High School
(HS) Grad = 1 if educ credential “1”, 0 otherwise 0.0010 0.0320
Other non-
traditional = 1 if educ credential “5”, 0 otherwise 0.0016 0.0406
Correspondence
school diploma = 1 if educ credential “7”, 0 otherwise 0.0011 0.0337
15 college creds
or Job Corps +
GED = 1 if educ credential “8”, 0 otherwise 0.0205 0.1419
Probationary HS
senior = 1 if educ credential “9”, 0 otherwise 0.0000 0.0036
Adult/alternate HS
diploma grad = 1 if educ credential “B”, 0 otherwise 0.0107 0.1033
Occupational
program
certificate/diploma = 1 if educ credential “C”, 0 otherwise 0.0000 0.0080
Associate’s degree = 1 if educ credential “D”, 0 otherwise 0.0045 0.0675
GED = 1 if educ credential “E”, 0 otherwise 0.0203 0.1410
HS diploma but
failed exit exam = 1 if educ credential “F”, 0 otherwise 0.0007 0.0273
Home schooled = 1 if educ credential “H”, 0 otherwise 0.0074 0.0861
Attendance based
HS diploma = 1 if educ credential “J”, 0 otherwise 0.0012 0.0347
Bachelor’s degree = 1 if educ credential “K”, 0 otherwise 0.0063 0.0794
HS diploma grad = 1 if educ credential “L”, 0 otherwise 0.5203 0.4995
Enrolled in other
than HS program = 1 if educ credential “M”, 0 otherwise 0.0096 0.0976
Master’s degree = 1 if educ credential “N”, 0 otherwise 0.0003 0.0181
Traditional HS
senior = 1 if educ credential “S”, 0 otherwise 0.3916 0.4881
Post-baccalaureate = 1 if educ credential “U”, 0 otherwise 0.0000 0.0036
Post-baccalaureate = 1 if educ credential “W”, 0 otherwise 0.0001 0.0105
Nat’l Guard Youth
Challenge = 1 if educ credential “X”, 0 otherwise 0.0019 0.0443
Source: U.S. Marine Corps Total Forces Data Warehouse (2013).
Note: Data manipulated by STATA statistical software.

68
When the educational tiers are separated, the results indicate which education
credentials are individually significant. Table 32 shows the results of the fleet attrition
analysis. As seen here, by separating the educational codes, the similar education codes
that were significant in Chapter IV, are significant to survivors. This model predicts fleet
attrition better than the model with the tiers intact. The “goodness-of-fit,” also known as
the pseudo R-squared, increased from .0273 to .0314 when the education codes were
separated.
As found in previous attrition studies, the education code of 15 college credits or
Job Corps (Tier II) continues to display high attrition rates in the fleet. The enlistee who
earns 15 college credits with a GED or alternative degree performs lower than many Tier
II enlistees.
Similar to the analysis in Chapter IV, recruits who possess higher levels of
education beyond high school show promising trends of fleet attrition predictability. The
educational code with the lowest probability of attrition is the prospective enlistees who
join while they are still seniors in high school (Tier I). The educational code with the
highest probability of attrition is the GED (Tier II) educational credential.
Table 32. Fleet Attrition Analysis—Regression Results Without Tiers
Variables Probit Partial Effects
AFQT 0.0009*** 0.0003***
(0.000) (0.000)
Female 0.1142*** 0.0344***
(0.013) (0.004)
Single with Dependents -0.1717*** -0.0464***
(0.052) (0.013)
Married with no Dependents -0.1734*** -0.0471***
(0.019) (0.005)
Married with Dependents -0.1853*** -0.0498***
(0.060) (0.015)
Age -0.0148*** -0.0043***
(0.002) (0.001)

69
Variables Probit Partial Effects
Black -0.1121*** -0.0313***
(0.013) (0.004)
Asian 0.0307 0.0090
(0.024) (0.007)
Asian Pacific Islander -0.1331*** -0.0366***
(0.048) (0.012)
Native American -0.2450*** -0.0641***
(0.046) (0.011)
Other -0.8294*** -0.1818***
(0.013) (0.002)
Less than High School -0.0543 -0.0154
(0.097) (0.027)
Non traditional High School
Certificate
0.2507*** 0.0797***
(0.076) (0.026)
Correspondence Diploma 0.0611 0.0182
(0.096) (0.029)
1 Semester of College 0.1232*** 0.0374***
(0.023) (0.007)
Adult Diploma 0.0020 0.0006
(0.032) (0.009)
Occupational Certificate -0.6734 -0.1420*
(0.540) (0.073)
Associate Degree 0.0163 0.0048
(0.050) (0.015)
GED 0.0932*** 0.0280***
(0.023) (0.007)
Exam Fail -0.1506 -0.0411
(0.122) (0.031)
Home Study -0.0203 -0.0059
(0.039) (0.011)
Attendance Certificate 0.0955 0.0288
(0.091) (0.028)
Bachelors 0.1621*** 0.0500***
(0.042) (0.014)
Near Completion of High
School
-0.0554* -0.0157*
(0.033) (0.009)

70
Variables Probit Partial Effects
Master's Degree -0.4194* -0.1008**
(0.219) (0.042)
High School Senior -0.1761*** -0.0504***
(0.008) (0.002)
1st Professional Degree 0.7912*** 0.2850**
(0.293) (0.117)
GED National Guard Youth
Challenge
0.0952 0.0287
(0.077) (0.024)
Fiscal Year 2004 0.1214*** 0.0363***
(0.011) (0.003)
Fiscal Year 2005 0.2485*** 0.0764***
(0.011) (0.004)
Fiscal Year 2006 0.1366*** 0.0409***
(0.011) (0.003)
Fiscal Year 2007 -0.1527*** -0.0429***
(0.011) (0.003)
Constant -0.4477***
(0.038)
Observations 163746 163746
Standard errors in parentheses
*** p<0.01, ** p<0.05, *
p<0.1
Source: U.S. Marine Corps Total Forces Data Warehouse (2013).
Note: Data manipulated by STATA statistical software.
3. Summary of Results
The analyses of enlistees who have completed boot camp portray similar trends as
analyses of educational credentials of individuals who attrite from boot camp. This result
makes it possible to deduce that, similar to naval fleet attrition analysis conducted by
Andrew, the educational tier system delivers the same inconsistencies when attempting to
predict fleet attrition.60 Even when the home-schooled education credential is moved into
Tier I status, the predictability of boot camp survivors continues to decrease. When
60 Andrew, “Improved Screening for Navy Enlistment,” 63.

71
educational codes are not grouped within the tier system, the predictability of first-term
and fleet attrition improves. The results are strikingly similar to the results found in
Chapter IV. However, a significant decrease in attrition is seen once an enlistee has
completed boot camp. This outcome partially results from the fact that, by the time the
enlistee has completed boot camp, a sense of duty continues to prevail to serve the
enlistment contract because a good amount of time and effort has been invested into
completing Marine Corps boot camp.

72
THIS PAGE INTENTIONALLY LEFT BLANK

73
VI. SUMMARY, CONCLUSIONS AND RECOMMENDATIONS
A. SUMMARY
The original purpose of the educational tier system was to simplify the screening
process used for prospective enlistees. The tiers allowed educational credentials of
prospective recruits and military applicants to be grouped together by attrition rates based
on historic performance. However, throughout the years, the performance of recruits with
certain education credentials has been uneven at best. At the same time, extraneous
factors, such as pressure from the GED industry or from supporters of other educational
alternatives to the traditional high school diploma, have influenced the way in which
educational credentials are used during enlistment screening. As a result of these outside
forces and changes in the reliability of certain credentials, the tier system has become
somewhat less effective in predicting attrition from military service.
1. First-Term Attrition
The Marine Corps has taken significant steps to improve the accuracy of the
education tier system. In June 2012, the Marine Corps decided to shift the home school
education credential from Tier II to Tier I status. Looking at the predictability of the tier
system when home-school credential holders are grouped in Tier II, we see that the
attrition rates of home-school credential holders are consistent with Tier I credentials.
When the same sample is analyzed with home-school credential holders grouped in Tier
I, the predictability of the model increases. When the results are populated with the
educational credentials broken out, the predictability of the model increases.
The most significant variables in the sample are age, gender, marital status and
dependency status. Each of these variables correlates to high levels of first term attrition
for enlistees. Although these demographic variables are useful in predicting first term
attrition, an enlistee with a traditional high school diploma is still the most useful basis
for predicting first-term attrition.
74
2. Fleet Attrition
When the sample was restricted to only the graduates of boot camp, much of the
same conclusions are drawn from the first term attrition dataset. The shift of the home-
school education credential from Tier II to Tier I also increases the predictability of fleet
attrition. With home-school credential holders broken out and analyzed separately, the
accuracy of the home-school education credential is significant when applied to Marines
who graduated boot camp.
Similar to studies in the past, the variables found as most significant to fleet
attrition were marital status and dependency status. Gender is still an important
demographic in analyzing fleet attrition; however, the predictability of female attrition
decreased significantly once the female Marines graduated boot camp. This is similar to
studies that have analyzed gender attrition in the Marine Corps.
B. CONCLUSION
Many of the findings in this thesis are consistent with those of other researchers.
Enlistees with higher AFQT scores will tend to have a lower likelihood of attrition. Also,
enlistees with higher levels of education will also tend to have a lower probability of
attrition. The only exception to this rule is with the evolution of many of the alternative
educational credentials that have been developed over the past 20 years. For instance, the
educational code listed as “some college” is incorrectly labeled and misleading. The
educational code “some college” includes enlistees who did not complete high school but
attended at least 15 college credits at a post-high school institution. Since these enlistees
have completed 15 college credits at a post-high school institution, regardless of classes
or school accreditation, they are able to shift from a Tier II status to a Tier I status. This
educational code may be a way to expand the pool of Tier II enlistees. However,
additional screening needs to be placed on this education credential to improve its
usefulness in predicting attrition.

75
Similar to the findings of Andrew, the demographic with the highest correlation to
attrition is being single with dependents.61 The highest correlation is evident during fleet
attrition rates.
Previous attrition research hypothesizes that the same predictors of first term
attrition are constant and similar to those when applied to the survivors of boot camp who
do not complete their initial service obligation. This study suggests that first-term
attrition and fleet attrition are very similar, and the predictors only change slightly.
The only predictors that change slightly between first-term and fleet attrition are
gender, age, and marital status. A similar correlation is found in the age variable.
Enlistees over the age of 18 had high attrition rates when applied to the entire first term.
However, when the sample is restricted to enlistees who are boot camp survivors, the
attrition rate decreased. Once these older Marines reach the Fleet, they are more mature
and more likely to complete their initial service obligation. When marital status was
analyzed in the first-term attrition model, persons who were married without dependents
had a high correlation to attrition. However, when the survivors of boot camp were
analyzed, being married with no dependents had a negative correlation to attrition.
C. RECOMMENDATIONS
1. Reevaluate Educational Credentials
The education credential “8” (Tier I) actually encompasses two education
credentials. The first persons covered in this group are enlistees who possess of a Job
Corps certificate and are GED holders. Education credential “8” also includes persons
who have completed 15 credits at a college, regardless of previous education level.
Therefore, an enlistee who has dropped out of high school during the 10th
grade and
decides to take a few courses at the local community college will receive this education
credential upon entering into the Marine Corps. This education category is also
considered to be a Tier I education credential. An enlistee who has 15 college credits and
high school diploma is vastly different from a GED credential holder or a high school
dropout with 15 credits of postsecondary education. One can speculate that the
61 Andrew, “Improved Screening for Navy Enlistment,” 68.

76
motivation or “stick-to-it-ness” of these two enlistees is somewhat different based on the
overriding value of the high school diploma in predicting attrition. Therefore, within the
Marine Corps Recruiting Information Support System (MCRISS) there needs to be a way
to separate this educational credential into two separate categories to improve its utility in
enlistment screening.
This educational credential does not distinguish between enlistees who have a
GED or possess a Job Corps credential. If the educational credential is separated by
individuals with 15 college credits who have a GED or Job Corps certificate, this would
provide greater insight as to what is causing attrition within this credential.
2. Dependency Status
Marine Corps Recruiting Command uses AFQT scores, education credentials and
physical fitness standards as the primary means of screening prospective recruits.
Characteristics such as gender, age, race, ethnicity and dependency status are known as
secondary screening tools. The secondary screening devices are seldom given the same
level of scrutiny as the primary screening methods. However, when it comes to the
variable of dependency status, more attention needs to be given to this characteristic since
it is often overlooked as a key predictor of attrition. The results show that single recruits
with a dependent attrite at a rate that is 27 percentage points higher than that of enlistees
without a dependent. It is recommended that a cap be placed on the number of
dependency waivers a recruiting station is allowed to grant annually. Consequently,
Commanding Officers at the recruiting stations would be able to determine with more
scrutiny if the prospective enlistee is deserving of the dependency waiver since these
individuals tend to attrite at such high rates.
3. ScreeNing by Individual Educational Credential
Due to the wide disparity in the predictability of certain educational credentials, it
is difficult to place unbounded trust in the tier system. Therefore, the Marine Corps
should consider screening prospective enlistees by the individual education credential
along with ASVAB and AFQT scores. The results suggest that regardless of how the

77
educational credentials are grouped, screening by individual characteristics could be
more effective than the tier system currently in place.
D. FUTURE RESEARCH
1. Home School Education across States
The home school educational credential is now considered to be a Tier I
credential under the current tier system. There is no national or federal standard that
home school credential holders need to obtain to be certified as a graduated home-
schooler. The standards applied to home-schooling vary from state to state. With
increased participation in home-school programs, the Marine Corps is noticing a rising
number of home-school accessions each year. With this understanding, it is
recommended that a study be conducted on the attrition rates of home-school credential
holders by geographic region, association or state. This information can be incorporated
into the recruiting command market and analysis research section to determine if recruits
in certain areas are producing enlistees with higher risks of attrition.
2. Non-Cognitive Screening for Tier II Credentials
The Army Research Institute has blazed a path for other services to follow when it
comes to non-cognitive testing. The Army has seen success by applying non-cognitive
testing to their recruiting toolkit to qualify applicants who would have been otherwise
ineligible for enlistment. It is recommended that the Marine Corps examine non-cognitive
factors and apply them across all potential recruits who have Tier II educational
credentials. This would expand the pool of Tier II recruits and allow recruiters to utilize
intangible characteristics that educational credentials and AFQT scores are not able to
capture. These non-cognitive factors can be incorporated with the current screening
model to predict attrition.
3. Drawdown Effects
A trend may be developing among college graduates who are willing to enlist in
the Marine Corps. In 2002, the Marine Corps experienced an influx of college graduates
enlisting as a result of the September 11, 2001, terrorist attacks. Now, with a still
78
struggling national economy, the Marine Corps is starting to see an influx similar to
2002, but for different reasons. These enlistees with bachelor’s degrees are joining
because the Marine Corps is currently undergoing a significant reduction in end-strength.
With these cuts, the Marine Corps has been forced to scale back the number of officer
accessions due to the high cost associated with producing a Marine officer versus an
enlisted Marine. Therefore, it is recommended that a study be conducted determine how
the drawdown has affected recruiting and first-term attrition.
E. FINAL REMARKS
A reoccurring theme in attrition research is that the high school diploma is the
most accurate predictor of first-term attrition. Several studies have attempted to find other
characteristics that are highly correlated with fleet attrition. Another common theme in
attrition research is that the more education an enlistee possesses, the less likely that
enlistee will attrite from the service. The same theme is found when it comes to AFQT
scores. The value of this thesis lies in the ability of the Marine Corps to look at other
ways of expanding the pool of potentially successful enlistees without relying so heavily
on education credentials.

79
LIST OF REFERENCES
Andrew, John J. “Improved Screening for Navy Enlistment.” Master’s thesis, Naval
Postgraduate School, 2009.
Armour, Davis, and Curtis L. Gilroy. Changing Minority Representation in the U.S.
Military. Armed Forces and Society, 2009.
Bownds, Christopher D. “Updating the Navy’s Recruit Quality Matrix: An Analysis of
Educational Credentials and the Success of First-Term Sailors.” Master’s thesis,
Naval Postgraduate School, 2004.
Buddin, Richard. Analysis of Early Military Attrition Behavior. Santa Monica, CA:
RAND Corporation, 1984.
Commander. Marine Corps Recruiting Command, Fiscal Year 2012 Recruiting Report.
Quantico, VA: Commander, Marine Corps Recruiting Command, 2012.
Cooper, Richard V. L. Military Manpower and the All-Volunteer Force. Santa Monica,
CA: RAND Corporation, 1977.
Department of Defense. Influencer Poll 10: Overview Report. Arlington, VA: Joint
Advertising and Market Research and Studies Program, 2008.
Eitelberg, Mark J. Janice H. Laurence, Brian K. Waters, and Linda S. Perelman.
Screening for Service: Aptitude and Education Criteria for Military Entry.
Alexandria, VA: Human Resources Research Organization, 1984.
Elster Richard S., and Eli S. Flyer. A Study of the Relationship Between Education
Credentials and Military Performance Criteria. Monterey, CA: Naval
Postgraduate School, 1982.
Flyer, Eli S. Educational Credentials and First-Term Attrition. Unpublished: Directorate
for Accession Policy Office of the Assistant Secretary of Defense [Force
Management], 2002.
———. Factors Relating to Discharge for Unsuitability Among 1956 Airman Accessions
to the Air Force. Lackland AFB, TX: Personnel Laboratory, Wright Air
Development Center, 1959.
———. First Term Attrition Among Enlisted Personnel Grouped by Racial/Ethnic
Background. Monterey, CA: BDM Corporation, 1984.
Flyer, Eli S., and Richard S. Elster. First Term Attrition Among Non-Prior Service
Enlisted Personnel: Loss Probabilities Based on Selected Entry Factors.
Monterey, CA: Naval Postgraduate School, 1983.
80
Franke, David B. “An Evaluation of Marine Corps Educational Credentials.” Master’s
thesis, Naval Postgraduate School, 1983.
Klein, Stephen, Jennifer Hawes-Dawson, and Thomas Martin. Why Recruits Separate
Early. R-3980-FMP. Santa Monica, CA: RAND Corporation, 1991.
Laurence, Janice H. Education Standards for Military Selection: From the Beginning.
Alexandria, VA: Human Resources Research Organization, 1984.
Laurence, Janice H. Peter F. Ramsberger, and Jane M. Arabian. Education Credential
Tier Evaluation. Arlington, VA: Human Resources Research Organization, 1997.
Matloff, Maurice. American Military History. Washington, DC: Office of the Chief of
Military History, U.S. Army, 1973.
Neuhalfen, Jon K. “Analysis of Recruit Attrition from the Navy’s Delayed Entry Program
and Recruit Training Command.” Master’s thesis, Naval Postgraduate School,
2007.
Pew Hispanic Center. Fact Sheet: Hispanics in the Military. Washington, DC: Pew
Hispanic Center, 2003.
Population Representation in the Military Service, Fiscal Year 2010. Department of
Defense, 2006.
http://prhome.defense.gov/RFM/MPP/ACCESSION%20POLICY/PopRep2010/s
ummary/summary.html.
Quester, Aline O. Marine Corps Recruits: A Historical Look at Accessions and Bootcamp
Performance. Alexandria, VA: Center for Naval Analysis, 2010.
Quester, Aline O. James H. North, and Theresa H. Kimble. Identifying Successful Marine
Corps Recruits. Alexandria, VA: Center for Naval Analysis, 1990.
Rostker, Bernard. I Want You! The Evolution of the All-Volunteer Force. Santa Monica,
CA: RAND Corporation, 2006.
Trent, Thomas, and Janice H. Laurence. Adaptability Screening for the Armed Forces.
Washington, DC: Office of the Assistant Secretary of Defense [Force
Management and Personnel], 1993.
U.S. Government Accounting Office. Military Attrition: Better Data, Coupled with
Policy Changes, Could Help the Services Reduce Early Separations
(GAO/NSAID-98-213). Washington, DC: GPO, 1998.
Wooldridge, Jeffrey M. Introductory Econometrics. 4th ed. Mason, OH: Thomson South-
Western, 2009.

81
INITIAL DISTRIBUTION LIST
1. Defense Technical Information Center
Ft. Belvoir, Virginia
2. Dudley Knox Library
Naval Postgraduate School
Monterey, California
3. Marine Corps Representative
Naval Postgraduate School
Monterey, California
4. Director, Training and Education
MCCDC, Code C46
Quantico, Virginia
5. Director, Marine Corps Research Center
MCCDC, Code C40RC
Quantico, Virginia
6. Marine Corps Tactical Systems Support Activity
(Attn: Operations Officer)
Camp Pendleton, California
7. Elda Pema
Naval Postgraduate School
Monterey, California
8. Mark Eitelberg
Naval Postgraduate School
Monterey, California
9. Andrew Holmes
Marine Corps Recruiting Command
Quantico, Virginia