NAVAL POSTGRADUATE SCHOOL - apps.dtic.mil · Standard software generates a chemical-agent-release...
105
NAVAL POSTGRADUATE SCHOOL MONTEREY, CALIFORNIA THESIS Approved for public release; distribution is unlimited U.S. CHEMICAL WARFARE STOCKPILE VULNERABILITY: EFFECTS TO LOCAL INFRASTRUCTURE FROM A CHEMICAL-AGENT RELEASE by Jeffrey Sundberg June 2007 Thesis Advisor: R. Kevin Wood Second Reader: P. Lee Ewing
Transcript of NAVAL POSTGRADUATE SCHOOL - apps.dtic.mil · Standard software generates a chemical-agent-release...

NAVAL
POSTGRADUATE SCHOOL
MONTEREY, CALIFORNIA
THESIS
Approved for public release; distribution is unlimited
U.S. CHEMICAL WARFARE STOCKPILE VULNERABILITY: EFFECTS TO LOCAL
INFRASTRUCTURE FROM A CHEMICAL-AGENT RELEASE
by
Jeffrey Sundberg
June 2007
Thesis Advisor: R. Kevin Wood Second Reader: P. Lee Ewing

THIS PAGE INTENTIONALLY LEFT BLANK

i
REPORT DOCUMENTATION PAGE Form Approved OMB No. 0704-0188 Public reporting burden for this collection of information is estimated to average 1 hour per response, including the time for reviewing instruction, searching existing data sources, gathering and maintaining the data needed, and completing and reviewing the collection of information. Send comments regarding this burden estimate or any other aspect of this collection of information, including suggestions for reducing this burden, to Washington headquarters Services, Directorate for Information Operations and Reports, 1215 Jefferson Davis Highway, Suite 1204, Arlington, VA 22202-4302, and to the Office of Management and Budget, Paperwork Reduction Project (0704-0188) Washington DC 20503. 1. AGENCY USE ONLY (Leave blank)
2. REPORT DATE June 2007
3. REPORT TYPE AND DATES COVERED Master’s Thesis
4. TITLE AND SUBTITLE U.S. Chemical Warfare Stockpile Vulnerability: Effects to Local Infrastructure from a Chemical-Agent Release 6. AUTHOR(S) Lt Col Jeffrey Sundberg
5. FUNDING NUMBERS
7. PERFORMING ORGANIZATION NAME(S) AND ADDRESS(ES) Naval Postgraduate School Monterey, CA 93943-5000
8. PERFORMING ORGANIZATION REPORT NUMBER
9. SPONSORING /MONITORING AGENCY NAME(S) AND ADDRESS(ES) N/A
10. SPONSORING/MONITORING AGENCY REPORT NUMBER
11. SUPPLEMENTARY NOTES The views expressed in this thesis are those of the author and do not reflect the official policy or position of the Department of Defense or the U.S. Government. 12a. DISTRIBUTION / AVAILABILITY STATEMENT Approved for public release, distribution is unlimited.
12b. DISTRIBUTION CODE
13. ABSTRACT (maximum 200 words) This thesis develops methods to identify certain infrastructure vulnerabilities from the accidental or intentional release of
a chemical agent from a U.S. Chemical Warfare Stockpile and Facility (CF). For the region surrounding any CF, a “multi-infrastructure network operations model” (MINO) is created from various infrastructure datasets: MINO covers the local population, road network, and emergency-response systems. Standard software generates a chemical-agent-release scenario that requires the evacuation of part of the region, and that blocks emergency responders from using certain roads. Using shortest-path methods, one version of MINO then identifies evacuation routes that the local population will likely use, showing where traffic congestion may slow evacuation. Another version computes and compares emergency-response distances, pre-release and post-release, for areas outside the contaminated region. Two or three scenarios are examined for each of six CFs. The areas surrounding Newport, Indiana, and Pueblo, Colorado, CFs show low evacuation numbers and low traffic intensities. For the Anniston, Alabama; Blue Grass, Kentucky; and Umatilla, Oregon CFs, several roads exhibit high traffic intensities that may slow evacuations. Several of these scenarios, along with one Pueblo incident, also show significant travel-distance increases for emergency-responders. Software limitations prohibit analysis of the CF at Tooele, Utah.
15. NUMBER OF PAGES
105
14. SUBJECT TERMS Chemical facility, chemical agent, chemical release, evacuation, emergency response, infrastructure, road network, shortest paths, graphical-information system
16. PRICE CODE
17. SECURITY CLASSIFICATION OF REPORT
Unclassified
18. SECURITY CLASSIFICATION OF THIS PAGE
Unclassified
19. SECURITY CLASSIFICATION OF ABSTRACT
Unclassified
20. LIMITATION OF ABSTRACT
UL NSN 7540-01-280-5500 Standard Form 298 (Rev. 2-89) Prescribed by ANSI Std. 239-18

ii
THIS PAGE INTENTIONALLY LEFT BLANK
iii
Approved for public release, distribution is unlimited.
U.S. CHEMICAL WARFARE STOCKPILE VULNERABILITY: EFFECTS TO LOCAL INFRASTRUCTURE FROM A CHEMICAL-AGENT RELEASE
Jeffrey P. Sundberg Lieutenant Colonel, United States Air Force
B.S., University of Colorado, 1991
Submitted in partial fulfillment of the requirements for the degree of
MASTER OF SCIENCE IN OPERATIONS RESEARCH
from the
NAVAL POSTGRADUATE SCHOOL June 2007
Author: Jeffrey P. Sundberg
Approved by: R. Kevin Wood Thesis Advisor
P. Lee Ewing Second Reader
James N. Eagle Chairman, Department of Operations Research

iv
THIS PAGE INTENTIONALLY LEFT BLANK
v
ABSTRACT
This thesis develops methods to identify certain infrastructure vulnerabilities from
the accidental or intentional release of a chemical agent from a U.S. Chemical Warfare
Stockpile and Facility (CF). For the region surrounding any CF, a “multi-infrastructure
network operations model” (MINO) is created from various infrastructure datasets:
MINO covers the local population, road network, and emergency-response systems.
Standard software generates a chemical-agent-release scenario that requires the
evacuation of part of the region, and that blocks emergency responders from using certain
roads. Using shortest-path methods, one version of MINO then identifies evacuation
routes that the local population will likely use, showing where traffic congestion may
slow evacuation. Another version computes and compares emergency-response distances,
pre-release and post-release, for areas outside the contaminated region. Two or three
scenarios are examined for each of six CFs. The areas surrounding Newport, Indiana,
and Pueblo, Colorado, CFs show low evacuation numbers and low traffic intensities. For
the Anniston, Alabama; Blue Grass, Kentucky; and Umatilla, Oregon CFs, several roads
exhibit high traffic intensities that may slow evacuations. Several of these scenarios,
along with one Pueblo incident, also show significant travel-distance increases for
emergency-responders. Software limitations prohibit analysis of the CF at Tooele, Utah.

vi
THIS PAGE INTENTIONALLY LEFT BLANK
vii
TABLE OF CONTENTS
I. INTRODUCTION........................................................................................................1 A. OVERVIEW.....................................................................................................1 B. BACKGROUND AND MOTIVATION ........................................................1 C. METHODOLOGY ..........................................................................................2 D. SCOPE, LIMITATIONS, AND ASSUMPTIONS ........................................4 E. THESIS ORGANIZATION............................................................................5
II. OPERATIONAL-ENVIRONMENT ASSESSMENT ..............................................7 A. U.S. CHEMICAL AGENTS............................................................................7
1. Agent Persistence .................................................................................7 2. Nerve Agents.........................................................................................8 3. Blister Agents .......................................................................................9
B. U.S. CHEMICAL WARFARE STOCKPILE...............................................9 1. Pine Bluff Chemical Activity, Pine Bluff, Arkansas .......................11 2. Newport Chemical Depot, Newport, Indiana..................................11 3. Anniston Chemical Activity, Anniston, Alabama ...........................12 4. Blue Grass Chemical Activity, Richmond, Kentucky.....................13 5. Pueblo Chemical Depot, Pueblo, Colorado......................................14 6. Deseret Chemical Depot, Tooele, Utah ............................................15 7. Umatilla Chemical Depot, Umatilla, Oregon ..................................16
C. INFRASTRUCTURE ....................................................................................17 1. Road Network.....................................................................................18 2. Public Health ......................................................................................18 3. Emergency-Response Systems ..........................................................18 4. Department of Defense (DoD) Facilities ..........................................19 5. Railroad Network...............................................................................19 6. Energy Systems and Services............................................................19 7. Water Systems....................................................................................19 8. Agriculture..........................................................................................20
D. CHEMICAL CATASTROPHE....................................................................20
III. MODEL DEVELOPMENT ......................................................................................23 A. POPULATION, ROAD, EMERGENCY REPONSE SYSTEM
MODEL ..........................................................................................................23 B. CATASTROPHE SCENARIOS...................................................................26 C. MULTI-INFRASTRUCTURE NETWORK OPERATIONS MODEL ...27
1. Creating the Evacuation Ellipse and Parameterizing MINONET ..28 2. The Evacuation Model.......................................................................29 3. The Emergency-Response System Model ........................................30
IV. MODEL SCENARIOS, ANALYSES AND RESULTS..........................................33 A. ROAD TRAFFIC RESULTS FROM MINOEVAC.......................................33 B. NEWPORT CHEMICAL DEPOT, INDIANA ...........................................34
viii
1. Parameters and Data Processing (Newport) ...................................34 2. Analysis and Results (Newport)........................................................35 3. Summary (Newport) ..........................................................................40
C. ANNISTON CHEMICAL ACTIVITY, ALABAMA .................................41 1. Parameters and Data Processing (Anniston)...................................41 2. Analysis and Results (Anniston) .......................................................42 3. Summary (Anniston) .........................................................................47
D. BLUE GRASS CHEMICAL ACTIVITY, KENTUCKY...........................47 1. Parameters and Data Processing (Blue Grass) ...............................47 2. Analysis and Results (Blue Grass)....................................................49 3. Summary (Blue Grass) ......................................................................53
E. PUEBLO CHEMICAL DEPOT, COLORADO .........................................53 1. Parameters and Data Processing (Pueblo) ......................................53 2. Analysis and Results (Pueblo)...........................................................55 3. Summary (Pueblo) .............................................................................57
F. DESERET CHEMICAL DEPOT, UTAH ...................................................58 1. Parameters and Data Processing (Deseret) .....................................58 2. Analysis and Results (Deseret)..........................................................59
G. UMATILLA CHEMICAL DEPOT, OREGON..........................................59 1. Parameters and Data Processing (Umatilla) ...................................59 2. Analysis and Results (Umatilla)........................................................61 3. Summary (Umatilla) ..........................................................................65
V. CONCLUSIONS AND RECOMMENDATIONS...................................................67 A. SUMMARY ....................................................................................................67 B. CONCLUSIONS AND KEY INSIGHTS ....................................................68 C. FOLLOW-ON WORK ..................................................................................68
APPENDIX A: HPAC ..........................................................................................................71
APPENDIX B: CREATING THE MINO ..........................................................................73 A. BACKGROUND ............................................................................................73 B. ROAD NETWORK DEVELOPMENT .......................................................73 C. POPULATION MAPPING...........................................................................75 D. EMERGENCY RESPONSE SYSTEM (ERS) ............................................76
APPENDIX C: GOOGLE EARTH NETWORK DISPLAY............................................77
LIST OF REFERENCES......................................................................................................81
INITIAL DISTRIBUTION LIST .........................................................................................85

ix
LIST OF FIGURES
Figure 1. U.S. Chemical Warfare Stockpile Locations (Source: CMA 2007) ................10 Figure 2. Pine Bluff Arsenal, Arkansas (Source: Google Maps 2007). ..........................11 Figure 3. Newport Chemical Depot, Indiana (Source: Google Maps 2007). ..................12 Figure 4. Anniston Army Depot, Alabama (Source: Google Maps 2007)......................13 Figure 5. Blue Grass Army Depot, Kentucky (Source: Google Maps 2007)..................14 Figure 6. Pueblo Chemical Depot, Colorado (Source: Google Maps 2007)...................15 Figure 7. Tooele Army Depot, Utah (Source: Google Maps 2007). ...............................16 Figure 8. Umatilla Chemical Depot, Oregon (Source: Google Maps 2007). ..................17 Figure 9. Example of MINOG Extracted from Pueblo, Colorado.......................................25 Figure 10. Example HPAC Chemical Catastrophe Result. ...............................................27 Figure 11. Newport Chemical Depot Chemical Catastrophes. .........................................35 Figure 12. Newport Chemical Depot Evacuation Result (Scen. 1: SW Wind).................36 Figure 13. Newport Chemical Depot Evacuation Result (Scen. 2: S Wind).....................38 Figure 14. Newport ERS Results, Scen. 2: Hospitals (Left) and ER (Right)...................40 Figure 15. Anniston Chemical Activity Chemical Catastrophes ......................................42 Figure 16. Anniston Chemical Activity Evacuation Result (Scen. 1: N Wind)................43 Figure 17. Anniston ERS Result, Scen. 1: Hospitals (Left) and ER (Right)....................44 Figure 18. Anniston Chemical Activity Evacuation Result (Scen. 2: S Wind).................45 Figure 19. Anniston ERS Results, Scen. 2: for Hospitals (Left) and ER (Right) ............46 Figure 20. Blue Grass Chemical Activity Chemical Catastrophes ...................................48 Figure 21. Blue Grass Chemical Activity Evacuation Result (Scen. 1: S Wind)..............49 Figure 22. Blue Grass ERS Result, Scen. 1: Hospitals. ...................................................50 Figure 23. Blue Grass Chemical Activity Evacuation Result (Scen. 2: SE Wind) ...........51 Figure 24. Blue Grass ERS Result, Scen. 2: Hospitals (Left) and ER (Right).................52 Figure 25. Pueblo Chemical Depot Chemical Catastrophes .............................................55 Figure 26. Pueblo Chemical Depot Evacuation Result (Scen. 3: ENE Wind).................56 Figure 27. Pueblo ERS Result, Scen. 3: ER.....................................................................57 Figure 28. Umatilla Chemical Depot Chemical Catastrophes ..........................................60 Figure 29. Umatilla Chemical Depot Evacuation Result (Scen. 1: W Wind) ...................61 Figure 30. Umatilla ERS Result, Scen. 1: Hospitals (Left), ER (Right). .........................62 Figure 31. Umatilla Chemical Depot Evacuation Result (Scen. 2: SSW Wind)..............63 Figure 32. Umatilla ERS Result, Scenario 2: Hospitals....................................................65 Figure 33. Google Earth Arc-to-KML Example. ..............................................................78 Figure 34. VBA Code Converting Nodes into Google Earth KML Files. ........................79 Figure 35. VBA Code Converting Arcs into Google Earth KML Files............................80

x
THIS PAGE INTENTIONALLY LEFT BLANK

xi
LIST OF TABLES
Table 1. HPAC Weather Settings for Computational Tests...........................................21 Table 2. Road Traffic-Intensity Scale ............................................................................34 Table 3. Newport Chemical Depot Scenario Parameters...............................................35 Table 4. Newport Road Traffic (Scenario 1: SW wind, 10 mph) .................................37 Table 5. Newport Road Traffic (Scenario 2: S wind, 10 mph).....................................39 Table 6. Anniston Chemical Activity Scenario Parameters...........................................41 Table 7. Anniston Road Traffic (Scenario 1: N Wind, 9 mph).....................................43 Table 8. Anniston Road Traffic (Scenario 2: S Wind, 8 mph) .....................................46 Table 9. Blue Grass Chemical Activity Scenario Parameters........................................48 Table 10. Blue Grass Road Traffic (Scenario 1: S Wind, 11 mph) ................................50 Table 11. Blue Grass Road Traffic (Scenario 2: SE Wind, 11 mph)..............................52 Table 12. Pueblo Chemical Depot Scenario Parameters..................................................54 Table 13. Pueblo Road Traffic (Scenario 3: ENE Wind, 10 mph) ..................................56 Table 14. Deseret Chemical Depot Scenario Parameters. ...............................................59 Table 15. Umatilla Chemical Depot Scenario Parameters...............................................60 Table 16. Umatilla Road Traffic (Scenario 1: W Wind, 9 mph) ....................................62 Table 17. Umatilla Road Traffic (Scenario 2: SSW Wind, 9 mph) ................................64

xii
THIS PAGE INTENTIONALLY LEFT BLANK
xiii
ACKNOWLEDGMENTS
I would first like to thank Professor Kevin Wood for providing the necessary
guidance and insights through the development of this thesis. His expertise and
instruction in Operations Research have been instrumental in this effort. I also would
like to thank the Second Reader, LTC Lee Ewing for adding his insight. Thank you to
Professor Matt Carlyle for providing several useful pieces of VBA code that were a major
portion of the network formatting and processing. And special thanks goes to the Naval
Postgraduate School’s Operations Research and Mathematics faculty for all the effort and
instruction over the past two years, I have learned more than I could have imagined.
Most importantly, I must thank my wife Tracy for her enduring love and support
over the years - all of this would not be possible without her. I must also mention my two
wonderful daughters, Gabrielle and Victoria, who remind me each day that what we do is
so important - ensuring this country remains strong and free for the future.

xiv
THIS PAGE INTENTIONALLY LEFT BLANK

xv
EXECUTIVE SUMMARY
This thesis examines the effects to the functionality of local infrastructure in the
event of a major chemical-agent release from one of the remaining United States
Chemical Warfare Stockpiles and Facilities (CFs). A multi-infrastructure network
operations model (MINO) represents the interactions between the local population and
certain infrastructure, specifically, the road network and the emergency-response system
(ERS). For any catastrophe scenario, MINO highlights road segments that may become
overburdened by evacuees, and identifies areas with degraded access by emergency
responders and to hospitals.
Several steps are necessary to build and solve each instance of MINO. For each
CF, the first step builds an interconnected MINO network model that links the local
population and emergency-response systems through the local road network. U.S.
Census 2000 data provides population data by “block” (small census tract), and provides
road data. Emergency-response system data, which includes hospital facilities, fire
stations, Emergency Medical Services, and ambulance providers, is derived from a
database provided by the National Geospatial-Intelligence Agency (NGA).
A commercial dispersion model HPAC (Hazard Prediction and Assessment
Capability) defines a “chemical-agent-release scenario” based on several parameters,
including type of chemical agent, release point, wind speed and wind direction. The
scenario describes the area that is likely to be contaminated. (Two or three scenarios are
analyzed for each CF.) MINO then expands the contaminated region with a buffer zone,
to create an “evacuation area,” and assumes that (1) all people within the evacuation area
must evacuate, and (2) after evacuation, no emergency services may use any roads within
the evacuation area, nor may anybody seeking to reach a hospital use one of those roads.
Finally, MINO applies two models, an evacuation model and an emergency-response-
system (ERS) model, to analyze the effect that the estimated road restrictions have on
evacuation and emergency response.
The evacuation model assumes that each population group (population in a census
block) within the evacuation area will follow their shortest route to leave that area. The

xvi
model computes these routes with a standard shortest-path algorithm. (By computing
evacuation routes backwards, only a single shortest-path calculation is needed.) With
evacuation paths for each population group defined, traffic intensity on each road
segment in the evacuation area is computed, and heavily used roadways are highlighted.
The results also identify areas outside the evacuation area that will encounter the most
evacuees. This may be important for emergency planning of food, shelter, medical care,
etc.
The ERS model investigates how, after the catastrophe, unusable pieces of the
road network affect the response distances for emergency responders working in the
evacuation area, and distances required by the population to reach hospital facilities.
The model calculates ERS distances and “closest-hospital distances” for all population
groups, pre-release and post-release, within the evacuation area. The difference between
these two results is mapped graphically to highlight areas that may experience severely
degraded emergency services, or none at all.
Wind direction significantly affects results in the two or three scenarios analyzed
for each CF. Results for the Newport Chemical Depot, Indiana, show a robust road and
ERS network that provides multiple exit routes for evacuating traffic and redundant
coverage for emergence-response systems. Scenarios for the Anniston Chemical
Activity, Alabama, show larger impacts because of a larger local population. Except for
a few areas, changes in ERS distances are small in the Anniston scenarios, however.
The area surrounding the Blue Grass Chemical Activity, Kentucky is heavily
populated, but two scenarios, using seasonally prevailing winds, show no mass
evacuations because neither resulting evacuation area covers a major city. However, with
several road segments exhibiting high-intensity traffic, the evacuations are still
significant events. ERS distances also increase in many areas to the west of Blue Grass.
For the Pueblo Chemical Depot, Colorado, prevailing winds imply almost no impact to
the population and infrastructure modeled by the MINO. However, a worst-case
scenario, with wind blowing into the city of Pueblo, creates a mass evacuation, closes all
hospitals in the model area, and significantly increases emergency-response distances
southeast of the city.

xvii
Major differences appear in evacuation results for the two scenarios examined for
the Umatilla Chemical Depot, Oregon. Nearly 100,000 more people evacuate in one
scenario than the other. In the worst case, ERS capabilities are also heavily affected,
because a large number of evacuees become isolated from hospital facilities.
Because of the network’s design and implementation, software limitations did not
allow analysis of the region surrounding the Deseret Chemical Depot, Utah.
MINO should be useful for assessing and guiding improvements in existing
emergency-response plans near CFs. Its methods could also be applied to chemical,
biological, and nuclear disasters, and to certain natural disasters like floods.

xviii
THIS PAGE INTENTIONALLY LEFT BLANK
1
I. INTRODUCTION
A. OVERVIEW
This thesis investigates and models the effects of a malicious or accidental release
of a chemical agent upon infrastructure located at and near Chemical Warfare Stockpiles
and Facilities (CFs) in the United States. Research addresses cascading effects to select
infrastructure, specifically road networks, public-health systems, and emergency-
response systems. The ultimate purpose is to identify road segments that are critical for
effective evacuation of a contaminated or soon-to-be contaminated area, and how
emergency-response times may increase in the “safe area,” just outside the area to be
evacuated.
B. BACKGROUND AND MOTIVATION
This thesis is developed in cooperation with USNORTHCOM-NORAD/J2, Joint
Intelligence Operations Center North, in support of the defense of the Homeland. The
motivation comes from a need to identify infrastructure that is vulnerable to the
accidental or malicious release of a chemical-warfare agent from a CF, where these
agents are being stored and destroyed.
The U.S. no longer produces chemical agents, and has agreed to completely
destroy all chemical-weapons, chemical-agent inventories, and production facilities
(CMA 2007a). Two CFs have completed or nearly completed destruction of their agents,
and the other six have relatively firm “destruction schedules” in place. But, until all
agents are destroyed by 2023 (Eisler 2006), emergency-preparedness planners and
military agencies must continue to improve contingency plans for a catastrophic
chemical-agent release. This thesis will help identify and characterize certain related
infrastructure vulnerabilities to assist contingency planners.
In the event of a chemical-agent release, efficient evacuation of the contaminated
area will be a top priority for public safety. One model developed in this thesis, the

2
“evacuation model,” identifies road segments that may become over-capacitated during
an evacuation: this can alert officials to take appropriate traffic-control measures and plan
alternate routes around congested areas. Using an “emergency-response system model,”
this thesis also examines the effect of a chemical-agent release on emergency-response
systems by identifying areas that may suffer from degraded emergency-responder
services, and by identifying areas that may be isolated from hospitals or other emergency
care. Here “planners,” hereafter defined as emergency preparedness planners, military
contingency planners, local agency planners, etc., could consider alternate transportation
options or identify non-local emergency-response services to augment local ones.
C. METHODOLOGY
The thesis first characterizes the operational environment surrounding each CF of
interest, including the composition of its stockpile and the planned destruction schedule.
A summary of chemical-agent effects upon specific infrastructure systems includes a
description of the likely impact to those infrastructures. With a chemical-agent release
into the environment from a known CF—such a release is hereafter referred to as a
“chemical catastrophe”—analysis will examine the effects on a few of several possible
infrastructure systems.
Utilizing modeling and simulation to analyze the effects of chemical catastrophe
is not new. In fact, an existing dispersion model will be used in this thesis to estimate the
extent of the contamination area. Certain research in evacuation modeling for large
geographical areas suggests simulation as a method to analyze traffic flow (Li et al. 2006,
Han et al. 2006). Other literature suggests the use of optimization, networks, and
dynamic flows for analytical purposes (e.g., Mamda et al. 2004, Liu et al. 2005).
In Mamda, et al., they suggest shortest-path and quickest-path approaches using
multiple sinks, and they also describe a dynamic network model with a time element to
address traffic congestion. Although the time factor is beyond our scope, the discussion
of static networks using multiple sinks is useful. In the study of hurricane evacuation by
Liu, et al., optimization is used to identify traffic control plans, but then simulation is
used for the evacuation. However, Liu, et al., does discuss the critical issue of emergency
3
response team routing, but leaves it for further study. This thesis chooses a network-
optimization approach that uses shortest-path techniques to identify routes for evacuees,
emergency responders, and people trying to reach hospital facilities.
For each CF, a multi-infrastructure network-operations model, MINONET, is
constructed with several sets of infrastructure data, e.g., road data, population census
data, hospital locations. A chemical catastrophe at a CF is then posited, defined by
parameters for agent type, wind speed and direction. Standard chemical-agent-dispersal
software calculates agent dispersal based on those parameters, and a contaminated area is
calculated. An “evacuation area” is then defined, consisting of the contaminated area
plus a buffer zone around that area; all people must evacuate from the evacuation area,
and all vehicle traffic is forbidden in the area after evacuation. Two application models
are then built on top of MINONET to examine two “interdependent-infrastructure
contingency events”; population evacuation from the designated evacuation area, and the
effect on emergency-response systems (ERSs) after the evacuation. We refer to these
two “contingency-response models” as MINOEVAC and MINOERS, respectively. We use
“MINO” as a generic term to mean the application of MINOEVAC and/or MINOERS to
MINONET, along with ancillary computations to put data into the correct format for input,
output, and analysis purposes.
MINOEVAC uses shortest-path methods to estimate traffic intensity on the road
network resulting from the local population evacuating the evacuation area. Estimated
traffic intensity on each road segment points to segments that are critical for effective
evacuations. By identifying over-capacitated roadways, planners can adjust disaster
plans by considering alternate routes for evacuation and emergency services, allocation of
police for traffic control, and other measures. With the mapping of expected traffic
routes and population flow, MINOEVAC can also identify nearby regions that will need to
absorb large numbers of potentially contaminated evacuees. This information can be
used to make special planning arrangements for food, shelter, medical care, etc.
MINOERS uses a similar methodology to calculate the “shortest-response
distance” from each “population group” to the nearest hospital and the nearest emergency
responder. (Population groups, also used in evacuation modeling, aggregate the

4
population in a census tract into a single homogeneous group.) After the chemical
catastrophe, emergency responders and the local population are prohibited from using the
road network in the evacuation area for travel. MINOERS compares the response
distances for hospitals and emergency responders after the chemical catastrophe (with
travel prohibitions imposed) to the normal distances. This distribution of increased ERS
distances for each population group, when mapped geographically, highlights areas with
no nearby hospital facilities and emergency responders. Planners should consider
augmenting emergency services or dedicating transportation services to supplement the
remaining ERS capabilities, for any area with a significantly increased ERS distance.
Ultimately, planners can use these results to improve emergency courses of action and
emergency preparedness plans.
D. SCOPE, LIMITATIONS, AND ASSUMPTIONS
This thesis is not meant to be an authoritative source for understanding the basic
characteristics and effects of chemical agents. The cause of the chemical catastrophe is
not the focus of this thesis; the catastrophe is an assumed event. Given that the event
occurs under posited environmental conditions—these conditions define a “scenario”—
an existing model (DTRA 2004) identifies the dispersion plume for the catastrophic
chemical-agent release and determines “the contaminated area.” Only a few catastrophe-
scenarios are modeled for each CF analyzed, and actual incidents could vary significantly
from these scenarios.
The geographical area covered by each scenario is limited to keep the resulting
network model from exceeding the capabilities of analytical software, specifically
Microsoft Excel (Walkenbach 2004). The spreadsheet limitations of Excel, specifically,
the maximum number of rows and columns, are the primary factors constraining the size
of network analyzed. In fact, because of these limitations, of the six CFs for which
analysis would be useful, only five are analyzed in this thesis. The road network
surrounding one CF is simply too complex for the current software implementation to
handle.

5
E. THESIS ORGANIZATION
Chapter II begins with a short primer on chemical agents stored at CFs in the
United States. The chapter continues with an operational environment assessment for
each CF, and then discusses general effects chemical agents could have on exposed
infrastructure systems. Chapter II ends with a description of the software used for
calculating the contaminated areas for the various chemical-catastrophe scenarios.
Chapter III describes the methods used for analyzing effects on local
infrastructure. First, the multi-infrastructure network-operations model (MINONET) is
developed. Next, the thesis describes the construction of hypothetical chemical-
catastrophe scenarios. The rest of Chapter III develops MINO further, and describes the
two contingency-response models, MINOEVAC and MINOERS built on top of MINONET.
Chapter IV applies the MINOEVAC and MINOERS to each CF, for two or three scenarios,
and describes results. Chapter V summarizes the thesis, points out key insights gained
and recommends areas for future work.

6
THIS PAGE INTENTIONALLY LEFT BLANK

7
II. OPERATIONAL-ENVIRONMENT ASSESSMENT
This chapter briefly describes the chemical agents previously produced and now
stored by the United States, for different types of weapons. (More detail can be found in
Army Field Manual 3-9, Potential Military Chemical/Biological Agents and Compounds;
see Department of the Army 1990.). Subsequently, a detailed operational-environment
assessment for each CF describes its chemical-agent inventory and destruction plans.
Finally, the chapter describes the likely effects of chemical agents on the infrastructure
systems of interest in this thesis.
A. U.S. CHEMICAL AGENTS
The majority of U.S. chemical-weapon agents are of two basic types, nerve agents
and blister agents. These agents may exist as solids, liquids, or gases, depending on how
they were produced and how they are stored. Chemical agents are designed to kill,
seriously injure, or incapacitate people. The effects on infrastructure systems such as
roads and buildings are not well known, but chemical agents can persist and remain lethal
within those systems for up to 16 weeks (DTRA 2001).
1. Agent Persistence
Determining the length of time that an agent retains lethality, i.e., its
“persistence,” is important for any operations or activity in and around a contaminated
area. Several factors influence the persistence of chemical agents, including the type of
agent, the agent’s volatility, and local weather, and terrain. In general, nerve agents and
blister agents are the least volatile and the most persistent of chemical agents. The
United States maintains no inventories of other agents, such as blood and choking agents.
Weather can affect an agent in several ways. Wind can disperse an agent rapidly
in open country so that its concentration becomes non-lethal; however, the contaminated
may also increase in size with wind dispersion, and an agent may be blown into terrain
and vegetation that can increase its persistence. High temperatures decrease, and low

8
temperatures increase, persistence (DTRA 2001). Rain disposes, dilutes and promotes
hydrolysis of an agent and thus reduces an agent’s lethality. However, rain does not
neutralize any agents (DTRA 2001).
The terrain and vegetation in an affected area also play a key role in determining
persistence. Chemical agents tend to flow over rolling terrain and follow the contours of
the earth’s surface, with the heavier concentrations remaining close to the ground. Areas
of heavy vegetation reduce wind speed and sunlight, thereby increasing persistence
(DTRA 2001).
Importantly, the nerve agents and blister agents stored in U.S. CFs are highly
persistent. Following a chemical catastrophe with one of these agents, persistence will
most affect first responders and clean-up efforts. While persistence must be understood
and considered for any chemical-agent release, this thesis assumes that the agent involved
in any catastrophe will persist for the duration of analysis. Furthermore, since the
analysis covers a short period of time following a catastrophe, it assumes that the size and
shape of the contaminated area stays constant.
2. Nerve Agents
Nerve agents cause several violent physiological actions. When inhaled, ingested,
or absorbed into the body through the skin or mucous membranes, these agents inhibit
enzymes throughout the body, disturbing nerve-signal transmission. Major effects may
include: muscle stimulation with uncontrolled contractions followed by fatigue and
usually paralysis, tightness in the chest, vomiting and diarrhea, secretions from air
passageways, and convulsions or disturbances in the brain leading to death (Department
of the Army 1990). The two main nerve agents used in U.S. chemical weapons are the
G-agent GB, and the V-agent VX. These nerve agents all exist normally as viscous
liquids. G-agents are more volatile, persisting only up to two days, whereas V-agents can
persist as long as 16 weeks (DTRA 2001).
GB is a colorless, odorless liquid. The initial vapor threat from GB exposure is
the greatest threat. The volatility of GB is an important physical factor as small droplets
sprayed from a plane or released from an exploding shell may vaporize and never hit the

9
ground (Department of the Army 1990). While GB vapor is lethal, it is less persistent
than its liquid form, and does not condense on surfaces to become a contact threat. G-
agents like GB do not persist for long periods as they decompose either naturally or with
chemical neutralization techniques. GB does mix with water easily, can contaminate
water sources and can be spread through those sources. However, contamination of
water sources does not come into play in this thesis.
V-agents have low volatility and thus high persistence. VX is an oily, odorless
liquid that does not vaporize easily, so it is mainly a liquid contact threat. Exposure can
take place when a droplet of spray contacts a person’s clothing or skin, or when a person
touches a contaminated surface. VX does not spread easily on surfaces and does not mix
well with water. VX by inhalation is approximately twice as toxic as GB by inhalation,
but is up to 100 times more toxic through contact (Department of the Army 1990).
3. Blister Agents
Blister agents, also known as vesicants, are easily absorbed by the human body.
These agents cause inflammation, blisters, and general destruction of moist tissues,
especially eyes, mucous membranes, and the respiratory tract (Department of the Army
1990). All blister agents are strongly persistent, surviving up to eight weeks. They are
normally employed as colorless gases and liquids (DTRA 2001). U.S. blister agents are
of the mustard form, primarily Levinstein Mustard (H), Distilled Mustard (HD), and
Mustard-T Mixture (HT).
B. U.S. CHEMICAL WARFARE STOCKPILE
CFs at eight Continental United States (CONUS) locations and one overseas
location have stored and maintained the inventory of U.S. chemical weapons. These
locations are depicted in Figure 1.

10
Figure 1. U.S. Chemical Warfare Stockpile Locations (Source: CMA 2007)
On 29 April 1997, the United States agreed to the Chemical Weapons Convention
and, in agreement with this convention, began the process of destroying all the chemical-
weapons, chemical-agent inventories, and production facilities (CMA 2007a). By
December 2000, all the chemical weapons on the Johnston Atoll had been destroyed
(CMA 2007a). In March 2006, the first U.S. CF, at the Edgewood Area of Aberdeen
Proving Grounds in Maryland, completed destruction of its chemical-agent stockpile,
which consisted of mustard agents (CMA 2007a). As of May 2007, with Johnson Atoll
and Edgewood destruction complete and other efforts underway, more than 44 percent of
the entire U.S. chemical-weapons stockpile had been destroyed (CMA 2007a).
Because agent destruction is nearing completion at the Pine Bluff Chemical
Activity in Arkansas, that CF will only receive an operational summary in this thesis.
The remaining six CFs comprise candidates for analysis. The following operational-
environment assessment for the seven CFs outlines the composition of their chemical-
agent stockpiles and provides other background information.

11
1. Pine Bluff Chemical Activity, Pine Bluff, Arkansas
The Pine Bluff Arsenal (PBA) began storing chemical weapons in 1945. Pine
Bluff Chemical Activity, part of the PBA, is located north of Pine Bluff, Arkansas on the
Arkansas River; see Figure 2. Little Rock, Arkansas lies 30 miles north of the PBA. The
chemical weapons stored at Pine Bluff Chemical Activity consist of various munitions
and one-ton containers containing GB or VX nerve agents, or HD blister agent (U.S.
Army 2007c). Disposal of these agents began in 2005 and, as of 19 May 2007, all 90,409
GB nerve-agent rockets had been destroyed. Destruction of VX rockets is scheduled to
begin in late 2007 (CMA 2007e). To date, 12 percent of the stockpile at Pine Bluff has
been destroyed and the remaining stockpile should be destroyed by late 2008
(Department of the Army 2006).
Figure 2. Pine Bluff Arsenal, Arkansas (Source: Google Maps 2007).
2. Newport Chemical Depot, Newport, Indiana
The Newport Chemical Depot, lies southwest of Newport, Indiana, on the west-
central border of Indiana, about 60 miles west of Indianapolis; see Figure 3. This CF

12
opened in 1941 and produced various warfare materials, including chemical agents,
through the late 1960s. Since that time, it has stored the liquid chemical agent VX in
large steel containers. Agent-destruction operations began in 2005 and, as of 15 May
2007, workers had destroyed approximately 156,126 gallons of liquid VX, amounting to
about 52 percent of the original agent stockpile (CMA 2007d).
Figure 3. Newport Chemical Depot, Indiana (Source: Google Maps 2007).
3. Anniston Chemical Activity, Anniston, Alabama
The Anniston Army Depot, located west of Anniston, Alabama, was established
in 1941; see Figure 4. Beginning in the 1960s, the Anniston Chemical Activity began
maintenance and storage of chemical weapons at the Depot. The Anniston Chemical
Activity has stored various munitions and chemical agents containing GB or VX nerve
agents or HD blister agent (U.S. Army 2007a).
The Anniston Chemical Agent Disposal Facility began construction in 2001, and
began destroying chemical weapons in 2003. By March 2006, 142,428 GB munitions
and 96,246 gallons of GB nerve agent had been destroyed; no GB agent remains (CMA

13
2007c). After completing the destruction of GB agent, destruction of VX-filled rockets
began. As of March 2007, all 35,662 VX-filled rockets and 41,056 gallons of VX had
been destroyed (CMA 2007c). Destruction operations will next process VX-filled
artillery shells. Overall, 27 percent of the chemical weapons stockpile at Anniston
Chemical Activity had been destroyed as of May 2007 (U.S. Army 2007a). The projected
date to complete all operations is early 2012 (Department of the Army 2006).
Figure 4. Anniston Army Depot, Alabama (Source: Google Maps 2007).
4. Blue Grass Chemical Activity, Richmond, Kentucky
The Blue Grass Army Depot, located near Richmond, Kentucky, houses the Blue
Grass Chemical Activity; see Figure 5. The Army has stored chemical weapons at this
facility since 1944. Located to the southwest of Richmond and 20 miles south of
Lexington, Kentucky, the Blue Grass Chemical Activity currently stores 523 tons of
chemical agents: blister agent in projectiles and nerve agents in projectiles and rockets
(Blue Grass Chemical Stockpile Outreach Office 2006). In 2003, a contract was awarded
14
to design, construct, and operate a facility to destroy the stockpile at Blue Grass. As of
May 2007, destruction of chemical agents has not yet begun.
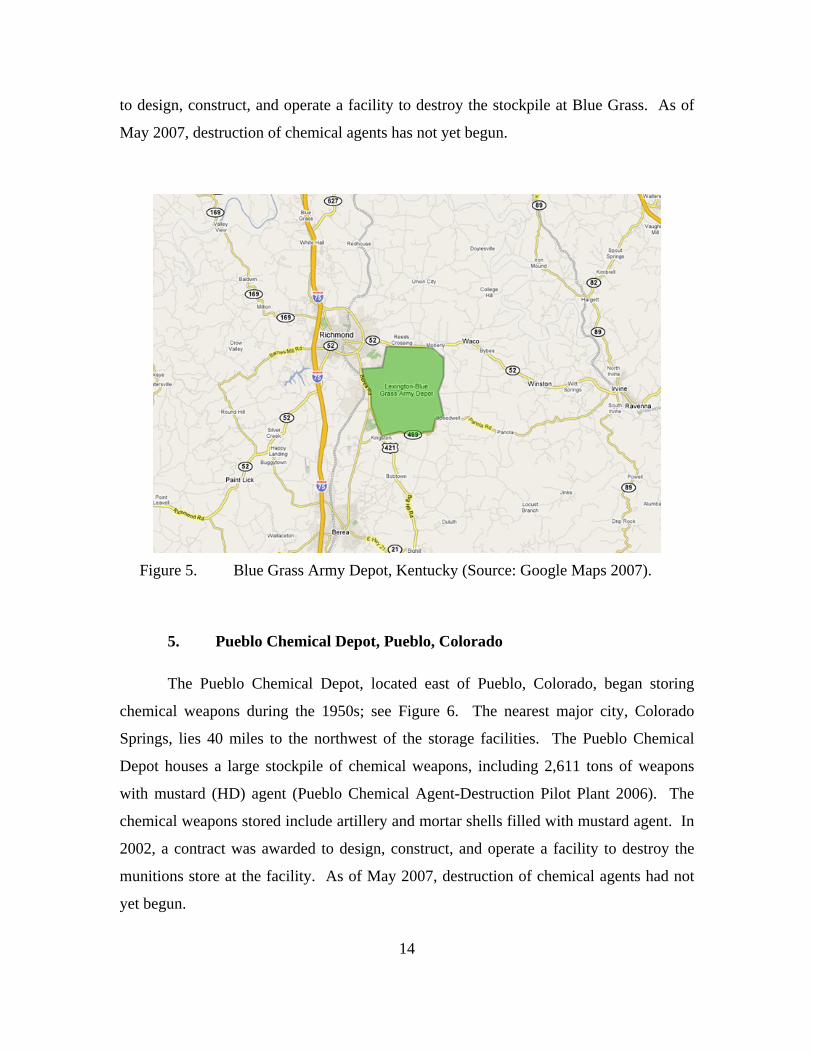
Figure 5. Blue Grass Army Depot, Kentucky (Source: Google Maps 2007).
5. Pueblo Chemical Depot, Pueblo, Colorado
The Pueblo Chemical Depot, located east of Pueblo, Colorado, began storing
chemical weapons during the 1950s; see Figure 6. The nearest major city, Colorado
Springs, lies 40 miles to the northwest of the storage facilities. The Pueblo Chemical
Depot houses a large stockpile of chemical weapons, including 2,611 tons of weapons
with mustard (HD) agent (Pueblo Chemical Agent-Destruction Pilot Plant 2006). The
chemical weapons stored include artillery and mortar shells filled with mustard agent. In
2002, a contract was awarded to design, construct, and operate a facility to destroy the
munitions store at the facility. As of May 2007, destruction of chemical agents had not
yet begun.
15
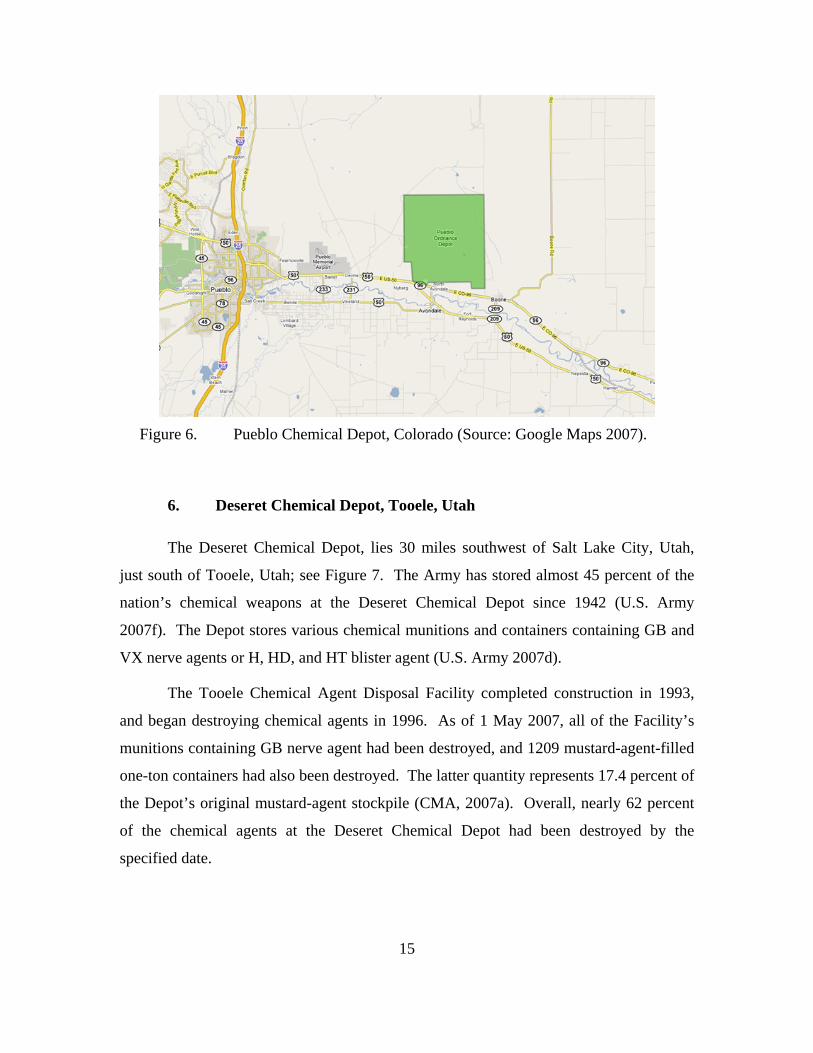
Figure 6. Pueblo Chemical Depot, Colorado (Source: Google Maps 2007).
6. Deseret Chemical Depot, Tooele, Utah
The Deseret Chemical Depot, lies 30 miles southwest of Salt Lake City, Utah,
just south of Tooele, Utah; see Figure 7. The Army has stored almost 45 percent of the
nation’s chemical weapons at the Deseret Chemical Depot since 1942 (U.S. Army
2007f). The Depot stores various chemical munitions and containers containing GB and
VX nerve agents or H, HD, and HT blister agent (U.S. Army 2007d).
The Tooele Chemical Agent Disposal Facility completed construction in 1993,
and began destroying chemical agents in 1996. As of 1 May 2007, all of the Facility’s
munitions containing GB nerve agent had been destroyed, and 1209 mustard-agent-filled
one-ton containers had also been destroyed. The latter quantity represents 17.4 percent of
the Depot’s original mustard-agent stockpile (CMA, 2007a). Overall, nearly 62 percent
of the chemical agents at the Deseret Chemical Depot had been destroyed by the
specified date.

16
Figure 7. Tooele Army Depot, Utah (Source: Google Maps 2007).
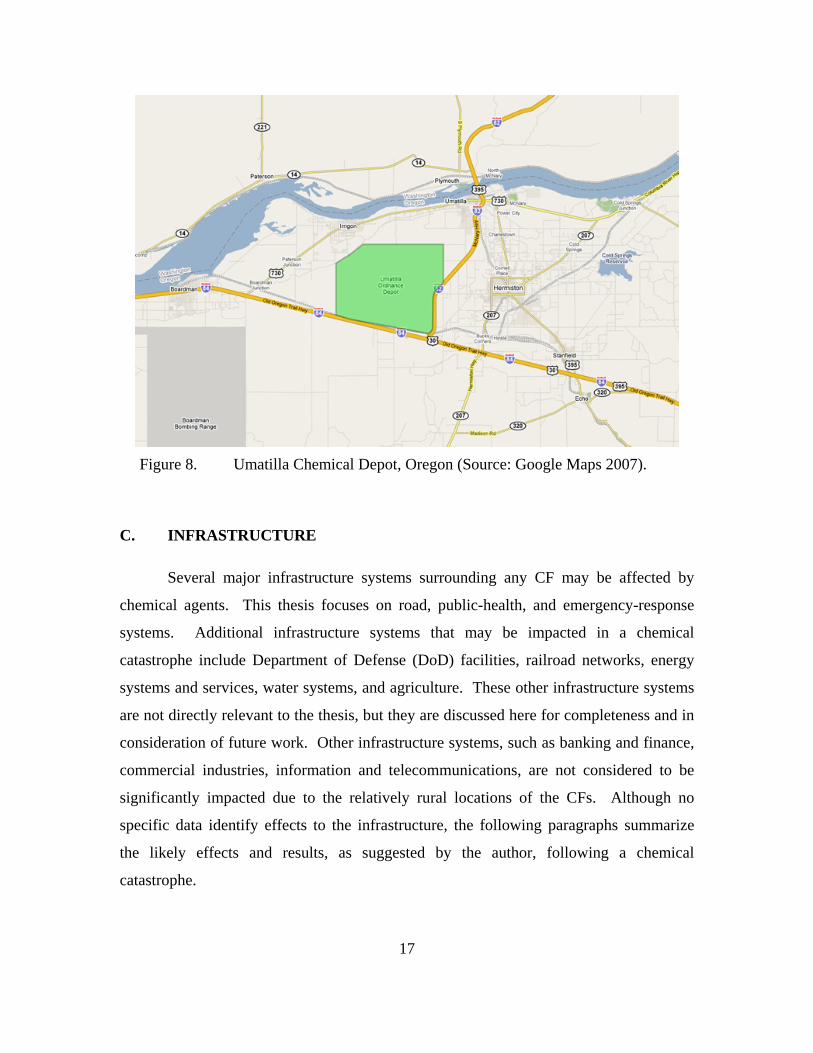
7. Umatilla Chemical Depot, Umatilla, Oregon
The Umatilla Chemical Depot lies six miles southwest of Umatilla, Oregon, and
west of the larger city of Hermiston; see Figure 8. On the north-central border of Oregon
with Washington, the Depot is situated near the Columbia River and about 25 miles
southwest of Kennewick, Washington. The Umatilla Chemical Depot opened in 1941
and began storing chemical weapons in 1962. The Depot stores various munitions and
containers containing GB or VX nerve agents or HD blister agent.
The Umatilla Chemical Agent Disposal Facility completed construction in 2001
and began destroying chemical weapons in 2004. As of 17 May 2007, the facility had
destroyed 139,393 chemical munitions and 962 tons of GB chemical agent, totaling
nearly 26 percent of all the chemical agents at the Depot (CMA, 2007f). The projected
date to complete all operations is early 2011 (Department of the Army 2006).
17
Figure 8. Umatilla Chemical Depot, Oregon (Source: Google Maps 2007).
C. INFRASTRUCTURE
Several major infrastructure systems surrounding any CF may be affected by
chemical agents. This thesis focuses on road, public-health, and emergency-response
systems. Additional infrastructure systems that may be impacted in a chemical
catastrophe include Department of Defense (DoD) facilities, railroad networks, energy
systems and services, water systems, and agriculture. These other infrastructure systems
are not directly relevant to the thesis, but they are discussed here for completeness and in
consideration of future work. Other infrastructure systems, such as banking and finance,
commercial industries, information and telecommunications, are not considered to be
significantly impacted due to the relatively rural locations of the CFs. Although no
specific data identify effects to the infrastructure, the following paragraphs summarize
the likely effects and results, as suggested by the author, following a chemical
catastrophe.

18
1. Road Network
A large portion of the road network near a CF, including major traffic arteries, can
become unusable in the event of a chemical catastrophe. The loss of these roads can
impact all of the other infrastructure systems because those systems, or key parts of them,
may become inaccessible. For example, cellular telephone towers and electric power
substations might need repair, but become inaccessible and remain out of service. Except
for population evacuation, roads will be unusable until they have been decontaminated,
either through natural degradation or through active neutralization by clean-up crews.
Until roads are clear for use, transportation and emergency services will have to reroute
around the contaminated area, and certain services may not have access to isolated areas.
For example, ambulances may be unable to reach injured persons because certain roads
are unusable.
2. Public Health
Protecting the local population from chemical agents is a significant issue for any
CF. In the event of a chemical catastrophe, local residents may be exposed, injured, and
even killed. The ability to evacuate and treat the public surrounding a CF must be
considered. Health services will degrade or even close down if healthcare facilities and
emergency-responders fall within the contamination area and can no longer operate.
Additionally, treating the population for normal health issues will become more
complicated for a degraded emergency-response system.
3. Emergency-Response Systems
Local emergency-response systems, which include first-response capabilities and
treatment facilities, may be lost or incapacitated during a chemical-catastrophe event.
First responders, such as firefighters, ambulances, and police will be constrained by the
contaminated area and may not be able to reach key population centers and casualties. If
local services are blocked from reaching casualty areas, outside agencies will need to
19
respond or alternate access methods will be required, e.g., helicopter or watercraft. These
emergency-response systems will be modeled in this thesis to determine vulnerable
population areas.
4. Department of Defense (DoD) Facilities
Because each CF is located on a military installation, a chemical catastrophe will
impact all operations at the installation. Each installation has plans to respond to such an
event. Most CF installations have few tenant operations, so the impact to other military
functions will be limited.
5. Railroad Network
All of the CFs have railroads lines located nearby. A contaminated railroad line
will not be usable until decontamination is verified. By examining railroad maps near
CFs, it appears that the impact to rail transportation scheduled to transit a potentially
affected area will be minimal, as most rail traffic can be rerouted around the area.
Increases to time and fuel will not be significant because of the small increase in overall
route lengths. However, deliveries to the area near the CF will be completely stopped if
rail yard facilities are contaminated.
6. Energy Systems and Services
Chemical agents should not have a direct impact on energy-supply systems such
as generation facilities, gas and oil pipelines, and power lines. However, personnel
required to run, maintain, and repair systems may not be able to reach contaminated
systems due to road-network contamination.
7. Water Systems
Local water systems directly contaminated by chemical agents will be a major
concern in a chemical catastrophe. Although water promotes hydrolysis of agents which

20
reduces their effectiveness, it does not neutralize them, so contaminated water will be
unusable (DTRA 2001). Contaminated water will also be hazardous to wildlife and
agricultural areas.
8. Agriculture
Chemical agents will affect livestock and crops in the contaminated area.
Animals will experience the same effects as humans and will suffer casualties. In fact,
animal casualties may help map the extent of the chemical-agent contamination.
Agricultural crops, like all vegetation, will absorb chemical agents and increase agent
persistence.
D. CHEMICAL CATASTROPHE
How each infrastructure system is impacted will be a function of the chemical
catastrophe, more specifically, its parameters: the agent involved, quantity of agent
released, weather conditions, etc. The specific details of how and why a chemical
catastrophe occurs are beyond the scope of this thesis; the thesis simply assumes that a
chemical catastrophe, with hypothetical parameters selected, has taken place at a specific
CF. The geographical extent of the catastrophe is computed for the set of parameters
using a well-established dispersion model implemented in the HPAC software (DTRA
2004). MINO then determines which infrastructure components and systems are
affected.
The Defense Threat Reduction Agency (DTRA) uses the Hazard Prediction and
Assessment Capability (HPAC) software for predicting chemical dispersion. This thesis
generates the chemical-catastrophe scenarios with it, for analysis. HPAC predicts the
effects of hazardous-material releases into the atmosphere and collateral effects on
civilian and military populations (DTRA 2007). Appendix A describes the HPAC model.
Results from HPAC depend on user-specified weather conditions and, in turn,
those significantly impact results from MINO. Other than wind, the weather settings
displayed in Table 1 are used in HPAC for all computational tests for all CFs. The
primary wind directions and speeds for each CF scenario come from historical climatic

21
wind data from a 66-year period from 1930-1996, published by the National Climatic
Data Center, National Oceanic and Atmospheric Administration (NOAA) (NOAA NCDC
1996). In addition to these base cases with historical prevailing wind directions, other
HPAC runs with different wind directions will be run to examine other, perhaps more
devastating scenarios.
Weather Parameter HPAC Setting (Fixed) Other Possible Settings Cloud Cover Broken Clear, Scattered, Overcast Surface Moisture Normal Dry, Wet Precipitation None (0.00 mm/hr) From Light Rain to Heavy Snow
Table 1. HPAC Weather Settings for Computational Tests

22
THIS PAGE INTENTIONALLY LEFT BLANK

23
III. MODEL DEVELOPMENT
Following a catastrophe, a cascade of events will take place, some planned and
others not. In the case of a wide-spread chemical-agent release, a large portion of the
local population will evacuate. In fact, authorities will require at least part of that
evacuation. With a large-scale evacuation, certain segments of the road network may
experience high traffic volumes, which will slow the evacuation and increase exposure
risk to evacuees. The first contingency-response model described in this chapter
examines this problem and helps identify the likely routes and traffic intensities for
evacuation planning.
The emergency-response system should also expect a spike in activity. Not only
will people need treatment for chemical-agent exposure, but an evacuation, potential
wide-spread panic, and a heavily loaded road system will all degrade the emergency-
response system’s performance. The second contingency-response model described in
this chapter captures part of this problem by determining how emergency-response
distances change across the study because of unusable roads and ERS locations.
A. POPULATION, ROAD, EMERGENCY REPONSE SYSTEM MODEL
For this thesis, the infrastructure network MINOG represents an interconnected
network of roads, population, and emergency services. This undirected network,
( , )MINOG N A= , is defined by:
Nodes N with subsets PN representing population aggregations, EN representing locations for emergency-response units, RN representing road intersections, ( )R P EN N N N= − − , and Arcs A with subsets PRA representing connections of population nodes to road intersections
( )PR P RA N N⊆ × , RRA representing actual road segments between intersections, ( )RR R RA N N⊆ ×

24
ERA representing connections of emergency-response units to road intersections
( )ER E RA N N⊆ × , and
Numerical data to be described later.
Constructing MINOG requires accurate critical-infrastructure (CI) data. The CI
data is extracted from various unclassified datasets and then merged, using a common
reference system: MINO uses latitude and longitude coordinates. The construction
process first defines the road-network infrastructure and then integrates the emergency-
response infrastructure, which includes the hospitals and first responders. Population
groups must also be represented and connected to the road network. The following
sections outline this process; appendix B contains more detail.
Road and population data are taken from the 2000 Census TIGER database
(Topologically Integrated Geographic Encoding and Referencing database) available to
the public (ESRI 2007). Each road segment from the database, for the study area, will
correspond to an arc in RRA . The union of arc endpoints over all arcs in RRA forms the
set of nodes RN . The database contains much additional data, but the only additional
data extracted are arc lengths, road names, and road types.
Next, the human population is modeled and connected to the road network. From
the TIGER database, census population data is provided for small geographical areas,
referred to as “blocks.” A population node Pi N∈ will represent each census block
population as a point geographically centered in the census block. Some blocks contain
no population and nodes are not created for these; population nodes containing five or
fewer people are paired with neighboring, larger population nodes for simplicity.
The final set of population nodes is then connected to the road network. For each
node Ri N∈ , a search procedure finds the two closest road nodes 1 2( ), ( ) Rj i j i N∈ , and
arcs 1( , ( ))i j i and 1( , ( ))i j i are created. The union of all such arcs is PRA . To ensure these
artificial arcs are not used for transit, other than to get the population onto the road
network or to allow emergency responders to reach the population, a large cost or length

25
C is assigned to each. That is, for all ( , ) PRijc C i j A= ∈ . The full set of these arcs is
defined by { }1 2( , ( )), ( , ( ))P
PR
i NA i j i i j i
∈= ∪ .
The ERS infrastructure data is provided by NGA from the Homeland Security
Infrastructure Program database (“HSIP”; see NGA 2007). From the ERS data, we select
locations for two different ERS categories from each CF area. The emergency-responder
(ER) category includes Emergency Medical Services (EMS), fire stations, and ambulance
providers. The other category, referred to as “hospitals” here, actually includes hospitals
and ambulatory surgical facilities. As with population nodes, we attach each ERS node
to the road network by two arcs; the collection of all such arcs is ERA . Each arc
( , ) ERi j A∈ has its true length assigned as its modeled length, i jc .
MINOG contains all nodes, arcs and numerical data required for modeling the
evacuations and emergency-response problems. Figure 9 displays a geographic map of MINOG extracted from a section of the city of Pueblo, Colorado.
Figure 9. Example of MINOG Extracted from Pueblo, Colorado. House icons denote population nodes. The blue lines, or lines connecting the house icons, are the artificial arcs connecting the population nodes to road nodes, and correspond to the arc set PRA . The red “+” icon depicts the sole emergency-response node from EN in this small region; it is connected to the road network by two arcs from ERA . The remaining lines (black in a color reproduction) represent the road arcs contained in the set RRA .
26
B. CATASTROPHE SCENARIOS
With a complete infrastructure network, an abstract model for a chemical
catastrophe is necessary to develop the scenario. A scenario, s , and the application
model being applied, simply alter the components in, and data associated with, MINOG .
For each CF, a chemical-catastrophe scenario is run in HPAC based on the
chemical agent in inventory, plus weather, terrain, and other factors. Different sets of
scenario parameters will cover most likely incidents, and some cover what the author
believes may be nearly worst-case incidents. For instance, a scenario using a prevailing
wind direction may correspond to a “likely” incident with contamination being spread
into lightly populated areas, but if the wind shifts 180 degrees, a heavily populated area
could be contaminated in a worst-case incident. Based on the scenario, an area
surrounding the chemical facility is identified as the contamination area and effects will
be assigned to critical infrastructure in that area and a surrounding buffer zone.
HPAC utilizes plume and chemical-agent dispersal calculations to determine the
contamination area. HPAC takes the incident and release information (the combination
of “where, what, and when” parameters and the specified environmental data), and
predicts where the chemical-agent material will move through the atmosphere, and
calculates its deposition on surfaces (DTRA 2004). HPAC’s atmospheric transport model
is called SCIPUFF. It is a Lagrangian, Gaussian puff model that relates dispersion rates to
measurable turbulent velocity statistics. Further detail about SCIPUFF can be found in
the HPAC 4.04 Users Manual (DTRA 2004).
HPAC typically generates a roughly elliptical contamination area, referred to
hereafter as the “contamination area.” Figure 10 shows actual HPAC results for a
scenario at the Umatilla Chemical Depot. An ellipse approximates this contamination
area, called the “contamination ellipse.” Any person remaining in the contamination
ellipse is likely to become sick and even die. Since the actual extent of chemical-agent
contamination cannot be mapped precisely, a buffer zone is added to the model’s
contamination ellipse. This buffer zone may be viewed as representing uncertainty in
prediction, and (a) the fact that the local populace, fearing for its lives, is likely to

27
evacuate a large area surrounding the truly contaminated area, and (b) the fact that
authorities will naturally build a buffer zone into their evacuation orders. The area
defined by the contamination ellipse and added buffer is referred to as the “evacuation
ellipse” or “evacuation area.” All models assume that the local population must be
evacuated from anywhere inside the evacuation area. Individual models will identify
nodes within the defined evacuation area to assign appropriate penalties.
Figure 10. Example HPAC Chemical Catastrophe Result. This figure shows the contamination area identified by HPAC for a hypothetical scenario at the Umatilla Chemical Depot. The Depot is denoted by a yellow triangle and colored ellipse-like areas represent different casualty levels in HPAC. The contamination area equates to the area within the outer-most blue solid line and is called the “Casualty Possible” area by HPAC (DTRA 2004).
C. MULTI-INFRASTRUCTURE NETWORK OPERATIONS MODEL
With the aforementioned datasets integrated into MINONET, the effects to specific
infrastructures will be determined. MINONET is parameterized for analysis after running
the HPAC scenario for a particular scenario. With a parameterized MINONET, a shortest-
path algorithm is solved for different contingencies, either population evacuation or

28
emergency response. Each model is built in Microsoft Excel 2003 and processed using
Visual Basic for Applications (VBA) algorithms. The VBA shortest-path algorithms
solve quickly, in less than a minute.
1. Creating the Evacuation Ellipse and Parameterizing MINONET
After running HPAC for a given scenario, the plotted contamination area is
exported for approximation as a contamination ellipse. The ellipse approximation
simplifies the construction of the larger evacuation ellipse, which is used in evacuation
and emergency-response system models.
To generate the contamination ellipse equation, we first plot the contamination
area and define the two extreme ends of that elongated area as the end points for the
semimajor axis. The area center ( , )c cx y is calculated by averaging the two end points.
The angle of rotation ϕ is also computed from the chord connecting the two end points.
This center point is used to translate the contamination area and the angle ϕ is used to
rotate the area on axis. With the area centered at the origin, the ellipse’s semimajor and
semiminor axes are then measured; their lengths are denoted a and b , respectively. The
center point ( , )c cx y and angle ϕ are recorded for use in the search functions.
Next, the contamination ellipse is expanded into the evacuation ellipse based on
two user-specified parameters. The “width-expansion parameter,” EFw , increases the
width of the semiminor axis by its value. The thesis arbitrarily uses 4EFw = throughout;
other users of MINO will want to explore different values. The “range-expansion
factor,” EFr , increases the length of the semimajor axis; tests in this thesis set 1.1EFr = .
This small value is used primarily to limit the size of MINONET. (Larger increases to EFr
may expand this network model beyond current software limitations.) The evacuation
ellipse, translated and rotated, is thus defined by
2 2
2 2All coordinates ( , ) such that 1( ) ( )EF EF
x yx yr a w b
+ ≤ .
In terms of the original coordinate system then, the evacuation ellipse is defined by:

29
All coordinates ( , )x y such that
2 2
2 2
[( ) cos ( )sin ] [( )cos ( )sin ] 1( ) ( )
c c c c
EF EF
x x y y y y x xr a w bϕ ϕ ϕ ϕ− + − − − −
+ ≤ .
MINOEVAC only marks population groups within the evacuation ellipse, whereas
MINOERS marks all population groups and ERS locations, and assigns penalties to road
arcs within the evacuation ellipse. For population and ERS nodes, a simple binary value
indicates if the node is inside the evacuation ellipse or not. For road arcs in MINOERS, a
search function looks at both nodes associated with the arc. If either is within the
evacuation ellipse, the road is considered unusable and the penalty C is added.
Specifically, for each ( , ) RRi j A∈ , if either i or j is within the evacuation area, then the
nominal length of the arc, which is ijc , becomes ijc C+ .
After integrating the chemical-catastrophe data into MINONET, that infrastructure
model is applied to the evacuation model MINOEVAC, and the emergency-response model
MINOERS. The next two sections describe this process.
2. The Evacuation Model
After a chemical catastrophe, all population within the evacuation ellipse will
depart for safety, or at least attempt to depart. MINOEVAC models this situation with
( , )EVAC P R PR RRG N N A A= ∪ ∪ . Also, the set of population nodes, PN , is divided into
two sets: the set of “unsafe” nodes that are inside the evacuation ellipse and must be
evacuated and those which are deemed “safe” and do not require evacuation.
In MINOEVAC, all pn persons in each population group p within the evacuation
area, are assumed to evacuate that area by following the same shortest route to the closest
safe node. By solving a single shortest-path problem as described below, it is possible to
identify the evacuation paths psQ which each population group p will use in scenario s .
The traffic intensity rsv , for each road segment r in scenario s , is computed as
| ps
rs pp r Q
v n∈
= ∑ .

30
It would seem necessary to solve a shortest-path problem for each population
group p within the evacuation ellipse. This can be avoided, however, by solving a
“reverse shortest-path problem” with unsafe nodes as sinks, and safe nodes as sources. A
single shortest-path calculation then identifies the shortest route for each population
group, corresponding to a single node, to reach its nearest exit from the evacuation
ellipse. It is assumed that all persons within a population group follow the same shortest
path, and thus it is easy to compute the number of persons traversing a given roadway.
A label-correcting algorithm, implemented with a deque (double-ended queue),
solves the shortest-path problem (Ahuju, Magnanti and Orlin 1993, p. 143). The
algorithm is modified to handle multiple sources by setting the distance label for each
source node to 0, and placing each such node on the deque before beginning distance
updates for the rest of the nodes. It is then a simple matter to use the optimal predecessor
function, along with population values, to compute traffic intensities rsv .
The evacuation model estimates traffic intensities for road segments used to
evacuate the evacuation area. Identifying the most used paths, i.e., those paths with the
greatest amount of population movement, will help provide insight into which roads will
be heavily used and potentially cause traffic problems during the evacuation. Results will
also show which safe areas will need to absorb the largest numbers of evacuees.
3. The Emergency-Response System Model
We create two variants of the ERS model, MINOERS. The first, MINOERS1 helps
identify where the local population may have difficulty in reaching a hospital facility
after the chemical catastrophe. The second, MINOERS2, determines if safe population
nodes can be reached by emergency responders. In both variants, the model identifies
isolated population nodes that might require access by means of alternate transportation
(e.g., helicopter) or by non-local emergency-response units. Both variants also identify
travel-distance increases between population groups and respective emergency services.
By mapping population nodes with significantly increased distances, emergency-response
planners can identify vulnerable areas.

31
MINOERS uses RESPG to represents the post-catastrophe network for evaluating
changes in emergency response. This graph is defined by
( , )
whereAll nodes outside the evacuation ellipse, and
All nodes outside the evacuation ellipse
SAFE SAFE
SAFE
SAFE
RESPR P E
PP
EE
G N N N A
N i N
N i N
= ∪ ∪
= ∈
= ∈
Prior to the parameterization of MINONET, using the basic MINOG , one shortest-
path solution from MINOERS1 identifies baseline shortest paths from each population
node to the closest hospital facility. Another solution, from MINOERS2, identifies the
baseline shortest paths from each population node to the nearest emergency responder.
The baseline shortest-path distances for each population group p are denoted 0Hpd and
0Epd for hospital and emergency responders, respectively. After the baseline distances are
calculated, each road arc within the evacuation area is assigned a penalty to inhibit travel
through the evacuation area, as described earlier. The model next recalculates shortest
paths using RESPG for the hospital facilities and emergency responders, calculating post-
catastrophe distances, 1Hpd and 1E
pd , to compare to baseline distances. Specifically, the
differences 1 0H Hp pd d− and 1 0E E
p pd d− will be evaluated for safe population groups p.
We solve these shortest-path problems using the same algorithm as used for
MINOEVAC. The algorithm is implemented almost identically to the evacuation model
algorithm and executes twice, once for hospitals, MINOERS1, and once for emergency
responders, MINOERS2.

32
THIS PAGE INTENTIONALLY LEFT BLANK

33
IV. MODEL SCENARIOS, ANALYSES AND RESULTS
This chapter describes the development of MINO for each CF, details on the
chemical-catastrophe scenarios examined, and results from the evacuation and ERS
models for those scenarios. Following presentation of analytical results, a short summary
for each CF characterizes potential vulnerabilities to the local population and
infrastructures for the scenarios analyzed. These scenarios represent hypothetical
situations and as a reminder, only a few specific scenarios are examined for each
location, and they represent only a small fraction of the possible scenarios that could
occur.
The discussion in Chapter 2, Section D applies for all CFs, and that discussion is
not repeated here. For reasons noted earlier, no summary is included for the Pine Bluff
Chemical Activity. As explained later, the Deseret Chemical Depot is not fully analyzed
because of software limitations. Google Earth and Keyhole Markup Language (KML)
are used to display MINO results; see Appendix C for details.
A. ROAD TRAFFIC RESULTS FROM MINOEVAC
To relate road-traffic results from MINOEVAC to an expected roadway congestion
level, a “traffic-intensity scale” is developed here to help estimate traffic speeds in an
evacuation. A slow evacuation will increase the potential for additional contamination of
the population and cause more casualties. For simplicity, the following assumptions are
made: each vehicle contains 2.0 persons, traffic travels on two out-bound freeway lanes,
and the evacuation transpires in a two-hour window. (No further attempt has been made
to incorporate actual road capacity, additional roads, etc.) With these assumptions,
interpolations can be made from the 2005 Urban Mobility Report’s Freeway Speed
Estimation Curves (Schrank and Lomax 2005) to create Table 2.

34
Traffic Intensity (Persons) Evacuation Speed (mph) Up to 3,750 60 mph (minimal impact)
5,000 50 mph 5,500 40 mph 6,000 30 mph 7,500 20 mph
Table 2. Road Traffic-Intensity Scale
This table provides a rough guide to gauge road-traffic results. Table 2 implies
that when traffic intensities reach or exceed 5,000 persons, traffic congestion may
become a problem. (This happens in scenarios for the Anniston, Blue Grass, Pueblo, and
Umatilla locations.) However, much more study is needed on this topic and the
discussion of results does not try to point out congested roads. The terms “high-intensity
traffic” and “medium-intensity traffic” will describe results, but these are only relative to
other traffic intensities in the scenario.
B. NEWPORT CHEMICAL DEPOT, INDIANA
1. Parameters and Data Processing (Newport)
For the Newport Chemical Depot, MINO defines an area roughly 60 miles wide
(east to west) and 60 miles tall (from north to south). The entire network model includes
57,731 road segments, 8,360 population nodes encompassing 282,567 people, and 154
emergency-response system locations. (Recall that these locations include hospitals,
surgical facilities, EMS, fire stations, and ambulance providers.)
NOAA historical wind data does not cover Newport, Indiana, so the wind data
used in this test comes from the nearest cities for which NOAA data is available,
Indianapolis, Columbus, and Springfield, Illinois. Indianapolis is the nearest city, and the
dominant prevailing wind there is southwest (SW) at 7-11 miles per hour (mph) (NOAA
NCDC 1998). Consequently that wind direction and speed is assumed for one scenario.
Since the other two nearby cities both have a dominant prevailing south (S) wind at 7-13
mph, a south wind is used for a second scenario.

35
The Newport Chemical Depot chemical catastrophes are centered at location
39.854N, 87.431W. Table 3 displays parameters used in HPAC to generate the two
scenarios for this Depot. The construction type “bermed” refers to a concrete, reinforced
bunker with a mound or earth barrier.
HPAC Settings Level Winds Type Agent VX (Nerve) 1. SW (225 degrees) @ 10 mph Prevailing Facility Type Storage Containers 2. S (180 degrees) @ 10 mph Prevailing Construction Bermed Weapon Size 500 lbs
Table 3. Newport Chemical Depot Scenario Parameters.
Figure 11 shows the contamination areas calculated by HPAC for the two scenarios.
For analysis, each contamination area is then approximated as an ellipse, and that ellipse
is enlarged to create the “evacuation ellipse,” as described in Chapter III, Section C.
(Figure 12 shows the two ellipses for the first scenario, and Figure 13 shows the ellipses
for the second scenario.)
Figure 11. Newport Chemical Depot Chemical Catastrophes. Figures show contamination areas for two different scenarios.
2. Analysis and Results (Newport)
The first catastrophe scenario (SW wind at 10 mph) for Newport results in
a large evacuation ellipse that covers 1,043 population nodes, totaling 23,471.
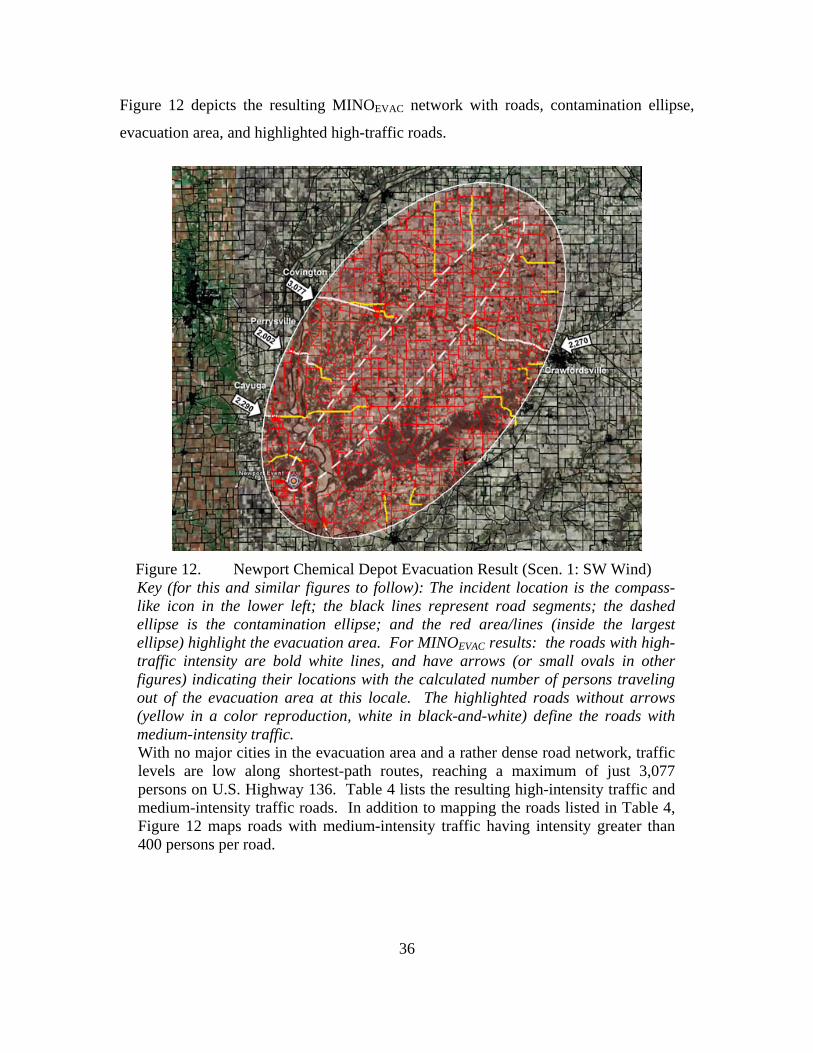
36
Figure 12 depicts the resulting MINOEVAC network with roads, contamination ellipse,
evacuation area, and highlighted high-traffic roads.
Figure 12. Newport Chemical Depot Evacuation Result (Scen. 1: SW Wind) Key (for this and similar figures to follow): The incident location is the compass-like icon in the lower left; the black lines represent road segments; the dashed ellipse is the contamination ellipse; and the red area/lines (inside the largest ellipse) highlight the evacuation area. For MINOEVAC results: the roads with high-traffic intensity are bold white lines, and have arrows (or small ovals in other figures) indicating their locations with the calculated number of persons traveling out of the evacuation area at this locale. The highlighted roads without arrows (yellow in a color reproduction, white in black-and-white) define the roads with medium-intensity traffic. With no major cities in the evacuation area and a rather dense road network, traffic levels are low along shortest-path routes, reaching a maximum of just 3,077 persons on U.S. Highway 136. Table 4 lists the resulting high-intensity traffic and medium-intensity traffic roads. In addition to mapping the roads listed in Table 4, Figure 12 maps roads with medium-intensity traffic having intensity greater than 400 persons per road.
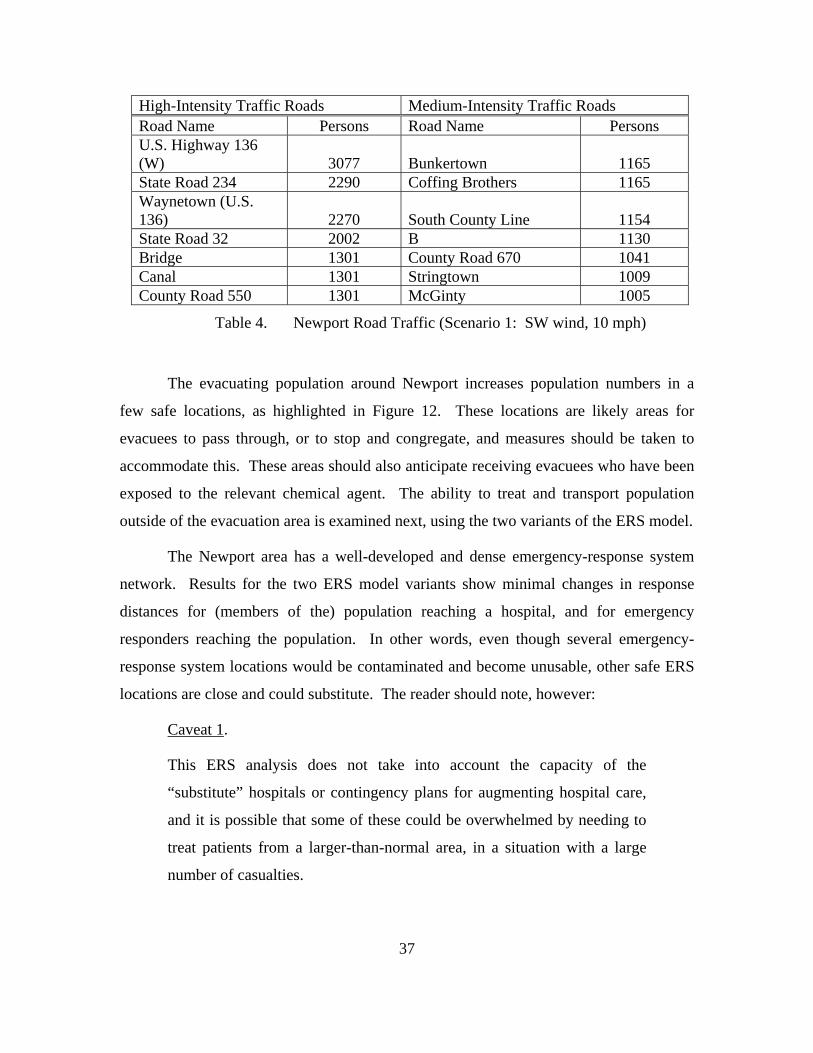
37
High-Intensity Traffic Roads Medium-Intensity Traffic Roads Road Name Persons Road Name Persons U.S. Highway 136 (W) 3077 Bunkertown 1165 State Road 234 2290 Coffing Brothers 1165 Waynetown (U.S. 136) 2270 South County Line 1154 State Road 32 2002 B 1130 Bridge 1301 County Road 670 1041 Canal 1301 Stringtown 1009 County Road 550 1301 McGinty 1005
Table 4. Newport Road Traffic (Scenario 1: SW wind, 10 mph)
The evacuating population around Newport increases population numbers in a
few safe locations, as highlighted in Figure 12. These locations are likely areas for
evacuees to pass through, or to stop and congregate, and measures should be taken to
accommodate this. These areas should also anticipate receiving evacuees who have been
exposed to the relevant chemical agent. The ability to treat and transport population
outside of the evacuation area is examined next, using the two variants of the ERS model.
The Newport area has a well-developed and dense emergency-response system
network. Results for the two ERS model variants show minimal changes in response
distances for (members of the) population reaching a hospital, and for emergency
responders reaching the population. In other words, even though several emergency-
response system locations would be contaminated and become unusable, other safe ERS
locations are close and could substitute. The reader should note, however:
Caveat 1.
This ERS analysis does not take into account the capacity of the
“substitute” hospitals or contingency plans for augmenting hospital care,
and it is possible that some of these could be overwhelmed by needing to
treat patients from a larger-than-normal area, in a situation with a large
number of casualties.

38
The second scenario (S wind at 10 mph), creates another large area in which
39,169 persons evacuate from 1,275 population nodes. Although this is a worse
evacuation scenario than the previous, results are similar; see Figure 13.
Figure 13. Newport Chemical Depot Evacuation Result (Scen. 2: S Wind) (The key in Figure 12 also applies to this figure.) No major cities fall within the evacuation area and the dense road network helps move traffic out of the evacuation area. Traffic along the shortest-path routes reaches a maximum of 4,129 persons on Madison Road, and at least 13,244 persons evacuate into the Danville area. Table 5 lists the high-intensity and medium-intensity traffic. In addition to mapping the roads listed in Table 5, Figure 13 maps roads with medium-intensity traffic having intensity greater than 800 persons per road.

39
High-Intensity Traffic Roads Medium-Intensity Traffic Roads Road Name Persons Road Name Persons Madison 4,129 Division 2,246 Bowman Avenue 4,003 United States Highway 41 2,246 U.S. Highway 136 3,832 Perrysville 2,118 Plum 3,832 Old Covington 2,114 River 3,024 I-74 2,103 100 2,989 Cemetery 2,012 Stone Bluff 2,878 4th 1,997 Fairchild 2,834
Table 5. Newport Road Traffic (Scenario 2: S wind, 10 mph)
As in Scenario 1, the dense emergency-response system helps to reduce the
impact to the local area from the Scenario-2 catastrophe. Results from the ERS models
show that only areas north and northeast of the evacuation area experience substantial
increases in ERS distances; see Figure 14.

40
Figure 14. Newport ERS Results, Scen. 2: Hospitals (Left) and ER (Right). Key: In MINOERS figures, legend numbers represent the increased distance in miles for hospital facilities and emergency-responders (ER) for a given area. The contours result from mapping all population groups together. In Scenario 2, a few population locations just north and northeast of the evacuation area exhibit substantial increases in both hospital and ER distances. For the hospital distances, the “distance-change scale” ranges from zero to greater than 25 miles. Population nodes in the red (dark) area would see travel distances increase over 25 miles to reach the nearest hospital. The ER distance increases range from zero to greater than 15 miles. Only a few areas north of the evacuation area see ER increases in excess of 12 miles. (The reader is warned that some vulnerabilities may be artificially induced by MINO boundaries; see the discussion in the text.)
Caveat 2.
ERS distances for population nodes near a boundary edge may improve if other
ERS locations exist just beyond the edges of that boundary. In fact, inspection of
actual ERS data north of the Newport MINO area shows additional hospital and
ER locations that may negate the discussed vulnerabilities. This will be the case
for all CF MINOERS results along the edge of the model area.
3. Summary (Newport)
Few large cities are situated near the Newport Chemical Depot, and the Depot is
surrounded by a robust road network and emergency-response system. Using two
scenarios with a container VX chemical catastrophe in prevailing wind conditions,
evacuees ranged from 23,000 – 40,000 persons, which are spread nearly uniform across

41
multiple exit routes. The traffic intensities reach a maximum of 4,100 persons on a single
road, which suggests minimal traffic-congestion problems. The safe population areas
outside the evacuation area see little change in response distances to both hospitals and
emergency-responders. In Scenario 2, with a south wind, some population areas in the
north do see increases in ERS distances. This is the only potential vulnerability
highlighted by the ERS models (but see Caveat 2).
C. ANNISTON CHEMICAL ACTIVITY, ALABAMA
1. Parameters and Data Processing (Anniston)
For the Anniston Chemical Activity, the MINO area covers an area roughly 45
miles wide and 60 miles tall. The entire network includes 51,949 road segments, 6,358
population nodes encompassing 299,599 people, and 130 emergency-response locations.
NOAA historical wind data does not provide wind conditions at the Anniston
location, so data from the nearest city, Birmingham, is used for the two scenarios
investigated here. The Birmingham prevailing wind directions are from the north (N) for
nine out of twelve months and are south (S) for the remaining three months (NOAA
NCDC 1998). Wind speeds ranged from 6-9 mph. The Anniston chemical catastrophes,
centered at 33.68N, 85.963W, use the Birmingham wind data and following parameters
in two different scenarios; see Table 6. Figure 15 shows the two corresponding
catastrophe-scenario results from HPAC.
HPAC Settings Level Winds Type Agent VX (Nerve) 1. N (360 degrees) @ 9 mph Prevailing Facility Type Weaponized VX 2. S (180 degrees) @ 8 mph Prevailing Construction Bermed Weapon Size 500 lbs
Table 6. Anniston Chemical Activity Scenario Parameters.
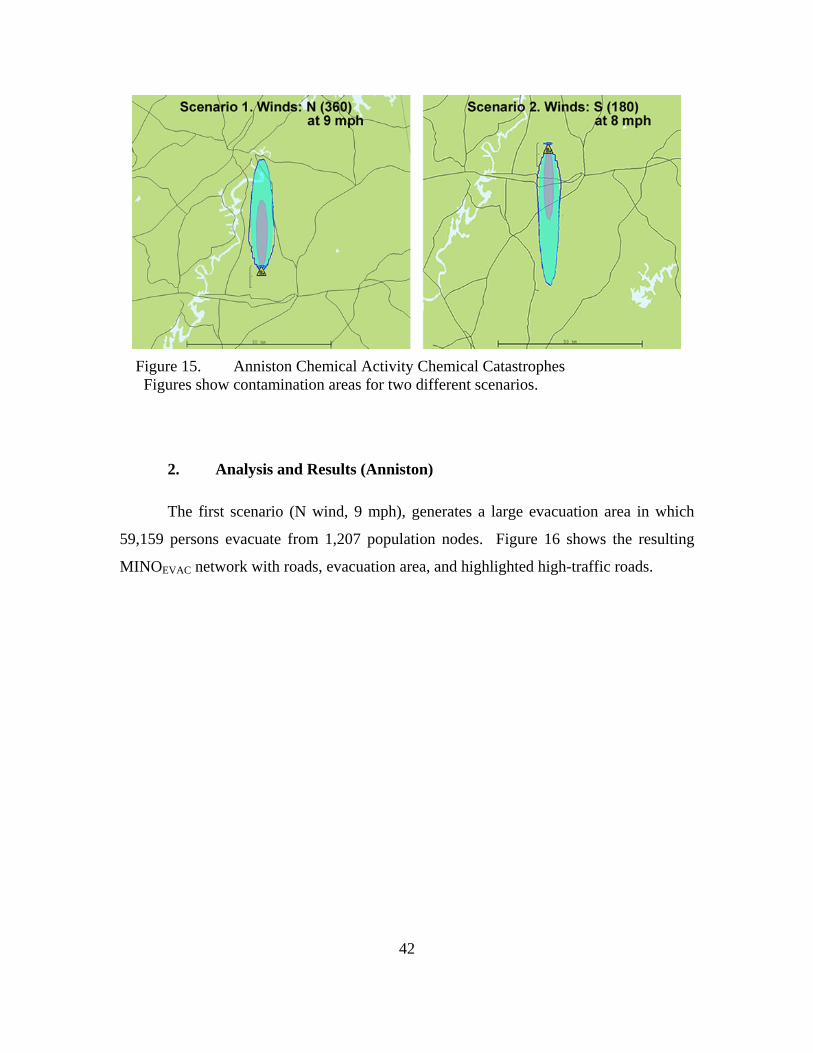
42
Figure 15. Anniston Chemical Activity Chemical Catastrophes
Figures show contamination areas for two different scenarios.
2. Analysis and Results (Anniston)
The first scenario (N wind, 9 mph), generates a large evacuation area in which
59,159 persons evacuate from 1,207 population nodes. Figure 16 shows the resulting
MINOEVAC network with roads, evacuation area, and highlighted high-traffic roads.
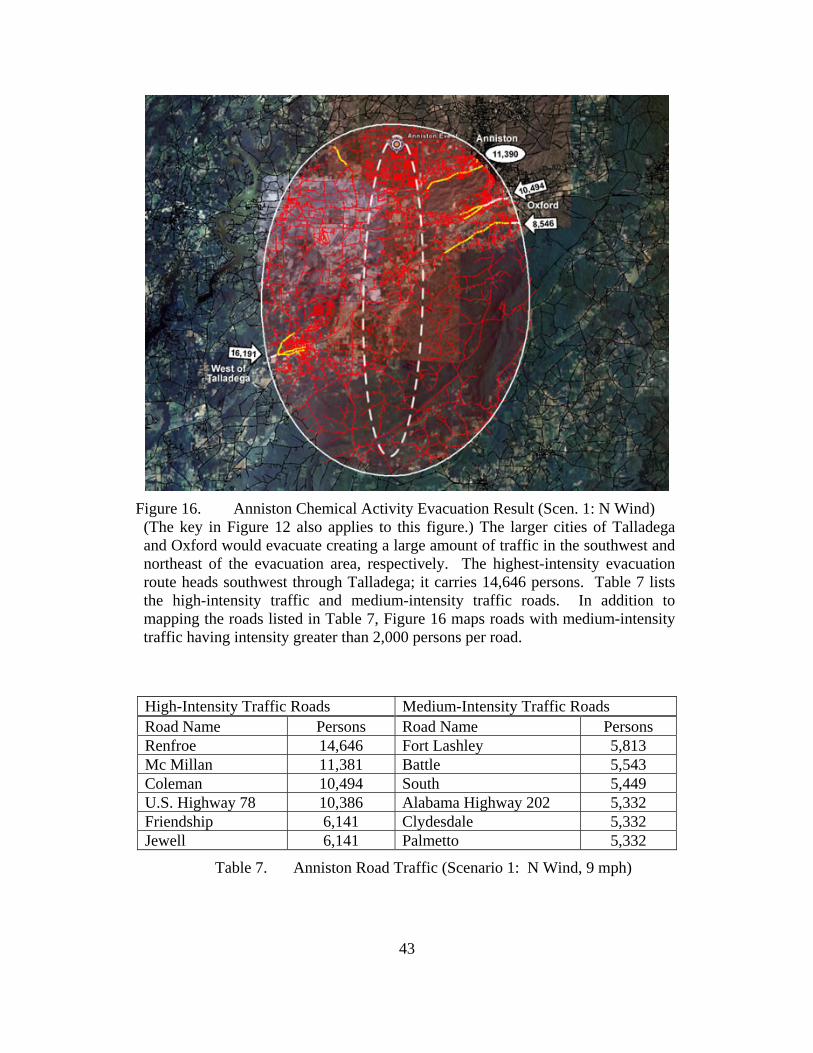
43
Figure 16. Anniston Chemical Activity Evacuation Result (Scen. 1: N Wind)
(The key in Figure 12 also applies to this figure.) The larger cities of Talladega and Oxford would evacuate creating a large amount of traffic in the southwest and northeast of the evacuation area, respectively. The highest-intensity evacuation route heads southwest through Talladega; it carries 14,646 persons. Table 7 lists the high-intensity traffic and medium-intensity traffic roads. In addition to mapping the roads listed in Table 7, Figure 16 maps roads with medium-intensity traffic having intensity greater than 2,000 persons per road.
High-Intensity Traffic Roads Medium-Intensity Traffic Roads Road Name Persons Road Name Persons Renfroe 14,646 Fort Lashley 5,813 Mc Millan 11,381 Battle 5,543 Coleman 10,494 South 5,449 U.S. Highway 78 10,386 Alabama Highway 202 5,332 Friendship 6,141 Clydesdale 5,332 Jewell 6,141 Palmetto 5,332
Table 7. Anniston Road Traffic (Scenario 1: N Wind, 9 mph)

44
The ERS surrounding Anniston, with 130 locations, has good, redundant coverage
for the N-wind scenario, except to the southwest of the evacuation area. Population
groups there see a significant increase in ERS distances. With a smaller number of
hospitals compared to emergency-responders, more population areas see an increase in
hospital distances; see Figure 17. (And note Caveat 2.)
Figure 17. Anniston ERS Result, Scen. 1: Hospitals (Left) and ER (Right) (The key in Figure 14 also applies to this figure.) The hospital distances range up to 50 miles. The red (dark) area southwest of the contamination area experiences a distance increase of over 50 miles. A large green area west of that would also expect hospital distances to increase more than 20 miles. The emergency-responder distances increase up to 50 miles with a similar distribution to the hospital results, but only in the red (dark) region.
The second Anniston scenario (S wind, 8 mph), creates another large area in
which 1,496 population nodes evacuate with 77,234 persons. Figure 18 shows the
resulting MINOEVAC network with roads, evacuation area, and highlighted high-traffic
roads.

45
Figure 18. Anniston Chemical Activity Evacuation Result (Scen. 2: S Wind) (The key in Figure 12 also applies to this figure.) In this scenario, the primary evacuation routes lead through the city of Gadsden to the northwest and through Anniston and Weaver to the southeast. The largest evacuation routes in the northwest carry over 30,000 persons out of the area. Table 8 lists the high-intensity traffic and medium-intensity traffic roads. In addition to mapping the roads listed in Table 8, Figure 18 maps roads with medium-intensity traffic having intensity greater than 2,000 persons per road.

46
High-Intensity Traffic Roads Medium-Intensity Traffic Roads Road Name Persons Road Name Persons Piedmont 11,019 Cole 3,913 Sutton Bridge 11,019 U.S. Highway 278 3,897 Church 8,089 Old Gadsden 3,879 Highway 77 7,961 Parker 3,844 Meighan 7,659 Mountain 3,726 Walker 4,670 Forney 3,726 Caddell 4,580 Main 3,722 Blarney 4,575 2nd 3,564 Elmwood 3,551 Alabama Hwy 204 3,495
Table 8. Anniston Road Traffic (Scenario 2: S Wind, 8 mph)
The MINOERS1 model for the second scenario indicates that areas to the north will
experience large travel-distance increases to reach a hospital (but see Caveat 2), and the
results from MINOERS2 show that the emergency-responder distances increase only
slightly; see Figure 19.
Figure 19. Anniston ERS Results, Scen. 2: for Hospitals (Left) and ER (Right) The dark red areas, in the left half of Figure 19, will experience hospital distance increases greater than 10 miles. The dense emergency-responder network shows little impact for population nodes after the catastrophe, with the greatest distance increase of only five miles for the small highlighted area straight west of the Anniston Chemical Activity.
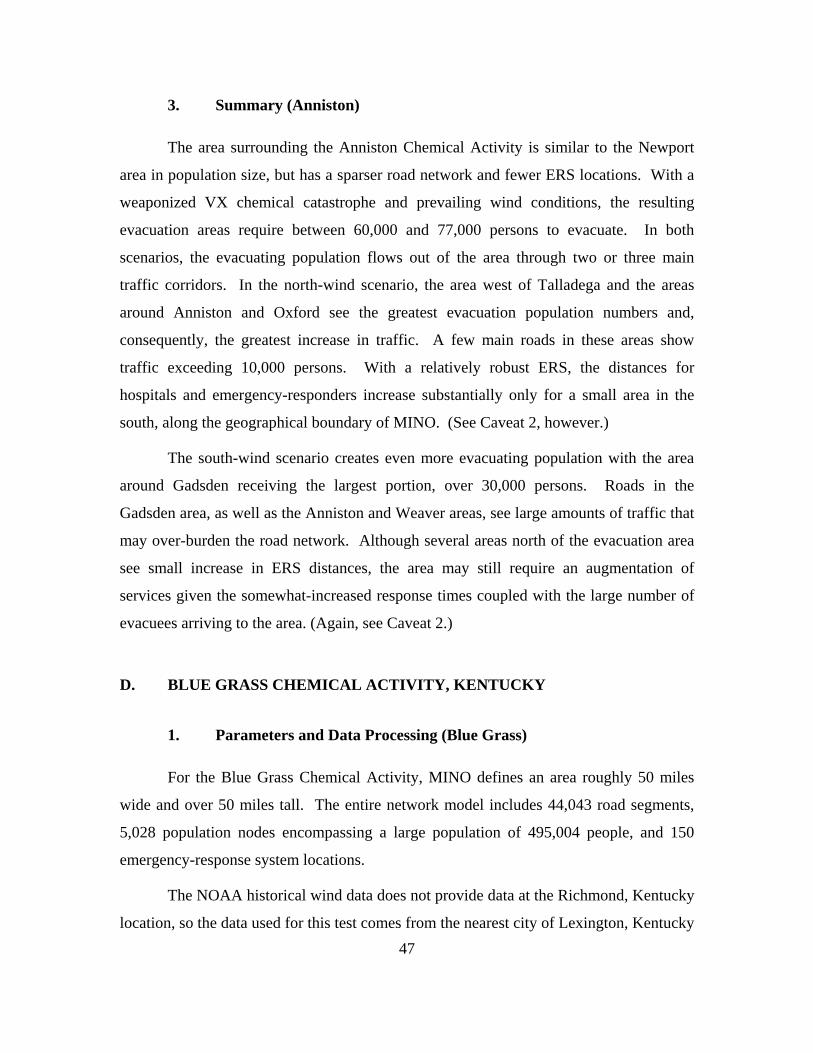
47
3. Summary (Anniston)
The area surrounding the Anniston Chemical Activity is similar to the Newport
area in population size, but has a sparser road network and fewer ERS locations. With a
weaponized VX chemical catastrophe and prevailing wind conditions, the resulting
evacuation areas require between 60,000 and 77,000 persons to evacuate. In both
scenarios, the evacuating population flows out of the area through two or three main
traffic corridors. In the north-wind scenario, the area west of Talladega and the areas
around Anniston and Oxford see the greatest evacuation population numbers and,
consequently, the greatest increase in traffic. A few main roads in these areas show
traffic exceeding 10,000 persons. With a relatively robust ERS, the distances for
hospitals and emergency-responders increase substantially only for a small area in the
south, along the geographical boundary of MINO. (See Caveat 2, however.)
The south-wind scenario creates even more evacuating population with the area
around Gadsden receiving the largest portion, over 30,000 persons. Roads in the
Gadsden area, as well as the Anniston and Weaver areas, see large amounts of traffic that
may over-burden the road network. Although several areas north of the evacuation area
see small increase in ERS distances, the area may still require an augmentation of
services given the somewhat-increased response times coupled with the large number of
evacuees arriving to the area. (Again, see Caveat 2.)
D. BLUE GRASS CHEMICAL ACTIVITY, KENTUCKY
1. Parameters and Data Processing (Blue Grass)
For the Blue Grass Chemical Activity, MINO defines an area roughly 50 miles
wide and over 50 miles tall. The entire network model includes 44,043 road segments,
5,028 population nodes encompassing a large population of 495,004 people, and 150
emergency-response system locations.
The NOAA historical wind data does not provide data at the Richmond, Kentucky
location, so the data used for this test comes from the nearest city of Lexington, Kentucky
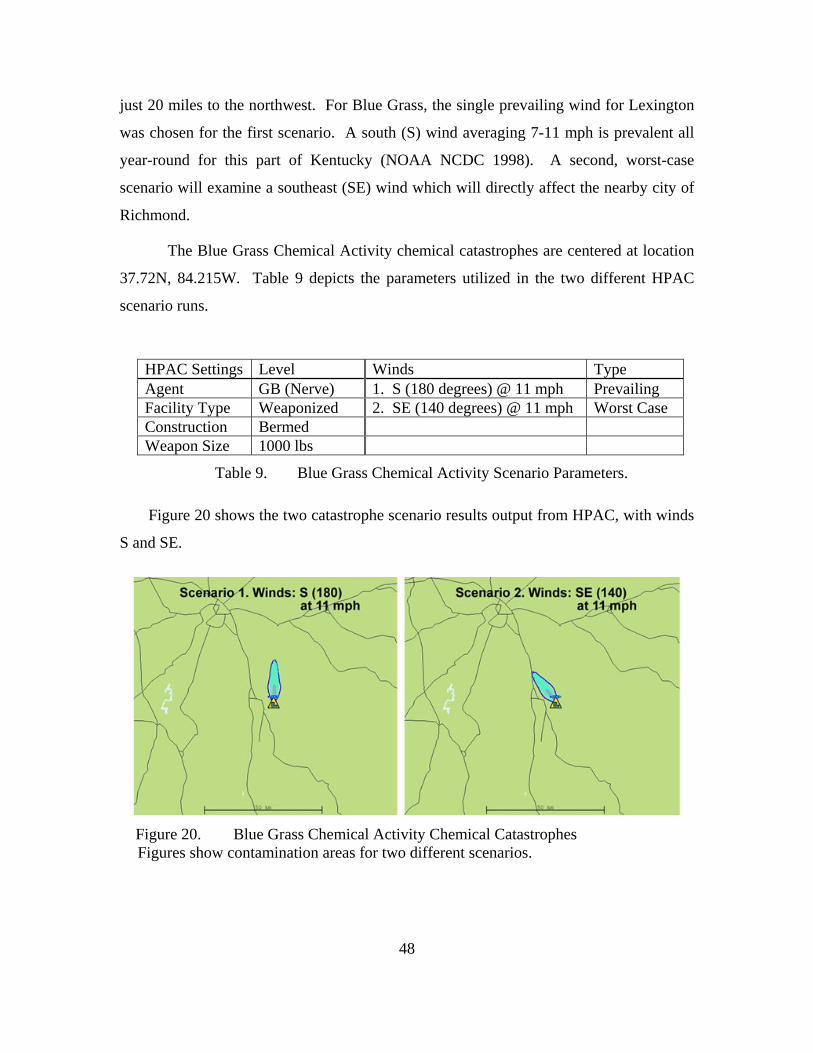
48
just 20 miles to the northwest. For Blue Grass, the single prevailing wind for Lexington
was chosen for the first scenario. A south (S) wind averaging 7-11 mph is prevalent all
year-round for this part of Kentucky (NOAA NCDC 1998). A second, worst-case
scenario will examine a southeast (SE) wind which will directly affect the nearby city of
Richmond.
The Blue Grass Chemical Activity chemical catastrophes are centered at location
37.72N, 84.215W. Table 9 depicts the parameters utilized in the two different HPAC
scenario runs.
HPAC Settings Level Winds Type Agent GB (Nerve) 1. S (180 degrees) @ 11 mph Prevailing Facility Type Weaponized 2. SE (140 degrees) @ 11 mph Worst Case Construction Bermed Weapon Size 1000 lbs
Table 9. Blue Grass Chemical Activity Scenario Parameters.
Figure 20 shows the two catastrophe scenario results output from HPAC, with winds
S and SE.
Figure 20. Blue Grass Chemical Activity Chemical Catastrophes Figures show contamination areas for two different scenarios.
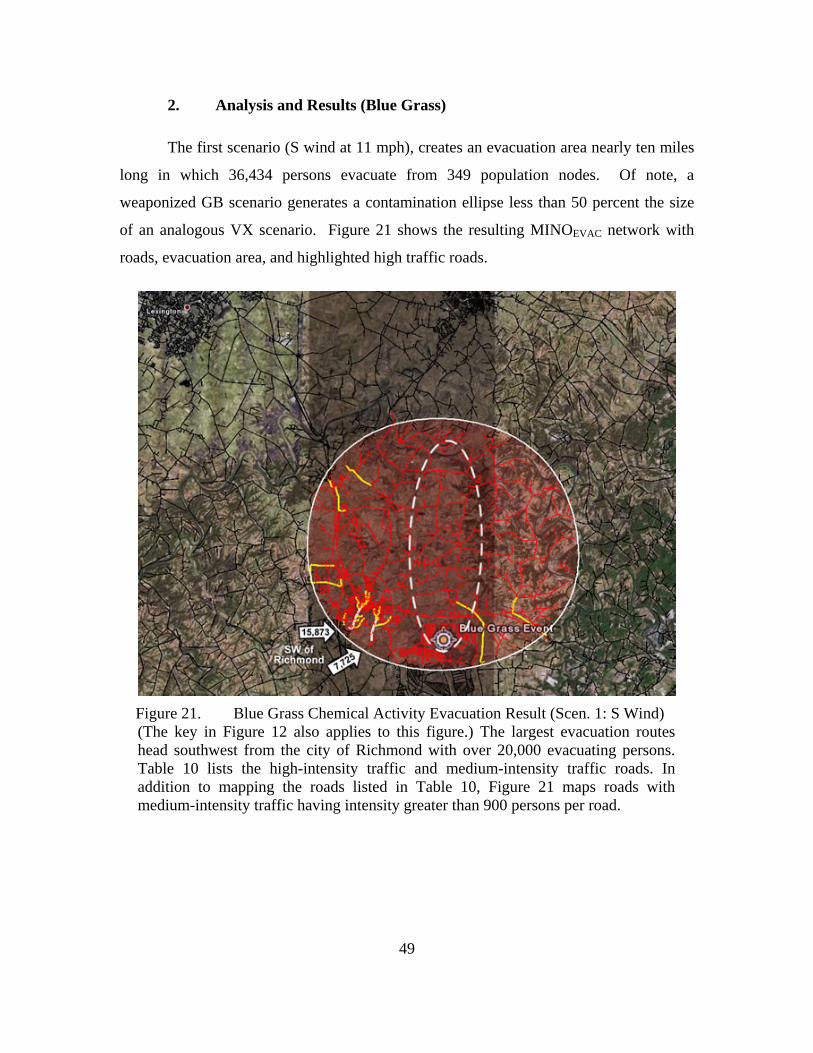
49
2. Analysis and Results (Blue Grass)
The first scenario (S wind at 11 mph), creates an evacuation area nearly ten miles
long in which 36,434 persons evacuate from 349 population nodes. Of note, a
weaponized GB scenario generates a contamination ellipse less than 50 percent the size
of an analogous VX scenario. Figure 21 shows the resulting MINOEVAC network with
roads, evacuation area, and highlighted high traffic roads.
Figure 21. Blue Grass Chemical Activity Evacuation Result (Scen. 1: S Wind) (The key in Figure 12 also applies to this figure.) The largest evacuation routes head southwest from the city of Richmond with over 20,000 evacuating persons. Table 10 lists the high-intensity traffic and medium-intensity traffic roads. In addition to mapping the roads listed in Table 10, Figure 21 maps roads with medium-intensity traffic having intensity greater than 900 persons per road.
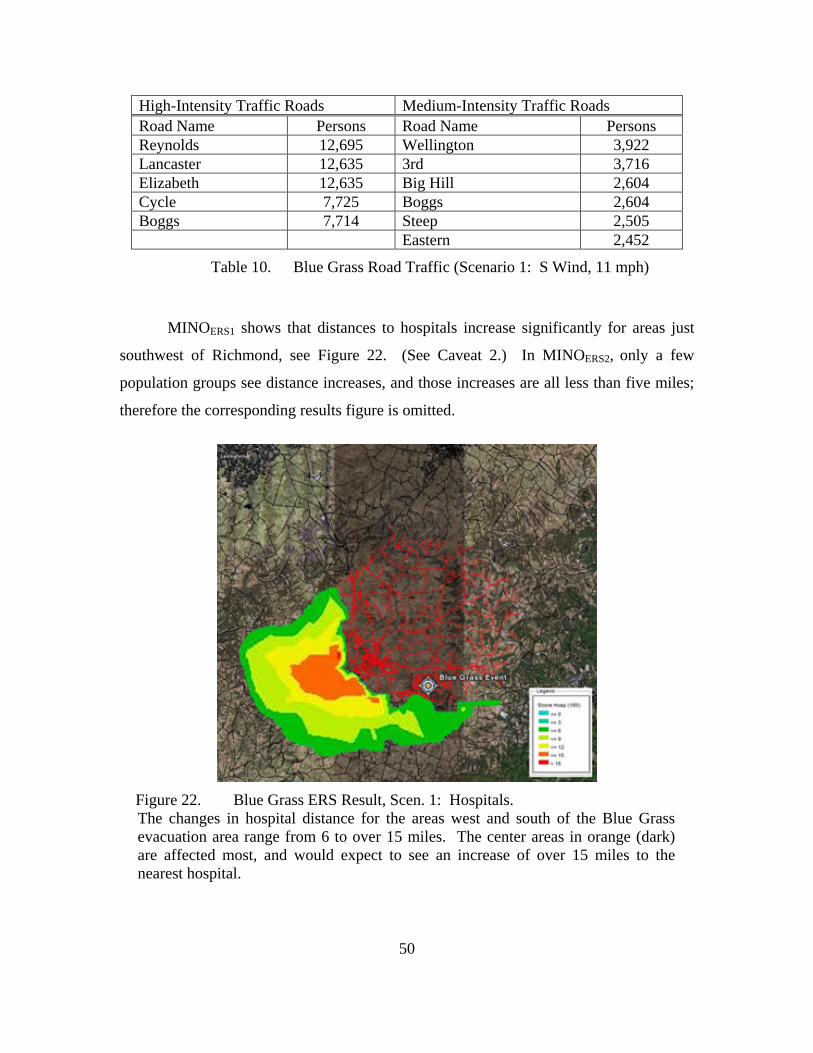
50
High-Intensity Traffic Roads Medium-Intensity Traffic Roads Road Name Persons Road Name Persons Reynolds 12,695 Wellington 3,922 Lancaster 12,635 3rd 3,716 Elizabeth 12,635 Big Hill 2,604 Cycle 7,725 Boggs 2,604 Boggs 7,714 Steep 2,505 Eastern 2,452
Table 10. Blue Grass Road Traffic (Scenario 1: S Wind, 11 mph)
MINOERS1 shows that distances to hospitals increase significantly for areas just
southwest of Richmond, see Figure 22. (See Caveat 2.) In MINOERS2, only a few
population groups see distance increases, and those increases are all less than five miles;
therefore the corresponding results figure is omitted.
Figure 22. Blue Grass ERS Result, Scen. 1: Hospitals. The changes in hospital distance for the areas west and south of the Blue Grass evacuation area range from 6 to over 15 miles. The center areas in orange (dark) are affected most, and would expect to see an increase of over 15 miles to the nearest hospital.

51
The second Blue Grass scenario (SE wind at 11 mph), creates a similar evacuation
area with 366 population nodes evacuating 39,213 persons. The resulting MINOEVAC
network with roads, evacuation area, and highlighted high traffic roads can be seen in
Figure 23.
Figure 23. Blue Grass Chemical Activity Evacuation Result (Scen. 2: SE Wind) (The key in Figure 12 also applies to this figure.) Traffic flows largely to the west out of Richmond with the Redwood and Tates Creek roads carrying over 20,000 evacuating persons. Table 11 lists the high-intensity traffic and medium-intensity traffic roads. In addition to mapping the roads listed in Table 11, Figure 23 maps roads with medium-intensity traffic having intensity greater than 1,000 persons per road.
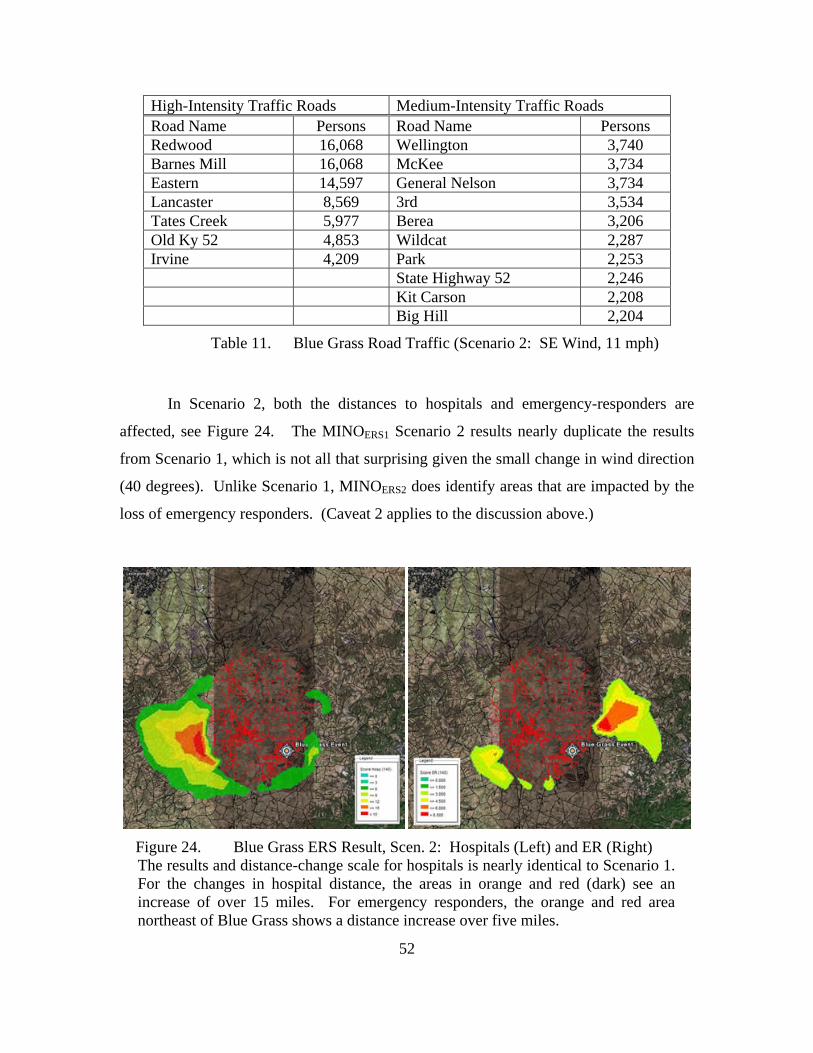
52
High-Intensity Traffic Roads Medium-Intensity Traffic Roads Road Name Persons Road Name Persons Redwood 16,068 Wellington 3,740 Barnes Mill 16,068 McKee 3,734 Eastern 14,597 General Nelson 3,734 Lancaster 8,569 3rd 3,534 Tates Creek 5,977 Berea 3,206 Old Ky 52 4,853 Wildcat 2,287 Irvine 4,209 Park 2,253 State Highway 52 2,246 Kit Carson 2,208 Big Hill 2,204
Table 11. Blue Grass Road Traffic (Scenario 2: SE Wind, 11 mph)
In Scenario 2, both the distances to hospitals and emergency-responders are
affected, see Figure 24. The MINOERS1 Scenario 2 results nearly duplicate the results
from Scenario 1, which is not all that surprising given the small change in wind direction
(40 degrees). Unlike Scenario 1, MINOERS2 does identify areas that are impacted by the
loss of emergency responders. (Caveat 2 applies to the discussion above.)
Figure 24. Blue Grass ERS Result, Scen. 2: Hospitals (Left) and ER (Right) The results and distance-change scale for hospitals is nearly identical to Scenario 1. For the changes in hospital distance, the areas in orange and red (dark) see an increase of over 15 miles. For emergency responders, the orange and red area northeast of Blue Grass shows a distance increase over five miles.

53
3. Summary (Blue Grass)
The Blue Grass Chemical Activity MINO includes a population of over 495,000
persons. Fortunately, the weaponized GB chemical catastrophe scenarios, using the
prevailing wind condition and a worst-case wind condition, not spark mass evacuations.
Fewer than 40,000 persons evacuate in each scenario. In the first scenario, with a south
wind, a few roads southwest of the Richmond area see significant traffic, with over
12,000 persons. This area also becomes the primary departure point for the nearly two-
thirds of the evacuating population. Additionally, with no hospital facilities available in
this area southwest of Richmond, hospital distances increase considerably, (See Caveat
2.)
Similar results follow for a second, worst-case scenario as the majority of
evacuating population departs west out of Richmond. Again, a few roads carry large
numbers of persons, with up to 16,000 persons on the main roadway. Hospital distances
increase as in the first scenario because the area west of Richmond has limited hospital
facility infrastructure. (See Caveat 2.) Overall, given the likely south wind for the Blue
Grass area, the road network and ERS appear vulnerable and may quickly reach capacity
in the areas south and west of Richmond.
E. PUEBLO CHEMICAL DEPOT, COLORADO
1. Parameters and Data Processing (Pueblo)
For the Pueblo Chemical Depot, MINO defines an area roughly 60 miles wide and
50 miles tall. The combined network includes 20,372 road segments, 3,015 population
nodes, and 31 emergency-response system locations. The model population includes
145,799 people.
The NOAA historical wind data establishes two prevailing wind conditions for
Pueblo. For two months, January and February, the prevailing wind is from the west (W)
from 7-8 mph, and for the other ten months, the prevailing winds are from the east-south-
east (ESE) at 7-11 mph (NOAA NCDC 1998).

54
The Pueblo chemical catastrophes are centered at location 38.345N, 104.32W.
Initial results from MINOEVAC and MINOERS show that the two prevailing wind
directions have little impact on the local infrastructure so a third more devastating wind
direction of east-north-east (ENE) is added for analysis. Table 12 displays the parameters
utilized in the three different HPAC scenarios run for the Pueblo area.
HPAC Settings Level Winds Type Agent HD (Mustard) 1. ESE (115 degrees) @ 11 mph Prevailing Facility Type Weaponized 2. W (270 degrees) @ 9 mph Prevailing Construction Light Steel 3. ENE (060 degrees) @ 10 mph Worst Case Weapon Size 500 lbs
Table 12. Pueblo Chemical Depot Scenario Parameters.
A few of the levels for Pueblo HPAC settings are altered to create worse-than-
likely scenarios for analysis. One setting with a large impact to contamination area is the
type of bunker or storage-facility construction. Most of the chemical weapons stored at
the Pueblo Chemical Depot are housed in bermed, concrete bunkers. With mustard agent
and bermed bunkers chosen in HPAC, the resulting contamination area would remain
within the confines of the military installation. While this is a comforting result, these
parameters were relaxed to test the Pueblo MINO. A more severe case assuming only
steel construction housing the chemical weapons is utilized for the scenario calculations.
Although less likely, this situation could occur during transport of a chemical weapon or
in a destruction facility.
Figure 25 shows the three results from HPAC, with winds ESE, W, and ENE from
left to right respectively.

55
Figure 25. Pueblo Chemical Depot Chemical Catastrophes Figures show contamination areas for three different scenarios.
2. Analysis and Results (Pueblo)
As alluded to earlier, the first two wind directions, ESE and W prevailing winds,
do not produce significant effects on the local infrastructure. Even with the expanded
evacuation area, the number of evacuees remain below 200 persons and there is virtually
no impact to the emergency-response system. Therefore, for prevailing wind directions
and speeds, a major weaponized mustard-agent catastrophe starting inside a light steel
building, has little impact to public safety, in general. To test vulnerabilities in the area, a
third scenario with a more problematic wind direction is created.
In Scenario 3 (ENE wind at 10 mph), 2,289 locations with 123,752 people
evacuate. Figure 26 shows the resulting MINOEVAC network, with evacuation area and
major-traffic roads.

56
Figure 26. Pueblo Chemical Depot Evacuation Result (Scen. 3: ENE Wind) (The key in Figure 12 also applies to this figure.) The population in this scenario will likely pool north of the city or continue further north out of the area. The areas north of Pueblo see an increase of over 106,000 persons, or over 85 percent of those evacuating. The remainder of the evacuees flow out to the southeast and east of the evacuation area. Table 13 lists the roads with the largest traffic intensities.
High-Intensity Traffic Roads Medium-Intensity Traffic Roads Road Name Persons Road Name Persons Boyero 64,098 Collins 13,546 Wildhorse 64,002 Wooden 11,311 Pueblo 57,174 Adams 11,262 Overton 42,157 Veta 10,814 Jerry Murphy 40,195 Princeton 9,663 Goodnight 17,419 29th 8,245
Table 13. Pueblo Road Traffic (Scenario 3: ENE Wind, 10 mph)
MINOERS for Scenario 3 shows that all of the hospital facilities in the study area fall
within the evacuation area and become unusable. In this worst case, the facilities needed

57
to treat any casualties (or unrelated injuries and disease) must lie outside the MINO area.
However, the Pueblo area contains more emergency-responder locations and some lie
outside the evacuation area, so it does make sense to analyze changes in ER distances
with MINOERS2; Figure 27 displays those results.
Figure 27. Pueblo ERS Result, Scen. 3: ER For areas southeast of the evacuation area, emergency-responder distances increase significantly, with a few areas in the orange (darker) contours increasing up to 100 miles. All areas southeast of the contamination area see emergency-responder distance increases of over 60 miles, and should expect response times to increase accordingly (See Caveat 2.)
3. Summary (Pueblo)
The area surrounding the Pueblo Chemical Depot has a sparse road network, a
relatively small population, and few emergency-response locations. Fortunately, the
chemical agent stored in the Depot, HD mustard, is the least dangerous of those studied
here, and is unlikely to produce a true chemical catastrophe. To test the Pueblo MINO,
HPAC parameters must be relaxed to create a scenario in which chemical agents actually
disperse beyond the borders of the military installation. With the two prevailing wind
conditions, given a weaponized mustard agent chemical catastrophe, the expanded
evacuation areas contain fewer than 200 persons and have virtually no impact to the ERS.

58
Overall, the results show no significant vulnerabilities for standard conditions in the
Pueblo area. However, to test MINO and identify potential vulnerabilities, a worst-case
wind direction is chosen next with an ENE wind, a direction that directly affects the city
of Pueblo.
The entire city of Pueblo lies within the evacuation area, and so a large volume of
traffic evacuates the area to the north towards Colorado Springs. Over 106,000 persons,
about 85 percent of all the evacuees, travel along these roads. The main roads and areas
just north of Pueblo would be impacted significantly with the added evacuation
population. Additionally, all the hospital facilities in the study area fall inside the
evacuation area and are deemed unusable. Hospital facilities outside the model area
would be required, or mobile facilities could be brought into the region. While the areas
north of Pueblo do not see major increases to the emergency-responder distances, the
areas east of Pueblo show significant distance increases because only a few emergency-
responder locations remain. The city of Pueblo, its infrastructure and population, appears
to be highly vulnerable to a worst-case chemical catastrophe. (However, see Caveat 2
and recall that the scenario assumptions here are extreme.)
F. DESERET CHEMICAL DEPOT, UTAH
1. Parameters and Data Processing (Deseret)
For the Deseret Chemical Depot, MINO defines an area roughly 40 miles wide
and 40 miles tall. With the large metropolis of Salt Lake City within this area, MINO
must be scaled back in an attempt to stay within the limitations of the software. (As
stated earlier, a different implementation could accommodate this much larger road
network and population.) The minimum population node size is increased to 40 persons
to reduce the number of population nodes. To increase space for road arcs, population
nodes and ERS nodes are connected to the road network using only one arc, rather than
the standard two. The reduced network includes 52,499 road segments, 8,142 population
nodes, and 231 emergency-response system locations. The model population includes
954,607 people.

59
NOAA historical wind data establish two prevailing wind conditions for Salt Lake
City, which lies about 25 miles to the northeast of CF. For two thirds of the year, the
prevailing winds are out of the south-southeast (SSE) at 8-10 mph, and the remainder of
the year the wind is out of the southeast (SE) at the same speeds (NOAA NCDC 1998).
With the prevailing winds from nearly the same direction, which also coincides with a
worst-case Salt Lake City event, the analysis of only one scenario is attempted here.
The Deseret chemical catastrophe is centered at location 40.308N, 112.358W.
Table 14 depicts the parameters utilized in the Deseret Chemical Depot HPAC scenario.
HPAC Settings Level Winds Type Agent VX (Nerve) 1. SE (215 degrees) @ 10 mph Prevailing Facility Type Storage Construction Bermed Weapon Size 750 lbs
Table 14. Deseret Chemical Depot Scenario Parameters.
2. Analysis and Results (Deseret)
Given the large contamination area created by the HPAC scenario, and given the
high density of population and roads in the Salt Lake City area, MINOG for this area is
simply too large to handle within the Excel format and MINO. Consequently, no
summary or further analysis is provided in this thesis for the Deseret Chemical Depot.
This large, population-dense area could be addressed in future work.
G. UMATILLA CHEMICAL DEPOT, OREGON
1. Parameters and Data Processing (Umatilla)
For the Umatilla Chemical Depot, MINO defines an area roughly 75 miles wide
and 75 miles tall. The complete network includes 43,700 road segments, 5,476
population nodes encompassing 290,589 people, and 135 emergency-response system
locations.

60
NOAA historical wind data establishes two prevailing wind conditions for
Pendleton, Oregon, a location 30 miles to the east of the Umatilla area. For two thirds of
the year, the prevailing wind is from the west (W) at 7-9 mph, and is from the SSE in the
same speed range for the remainder of the year (NOAA NCDC 1998).
The Umatilla chemical catastrophes are centered at location 45.85N, 119.425W.
Table 15 displays parameters used in HPAC to generate the two scenarios for this Depot.
One prevailing-wind-direction scenario is selected along with a worst-case scenario
which impacts the larger city of Kennewick, Washington, to the northeast of the CF.
HPAC Settings Level Winds Type Agent GB (Nerve) 1. W (270 degrees) @ 9 mph Prevailing Facility Type Storage Containers 2. SSW (205 degrees) @ 9 mph Worst Case Construction Bermed Weapon Size 750 lbs
Table 15. Umatilla Chemical Depot Scenario Parameters.
Figure 28 shows the two results from HPAC, with winds W and SSW on the left and
right respectively.
Figure 28. Umatilla Chemical Depot Chemical Catastrophes Figures show contamination areas for three different scenarios.

61
2. Analysis and Results (Umatilla)
Scenario 1 (W wind at 9 mph), creates an evacuation area stretching nearly 40
miles long in which 30,921 persons from 658 population nodes require evacuation. The
resulting MINOEVAC network with roads, evacuation area, and highlighted high-traffic
roads can be seen in Figure 29.
Figure 29. Umatilla Chemical Depot Evacuation Result (Scen. 1: W Wind) (The key in Figure 12 also applies to this figure.) The most heavily used evacuation routes head north across the Interstate 82 bridge spanning the Columbia River. Table 16 lists the high-intensity traffic and medium-intensity traffic roads. In addition to mapping the roads listed in Table 16, Figure 29 maps roads with medium-intensity traffic having intensity greater than 3,000 persons per road.

62
High-Intensity Traffic Roads Medium-Intensity Traffic Roads Road Name Persons Road Name Persons I-82 15,774 Jones Scott 8,122 Plymouth 15,774 Umatilla-Stanfield 8,083 Brownell 15,713 Madison Sayler 7,465 6th 11,663 Colonal Jordan 7,465 Westland 7,035 Bridge 6,655
Table 16. Umatilla Road Traffic (Scenario 1: W Wind, 9 mph)
Although there are 135 ERS locations in the Umatilla MINOERS, the lack of roads
crossing the Columbia River and contamination of larger cities can greatly impact the
ERS; see Figure 30.
Figure 30. Umatilla ERS Result, Scen. 1: Hospitals (Left), ER (Right). In this first scenario, hospital distances increase in excess of 25 miles for areas in red and orange (dark center) west of the chemical catastrophe. An even larger area of population, in yellow and greens (outer edges), will see distance increases greater than 15 miles to the nearest hospital. The emergency-responders are less impacted with the greatest distance increase just over six miles. Although there are several large areas in the ER figure, the increase in distances for emergency-responders is not as significant as seen with hospitals.

63
The second scenario (SSW wind at 9 mph), generates another large contamination
area stretching into the town of Kennewick, Washington. A much larger population falls
within the evacuation area where 1,995 population nodes encompassing 127,935 persons
must evacuate. Figure 31 displays the resulting MINOEVAC network with roads,
evacuation area, and highlighted high-traffic roads.
Figure 31. Umatilla Chemical Depot Evacuation Result (Scen. 2: SSW Wind) (The key in Figure 12 also applies to this figure.) The most heavily used evacuation routes are depicted, exiting the city of Kennewick to the east, and west to Richland. As the figure shows, nearly 100,000 persons must evacuate the Kennewick area creating a significant traffic problem. Table 17 lists the high-intensity traffic and medium-intensity traffic roads. In addition to mapping the roads listed in Table 17, Figure 31 maps roads with medium-intensity traffic having intensity greater than 5,000 persons per road.

64
High-Intensity Traffic Roads Medium-Intensity Traffic Roads Road Name Persons Road Name Persons 10th 20,474 George Washington 13,155 Chemical 20,444 State Highway 240 13,155 19th 20,444 Carmichael 11,628 Yew 20,444 Kennewick 11,340 7th 18,123 Highway 395 10,233 3rd 17,731 25th 7,363 Oak 17,731 27th 7,253 Gum 16,804 Columbia Center 5,706 1st 16,783 Steptoe 5,639 Vineyard 16,362 Orchard 5,575
Table 17. Umatilla Road Traffic (Scenario 2: SSW Wind, 9 mph)
Since the model only moves evacuees to the edge of the evacuation area, we
would presume evacuees traveling east from Kennewick would have adequate bridge
capacity to travel across the Columbia River. According to the MINOEVAC road data,
those specific evacuees would be stranded, as no safe bridges exist across the Columbia
outside the evacuation area. Therefore, evacuees would more likely travel longer
distances through the evacuation area across the bridges in Kennewick or to the west. In
other words, evacuees would follow longer paths that would tend to increase their risk of
exposure to the chemical agent.
As noted earlier, a portion of population east of the contaminated area will be
isolated, without safe travel routes. Hospital distances are impacted significantly in this
scenario, as highlighted by MINOERS1; see Figure 32. Some emergency-responders are
located within the isolated area as well as in other areas, and this means that emergency-
responder distances are barely affected in this scenario; the corresponding ER figure is
therefore omitted.

65
Figure 32. Umatilla ERS Result, Scenario 2: Hospitals Of the 11 ERS hospital locations, none of the hospitals fall within this red (dark) isolated area bounded by the evacuation area and the Columbia River. Therefore, the isolated population cannot reach a hospital using the road network. Alternate means via the river or air would be required to move further from the evacuation area without reentering and risking exposure. Another large number of population groups would see hospital distances increase over 30 miles, depicted by the green areas southwest of the Umatilla Chemical Depot.
3. Summary (Umatilla)
The Umatilla Chemical Depot area studied roughly 5,600 square miles of Oregon
and Washington, the largest of the MINO areas. With a GB storage facility chemical
catastrophe, two vastly different scenarios result, depending solely on differing wind
directions. The prevailing westerly wind generates a large evacuation area, but only
requires evacuation of 31,000 persons. The majority of those persons cross the Columbia
River in their shortest path, highlighting the importance of the Interstate 82 bridge. With
the contamination of the ERS locations east of Umatilla, population groups west of the
evacuation area would see a large distance increase, greater than 15-30 miles, to the
nearest hospital. (See Caveat 2.)
The worst-case wind scenario creates a large evacuation area stretching into the
town of Kennewick, Washington. In this case, over 127,000 persons require evacuation.
This evacuation creates high traffic volumes on numerous roadways, especially in the

66
Kennewick area, but also in the Richland and Hermiston areas. These areas could expect
to see large increases in population with the possibility of large numbers of exposed
persons. Results from MINOEVAC isolate a large portion of the evacuating population
between the evacuation area and the Columbia River. This fact may be viewed as a
model limitation, as a logical evacuation plan would require evacuees to follow longer
routes within the evacuation area to reach safe areas that are not isolated. Nevertheless,
for any isolated population group, an alternate transportation system to transit from the
isolated area may be necessary, e.g., watercraft on the river. The hospital distances
increase for several areas surrounding the evacuation area. With several bridges
unusable, this situation would also require alternate transportation solutions.
67
V. CONCLUSIONS AND RECOMMENDATIONS
A. SUMMARY
This thesis has created a model called MINO (multi-infrastructure network
operations model) to identify vulnerabilities in select infrastructure systems to the release
of a chemical-weapons agent. MINO is applied to the road networks, emergency-
response systems, and public-health systems in the areas surrounding each of five U.S.
Chemical Warfare Stockpiles and Facilities (CFs). Each CF is subjected to several
hypothetical “chemical-catastrophe scenarios,” and variants of MINO (1) identify roads
that are likely to become congested during the evacuation that must take place, (2)
identify areas in the “safe zone” (outside the evacuation zone) that will need to
accommodate large numbers of evacuees (3) identify safe-zone areas in which
emergency-response times will increase, and (4) identify safe-zone areas in which the
population will experience a significant increase in the time required to reach a hospital.
MINO first creates a generic network model that integrates representations of the
local road network, population blocks, emergency-response services and public-health
facilities. Chemical-catastrophe scenarios are generated by specifying a variety of
parameters (e.g., wind speed, wind direction, chemical type) for the Hazard Prediction
and Assessment Capability software (HPAC) currently in use by the Defense Threat
Reduction Agency (DTRA). The output is a “contamination area,” which is expanded
with a buffer zone to define an “evacuation area.” The local population must leave the
evacuation area immediately, after which all roads in that area are declared unusable.
Variants of the MINO network and shortest-path techniques are then used to address
items (1)-(4) listed above.
The models are written in Microsoft Excel’s Visual Basic for Applications
(VBA), because Excel is widely accessible and used in the Department of Defense.
Google Earth software helps visualize MINO and interpret MINO results.

68
Results from MINO highlight vulnerabilities in the road and emergency-response
system (ERS) infrastructures. This should inform emergency planners as to where
infrastructure deficiencies may exist and help guide improvements.
B. CONCLUSIONS AND KEY INSIGHTS
As a caveat, the reader should note that only a few hypothetical scenarios have
been analyzed for each location, and these scenarios represent only a small fraction those
possible. Therefore, the results from this thesis should not be considered definitive.
Furthermore, results for a single CF can vary widely depending on scenario parameters.
For instance, the two scenarios investigated for the Umatilla Chemical Depot in Oregon
show a difference of 100,000 in the number of evacuees (starting from a total population
of 290,589).
The algorithms used in MINO run quickly. With a well-developed MINO
network model, a range of scenarios could be analyzed, vulnerabilities identified and
those results cataloged as an on-the-shelf reference for contingency planners and
emergency responders.
The MINO evacuation model can identify main road corridors used in an
evacuation, and safe areas in which evacuees may congregate. This information can be
used to help design better evacuation routes, give emergency responders an
understanding of where traffic intensities may affect their response, and will also assist in
implementing traffic-control measures. The MINO ERS model helps emergency
responders and planners identify areas that may require special attention, such as
assistance from outside sources.
C. FOLLOW-ON WORK
The development of MINO introduces an example of multi-infrastructure
networks and systems analysis. From the macro perspective, the next step should
consider integrating other infrastructure systems into the MINO model. Other
infrastructure systems, such as water systems or agriculture, may have similarities which

69
would lend to reuse of the existing contamination logic and evacuation model (or modest
modifications, thereof). Other infrastructure systems, e.g., a local electric power grid,
may require substantially different models.
Several aspects of the current MINO models should be developed further. First,
adding weights to roads based on road capacity would create more realistic evacuation
routes as evacuees are more likely to use higher-capacity roads and highways rather than
low-capacity side streets. A similar modification could address casualty capacities for
the ERS, e.g., the size of hospital facilities and load capacity for emergency responders.
Second, software changes are needed to handle larger network models, and thus
larger geographical regions. With the current implementation in Excel 2003, the
maximum number of spreadsheet rows limits the network size, which is a function of the
number of roads, population nodes, etc. For instance, the current MINO implementation
cannot analyze the region surrounding the Deseret Chemical Depot near Salt Lake City,
because of the dense road network and large population.
Third, a few steps in the modeling-and-analysis process require manual
intervention from the user, and these should be automated. For instance, the
approximation of the contamination area by an ellipse requires data imports and manual
point selection. Further study should verify the validity of the elliptical contamination-
area approximation. Integrating several manual steps and consolidating other
disconnected steps into a single function could further simplify model processing and
improve efficiency. For example, the following manual steps could be fully automated in
a single process: the data for the HPAC-generated contamination area is manually
transferred into Excel; the user then applies that data, in a partially manual process to
generate the evacuation ellipse; and then a separate application makes structural changes
to the MINO network to reflect the imposition of the evacuation area.
Fourth, with improved, automated data processing, a smart design of experiment
could investigate a large range of values for wind speed, wind direction and other
parameters. Generating a wider range of scenarios would help identify vulnerabilities

70
that are most likely to be problematic. Ultimately, the study of multi-infrastructure
problems with catastrophe scenarios presents a nearly endless list of topics for future
exploration.

71
APPENDIX A: HPAC
The following selection, provides a brief introduction to the HPAC software used in this
these, was taken from the HPAC 4.04 Users Manual (DTRA 2004).
Hazard Prediction and Assessment Capability (HPAC) is a counter proliferation,
counterforce tool that predicts the effects of hazardous material releases into the
atmosphere and its [sic] collateral effects on civilian and military populations. HPAC
assists warfighters in destroying targets containing weapons of mass destruction (WMD)
and responding to hazardous agent releases. It employs integrated source terms, high-
resolution weather forecasts and particulate transport algorithms to rapidly model hazard
areas and human collateral effects. HPAC estimates the NBC hazards associated with
releases from either facilities or weapons.
HPAC predicts NBC hazards from incidents such as the following:
• Nuclear Facility Accidents (Chernobyl, Ukraine) • Nuclear Weapon Explosions (Hiroshima, Japan) • Nuclear Weapon Incident/Accident, “Broken Arrow” (Palomares, Spain) • Radiological Weapon Incident • Chemical Facility Damage (Bhopal, India) • Biological Facility Damage (Sverdlovsk, Russia) • Chemical Weapons (Kamasiyha, Iraq) • Biological Weapons (Yokosuka, Japan (alleged use by Aum Shin Rikyo))
HPAC was designed to be used by two types of users, operational and analytical:
• Operational users include pilots, soldiers, and commanders – in other words, field users responding to actual or expected events.
• Analytical users (analysts) generally are involved in research and development. HPAC generally includes default values for user inputs in order to simplify complex input for operational users. Analytical users may change these default inputs based on their subject matter expertise.

72
THIS PAGE INTENTIONALLY LEFT BLANK

73
APPENDIX B: CREATING THE MINO
A. BACKGROUND
The following Appendix expands on Chapter III, Section A, constructing the
multi-infrastructure network operations model (MINO) for a given U.S. Chemical
Warfare Stockpile and Facility (CF), represented by the undirected network graph MINOG .
The required critical-infrastructure data is extracted from various datasets and then
merged, using a common reference system: latitude and longitude (lat/long) coordinates.
The construction process first defines the road-network infrastructure and then integrates
the emergency-response system (ERS) infrastructure, which includes the hospitals and
first responders. Population must also be represented and connected to the road network.
The goal is to build a connected, undirected road, population, and emergency-
response system network of nodes and arcs in Microsoft Excel using data-processing
routines written in Visual Basic for Applications (VBA). All initial data files are
specified in a shapefile (.shp) format (ESRI 1998). While a shapefile can be read by
ESRI’s ArcMap program, it does not easily convert into a traditional network dataset.
Several different transformations are required to convert the shapefile data files into a
useful form (University of Texas 2004).
B. ROAD NETWORK DEVELOPMENT
Road and population data are taken from the 2000 Census TIGER database
(Topologically Integrated Geographic Encoding and Referencing database) available to
the public through the ESRI GIS and Mapping Software Web site (ESRI 2007). The
TIGER database is downloadable by county and data type, e.g. “Census Blocks 2000”
and “Line Features – Roads”. After downloading county road data for a given CF area
from the TIGER database, the county sets are merged into a single shapefile for further
processing using GeoMerge (VDS Technologies 2007). The software tool GeoMerge, a
free utility available on the Internet, easily and quickly combines the county shapefiles
into one large dataset. The road dataset is then filtered by lat/long in ArcMap using the

74
Selection Features tool to shrink the working file and ensure a maximum of 65,535 road
segments, an Excel 2003 software limitation (Walkenbach 2004). This segment limit is
imposed by the road-processing algorithm. This limitation could be overcome with a
different implementation (using multiple spreadsheets and combining the data using
VBA) or Excel 2007. With the newly filtered area in ArcMap, the selected layer is
exported as a new road shapefile.
The road data shapefiles contain data based on shapes. To convert the shapefiles
into a set of line segments a data transformation is necessary. The FWTools toolset first
converts the road shapefile into a more usable MapInfo Interchange Format (.mif)
(Warmerdam 2007). The MapInfo result contains the road segments, each segment
described by several points. These road segments represent a portion of the road with no
intersections and the points follow the actual curve of the segment. Only the first and
last points are kept by MINO as nodes with a corresponding road arc.
Additional data required for each road arc is available in the road shapefile and
can be accessed using the ArcMap Attribute Table for the specific shapefile. The length
of each road segment is extracted, as well as other data including the name of the road,
e.g. County Road A10, and type of road, e.g. A5 – Vehicular Trail. The road name is
informative for final analysis, and the road type is needed because certain roads cannot be
used by normal vehicles. In particular, a road designated as A5, “Vehicular Trail” is
usable only by four-wheel drive vehicles, and A7, “Road as Other Thoroughfare” is
usable only by bicyclists or pedestrians: these read types are deemed unusable in MINO
and omitted (U.S. Census Bureau 2001). For further Excel VBA processing, the
shapefile’s Attribute Table is exported and saved in dBase format (.dbf).
A VBA algorithm then processes the MapInfo file and dBase Attribute Table to
create the road arc list by start node, end node, distance, road name, and road type. To
further confine the road data to the working area and keep the dataset as small as
possible, the road data is more accurately filtered by lat/long. Another filter also deletes
any road of type A5 or A7. The resulting road-arc dataset contains essentially one-way
only roads. To ensure traffic can flow either way on the road arcs, all roads are assumed
to be two-way and a “reversed” copy of the arcs is added to the network during model

75
processing. (Internally, MINO uses a directed graph representation of the road network so
every undirected arc ( , )i j in MINOG must be represented by the directed arcs
( , ) and ( , )i j j i .) A final road node list from the arc set is also maintained for connecting
nodes that will represent population or ERS locations.
C. POPULATION MAPPING
Next, the human population is modeled and connected to the road network. From
the TIGER database, census population data is provided for small geographical areas,
referred to as “blocks.” Downloading census block data requires the same process used
for the road network: select counties and merge the county shapefiles into a single
shapefile. Again, using ArcMap the census data is filtered by the Select Features tool.
Since the population-processing algorithms place no restriction on the number of Census
blocks in the final shapefile, the lat/long filtering can be done with a VBA filter (instead
of using ArcMap).
Unlike the road network, the edges of the block shape cannot be transformed
directly into a population network. Each block is represented by a node placed at the
block’s center with all population in the block assigned to that “population node.” The
shape’s edge lat/long points are averaged to define a central population node that lies
within the shape.
Creating population nodes follows the same initial steps as the road-network
construction process. The merged shapefile for population census blocks is transformed
into a MapInfo file. The MapInfo file is imported into Excel, processed, and averaged to
create a set of population nodes. The actual population (number of people in a block
shape) is captured by joining the demographic data with the merged shapefile’s Attribute
Table. The population data is copied in with the set of population nodes and the
combined population set is filtered again. Some blocks contain no population, so nodes
are not created for these. Nodes are also more accurately filtered by lat/long using a
VBA algorithm. Next, population nodes containing five or fewer people are paired with
neighboring, larger population nodes to reduce the total number of MINO nodes. This

76
“neighbor-population filter” reduces the number of population nodes by about ten
percent.
Finally, the remaining set of population nodes must be connected to the road
network. A search procedure finds the two closest road nodes, from the road node list,
and arcs are created to these two nodes. To ensure these artificial arcs are not used to
transit the network, other than to get the population on the road network or emergency
responders to the population, a large distance penalty, C , is assigned to each one. The
penalty C was chosen to be larger than any possible route within the MINO area. For all
MINOs, 100.C =
D. EMERGENCY RESPONSE SYSTEM (ERS)
The ERS infrastructure data is provided by the National Geospatial-Intelligence
Agency (NGA) from the Homeland Security Infrastructure Program database (“HSIP”;
see NGA 2007). From the ERS data, locations are selected for two different ERS
categories in a CF area. The emergency-responder (ER) category includes Emergency
Medical Services (EMS), fire stations, and ambulance providers. The other category,
referred to as “hospitals” here, actually includes hospitals and ambulatory surgical
facilities.
These ERS data are provided as point shapefiles and locations are easily
converted into nodes for MINO. For model simplicity, static locations are assumed for
emergency-responders such as ambulance providers, which may normally preposition.
As with population nodes, arcs are created to ensure these services and facilities connect
to the road network for model analysis. These arcs are assigned actual distances,
however.

77
APPENDIX C: GOOGLE EARTH NETWORK DISPLAY
A method to graphical depict the multi-infrastructure network operations model
(MINO) is necessary to visually examine for accuracy and create results. At this point,
then Google Earth (GE) is the solution. While ArcMap is useful to display initial
shapefiles (ESRI 1998), after creating a MINO in Microsoft Excel with a standard arc set
and node list, the MINO network cannot easily translate back into shapefile format for
ArcMap display. Furthermore, ArcMap is not readily available for most DoD facilities
and a more portable solution is desirable. Google Earth provides a simple solution. It
encompasses an open-source set of tools than can quickly convert a standard network
dataset of arcs and nodes into a useful graphical depiction. GE’s built-in maps and other
data provide a background image to correlate MINO to the actual geographic area and
infrastructure.
Google Earth can display lines and points from a Keyhole Markup Language
(KML) formatted whose format is similar to the more common Extensible Markup
Language (XML). Generating a KML file from Excel requires a VBA macro to generate
either arcs as lines or nodes as icons. The KML format is outlined in detail at the
following Web site: http://code.google.com/apis/kml/documentation/index.html.
Node-name strings in MINO contain the node’s latitude and longitude (lat/long)
position in the network. For example, a road intersection or population group could be
represented as the node string: “38.036284 -84.674312”. With a single space between
the two coordinates, Excel functions parse the latitude and longitude double-precision
numerical values from the node name. The lat/long data along with the KML formatting
create a file that GE can display. The following example, which results from processing
that data for GE (Figure 33,) shows arc data in Excel and the KML file.
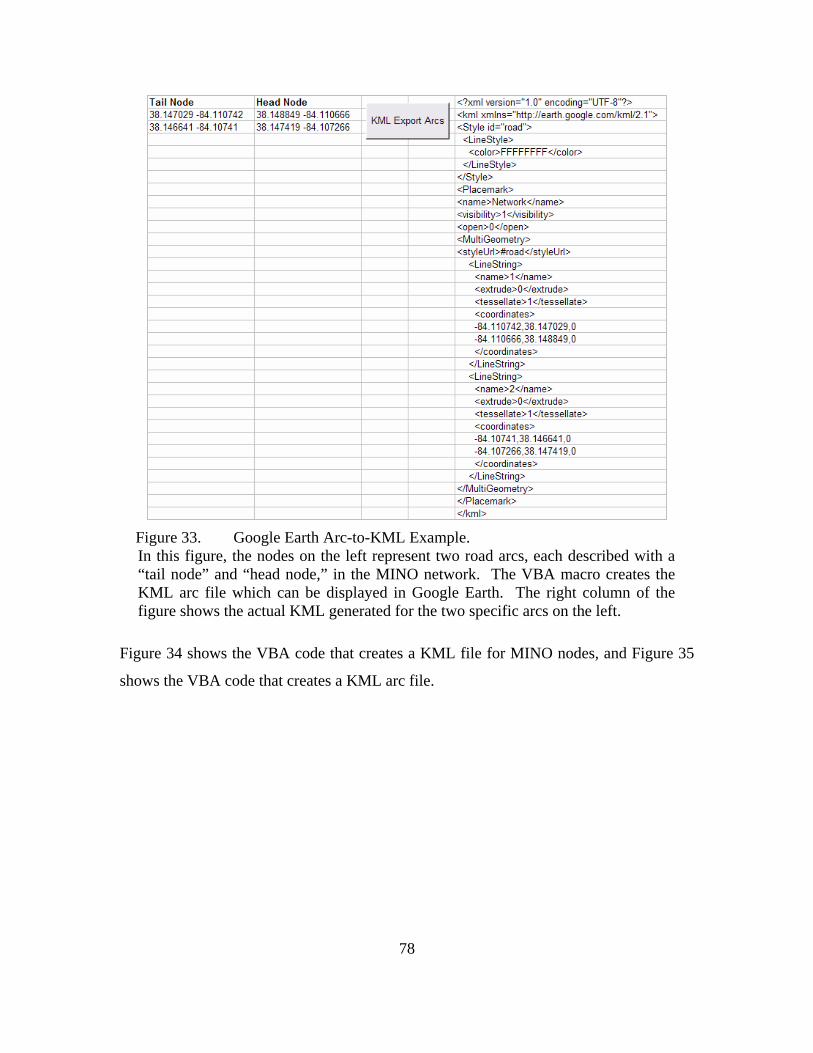
78
Figure 33. Google Earth Arc-to-KML Example. In this figure, the nodes on the left represent two road arcs, each described with a “tail node” and “head node,” in the MINO network. The VBA macro creates the KML arc file which can be displayed in Google Earth. The right column of the figure shows the actual KML generated for the two specific arcs on the left.
Figure 34 shows the VBA code that creates a KML file for MINO nodes, and Figure 35
shows the VBA code that creates a KML arc file.

79
Sub Nodes2KML() Dim rNodes As Range, FN As Integer, i As Long, j As Long Dim dLat As Double, dLong As Double Set rNodes = ActiveSheet.Range("I2", ActiveSheet.Range("I2").End(xlDown).End(xlToRight)) ChDrive Left$(ActiveWorkbook.path, 1) ChDir ActiveWorkbook.path FN = FreeFile() Open "nodes.kml" For Output As FN Print #FN, "<?xml version=""1.0"" encoding=""UTF-8""?>" Print #FN, "<kml xmlns=""http://earth.google.com/kml/2.1"">" Print #FN, "<Document>" For i = 1 To rNodes.Rows.Count Print #FN, "<Placemark>" Print #FN, " <name>i</name>" Print #FN, " <Point>" Print #FN, " <coordinates>" dLat = Latitude(rNodes(i, 1)) 'Latitude function dLong = Longitude(rNodes(i, 1)) 'Longitude function Print #FN, " " & dLong & "," & dLat & "," & 0 Print #FN, " </coordinates>" Print #FN, " </Point>" Print #FN, "</Placemark>" Next i Print #FN, "</Document>" Print #FN, "</kml>" Close FN End Sub
Figure 34. VBA Code Converting Nodes into Google Earth KML Files.

80
Sub Network2KML() Dim rArcs As Range, rNodes As Range, FN As Integer, i As Long, j As Long Dim dLat As Double, dLong As Double 'Sets range of arcs to convert to into KML Set rArcs = ActiveSheet.Range("A2", ActiveSheet.Range("A2").End(xlDown).End(xlToRight)) ChDrive Left$(ActiveWorkbook.path, 1) ChDir ActiveWorkbook.path FN = FreeFile() Open "network.kml" For Output As FN 'Output file name in same dir as Workbook Print #FN, "<?xml version=""1.0"" encoding=""UTF-8""?>" Print #FN, "<kml xmlns=""http://earth.google.com/kml/2.1"">" Print #FN, "<Style id=""road"">" 'Sets line color (white) Print #FN, " <LineStyle>" Print #FN, " <color>FFFFFFFF</color>" Print #FN, " </LineStyle>" Print #FN, "</Style>" Print #FN, "<Placemark>" Print #FN, "<name>Network</name>" Print #FN, "<visibility>1</visibility>" Print #FN, "<open>0</open>" Print #FN, "<MultiGeometry>" Print #FN, "<styleUrl>#road</styleUrl>" For i = 1 To rArcs.Rows.Count Print #FN, " <LineString>" Print #FN, " <name>" & i & "</name>" Print #FN, " <extrude>0</extrude>" Print #FN, " <tessellate>1</tessellate>" Print #FN, " <coordinates>" For j = 1 To 2 dLat = Latitude(rArcs(i, j)) 'Latitude function dLong = Longitude(rArcs(i, j)) 'Longitude function Print #FN, " " & dLong & "," & dLat & "," & 0 Next j Print #FN, " </coordinates>" Print #FN, " </LineString>" Next i Print #FN, "</MultiGeometry>" Print #FN, "</Placemark>" Print #FN, "</kml>" Close FN End Sub
Figure 35. VBA Code Converting Arcs into Google Earth KML Files.

81
LIST OF REFERENCES
Ahuja, R. K., Magnanti, T. L., and Orlin, J. B. (1993). Network Flows. Upper Saddle River, New Jersey: Prentice Hall.
Blue Grass Chemical Stockpile Outreach Office. (2006). Chemical Weapons
Destruction at Blue Grass (BGCAPP CWD). Department of the Army. (1990). Potential Military Chemical/Biological Agents and
Compounds (Army Field Manual No 3-9). Department of the Army. (2006). Chemical Agents and Munitions Destruction (Fiscal
Year 2007 Budget Estimate Submission). DTRA (2001). (Defense Threat Reduction Agency) Primer of Nuclear, Biological, and
Chemical Weapons and Effects (HPAC Version 4.0). DTRA (2004). (Defense Threat Reduction Agency) HPAC 4.04 Users Manual. DTRA (2007). (Defense Threat Reduction Agency) Research and Development
Enterprise, Assessment of Catastrophic Events Center (ACECenter). Retrieved April 5, 2007, from DTRA Link Web site: http://www.dtra.mil/rd/programs/acec/hpac.cfm.
Eisler, Peter (2006). Chemical weapons' disposal delayed. USA Today, Retrieved June
7, 2007, from http://www.usatoday.com/news/washington/2006-11-20-chemical-weapons_x.htm.
ESRI (1998). (Environmental Systems Research Institute, Inc.) ESRI Shapefile
Technical Description. ESRI (2007). (Environmental Systems Research Institute, Inc.) Download Census 2000
TIGER/Line Data. Retrieved Several Dates, from ESRI GIS and Mapping Software Web site: http://arcdata.esri.com/data/tiger2000/tiger_download.cfm.
Google Earth (2007). Retrieved May 6, 2007, Web site: http://earth.google.com. Google Maps (2007). Google Maps. Retrieved April 20, 2007, Web site:
http://maps.google.com. Google (2007). KML. Retrieved May 17, 2007, from Google Web site:
http://code.google.com/apis/kml/documentation/index.html.

82
Han, L., Yuan, F., Chin, S., and Hwang, H. (2006). Global Optimization of Emergency Evacuation Assignments. Interfaces. Vol. 36, pp. 502-513.
Li, Q., Yang, X., and Wei, H. (2006). Integrating Traffic Simulation Models with
Evacuation Planning System in A GIS Environment. Proceedings of the IEEE ITSC 2006. pp. 590-595.
Liu, Y., Zou, N., Chang, G. (2005). An integrated emergency evacuation system for
real-time operations – A case study of Ocean City, Maryland under hurricane attacks. Proceedings of the 8th International IEEE Conference on Intelligent Transportation Systems. pp. 281-286.
Mamda, S., Makino, K., and Fujishige, S. (2004).Evacuation Problems and Dynamic
Network Flows. SICE Annual Conference. pp. 530-535. National Geospatial-Intelligence Agency (NGA) (2007). Homeland Security
Infrastructure Program (HSIP) database. NOAA NCDC (1998). (NOAA, National Climatic Data Center) (1998). Climatic Wind
Data for the United States. Pueblo Chemical Agent-Destruction Pilot Plant (2006). Chemical Weapons Destruction
at U.S. Army Pueblo Chemical Depot (PCAPP Pueblo Overview). Schrank, D., and Lomax, T. (2005). The 2005 Urban Mobility Report. Texas
Transportation Institute, Texas A&M University System. U.S. Army Chemical Materials Agency (CMA) (2007a). Chemical Weapons
Convention Fact Sheet. U.S. Army Chemical Materials Agency (CMA) (2007b). Monthly Update : Deseret
Chemical Depot (May 15). U.S. Army Chemical Materials Agency (CMA) (2007c). Weekly Update : Anniston
Chemical Activity (March 12). U.S. Army Chemical Materials Agency (CMA) (2007d). Weekly Update : Newport
Chemical Depot (May 15). U.S. Army Chemical Materials Agency (CMA) (2007e). Weekly Update : Pine Bluff
Chemical Activity (Mar. 27 - Apr. 2). U.S. Army Chemical Materials Agency (CMA) (2007f). Weekly Update : Umatilla
Chemical Depot (May 17).
83
U.S. Army Chemical Stockpile Emergency Preparedness Program (2006). Chemical Stockpile Emergency Preparedness Program.
U.S. Army (2007a). U.S. Army Chemical Materials Agency (CMA) - Anniston, AL.
Retrieved April 10, 2007, Web site: http://www.cma.army.mil/anniston.aspx. U.S. Army (2007b). U.S. Army Chemical Materials Agency (CMA) – Newport, IN.
Retrieved April 10, 2007, Web site: http://www.cma.army.mil/newport.aspx. U.S. Army (2007c). U.S. Army Chemical Materials Agency (CMA) - Pine Bluff, AR.
Retrieved April 10, 2007, Web site: http://www.cma.army.mil/pinebluff.aspx. U.S. Army (2007d). U.S. Army Chemical Materials Agency (CMA) – Tooele, UT.
Retrieved April 10, 2007, Web site: http://www.cma.army.mil/tooele.aspx. U.S. Army (2007e). U.S. Army Chemical Materials Agency (CMA) – Umatilla, OR.
Retrieved April 10, 2007, Web site: http://www.cma.army.mil/umatilla.aspx U.S. Army (2007f). U.S. Army Chemical Materials Agency (CMA) – Utah. Retrieved
April 14, 2007, Web site: http://www.cma.army.mil/state.aspx?state=Utah. U.S. Army (2007g). U.S. Army Chemical Materials Agency (CMA) Web Site.
Retrieved June 6, 2007, Web site: http://www.cma.army.mil/. U.S. Census Bureau (2001). Redistricting Census 2000 Tiger/Line Files (Technical
Documentation). University of Texas at Austin School of Architecture, Community and Regional
Planning Program (2004). Working with 2000 Census Data in ArcGIS. Retrieved June 5, 2007, from Austin School of Architecture Web site: http://soa.utexas.edu/crp/gis/arcgis_tips/census2000/index.html.
VDS Technologies, GeoMerge - Merging Multiple Shapefiles into a Single File.
Retrieved March 2007, from VDS Technologies Web site: http://www.vdstech.com/geomerge.htm.
Walkenbach, John (2004). Excel 2003 Power Programming with VBA. Indianapolis,
IN: Wiley Publishing. Warmerdam, Frank (2007). FWTools: Open Source GIS/RS Binary Kit. Retrieved
March 2007, Web site: http://fwtools.maptools.org.

84
THIS PAGE INTENTIONALLY LEFT BLANK
85
INITIAL DISTRIBUTION LIST
1. Defense Technical Information Center Ft. Belvoir, Virginia
2. Dudley Knox Library Naval Postgraduate School Monterey, California
3. Robert Ensley NORTHCOM-NORAD J2 Colorado Springs, Colorado