NAVAL POSTGRADUATE SCHOOL · MASTERS OF BUSINESS ADMINISTRATION from the NAVAL POSTGRADUATE SCHOOL...
61
NAVAL POSTGRADUATE SCHOOL MONTEREY, CALIFORNIA THESIS Approved for public release; distribution is unlimited AN ANALYSIS OF CG-47 CRUISER CLASS OPERATING AND SUPPORT COSTS TRENDS AND COST RELATIONSHIP WITH PLATFORM AGE by Joseph R. McDonald June 2011 Thesis Co-Advisors: John Mutty Jeremy Arkes
-
Upload
truongdung -
Category
Documents
-
view
215 -
download
0
Transcript of NAVAL POSTGRADUATE SCHOOL · MASTERS OF BUSINESS ADMINISTRATION from the NAVAL POSTGRADUATE SCHOOL...

NAVAL
POSTGRADUATE SCHOOL
MONTEREY, CALIFORNIA
THESIS
Approved for public release; distribution is unlimited
AN ANALYSIS OF CG-47 CRUISER CLASS OPERATING AND SUPPORT COSTS TRENDS AND COST RELATIONSHIP WITH
PLATFORM AGE
by
Joseph R. McDonald
June 2011
Thesis Co-Advisors: John Mutty Jeremy Arkes

THIS PAGE INTENTIONALLY LEFT BLANK

i
REPORT DOCUMENTATION PAGE Form Approved OMB No. 0704-0188 Public reporting burden for this collection of information is estimated to average 1 hour per response, including the time for reviewing instruction, searching existing data sources, gathering and maintaining the data needed, and completing and reviewing the collection of information. Send comments regarding this burden estimate or any other aspect of this collection of information, including suggestions for reducing this burden, to Washington headquarters Services, Directorate for Information Operations and Reports, 1215 Jefferson Davis Highway, Suite 1204, Arlington, VA 22202-4302, and to the Office of Management and Budget, Paperwork Reduction Project (0704-0188) Washington DC 20503. 1. AGENCY USE ONLY (Leave blank)
2. REPORT DATE June 2011
3. REPORT TYPE AND DATES COVERED MBA Thesis
4. TITLE AND SUBTITLE An Analysis of CG-47 Cruiser Class Operating and Support Costs Trends and Cost Relationship with Platform Age 6. AUTHOR(S) Joseph R. McDonald
5. FUNDING NUMBERS
7. PERFORMING ORGANIZATION NAME(S) AND ADDRESS(ES) Naval Postgraduate School Monterey, CA 93943-5000
8. PERFORMING ORGANIZATION REPORT NUMBER
9. SPONSORING /MONITORING AGENCY NAME(S) AND ADDRESS(ES) N/A
10. SPONSORING/MONITORING AGENCY REPORT NUMBER
11. SUPPLEMENTARY NOTES The views expressed in this thesis are those of the author and do not reflect the official policy or position of the Department of Defense or the U.S. Government. IRB Protocol number ___N/A_____________.
12a. DISTRIBUTION / AVAILABILITY STATEMENT Approved for public release; distribution is unlimited
12b. DISTRIBUTION CODE A
13. ABSTRACT (maximum 200 words) The purpose of this research is to identify trends in CG-47 Operating and Support (O&S) costs and determine if costs, specifically maintenance costs, are increasing as the platforms in the ship class age. O&S data from FY1987 to FY2010 supplied by the Naval Center for Cost Analysis were used to analyze trends and create statistical models for analyzing the relationship between cost and age. This thesis is intended to supplement a similar statistical analysis performed by the Institute for Defense Analysis (IDA) which analyzed CG-47 O&S costs from FY1984 to FY1999 and found no significant relationship between costs and age. Additionally, concerns in the Navy’s current surface fleet force-structure plans will be summarized and analyzed to establish relevance and background. Analysis of O&S cost data in this thesis yielded results that differed from the 2002 IDA report, and showed a statistically significant relationship between platform age and maintenance costs. This analysis is intended to aid in future naval leadership decisions on how best to achieve the desired force structure of the fleet. Conclusions drawn from this thesis will contribute relevant cost prediction insight that could greatly impact future decisions between extending the life of active surface combatants versus developing and procuring new ships. Predictions of future maintenance funding requirements drawn from this thesis can be incorporated into ship service-life decisions and potentially improve cost forecast accuracy and legitimacy.
15. NUMBER OF PAGES
61
14. SUBJECT TERMS CG-47, Cruiser, Ticonderoga, Operating and Support, Maintenance, Platform Age
16. PRICE CODE
17. SECURITY CLASSIFICATION OF REPORT
Unclassified
18. SECURITY CLASSIFICATION OF THIS PAGE
Unclassified
19. SECURITY CLASSIFICATION OF ABSTRACT
Unclassified
20. LIMITATION OF ABSTRACT
UU NSN 7540-01-280-5500 Standard Form 298 (Rev. 2-89) Prescribed by ANSI Std. 239-18
ii
THIS PAGE INTENTIONALLY LEFT BLANK

iii
Approved for public release; distribution is unlimited
AN ANALYSIS OF CG-47 CRUISER CLASS OPERATING AND SUPPORT COSTS TRENDS AND COST RELATIONSHIP WITH PLATFORM AGE
Joseph R. McDonald Lieutenant, United States Navy
B.S., SUNY Maritime College, 2006
Submitted in partial fulfillment of the requirements for the degree of
MASTERS OF BUSINESS ADMINISTRATION
from the
NAVAL POSTGRADUATE SCHOOL June 2011
Author: Joseph R. McDonald
Approved by: John E. Mutty, Captain, USN (Ret) Thesis Co-Advisor
Jeremy A. Arkes, PhD Thesis Co-Advisor
William R. Gates, PhD Dean, Graduate School of Business and Public Policy

iv
THIS PAGE INTENTIONALLY LEFT BLANK

v
ABSTRACT
The purpose of this research is to identify trends in CG-47 Operating and Support (O&S)
costs and determine if costs, specifically maintenance costs, are increasing as the
platforms in the ship class age. O&S data from FY1987 to FY2010 supplied by the Naval
Center for Cost Analysis were used to analyze trends and create statistical models for
analyzing the relationship between cost and age. This thesis is intended to supplement a
similar statistical analysis performed by the Institute for Defense Analysis (IDA), which
analyzed CG-47 O&S costs from FY1984 to FY1999 and found no significant
relationship between costs and age. Additionally, concerns in the Navy’s current surface
fleet force-structure plans will be summarized and analyzed to establish relevance and
background.
Analysis of O&S cost data in this thesis yielded results that differed from the
2002 IDA report, and showed a statistically significant relationship between platform age
and maintenance costs.
This analysis is intended to aid in future naval leadership decisions on how best to
achieve the desired force structure of the fleet. Conclusions drawn from this thesis will
contribute relevant cost prediction insight that could greatly impact future decisions
between extending the life of active surface combatants versus developing and procuring
new ships. Predictions of future maintenance funding requirements drawn from this
thesis can be incorporated into ship service-life decisions and potentially improve cost
forecast accuracy and legitimacy.

vi
THIS PAGE INTENTIONALLY LEFT BLANK
vii
TABLE OF CONTENTS
I. INTRODUCTION........................................................................................................1 A. BACKGROUND ..............................................................................................2
1. U.S. Navy Force Structure Vision ......................................................3 2. Literature and Context........................................................................5
II. DATA ANALYSIS .....................................................................................................13 A. COLLECTION AND ANALYSIS METHOD ............................................13
1. O&S Cost Data Collection.................................................................13 2. Plan of Analysis ..................................................................................13
B. HISTORICAL TREND ANALYSIS............................................................15 1. Consolidated CG-47 O&S Cost Trend Analysis .............................15 2. Personnel Cost Trend Analysis.........................................................16 3. Petroleum Oil and Lubricants (POL) Trend Analysis ...................18 4. Ammunition Cost Trend Analysis....................................................20 5. Maintenance Cost Trend Analysis ...................................................21
C. REGRESSION ANALYSIS ..........................................................................27 1. Regression Introduction ....................................................................27 2. Regression Model Statistical Results Summary..............................28 3. Scheduled Depot-Level Maintenance Cost Regression Analysis ...29 4. Unscheduled Depot-Level Maintenance Cost Regression
Analysis ...............................................................................................31 5. Modernization Cost Regression Analysis ........................................32 6. Intermediate Maintenance Cost Regression Analysis ....................35 7. Other Maintenance Cost Regression Analysis ................................36
III. SUMMARY AND CONCLUSION ..........................................................................37 A. SUMMARY OF FINDINGS .........................................................................37 B. CONCLUSION ..............................................................................................38
LIST OF REFERENCES......................................................................................................41
INITIAL DISTRIBUTION LIST .........................................................................................43

viii
THIS PAGE INTENTIONALLY LEFT BLANK

ix
LIST OF FIGURES
Figure 1. Navy and CBO estimated funding requirements and Navy Projected surface force levels based on the Navy’s Fiscal Year 2011 Shipbuilding Plan. ...................................................................................................................9
Figure 2. Average Annual O&S Cost per Ship & Average CG-47 Cruiser Age ............15 Figure 3. Average Annual Personnel Cost per Ship & Average Number of Personnel
Assigned...........................................................................................................16 Figure 4. Average Annual Personnel Cost per Ship & Average Cost per Person...........18 Figure 5. Average Annual POL Cost per Ship & Average Annual Steaming Hours......19 Figure 6. Average Annual POL Cost per Ship versus Inflation Adjusted Crude Oil
Price per Barrel ................................................................................................20 Figure 7. Average Annual Replacement Ammunition Cost per Ship .............................21 Figure 8. Average Annual Maintenance Cost per Ship and Average Annual Depot-
Level Maintenance Man-Days per Ship ..........................................................22 Figure 9. Average Annual Depot-Level Maintenance Cost per Ship and Average
Annual Depot Man-Days per Ship...................................................................24 Figure 10. Average Annual Scheduled Depot-Level Maintenance Cost per Ship............25 Figure 11. Average Annual Un-Scheduled Depot-Level Maintenance Cost per Ship......25 Figure 12. Average annual modernization cost per ship ...................................................26 Figure 13. Estimated Platform Age Relationship to Average Annual Scheduled
Depot-Level Maintenance Cost per Ship.........................................................30 Figure 14. Estimated Platform Age Relationship to Average Annual Un-Scheduled
Depot-Level Maintenance Cost per Ship.........................................................31 Figure 15. Estimated Platform Age Relationship to Average Annual Modernization
Cost per Ship....................................................................................................32 Figure 16. Simple regression model showing Estimated Platform Age Relationship to
Average Annual Modernization Cost per Ship................................................34 Figure 17. Estimated Platform Age Relationship to Average Annual Intermediate-
Level Maintenance Cost per Ship ....................................................................35 Figure 18. Estimated Platform Age Relationship to Average Annual Other
Maintenance Cost per Ship ..............................................................................36

x
THIS PAGE INTENTIONALLY LEFT BLANK

xi
LIST OF TABLES
Table 1. Average Annual O&S cost per ship, 1987–2010.............................................14 Table 2. Regression Model Statistical Results...............................................................28

xii
THIS PAGE INTENTIONALLY LEFT BLANK

xiii
LIST OF ACRONYMS AND ABBREVIATIONS
CG-47 Ticonderoga Class Guided Missile Cruiser
CG(X) Guided Missile Cruiser (X denotes a hull number not yet assigned)
O&S Operating and Support
FY Fiscal Year
IDA Institute for Defense Analysis
USS United States Ship
CBO Congressional Budget Office
CRS Congressional Research Service
DON Department of the Navy
LCS Littoral Combat Ship
FYDP Future Years Defense Plan
NCCA Naval Center for Cost Analysis
VAMOSC Visibility and Management of Operating and Support Costs
DON Department of the Navy
DDG-51 Arleigh Burke Class Guided Missile Destroyer
JIC Joint Inflation Calculator
OPN Other Procurement, Navy
OM&N Operations and Maintenance, Navy
MPN Military Personnel, Navy
SCN Ship Construction, Navy
POL Petroleum Oil and Lubricants
OPNAV Office of the Chief of Naval Operations
CNO Chief of Naval Operations
TYCOM Type Commander
OPTEMPO Operational Tempo

xiv
THIS PAGE INTENTIONALLY LEFT BLANK

xv
ACKNOWLEDGMENTS
This thesis would not have been possible without the continuous encouragement
and grammatical advice of my beautiful wife Veronica. Also, special thanks to my
advisors, and to those professors both inside and outside the business school who came to
my aid when I needed them. Lastly, thanks to all my friends and classmates at NPS for
all the good conversations and camaraderie.

xvi
THIS PAGE INTENTIONALLY LEFT BLANK

1
I. INTRODUCTION
Is there a relationship between the age of a ship and the amount of money that
must be spent to maintain it at a desired level of material and operational readiness?
With the U.S. Navy’s plans to extend the service life of CG-47 class cruisers, and cancel
the development of its new cruiser CG(X), a closer look at costs associated with the aging
fleet of cruisers is needed to establish trends and better predict future costs for the ship
class (Director, Warfare Integration, 2010). This thesis will serve as an analysis of CG-
47 Operating and Support (O&S) costs from Fiscal Year (FY) 1987 to FY2010. It is
aimed at aiding in future naval leadership decisions between extending the life of active
surface combatants and developing and procuring new ships.
The trade-off decision between building new ships and extending ship service
lives is significant given that a relatively small service life increase can have a substantial
impact on procurement budgeting and force structure planning (Koenig, Nalchajian, &
Hootman, 2009). While the scope of this analysis is limited to trend analysis of average
cost per year in specific O&S categories from the CG-47 class, any correlation
established between platform age and cost is intended to serve as a catalyst for future,
more detailed analysis analogously applicable to multiple ship classes.
In 2002, the Institute for Defense Analysis (IDA) published a report looking for
what effect, if any, age had on the Operating and Support (O&S) costs of the CG-47
class. Using O&S cost data from 1984 to 1999, IDA found that “the O&S costs of the
CG-47 fail to show the consistent rise in age that we would expect” (Devers & Levine,
2002, p. I-2)1. One potential explanation for the lack of correlation between O&S costs
and ship age offered in the report was, “the question of whether CG-47s might still be too
young for age to have taken its toll, and that the older naval surface combatants might
show a consistent upward trend” (Devers et al., p. I-3). This theory that the CG-47 class
might have been collectively “too young” during the analysis period ending in 1999 has
1 The IDA report, Effect of Age on Operating and Support Costs of CG-47 Class Cruisers, used O&S
costs beginning in 1984, which was the first complete fiscal year for the CG-47 Class Cruiser (Devers & Levine).

2
merit since the oldest ship of the class of 27 ships had only 14 years of service at the
time2 of the report. In 2010, 22 of the original 27-ship CG-47 class remained in service
with an expected service life of 35 years or more (Director, Warfare Integration, 2010)3.
The oldest ship of the 22 cruisers that remain active, USS Bunker Hill (CG-52), was
commissioned in September of 1986, and has now been in service for 24 years. With ten
more years added to the collective age of the CG-47 fleet since the IDA report in March
of 2002, an analysis of subsequent O&S cost data is relevant to establish whether a link
between the collective age of the ship class and costs trends exists now, where none
existed in previous analysis.
A. BACKGROUND
The United States Navy has enjoyed virtually uncontested supremacy in the
world’s oceans since World War II. Recent fiscal constraints, however, may pose a
greater threat to U.S. sea power than any potential enemy. To maintain naval
effectiveness amid budgetary constrictions, the Navy has been forced to balance the
ability to build advanced new ships with a need to depend on currently-active platforms
to survive until the bitter end of their expected service lives. Will the Navy’s decision to
operate combat ships longer bring a requirement for increased maintenance funding in
order to maintain effectiveness? While both new ship development and the sustainment
of existing platforms impact Navy budget decisions, the extent to which that impact
might limit future naval capabilities warrants investigation.
Given the availability of information and analysis from government
organizations—such as the Institute for Defense Analysis (IDA), the Congressional
Budget Office (CBO), and the Congressional Research Service (CRS)—on the
implications of fleet modernization versus fleet development, the need to summarize
general concerns between analysts is apparent; additionally, establishing trends in
potential risks associated with the Navy’s most current plan may be significant in aiding
2 The first ship of the class, USS TICONDEROGA (CG-47), was commissioned on 22 January 1983
(Surface Warfare Directorate N76, 2009). 3 The first five ships of the CG-47 class, CG-47 through CG 51, were decommissioned between
August 2004 and December 2005 (Surface Warfare Directorate N76).

3
future force structure decisions. A need exists to also determine what financial
implications could result from operating a ship class beyond the historically reasonable
service life. Can operating costs, maintenance costs, and the cost of modernization
(required to keep an aging ship relevant), be expected to continually increase over time?
The challenge of creating a naval force structure that is both affordable and
capable of filling the roles required to implement national policy has been a continuous
trade-off between efficiency and effectiveness. U.S. Navy leaders are charged with
making decisions on how best to structure naval forces to ensure national policy can be
carried out. Among these decisions is the choice between funding new surface combatant
development/procurement and obligating scarce Navy funds to the continuous
rejuvenation of existing ships.
1. U.S. Navy Force Structure Vision
Each year, the Navy submits a plan to Congress outlining future force structure
and shipbuilding requirements. The most recent plan, entitled Report to Congress on
Annual Long-Range Plan for Construction of Naval Vessels for FY2011, outlines the
Navy’s vision of the surface fleet over a period of 30 years. Given the longsighted nature
of the plan, accurate predictions in the distant future are based more on speculation than
fact. In order to add accuracy, the plan is separated into three separate time periods: “the
near term period 2011 through 2020,” which was created with the most accurate
estimates of requirements and costs; the “mid-term requirements projected for 2021 to
2030,” which is less precise than the near-term, and was put together using estimates of
future ship types planned for construction; and “the far-term requirements period, from
2031 to 2040,” which is the least accurate portion of the plan, and is anticipated to change
based on the outcome of the first two sections of the timeline (O'Rourke, Navy Force
Structure and Shipbuilding Plans: Background Issues for Congress, 2010, p. 4).
CBO and CRS experts have analyzed the Navy’s current shipbuilding plan and
released several documents aimed at determining how ship development costs,
procurement costs, and the cost to modernize existing ships will impact future naval force
structure, and the Navy’s budget. Additionally, IDA analysts have produced a report

4
intended to determine if an upward trend exists in Operating and Support (O&S) funding
required for operating and maintaining ships over time. Whether building new ships or
upgrading and extending the life of older ships, budget impact analysis is required to
ensure that the best fiscal decision is mated with the most effective means of maintaining
naval supremacy throughout the world.
In the FY2011 shipbuilding plan, Navy leaders opted to extend the service life of
Aegis cruisers and destroyers4 and terminate the development of the CG(X) future cruiser
class. The motivation to execute this change of direction in the Navy’s shipbuilding plan
was likely due to budgetary pressures recently introduced by Secretary of Defense Gates’
campaign to limit budgetary growth within the Department of Defense. In a 2010 report
to Congress, CRS quoted a Navy statement justifying the cancellation of the CG(X)
program as “driven by affordability considerations” (O'Rourke, Navy CG(X) Cruiser
Program: Background for Congress, p. 4). Understandably, Navy leaders face a difficult
challenge in creating long-range budgeting plans based on estimations and predictions of
what capabilities will be required onboard ships thirty years in the future. Accurate
budget predictions become even more difficult with the addition of potential error
introduced by fluctuations in labor and material costs over time.
The Navy has based its future surface force composition on the assumption that
ships will remain serviceable and relevant until they reach the end of their 35-40 year
expected service lives. Older platforms, such as the CG-47 class, will ostensibly require
an increase in funding to cover the maintenance and modernization costs needed to keep
the cruiser class operationally relevant, both technologically and mechanically. The
potential for problems associated with retrofitting new technology onto older platforms
that have neither the space nor the support infrastructure to support the additions seems
intuitive; however, financial pressures can drive decisions that force leaders to take
calculated risks in order to accept budget constriction in one area that can be used to
bolster others.
4 CG-47 Ticonderoga class cruisers and DDG-51 Arleigh Burke class destroyers, equipped with the
Navy’s Aegis Combat Systems Suite are referred to as Aegis cruisers and destroyers after the shield of Zeus in ancient Greek mythology (O'Rourke, Navy Aegis Cruiser and Destroyer Modernization: Background and Issues for Congress, 2010).
5
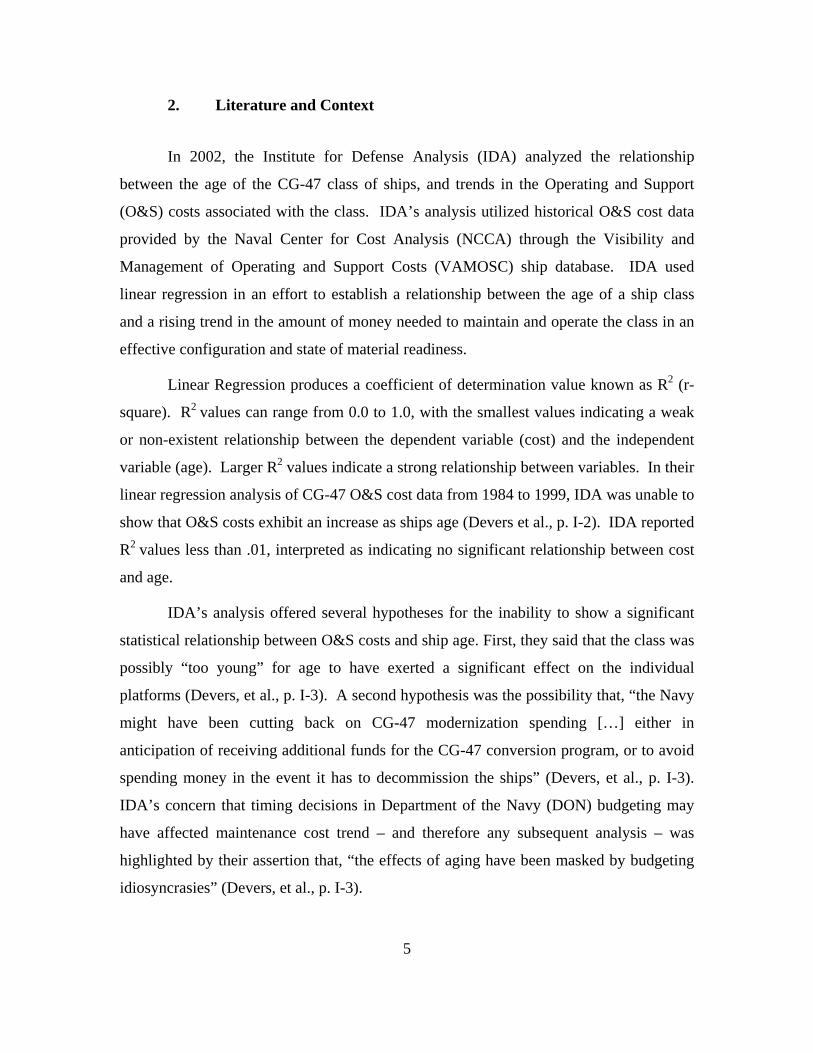
2. Literature and Context
In 2002, the Institute for Defense Analysis (IDA) analyzed the relationship
between the age of the CG-47 class of ships, and trends in the Operating and Support
(O&S) costs associated with the class. IDA’s analysis utilized historical O&S cost data
provided by the Naval Center for Cost Analysis (NCCA) through the Visibility and
Management of Operating and Support Costs (VAMOSC) ship database. IDA used
linear regression in an effort to establish a relationship between the age of a ship class
and a rising trend in the amount of money needed to maintain and operate the class in an
effective configuration and state of material readiness.
Linear Regression produces a coefficient of determination value known as R2 (r-
square). R2 values can range from 0.0 to 1.0, with the smallest values indicating a weak
or non-existent relationship between the dependent variable (cost) and the independent
variable (age). Larger R2 values indicate a strong relationship between variables. In their
linear regression analysis of CG-47 O&S cost data from 1984 to 1999, IDA was unable to
show that O&S costs exhibit an increase as ships age (Devers et al., p. I-2). IDA reported
R2 values less than .01, interpreted as indicating no significant relationship between cost
and age.
IDA’s analysis offered several hypotheses for the inability to show a significant
statistical relationship between O&S costs and ship age. First, they said that the class was
possibly “too young” for age to have exerted a significant effect on the individual
platforms (Devers, et al., p. I-3). A second hypothesis was the possibility that, “the Navy
might have been cutting back on CG-47 modernization spending […] either in
anticipation of receiving additional funds for the CG-47 conversion program, or to avoid
spending money in the event it has to decommission the ships” (Devers, et al., p. I-3).
IDA’s concern that timing decisions in Department of the Navy (DON) budgeting may
have affected maintenance cost trend – and therefore any subsequent analysis – was
highlighted by their assertion that, “the effects of aging have been masked by budgeting
idiosyncrasies” (Devers, et al., p. I-3).

6
The Navy’s ability to hold money in anticipation of additional funding, or to fund
modernization projects with procurement appropriations (rather than O&S), could serve
to mask trends in funding requirements for maintenance and modernization that might
otherwise be present if funding data were more readily traceable amongst multiple
appropriation categories. DON funds that might otherwise be used in the development
and procurement of new ship platforms, like the CG(X), could be reprogrammed and
absorbed into program funding needed for modernization.
CBO analysis of the Navy’s latest 30-year shipbuilding plan highlighted a specific
example of idiosyncrasies in budgeting. CBO analysts noticed that the Navy budgeted
$9.4 billion for the procurement of 15 Littoral Combat Ships (LCS) over the current
Future Years Defense Plan (FYDP); however, with Congressional limits on LCS
procurement set at $480 million per ship, the Navy would not be able to spend more than
$7.8 billion5 for 15 LCS platforms (Labs, pp. 10-11).
Any estimates of future funding requirements will depend heavily on the
assumptions included in calculations. Variation in assumptions for future costs can cause
disparity between independent estimates of future costs associated with the same project;
which was the case in the CBO analysis of the Navy’s 2011 shipbuilding plan. The
Navy’s 30-year plan estimates the need for average annual funding of $15.9 billion6 to
build the desired 313-ship fleet (Congressional Budget Office, 2010, p. 6). CBO
analysis, based on independent assumptions, generated estimates of annual funding
requirements needed to achieve the Navy’s force structure goals at $19 billion
(Congressional Budget Office, p. 6). This disparity between estimates is representative
of the effect assumptions play in long-range planning. The CBO estimate is nearly 20%
higher than that of the Navy.
CBO also indicated that the Navy’s planned annual ship procurement numbers
may not be sufficient, or even realistic, to achieve the desired end state of 313 ships.
CBO noted that, in a departure from previous plans, the Navy’s 2011 long-range
5 Amount adjusted for annual inflation. 6 Monetary amounts are reported in 2010 dollars, unless otherwise noted.
7
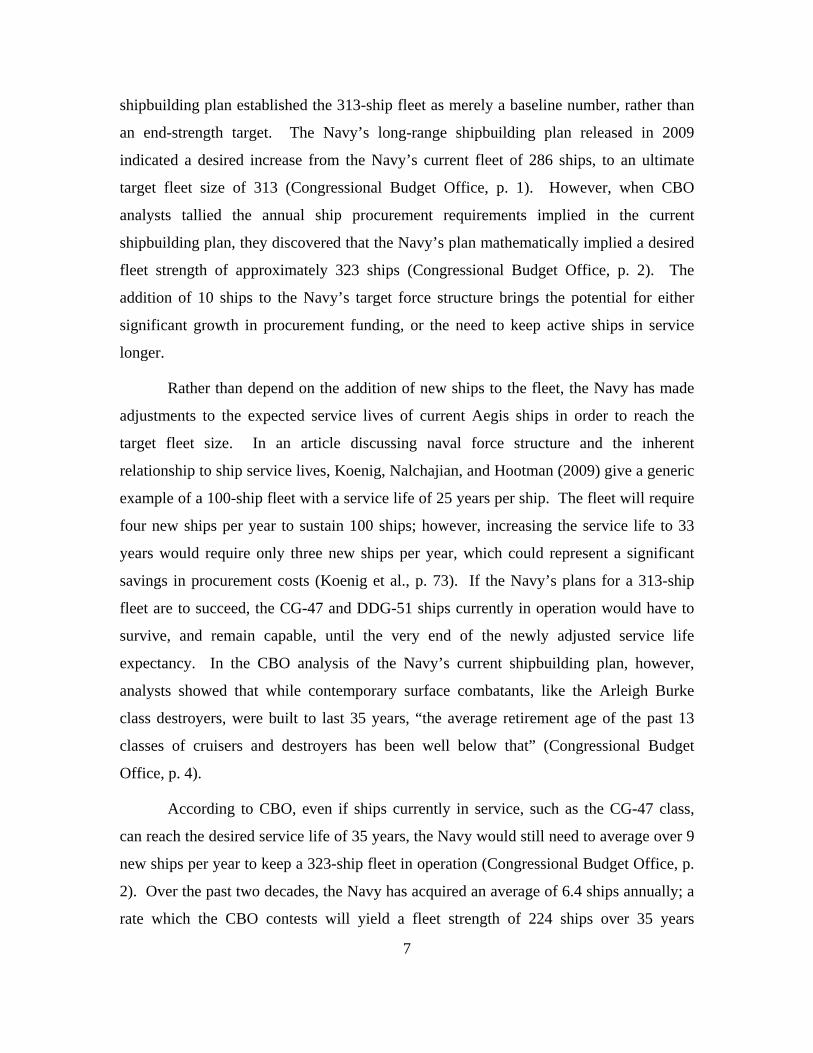
shipbuilding plan established the 313-ship fleet as merely a baseline number, rather than
an end-strength target. The Navy’s long-range shipbuilding plan released in 2009
indicated a desired increase from the Navy’s current fleet of 286 ships, to an ultimate
target fleet size of 313 (Congressional Budget Office, p. 1). However, when CBO
analysts tallied the annual ship procurement requirements implied in the current
shipbuilding plan, they discovered that the Navy’s plan mathematically implied a desired
fleet strength of approximately 323 ships (Congressional Budget Office, p. 2). The
addition of 10 ships to the Navy’s target force structure brings the potential for either
significant growth in procurement funding, or the need to keep active ships in service
longer.
Rather than depend on the addition of new ships to the fleet, the Navy has made
adjustments to the expected service lives of current Aegis ships in order to reach the
target fleet size. In an article discussing naval force structure and the inherent
relationship to ship service lives, Koenig, Nalchajian, and Hootman (2009) give a generic
example of a 100-ship fleet with a service life of 25 years per ship. The fleet will require
four new ships per year to sustain 100 ships; however, increasing the service life to 33
years would require only three new ships per year, which could represent a significant
savings in procurement costs (Koenig et al., p. 73). If the Navy’s plans for a 313-ship
fleet are to succeed, the CG-47 and DDG-51 ships currently in operation would have to
survive, and remain capable, until the very end of the newly adjusted service life
expectancy. In the CBO analysis of the Navy’s current shipbuilding plan, however,
analysts showed that while contemporary surface combatants, like the Arleigh Burke
class destroyers, were built to last 35 years, “the average retirement age of the past 13
classes of cruisers and destroyers has been well below that” (Congressional Budget
Office, p. 4).
According to CBO, even if ships currently in service, such as the CG-47 class,
can reach the desired service life of 35 years, the Navy would still need to average over 9
new ships per year to keep a 323-ship fleet in operation (Congressional Budget Office, p.
2). Over the past two decades, the Navy has acquired an average of 6.4 ships annually; a
rate which the CBO contests will yield a fleet strength of 224 ships over 35 years

8
(Congressional Budget Office, p. 2). The difference between CBO and Navy estimates is
even more troubling given that, historically, Navy cruisers and destroyers “have been
retired after 25 years of service or less” (Congressional Budget Office, p. 4). The
historical service life of 25 years calls into question the Navy’s decision to base the
ability to achieve a 313-ship fleet on cruisers and destroyers lasting well beyond 30 years.
In his testimony before Congress on January 20, 2010, CBO Senior Analyst Eric
Labs used Under Secretary of the Navy Robert O. Work’s statement that the Navy “can
do what we need on $15 billion a year,” to help determine how the Navy’s ship inventory
would be affected by future budget constraints. When comparing the required annual
funding to execute the Navy’s 30-year shipbuilding plan, CBO used per-ship estimates of
$2.1 billion (used in the 2010 defense appropriation), $2.5 billion (used by the Navy in
2009 estimates), and $2.7 billion (used by CBO in 2009 estimates) (Labs, 2010, p. 7).
Using a $15 billion annual budget estimate, coupled with the an estimated cost per ship of
$2.1 to $2.7 billion, Labs determined that, “with those annual budget levels and average
ship costs, the size of the Navy’s fleet would decline over the next three decades from
287 ships to between 170 and 240” (Labs, pp. 5–7). CBO calculations also relied on the
assumption that currently-active ships would achieve the 35-year service life anticipated
by Navy leaders. The goal of the Navy is to grow to a 313-ship fleet and then achieve a
steady-state, defined by Labs as “the average number of ships that would have to be
purchased each year to keep the fleet at a given size, […] equals that steady-state force
size divided by the stated service life of a ship” (Labs, p. 5). According to Labs, the
Navy would have to acquire nearly 10 new ships per year to achieve a steady state with a
313-ship inventory.
Figure 1 illustrates the projected force levels, or number of ships, taken from the
Navy’s long-range shipbuilding plan, along with the disparity in Navy funding estimates
versus estimates made by CRS analysts (O'Rourke, Navy Force Structure and
Shipbuilding Plans: Background Issues for Congress, 2010, pp. 6–7).

9
Figure 1. Navy and CBO estimated funding requirements and Navy Projected surface force levels based on the Navy’s Fiscal Year 2011
Shipbuilding Plan.
The Navy’s plan will grow the fleet from its current strength of 285 ships to 315
ships by FY2020 (Director, Warfare Integration, p. 9). After FY2020, the fleet will
continue to grow until it peaks in size, at 320 ships, in FY2024 (Director, Warfare
Integration, p. 9). After peaking, the fleet will diminish steadily until the end of the 30-
year shipbuilding plan, with a low in FY2032 of 288 ships, and a total of 301 ships in
FY2040 (Director, Warfare Integration, p. 9). The trend in force strength is a
representation of the Navy’s phased plan, which CBO concluded would “enable the Navy
to reach its earlier 313-ship goal by 2020” (Congressional Budget Office, p. 2). After the
near-term, however, the plan shows less promise, with the fleet staying above the 313-
ship baseline for only seven years before beginning to decline. CBO’s report also added
that the Navy’s plan “would never achieve its implied goal of 322 or 323 ships”
(Congressional Budget Office, p. 2). Adding to the capricious nature of out-year

10
estimates is the fact that labor and material costs have historically grown at a faster rate
than the overall economy (Congressional Budget Office, p. VIII). Couple volatile labor
and material costs with the unpredictability of future requirements and availability of
funding, and the ability to predict force structure beyond the near term becomes
increasingly more challenging.
The alternative to simply purchasing the number of new ships necessary to attain
the goal of 313 ships, is to embark on a project to modernize existing platforms in an
effort to ensure they reach their full service life potential. On the surface, rejuvenating
existing ships rather than spending over $2 billion per ship to replace them, seems like a
quick and inexpensive way to achieve a 313-ship fleet. Seemingly, the Navy has
determined this route to be the most affordable option, given budget constraints. The
Navy’s FY2010 budget submission to Congress proposed cancelling the FY2009 plan for
building 19 CG(X) future cruisers intended to replace the aging CG-47 class (O'Rourke,
Navy DDG-51 and DDG-1000 Destroyer Programs: Background and Issues for
Congress, 2010, p. 7). Additionally, the Navy’s plan to build as many as 24 new ships
under the DDG-1000 program has been abridged to a total procurement of three ships for
the entire class (Congressional Budget Office, p. 17).
The Navy’s approach to attaining a 313-ship force has changed course since the
last shipbuilding plan was submitted to Congress in 2009. The development of new ship
classes will be subordinate to modernizing and sustaining existing ships, coupled with the
procurement of new DDG-51 class destroyers (O'Rourke, Navy Aegis Cruiser and
Destroyer Modernization: Background and Issues for Congress, pp. 1–2). The
procurement of new DDG-51 Aegis destroyers was ended in 2005 at a time when new
platforms were anticipated to become available for replacement (O'Rourke, pp. 1–2). By
re-starting the proven DDG-51 program in 2010, the Navy likely gained the ability to
predict future procurement costs with greater certainty.
In the near term, the Navy plans to keep the 62 existing DDG-51 class ships in
service beyond their originally-intended 35-year service life, by adding the destroyer
class to the CG-47 cruiser class in their modernization plan (O'Rourke, p. 2). The
adjusted service life expectancy for DDG-51 class destroyers is now an impressive 40
11
years (O'Rourke, p. 2). In addition to potential savings gained by avoiding new ship
development, the Navy’s plan to modernize 22 CG-47 class cruisers and 62 DDG-51
class destroyers may prove to be a cost-effective means of expanding the size of the
current fleet, with total program costs estimates at $16.6 billion (O'Rourke, 2010, p. 1).

12
THIS PAGE INTENTIONALLY LEFT BLANK

13
II. DATA ANALYSIS
A. COLLECTION AND ANALYSIS METHOD
1. O&S Cost Data Collection
This analysis utilizes O&S cost data supplied by the Naval Center for Cost
Analysis (NCCA) Visibility and Management of Operating and Support Costs
(VAMOSC) ship database. The data span from FY1987, when the oldest cruiser in this
analysis was first operational, to the most recent year for which complete data were
available, FY2010. Total O&S cost is comprised of several individual categories
including personnel, maintenance, repair parts, supplies, and fuel costs which were
combined for the 22 ships in the CG-47 class to produce average annual O&S costs per
ship in order to establish historical trends. Additionally, NCCA VAMOSC was able to
provide annual values for steaming hours, personnel assigned, and maintenance hours for
each ship in the class. All dollar values have been normalized to FY2010 dollar values
using the current (Jan 2010) Joint Inflation Calculator (JIC) provided by the NCCA.
O&S sub-categories for maintenance were further disaggregated into individual
costs for scheduled and unscheduled depot-level maintenance, intermediate maintenance,
and maintenance costs directly attributable to modernization. The detailed maintenance
cost data provided for statistical regression analysis, and enabled the development of
more accurate cost estimation relationship (CER) development.
2. Plan of Analysis
This analysis is intended to provide a fresh look at CG-47 historical O&S costs,
while maintaining continuity and comparability with the 2002 IDA report on O&S cost
data for CG-47 class cruisers from FY1984 to FY1999. Annual class averages in each
sub-category of O&S were analyzed individually using historical trend analysis.
Additionally, average annual O&S cost and average annual maintenance costs per ship
trends were analyzed further using statistical analysis (linear regression) to determine

14
what fraction of the variation in cost, if any, could be explained by the variation in the
age of the ship. In order to maintain consistency throughout the chosen period, only the
22 remaining CG-47 class cruiser statistics were included in the analysis. While the first
five hulls, CG-47 through CG-51, were in service for the first half of the decade,
inclusion of their data would greatly disrupt consistency in the analysis. To aid in direct
comparison, all dollar values are reported in constant 2010 dollars in both analysis and
graphs.
Table 1 is a summary of average O&S cost per ship over the entire period of
analysis from FY1987 to FY2010. In the interest of maintaining consistency with the
previous IDA analysis, items in bold will be the focus of this thesis, and will receive the
most attention.
Table 1. Average Annual O&S cost per ship, 1987–2010
Cost per Ship(FY10 $M)
Total O&S 49.6 Unit (Organizational Level) 37.4 Personnel 21.5 Material 15.9 POL (Fuel both underway and not underway) 9.6 Repair parts and repairables 3.4 Supplies 0.7 Training expendable stores (replacement ammunition) 2.2 Intermediate-level maintenance 1.9 Depot-level maintenance 4.4 Repair during Scheduled maintainance availablilities 2.9 Repair during Un-Scheduled maintainance availablilities 1.5 Modernization 3.3No tes : Bo ld deno tes the main fo cus o f ana lys is . To ta ls do no t s um due to ro unding.

15
B. HISTORICAL TREND ANALYSIS
1. Consolidated CG-47 O&S Cost Trend Analysis
Figure 2. Average Annual O&S Cost per Ship & Average CG-47 Cruiser Age
Figure 2 shows the average O&S cost per ship for each fiscal year from FY1987
to FY2010. Over the 23 years analyzed, average annual O&S cost per ship increased
over 45% from its lowest point of $29.7 million in FY1990, to its peak of $64.9 million
in FY2007. Over the same time period the average age of the CG-47 cruiser class
(dashed line) rose from one year in FY1987 when only CG-52 was in service, to an
average age of 20 years in FY2010 when all 22 ships were active.
Total O&S contains multiple data categories that span several appropriation titles,
including: Operations and Maintenance, Navy (OM&N); Other Procurement, Navy
(OPN); Weapons Procurement, Navy; and Military Personnel, Navy (MPN). While

16
several of these appropriations categories, and their associated O&S cost categories are
ostensibly not related to platform age, other categories, for example maintenance, are
presumably related to the age of the platform and will be analyzed in detail in subsequent
sections.
The trend in O&S costs shown in Figure 2 appears to follow closely with average
platform age, with the exception of a large spike to $61M in FY1991 which followed
Operation Desert Storm7. The spike in O&S costs in FY1991 was largely driven my
maintenance and replacement ammunition costs, and will be further analyzed in
subsequent sections.
2. Personnel Cost Trend Analysis
Figure 3. Average Annual Personnel Cost per Ship & Average Number of Personnel Assigned
7 OPERATION DESERT STORM and the war between the United States and Iraq lasted from August
1990 to April 1991 (Department of the Navy - Naval Historical Center, 1997).

17
Average annual personnel cost per ship provides an interesting trend analysis, but
does not warrant a linear regression comparison since the number, and cost, of personnel
assigned to a ship is not driven by the age of the platform. Personnel costs, shown in
Figure 3, include pay and allowances for both officer and enlisted crew members, and are
the largest contributing category to O&S costs. Trends in personnel cost have a
significant impact on overall O&S trends, while behaving independent of variation in
platform age.
Personnel costs have been rising steadily over time. In IDA’s analysis of CG-47
cruisers from FY1984 to FY1999, personnel costs rose 60% (Devers & Levine, 2002).
From FY2000 to FY2003, the average number of personnel assigned per ship increased
8% from 361 to 393; accordingly, personnel costs increased 10% from $21.8 million to
$24.4 million. Since personnel costs also include entitlements like hazardous duty pay
and eminent danger pay, the spike in FY2003 can likely be attributed to the buildup of
naval forces associated with the “Shock and Awe” offensive8 of Operation Iraqi Freedom
(OIF) (Singal, Lim, & Stephey, 2003). Between FY2003 and FY2009, however, a 15%
decrease in crew size from an average of 393 down to 332 per ship, was accompanied by
a significantly smaller decrease in average annual personnel costs per ship of less than
5% from $24.4 million to $23.3 million.
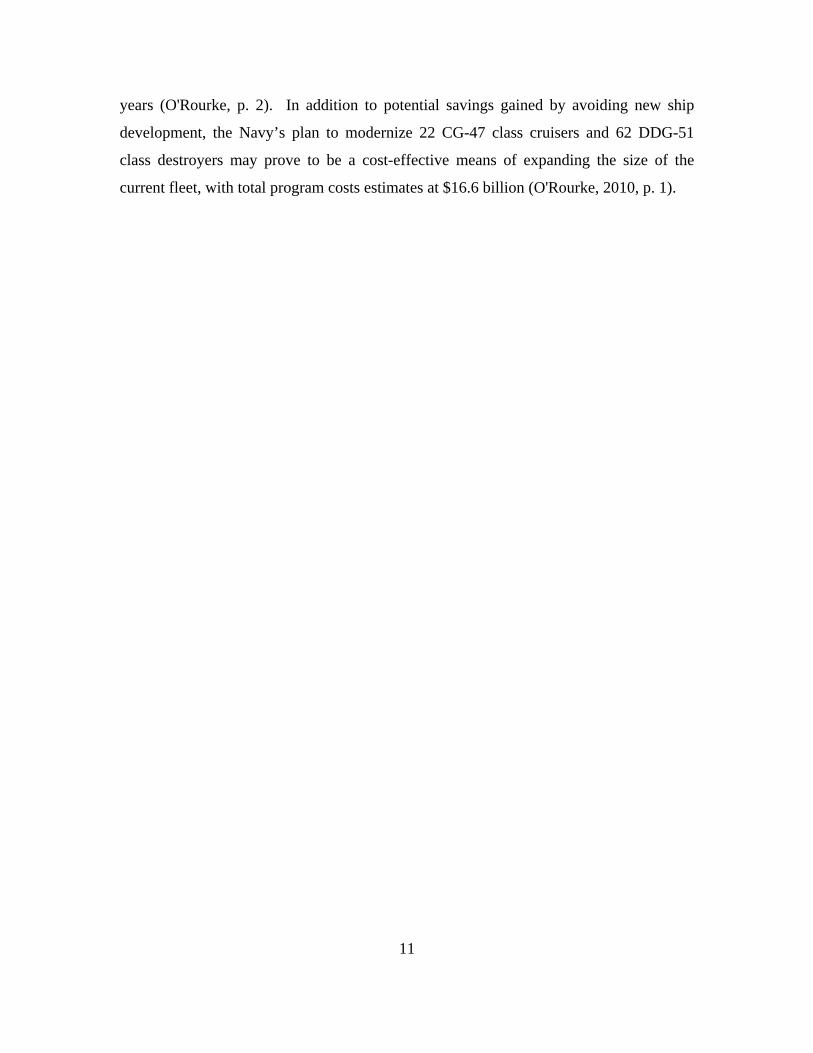
Figure 4 shows that the average annual cost per person assigned rose nearly 60%,
from $46K in FY1987, to $78K in FY2010. Given that all cost numbers have been
adjusted to constant FY2010 dollars, a further, more detailed, analysis of personnel pay
and benefits is warranted, but is beyond the scope of this thesis.
8 On March 19, 2003, the U.S.-led coalition began bombing Baghdad (Singal, Lim, & Stephey, 2003).
18
Figure 4. Average Annual Personnel Cost per Ship & Average Cost per Person
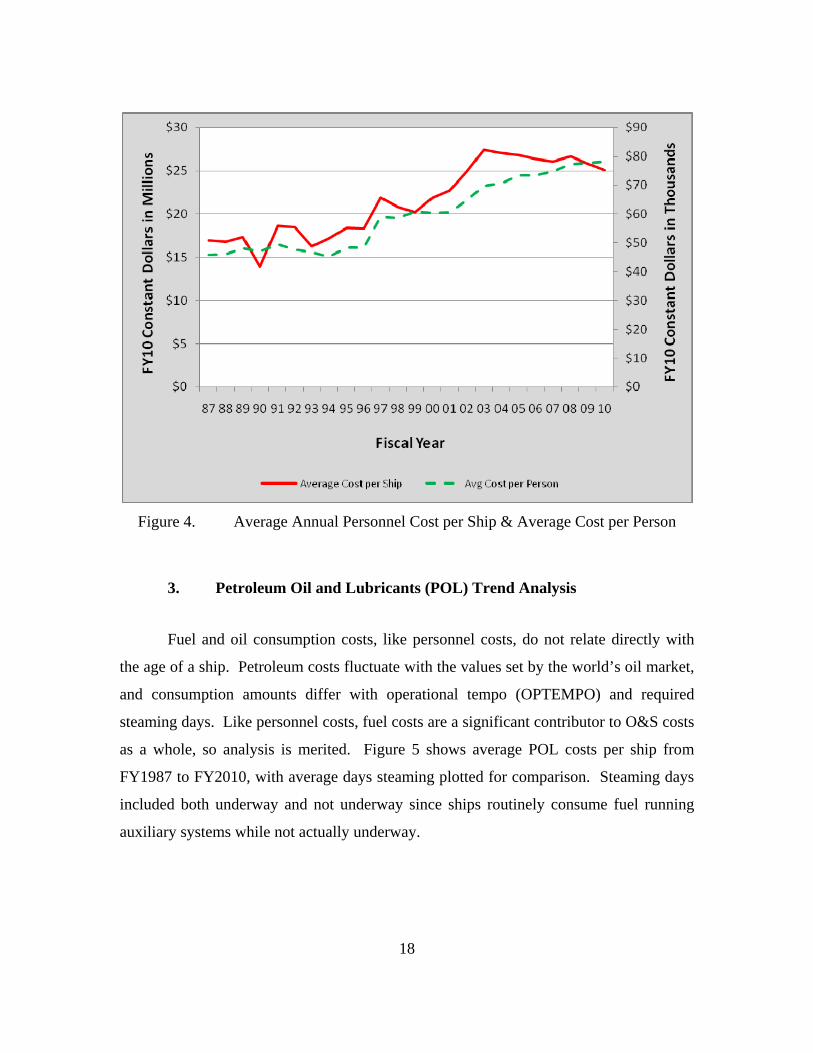
3. Petroleum Oil and Lubricants (POL) Trend Analysis
Fuel and oil consumption costs, like personnel costs, do not relate directly with
the age of a ship. Petroleum costs fluctuate with the values set by the world’s oil market,
and consumption amounts differ with operational tempo (OPTEMPO) and required
steaming days. Like personnel costs, fuel costs are a significant contributor to O&S costs
as a whole, so analysis is merited. Figure 5 shows average POL costs per ship from
FY1987 to FY2010, with average days steaming plotted for comparison. Steaming days
included both underway and not underway since ships routinely consume fuel running
auxiliary systems while not actually underway.

19
Figure 5. Average Annual POL Cost per Ship & Average Annual Steaming Hours
As expected, POL costs closely follow average steaming days across the entire
timeframe. Over the timeframe analyzed from FY1987 to FY2010, average annual POL
costs per ship closely followed changes in crude oil prices, ranging from $7.4M to
$14.2M and maintained an average annual cost per ship of $9.6M. Trends in annual POL
cost per ship are much less erratic than trends in oil prices per barrel9 experienced in the
world market during the same time period (McMahon, 2010). Over the entire period of
analysis, crude oil prices rose a total of 217%, from $33 per barrel in FY1987 to $72 per
barrel in FY2010. Between FY1999 and FY2010 crude oil prices showed a dramatic
increase of nearly 450% from a low of $16 per barrel in FY1998, to $72 per barrel in
FY2010. While price per barrel figures used to illustrate world oil market trends may
differ from oil prices paid by the government during that period, market price trends do
9 “Prices are adjusted for Inflation to June 2010 prices using the Consumer Price Index (CPI-U) as
presented by the Bureau of Labor Statistics. Prices are based on historical free market (stripper) prices of Illinois Crude as presented by IOGA (McMahon, 2010).”

20
serve as a valid comparison to help explain historical increases revealed in POL cost
trend analysis. Figure 6 shows average annual POL cost per ship plotted with a crude oil
price per barrel trend line covering the same period.
Figure 6. Average Annual POL Cost per Ship versus Inflation Adjusted Crude Oil Price per Barrel
4. Ammunition Cost Trend Analysis
Ammunition replacement cost trend analysis is included here, both to maintain
consistency with IDA’s report on O&S costs, and to highlight the contribution
ammunition replacement has to overall O&S trends. The key takeaway from Figure 7 is
the spike in average ammunition replacement cost per ship to $12.3M in FY1991. The
spike in cost represented in Figure 7 is consistent with other O&S cost sub-categories,
and adds to the overall O&S cost spike that followed the Gulf War in 1991.

21
Ammunition replacement costs, shown in Figure 7, provide a much less
significant contribution to overall O&S costs than the previously discussed categories of
personnel and POL costs. Average annual ammunition replacement costs include both
ammo expended in operations and ammo used in training exercises. Additionally,
replacement costs for expended acoustic sonobuoys were included in the overall
ammunition figures. During the course of the timeframe plotted in Figure 7, average
annual ammunition replacement costs declined steadily from $4.7M per ship in FY1987
to $311K per ship in FY2010.
Figure 7. Average Annual Replacement Ammunition Cost per Ship
5. Maintenance Cost Trend Analysis
Maintenance costs, as the second largest contributor to overall O&S costs, is a
monetarily significant category and capable of influencing overall O&S costs

22
dramatically. Additionally, maintenance provides the most ostensibly plausible
relationship to platform age of all the O&S cost categories previously discussed.
Figure 8. Average Annual Maintenance Cost per Ship and Average Annual Depot-Level Maintenance Man-Days per Ship
Included in average annual maintenance costs per ship are scheduled and non-
scheduled depot maintenance, intermediate-level maintenance, and fleet modernization.
Fleet modernization10 is a maintenance program scheduled to outfit each cruiser in the
CG-47 class with systems upgrades that will enable the ships to maintain military
relevance throughout the duration of the ship’s intended service life of 35 years (Director,
Warfare Integration (OPNAV N8F). Modernization, as a one-time program designed to
10 Fleet modernization will “improve the CG-47 Ticonderoga class by modernizing the computing and
display infrastructure, and the Hull, Mechanical and Electrical (HM&E) systems. Weapons and sensor sets will also be improved, […], as well as routine machinery upgrades to improve all areas of ship functionality” (OPNAV N8F).

23
upgrade and update an entire class, will be analyzed both in a consolidated maintenance
cost trend graph, and in a separate trend analysis. Fleet modernization costs represent a
cost directly associated with maintaining an aging ship class.
Figure 8 shows the average annual maintenance cost per ship, plotted with
average annual maintenance man-days for comparison. Annual maintenance cost for
each ship—with the maintenance sub-categories of scheduled depot maintenance, un-
scheduled depot maintenance, modernization, and “other,”—were consolidated into a
single average for each year.
Overall, average annual maintenance cost per ship increased drastically during the
period analyzed; however, changes in average maintenance costs do not appear to follow
fluctuations in depot-level maintenance man-days. The lack of correlation between
maintenance cost and maintenance time is counter-intuitive since an increase in
maintenance time would, seemingly, cause a similar change in the overall cost to
maintain the ship.
Figure 8 also shows a notable doubling of maintenance costs between FY2006
and FY2007 from $9 million to $18.7 million. This timeframe coincides with the
beginning of the CG-47 fleet modernization program. The dramatic, upward trend
starting in FY2007 continues through FY2010, and may be indicative of future
maintenance cost.
Figure 9 shows average annual depot maintenance cost per ship plotted with
average depot maintenance man-days. Once the two depot-level maintenance sub-
categories, scheduled and un-scheduled, are plotted independent of other maintenance
cost sub-categories, the depot cost trend line follows much more closely with
maintenance man-days, and exhibits the correlation originally expected between
maintenance cost and time.

24
0
1
2
3
4
5
6
$0
$2
$4
$6
$8
$10
$12
87 88 89 90 91 92 93 94 95 96 97 98 99 00 01 02 03 04 05 06 07 08 09 10
Man Days in Thousands
FY2010 Constant Dollars in Millions
Fiscal YearAvg Annual Depot Maintenance per Ship Avg Annual Depot Man‐Days per Ship
Figure 9. Average Annual Depot-Level Maintenance Cost per Ship and Average Annual Depot Man-Days per Ship
Figure 10 features the overall trend in scheduled depot maintenance independent
of other maintenance sub-categories. Scheduled depot maintenance, including Type
Commander (TYCOM), and Chief of Naval Operations (CNO) shipyard maintenance
periods, shows a fluctuating, but steadily upward trend during the period analyzed.
Figure 11 shows a consistent trend in un-scheduled depot-level maintenance cost
throughout most of the period analyzed; however, the trend line increases exponentially
after FY2006. Between FY1987 and FY2006, average annual un-scheduled maintenance
cost per ship never exceeded $1.8M. Interestingly, from FY2006 to FY2009 the average
per ship cost of un-scheduled depot-level maintenance rose from $1.75M to $5.6M,
before dropping off slightly to $4M per ship in FY2010.

25
Figure 10. Average Annual Scheduled Depot-Level Maintenance Cost per Ship
Figure 11. Average Annual Un-Scheduled Depot-Level Maintenance Cost per Ship

26
Figure 12 plots average annual modernization cost per ship independent of all
other maintenance cost sub-categories. Modernization cost shows no readily-discernable
trend, and peaks spread consistently throughout the period analyzed.
Figure 12. Average annual modernization cost per ship
While upward trends appear to exist in most of the O&S cost categories analyzed,
age, along with steaming hours, likely have the greatest affect on maintenance costs and
will be the focus of regression analysis in the following chapter. Other cost categories,
while significant contributors to overall O&S cost, will not be explored any further
beyond the level already discussed.
27
C. REGRESSION ANALYSIS
1. Regression Introduction
For this section of analysis, maintenance cost data were separated from all other
O&S cost categories, and then further disaggregated into the five maintenance cost sub-
categories of Scheduled Depot Maintenance, Unscheduled Depot Maintenance,
Modernization, Intermediate Maintenance, and Other Maintenance. Individual
maintenance cost sub-categories were analyzed by creating separate regression models
for each that focused on the relationship between platform age and maintenance cost,
holding all other factors constant.
While regression analysis is expected to show that platform age is linked to an
upward trend in maintenance cost over time, there are factors other than platform age that
could affect the age-cost relationship and should be addressed. For this reason, steaming
hours were included in each regression model to account for any effect operational tempo
(OPTEMPO), or platform utilization, could have on maintenance cost. Steaming hours
are endogenous to maintenance costs, since more maintenance cost would ostensibly
indicate more down time and less steaming hours. Thus, one-year lagged, and two-year
lagged steaming variables were used.
The addition of variables accounting for the effects of platform utilization,
specifically captured in steaming hours, was a logical way to account for any year-based
effects that may have been introduced by changes in maintenance funding. The two
“lagged” variables for steaming hours were present in the regression models for each of
the five maintenance cost sub-categories.
Additional steps were taken in the regression analysis to minimize any effect one
ship might have on the maintenance cost predictions for the entire class; specifically, if
one ship had an abnormally large maintenance cost in a single year that could not be
attributed to platform age. For example, in February 1991, USS Princeton (CG-59)
struck two mines in the Persian Gulf causing hull and superstructure damage. The
damage caused by Princeton’s mine strikes, while certainly contributing to subsequent

28
maintenance costs, have no connection to the age of the platform. Similarly, other types
of damage may affect maintenance costs while having no relationship with platform age.
An example of an event unrelated to platform age that increased maintenance cost is USS
Port Royal (CG-73), which ran aground off the coast of Oahu, Hawaii in 2009. The
grounding caused significant damage and contributed to subsequent maintenance costs
associated with that particular platform in the following year. In order to minimize the
effect of any single platform, dummy variables for each of the 22 ships were utilized in
each regression model. These dummy variables enable the regression model to calculate
individual mean values for each of the 22 ships included in the analysis.
Finally, after multiple trial regression models, a limit of $10M was set for the
annual maintenance costs of any individual ship. By eliminating cost observations
greater than $10M, the regression analysis showed results of much greater accuracy, and
future projections will be possible utilizing the Cost Estimation Relationships (CER)
established here.
2. Regression Model Statistical Results Summary
Table 2. Regression Model Statistical Results
FY2010 Dollars Scheduled Un‐Scheduled Modernization Intermediate OtherPlatform Age (Standard Error)
85,019** (34,944)
146,047*** (16,756)
‐74,695*** (25,072)
209,449*** (15,982)
16,294** (8536)
Steaming Hours Lagged 1‐Year (Standard Error)
405*** (133)
162*** (61)
110 (91)
88 (58)
14.5 (31)
Steaming Hours Lagged 2‐Year (Standard Error)
‐5.38 (126)
46 (62)
‐250*** (92)
192*** (59)
‐16 (32)
Sample Size 235 373 352 372 369R‐Squared 0.10 0.30 0.12 0.44 0.09*** 1% Significance Level** 5% Significance Level* 10% Significance Level
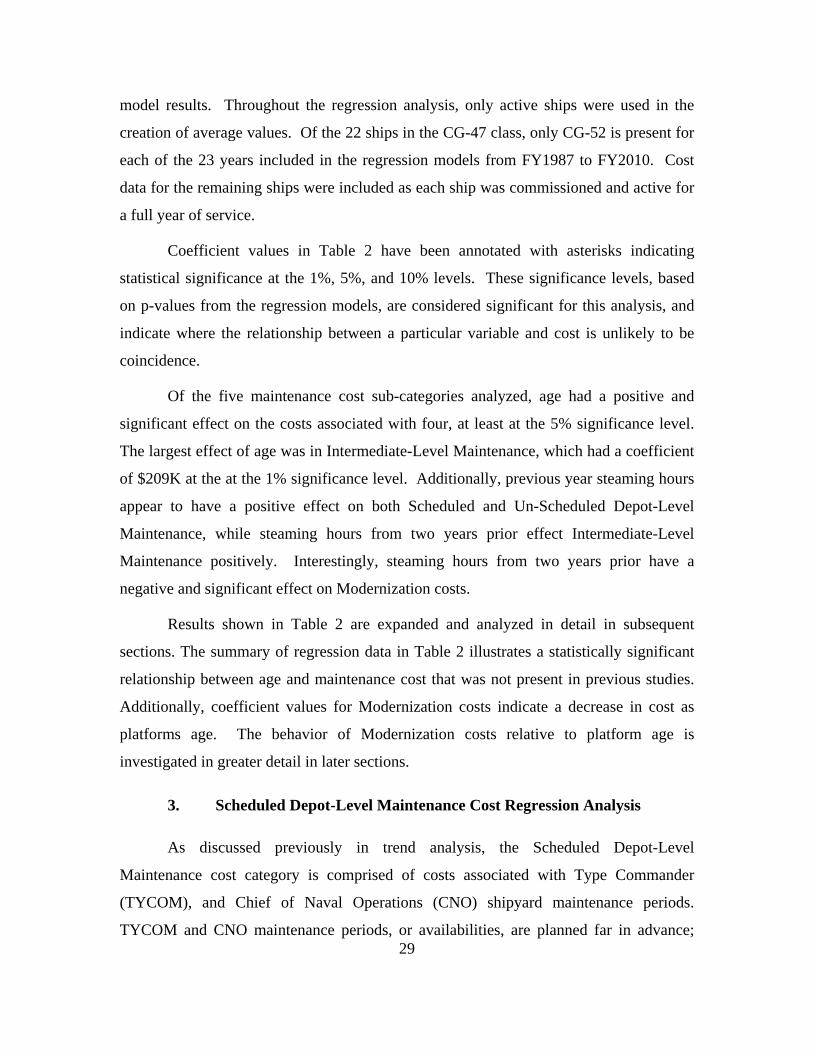
Table 2 provides a summary of regression model results, and displays the
statistical significance of each coefficient. Coefficient values in Table 2 are in FY2010
dollars, and were used in subsequent sections to produce graphical representations of the
regression results from each maintenance cost sub-category. Standard error values were
included for each coefficient value as a representation of potential error in the regression
29
model results. Throughout the regression analysis, only active ships were used in the
creation of average values. Of the 22 ships in the CG-47 class, only CG-52 is present for
each of the 23 years included in the regression models from FY1987 to FY2010. Cost
data for the remaining ships were included as each ship was commissioned and active for
a full year of service.
Coefficient values in Table 2 have been annotated with asterisks indicating
statistical significance at the 1%, 5%, and 10% levels. These significance levels, based
on p-values from the regression models, are considered significant for this analysis, and
indicate where the relationship between a particular variable and cost is unlikely to be
coincidence.
Of the five maintenance cost sub-categories analyzed, age had a positive and
significant effect on the costs associated with four, at least at the 5% significance level.
The largest effect of age was in Intermediate-Level Maintenance, which had a coefficient
of $209K at the at the 1% significance level. Additionally, previous year steaming hours
appear to have a positive effect on both Scheduled and Un-Scheduled Depot-Level
Maintenance, while steaming hours from two years prior effect Intermediate-Level
Maintenance positively. Interestingly, steaming hours from two years prior have a
negative and significant effect on Modernization costs.
Results shown in Table 2 are expanded and analyzed in detail in subsequent
sections. The summary of regression data in Table 2 illustrates a statistically significant
relationship between age and maintenance cost that was not present in previous studies.
Additionally, coefficient values for Modernization costs indicate a decrease in cost as
platforms age. The behavior of Modernization costs relative to platform age is
investigated in greater detail in later sections.
3. Scheduled Depot-Level Maintenance Cost Regression Analysis
As discussed previously in trend analysis, the Scheduled Depot-Level
Maintenance cost category is comprised of costs associated with Type Commander
(TYCOM), and Chief of Naval Operations (CNO) shipyard maintenance periods.
TYCOM and CNO maintenance periods, or availabilities, are planned far in advance;

30
however, all levels of shipboard maintenance are likely accomplished during these
maintenance periods where ships are non-operational for several months consecutively.
Figure 13 gives graphical representation of the regression model results for
Scheduled Depot-Level Maintenance generated under the assumptions and limitations
discussed in the previous section. Regression results have been plotted along with the
original VAMOSC per ship annual average costs data for Scheduled Depot-Level
Maintenance for comparison. With the drastic fluctuations in Scheduled Depot-Level
Maintenance costs, an accurate prediction of future costs using regression is not ideal;
however, the regression line generated in this analysis does visually show the relationship
between maintenance costs and platform age, holding other factors constant, and shows a
readily discernable upward trend in costs. In the years plotted, estimated cost for average
annual Scheduled Depot-Level Maintenance per ship rose from $1.8M to $3.8M, while
the actual average per ship cost rose similarly from $1.8M per ship in FY1991, to a per
ship annual average of $4.8M in FY2010.
Figure 13. Estimated Platform Age Relationship to Average Annual Scheduled Depot-Level Maintenance Cost per Ship

31
In light of the upward trend in the age-cost relationship shown in Figure 13, a
future estimate of average annual Scheduled Maintenance cost was made. Although
forecasting future maintenance costs based on highly variable data is potentially
inaccurate, a prediction based on the regression model plotted in Figure 13 provided
reasonable and seemingly realistic values. Based on the expected service life of 35 years
for each of the 22 CG-47 class platforms, Scheduled Depot-Level Maintenance cost can
be expected to continue to rise steadily in the future from an annual per ship average cost
of $3.8M in FY2010, to a predicted value of $5.5M per ship in FY2029 when the final
ship in the class would reach 35 years of service. This prediction was based only on
those ships scheduled to be active in each year based on the generic 35-year service life
expectation.
4. Unscheduled Depot-Level Maintenance Cost Regression Analysis
Figure 14. Estimated Platform Age Relationship to Average Annual Un-Scheduled Depot-Level Maintenance Cost per Ship

32
Like Scheduled Depot-Level Maintenance, regression analysis of Un-Scheduled
Depot-Level Maintenance costs gave similarly expected results. The estimated cost-age
relationship line produced in regression model trials visually fits the data nicely, and
shows a significant upward trend over time, increasing from an annual per ship average
estimate of $127K in FY1989, to $3.2M per ship in FY2010. The spike in the original
VAMOSC data in Figure 14 for Un-Scheduled Depot-Level Maintenance costs in
FY2009 can be attributed to $58M spent repairing USS Port Royal (CG-73) following
her grounding off the coast of Oahu, Hawaii.
5. Modernization Cost Regression Analysis
Figure 15. Estimated Platform Age Relationship to Average Annual Modernization Cost per Ship

33
Regression analysis of Modernization cost yielded results less anticipated than
other maintenance cost sub-categories, and required a great deal of effort in interpretation
of regression model results. Figure 15 shows the line representing the estimated
relationship between platform age and average annual Modernization cost per ship
plotted with the original VAMOSC Modernization data for comparison. Unexpectedly,
the Modernization cost estimate line developed for this analysis shows a decrease in
Modernization cost as platforms age. Previously discussed controls and assumptions
incorporated into the regression model have controlled for volatility in the underlying
data, and enabled the estimation line to better represent the relationship between
Modernization costs and the age of the platforms.
Pursuit of a suitable explanation for diminishing Modernization costs over the
lifecycle of the CG-47 class led to three potential hypotheses. First, funding for Aegis
Cruiser Modernization is funded through appropriations other than Operations and
Maintenance, Navy (OMN), and is difficult to isolate into a single, analyzable database.
For example, the President’s FY2011 budget submission requested Modernization
funding of $357M for CG-47 modernization and $296.7M for DDG-51 modernization
under the Other Procurement, Navy (OPN) appropriation rather than Operations and
Maintenance, Navy (OM&N), which is represented in this analysis (O'Rourke, Navy
Aegis Cruiser and Destroyer Modernization: Background and Issues for Congress).
The second potential explanation for the age-cost relationship depicted in Figure
15 is that Modernization for the 22 CG-47 class cruisers makes up a minority portion of a
much larger ship modernization plan that includes 62 DDG-51 Arleigh-Burke class
destroyers (PEO Ships). Given the large number of DDGs, and their expected service life
of 40 years per ship, the CG-47 class cruisers would ostensibly receive a proportionately
smaller fraction of the total planned Modernization budget. To date, only three CG-47
class cruisers have completed the Modernization process. Additionally, funding for only
one CG-47 class cruiser was included in the President’s FY2011 budget submission,
compared to a funding request for three DDG-51 destroyers (O'Rourke, Navy Aegis
Cruiser and Destroyer Modernization: Background and Issues for Congress).

34
A third potential explaination for the decreasing Modernization cost estimate line
in Figure 15 is that ship modernization is not driven by age-related requirements, but
rather a need to maintain operational relevance. The regression model illustrated in
Figure 15 was designed around the anticipation that the cost to maintain a ship is related
to the age and utilization of the platform. The anticipated cost-age relationship has been
apparent in other maintenance csategories analized; however, unlike maintenance
required to offset platform utilization or damage, Modernization can be assumed to be
driven by changes in technology, perceived enemy capabilities, or requirements
generated independent of the requirement to maintain the functionality of systems and
capabilities currently deployed on surface ships.
Figure 16 shows the result of a simple regression model with average annual
Modernization cost per ship as the dependant variable, set against the average age of the
22 active CG-47 class cruisers as the independent variable. Unlike all other regression
figures in this analysis, Figure 16 does not hold other contributing factors constant.
Interestingly, without controls for utilization, year-fixed effects, or ship-specific outliers,
the results show a more anticipated upward trend in Modernization cost as platforms age.
Figure 16. Simple regression model showing Estimated Platform Age Relationship to Average Annual Modernization Cost per Ship

35
6. Intermediate Maintenance Cost Regression Analysis
Figure 17. Estimated Platform Age Relationship to Average Annual Intermediate-Level Maintenance Cost per Ship
Intermediate Maintenance cost regression analysis produced results consistent
with the anticipated rise as age values increased, and showed the strongest age-cost
relationship of all the maintenance cost sub-categories analyzed. Disregarding the initial
three years with negative values plotted in Figure 17, estimates for average annual
Intermediate Maintenance cost per ship increased steadily from $57K per ship in
FY1990—when only the first ten of the 22 total cruisers included in this analysis were
active—to over $4.2M per ship annually in FY2010. If the regression line is continued
out to FY2029, the average annual per ship estimate for Intermediate Maintenance cost
increases steadily to an estimate of over $8.2M. That represents a 194% increase over
the estimated cost for FY2010.

36
7. Other Maintenance Cost Regression Analysis
Figure 18. Estimated Platform Age Relationship to Average Annual Other Maintenance Cost per Ship
The Other Maintenance category encompasses maintenance costs not captured in
the previously analyzed categories, and is the smallest contributor to overall maintenance
costs. Figure 18 shows the regression estimate for average annual Other Maintenance
cost per ship potted with the corresponding VAMOSC data for comparison. Similar to
both Scheduled Maintenance and Modernization, the Other Maintenance sub-category
represented a challenge for regression analysis given the volatility in the underlying cost
data. Regression analysis results did produce a best fit estimate line that shows a
definitive upward trend over time, increasing from $474K as an average annual per ship
estimate in FY1987, to $849K per ship in FY2010. Continued out to FY2029, the
average annual estimate per ship for Other Maintenance increases to $1.2M, show a
significant upward trend in cost as related to platform age.

37
III. SUMMARY AND CONCLUSION
A. SUMMARY OF FINDINGS
Regression analysis of maintenance cost associated with the CG-47 cruiser class
yielded results that differed from those found by IDA in attempting to establish a
relationship between the age of a platform and the cost required to maintain it. While
IDA found no significant relationship between cost and age, results found in this analysis
indicate a statistically significant relationship between specific maintenance cost,
steaming hours, and platform age. Not all categories of maintenance, however, showed
the upward trend expected with increasing age.
Maintenance required for correction of material deficiencies resulting from use,
such as Scheduled and Un-Scheduled Depot-Level Maintenance, showed the upward
relationship with age that was anticipated prior to analysis. Modernization cost, however,
showed a negative age-cost relationship, indicating a decline in Modernization cost with
age.
In contrast to the IDA study, this analysis does show a statistically significant
relationship between platform age and maintenance cost. Most notably, the statistical
relationship between Intermediate-Level Maintenance cost, platform age, and steaming
hours. Using these regression results to forecast future cost showed that Intermediate-
Level Maintenance cost can be expected to increase by an average, per ship amount of
$209.5K for each additional year of service expected of a CG-47 class cruiser.
While Intermediate-Level Maintenance regression results were strong—showing
strong statistical significance between cost and all three variables—all four other
maintenance cost categories showed statistically significant relationships between
maintenance cost and platform age. Additionally, steaming hours lagged one year
showed strong statistical significance in both the Scheduled and Un-Scheduled Depot-
Level Maintenance categories.

38
Coefficient values for each of the five maintenance category regression models
were combined, and yielded a predicted average annual increase in maintenance cost of
$382.1K per ship, for each additional year of service. That amount, although in addition
to current annual maintenance funding per ship, included the estimated $75K annual
decrease in Modernization cost per ship.
B. CONCLUSION
Fiscal challenges facing the Navy have created a situation where policy objectives
and mission requirements driving the force structure of the surface fleet must be re-
evaluated in an effort to ensure that the highest priority objectives do not go unmet.
Force capability goals for the future surface fleet must be redefined with the realization
that budget restrictions necessitate a reduction in overall resources. Congress must
choose to either fund the surface fleet deemed necessary by Navy leaders to implement
current national policy, work with the President to change national policy, or accept the
inevitable limitations of the force they are able to fund. By forcing the Navy to trade
effectiveness for efficiency, Congress will put the Navy in a position where they are
forced to submit what the Senate Armed Services Committee deemed, “an overly
optimistic procurement strategy for large surface combatants,” with program changes
that, “inject a great deal of instability into the SCN11 accounts” (O'Rourke, Navy CG(X)
Cruiser Program: Background for Congress, 2010, p. 8).
The good news, however, is that the Navy seems to have found a compromise in
the balance between new ship procurement and old ship sustainment that will postpone a
reduction in current capabilities. By restarting DDG-51 production, the fleet is assured
the addition of newly constructed large surface combatants in the future, and the
budgeting stability gained will likely enhance the accuracy of future budget estimates.
With the theoretical affordability of modernization shown in this thesis, coupled with the
reduction in funding requirements resulting from avoiding new ship development, the
Navy appears to have found the most realistic route available to pursue a 313-ship fleet.
11 Ship Construction, Navy (SCN).

39
Budget stability gained through the DDG-51 program alone is not enough to
afford Navy decision-makers the predictability needed to ensure force structure decisions
are realistically attainable within fiscal constraints. The Navy needs the ability to predict
how O&S costs will behave based on the age of their current fleet. Trends present
throughout this analysis, indicate that O&S costs associated with the CG-47 class will
continue to increase as the ships in the class age; however, the increase in maintenance
cost alone may not warrant a change is current force structure policy toward the
development of new Large Surface Combatants. Further analysis, including equipment
failure trend data, readiness metrics, and material condition scores12, is needed to better
encompass the broad array of costs that could potentially be attributed to the age of a
ship. Operating and Support cost, while a good measure of overall ship costs, contain
many categories that fluctuate based on factors completely independent of platform age.
The ability to better predict future funding requirements is even more significant
given that the analysis of the Navy’s latest shipbuilding plan, from both the CBO and the
CRS, indicates that, with the historical average of $15 billion per year for shipbuilding,
the Navy “will not be able to afford all of the purchases in the 2011 plan” (O'Rourke,
Navy Force Structure and Shipbuilding Plans: Background Issues for Congress, 2010, p.
1). Given that a substantial increase in SCN funding is unlikely, the possibility that a
313-ship Navy will not materialize is a likelihood that must be considered. The
implications for the Navy posed by an inability to reach force structure levels required to
implement national policy are complex. The Navy has structured its 313-ship plan to fill
present and future requirements determined to be responsibilities of the Navy under
current national policy. If Congress is unable to provide sufficient funding to realize the
Navy’s force structure goals, they must be cognizant of potential risks and be ready to
accept possible consequences.
In the near term, the Navy’s plan appears to be achievable, and the supremacy of
the U.S. fleet is not in jeopardy. After the current FYDP, however, the plan becomes
12 Classified as secret in 2009 and no longer available publically, “The reports, filed by the Board of
Inspection and Survey, or INSURV, contain the findings of meticulous, days-long inspections that cover every detail of the workings of surface ships, aircraft carriers and submarines (Ewing, 2009).”

40
potentially problematic and will require constant assessment and adjustment in order to
maintain a realistic chance of success. However, in light of this initial look into the effect
of age on the CG-47 class, the U.S. Navy’s decision to extend the life of the class, over
the development and procurement of new technology, was likely a well-founded
decision. The Navy, and Congress, will no doubt adjust to changes in funding levels and
requirements, and in the mean time, the current fleet of Aegis cruisers and destroyers will
continue on the path to modernization that will keep them at the forefront of naval
combat effectiveness throughout the world.
With no current ability to predict future O&S costs with any certainty, future
analysis of the CG-47 class, and others, will be warranted in an effort to establish a
relationship between age and cost as the platform continues to mature. Additionally,
modernization costs associated with keeping an older class of ships capable exist outside
the scope of O&S data, and warrants introduction into future analysis. The ability to
understand the cost associated with the CG-47 class will help in making future class
service life decisions and aid leadership in naval force structure planning.

41
LIST OF REFERENCES
Congressional Budget Office. (2010). An Analysis of the Navy's Fiscal Year 2011 Shipbuilding Plan. Washington, DC: The Congress of the United States, Congressional Budget Office.
Devers, W. C., & Levine, D. B. (2002). Effect of Age on the Operating and Support Costs
of CG-47 Class Cruisers. Alexandria, VA: Institute for Defense Analysis. Director, Warfare Integration (OPNAV N8F). (2010). Report to Congress on Annual
Long-Range Plan for Construction of Naval Vessels for FY 2011. Washington, DC: Office of the Chief of Naval Operations.
Ewing, P. (2009, March 10). Navy classifies regular ship inspections. Retrieved
September 15, 2010, from NavyTimes.com: http://www.navytimes.com/news/2009/03/navy_insurv_030809w/
Koenig, P., Nalchajian, D., & Hootman, J. (2009). Ship Service Life and Naval Force
Structure. American Society of Naval Engineers. Labs, E. J. (2010, January 20). The Long-Term Outlook for the U.S. Navy Fleet.
Washington, DC: Congressional Budget Office. McMahon, L. M. (2010, July 21). Historical Oil Prices. Retrieved September 15, 2010,
from InflationData.com: http://inflationdata.com/inflation/inflation_rate/historical_oil_prices_table.asp
O'Rourke, R. (2010). Navy Aegis Cruiser and Destroyer Modernization: Background and
Issues for Congress. Washington, DC: Congressional Research Service. O'Rourke, R. (2010). Navy CG(X) Cruiser Program: Background for Congress.
Washington, DC: Congressional Research Sevice. O'Rourke, R. (2010). Navy DDG-51 and DDG-1000 Destroyer Programs: Background
and Issues for Congress. Washington, DC: Congressional Research Service. O'Rourke, R. (2010). Navy Force Structure and Shipbuilding Plans: Background Issues
for Congress. Washington, DC: Congressional Research Service. PEO Ships. (n.d.). Naval Sea Systems Command. Retrieved September 10, 2010, from
NAVSEA.navy.mil: http://www.navsea.navy.mil/teamships/Sea21_Mod/MOD_CG47.aspx

42
Singal, J., Lim, C., & Stephey, M. J. (2003, March). Six Years in Iraq. Retrieved September 15, 2010, from Time.com: http://www.time.com/time/2007/iraq/1.html
Surface Warfare Directorate (N76). (2009, October 28). Director, Surface Warfare
(N76). Retrieved September 15, 2010, from navy.mil: http://www.navy.mil/navydata/fact_display.asp?cid=4200&tid=800&ct=4
43
INITIAL DISTRIBUTION LIST
1. Defense Technical Information Center Ft. Belvoir, Virginia
2. Dudley Knox Library Naval Postgraduate School Monterey, California
3. John Mutty, Capt, USN (Ret) Graduate School of Business and Public Policy Naval Postgraduate School Monterey, California
4. Dr. Jeremy A. Arkes Graduate School of Business and Public Policy Naval Postgraduate School Monterey, California
5. Joseph R. McDonald Graduate School of Business and Public Policy Naval Postgraduate School Monterey, California