NAVAL POSTGRADUATE SCHOOL · was conducted with the sponsorship and assistance of the Center for...
74
NAVAL POSTGRADUATE SCHOOL MONTEREY, CALIFORNIA MBA PROFESSIONAL REPORT Grade Point Average as a Predictor of Success in Explosive Ordnance Disposal Training By: Sarah E. Turse, and Trevor Ritland December 2009 Advisors: Samuel E. Buttrey Cary Simon Approved for public release; distribution is unlimited.
Transcript of NAVAL POSTGRADUATE SCHOOL · was conducted with the sponsorship and assistance of the Center for...

NAVAL POSTGRADUATE
SCHOOL
MONTEREY, CALIFORNIA
MBA PROFESSIONAL REPORT
Grade Point Average as a Predictor of Success in Explosive Ordnance Disposal Training
By: Sarah E. Turse, and Trevor Ritland
December 2009
Advisors: Samuel E. Buttrey Cary Simon
Approved for public release; distribution is unlimited.

i
REPORT DOCUMENTATION PAGE Form Approved OMB No. 0704-0188 Public reporting burden for this collection of information is estimated to average 1 hour per response, including the time for reviewing instruction, searching existing data sources, gathering and maintaining the data needed, and completing and reviewing the collection of information. Send comments regarding this burden estimate or any other aspect of this collection of information, including suggestions for reducing this burden, to Washington headquarters Services, Directorate for Information Operations and Reports, 1215 Jefferson Davis Highway, Suite 1204, Arlington, VA 22202-4302, and to the Office of Management and Budget, Paperwork Reduction Project (0704-0188) Washington DC 20503. 1. AGENCY USE ONLY (Leave blank)
2. REPORT DATE December 2009
3. REPORT TYPE AND DATES COVERED MBA Professional Report
4. TITLE AND SUBTITLE: Grade Point Average as a Predictor of Success in Explosive Ordnance Disposal Training 6. AUTHOR(S) Turse, Sarah E.; Ritland, Trevor J.
5. FUNDING NUMBERS
7. PERFORMING ORGANIZATION NAME(S) AND ADDRESS(ES) Naval Postgraduate School Monterey, CA 93943-5000
8. PERFORMING ORGANIZATION REPORT NUMBER
9. SPONSORING / MONITORING AGENCY NAME(S) AND ADDRESS(ES) N/A
10. SPONSORING / MONITORING AGENCY REPORT NUMBER
11. SUPPLEMENTARY NOTES The views expressed in this report are those of the author(s) and do not reflect the official policy or position of the Department of Defense or the U.S. Government. 12a. DISTRIBUTION / AVAILABILITY STATEMENT Approved for public release, distribution is unlimited.
12b. DISTRIBUTION CODE
13. ABSTRACT (maximum 200 words) The purpose of this MBA Project was to determine if a student’s Grade Point Average (GPA) while attending Naval School Explosive Ordnance Disposal (NAVSCOLEOD) is an accurate predictor of graduation. This project was conducted with the sponsorship and assistance of the Center for EOD and Diving, as well as NAVSCOLEOD. This project served to verify the graduation prediction model currently in use at NAVSCOLEOD is valid. The regression equation used in the graduation prediction model was updated with student data from 2004–2008.
NAVSCOLEODINST 5420.1U claims the model predicts successful completion of training for 95% of graduates who experienced a setback, and that the model is far more accurate overall than the traditional Academic Review Board (ARB) process. Based on student data from 2004–2008, the model predicted 94.1% would graduate and 5.9% would fail. This is not within the specified requirements of NAVSCOLEODINST 5420.1U.
We also conclude that the methodology used in the current graduation prediction model is not a true portrayal of student graduation or failure. This model proceeds from outcome to prediction, instead of the other way around. We discuss another approach that more logically proceeds from prediction to outcome and gives a clearer understanding of model accuracy.
15. NUMBER OF PAGES
75
SUBJECT TERMS NAVSCOLEOD, Academic Review Board, Graduation Prediction Model
16. PRICE CODE
17. SECURITY CLASSIFICATION OF REPORT
Unclassified
18. SECURITY CLASSIFICATION OF THIS PAGE
Unclassified
19. SECURITY CLASSIFICATION OF ABSTRACT
Unclassified
20. LIMITATION OF ABSTRACT
UU NSN 7540-01-280-5500 Standard Form 298 (Rev. 2-89)
Prescribed by ANSI Std. 239-18

ii
THIS PAGE INTENTIONALLY LEFT BLANK
iii
GRADE POINT AVERAGE AS A PREDICTOR OF SUCCESS IN EXPLOSIVE ORDNANCE DISPOSAL TRAINING
Sarah E. Turse, Lieutenant, United States Navy
Submitted in partial fulfillment of the requirements for the degree of
MASTER OF BUSINESS ADMINISTRATION
from the
NAVAL POSTGRADUATE SCHOOL
December 2009
Trevor J. Ritland, Lieutenant, United States Navy
Submitted in partial fulfillment of the requirements for the degree of
MASTER OF BUSINESS ADMINISTRATION
from the
NAVAL POSTGRADUATE SCHOOL March 2010
Authors: _____________________________________
Sarah E. Turse
_____________________________________ Trevor J. Ritland
Approved by: ______________________________
Samuel E. Buttrey, Lead Advisor ______________________________ Cary Simon, Support Advisor _____________________________________ Dr. William Gates, Dean
Graduate School of Business and Public Policy

iv
THIS PAGE INTENTIONALLY LEFT BLANK

v
GRADE POINT AVERAGE AS A PREDICTOR OF SUCCESS IN EXPLOSIVE ORDNANCE DISPOSAL TRAINING
ABSTRACT
The purpose of this MBA Project was to determine if a student’s Grade Point
Average (GPA) while attending Naval School Explosive Ordnance Disposal
(NAVSCOLEOD) is an accurate predictor of graduation. This project was conducted
with the sponsorship and assistance of the Center for EOD and Diving, as well as
NAVSCOLEOD. This project served to verify the graduation prediction model currently
in use at NAVSCOLEOD is valid. The regression equation used in the graduation
prediction model was updated with student data from 2004–2008.
NAVSCOLEODINST 5420.1U claims the model predicts successful completion
of training for 95% of graduates who experienced a setback, and that the model is far
more accurate overall than the traditional Academic Review Board (ARB) process. Based
on student data from 2004–2008, the model predicted 94.1% would graduate and 5.9%
would fail. This is not within the specified requirements of NAVSCOLEODINST
5420.1U.
We also conclude that the methodology used in the current graduation prediction
model is not a true portrayal of student graduation or failure. This model proceeds from
outcome to prediction, instead of the other way around. We discuss another approach that
more logically proceeds from prediction to outcome and gives a clearer understanding of
model accuracy.

vi
THIS PAGE INTENTIONALLY LEFT BLANK

vii
TABLE OF CONTENTS
I. INTRODUCTION........................................................................................................1
II. NAVSCOLEOD INSTRUCTION 5420.1U REVIEW..............................................9
III. LITERATURE REVIEW .........................................................................................15
IV. METHODOLOGY ....................................................................................................21
V. DATA VALIDATION ...............................................................................................23
VI. DATA ANALYSIS.....................................................................................................27
VII. MODEL VALIDATION ...........................................................................................31
VIII. LOWERING THE THRESHOLD...........................................................................35
IX. RESULTS ...................................................................................................................37 A. NUMBERS BY THE YEARS.......................................................................38
1. Year 2004 ............................................................................................38 2. Year 2005 ............................................................................................39 3. Year 2006 ............................................................................................40 4. Year 2007 ............................................................................................41 5. Year 2008 ............................................................................................42
B. SERVICE-SPECIFIC ANALYSIS...............................................................43 1. Overall School Statistics ....................................................................44 2. U.S. Army ...........................................................................................44 3. U.S. Air Force.....................................................................................46 4. U.S. Marine Corps .............................................................................47 5. U.S. Navy.............................................................................................49 6. Service Results....................................................................................50
C. SETBACKS BY DIVISION..........................................................................51 D. NON-ACADEMIC TERMINATIONS ........................................................52
X. CONCLUSION ..........................................................................................................55
LIST OF REFERENCES......................................................................................................57
INITIAL DISTRIBUTION LIST .........................................................................................59

viii
THIS PAGE INTENTIONALLY LEFT BLANK

ix
LIST OF FIGURES
Figure 1. Backward-Looking Analysis ...........................................................................27 Figure 2. Forward-Looking Analysis ..............................................................................28 Figure 3. Divisional Setbacks..........................................................................................52 Figure 4. Non-Academic Terminations...........................................................................53

x
THIS PAGE INTENTIONALLY LEFT BLANK

xi
LIST OF TABLES
Table 1. Missed Students Based on Sample Size ..........................................................10 Table 2. ARB Model Probability Matrix .......................................................................12 Table 3. FY05 ARB Model Validation..........................................................................12 Table 4. FY05 ARB Model Validation with a more Liberal Decision Threshold.........13 Table 5. 2004–2005 Student Setback Data (Threshold = .5) .........................................24 Table 6. 2004–2005 Predictions Compared to Graduation Results ...............................24 Table 7. 2004–2005 Forward-Looking Analysis ...........................................................28 Table 8. 2004–2008 Student Setback Data (Threshold =.5) ..........................................32 Table 9. 2004–2008 Backward-Looking Analysis ........................................................32 Table 10. 2004–2008 Forward-Looking Analysis ...........................................................33 Table 11. 2004–2008 Student Setback Data (Threshold = .4) .........................................35 Table 12. 2004–2008 Backward-Looking Analysis ........................................................35 Table 13. 2004–2008 Forward-Looking Analysis ...........................................................35 Table 14. 2004 Student Setback Data (Threshold = .5) ...................................................38 Table 15. 2004 Backward-Looking Analysis ..................................................................38 Table 16. 2004 Forward-Looking Analysis .....................................................................39 Table 17. 2005 Student Setback Data (Threshold = .5) ...................................................39 Table 18. 2005 Backward-Looking Analysis ..................................................................39 Table 19. 2005 Forward-Looking Analysis .....................................................................40 Table 20. 2006 Student Setback Data (Threshold = .5) ...................................................40 Table 21. 2006 Backward-Looking Analysis ..................................................................40 Table 22. 2006 Forward-Looking Analysis .....................................................................41 Table 23. 2007 Student Setback Data (Threshold = .5) ...................................................41 Table 24. 2007 Backward-Looking Analysis ..................................................................41 Table 25. 2007 Forward-Looking Analysis .....................................................................42 Table 26. 2008 Student Setback Data (Threshold = .5) ...................................................42 Table 27. 2008 Backward-Looking Analysis ..................................................................42 Table 28. 2008 Forward-Looking Analysis .....................................................................43 Table 29. 2004–2008 U.S. Army Data.............................................................................45 Table 30. 2004–2008 Backward-Looking Analysis ........................................................45 Table 31. 2004–2008 Forward-Looking Analysis ...........................................................45 Table 32. 2004–2008 U.S. Air Force Data ......................................................................46 Table 33. 2004–2008 Backward-Looking Analysis ........................................................47 Table 34. 2004–2008 Forward-Looking Analysis ...........................................................47 Table 35. 2004–2008 U.S. Marine Corps Data................................................................48 Table 36. 2004–2008 Backward-Looking Analysis ........................................................48 Table 37. 2004–2008 Forward-Looking Analysis ...........................................................48 Table 38. 2004–2008 U.S. Navy Data .............................................................................49 Table 39. 2004–2008 Backward-Looking Analysis ........................................................49 Table 40. 2004–2008 Forward-Looking Analysis ...........................................................50

xii
THIS PAGE INTENTIONALLY LEFT BLANK
xiii
LIST OF ACRONYMS AND ABBREVIATIONS
ARB Academic Review Board DOR Drop on Request GPA Grade Point Average IEDs Improvised Explosive Devices LSI Learning Styles Inventory MIDAS Multiple Intelligences Developmental Assessment Scales NAVSCOLEOD Naval School Explosive Ordnance Disposal RFF Request for Forces TO Training Officer USA United States Army USAF United States Air Force USMC United States Marine Corps USN United States Navy

xiv
THIS PAGE INTENTIONALLY LEFT BLANK

1
I. INTRODUCTION
The wars in Iraq and Afghanistan, coupled with President Bush’s 2007-troop
surge and President Obama’s 2009-troop increase have had numerous ramifications for
the military. These effects have impacted not only the coalition forces sent directly into
combat, but also the multiple training pipelines required to support the request for forces
(RFF). President Bush’s deployment of an additional 21,500 troops to Baghdad and Al-
Anbar province in March of 2007 increased total U.S. forces in the country to 135,000
(Iraq by the Numbers, 2007). President Obama’s deployment of 17,000 additional troops
in Afghanistan has put additional stressors on the military force. These new force
requirements strain the EOD community that is undermanned in all four services.
Currently enlisted manning for Navy EOD is at 95% of authorized strength;
however, Zone A manning (sailors who have 17 months to six years of service) is only 75
percent. The Air Force is manned at 80%, the Army at 84% and the Marine Corps at
78%, according to personal correspondence with respective service representatives.
Keeping this highly trained force at capacity is a continual challenge as Improvised
Explosive Devices (IEDs) continue to be the number one killer in the war on terror
(JIEDDO, 2008). According to the Joint Improvised Explosive Device Defeat
Organization’s Annual 2008 Report, IEDs are the weapon of choice for terrorists
worldwide. IED construction requires limited skill and gives the terrorist “the ability to
conduct spectacular attacks for relatively small investment. IEDs continue to provide the
enemy with inexpensive, stand-off, precision weapon systems that often provide the
attacker with near total anonymity” (JIEDDO, 2008).
In calendar year 2006, total Joint EOD responses in combat zones totaled 20,890
(Wehmeyber, 2007). This number represents only one year of combat operations, while
EOD technicians have been deployed since 2003 and deployments are ongoing. Year
2007 was the first time since the initial IED attack in 2003 that the number of annual IED
incidents in Iraq began to decline. In 2008, IED accounted for only 40% of attacks on
coalition forces in Iraq, reaching their lowest levels since 2003. “The total number of IED
attacks in September 2008 was 33% of September 2007 and 22% of September 2006
2
levels” (JIEDDO, 2008). Although this decline is good news, the past five years of IED
incidents have strained the EOD force as EOD technicians have been tasked with
responding to each of these incidents. Even though IED incidents are decreasing in Iraq,
they represent 75% of enemy initiated action in Afghanistan. According to JIEDDO, “by
September 2008 total IED incidents in Afghanistan were roughly 25% higher than the
number experienced during the previous year and twice the number in 2006” (JIEDDO,
2008).
EOD technicians train to combat the prime killer of coalition forces on the
battlefield. Their missions include IED incidents, unexploded ordnance responses, route
clearance convoys, direct action support and post-blast analysis. The scope of the EOD
mission set is expanding as adversaries adapt and incorporate both low-tech and
increasingly sophisticated technologies to wage war, e.g., bombs made from fertilizers,
Internet recruiting, and cell-phone bomb activation. Deployment rates are at an all time
high, with dwell time in the Air Force reaching 1:1, meaning technicians are deployed as
often as they are home (Wehmeyber, 2007). Although the services offer various
incentives, such as early promotion, re-enlistment bonuses and special duty assignment
pays to EOD technicians, community manning remains insufficient to meet requirements.
As individual services increase the number of students at EOD School to counter these
manning shortfalls, attrition rates there are also a contributing variable to persistent low
manning strength.
To become an Explosive Ordnance Disposal technician, each candidate,
regardless of service affiliation, must complete an intensive training curriculum at Naval
School Explosive Ordnance Disposal (NAVSCOLEOD), Eglin Air Force Base Florida.
The program is both physically and mentally challenging, lasting at least 42 weeks, and
possibly more, depending on service and training setbacks. An academic setback occurs
when a student cannot complete the required learning objectives for a specific area of
study and must repeat the training. The Navy has the longest training pipeline, 68 weeks,
because of the inclusion of dive training, parachute training and tactical training

3
(Navy.mil, 2009). The attrition rate varies by service with the Air Force typically having
the highest and the Marine Corps the lowest. The overall attrition rate has averaged 27%
over the last five years (Andrea, 2009).
The training curriculum consists of 12 phases: 1) Core I, 2) Demolition, 3)
Reconnaissance, 4) Tools and Methods, 5) Core II, 6) Ground Ordnance, 7) Air
Ordnance, 8) Improvised Explosive Devices, 9) Biological and Chemical Weapons, 10)
Nuclear Weapons, 11) Weapons of Mass Destruction, and 12) Underwater Ordnance.
This last division is for naval personnel only. “Upon graduation, EOD technicians are
equipped with the skills to render safe and dispose of explosive material in permissive
and non-permissive environments” (Navy.mil, 2009). However, with an attrition rate
approaching 30%, graduating is difficult and manning continues to suffer.
The increasing EOD force requirements in Iraq and Afghanistan, added to the
existing manning shortfalls, have created a problem needing serious mitigation. One
solution (and the premise behind this story) is to increase student throughput substantially
at NAVSCOLEOD. From 2004 to 2008, billets at EOD School have increased from 777
students to 1,122 students, a 44% increase (Andrea, 2009).
The influx of personnel at the schoolhouse has caused a bottleneck effect when
students have experienced a training setback and await an Academic Review Board
(ARB). The ARB is designed to evaluate the student’s academic progress and make
recommendations concerning student training potential. A setback is administered when
students do not meet training objectives, most commonly evidenced in a written or
practical exercise test failure. An ARB may be convened at any time if the division
officer feels the student has become so far behind that training objectives will not be met
for the division, or the student appears to reflect a safety hazard (NAVSCOLEOD, 2008).
Approximately 40% of students attending the 42-week curriculum receive at least
one setback in training. (In years 2002–2007, there were 3,597 students and 1,391,
roughly 39% of students, experienced at least one academic setback). An ARB convenes
when a student fails both an initial test and the retest in any one of the 12 divisions. After
two test failures in a row, the student is removed from training while the ARB convenes.

4
The ARB determines if the student will be allowed to repeat the division, or will be
removed from training permanently. Typically, a student is granted one setback in
training, but if a second ARB must be convened, the probability a student will graduate is
low. Extensions in training are financially costly as they increase a student’s total time in
training. Non-graduation is even more costly as there is no return on investment on
capital or manpower (NAVSCOLEOD, 2008).
The goals of the ARB include helping students solve problems that may prevent
successful completion of training, as well as identifying which students are capable of
completing the training. The ARB also determines which students are unwilling or unable
to complete training and the board makes recommendations concerning its findings
(NAVSCOLEOD, 2008). The policy states that:
The Scope of Possible ARB Recommendations Includes:
1. Continue with Class: Continuation of training in the present class with or without remediation.
A. Without Remediation: The student is not required to take a retest and the student has met all training objectives.
B. With Remediation: The student is required to take a retest. The student has not met training objectives and must successfully pass retest prior to completion of division.
2. Setback: The student receives an extension of training with remediation. The student will repeat all or part of the current division or previous division curriculum as recommended by the ARB. Students will normally be setback only to repeat the training objectives that have not been satisfactorily demonstrated. If repeating additional training objectives that precede the failed training objective is a remediation method that will benefit the student, the ARB may recommend it.
3. Drop from Training: A student has not met training objectives and should be permanently removed from training. When the ARB recommends a drop from training the student must demonstrate unwillingness or inability to continue the training.

5
The ARB process is time-consuming, costly, and labor-intensive since it involves many players. Because of this, setbacks are granted only after all types of remediation are exhausted. The following people have authority and responsibility in the process in accordance with NAVSCOLEODINST 5420.1U:
1. Testing Officer. Ensure that the student is tested in accordance with instruction.
2. Instructor. Ensure NAVSCOLEOD Form 1610/1 Sections I through VII are completed properly. Once all information is correctly filled out the package will be forwarded to the Division Officer for action.
3. Division Officer. Ensure the student is counseled on his or her failure; fills out NAVSCOLEOD Form 1610/1, check previous sections for correctness and forward to the training officer for action.
4. Training Officer. Conduct student interview and review student’s academic history. For a student’s initial setback, the Training Officer (TO) will determine if the student meets the requirement for an academic setback or drop from training per instruction. For all other setbacks, an ARB will be convened. The Training Officer will ensure ARB packages are complete, deviation notice updated, and students are present prior to ARB convening in proper uniform. The Training Officer will work with CISO to ensure board composition is in compliance with instruction, based on service component.
5. ARB Board Chairman. Ensure boards are conducted per instruction. The student record with disposition recommendation will be forwarded to the Commanding Officer (CO) or Executive Officer (XO) by the Training Officer and via the Service Detachment Commander. The Executive Officer will retain final decision for ARB recommendations, which are agreed to by the Service Detachment Commander. All others will be forwarded to the Commanding Officer for final decision. In these cases, the Service Detachment Commander or his designated representative may present the board package to the CO. The Training Officer will take necessary action to effect the student’s disposition. If the student is dropped from training, he or she shall be turned over to the Training Support Officer or Service Detachment Commander. The second and all subsequent ARBs will consist of a chairman and at least two additional service members who shall be certified instructors.
6. Detachment Commanders. Service Detachment Commanders and/or Liaison Officers will be notified by the Training Department of all impending boards. Commanders will review the ARB package and make recommendations to the Commanding Officer.

6
7. Commanding Officer. Review all completed ARB packages and exercise final disposition authority in all cases unless the Service Commander disagrees with the ARBs recommendation. (NAVSCOLEOD, 2008)
NAVSCHOLEODINST 5420.1U also states:
Setbacks are categorized as Academic or Non-Academic depending on the circumstances. Non-academic setbacks may occur when the student is unable to complete training due to illness or special circumstances outside the control of the course or the student. Academic setbacks occur after the failure of the first retest. The Training Officer as a result of unsuccessful remediation and retesting may grant initial academic setbacks. Remediation efforts may include supplemental examinations by the Division Officer with approval of the Training Officer. Supplemental examination will only be given if an administered test is deemed invalid due to technical information or instructor error. The Training Officer will inform CISO when a supplemental test is directed. CISO will take appropriate action per NAVSCOLEOD instructions. If remediation can be achieved in any way other than setback, it shall be considered first. Students will be setback only when the training objectives have not been satisfactorily demonstrated. (NAVSCOLEOD, 2008)
The increase in the number of students at NAVSCOLEOD has, in turn, caused an
increase in ARBs. As there are no set faculty members employed solely to conduct
review boards, faculty are pulled from their primary jobs to sit as board members.
Moreover, the numerous responsibilities of each person in the ARB process reveal the
lengthy, time consuming, paper-work intensive procedure. An academic review board is
comprised of six people: one chairman, four service representatives and the student
himself or herself. A second ARB is comprised of an additional two board members.
Each review board lasts a minimum of 30 minutes, not including the hours of paperwork
and counseling that instructors and staff complete beforehand.
In the six months from October 2008 until March 2009, 306 students were subject
to an ARB. Had the Training Officer setback not been implemented (see section II), those
306 review boards would have required at least 918 man hours to handle this process
(306 boards x 6 people/board x 30 min/board). This number further breaks down into 765
hours lost to instructors and 153 hours lost to students. Instructors, therefore, lost over 95

7
days to review boards in the last six months (765 hours / 8-hours/day = 95.635 days) and
students lost 19 days to review boards in the last six months (153 hours / 8 hours/day=
19.125 days).
In addition, these days represent value forgone to the military as teachers are not
instructing and students are not learning. The average board member is an E-7 or above
and the student an E-5 or below. The average E-7 earns $245.24/day and the average E-5
earns $169.98/day (see Exhibit 2, FY 10 Projected Individual Programming Rates). A
simplified calculation using these numbers suggests an estimate of $27,000 lost to
conducting academic review boards over the last six months. (The days lost to review
boards can be converted into $23,298.80 cost to instructors (95 days x $245.24/day) and
$3,229 cost to students (19 days x $169.98), totaling $26,528.24 dollars). This amount
only takes into account the review board itself, not the hours spent on counseling,
paperwork and remediation; those costs are too variable to estimate for the purposes of
this paper. In addition, the time students wait to return to training is also a cost lost to the
military. It is clear that this lost time and money will continue to accumulate as student
population increases at the schoolhouse, presuming a stable attrition rate.

8
THIS PAGE INTENTIONALLY LEFT BLANK
9
II. NAVSCOLEOD INSTRUCTION 5420.1U REVIEW
Due to the high number of students awaiting academic review boards,
NAVSCOLEOD has developed the process of a Training Officer (TO) setback. This
process strives to minimize time lost to instructors and students by utilizing an interview
process and a graduation prediction model in lieu of an ARB to determine if a student
should be set back or dropped from training upon the failure of his or her first retest. The
model identifies students who are more likely to complete training upon their initial
setback based on historical data. If the student fails a test and a retest after his or her first
setback, a full ARB must be convened.
This model is currently in use, but the data is outdated. This MBA project updates
the model with current data from NAVSCOLEOD. The Academic Review Board
instruction 5420.1U describes the process of the Training Officer Setback:
The decision tool will improve training efficiency without compromising standards. The decision tool uses GPA and the first setback area to predict graduation. The tool predicts successful completion of training for 95% of graduates who experienced a setback, and the tool is far more accurate overall than the traditional ARB process.
The tool has an additional value in that changing the decision threshold allows it to predict nearly 100% of graduates while keeping false alarms in check. This decisional feature enables the tool to respond to forward demand signals more efficiently than the traditional ARB process.
Process. The student’s first Academic Review Board/Training Officer Setback will consist of reporting to the Training Office in proper service dress uniform. The TO, Assistant Training Officer or Training Leading Chief Petty Officer will interview the student. The justification to remove from or continue with training may be based upon the student’s grade point average and division recommendation where the student would be set back in. If the student is not at or below the minimum allowed GPA for the specific division the training office may grant a TO setback if warranted. The student will be recommended for drop if the GPA is less than that determined by the graduation prediction model. (NAVSCOLEOD, 2008)

10
This process virtually eliminates the need for an Academic Review Board for
those students whose GPA is above the historical average, indicating that those student
have a high probability of completing training and graduating from EOD school. If a
student’s average is below the allowed GPA, he or she will be dropped from training as
the model predicts it is highly unlikely this student will graduate. The instruction further
states:
Statistical Model. The model will only be used for the area of the first setback to help determine if a student has the ability to complete NAVSCOLEOD objectives, and will not be used to address any further academic failures.
Annual Statistical Certification. The statistical data used in lieu of the first ARB will be checked on an annual basis using the first class convening in the new fiscal year. This class will be used to ensure the statistical method is still valid. Every student within the class will be given an ARB vise using the model for first setback situations. Each student that is given an ARB will be compared to the model. Using the table below, the model non-graduate predictions should not differ by more than the number in the right hand column.
Table 1. Missed Students Based on Sample Size
Class Sample Size (Number of Students) Students that Graduate and Model Predicted Would Not
12–20 4 21–24 5 35–44 6
The Training Officer will be responsible for maintaining statistical validation data for this model. Additionally, the Training Officer will coordinate periodic Technical Training Acceptance Board review of the ARB instruction and the annual statistical validation results to ensure the process is producing desired results. Subsequent failure of retests will result in an ARB. (NAVSCOLEOD, 2008)
The Human Performance Center Detachment at the Center for Explosive
Ordnance Disposal and Diving provided a preliminary assessment of the model to
determine if the model satisfied Chapter 3 Section 6 NAVEDTRA 135 B. Two
statements were identified that may call into question the use of the ARB decision tool:

11
1. Students enrolled in Class “A” and “C” schools will be academically dropped from training only as a result of an ARB recommendation (p. 3-6-1).
A Class “A” School provides basic technical knowledge and skills required for a
rating and further specialized training. A Class “C” School provides advanced
knowledge, skills and techniques to perform a particular job in a billet (The Naval
Education and Training Command, 2009).
2. Administrative procedures that result in “automatic” drops or setback are not authorized (p. 3-6-2) (Swiergosz, Aaberg, & West, 2005).
The Performance Center determined that these factors are mitigated by the
following.
1. NAVEDTRA 135 does not dictate how an ARB decision will be made
2. The use of a decision tool does not preclude normal chain-of-command routing for CO approval
3. The decision tool is an unbiased recommendation
4. The decision tool is a better overall predictor of graduation outcomes than the traditional ARB process
5. Decision tool output will be forwarded to the International Military Student Manager when an international military student is under review (Swiergosz, Aaberg, & West, 2005)
The Performance Center also amplified:
NAVSCOLEOD collected data over a two-year period from FY04–FY05 to develop the decision tool that predicts successful completion of training. These efforts produced the following regression equation:
Graduation = −4.585 + 0.057 × GPA + 0.032 × Setback Area
where -4.585 is the y-intercept (the point at which the regression line crosses the y-axis), 0.057 is the coefficient for GPA and 0.032 is the coefficient for setback area (variable that represents the first test failure area). Expected outcome probabilities are show in Table 1 when the threshold for predicting graduation (no-yes; 0–1) is set at 0.5.

12
As shown in Table 1, the ARB decision tool is a robust predictor of graduation (95%); less than 5 % of students who actually graduate will be “missed.” It is also evident from Table 1 that the student receives a “benefit of the doubt” from the decision tool in that, successful completion of training is predicted 27% of the time when a student will actually fail (false-alarm).
To clarify, once a setback student graduates or fails, the school looks back at
whether or not his or her model score was above the decision threshold.
The decision threshold can be set to achieve different outcome probabilities. For example, setting the decision threshold at 0.4 is expected to predict nearly all occurrences of graduation and elevate the false-alarm rate from 27% to 66%.
Table 2. ARB Model Probability Matrix
The outcome distributions in Table 2 represent data collected during FY05 validation. These outcomes parallel the expected probabilities in Table 1.
Table 3. FY05 ARB Model Validation
The outcome distributions in Table 3 represent data collected during FY05 validation when the decision threshold was set at 0.4. The “hit” rate is parallel to the expected probabilities (100%) and the false alarm rate was significantly lower (49%) than the expected (66%) ( )2 1 6.38, .01x p= < .
13
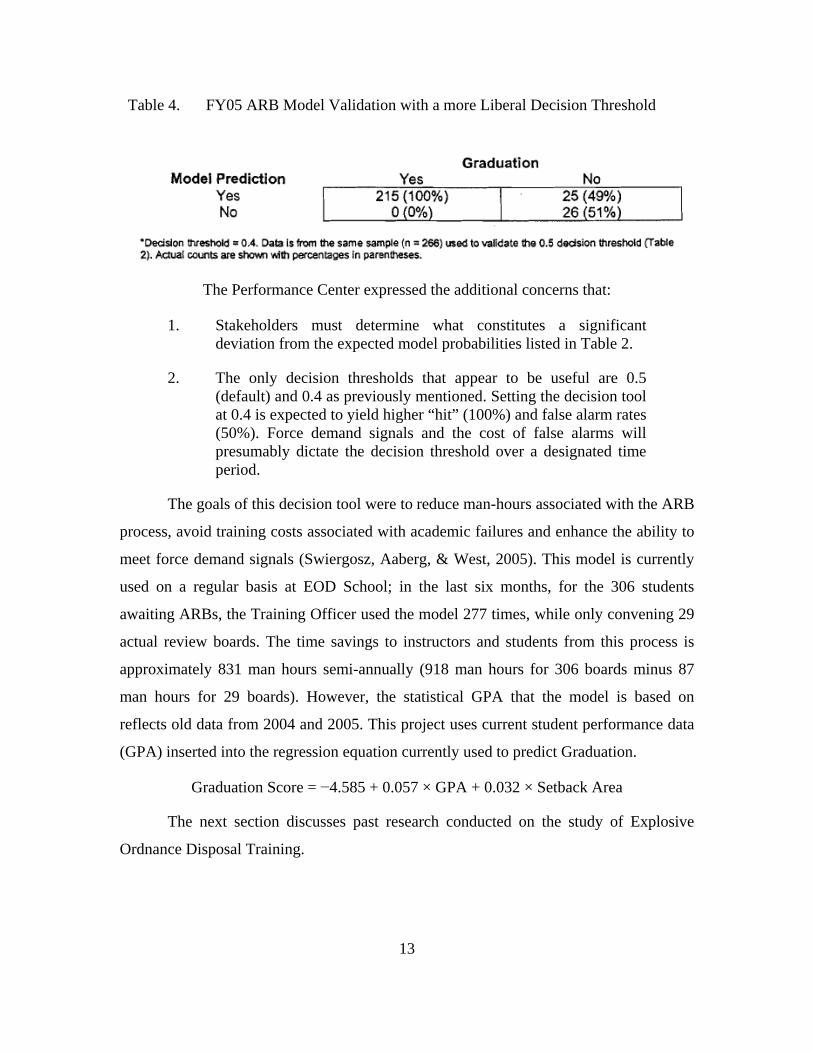
Table 4. FY05 ARB Model Validation with a more Liberal Decision Threshold
The Performance Center expressed the additional concerns that:
1. Stakeholders must determine what constitutes a significant deviation from the expected model probabilities listed in Table 2.
2. The only decision thresholds that appear to be useful are 0.5 (default) and 0.4 as previously mentioned. Setting the decision tool at 0.4 is expected to yield higher “hit” (100%) and false alarm rates (50%). Force demand signals and the cost of false alarms will presumably dictate the decision threshold over a designated time period.
The goals of this decision tool were to reduce man-hours associated with the ARB
process, avoid training costs associated with academic failures and enhance the ability to
meet force demand signals (Swiergosz, Aaberg, & West, 2005). This model is currently
used on a regular basis at EOD School; in the last six months, for the 306 students
awaiting ARBs, the Training Officer used the model 277 times, while only convening 29
actual review boards. The time savings to instructors and students from this process is
approximately 831 man hours semi-annually (918 man hours for 306 boards minus 87
man hours for 29 boards). However, the statistical GPA that the model is based on
reflects old data from 2004 and 2005. This project uses current student performance data
(GPA) inserted into the regression equation currently used to predict Graduation.
Graduation Score = −4.585 + 0.057 × GPA + 0.032 × Setback Area
The next section discusses past research conducted on the study of Explosive
Ordnance Disposal Training.

14
THIS PAGE INTENTIONALLY LEFT BLANK

15
III. LITERATURE REVIEW
Edwin Bundy, Roderick Sims, Stephen Briggs and Joyce and Robert Hogan have
conducted additional research on cognitive and non-cognitive predictors of success in
Explosive Ordnance Disposal training over the past 30 years. All these individuals strived
to predict accurately which students would be successful in EOD training. If military
detailers could recruit the “correct” candidate, attrition rates would decrease, manning in
the community would increase, and the military would receive maximum return on
investment as fewer resources are spent on non-graduates.
Bundy and Sims from the Technical Support Working Group, Explosives
Detection Subgroup, conducted a study called Commonalities in an uncommon
profession: Bomb disposal. The study discusses the importance of having highly trained,
responsive and consistent bomb disposal technicians in both the military and private
sector. The purpose of the article itself is to identify if specific learning styles and
intelligence strengths are common among professionals in this field through the
administration of analytical tests. The results can be used as a predictor of success in
bomb disposal training by identifying similar character traits that are inherent in
successful EOD technicians.
Their study sought to identify what cognitive characteristics make a “good” EOD
technician. More specifically, the purpose was to “investigate the extent to which
individual learner preferences, as measured by learning styles and multiple intelligences,
impact the effectiveness of bomb disposal training” (Bundy, 2007). Bundy determined
that learning style preferences and intelligence strengths could be used as predictors for
academic success because EOD technicians tend to share common traits. Bundy and Sims
identified these commonalities through the Canfield Learning Styles Inventory (LSI) and
Multiple Intelligences Developmental Assessment Scales (MIDAS). The caveat to his
claim is that other variables must be considered because this research did not address the
psychological and neuropsychological characteristics of EOD technicians.
16
The author sampled a wide demographic of EOD technicians, both civilian and
military and determined that commonalities existed despite race, age, gender, education,
and military affiliation. Bundy determined bomb technicians preferred specific learning
styles while showing aversion to others. In addition, EOD technicians shared similar
strengths and weaknesses in certain types of intelligence. The author’s goal is to use this
information to alter the training and education curriculum for EOD technicians to be
exploit these characteristics and to anticipate and accommodate their learning
capabilities. Identification of common strengths and weakness among bomb disposal
technicians is important knowledge for instructors. This will allow them to tailor training
to address problems that may incur in the field. In addition, this data can inform the EOD
selection process to select the proper candidate for EOD training more accurately.
Bomb technicians shared similar results on the LSI and MIDAS tests. Results
from the LSI showed strong commonalities in the three areas of the test (Bundy, 2007).
1. Conditions for Learning: over 75% of bomb technicians sampled showed high preference for the following.
• Detail: requiring specific information on assignments, requirements and rules
• Authority: desiring classroom discipline and maintenance of order
• Organizational: wanting course work to be logically and clearly organized with meaningful assignments and sequence of activities
• Competition: desiring comparison with others; needing to know how one is doing in relation to others
2. Expectation-for-Course-Grade: 72% reported a high Expectation-for-Course-Grade.
3. Learner Typology: technicians had preferences common to the Social/Applied and Independent/Applied categories. The categories are similar in that all prefer opportunities to work in situations that approximate real-world environments while Social learners seek work with others and Independents prefer to work alone in a self-selected path toward a goal.

17
Dr. Shearer, developer of the MIDAS test, reported that results from the bomb
technicians were unusual (Bundy, 2007). Technicians consistently rated themselves lower
in certain areas as compared with other segments of the population, but results were
uniformly consistent within the sample itself. Most technicians rated themselves strong
on the following.
1. Interpersonal Intelligence (44%): the potential for working with others, as used in understanding people, leading and organizing others, communicating and resolving conflicts.
2. Intrapersonal Intelligence (42%): the potential for understanding ourselves as used in recognizing one’s own strengths and weaknesses and setting personal goals.
EOD technicians, however, scored themselves extremely low on the following.
3. Musical Intelligence (24%): the potential for thinking in music; for hearing, recognizing and remembering patterns as used in singing, identifying sounds and remembering melodies and rhythms.
Comparison of the two tests showed that a high score on the Intrapersonal scale
of the LSI correlated with the high Expectation-for-Course-Grade on the MIDAS test
(Bundy, 2007). Translated, this means a person with a high degree of self-efficacy, or
self-worth, would have high expectations of receiving a good grade. Since each of these
areas was ranked highest by the majority of bomb technicians, this is perhaps an indicator
of potential success for future bomb technicians (Bundy, 2007).
Bundy and Sims agreed that bomb disposal is inherently dangerous and the EOD
community seeks to attract, train, and retain individuals who are physically, mentally and
emotionally capable of performing the diverse and complex tasks required of bomb
disposal technicians (Bundy, 2007). They further acknowledge that the EOD community
is continually understaffed in part due to the attrition rate during initial training. Their
research identified common characteristics among bomb disposal technicians. This data
can be used to distinguish mismatches between learning style preference or intelligence
strengths of an EOD candidate and those EOD technicians that have been successful in
the field.
This research is useful in pre-selecting EOD candidates, especially when used in
conjunction with the ASVAB and physical fitness test. In reference to this project,
18
perhaps it can be incorporated into the ARB’s decision of whether or not to keep a
student in training. If the student displays the common learning style preferences and
intelligence strengths shared by successful EOD technicians, he or she may be more
likely to graduate than a student who does not possess the similar characteristics.
Hogan, Hogan and Briggs (1984) wrote a study titled Psychological and Physical
Performance Factors Associated with Attrition in Explosive Ordnance Disposal Training.
The Naval Medical Research and Development Command supported their research. They
conducted three studies designed to predict performance in EOD training. The research
team followed a sample of students in all different phases of EOD training, some in the
beginning, some in the middle and still others close to graduation. Like Bundy, the team
wanted to develop valid measures to identify qualified candidates and reduce attrition
created by recruiting inappropriate personnel. The first study investigates psychological
factors underlying successful completion of the EOD School. The second study identifies
physical performance predictors of success in preconditioning training program. The
third study investigates both psychological and physical factors associated with
completion of a twelve-week second-class diver course. The goal was to develop a
comprehensive set of selection procedures and recommendations for recruiting potential
EOD candidates (Hogan, Hogan, & Briggs, 1984).
The first study investigated non-cognitive measures of a sample of EOD
technicians currently undergoing training at EOD School. Students were given four tests.
1. CPI (California Psychological Inventory)—the most fully validated measure of normal personality
2. HPI (Hogan Personality Inventory)—assesses six factors associated with status and popularity in everyday life: Intelligence, Adjustment, Prudence, Ambition, Sociability and Likeability
3. SDS (Self Directed Search)—the standard vocational preference battery
4. ASVAB (Armed Service Vocational Aptitude Battery)—the primary cognitive battery used in the Armed Services
The results of the multiple tests revealed EOD technicians were realistic,
investigative, intellectual, self assured and had social interests. These characteristics
paralleled the profiles of athletes, engineers, pilots or technicians. People who deviate

19
from this profile, such as artists or musicians may not be successful in EOD training and
will be at a high risk for attrition. However, candidates possessing these traits will more
likely to successfully complete the rigors of EOD training (Hogan, Hogan, & Briggs,
1984).
The research team also determined that the use of vocational preference and non-
cognitive measures are highly reliable predictors of academic success at EOD School.
The team also found that the ASVAB was of little utility and highly inaccurate in
selecting candidates who would ultimately graduate from EOD training (Hogan, Hogan,
& Briggs, 1984).
In their second study, Hogan et al. analyzed the physical aspect of Navy EOD
training. In 1982, pre-conditioning training and dive school accounted for 70% of the
total attritions in the entire Navy EOD training pipeline (Hogan, Hogan, & Briggs, 1984).
In 2008, pre-conditioning training accounted for 50% of attrition, dive training accounted
for 20% of attrition and EOD School for 30% of Navy attrition (Getman, 2009). Hogan,
et al. identified seven dimensions that provide a complete coverage of physical strengths
needed for job performance in any demanding field: Muscular Strength, Muscular Power,
Muscular Endurance, Cardiovascular Endurance, Flexibility, Balance, and
Neuromuscular Coordination.
The results of the physical study found that extensive array of measures are
necessary to predict performance in complex training programs. The researchers had to
administer 26 different physical tests to lead to accurate prediction of successful dive
training. They found that of the seven dimensions, that muscular strength was not a
predictor of performance. Similarly, height, weight and body fat were not accurate
predictors either. These findings suggest that successful performance in an arduous
physical job is not related to physical size or strength. The best predictor, they determined
was cardiovascular endurance (Hogan, Hogan, & Briggs, 1984).
Their final study combined multiple elements, such as psychological, cognitive,
physical and manual dexterity to predict successful completion of dive training. They
found that attrition in dive training is due to a specific set of factors. Students do not tend

20
to fail due lack of cognitive competency; they did not typically attrite for academic
reasons. Instead, personal and physical factors were the primary reasons for training
failures. The psychological tests determined that students who were successful in dive
training were well-adjusted, self-confident and mature, as well as hard working and
achievement oriented. Those who were not successful were categorized as immature,
anxious and self-doubting. The physical tests most predictive of successful performance
were cardiovascular and muscular endurance. Therefore, candidates must be able to
persist in physical activity while withstanding fatigue to graduate from dive training
(Hogan, Hogan, & Briggs, 1984).
Overall Hogan, Hogan and Briggs indentified predictors for success during the
academic portion of EOD School. They have also determined who will fail out of pre-
conditioning training and who is at risk to attrite during dive training. By testing EOD
candidates with the SDS and HPI and incorporating cardiovascular endurance runs into
the screening process, program managers can significantly reduce attrition in the EOD
community (Hogan, Hogan, & Briggs, 1984).
The extensive research done in this field dating from 1982 indicates that EOD
attrition is high. However, the problem lies not in the demanding and arduous EOD
training curriculum, but in the candidates selected for training. There exists a percentage
of the population who are not cut out for the highly stressful, physically demanding and
mentally challenging job of bomb disposal. Those people must be weeded out of the
process. However, if recruiters can use the research findings that successful EOD
technicians share similar traits while tweaking the screening process to include specific
psychological and physical factors to select the appropriate candidates from the
beginning, standards in the community would not suffer, manning would increase and the
military would experience cost savings.

21
IV. METHODOLOGY
Data was collected from EOD School on all student records from 1999 until 2009
in order to answer the research question “Is the graduation prediction model still valid?”
Of the students who experienced at least one academic setback, we calculated their
“model score” by imputing their unadjusted performance data (GPA) and their setback
area in training, into the regression equation:
Graduation Score = −4.585 + 0.057 × GPA + 0.032 × Setback Area
As stated before, −4.585 is the y-intercept (the point at which the regression line
crosses the y-axis), 0.057 is the coefficient for GPA and 0.032 is the coefficient for
setback area. The setback area is a number from 1 to 12 that corresponds with the
particular division in which the student failed two consecutive tests and was consequently
removed from training.
From years 2004–2008, the result from this equation produced a number ranging
from −.848 to 1.29, which we labeled “Model Score.” NAVSCOLEODINST 5420.1U
says, “The tool predicts successful completion of training for 95% of graduates who
experienced a setback.” To clarify, of all the students who graduate and had experienced
a training setback, 95% had had a model score of .5 or higher and therefore, the model
predicted correctly that he or she would graduate. On the other hand, only 5% of students
who graduated and who had experienced a training setback had had a model score below
.5, so that the model predicted incorrectly that they would not graduate. When the
threshold is lowered, more students will be “captured” and fewer graduates will be
“missed” by the model. For example, under the reduced threshold of .4 used in FY05, all
graduates with setbacks had model scores, at the time of setback, exceeding the threshold.
Translated, no student who graduated would have been mistakenly dropped from
training.
This is only one way to interpret the data; we will also be analyzing the same data
with a different perspective. The school’s instruction first asks, “Did the student
graduate?” and then looks back to find out what the model predicted. We also want to

22
look at the data with the perspective of predicting the student’s future at the point of his
or her setback. At the point of the setback, we want to know what the model predicted
and then compare it to the end result (graduated or not graduated). This will allow us to
determine how accurately the model can predict the end result of graduation or failure.
These two perspectives will be discussed in greater detail.

23
V. DATA VALIDATION
Our first step was to ensure the data we collected was representative of the data
used to build the regression equation in the first place. In order to do this, we had to filter
the data from the unabridged data set. Since the school’s regression equation was built
using calendar years 2004 and 2005, we focused only on the students who experienced a
setback during those years. We also filtered out non-academic drops and setbacks for
other than academic reasons, such as medical, administrative, behavioral or security
issues. With this filtered set, there were now only two reasons for a student’s termination,
graduation or an academic removal from training. Students who never experienced a
training setback were also filtered out. A model score cannot be calculated for these
students, as there is no “Setback Area” to be factored into the equation.
During the analysis of our data set, we noticed some issues that were cause for
concern. These issues included discrepancies in the labeling of the data, as well as
contradictory pieces of information within individual student records. A significant
mislabeling that we noticed was between the “Termination Reason” and “Graduation
Status.” We found numerous students who were listed as graduated from the school but
were apparently terminated due to academic and non-academic reasons. In addition, we
found students who were listed as terminated due to graduation yet their graduation status
was shown as “Not Graduating.” These conflicts made it difficult to determine the actual
number of students who graduated. Before we generated our results, we had to decide
what the “better” entry was and calculate our data based on that decision. We recommend
that EOD School be precise in its data entries, in order to ensure accurate research.
With the data we data we had, the filtered set for calendar years 2004 and 2005
resulted in a sample size of n = 627.
We examined four sets of students within that sample.
1. The students that the model predicted would graduate because they had a model score greater than .5 and did in fact graduate (366)
2. The students the model predicted would graduate because they had a model score greater than .5 but did not graduate (132)

24
3. The students the model predicted would not graduate because they had a model score less than .5 and actually did not graduate (89)
4. The students that the model predicted would not graduate because they had a model score less than .5 but actually did graduate (40)
These numbers are presented in Table 5.
Table 5. 2004–2005 Student Setback Data (Threshold = .5)
Graduated Prediction Yes No Total
Yes 366 132 498 No 40 89 129
Total 406 221 627
Converting this data into percentages produces the table below.
Table 6. 2004–2005 Predictions Compared to Graduation Results
Graduated Prediction Yes No
Yes 90.10% 59.70% No 9.90% 40.30%
Total 100.00% 100.00%
Table 6 reveals that using the data we collected, 90.1% of all the students who
graduated and experienced a training setback had had a model score of .5 or higher at the
time of setback, so that the model predicted correctly they would graduate. Only 9.9% of
students who graduated and experienced a training setback had had a model score below
.5, the model predicting incorrectly that they would not graduate. Simply stated, 9.9% of
all students who graduated and experienced a setback had been predicted to fail by the
model.
In addition, Table 6 shows that once a student experienced a training setback, the
model would err on the side of caution and give students the “benefit of the doubt.” Of
the students who did not graduate and experienced a setback, 59.7% had had a model
score greater than .5, so that the model predicted they would graduate. This represents a
cost lost to the military as the model retained students who would eventually fail.

25
We compared this data to the ARB Model Probability Matrix found in
NAVSCOLEODINST 5420.1U and referenced in Table 2. The model currently in use at
NAVSCOLEOD claims that 95% of graduates who experienced a setback would have
had model scores exceeding .5, while only 5% would have had scores below that
threshold. Our results of 90.1% and 9.9% do not meet criteria specified within the
instruction. This variation may be due to a difference in sample sizes. Our sample size of
627 was not the same as the school’s sample size of 1166 due to differences in data
filtering.
When the model was developed, the sample size of 1,166 included all students
from FY2004–2005, even those who never experienced a training setback. However, we
filtered out students who never experienced a training setback, as there is no “setback
area” to be factored into the regression equation. These students would not be able to tell
us if the model predicted correctly or incorrectly since they were never subject to the
model in the first place.

26
THIS PAGE INTENTIONALLY LEFT BLANK

27
VI. DATA ANALYSIS
Based on the data EOD School provided, we concluded our data set was slightly
different from the data used in the school’s instruction, as referenced in differences in
sample sizes. However, we will use the data that was provided to continue our analysis.
The first and most important point of this paper is to present two different ways to
analyze this data, the forward-looking analysis and the backward-looking analysis.
The analysis in NAVSCOLEODINST 5420.1U takes a backward-looking
approach in which the outcome is already known (i.e., a student graduates or does not
graduate). We will use the data in Table 5 and the corresponding percentages in Table 6
to represent this approach in Figure 1.
Figure 1 illustrates the setup to this analysis.
Figure 1. Backward-Looking Analysis
Knowing the outcome, students are divided into two groups-those who graduated
and those who did not. Once the groups are divided, the model focuses on each group and
looks back at what their corresponding model scores were at the time of setback. In the
graduation group, 90.1% of students had model scores greater than .5, so these students’
outcomes would have been correctly predicted at the time of the setback. Simply put, the
model correctly identified 90.1% of the graduates. Among graduates, 9.9% had scores
smaller than .5. Simply put, the model gave low scores to 9.9% of the graduates.

28
Among non-graduates, 59.7% had model scores above .5. Simply, the model
cautiously kept 59.7% of students who would eventually fail out. Although this number
may seem alarmingly high, it offers the student the “benefit of the doubt” by allowing
him or her to continue training. Finally, among non-graduates, 40.3% had model scores
below .5. The model correctly identified 40.3% of eventual non-graduates.
The forward-looking analysis allows us to examine the prediction success of the
model without knowing the outcome in advance. It shows that once you make a
prediction, you can determine the probability of getting the prediction correct. Table 7
provides another viewpoint of the data in Table 5.
Table 7. 2004–2005 Forward-Looking Analysis
Graduated Prediction Yes No Total
Yes 73.50% 26.50%100.00%No 31.00% 69.00%100.00%
Figure 2 further illustrates the setup to this analysis.
Figure 2. Forward-Looking Analysis
This approach is a more logical progression as the setback occurs first, followed
by the outcome of graduated or not graduated. For example, in calendar years 2004 and
2005, 129 students were predicted to fail EOD school. However, 40 of those students
(31%) went on to graduate. Conversely, 89 of those 129 students (69%) failed as
predicted. Of the 498 students who the model predicted to graduate, 132 (26.5%) would

29
have failed, while 366 (73.5%) would have been predicted correctly. As the School’s
instruction states, inaccuracy is more acceptable when the model predicts a graduation
and the student fails.
While the data used to generate the percentages in the backward-looking analysis
and the forward-looking analysis is the same, the viewpoints are different. Although the
graduation prediction model currently in use at EOD School is based on the backward-
looking approach, we claim that the forward-looking approach is a more logical way to
analyze the data.
The main differences in analyzing the data in Table 5 from years 2004 and 2005
are listed below. We use the shortened term “setbacks” to identify students who
experienced an academic training setback.
1. Correctly Predicting Graduation The Forward-Looking Analysis correctly predicts graduation in 73.5% of setbacks who had a model score of .5 or above.
The Backward-Looking Analysis noted a model score of .5 or above in 90.1% of those who graduated.
2. Incorrectly Predicating Graduation (False-Alarm) The Forward-Looking Analysis falsely predicts graduation in 26.5% of setbacks who had a model score of .5 or above.
The Backward-Looking Analysis noted a model score of .5 or above in 59.7% of those who did not graduate.
3. Correctly Predicting Failures (Non-Graduates) The Forward-Looking Approach correctly predicts failure in 69% of setbacks who had a model score of less than .5.
The Backward-Looking Approach noted a model score of less than .5 in 40.3% of those who did not graduate.
4. Incorrectly Predicting Failures (Would-be Graduates) The Forward-Looking Approach falsely predicts failure in 31% of those who had a model score less than .5.
The Backward-Looking Approach noted a model score of less than .5 in 9.9% of those who did graduate.
The last item is perhaps the most important difference between the two
approaches. These two viewpoints present the different levels of error in the graduation
prediction model. The forward-looking approach shows of all students the model predicts

30
will not graduate, 31% of those students actually will graduate. On the other hand, the
backward-looking approach shows of all students who graduated, 9.9% were predicted to
fail. The model would have dropped these students from training, but given the
opportunity they would go on to graduate and become EOD technicians. The backward-
looking analysis claims to “miss” a much smaller number of students (9.9%) then the
forward-looking analysis (31%). It is important for NAVSCOLEOD to recognize this
difference. By using the backward-looking approach, they believe their margin of error is
small, while the forward-looking approach shows a much larger error rate.

31
VII. MODEL VALIDATION
We have validated our data set and determined that our data is slightly different
than the data used to construct the graduation prediction model. We have also discussed
the two different approaches to analyze the data in this research. Now we can move on to
answereing the research question, “Is the model still valid?”
We extracted the data (GPA) from students who experienced an academic training
setback in years 2004–2008 to determine if the tool is still an accurate predictor of
graduation. We filtered out students in years 2009, as they have not yet completed
training. Again, we included only students who terminated their training for one of two
reasons, graduation or an academic removal from training. Non-academic drops and
setbacks for reasons, such as medical, administrative, behavioral or security were filtered
out of our data set. Students who never experienced a training setback were also filtered
out, as these students were never assigned a model score (since there was no setback area
to be factored into the regression equation). Finally, we removed students that we
determined were dropped because they had low model scores since these students never
had the opportunity to continue and graduate. The filtered data resulted in a sample size
of n = 1495.
Using a pivot table, we examined each student’s model score against a “Yes” or
“No” indicating actual graduation. Model scores from our sample ranged from −.848 to
1.29 and the model used a threshold of .5 and higher as the predictor of graduation. Said a
different way, if a student had a model score of .5 or greater the model would predict that
he or she would graduate and therefore it would retain them in training. If a student had a
model score below .5, the model would predict that he or she would not graduate and
recommend that he or she be dropped from training. Our data produced Table 8.

32
Table 8. 2004–2008 Student Setback Data (Threshold =.5)
Graduated Prediction Yes No Total
Yes 927 386 1,313No 58 124 182
Total 985 510 1,495
As we did on Table 6, we focused the data into two groups (Graduated or Did Not
Graduate) and computed the percentages of whether the model predicted graduation or
failure. Using the backward-looking analysis, this data resulted in the following table:
Table 9. 2004–2008 Backward-Looking Analysis
Graduated Prediction Yes No
Yes 94.10% 75.70%No 5.90% 24.30%
Total 100.00% 100.00%
Comparing the results from Table 9 to Table 6, we see that the numbers have
changed only slightly over the years. In 2004–2005, of all the students who graduated,
the model predicted failure in 9.9% of those setback cases. Validating the model with
current data (2004–2008) revealed that of all the students who graduated, only 5.9% were
predicted to fail. These two numbers (5.9% and 9.9%) are similar, but proves the model
has gotten more accurate over the years in predicting success among graduates. This
5.9% is actually closer to the 5% threshold specified in NAVSCOLEODINST 5420.1U
than the earlier number.
In the years 2004–2005, of all students who failed, the model predicted that
59.7% would graduate. Validating the model with current data (2004–2008) revealed that
of all the students who failed, the model predicted 75.7% would graduate. These two
numbers (59.7% and 75.7%) are not close in range, and proves the model has become
more inaccurate over the years concerning this measure. It has allowed more students

33
who have a low probability of ever graduating to remain in training. This number
represents a cost to the military as there is no return on investment on students who do
not graduate.
In addition, the updated model accurately predicted the future of 94.1% of
graduates and 24.3% of non-graduates (compared to 90.1% and 40.3% in 2004–2005).
The model has gotten more accurate over the years in predicting graduates, but less
accurate in predicting non-graduates.
Using the forward-looking analysis for the same data gathered in years 2004
through 2008, the following table was generated.
Table 10. 2004–2008 Forward-Looking Analysis
Graduated Prediction Yes No Total
Yes 70.60% 29.40% 100.00%No 31.90% 68.10% 100.00%
Comparing the results from Table 10 to Table 7, we see that the numbers have
changed only slightly. In the years 2004–2005, among students who experienced an
academic setback, 31.9% of those predicted to not graduate by the model did, in fact,
graduate. These students would have been dropped from training by the model, however
given the opportunity to continue, they went go on to graduate. Validating the model with
current data (2004–2008) revealed that 31.9% of students who were predicted to fail by
the model actually went on to graduate. These two numbers (31% and 31.9%) are very
similar.
Validating the model with current data (2004–2008) revealed that 29.4% of
students predicted by the model to graduate actually failed out. This number is similar to
the 26.5% observed in years 2004–2005.
In addition, the updated model using the forward-looking approach accurately
predicted the graduation in 70.6% of those with high model scores and 68.1% of those
predicted to fail actually failed (compared with similar numbers of 73.5% and 69% in
years 2004–2005).

34
Overall, without regard to a specific analysis, the updated model accurately
predicted the future of 70.3% of setback cases (1,051 out of 1,495 students ) compared to
72.6% (455 out of 627 students) in years 2004–2005. Again, these numbers are similar,
but show that the model has dropped slightly in accuracy over the years.

35
VIII. LOWERING THE THRESHOLD
When the threshold is lowered to .4 (applying the same filters), our data produced
Table 11, with corresponding percentages in Tables 12 and 13, is produced.
Table 11. 2004–2008 Student Setback Data (Threshold = .4)
Graduated Prediction Yes No Total
Yes 957 429 1,386No 28 81 109
Total 985 510 1,495
Table 12. 2004–2008 Backward-Looking Analysis
Graduated Prediction Yes No
Yes 97.20% 84.10%No 2.80% 15.90%
Total 100.00% 100.00%
Table 13. 2004–2008 Forward-Looking Analysis
Graduated Prediction Yes No Total
Yes 69.0% 31.0% 100.00%No 25.7% 74.3% 100.00%
If the threshold is lowered to .4, Table 12 shows the model currently in use at
NAVSCOLEOD (backward-looking analysis) became more accurate (97.2% compared
to 94.1% at the .5 threshold).
Table 13 (forward-looking analysis) shows that the model correctly predicted
graduation 69% of the time (that is, 69% of students with model scores above .4 ended up
graduating), compared to 70.6% at the .5 threshold.

36
The benefit of lowering the threshold in both the forward- and backward-looking
analysis is an increase in overall prediction success. As seen above, the probability of
dropping a student who will eventually graduate is lowered.
The trade-off of decreasing the threshold is an increase in the false-alarm rate. In
both approaches, by lowering the threshold the model will keep students who will
ultimately never graduate. This represents a cost lost to the military, as there is no return
on investment for students dropped from training.

37
IX. RESULTS
To validate the model, we used backward-looking analysis as the forward-looking
analysis was not used to generate the graduation prediction tool. Using the backward-
looking approach and results from Tables 6 and 9 at the .5 threshold, we conclude that the
graduation prediction model currently in use at NAVSCOLEOD is not within the
specified requirements of NAVSCOLEODINST 5420.1U. The updated data in Table 9
shows that of all the students who graduated and experienced a training setback, the
model predicted 94.1% would graduate and 5.9% would fail. Although these percentages
are close, they do not meet the minimum threshold of the graduation prediction model
requirements of 95% and 5 percent. It is up to NAVSCOLEOD to decide whether this
level of error is acceptable.
In addition, the updated data from Table 9 shows students are still given the
benefit of the doubt from the decision tool. Of all students who fail, the model predicted
75.7% would graduate (this is a false alarm). The model will most likely retain a student,
when he or she will actually fail. This false alarm rate is much higher than in the original
ARB Probability Matrix in Table 2, which predicts only a 27% false alarm rate, while
updated data predicts a 75.7% false alarm rate. While the updated percentage reflects a
more conservative approach, there is a monetary cost associated with this.
When the threshold is lowered to .4, we can see, as expected, the improvement in
graduation prediction. The updated data from Table 12 shows that of all the students who
graduate and experience a training setback, the model predicted 97.2% would graduate
and 2.8% would fail. Although this is an improvement from the .5 threshold, it does not
meet the criteria of the instruction. The model validation in Table 4 (FY05) predicted
successful completion of training for 100% of the graduates who experienced a setback
when the threshold is lowered. We can see that current data did not predict 100%,
although it is within 4% of that lowered decision threshold. It is up to the chain of
command at EOD School to determine if this variation is acceptable.

38
Overall, rates based on current data are close to those in the criteria outlined in
NAVSCOLEODINST 5420.1U. Points of concern include a higher false-alarm rate and
variations at the .5 and .4 thresholds.
A. NUMBERS BY THE YEARS
After we looked at a large sample size (n = 1495) over the years 2004–2008, we
wanted to examine each year more specifically to see how much variation existed from
year to year. This would enable us to determine if variations from the instruction criteria
of 95% and 5% existed in all years, or if one year produced enough variation to skew the
entire data set. Tables 14 through 28 reflect data from each year.
1. Year 2004
Table 14. 2004 Student Setback Data (Threshold = .5)
Graduated Prediction Yes No Total
Yes 173 67 240 No 20 29 49
Total 193 96 289
Table 15. 2004 Backward-Looking Analysis
Graduated Prediction Yes No
Yes 89.6% 69.8% No 10.4% 30.2%
Total 100.00% 100.00%
Of all the students who graduated and experienced a setback, 89.6% were
predicted to graduate, while 10.4% were predicted to fail. These results are similar to our
overall findings regarding the backward-looking approach.

39
Table 16. 2004 Forward-Looking Analysis
Graduated Prediction Yes No Total
Yes 72.1% 27.9% 100.00%No 40.8% 59.2% 100.00%
Of all the students who were predicted to fail, 40.8% of them actually succeeded.
Simply, two out of every five students that were predicted to fail would have actually
graduated. These results are farther from the instruction criteria than the overall findings
of 31.9% regarding the forward-looking approach.
2. Year 2005
Table 17. 2005 Student Setback Data (Threshold = .5)
Graduated Prediction Yes No Total
Yes 193 101 294 No 20 60 80
Total 213 161 374
Table 18. 2005 Backward-Looking Analysis
Graduated Prediction Yes No
Yes 90.6% 62.7% No 9.4% 37.3%
Total 100.00% 100.00%
Of all the students who graduated and experienced a setback, 90.6% were
predicted to graduate, while 9.4% were predicted to fail. This data is similar to our
overall findings regarding the backward-looking approach.
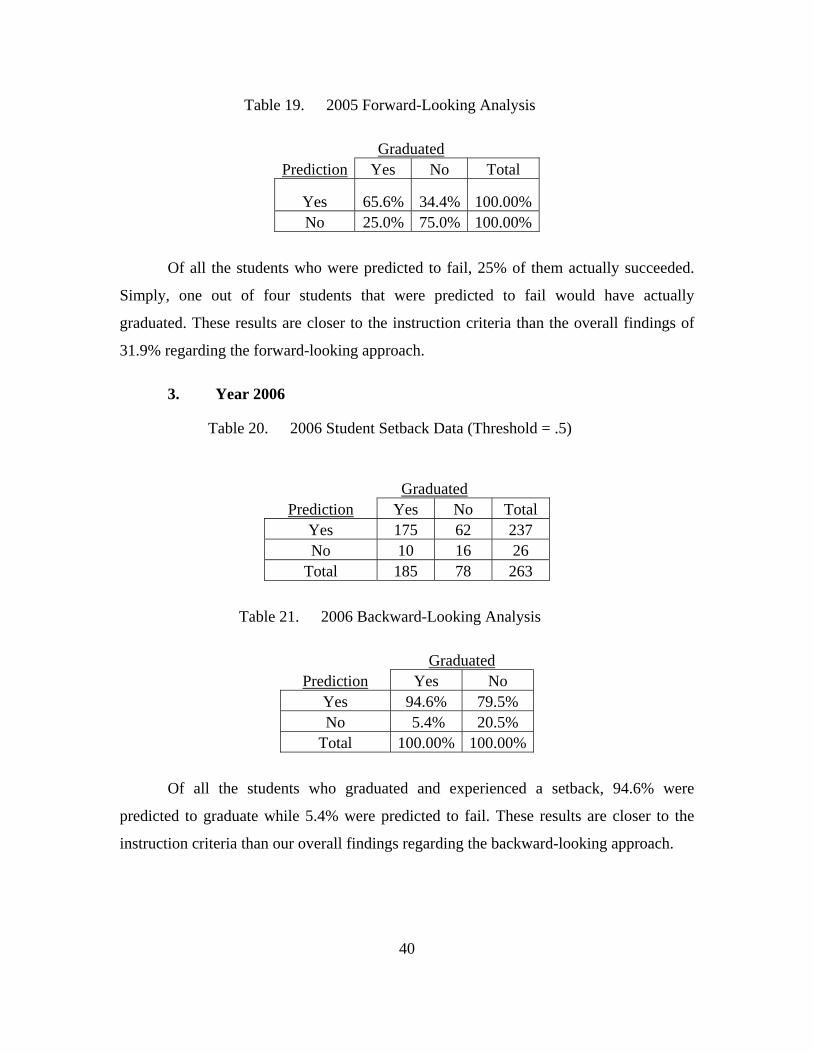
40
Table 19. 2005 Forward-Looking Analysis
Graduated Prediction Yes No Total
Yes 65.6% 34.4% 100.00%No 25.0% 75.0% 100.00%
Of all the students who were predicted to fail, 25% of them actually succeeded.
Simply, one out of four students that were predicted to fail would have actually
graduated. These results are closer to the instruction criteria than the overall findings of
31.9% regarding the forward-looking approach.
3. Year 2006
Table 20. 2006 Student Setback Data (Threshold = .5)
Graduated
Prediction Yes No Total Yes 175 62 237 No 10 16 26
Total 185 78 263
Table 21. 2006 Backward-Looking Analysis
Graduated Prediction Yes No
Yes 94.6% 79.5% No 5.4% 20.5%
Total 100.00% 100.00%
Of all the students who graduated and experienced a setback, 94.6% were
predicted to graduate while 5.4% were predicted to fail. These results are closer to the
instruction criteria than our overall findings regarding the backward-looking approach.
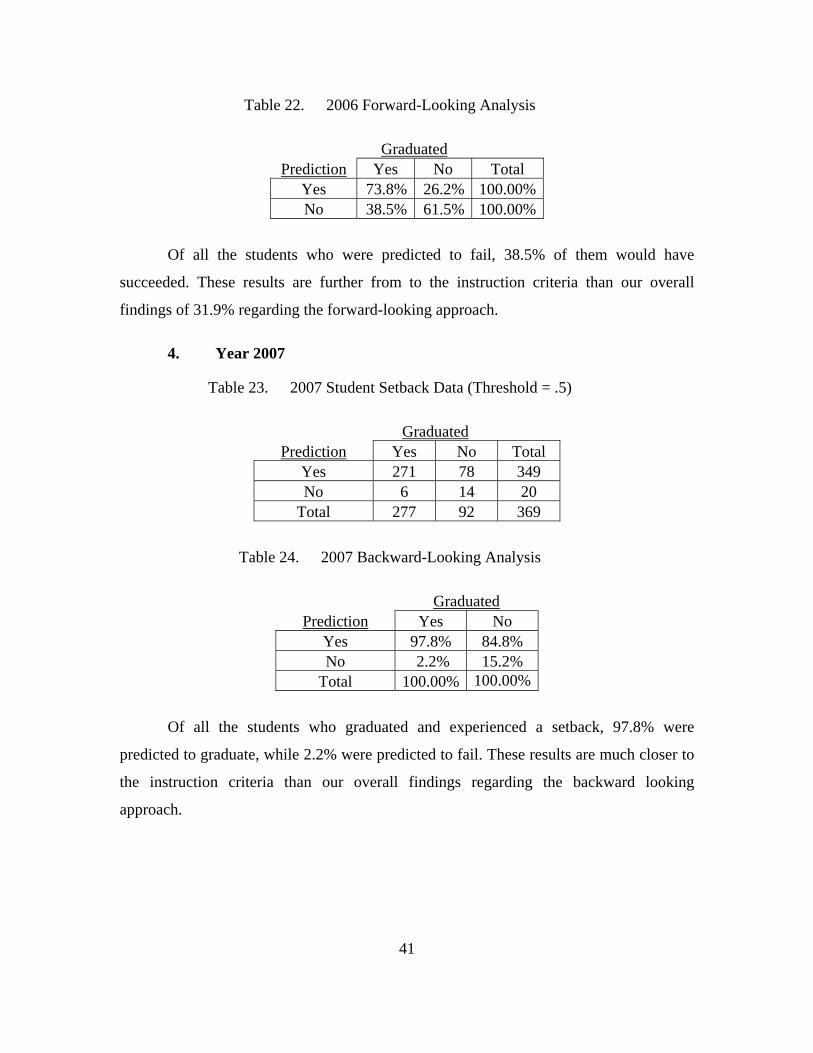
41
Table 22. 2006 Forward-Looking Analysis
Graduated Prediction Yes No Total
Yes 73.8% 26.2% 100.00%No 38.5% 61.5% 100.00%
Of all the students who were predicted to fail, 38.5% of them would have
succeeded. These results are further from to the instruction criteria than our overall
findings of 31.9% regarding the forward-looking approach.
4. Year 2007
Table 23. 2007 Student Setback Data (Threshold = .5)
Graduated Prediction Yes No Total
Yes 271 78 349 No 6 14 20
Total 277 92 369
Table 24. 2007 Backward-Looking Analysis
Graduated Prediction Yes No
Yes 97.8% 84.8% No 2.2% 15.2%
Total 100.00% 100.00%
Of all the students who graduated and experienced a setback, 97.8% were
predicted to graduate, while 2.2% were predicted to fail. These results are much closer to
the instruction criteria than our overall findings regarding the backward looking
approach.

42
Table 25. 2007 Forward-Looking Analysis
Graduated Prediction Yes No Total
Yes 77.7% 22.3% 100.00%No 30.0% 70.0% 100.00%
Of all the students who were predicted to fail, 30% of them actually succeeded.
These results are closer to the instruction criteria than our overall findings regarding the
forward-looking approach.
5. Year 2008
Table 26. 2008 Student Setback Data (Threshold = .5)
Graduated Prediction Yes No Total
Yes 115 78 193 No 2 5 7
Total 117 83 200
Table 27. 2008 Backward-Looking Analysis
Graduated Prediction Yes No
Yes 98.3% 94.0% No 1.7% 6.0%
Total 100.00% 100.00%
Of all the students who graduated and experienced a setback, 98.3% of them had a
model score of .5 or higher, while 1.7% had a model score lower than .5. The prediction
for graduation was very accurate; however, the false-alarm rate was extremely high. The
model kept 94% of students who would not graduate.
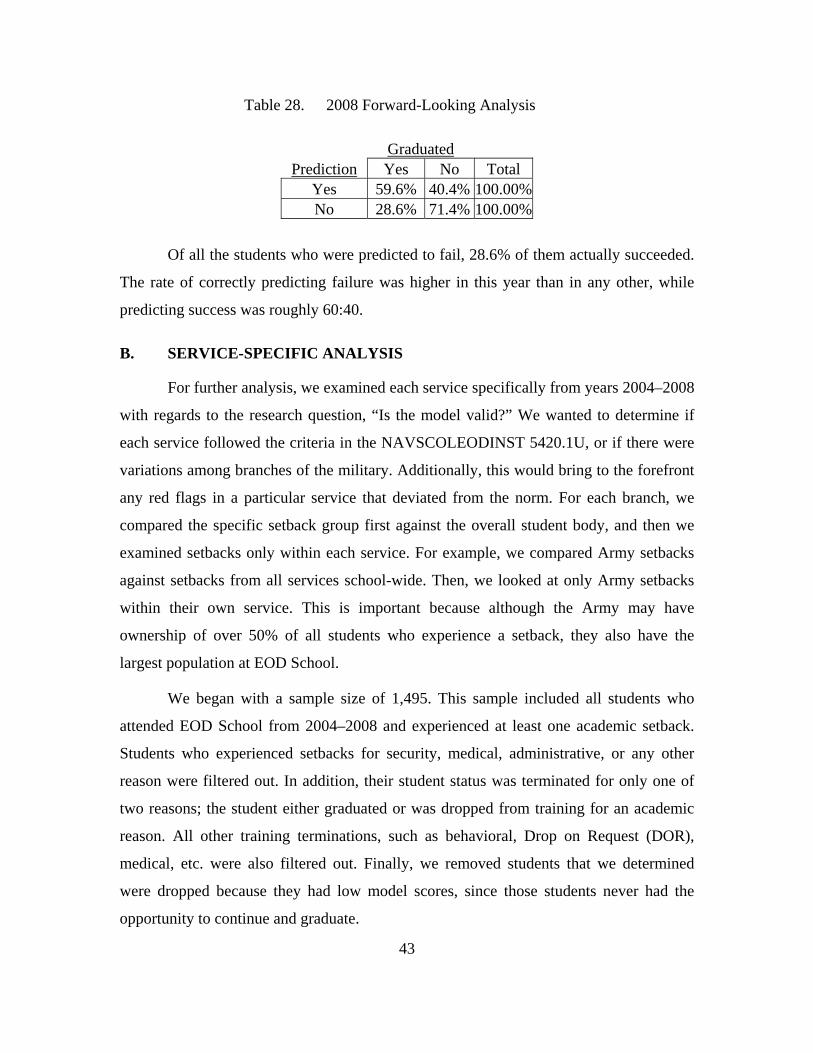
43
Table 28. 2008 Forward-Looking Analysis
Graduated Prediction Yes No Total
Yes 59.6% 40.4% 100.00%No 28.6% 71.4% 100.00%
Of all the students who were predicted to fail, 28.6% of them actually succeeded.
The rate of correctly predicting failure was higher in this year than in any other, while
predicting success was roughly 60:40.
B. SERVICE-SPECIFIC ANALYSIS
For further analysis, we examined each service specifically from years 2004–2008
with regards to the research question, “Is the model valid?” We wanted to determine if
each service followed the criteria in the NAVSCOLEODINST 5420.1U, or if there were
variations among branches of the military. Additionally, this would bring to the forefront
any red flags in a particular service that deviated from the norm. For each branch, we
compared the specific setback group first against the overall student body, and then we
examined setbacks only within each service. For example, we compared Army setbacks
against setbacks from all services school-wide. Then, we looked at only Army setbacks
within their own service. This is important because although the Army may have
ownership of over 50% of all students who experience a setback, they also have the
largest population at EOD School.
We began with a sample size of 1,495. This sample included all students who
attended EOD School from 2004–2008 and experienced at least one academic setback.
Students who experienced setbacks for security, medical, administrative, or any other
reason were filtered out. In addition, their student status was terminated for only one of
two reasons; the student either graduated or was dropped from training for an academic
reason. All other training terminations, such as behavioral, Drop on Request (DOR),
medical, etc. were also filtered out. Finally, we removed students that we determined
were dropped because they had low model scores, since those students never had the
opportunity to continue and graduate.

44
1. Overall School Statistics
Of all students in our filtered subset who experienced an academic setback from
2004–2008, 52.7% were from the United States Army (USA), 22.7% were from the
United States Air Force (USAF), 10.3% were from the United States Marine Corps
(USMC) and 13.5% were from the United States Navy (USN).
Breaking these numbers down further into two groups, students who graduate and
students who do not graduate, gives us more insight into service-specific differences. Of
all students who experience at least one academic setback and do not graduate, 53.6% are
USA, 26.3% are USAF, 6.0% are USMC and 13.5% are USN. The remaining 0.6%
belongs to civilians attending EOD School (the Coast Guard does not have EOD assets).
Of all students in our filtered subset who experience at least one academic setback
and do graduate, 52.1% are USA, 20.6% are USAF, 12.9% are USMC and 13.5% are
USN. The remaining 0.8% belongs to civilians attending EOD School. Although this
interesting, a more accurate picture of service specific trends is found by examining each
student setback rate against its own service population.
2. U.S. Army
Of all Army students who experience a setback, with no regard to model score,
34.6% of those students did not graduate, while 65.4% did. The number of students of
each sort is show in Table 29. However, with use of the graduation prediction model, we
can more accurately identify which students fit into the graduation and non-graduation
categories. Using the backward-looking analysis in NAVSCOLEODINST 5420.1U, we
see that of all USA students who graduated and experienced a setback, the model
predicted the success of 98.1% of those students, while only “missing” 1.9% (Table 30).
This is within the instruction standards of 95% and 5% regarding backward-looking
analysis.
The right hand side of the table reveals the false-alarm rate; of the students who
failed out of school, the model predicted that 87.1% of those students would graduate.
This represents a “benefit of the doubt” to students, but is a cost lost to the Army.

45
Table 29. 2004–2008 U.S. Army Data
Graduated Prediction Yes No Total
Yes 490 220 710 No 24 52 76
Total 514 272 786
Table 30. 2004–2008 Backward-Looking Analysis
Graduated Prediction Yes No
Yes 98.10% 87.10%No 1.90% 12.90%
Total 100.00%100.00%
The forward-looking analysis (Table 31) produces different statistics. Of all Army
students who were predicted to graduate, 69% of those students actually graduated.
However, of all Army students who were predicted to fail, 31.6% of those students
actually graduated. Among students who would have been dropped by the model, over
30% would have graduated and become EOD technicians.
The right hand side of the table reveals the false-alarm rate; among students with
setbacks predicted to graduate by the model, 31% eventually failed out of training. This
number is more accurate than the 87.1% calculated above.
Table 31. 2004–2008 Forward-Looking Analysis
Graduated Prediction Yes No Total
Yes 69.0% 31.0% 100.00%No 31.6% 68.4% 100.00%
Looking at Table 29, we see that there were only 24 students in five years (2004–
2008) that the model predicted would not graduate but in fact did. Similarly small sample
sizes appear in each service-specific table. Taking into account all the aforementioned
filters, the reason for such a small sample size in this block is reflective of the model
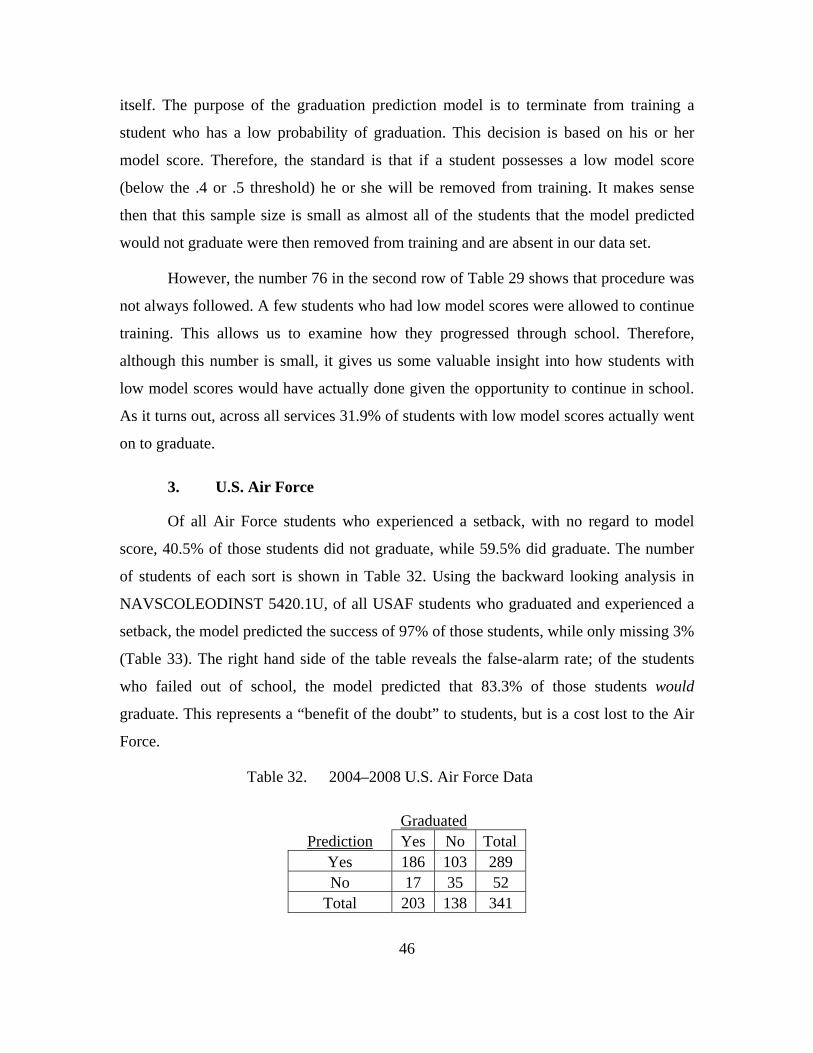
46
itself. The purpose of the graduation prediction model is to terminate from training a
student who has a low probability of graduation. This decision is based on his or her
model score. Therefore, the standard is that if a student possesses a low model score
(below the .4 or .5 threshold) he or she will be removed from training. It makes sense
then that this sample size is small as almost all of the students that the model predicted
would not graduate were then removed from training and are absent in our data set.
However, the number 76 in the second row of Table 29 shows that procedure was
not always followed. A few students who had low model scores were allowed to continue
training. This allows us to examine how they progressed through school. Therefore,
although this number is small, it gives us some valuable insight into how students with
low model scores would have actually done given the opportunity to continue in school.
As it turns out, across all services 31.9% of students with low model scores actually went
on to graduate.
3. U.S. Air Force
Of all Air Force students who experienced a setback, with no regard to model
score, 40.5% of those students did not graduate, while 59.5% did graduate. The number
of students of each sort is shown in Table 32. Using the backward looking analysis in
NAVSCOLEODINST 5420.1U, of all USAF students who graduated and experienced a
setback, the model predicted the success of 97% of those students, while only missing 3%
(Table 33). The right hand side of the table reveals the false-alarm rate; of the students
who failed out of school, the model predicted that 83.3% of those students would
graduate. This represents a “benefit of the doubt” to students, but is a cost lost to the Air
Force.
Table 32. 2004–2008 U.S. Air Force Data
Graduated Prediction Yes No Total
Yes 186 103 289 No 17 35 52
Total 203 138 341

47
Table 33. 2004–2008 Backward-Looking Analysis
Graduated Prediction Yes No
Yes 97.00% 83.30% No 3.00% 16.60%
Total 100.00% 100.00%
The forward-looking analysis, (Table 34) produces different statistics. Of all Air
Force students who were predicted to graduate, 64.6% of those students actually
graduated. However, of all Air Force students who were predicted to fail, 32.7% of those
students actually graduated. This is a much larger number than the 4% presented in the
backward-looking analysis. This is because these numbers represent different ratios.
Among students who would have been dropped by the model, 32.7% graduated and
became EOD technicians. The right hand side of the table reveals the false-alarm rate;
among students with setbacks predicted to graduate by the model, 35.4% eventually
failed out of training. This number is a better indicator of the model’s inaccuracy than the
83.3% calculated above.
Table 34. 2004–2008 Forward-Looking Analysis
Graduated Prediction Yes No Total
Yes 64.40% 35.40% 100.00%No 32.70% 67.70% 100.00%
4. U.S. Marine Corps
Marine Corps students who experienced a setback had the highest probability of
graduating among students from all the services. With no regard to model score, 81.4%
of those students graduate, while only 18.6% do not graduate. The number of students of
each sort is shown in Table 35. Using the backward looking analysis in
NAVSCOLEODINST 5420.1U, we can see that of all USMC students who graduated
and experienced a setback, the model predicted the success of 94.5% of those students,
while only missing 5.5% (Table 36). The right hand side of the table reveals the false-
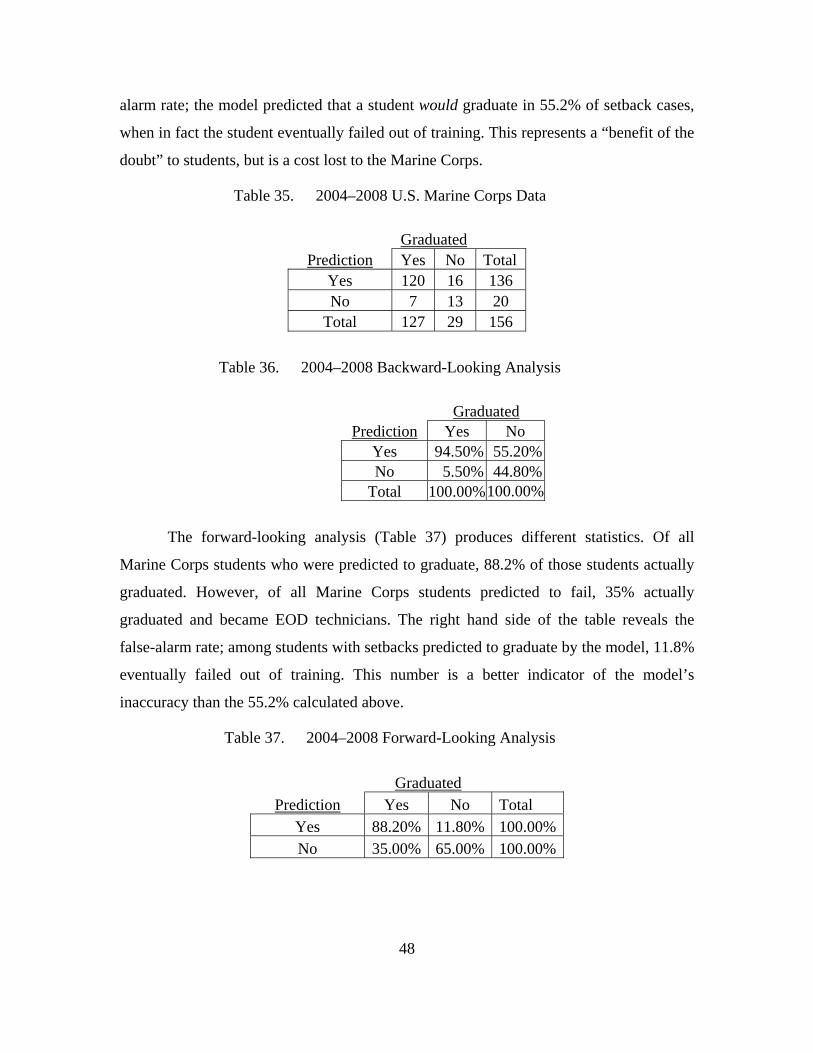
48
alarm rate; the model predicted that a student would graduate in 55.2% of setback cases,
when in fact the student eventually failed out of training. This represents a “benefit of the
doubt” to students, but is a cost lost to the Marine Corps.
Table 35. 2004–2008 U.S. Marine Corps Data
Graduated Prediction Yes No Total
Yes 120 16 136 No 7 13 20
Total 127 29 156
Table 36. 2004–2008 Backward-Looking Analysis
Graduated Prediction Yes No
Yes 94.50% 55.20%No 5.50% 44.80%
Total 100.00%100.00%
The forward-looking analysis (Table 37) produces different statistics. Of all
Marine Corps students who were predicted to graduate, 88.2% of those students actually
graduated. However, of all Marine Corps students predicted to fail, 35% actually
graduated and became EOD technicians. The right hand side of the table reveals the
false-alarm rate; among students with setbacks predicted to graduate by the model, 11.8%
eventually failed out of training. This number is a better indicator of the model’s
inaccuracy than the 55.2% calculated above.
Table 37. 2004–2008 Forward-Looking Analysis
Graduated Prediction Yes No Total
Yes 88.20% 11.80% 100.00%No 35.00% 65.00% 100.00%
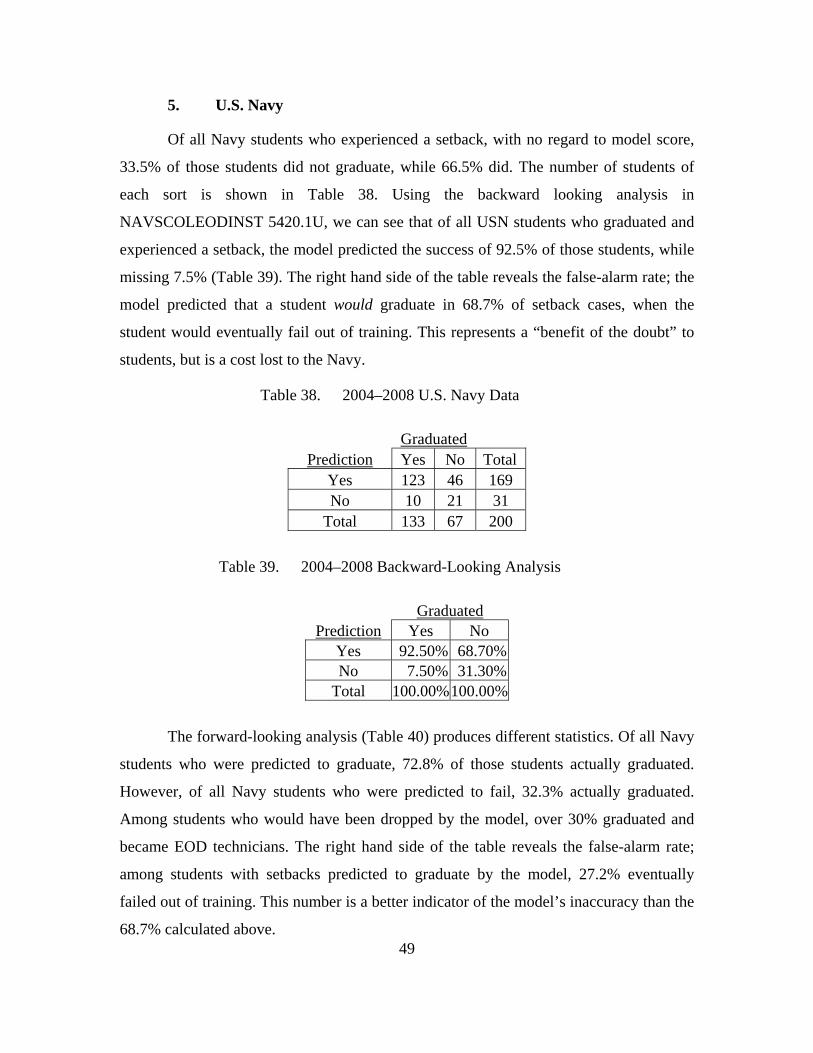
49
5. U.S. Navy
Of all Navy students who experienced a setback, with no regard to model score,
33.5% of those students did not graduate, while 66.5% did. The number of students of
each sort is shown in Table 38. Using the backward looking analysis in
NAVSCOLEODINST 5420.1U, we can see that of all USN students who graduated and
experienced a setback, the model predicted the success of 92.5% of those students, while
missing 7.5% (Table 39). The right hand side of the table reveals the false-alarm rate; the
model predicted that a student would graduate in 68.7% of setback cases, when the
student would eventually fail out of training. This represents a “benefit of the doubt” to
students, but is a cost lost to the Navy.
Table 38. 2004–2008 U.S. Navy Data
Graduated Prediction Yes No Total
Yes 123 46 169 No 10 21 31
Total 133 67 200
Table 39. 2004–2008 Backward-Looking Analysis
Graduated Prediction Yes No
Yes 92.50% 68.70%No 7.50% 31.30%
Total 100.00%100.00%
The forward-looking analysis (Table 40) produces different statistics. Of all Navy
students who were predicted to graduate, 72.8% of those students actually graduated.
However, of all Navy students who were predicted to fail, 32.3% actually graduated.
Among students who would have been dropped by the model, over 30% graduated and
became EOD technicians. The right hand side of the table reveals the false-alarm rate;
among students with setbacks predicted to graduate by the model, 27.2% eventually
failed out of training. This number is a better indicator of the model’s inaccuracy than the
68.7% calculated above.

50
Table 40. 2004–2008 Forward-Looking Analysis
Graduated Prediction Yes No Total
Yes 72.80% 27.20% 100.00%No 32.30% 67.70% 100.00%
6. Service Results
With regards to our original research question, “Is the model valid?” it appears
that when the data is broken down by service the model still holds for the USA and the
USAF. However, the USMC and USN are just outside the instruction requirements of
predicting 95% of graduates and missing 5 percent. We must remember the caveat that
there are two ways to interpret the data: the backward-looking approach and the forward-
looking approach. These results are based on the backward-looking approach, since that
is what the model was built on.
The NAVSCOLEODINST 5420.1U uses the backward-looking analysis, claiming
it predicts successful graduation in 95% of student setback cases, while only missing 5%
at the .5 threshold. When broken down by service, the USA and USAF meet those
criteria. The model predicts successful graduation in 98.1% of Army setbacks while only
missing 1.9%. It predicts successful graduation in 97% of Air Force setbacks while only
missing 3%. However, the USMC and USN are outside the instruction standards. The
model predicts 94.5% of Marine Corps graduates and 92.5% of Navy graduates while
only missing 5.5% and 7.5%, respectively. However, to be fair, the instruction is joint for
the entire school.
Analyzing the data from 2004–2005 with the forward-looking approach, we see
that of the students who were predicted to graduate across all services, 73.5% actually
graduated, while 26.5% did not. However, of the students who predicted to fail, 69%
actually failed, while 31% went on to graduate. Overall, the model accurately predicted
the end result in 72.6% of setback cases. It incorrectly predicted the end result in 27.4%

51
of setback cases. Breaking this down by service, there is a greater deviation from these
parameters. The following show the comparison between the services and the figures for
all of the services combined:
Army—Of the students who were predicted to graduate, 69% actually graduated, while 31% did not. Of the students who were predicted to fail, 68.4% actually failed while 31.6% went on to graduate. Overall, the model accurately predicted the end result in 69% of setback cases. It incorrectly predicted the end result in 31% of setback cases
Air Force—Of the students who were predicted to graduate, 64.4% actually graduated while 35.6% did not. Of the students who were predicted to fail, 67.7% actually failed while 32.3% went on to graduate. Overall, the model accurately predicted the end result in 64.8% of setback cases. It incorrectly predicted the end result in 35.2% of setback cases
Marine Corps—Of the students who were predicted to graduate, 88.2% actually graduated while 11.8% did not. Of the students who were predicted to fail, 65% actually failed while 35% went on to graduate. Overall, the model accurately predicted the end result in 85.3% of setback cases. It incorrectly predicted the end result in 14.7% of setback cases
Navy—Of the students who were predicted to graduate, 72.8% actually graduated while 27.2% did not. Of the students who were predicted to fail, 67.7% actually failed while 32.3% went on to graduate. Overall, the model accurately predicted the end result in 72% of setback cases. It incorrectly predicted the end result in 28% of setback cases
No service matches our 2004–2005 overall data findings regarding the forward-
looking approach. For example, the Marine Corps far exceeds our finding in correctly
predicting graduation, but falls short in accurately predicting failures. The best way to
analyze the service-specific data is to compare the percentages of how often the model
accurately predicted the end result. The model was the most accurate in predicting
Marine Corps success or failure, while it was least accurate for the Air Force.
C. SETBACKS BY DIVISION
We also examined the number of setbacks in each division from years 2004–
2008. This analysis will help future researchers determine if a more accurate regression
equation could be developed to account for where the student’s setback occurred in
school. In the current equation, the student’s setback division (1–12) is multiplied by a
coefficient (0.032) to generate the model score. Since the divisions increase in number

52
from 1 to 12, a student is more likely to succeed for every division that student passes.
The model score increases by an equal increment for each division. However, this equal
increase assumes that each division is equally difficult. We calculated the number of
failures in each division to analyze where students had their setbacks for the years
between 2004 and 2008. During these years, there were a total of 1,559 setbacks. The
following graph in Figure 3 represents our results.
Figure 3. Divisional Setbacks
There were students who are set back in the Chem/Bio, Nuclear, WMD, Area VIII
and Underwater divisions; their percentages are just too small to display on the graph. As
the graph shows, the number of setbacks generally increases through Air Division and
then drops off drastically. A more accurate model score might be computed by adjusting
the setback coefficient to reflect this information.
D. NON-ACADEMIC TERMINATIONS
Going back to our original unabridged data set, we also analyzed the non-
academic terminations between the years 2004 and 2008. Since man-hours and money

53
can be saved with an accurate prediction model, the military could experience similar
cost savings by focusing on the non-academic terminations as well. The following graphs
represent reasons for student termination from EOD School excluding academic reasons.
During this time period, 1,287 students were removed from school for non-academic
reasons out of 5,075 total students who attended school.
Figure 4. Non-Academic Terminations
Since 25% of students terminate training for non-academic reasons, a further
examination of these incidents could result in lower attrition rates and cost savings. In
addition, “unknown” and “general” reasons reflected the highest percentages of non-
academic terminations. More specific data would provide greater insight into these
termination categories.

54
THIS PAGE INTENTIONALLY LEFT BLANK

55
X. CONCLUSION
The purpose of this MBA Project was to determine if a student’s Grade Point
Average (GPA) while attending Naval School Explosive Ordnance Disposal
(NAVSCOLEOD) would be an accurate predictor of graduation. NAVSCOLEDOINST
5420.1U claims that the model predicts successful completion of training for 95% of
graduates who experienced a setback, and that the model is far more accurate overall than
the traditional ARB process. Based on updated student data from 2004–2008, the model
predicted 94.1% would graduate and 5.9% would fail. Although this is not within the
specified requirements of NAVSCOLEODINST 5420.1U, the numbers are similar and
stakeholders must determine what constitutes a significant deviation from the expected
model probabilities listed in Table 2.
We also conclude that the backward-looking analysis used in the graduation
prediction model is not an accurate portrayal of whether a student will succeed or fail.
That analysis proceeds from outcome to prediction, instead of the other way around. The
forward-looking analysis is a more logical approach. First, the prediction is made and
then the outcome of graduation or failure follows. This approach allows us to decide if
the prediction was correct at the time of setback.
We claim that the backward-looking approach does not produce a true picture of
student success or failure. There is a much smaller error statistic associated with this
analysis than with to the forward-looking approach. We claim the forward-looking
approach produces data that is more reflective of what is actually occurring at
NAVSCOLEOD. A larger percentage of students who would actually continue on to
graduate are being dismissed from training than what the backward-looking approach
leads one to believe.
We recommend that the forward-looking approach be the method of choice to
view student setback data. However, to produce the 95% prediction success rate as
claimed in NAVSCOLEODINST 5420.1U, a new model must be developed. Simply
lowering the threshold in the backward-looking approach will result in an increase in
56
prediction success. This was evident in Section VIII, Lowering the Threshold. However,
to reiterate, the backward-looking approach is not an accurate portrayal of student
graduation or failure.
However, lowering the threshold in the forward-looking approach will guarantee
neither an increase nor a decrease in prediction success, due to the difference in ratios. A
new model will determine if the prediction criteria of 95% at the time of setback is
achievable. The current model cannot be manipulated to produce these figures. A follow-
up thesis will address these issues. A graduation prediction tool at NAVSCOLEOD is
vital; the model conserves numerous man-hours that would be lost to the ARB process.
With student throughput increasing 44% from 2004 to 2008, an accurate model will be a
critical tool to handle the hundreds of student setbacks that occur every year.

57
LIST OF REFERENCES
Andrea, T. (2009, March). Assistant Training Officer Naval School Explosvie Ordnance Disposal. Eglin Air Force Base, FL.
Booth, W., Colomb, G., & Williams, J. (2003). The craft of research. Chicago: The University of Chicago Press.
Bundy, E. (2007). Commonalities in an uncommon profession: Bomb Disposal. Ascilite, 85–96.
Getman, R. (2009). High attritionin EOD and ND pipelines. Power Point Presentation. Panama City: Naval Center for EOD and Diving.
Hogan, J., Hogan, R., & Briggs, S. (1984). Psychological and physical performance factors associated with attrition in explosive ordnance disposal training. Bethesda: Office of Naval Research.
Iraq by the Numbers. (2007, March 19). Retrieved May 24, 2009, from Center for American Progress. http://www.americanprogress.org/issues/2007/03/iraq_by_the_numbers.html
JIEDDO. (2008). Joint improvised explosive device defeat organization FY 2008 report. Department of Defense.
Naval Education and Training Command, The (2009, October 5). Retrieved October 18, 2009, from Credential Opportunities On-Line. https://www.cool.navy.mil/navy-edu-train-sys.htm#a
NAVSCOLEOD. (2008). NAVSCOLEODINST 5420.1U Academic review board and student setback policy. Eglin Airforce Base, FL: Department of the Navy.
Navy.mil. (2009). Naval Explosive Ordnance Disposal. Retrieved May 24, 2009, from www.eod.navy.mil/training.htm
Swiergosz, M., Aaberg, W., & West, H. (2005). EOD academic review board preliminary fact finding. Panama City, FL: CENEODDIVE.
Wehmeyber, M. (2007). Explosive ordnance disposal. Power Point Presentation . Headquaters U.S. Air Force.

58
THIS PAGE INTENTIONALLY LEFT BLANK

59
INITIAL DISTRIBUTION LIST
1. Defense Technical Information Center Ft. Belvoir, Virginia
2. Dudley Knox Library Naval Postgraduate School Monterey, California
3. Samuel E. Buttrey Naval Postgraduate School Monterey, California
4. Cary Simon Naval Postgraduate School Monterey, California
5. Commanding Officer Naval School Explosive Ordnance Disposal Eglin Air Force Base Fort Walton Beach, Florida
6. Commanding Officer Center for Explosive Ordnance Disposal and Diving Panama City, Florida