Naval Aviation Safety: 2012 Year in Review -...
48
CAPT Lee Mandel CDR Chris Lucas LCDR Lisa Finlayson LT Tony Anglero Naval Safety Center Norfolk, VA 23511-4399 Naval Aviation Safety: 2012 Year in Review
Transcript of Naval Aviation Safety: 2012 Year in Review -...

CAPT Lee MandelCDR Chris Lucas
LCDR Lisa FinlaysonLT Tony Anglero
Naval Safety CenterNorfolk, VA 23511-4399
Naval Aviation Safety:2012 Year in Review

Disclosure Information84th Annual AsMA Scientific Meeting
CDR Christopher Lucas
I have no financial relationships to disclose.
I will not discuss off-label use or investigational use in my presentation

Code 14 (Aeromedical Division) Code 14 (Aeromedical Division)
LineupLineup
CAPT Lee Mandel, [email protected]
CDR Chris Lucas, [email protected]
LCDR Lisa Finlayson, [email protected]
LT Tony Anglero, [email protected]
X

Code 14 Core Functions• Mishap Prevention -Safety surveys
-Aeromedical analysis
-Human Factors analysis and trends
-Physiology analysis
• Teaching and Education -Student aeromedical officer course
-Safety presentations (conferences, squadrons)
• Resource Facilitation -Website
-Flight Surgeons Manual
-Data

Code 14 “Other” Activities
• Physiologic episodes in the F/A-18, T-45
• Fatigue (FAST program)
• Human Factors consults to surface, sub
• “Every time the phone rings…”

Naval Safety Center Websitehttp://www.public.navy.mil/navsafecen/Pages/aviation/aeromedical/Aeromedical.aspx

Flight Surgeon’s Biblehttp://www.public.navy.mil/navsafecen/Documents/aviation/aeromedical/duties/Pocket_Ref.pdf

Mishap Classification
• Class A - Total cost of damage greater than $2,000,000
- Aircraft destroyed or missing
- Fatality or permanent total disability
• Class B - Damage greater than $500,000 but less than $2,000,000
- Permanent partial disability
- Hospitalization of three or more personnel
• Class C• - Damage greater than $50,000 but less than $500,000
- Injury requiring 5 or more lost workdays

12
Mis
hap
rate
s pe
r 100
,000
flig
ht h
ours
Aviation Safety Historical Perspective
•Acquisition System Changes•Organizational Structure•Policy & Programs•Maintenance & Standardization•Technical Solutions•Training•Risk Management – Ops & Maint
Focus: Human Factors andSafety Information / Program Management
Angled decks
Aviation Safety Center
Squadron Safety program
Naval Aviation Maintenance Program, 1959
FRS, 1961
NATOPS, 1961
Ground Proximity Warning System (GPWS), 1978
ACT CRM
ORM HFACS
Navy Data
Fatalities: 131Aircraft: 139Cost: $4.5B
MFOQAORMASAPHF FOCUS

(774)(465) (1147) (2405) (6500) (11,727) (26,929)(42,500)
WW IIKorea
VietnamGulf War Bosnia OIF/OEF
Through 08 May 12
(Mean Time Between Class “A” Naval Aviation Flight Mishaps)
(51,373)
92971
2010-12

FY12 CLASS A FLIGHT MISHAPS
FY12 FINAL SUMMARY
15 CLASS A FLIGHT MISHAPS9 USN (5 JET, 4 ROTARY WING)
6 USMC (2 JET, 4 ROTARY WING)19 FATALTIES

FY-13 TO DATE

*see last slide for definition of UCI/LCI and FY12 Max explanation
CLASS A FLIGHT MISHAPS
Manned Aircraft Only
Nu
mb
er
Rat
e/10
0K F
lt H
rs
CLASS A MISHAPS/MISHAP RATE FY COMPARISON:
FY11 MISHAPS/MISHAP RATE:10-YEAR AVERAGE (FY02-11) MISHAPS/MISHAP RATE:
30-Sep-12 30-Sep-11
9/0.99
9/0.96
13.60/1.36
9/0.96
21
26
12 13 14
9
1411
79 9
4
0
2
4
6
0
5
10
15
20
25
30
2002 2003 2004 2005 2006 2007 2008 2009 2010 2011 2012 12 Max
Mishap Numbers
Mishap Rate
Rate UCI*
Rate LCI*

CLASS A FLIGHT MISHAPS Manned Aircraft Only
Nu
mb
er
Rat
e/10
0K F
lt H
rs
CLASS A FM/FM RATE FY COMPARISON:
FY11 MISHAPS/MISHAP RATE:10-YEAR AVERAGE (FY02-11) MISHAPS/MISHAP RATE:
30-Sep-11
6/2.18
7/2.448.80/2.60
7/2.44
30-Sep-12
15 11 18 9 6 7 7 4 4 7 6
3.89
2.91
5.18
2.52
1.922.05 2.26
1.41 1.46
2.44 2.18
0.00
2.00
4.00
6.00
8.00
0
5
10
15
20
25
30
2002 2003 2004 2005 2006 2007 2008 2009 2010 2011 2012
Mishap Numbers
Mishap Rate
Rate UCI*
Rate LCI*

Aircrew Human FactorsAircrew Human Factors
18
Class A FM
FY-11 FY-12
USN USMC USN USMC
Maintenance 1 1
Material 5 1 2
Aircrew-HF 4 2 4 3
M/Mat – Aircrew HF
4 3
Undetermined 1
Total mishaps with an ultimate characterization of Aircrew-Human Factors:
FY11: 10 of 16 (63%) FY12: 10 of 15 (66%) All aircrew humans factors are grouped together
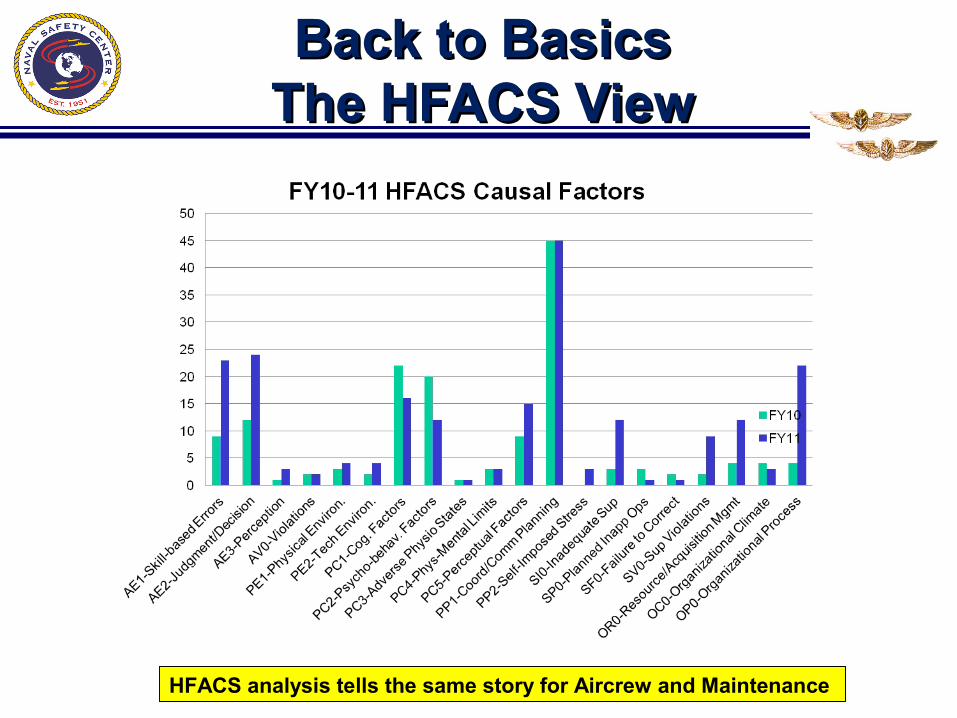
Back to BasicsBack to BasicsThe HFACS ViewThe HFACS View
19HFACS analysis tells the same story for Aircrew and Maintenance

Decreasing Mishap Rate and Cost
Costs in then year $ Decreasing Rate Controlling Mishap Costs

Cost
Total Fatalities: 59
Fatalities
PMV42
Current as of 20 Dec 2012
AVIATION$516M
Total Cost: $692M
USN – FY 2012
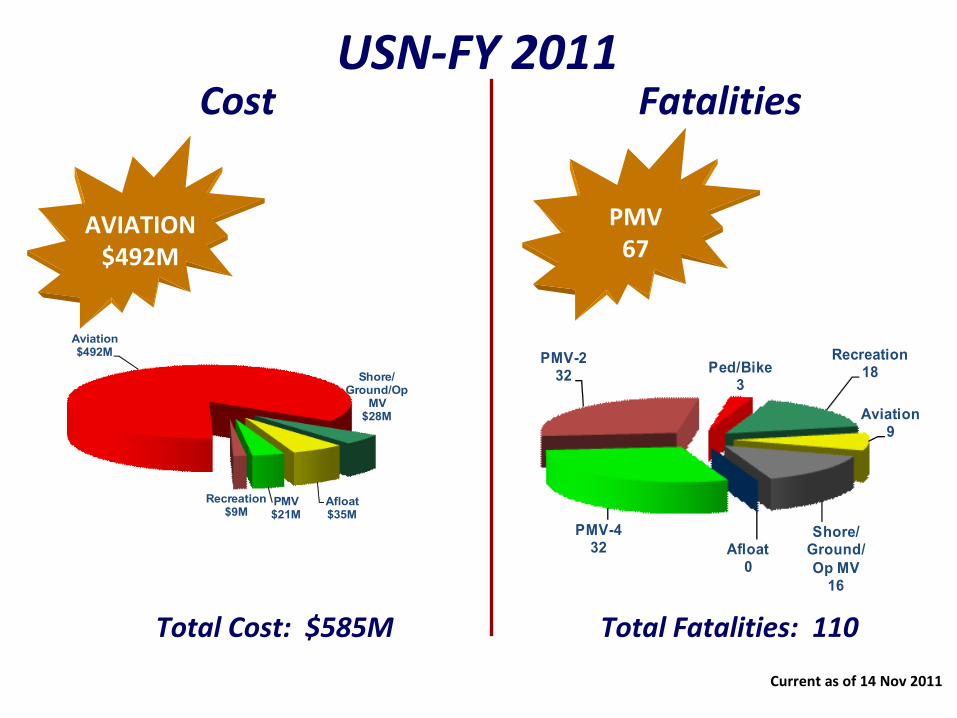
Cost
Total Fatalities: 110
PMV-432
PMV-232 Ped/Bike
3
Recreation18
Aviation9
Shore/Ground/Op MV
16
Afloat0
Fatalities
PMV67
Current as of 14 Nov 2011
PMV$21M
Recreation$9M
Aviation$492M
Shore/Ground/Op
MV$28M
Afloat$35M
AVIATION$492M
Total Cost: $585M
USN-FY 2011

• Vision– ZERO “preventable” mishaps
• Aviation A, B, C• Ground, flight related, flight• Operational, recreational, POV, etc.
• Method– More focus on HF cause factor prevention– Technology / Systems Safety– Programs– Leadership
Where We Are Going

• Traditional• HFACS / Human Factors• CRM / (O) RM
• Time Critical Risk Management (TCRM)• Safety Management System (3750.7R/S)• Culture Workshop• Safety Survey
• Improved Survey – not as much programmatic as Climate/Culture/Maintenance Risk Management focused
• CSA / MCAS• Safety Education
Where We Are GoingPrograms / Tools
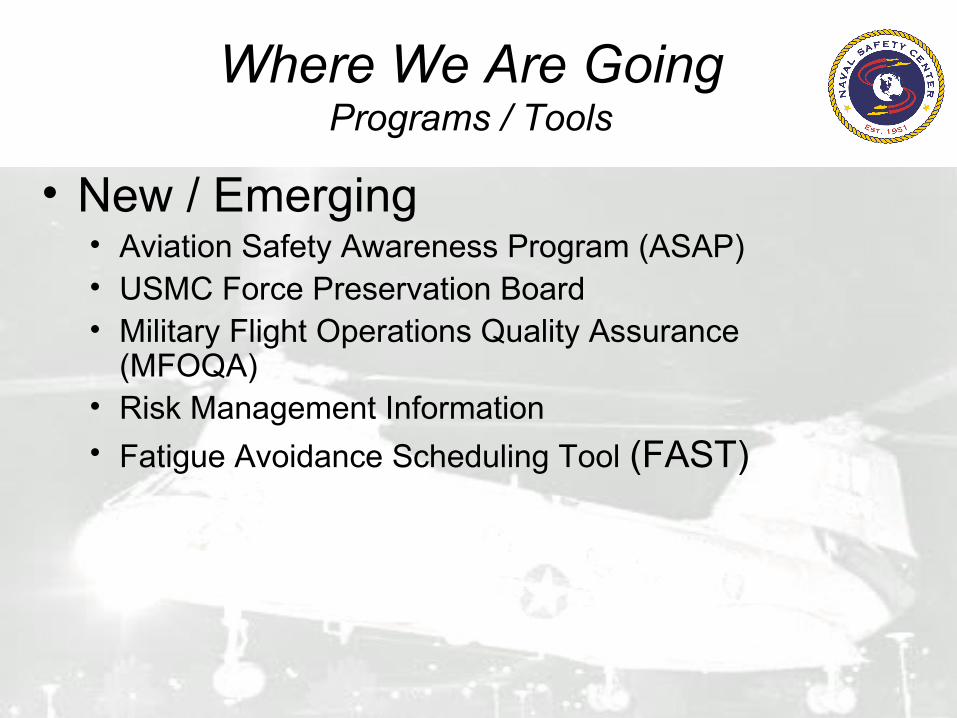
• New / Emerging• Aviation Safety Awareness Program (ASAP)• USMC Force Preservation Board• Military Flight Operations Quality Assurance
(MFOQA)• Risk Management Information
• Fatigue Avoidance Scheduling Tool (FAST)
Where We Are GoingPrograms / Tools

26
QUESTIONS?

Naval Safety Center AeromedicalContact List
• CDR Christopher Lucas–Flight Surgeon– [email protected] 757-444-3520x7268
• LCDR Lisa Finlayson– Aerospace Physiologist– [email protected] 757-444-3520 x7229
• LT Antonio Anglero– Aerospace Experimental Psychologist– [email protected] 757-444-3520x7231
27

Additional Slides

FY11/FY12 Class A Characterizations*
• Factors leading up to mishaps fall into in 4 bins– Material Failure only– Maintenance Factors only– Aircrew-related Human Factors (Aircrew Error)– Maintenance or material factors followed by Aircrew-related
Human Factors**
• FY11 and FY12 – majority of Class A mishaps characterized as Aircrew- related Human Factor related.
** Events where aircrew-related human factors errors follow maintenance or material failure are ultimately characterized as Aircrew-related HF events.
29*Characterization not to be confused with accepted cause factors.

FY11/12 Class A FM FY11/12 Class A FM TotalsTotals
• Class A MishapsClass A Mishaps FY11: 16FY11: 16 FY12: 15 (to date)FY12: 15 (to date)
• Aircrew Human Factors InvolvedAircrew Human Factors Involved FY11: 10 of 16FY11: 10 of 16 FY12: 10 of 15 (to date)FY12: 10 of 15 (to date) 65% of all class A losses in FY11 & 12.65% of all class A losses in FY11 & 12.
• In Field Takeoff, Hover & Landing EnvironmentIn Field Takeoff, Hover & Landing Environment FY11: 5 of 10FY11: 5 of 10 FY12: 7 of 10 (to date)FY12: 7 of 10 (to date) 60% of all class A losses due to Aircrew Human Error.60% of all class A losses due to Aircrew Human Error.
Aircrew humans factors mishaps parsed to T/O, hovering and landing.
Back to BasicsBack to BasicsAirfield Environment Airfield Environment
MishapsMishaps
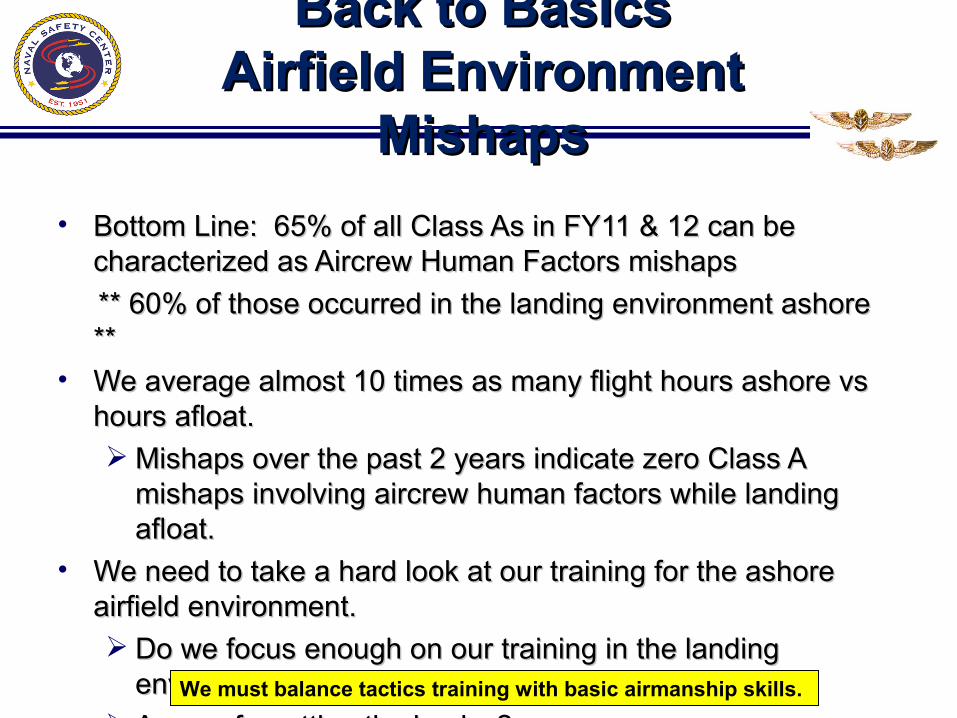
• Bottom Line: 65% of all Class As in FY11 & 12 can be Bottom Line: 65% of all Class As in FY11 & 12 can be characterized as Aircrew Human Factors mishaps characterized as Aircrew Human Factors mishaps
** 60% of those occurred in the landing environment ashore ** 60% of those occurred in the landing environment ashore ****
• We average almost 10 times as many flight hours ashore vs We average almost 10 times as many flight hours ashore vs hours afloat. hours afloat.
Mishaps over the past 2 years indicate zero Class A Mishaps over the past 2 years indicate zero Class A mishaps involving aircrew human factors while landing mishaps involving aircrew human factors while landing afloat.afloat.
• We need to take a hard look at our training for the ashore We need to take a hard look at our training for the ashore airfield environment.airfield environment. Do we focus enough on our training in the landing Do we focus enough on our training in the landing
environment away from the boat?environment away from the boat? Are we forgetting the basics?Are we forgetting the basics?
31We must balance tactics training with basic airmanship skills.

Maintenance Mishaps Maintenance Mishaps
• Maintenance causal factorsMaintenance causal factorsComprise a small portion of Class A mishapsComprise a small portion of Class A mishapsTherefore, look at Class B and C mishaps Therefore, look at Class B and C mishaps FY-11 & 12 = 98 eventsFY-11 & 12 = 98 events
32What results in most maintenance mishaps?

Maintenance Mishaps Maintenance Mishaps
33
FY-11 FY-12
Rank Severity Rank Severity
1 Failure to follow maintenance instructions 1
1 Failure to follow maintenance instructions 1
2 Aircraft maintenance turns2
2 Aircraft maintenance turns2
3 Aircraft towing3
3 Aircraft towing3
4 4 Personnel injury (falls)
5 5 Tool control
Note the repeat of mishap characterizations in FY-11 and FY -12
Back to BasicsBack to BasicsMaintenance Environment Maintenance Environment
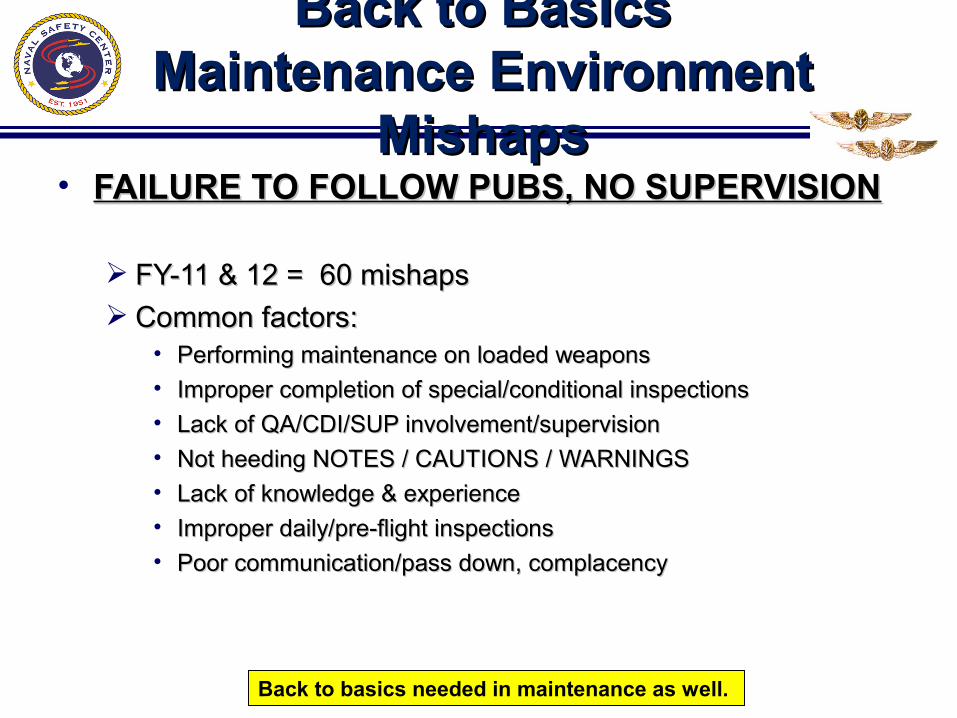
MishapsMishaps• FAILURE TO FOLLOW PUBS, NO SUPERVISIONFAILURE TO FOLLOW PUBS, NO SUPERVISION
FY-11 & 12 = 60 mishapsFY-11 & 12 = 60 mishaps Common factors:Common factors:
• Performing maintenance on loaded weaponsPerforming maintenance on loaded weapons• Improper completion of special/conditional inspectionsImproper completion of special/conditional inspections• Lack of QA/CDI/SUP involvement/supervisionLack of QA/CDI/SUP involvement/supervision• Not heeding NOTES / CAUTIONS / WARNINGSNot heeding NOTES / CAUTIONS / WARNINGS• Lack of knowledge & experienceLack of knowledge & experience• Improper daily/pre-flight inspectionsImproper daily/pre-flight inspections• Poor communication/pass down, complacencyPoor communication/pass down, complacency
34Back to basics needed in maintenance as well.

Back to BasicsBack to BasicsThe HFACS ViewThe HFACS View
35
AE
1-S
kill
-b
ased
Err
ors
AE
2-Ju
dg
men
t/D
eci
sio
n
AE
3-P
erce
pti
on
AV
0-V
iola
tio
ns
PE
1-P
hys
ical
E
nvi
ron
.
PE
2-T
ech
E
nvi
ron
.
PC
1-C
og
. F
acto
rs
PC
2-P
sych
o-
beh
av.
Fac
tors
PC
3-A
dve
rse
Ph
ysio
Sta
tes
PC
4-P
hys
-M
enta
l L
imit
s
PC
5-P
erce
ptu
al
Fac
tors
PP
1-C
oo
rd/C
om
m
Pla
nn
ing
PP
2-S
elf-
Imp
ose
d
Str
ess
SI0
-In
adeq
uat
e S
up
SP
0-P
lan
ned
In
app
Op
s
SF
0-F
ailu
re t
o
Co
rrec
t
SV
0-S
up
V
iola
tio
ns
OR
0-R
eso
urc
e/A
cqu
isit
ion
Mg
mt
OC
0-O
rgan
izat
ion
al
Cli
mat
e
OP
0-O
rgan
izat
ion
al
Pro
cess
FY10 9 12 1 2 3 2 22 20 1 3 9 45 0 3 3 2 2 4 4 4 151FY11 23 24 3 2 4 4 16 12 1 3 15 45 3 12 1 1 9 12 3 22 215% 0.059603 0.07947 0.006623 0.013245 0.019868 0.013245 0.145695 0.13245 0.006623 0.019868 0.059603 0.298013 0 0.019868 0.019868 0.013245 0.013245 0.02649 0.02649 0.02649
P=.002 P=.022 p=.12 p=.24 p=.2 p=.16 p=.0007 p=.0001 p=.34 p=.18 p=.088 p=.0008 p=0 p=.0010 p=.06 p=.17 p=.002 p=.008 p.10 p=.000
• BLUF:•Act-level skill based & judgment errors are increasing•Supervisory-level operations planning issues are still high•Organizational-level process (optempo, guidance, training) is increasing
•Statistical trends are not possible to determine due to the low number of mishaps• Listed are the probabilities that the change seen from one year to the next was by chance. (P=.05 was used as cut off)• CRM remains the most frequently cited causal factor, although incidences decreased.• Green indicates decreases that are likely not due to chance and the red are increase that are not likely due to chance.
HFACS analysis tells the same story for Aircrew and Maintenance

Aviation Mishap Summary Aviation Mishap Summary
Areas for ImprovementAreas for Improvement• Aircrew:Aircrew:
Compliance with NATOPS & SOPs Compliance with NATOPS & SOPs Basic airmanshipBasic airmanshipBalance tactical qualifications with flying skillsBalance tactical qualifications with flying skills
• MaintenanceMaintenanceCompliance with maintenance publicationsCompliance with maintenance publicationsBasic sound maintenance practicesBasic sound maintenance practicesBalance work accomplishment with quality Balance work accomplishment with quality
assuranceassurance
• Every one: Every one: Supervise, Supervise, Supervise, Supervise, Supervise!Supervise!
36Aircrew and Maintenance personnel have similar problems

Navy Fatalities and Aircraft Losses1982 vs 2012 Comparison
1982 2012
Category Number of Fatalities
Navy Personal Motor Vehicles
222 42
Navy Recreation 75 7
Navy Aviation 64 2
Navy Shore 13 5
Navy Afloat 21 3
Number of Aircraft
Aircraft Mishap/Losses 70/64 10/6
Cost in then Year $
Navy Aviation Mishaps $319M $516M
Focus on Greatest Fatality and Cost Drivers37

Safety Surveys - Safety Surveys - Squadrons Squadrons
38
FY-11 FY-12
Rank Severity Rank Severity1 Aircraft logbook inspection
and TD’s do not match OOMA/NALCOMIS
1 Personnel lack ORM knowledge and proper application
2 Personnel lack ORM knowledge and proper application
2 Improper/Lack of proper use of personal protective equipment 1
3 Outdated publications utilized by maintenance personnel 1
3 Failure to use publication/checklist during task
2
4 Tool inventories not updated to reflect changes
4 Poor communication between work center and maintenance control/unrealistic expectation
3
5 Pre-expendable and spare parts bin lack proper accountability
5 Lack of senior leadership guidance during towing evolution
6 Hydraulic fluid log not fully documented and class 6 results not entered in logbook
6 Tool Control: Shift change ATAF, lack of knowledge for lost/missing tool reporting
7 Personnel introducing spark producing items within ALSS hazard area
7 Improper storage of Hazardous material
8 Missing safety devices on shop equipment, (i.e. sewing machine, grinders, drill press)
3
8 Missing safety devices on shop equipment, (i.e. sewing machine, grinders, drill press)
9 Material Safety Data sheets not updated and lack unique identifier
9 Personnel introducing spark producing items within ALSS hazard area
10 Pre-operational checks not performed prior to use of equipment
2
10 Aircraft logbook inspection and TD’s do not match OOMA/NALCOMIS
Repeat discrepancies

Safety Surveys – Air Safety Surveys – Air Stations Stations
39
FY-11 FY-12Rank Severity Rank Severity
1 Runway/Taxiway markings faded, worn or peeling
1 Runway/Taxiway markings faded, worn or peeling
2 Grass obstructing view of airfield signage & lighting
2 Grass obstructing view of airfield signage & lighting
3 No vehicle traffic signs or hold short lines to airfield
3 No vehicle traffic signs or hold short lines to airfield
4 Surface corrosion on AG 4 Surface corrosion on AG5 Arresting gear lubrication 5 Arresting gear lubrication6 FOD underneath AG
system6 FOD underneath AG system
7 No explosion proof lighting
7 Expired gauges on fuel equipment and trucks
8 Fuel sample documentation
8 QA fuel lab not IAW the NATOPS & UFC
9 Missing fuel farm pump placards
9 Explosion proof lighting (fuel lab)
10 Point of sale meter not calibrated
10 BASH
Repeat discrepancies

Culture Workshop Results Culture Workshop Results
AviationAviation• CW areas of Concern:CW areas of Concern:
MATCHING MANNING WITH SKILL-SETS MATCHING MANNING WITH SKILL-SETS MANDATORY TRAINING VS OPS TEMPO MANDATORY TRAINING VS OPS TEMPO PTS/ERBPTS/ERB LACK OF SKIPPER'S AUTHORITYLACK OF SKIPPER'S AUTHORITY AIRCREW CURRENCYAIRCREW CURRENCY CONTRACT HOUSINGCONTRACT HOUSING HIGH OPTEMPOHIGH OPTEMPO FATIGUEFATIGUE LACK OF RESOURCES/AGING AIRCRAFT/AIRCRAFT LACK OF RESOURCES/AGING AIRCRAFT/AIRCRAFT
TRANSITIONINGTRANSITIONING FORCE SHAPING PROGRAMSFORCE SHAPING PROGRAMS EXPERIENCE/ENLISTED LEADERSHIP CAPABILITIESEXPERIENCE/ENLISTED LEADERSHIP CAPABILITIES MILLENNIAL GENERATION CHALLENGESMILLENNIAL GENERATION CHALLENGES SAFETY PRIORITIZATIONSAFETY PRIORITIZATION
40Non-prioritized information through August CY 12

Culture Workshop Results Culture Workshop Results
SurfaceSurface• CW areas of Concern:CW areas of Concern:
LACK OF COMPETENT PERSONNELLACK OF COMPETENT PERSONNEL COMMUNICATION BETWEEN OFFICERS AND COMMUNICATION BETWEEN OFFICERS AND
ENLISTED PERSONNELENLISTED PERSONNEL OPERATIONAL DEMAND FROM EXTERNAL SOURCESOPERATIONAL DEMAND FROM EXTERNAL SOURCES
POOR COMMAND INDOC/PQSPOOR COMMAND INDOC/PQS
PQS/TRAINING EFFECTIVENESSPQS/TRAINING EFFECTIVENESS
AT/FP REQUIREMENTSAT/FP REQUIREMENTS
MANNING AND CANNIBALIZATION (BORROWED) MANNING AND CANNIBALIZATION (BORROWED) EQUIPMENT TO SUPPORT INSURVEQUIPMENT TO SUPPORT INSURV
HOSTILE WORK ENVIRONMENT/ SEXUAL ASSAULTS HOSTILE WORK ENVIRONMENT/ SEXUAL ASSAULTS
41Non-prioritized information through August CY 12

Areas of Concern
• Squadron ORM Implementation. Many commands lacked a formal ORM instruction per OPNAVINST 3500.39.
• Naval Aviation Survival Training Program (NASTP appendix E, OPNAVINST 3710.7T) required annual training in:– Aeromedical aspects of ejection and emergency ground
egress– Emergency ground egress — impact, acceleration,
survivability and egress– Sensory problems — spatial disorientation, visual
illusions, visual scanning, situational awareness and disorientation countermeasures3710 required aeromedical briefs rarely done
• Most squadrons have not recently (or ever) briefed their personnel on the Concept of Privilege.
• Many mishap investigation kits contained expired and out of date items.
• AMB training is not happening on a quarterly basis for all squadrons. Documentation is also lacking.
Areas of Concern

• Aviation Safety Council, Enlisted Safety Committee, and even HFB/HFC sometimes lack medical representation (or a ‘rent a doc’ fills in who really doesn’t know what's going on).
• Medical data entry is behind/inaccurate (inoculations, hearing conservation, etc.).
• Medical Clearance Notices/waivers are often inaccurate/not followed up on.
• Often there is no medical training for the mishap boards• Ground OSH/PPE programs often lack medical
assistance. These programs were taken over by clinics which can leave the squadron Flight Surgeon out of the loop.
Areas of Concern

• Safety / NATOPS• Lacked a squadron instruction for safety, and
many did not define their squadron’s safety program and all the safety department’s personnel, roles, and responsibilities. Such as HFCs, ASCs, ESCs, ground safety programs, etc. This safety instruction should include the flight surgeon, corpsman, and the enlisted NATOPS clerk.
• Few squadrons did not conduct their aviation safety councils on a quarterly basis as required by OPNAVINST and MCO.
Areas of Concern

• Navy AMSOs not getting out much at all
• Access to care a problem, especially Reserves
• Flight Surgeons not putting AA in WESS!
• Go to your squadrons and FLY!!– Need familiarity with mission and people– Primary job – Aviation Safety, NOT clinic
Areas of Concern

Positives
• Squadrons like their “Docs”
• Excellent quality of medical care
• Good understanding of human errors in mishaps
• Improving Aeromedical Analysis write ups

• UCI = Upper Confidence Interval LCI = Lower Confidence Interval
• Rate values above the UCI or below the LCI infer a statistically significant change is probable. This is only an indicator. Significance cannot be determined until end-of-year.
• Values between the UCI and LCI infer that nothing significant has occurred to increase or decrease mishap rate.
(Confidence Interval is based on: Poisson Rate related to a Chi Squared Distribution and calculated using FY07-11 data except for the Lost Work Days and Lost Time Case slides which were based on a normal distribution).
Mishap Confidence Interval
FY12 Goal ExplanationFY12 Goals were calculated to reflect the whole number of events that could occur in a given category and still achieve the 75% reduction from 2002. This calculation takes into account the changing exposure level (i.e. population, flight hours and fleet size) as well as the OSD requirement to only count the property damage events from 2002 that would be Class A events under the new property damage thresholds.