NAV / Share : US$ 0.950 RNAV / Share : US$ 1.095 Property ... · PDF fileThe Ho Chi Minh...
13
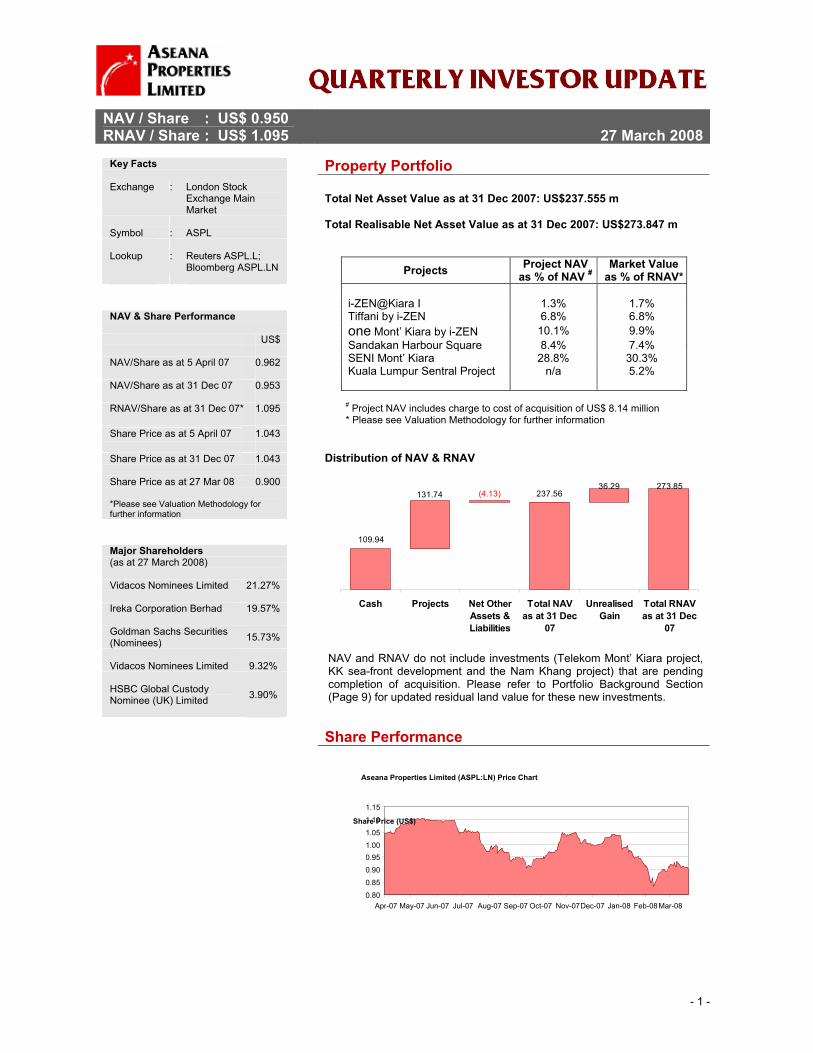
- 1 - NAV / Share : US$ 0.950 RNAV / Share : US$ 1.095 27 March 2008 Property Portfolio Total Net Asset Value as at 31 Dec 2007: US$237.555 m Total Realisable Net Asset Value as at 31 Dec 2007: US$273.847 m Projects Project NAV as % of NAV # Market Value as % of RNAV* i-ZEN@Kiara I 1.3% 1.7% Tiffani by i-ZEN 6.8% 6.8% one Mont’ Kiara by i-ZEN 10.1% 9.9% Sandakan Harbour Square 8.4% 7.4% SENI Mont’ Kiara 28.8% 30.3% Kuala Lumpur Sentral Project n/a 5.2% # Project NAV includes charge to cost of acquisition of US$ 8.14 million * Please see Valuation Methodology for further information Distribution of NAV & RNAV 273.85 36.29 237.56 (4.13) 131.74 109.94 Cash Projects Net Other Assets & Liabilities Total NAV as at 31 Dec 07 Unrealised Gain Total RNAV as at 31 Dec 07 NAV and RNAV do not include investments (Telekom Mont’ Kiara project, KK sea-front development and the Nam Khang project) that are pending completion of acquisition. Please refer to Portfolio Background Section (Page 9) for updated residual land value for these new investments. Share Performance NAV & Share Performance US$ NAV/Share as at 5 April 07 0.962 NAV/Share as at 31 Dec 07 0.953 RNAV/Share as at 31 Dec 07* 1.095 Share Price as at 5 April 07 1.043 Share Price as at 31 Dec 07 1.043 Share Price as at 27 Mar 08 0.900 *Please see Valuation Methodology for further information Major Shareholders (as at 27 March 2008) Vidacos Nominees Limited 21.27% Ireka Corporation Berhad 19.57% Goldman Sachs Securities (Nominees) 15.73% Vidacos Nominees Limited 9.32% HSBC Global Custody Nominee (UK) Limited 3.90% Key Facts Exchange : London Stock Exchange Main Market Symbol : ASPL Lookup : Reuters ASPL.L; Bloomberg ASPL.LN Aseana Properties Limited (ASPL:LN) Price Chart 0.80 0.85 0.90 0.95 1.00 1.05 1.10 1.15 Apr-07 May-07 Jun-07 Jul-07 Aug-07 Sep-07 Oct-07 Nov-07Dec-07 Jan-08 Feb-08 Mar-08 Share Price (US$)
Transcript of NAV / Share : US$ 0.950 RNAV / Share : US$ 1.095 Property ... · PDF fileThe Ho Chi Minh...
- 1 -
NAV / Share : US$ 0.950 RNAV / Share : US$ 1.095
27 March 2008
Property Portfolio
Total Net Asset Value as at 31 Dec 2007: US$237.555 m Total Realisable Net Asset Value as at 31 Dec 2007: US$273.847 m
Projects Project NAV as % of NAV #
Market Value as % of RNAV*
i-ZEN@Kiara I 1.3% 1.7% Tiffani by i-ZEN 6.8% 6.8% one Mont’ Kiara by i-ZEN 10.1% 9.9% Sandakan Harbour Square 8.4% 7.4% SENI Mont’ Kiara 28.8% 30.3% Kuala Lumpur Sentral Project n/a 5.2%
# Project NAV includes charge to cost of acquisition of US$ 8.14 million * Please see Valuation Methodology for further information Distribution of NAV & RNAV
273.8536.29
237.56(4.13)131.74
109.94
Cash Projects Net OtherAssets &Liabilities
Total NAVas at 31 Dec
07
UnrealisedGain
Total RNAVas at 31 Dec
07
NAV and RNAV do not include investments (Telekom Mont’ Kiara project, KK sea-front development and the Nam Khang project) that are pending completion of acquisition. Please refer to Portfolio Background Section (Page 9) for updated residual land value for these new investments.
Share Performance
NAV & Share Performance US$ NAV/Share as at 5 April 07 0.962 NAV/Share as at 31 Dec 07 0.953 RNAV/Share as at 31 Dec 07* 1.095 Share Price as at 5 April 07 1.043 Share Price as at 31 Dec 07 1.043 Share Price as at 27 Mar 08 0.900 *Please see Valuation Methodology for further information
Major Shareholders (as at 27 March 2008) Vidacos Nominees Limited 21.27% Ireka Corporation Berhad 19.57% Goldman Sachs Securities (Nominees) 15.73%
Vidacos Nominees Limited 9.32% HSBC Global Custody Nominee (UK) Limited 3.90%
Key Facts Exchange : London Stock
Exchange Main Market
Symbol : ASPL Lookup : Reuters ASPL.L;
Bloomberg ASPL.LN
Aseana Properties Limited (ASPL:LN) Price Chart
0.80
0.85
0.90
0.951.00
1.05
1.10
1.15
Apr-07 May-07 Jun-07 Jul-07 Aug-07 Sep-07 Oct-07 Nov-07 Dec-07 Jan-08 Feb-08Mar-08
Share Price (US$)

- 2 -
Aseana Properties Limited (ASPL:LN) Volume Chart
02468
10121416
Apr-07 May-07 Jun-07 Jul-07 Aug-07 Sep-07 Oct-07 Nov-07 Dec-07 Jan-08 Feb-08 Mar-08
Mill
ions
Shar
e Pr
ice
(US$
)
Portfolio Developments
Company Information Domicile Jersey Shares Issued* 250 million Share Denomination
US Dollars
Management Fee 2% of NAV Performance Fee 20% of the out
performance NAV over a total return
hurdle rate of 10%
Admission Date 5 April 2007 Investor Reporting Quarterly Fiscal Year End 31 December Financials Semi-annual
review; annual audit
For additional information please refer to www.aseanaproperties.com
Contact Information Development Manager
Ireka Development Management Sdn Bhd
Website www.ireka.com.my Kuala Lumpur office
G-1, Kiara II No. 1, Jalan Kiara Mont’ Kiara 50480 Kuala Lumpur Malaysia Tel: +603 6203 6688 Fax: +603 6203 6868
Vietnam office
Suite 12A Mezzanine Floor Sun Wah Tower No. 115 Nyuyen Hue Boulevard District 1, Ho Chi Minh City Vietnam Tel: +84 821 91 80 Fax: +84 821 91 81
Chief Executive Officer
Mr. Lai Voon Hon [email protected]
Chief Financial Officer
Ms. Monica Lai [email protected]
Status of Property Portfolio The Company has submitted design and building plans for approval for the Telekom Mont’ Kiara Project as of early January 2008. The Company is making good progress in finalising the designs and construction plans on its other three projects namely, Kuala Lumpur Sentral Project, KK sea-front development and the Nam Khang project. Construction is expected to commence in 3Q08 for KL Sentral Project and 4Q08 for Telekom Mont’ Kiara Project, KK sea-front development and Nam Khang project. Status of sales of projects undertaken by ASPL is as follows:
Projects % Sales*
i-ZEN@Kiara I 99% Tiffani by i-ZEN 87% one Mont’ Kiara by i-ZEN – bz hub ^ 100% Sandakan Harbour Square
- Phase 1 retail lots - Phase 2 retail lots
100% 42%
SENI Mont’ Kiara – Phase I 81%
* as at February 2008, please see Portfolio Background (Page 8) for further
information on Projects ^ Five floors have been held back for sale at later date
Conceptual design of new investment in Danang
- 3 -
Advisors & Service Providers Development Manager
: Ireka Development Management Sdn Bhd
Financial Adviser : Fairfax I.S. PLC Legal Advisors : - English Stephenson
Harwood - US Morrison
Foerster MNP - Jersey Walkers - Malaysia Foong &
Partners - Vietnam Vilaf-Hong Duc Reporting Accountants, Auditor, Tax Adviser
: Mazars LLP
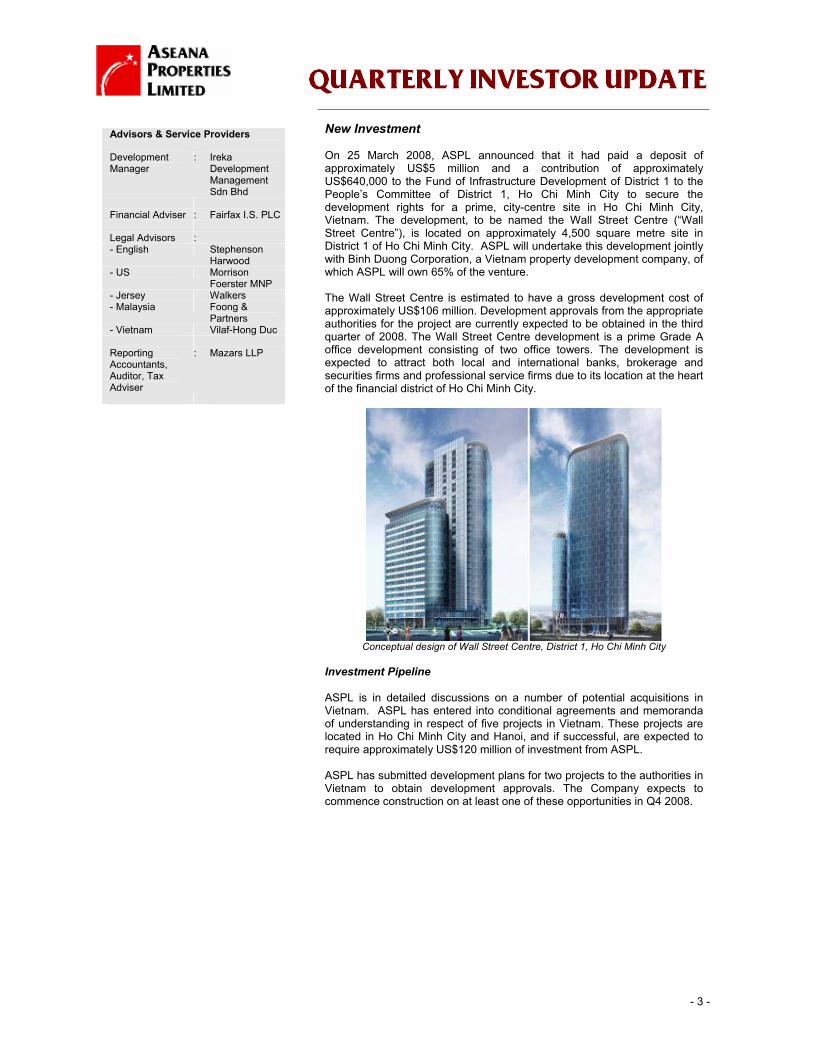
New Investment On 25 March 2008, ASPL announced that it had paid a deposit of approximately US$5 million and a contribution of approximately US$640,000 to the Fund of Infrastructure Development of District 1 to the People’s Committee of District 1, Ho Chi Minh City to secure the development rights for a prime, city-centre site in Ho Chi Minh City, Vietnam. The development, to be named the Wall Street Centre (“Wall Street Centre”), is located on approximately 4,500 square metre site in District 1 of Ho Chi Minh City. ASPL will undertake this development jointly with Binh Duong Corporation, a Vietnam property development company, of which ASPL will own 65% of the venture. The Wall Street Centre is estimated to have a gross development cost of approximately US$106 million. Development approvals from the appropriate authorities for the project are currently expected to be obtained in the third quarter of 2008. The Wall Street Centre development is a prime Grade A office development consisting of two office towers. The development is expected to attract both local and international banks, brokerage and securities firms and professional service firms due to its location at the heart of the financial district of Ho Chi Minh City.
Conceptual design of Wall Street Centre, District 1, Ho Chi Minh City
Investment Pipeline ASPL is in detailed discussions on a number of potential acquisitions in Vietnam. ASPL has entered into conditional agreements and memoranda of understanding in respect of five projects in Vietnam. These projects are located in Ho Chi Minh City and Hanoi, and if successful, are expected to require approximately US$120 million of investment from ASPL. ASPL has submitted development plans for two projects to the authorities in Vietnam to obtain development approvals. The Company expects to commence construction on at least one of these opportunities in Q4 2008.

- 4 -
VIETNAM
MALAYSIA
Thailand
Indonesia
Cambodia
LaosMyanmar
Kuala Lumpur
Kota Kinabalu Sandakan
Ho Chi Minh City
Hanoi
Danang
VIETNAM
MALAYSIA
Thailand
Indonesia
Cambodia
LaosMyanmar
Kuala Lumpur
Kota Kinabalu Sandakan
Ho Chi Minh City
Hanoi
Danang
Kuala Lumpur
Kota Kinabalu Sandakan
Ho Chi Minh City
Hanoi
Danang
Location Map of Vietnam & Malaysia
Vietnam Economic Update
Economic growth for the year has been impressive with a record-high GDP of 8.5%, becoming the second fastest growing economy in Asia after China. The main drivers of growth are the industrial and construction sector and the services sector with growth rates of 10.6%, and 8.68% respectively. Vietnam is also one of the largest recipients of foreign direct investment (FDI) in the world relative to the size of its GDP in recent years. The US, South Korea, Japan and Hong Kong are its largest FDI providers. In the year, the country attracted record foreign investments of US$20.3 billion compared to US$12 billion in 2006 – an increase of 69.2%. Money continues to be invested in industrial, hotel & tourism and development projects. The Consumer Price Index (CPI) for the year is 12.63%, of which prices of food and eating service rose by 18.92%; housing and construction materials by 17.12% and others rising from 1.69% to 7.27%. CPI for February 2008 rose to 15.67% mainly due to increases in food prices, petrol and housing and construction materials. Due to the increase in world oil prices, the Government has increased the price per litre of petrol of 92-RON gasoline, the most common grade used in the country by 15.0% in November and 11.5% in February. However, the Prime Minister has recently ordered a freeze to petrol prices until at least June to manage inflation. The Ministry of Finance was instructed to boost subsidies to fuel traders. The Ho Chi Minh City’s stock market index has not been spared in the recent downturn on the global stock market. However, Vietnam's state investment arm has stepped in to the market to improve retail investors’ confidence. The government and central bank have adopted various measures to bring prices under control, including raising compulsory reserves at banks, increasing interest rates and widening the trading band of the closely managed Dong currency. In February, all banks had to raise the proportion of Dong and foreign currency deposits kept for the central bank to 11%, up from the previous 10%. The official Dollar/Dong rate at VND16,005/US$ is at its highest in nearly 18 months after a strong influx of the US currency and widened trading band. Housing demand soared due to the expanding economy and more open migration and housing policies. New regulations were being prepared to speed up housing projects and increase land taxes, which would help fight speculation among home-buyers, hence keeping property prices at a sustainable level.

- 5 -
The government has amended proposed regulations to Decree No 90/2006/ND-CP to allow certain foreigners to purchase apartments in Vietnam. Among those eligible to purchase apartments are honorary citizens, foreigners that invested directly in Vietnam, foreigners who received President’s or Government’s certificate of merit or medals for their contribution to the country and foreigners who married Vietnamese residents and reside in Vietnam.
Overview of Property Market in Vietnam
Residential At present, the larger cities like Ho Chi Minh CIty and Hanoi are facing
a shortage of residential housing due to high population density and government imposed restrictions on land use
Prices for high end residential condominiums in Ho Chi Minh City remain high, up to US$4,500 psm in District 1 and US$3,300 in District 2 and Binh Thanh District
New construction projects are seen in residential areas such as Ha Tay, Vinh Phuc, and Bac Ninh provinces
CBRE forecasted that monthly rents for serviced residences may reach US$40 psm to US$45 psm in 2008
Offices Vacancy rates for Grade A and Grade B office space remain low Average rental for Grade A and Grade B office space for Q108 is
US$63 psm per month and US$ 40 psm per month respectively, an increase of 97% and 51% respectively when compared to Q107
Office rental is expected to continue to rise due to high demand and continuing shortage of space.
Decentralisation of office buildings from CBD to Tan Binh, Thu Thiem, District 7
CBRE forecast that rental for Grade A buildings may reach US$65 psm to US$70 psm per month in 2008
Retail Average retail rental rates in Ho Chi Minh City increased to US$ 88
psm per month as of Q407 compared to US$64 psm per month in 2006 Prime retail space in Ho Chi Minh City enjoys 99% to 100% occupancy
rate Rental rates are expected to increase due to limited supply and high
demand of good retail space An additional 56,683 sqm and 109,738 sqm of retail space is expected
to be completed by 2008 and 2009 respectively Effective January 2008, equity limitation for foreign capital is abolished.
There will be no equity interest limitation for foreign investors and compulsory joint ventures with Vietnamese partners.
Hospitality International arrivals to Vietnam in 2007 were estimated at 4.23 million,
an increase of 18% compared to 2006 Foreign tourists are mainly from China, South Korea, United States,
Japan and Taiwan Sharp increase in number of foreign tourists has led to price increases
in hotel room rates as the shortage for good quality hotel rooms remains due to delay in supply.
Investment licence has been granted to build Vietnam’s largest tourism and entertainment project in the coastal town of Vung Tau for US$1.3 billion
Source: Company research, General Statistics Office of Vietnam, CBRE Vietnam Reports
- 6 -
Malaysia Economic Update
Real GDP expanded by 7.3% in the fourth quarter of 2007 (3Q: 6.6%), with all economic sectors recording strong growth. Sustained domestic demand and robust business activity supported growth in the services sector. Growth in the construction sector was sustained, supported by implementation of projects under the Ninth Malaysia Plan. The average CPI inflation in the final quarter of 2007 increased to 2.2% (3Q: 1.8%) mainly on account of higher prices in the food and non-alcoholic beverages category. Food prices rose by 3.7% (3Q: 2.7%), given higher prices for rice, bread and other cereals, meat, fish and seafood, milk, cheese and eggs, and food consumed away from home. The impact on overall inflation was, however, partly mitigated by the lower inflation in the alcoholic beverages and tobacco category following the lapse of the impact of higher excise taxes on alcoholic beverages and tobacco announced in Budget 2007. Among the Asean countries, Malaysia is ranked third in foreign direct investments (FDIs) inflows after Singapore and Vietnam. FDI inflows increased by 54.4% to US$9.4 billion in 2007, compared to US$6.1 billion in 2006. The FDIs are mainly in the services, manufacturing and oil & gas sectors. The Employees Provident Fund’s (EPF) housing loan monthly installment withdrawal scheme has come into effect on 1st January 2008. The scheme allows EPF members to make monthly withdrawals from Account II to finance the loan repayments of a single housing loan. This scheme will be positive for the Malaysian residential property market. On 30th October 2007, the East Coast Economic Region (ECER) Masterplan was officially launched. The ECER is the third development region to be launched this year after the Iskandar Development Region (IDR) in Johor and the North Coast Economic Region (NCER) covering states in northern Peninsular Malaysia. The main objective of the ECER is to accelerate growth in the region in a viable, equitable and sustainable manner. Moving into 2008, the Malaysian economy is expected to sustain its growth trend despite the risks of a slowdown in the US economy, given the strengthening of the economies in the emerging countries, particularly in Asia. In early March 2008, Malaysia completed its 12th General Election. The National Coalition Front, who has been the ruling party of Malaysia since its independence in 1957, won by a simple majority to form the next Government. They have however failed to retain a two-thirds majority in Parliament, winning only 63% of the seats, with the Opposition alliance winning the remaining 37%. At the State level, the Opposition also won the mandate to form Governments for five states namely, Penang, Selangor, Perak, Kedah and Kelantan, whilst the National Coalition Front retained Governments for the remaining eight states. The election outcome can be interpreted as Malaysia’s desire for change and economic progress, which is positive for investment in the longer term, notwithstanding the possibility of short term volatility as the country adapts to a bigger opposition presence. With the results in mind, improving economic performance will be increasingly critical to the National Coalition Front and this is likely to force the government to step up fiscal spending and go for tighter management of inflation.

- 7 -
Overview of Property Market in Malaysia
Residential Residential property transactions rose 23.3% year on year in value and
8.8% year on year in volume for the first 9 months of 2007 fuelled by government liberalization measures including RPGT waiver, foreign inflows and robust domestic consumer sentiment
Market rentals for condominiums in the Klang Valley generally remained stable in 4Q07
Luxury residential section remains positive Offices Office rental generally remained stable. However, prime office rental
continue to rise Eight new office buildings were completed in the fourth quarter, of
which, one is Prime Grade A building (UOA Damansara II) Net yields generally remain stable at between 6% to 8% Activity in the commercial property market is buoyant and likely to
remain so given the positive fundamentals Notable transactions: The Icon @ Tun Razak (RM800 psf), The Icon @
Mont’ Kiara (RM750 psf), Menara YNH (RM1,250 psf), Capital Square Tower 2 (RM734 psf), Menara Felda (RM930 psf)
Retail
Strong demand from retailers for rental space, particularly in prime shopping centres
Average monthly rental rate for ground levels in the city centre ranged between RM20 psf to RM45 psf for Prime A retail centres
Overall occupancy rate for retail centres increased from 83.6% in 3Q07 to 86.1% in 4Q07
Another three prime malls opened this quarter namely AEON Bukit Tinggi (Prime A), Cap Square and Sooka Sentral (both Prime B) increasing retail space in Klang Valley by 1.34 million square feet
Hospitality Klang Valley hotel market generally registered healthy occupancies
with the nationwide “Visit Malaysia Year 2007” and “50th Merdeka” celebrations
Tourist arrivals for the year increased by 18% to 20.7 million tourists compared to 17.55 million tourists for the previous year
Malaysia was voted for the second time by Global Traveller Magazine as the Best International Tourism Destination
Average Daily Room Rates for top tier hotels exceeded the RM600 per room per night (Mandarin Oriental Hotel: RM630 per room per night)
Average occupancy rate from Klang Valley increased 4.2% to 71.9% in 4Q07 compared to 67.7% in 4Q06
Hotel occupancy and average room rate is expected to sustain with Visit Malaysia Year being extended another year to 2008
Source: Bank Negara Malaysia website, Jones Lang Wotton Q4 report, CBRE, Various publications
- 8 -
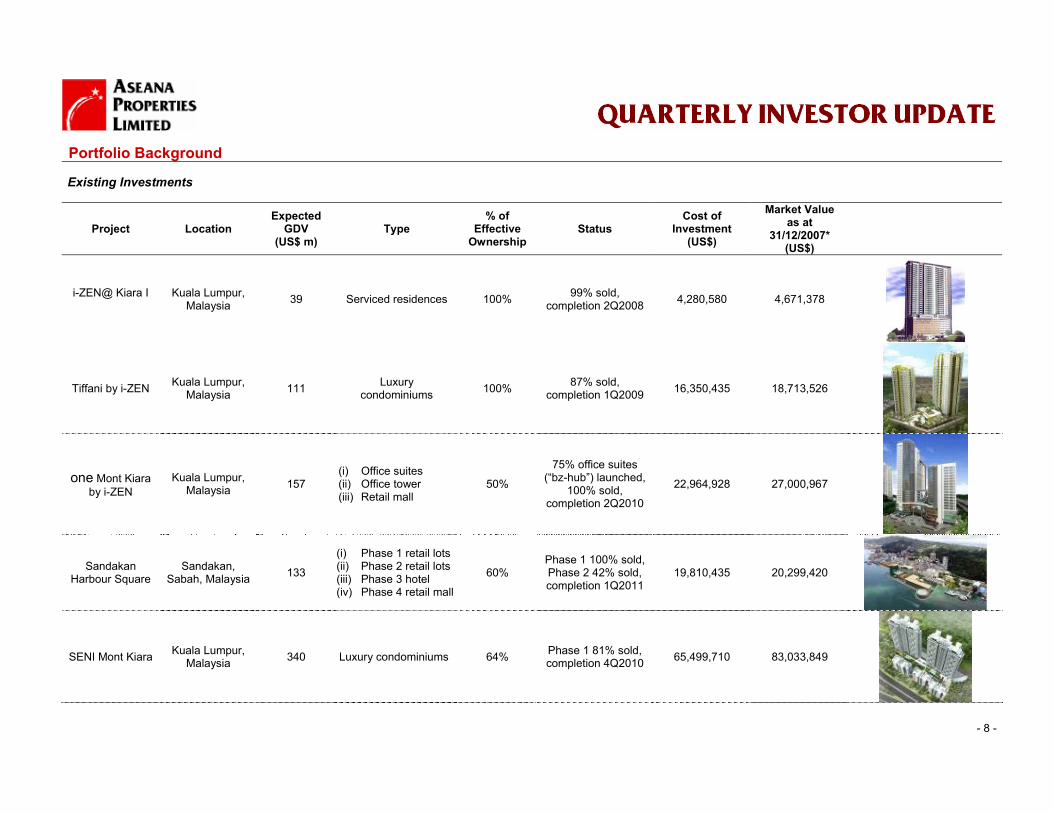
Portfolio Background Existing Investments
Project Location Expected
GDV (US$ m)
Type % of
Effective Ownership
Status Cost of
Investment (US$)
Market Value as at
31/12/2007* (US$)
i-ZEN@ Kiara I
Kuala Lumpur, Malaysia 39 Serviced residences 100% 99% sold,
completion 2Q2008 4,280,580 4,671,378
Tiffani by i-ZEN Kuala Lumpur, Malaysia 111 Luxury
condominiums 100% 87% sold, completion 1Q2009 16,350,435 18,713,526
one Mont Kiara by i-ZEN
Kuala Lumpur, Malaysia 157
(i) Office suites (ii) Office tower (iii) Retail mall
50%
75% office suites (“bz-hub”) launched,
100% sold, completion 2Q2010
22,964,928 27,000,967
Sandakan Harbour Square
Sandakan, Sabah, Malaysia 133
(i) Phase 1 retail lots (ii) Phase 2 retail lots (iii) Phase 3 hotel (iv) Phase 4 retail mall
60% Phase 1 100% sold, Phase 2 42% sold, completion 1Q2011
19,810,435 20,299,420
SENI Mont Kiara Kuala Lumpur, Malaysia 340 Luxury condominiums 64% Phase 1 81% sold,
completion 4Q2010 65,499,710 83,033,849

- 9 -
Portfolio Background (continued) Existing Investments (continued)
Project Location Expected
GDV (US$ m)
Type % of
Effective Ownership
Status Cost of
Investment (US$)
Market Value as at
31/12/2007* (US$)
Kuala Lumpur Sentral project
Kuala Lumpur, Malaysia 245
Two office towers and a boutique business hotel
40%
Joint Venture Agreement and
Sales & Purchase Agreement signed
in Aug 2007
2,492,016 (equity
contribution made in January
2008)
14,310,246
Telekom Mont Kiara project #
Kuala Lumpur, Malaysia 32 Commercial and
office suites 100% Sales & Purchase Agreement signed
in Aug 2007
3,130,609 (Land cost, un-
leveraged) 3,931,650 ^
Sea-front resort & residential
development #
Kota Kinabalu, Sabah, Malaysia 170
Resort homes, boutique resort hotel
and resort villas
100% for resort villas
& hotel, 50% for resort homes
Signed Heads of Agreement and
Sales & Purchase Agreements
8,243,320 (Land cost, un-
leveraged) 9,813,351 ^
The Nam Khang Resort &
Residences #
Danang, Vietnam 150
Luxury hotel and resort-themed
residences 60%
Signed Memorandum of
Agreement in November 2007
18,000,000 (Equity
contribution) N/A
* Please refer to section on Valuation Methodology ^ Relates to effective interest of ASPL based on residual market value of land # These new investments are pending completion of acquisition and are therefore not included in the NAV and RNAV calculations N/A: Not applicable Exchange rate - 30 September 2007: US$1 : RM3.417; 31 December 2007: US$1 : RM3.3065 (Source: Bank Negara Malaysia)

- 10 -
Portfolio Background (continued) New Investment
Project Location Expected
GDV (US$ m)
Type % of
Effective Ownership
Status Cost of
Investment (US$)
Market Value as at
31/12/2007* (US$)
Wall Street Centre, District 1
Ho Chi Minh City, Vietnam 106 Offices 65%
Signed MoU, Paid deposit to People’s
Committee of District 1, Ho Chi
Minh City, awaiting Approval-in-
principle,
5,000,000 (deposit) N/A
Investment Pipelineα
Project Location Expected GDV (US$ m) Type % Proposed Ownership Status
Horizon Place, District 4 Ho Chi Minh City, Vietnam 110 Residential and offices 65%
Signed conditional Joint Venture
Agreement, final DPA approval obtained,
awaiting Investment License
One Saigon, District 1 Ho Chi Minh City, Vietnam 280 Offices and hotel 65% Signed MoU, awaiting
Approval-in-principle

- 11 -
Project Location Expected GDV (US$ m) Type % Proposed Ownership Status
Residential & serviced residence development,
District 1
Ho Chi Minh City, Vietnam 215 Luxury condominiums
and serviced residences 60%
Signed MoU, awaiting for site clearance and
LURC from local partner
North Gate mixed development Hanoi, Vietnam 187 Serviced residences,
luxury apartments 65% Signed MoU
Residential development, District 7
Ho Chi Minh City, Vietnam 690 Luxury condominiums
and residences 80%
Awaiting for clarification on status
of land, finalising Investment Agreement
α These projects are pipeline opportunities only, which may or may not materialise

- 12 -
Valuation Methodology The Company will appoint one or more internationally recognised firms of valuers. It is the intention that the Company’s property portfolio will be independently valued on a quarterly basis, consisting of three desktop valuations and an annual full valuation. Where applicable and permitted under the International Financial Reporting Standards, the Directors of the Company may choose to adopt and incorporate the valuation into the computation of the Company’s Net Asset Value. The Realisable Net Asset Value of the Company as at 31 December 2007 has been computed by the Company based on the Company’s management accounts for the period and the market values of the property portfolio as determined by Horwath, an independent firm of valuers. The valuations performed by Horwath have been performed in accordance with International Valuation Standards (“IVS”) promulgated by the International Valuation Standards Committee.

- 13 -
Important Notice This document, and the material contained therein, is not intended as an offer or solicitation for the subscription, purchase or sale of securities in Aseana Properties Limited (the “Company”). Any investment in the Company must be based solely on the Listing Prospectus of the Company or other offering document issued from time to time by the Company, in accordance with applicable laws. The material in this document is not intended to provide, and should not be relied on for accounting, legal or tax advice or investment recommendations. Potential investors are advised to independently review and/or obtain independent professional advice and draw their own conclusions regarding the economic benefit and risks of investment in the Company and legal, regulatory, credit, tax and accounting aspects in relation to their particular circumstances. No undertaking, representation, warranty or other assurance, express or implied, is given by or on behalf of either of the Company or Ireka Development Management Sdn. Bhd. or any of their respective directors, officers, partners, employees, agents or advisers or any other person as to the accuracy or completeness of the information or opinions contained in this document and no responsibility or liability is accepted by any of them for any such information or opinions or for any errors, omissions, misstatements, negligence or otherwise. No warranty is given, in whole or in part, regarding the performance of the Company. There is no guarantee that investment objectives of the Company will be achieved. Potential investors should be aware that past performance may not necessarily be repeated in the future. The price of shares and the income from them may fluctuate upwards or downwards and cannot be guaranteed. This document is intended for the use of the addressee and recipient only and should not be relied upon by any persons and may not be reproduced, redistributed, passed on or published, in whole or in part, for any purposes, without the prior written consent of Aseana Properties Limited.