Nature Immunology: doi:10.1038/ni/-and Cpdm-/-mice were differentially labeled with Cell Trace Far...
17
Nature Immunology: doi:10.1038/ni.3352
-
Upload
nguyentuyen -
Category
Documents
-
view
214 -
download
1
Transcript of Nature Immunology: doi:10.1038/ni/-and Cpdm-/-mice were differentially labeled with Cell Trace Far...

Nature Immunology: doi:10.1038/ni.3352

Supplementary Figure 1
Phenotypic analysis of thymocytes.
(a) Expression level of SHARPIN in DN, CD4+, CD8
+ SP and DP thymocytes, CD4
+ naïve T and Treg cells, B cells and macrophages.
(b) Total numbers of CD4+
SP, CD8+
SP and DP thymocytes of Cpdm+/-
and Cpdm-/-
mice (n=8 mice per group). (c) Flow cytometric
analysis (left) or frequencies (right) of CD4+ and CD8
+ T cells in the thymus of 4 wk old Cpdm
+/- and Cpdm
-/- mice (n=10 mice per
group). (d) Percentage of Live/Dead+ DP thymocytes from Cpdm
+/- and Cpdm
-/- mice with or without anti-CD3 and anti-CD28
stimulation (n=8 mice per group). The data are compiled or representative of three to four independent experiments. Error bars indicate
the mean (± s.d.). *P < 0.05 (two-tailed unpaired t-test).
Nature Immunology: doi:10.1038/ni.3352

Nature Immunology: doi:10.1038/ni.3352

Supplementary Figure 2
Analysis of T cell development and phenotype in BM chimeric mice.
(a-b) Flow cytometric analysis of CD4+ and CD8
+ in pregated CD45.1
+ or CD45.2
+ cells of Thy or SP from mice reconstituted with
individual (a) or mixed transfers (b) of WT or Cpdm+/-
and Cpdm-/-
BM (n=4-6 mice per group). (c) Sorted naive CD4+CD62L
+CD44
-
CD25- T cells of SP from mice reconstituted with mixed transfers of WT or Cpdm
+/- and Cpdm
-/- BM were cultured with anti-CD3 or anti-
CD3 and anti-CD28. Cell Trace Violet dilution was examined 4 d later by flow cytometry. (d) Percentage of Live/Dead+ CD4
+ T cells of
SP from the mice in (c) with or without anti-CD3 and anti-CD28 stimulation. (e) Flow cytometric analysis (upper) or frequencies (bottom)
of CD62L+ and CD44
+ of CD4
+ T cells in SP or lung from mice reconstituted with individual or mixed transfers of WT or Cpdm
+/- and
Cpdm-/-
BM (n=6-8 mice per group). (f) Cytokine production in CD4+T cells. Isolated lung cells from the mice in (e) were stimulated with
PMA and Ionomycin for 4h (n=6 mice per group). (g) H&E staining (upper) and histology scores (bottom) of the lung tissue section from
the mice in (e). Original magnification, ×100 (n=6 mice per group). (h) Analysis of the phosphorylation status of signaling proteins in
sorted CD4+
T cells from Cpdm+/-
and Cpdm-/-
mice upon TGF-β stimulation. The data are compiled or representative of two to three
independent experiments. Error bars indicate the mean (± s.d.). *P < 0.05 **P < 0.01 and ***P < 0.001 (two-tailed unpaired t-test).
Nature Immunology: doi:10.1038/ni.3352

Nature Immunology: doi:10.1038/ni.3352

Supplementary Figure 3
Analysis of Treg cell proliferation and apoptosis.
(a) Flow cytometric analysis of Ki-67 expression in Treg cells of SP from Cpdm+/-
and Cpdm-/-
mice (n=12 mice per group). (b) Sorted
CD4+CD25
+Nrp1
+ Treg cells of SP from Cpdm
+/- and Cpdm
-/- mice were cultured with anti-CD3and anti-CD28. Cell Trace Violet dilution
was examined 2 or 4 d later by flow cytometry. (c) Percentage of Live/Dead+ CD4
+Foxp3
+ Treg cells with or without anti-CD3 and anti-
CD28 in SP from Cpdm+/-
and Cpdm-/-
mice (n=8 mice per group). (d) Flow cytometric analysis of Ki-67 expression in Treg cells of SP
from mixed chimeric mice (n=8 mice per group). (e) Percentage of Live/Dead+ CD4
+Foxp3
+ Treg cells with or without anti-CD3 and anti-
CD28 in SP from mixed chimeric mice (n=6 mice per group). (f-g) Percentage of Live/Dead+ CD4
+Foxp3
+ Treg cells in thymus from
Cpdm+/-
and Cpdm-/-
mice (f) or mixed chimeric mice (g) (n=6 mice per group). The data are compiled or representative of two to four
independent experiments. Error bars indicate the mean (± s.d.). *P < 0.05 **P < 0.01 and ***P < 0.001 (two-tailed unpaired t-test).
Nature Immunology: doi:10.1038/ni.3352

Nature Immunology: doi:10.1038/ni.3352

Supplementary Figure 4
SHARPIN-deficient Treg cells have a defect in the suppression of colitis.
Rag1–/–
mice received sorted CD4+CD25
+YFP
+ Treg (CD45.2
+) cells from Foxp3
YFPCreCpdm
+/-or Foxp3
YFPCreCpdm
-/- mice, together with
CD4+CD45RB
hi (CD45.1
+) T cells, or CD4
+CD45RB
hi (CD45.1
+) T cells alone (None). (a-d) Colon length (a), the ratios of
CD4+CD45RB
high (CD45.1
+) to CD4
+YFP
+ (CD45.2
+) Treg cells in the indicated organs (b), absolute numbers of CD4
+YFP
+ (CD45.2
+)
Treg cells in the indicated organs (c), and frequencies of the indicated cytokine-producing CD4+CD45RB
hi (CD45.1
+) T cells in the
indicated organs (d) of the Rag1-/-
recipient mice at 8 wk after transfer (n=6 to 12 mice per group). (e-f) Isolated CD4+
T cells from
Cpdm+/-
and Cpdm-/-
mice were differentially labeled with Cell Trace Far Red DDAO-SE and Violet dye, respectively, or vice versa, and
then co-injected into WT recipient mice. Flow cytometric analysis (left) or percentage (right) of the input population and transferred
CD4+Foxp3
- T cells (e), flow cytometric analysis (left) or percentage (right) of the input population and transferred CD4
+Foxp3
+ T cells
(f), isolated from various tissues of the recipient mice at 2 or 20 hr after injection (n=6 mice per group). The data are compiled or
representative of two to four independent experiments. Error bars indicate the mean (± s.d.). *P < 0.05 **P < 0.01, ***P < 0.001 and
****P < 0.0001 (two-tailed unpaired t-test).
Nature Immunology: doi:10.1038/ni.3352
Nature Immunology: doi:10.1038/ni.3352

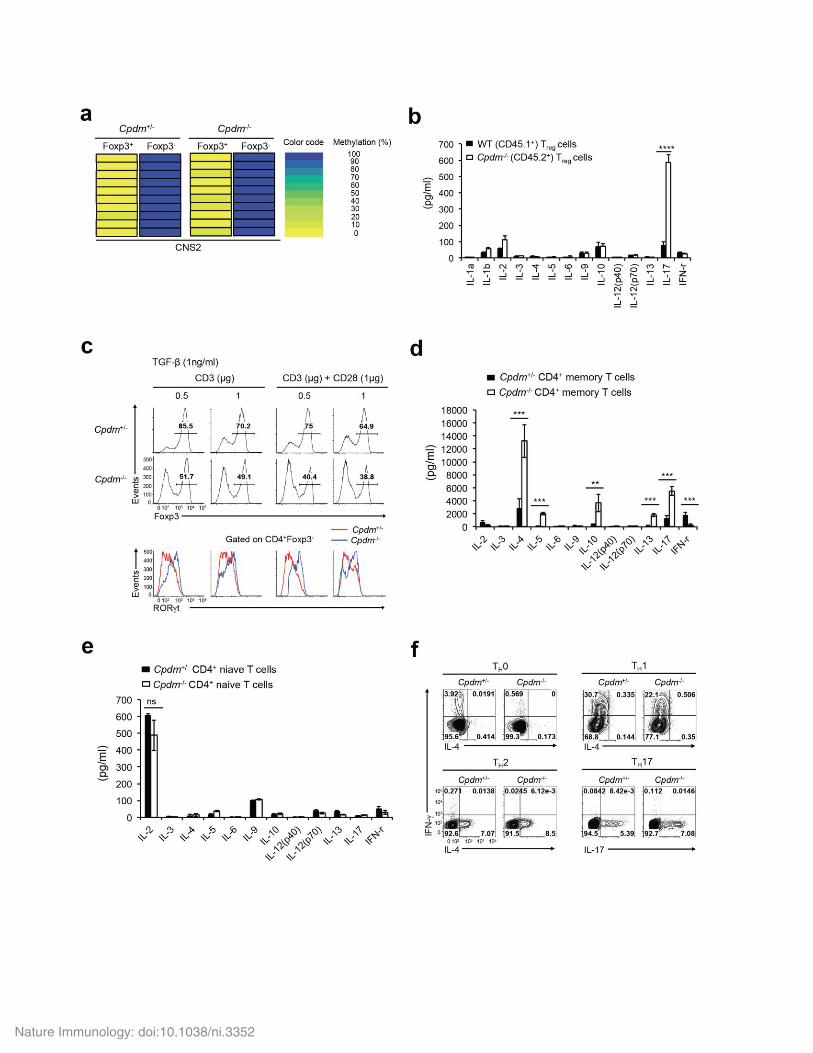
Supplementary Figure 5
Cytokine production in SHARPIN-deficient memory or naive T cells or Treg cells.
(a) The methylation pattern of CNS2 of the Foxp3 locus in sorted CD4+YFP
+CD25
+ Treg cells and CD4
+YFP
-CD25
- conventional T cells
from Foxp3YFPCre
Cpdm+/-
or Foxp3YFPCre
Cpdm-/-
mice. Individual CpG motif within CNS2 is vertically arranged and color-coded according
to the degree of methylation at that site (n=6 mice per group). (b) Sorted CD45.1+CD4
+CD25
+Nrp1
+ or CD45.2
+CD4
+CD25
+Nrp1
+ Treg
cells from mixed chimeric mice were cultured with anti-CD3 and anti-CD28 for 36 h. Cytokine production was measured by bio-plex
multi-cytokine assay (n=6 mice per group). (c) Flow cytometric analysis of Foxp3 (upper) or RORγt (bottom) expression in CD4+
T cells
from Cpdm+/-
and Cpdm-/-
mice upon stimulation with the indicated concentration of anti-CD3 or anti-CD3 and anti-CD28 in the
presence of TGF-β (1ng/ml) and IL-2. (d-e) Cytokine production was measured by bio-plex multi-cytokine assay in sorted memory
CD4+CD44
+CD62L
- T cells (d) or naïve CD4
+CD62L
+CD44
-CD25
- T cells (e) from Cpdm
+/- and Cpdm
-/- mice upon TCR and CD28
stimulation for 36 h. f, Sorted naïve CD4+CD62L
+CD44
-CD25
- T cells from Cpdm
+/- and Cpdm
-/- mice were cultured under TH0, TH1, TH2
and TH17 polarizing conditions for 5 days. IFN-γ, IL-4 or IL-17A producing cells were analyzed by intracellular cytokine staining and flow
cytometry 6 h after restimulation with anti-CD3 and anti-CD28 (n=6 mice per group). The data are compiled or representative of two to
four independent experiments. Error bars indicate the mean (± s.d.). *P < 0.05 **P < 0.01, ***P < 0.001 and ****P < 0.0001 (two-tailed
unpaired t-test).
Nature Immunology: doi:10.1038/ni.3352

Supplementary Figure 6
Phosphorylation status of signaling proteins upon stimulation with various stimuli.
(a) Analysis of the phosphorylation status of signaling proteins in sorted CD4+
T cells from Cpdm+/-
and Cpdm-/-
mice upon TCR and
CD28 stimulation. (b) Analysis of the phosphorylation status of signaling proteins in sorted DP thymocytes from Cpdm+/-
and Cpdm-/-
mice upon TCR stimulation. (c) Analysis of the phosphorylation status of signaling proteins in sorted CD4+
T cells from Cpdm+/-
and
Cpdm-/-
mice upon TNF stimulation. (d) Splenocytes from Cpdm+/-
and Cpdm-/-
mice were stimulated with PMA and Ionomycin for 10
min. Phosphorylation status of ERK1/2 in CD4+Foxp3
- T or CD4
+Foxp3
+ Treg cells were analyzed by intracellular phosphor-protein
staining. The data are representative of three independent experiments.
Nature Immunology: doi:10.1038/ni.3352

Nature Immunology: doi:10.1038/ni.3352

Supplementary Figure 7
Linkage-specific ubiquitination and the mapping of ubiquitination sites on SHARPIN.
(a-c) Jurkat T cells were transiently expressed with the indicated plasmids and analyzed for ubiquitination. (a) HA-Ub WT and
SHARPIN WT or mutants (F354V, K42R, K168/169R and K312R); (b) HA-Ub WT or mutants (K11, K48 and K63) and SHARPIN WT or
mutants (K42R, K168/169R and K312R); and (c) HA-Ub WT or mutants (K11 and K48) and SHARPIN WT or mutants (F354V and
K312R). Cells were stimulated with OKT3 for 5 min, and lysed by adding SDS lysis buffer (2% SDS) and immunoprecipitated with anti-
Myc antibody. The data are representative of three independent experiments.
Nature Immunology: doi:10.1038/ni.3352

Nature Immunology: doi:10.1038/ni.3352

Supplementary Figure 8
Knockdown of SHARPIN reduces the generation of Treg cells, but knockdown of HOIP does not.
(a) Analysis of mAmetrine expression in peripheral blood (left) and SHARPIN or HOIP protein expression (right) from BM chimeric mice
8 wks after reconstitution with retrovirus vector expressing control, HOIP or SHARPIN shRNA. (b) Splenocytes from WT mice were
stimulated with concanavalin A, followed by retroviral transduction of retrovirus vector expressing control, HOIP or SHARPIN shRNA.
Four days after transduction, the phosphorylation status of signaling proteins was analyzed in sorted mAmetrine+CD4
+T cells upon TCR
stimulation. (c-d) Flow cytometric analysis of Foxp3 expression in pregated mAmetrine+CD45.2
+CD4
+ T cells in thymus (c) or SP (d) of
the mice in (a) (n=6 mice per group). The data are compiled or representative of three independent experiments with two mice each.
Error bars indicate the mean (± s.d.). *P < 0.05 **P < 0.01, ***P < 0.001 and ****P < 0.0001 (two-tailed unpaired t-test).
Nature Immunology: doi:10.1038/ni.3352

Supplementary Table 1
Nature Immunology: doi:10.1038/ni.3352

Supplementary Table 2
Nature Immunology: doi:10.1038/ni.3352