Nature and Science 2017;15(12) ... · Geotechnical and Radiometric Studies for New Alamein City,...
14
Nature and Science 2017;15(12) http://www.sciencepub.net/nature 98 Geotechnical and Radiometric Studies for New Alamein City, Egypt Ahmed, M., Saad 1 , Essam M. Esmail 2 , Osama, M., Draz 2, and Belal, M, Abdou 1 1 Geology Department, Faculty of Science, Al-Azhar University, Cairo, Egypt. 2 Subsurface Geology Dept. Nuclear Material Authority, Cairo, Egypt. [email protected] Abstract: This research involves geotechnical and radiometric studies for New Alamein - Egypt. The study area lies in the northern portion of the Western Desert between Latitudes 30 o 44" and 30 o 38" North and Longitudes 28 o 51" and 28 o 48" East, on the North-Western coast of Egypt (Fig.1). The main objective of the current study is to evaluate the foundation materials and soil bearing capacity of the study area. The geotechnical properties of the foundation materials, including grain size distribution, specific gravity and direct shear test, Atterberg limits (liquid, plastic, shrinkage limits and plasticity index), Free swell test and swell pressure. Grain size parameters are Uniformity Coefficient (Cu) and Curvature Coefficient (Cc) used as principles classification of soil. Uniformity coefficient (C u ) values are ranging from (1.39mm) to (20.40 mm) with an average (10.90mm) and Curvature Coefficient (Cc) values are ranging from (0.20mm) to (4.62mm). Grain size parameters indicate poorly-graded soil, and that from the standpoint of classification engineering geology. Specific gravity ranges from (2.40 to 2.85). The free swell of studied samples varies between 20% (low expensive) and 210% ( very high expensive soil). Aterberg limits and consistency of cohesive soil indicate that, the studied samples are semi plastic or solid, extremely stiff and vary between intermediate and very high plasticity. This paper also presents radiometric studies to detect the level of radiation safety. [Ahmed, M., Saad, Essam M. Esmail, Osama, M., Draz and Belal, M, Abdou. Geotechnical and Radiometric Studies for New Alamein City, Egypt. Nat Sci 2017;15(12):98-110]. ISSN 1545-0740 (print); ISSN 2375-7167 (online). http://www.sciencepub.net/nature . 9. doi:10.7537/marsnsj151217.09 . Key words: Geotechnical, Radiometric, New Alamein City, Western Desert. 1. Introduction and Geological Setting The Western Desert covers a surface area of about 700.000 km2. The study area lies in the northern portion of the Western Desert, on the North-western coast of Egypt (Fig.1). Bordered by the international costal road (Alexandria – Matrouh ) to the North East, Hamam Chanal to the North, Alexandria to the East and Betrolum Road to the west between Latitudes 30◦45" and 30◦35" North and Longitudes 28◦51" and 28◦48"East. The study area is made up of sedimentary rocks formed during Tertiary and Quarterly geologic ages (Selim, A, A.1971). The outcrops of the investigated area are shown as Sand and Clay-rich units of Early Miocene at the northeastern part of the Qattara Depression, while Calcareous Sands and Clay- rich sediments of Middle and Late Eocene and Oligocene ages lie in the southern and western boundaries of the depression. The area in and around Moghra Lake is mostly covered by Quaternary deposits. Unconsolidated Aeolian Sands, Sabkha deposits, and wadi fill unconformable overlying the Miocene rocks represent the Quaternary deposits. These Quaternary deposits are unconformable underlying by Middle Miocene deposits (Marmarica Formation) that overlying the Moghra Formation of Lower Miocene that crops out at the edge of the Qattara Depression. The area has a Mediterranean climate, as it lies in the northern extremity of the Western desert of Egypt, parallel to the Mediterranean Sea. Structural Setting: Egypt is limited by the divergent boundary of Red Sea-Gulf of Suez Rift from the east and by the Mediterranean convergent boundary to the north (Fig. 3). Internally, the Egyptian margin is differentiated into unstable shelf in the north and stable shelf in the south. The unstable shelf is characterized by highly folded and faulted Mesozoic-Tertiary rocks, whereas the stable shelf is dominated by nearly horizontal- lying Mesozoic-Tertiary rocks. The area under investigation, where the Anew Alamein site is located, in north Western Desert, lies at the northern terminus of the Nile Valley rift and to the northwest of the Gulf of Suez rift Fig (3). Thus, the structural setting of the study area is controlled mainly by the Northwest oriented faults that are continued from these two structural domains as well as by the east-west faults and folds that are related to the Syrian Arc system in North Egypt (Worly parson report 2010). 2. Methodology The present work involved a number of pore hole disturbed soilsamples were collected from different locations in the New Alamein city and analyzed for various index and engineering parameters. Various geotechnical tests were conducted on the soil samples
Transcript of Nature and Science 2017;15(12) ... · Geotechnical and Radiometric Studies for New Alamein City,...

Nature and Science 2017;15(12) http://www.sciencepub.net/nature
98
Geotechnical and Radiometric Studies for New Alamein City, Egypt
Ahmed, M., Saad1, Essam M. Esmail2, Osama, M., Draz2, and Belal, M, Abdou1
1Geology Department, Faculty of Science, Al-Azhar University, Cairo, Egypt. 2 Subsurface Geology Dept. Nuclear Material Authority, Cairo, Egypt.
Abstract: This research involves geotechnical and radiometric studies for New Alamein - Egypt. The study area lies in the northern portion of the Western Desert between Latitudes 30o44" and 30o38" North and Longitudes 28o51" and 28o48" East, on the North-Western coast of Egypt (Fig.1). The main objective of the current study is to evaluate the foundation materials and soil bearing capacity of the study area. The geotechnical properties of the foundation materials, including grain size distribution, specific gravity and direct shear test, Atterberg limits (liquid, plastic, shrinkage limits and plasticity index), Free swell test and swell pressure. Grain size parameters are Uniformity Coefficient (Cu) and Curvature Coefficient (Cc) used as principles classification of soil. Uniformity coefficient (Cu) values are ranging from (1.39mm) to (20.40 mm) with an average (10.90mm) and Curvature Coefficient (Cc) values are ranging from (0.20mm) to (4.62mm). Grain size parameters indicate poorly-graded soil, and that from the standpoint of classification engineering geology. Specific gravity ranges from (2.40 to 2.85). The free swell of studied samples varies between 20% (low expensive) and 210% ( very high expensive soil). Aterberg limits and consistency of cohesive soil indicate that, the studied samples are semi plastic or solid, extremely stiff and vary between intermediate and very high plasticity. This paper also presents radiometric studies to detect the level of radiation safety. [Ahmed, M., Saad, Essam M. Esmail, Osama, M., Draz and Belal, M, Abdou. Geotechnical and Radiometric Studies for New Alamein City, Egypt. Nat Sci 2017;15(12):98-110]. ISSN 1545-0740 (print); ISSN 2375-7167 (online). http://www.sciencepub.net/nature. 9. doi:10.7537/marsnsj151217.09. Key words: Geotechnical, Radiometric, New Alamein City, Western Desert. 1. Introduction and Geological Setting
The Western Desert covers a surface area of about 700.000 km2. The study area lies in the northern portion of the Western Desert, on the North-western coast of Egypt (Fig.1). Bordered by the international costal road (Alexandria – Matrouh ) to the North East, Hamam Chanal to the North, Alexandria to the East and Betrolum Road to the west between Latitudes 30◦45" and 30◦35" North and Longitudes 28◦51" and 28◦48"East. The study area is made up of sedimentary rocks formed during Tertiary and Quarterly geologic ages (Selim, A, A.1971). The outcrops of the investigated area are shown as Sand and Clay-rich units of Early Miocene at the northeastern part of the Qattara Depression, while Calcareous Sands and Clay-rich sediments of Middle and Late Eocene and Oligocene ages lie in the southern and western boundaries of the depression. The area in and around Moghra Lake is mostly covered by Quaternary deposits. Unconsolidated Aeolian Sands, Sabkha deposits, and wadi fill unconformable overlying the Miocene rocks represent the Quaternary deposits. These Quaternary deposits are unconformable underlying by Middle Miocene deposits (Marmarica Formation) that overlying the Moghra Formation of Lower Miocene that crops out at the edge of the Qattara Depression. The area has a Mediterranean climate, as it lies in the northern extremity of the
Western desert of Egypt, parallel to the Mediterranean Sea. Structural Setting:
Egypt is limited by the divergent boundary of Red Sea-Gulf of Suez Rift from the east and by the Mediterranean convergent boundary to the north (Fig. 3). Internally, the Egyptian margin is differentiated into unstable shelf in the north and stable shelf in the south. The unstable shelf is characterized by highly folded and faulted Mesozoic-Tertiary rocks, whereas the stable shelf is dominated by nearly horizontal-lying Mesozoic-Tertiary rocks. The area under investigation, where the Anew Alamein site is located, in north Western Desert, lies at the northern terminus of the Nile Valley rift and to the northwest of the Gulf of Suez rift Fig (3). Thus, the structural setting of the study area is controlled mainly by the Northwest oriented faults that are continued from these two structural domains as well as by the east-west faults and folds that are related to the Syrian Arc system in North Egypt (Worly parson report 2010). 2. Methodology
The present work involved a number of pore hole disturbed soilsamples were collected from different locations in the New Alamein city and analyzed for various index and engineering parameters. Various geotechnical tests were conducted on the soil samples

Nature and Science 2017;15(12) http://www.sciencepub.net/nature
99
for finding out the effect on the various geotechnical parameters like grain size analysis, direct shear test, chemical analysis, Atterberglimits, Free swell test and Swellingpressure. The selected of geotechnical properties of all the samples were determined in accordance with the produces described by ASTM standers. A grain size analysis was performed according to ASTM D422-63 (1998), specific gravity performed according to ASTM D-854, direct shear test performed according to ASTM D-3080and moisture content wasperformed according to ASTM D-2216. Both the liquid and the plastic limit testes will be
carried out in one laboratory session. The testes will be carried out in accord with (ASTM) designation D-4318 for liquid limit, and plastic limit. While shrinkage limit according to ASTM D-427. In this study the direct shear test is used to estimate the shear strength parameters. The chemical analysis, in its simplest sense, is mainly used to determine the degree of aggressive of soils. By determine the organic, sulphate and chloride salts content. The water extraction method can be used for the sulphate, chloride, and PH values.
Fig (1): Location map of the studied area.

Nature and Science 2017;15(12) http://www.sciencepub.net/nature
100
Fig (2): Geologic map of the study area (After Sofratome, 1984).
Fig (3): Structural and main tectonic map of Egypt showing New Alamein site and its surrounding structural elements. (After, Worly Parson, 2010)

Nature and Science 2017;15(12) http://www.sciencepub.net/nature
101
3. Result and Discussion 1. Geotechnical properties:
In the present work the laboratory tests on sands and sand with gravels are sieves analysis, specific gravity, chemical analysis, and direct shear test, free swell and swelling pressure. 1.1. Grain Size Distribution Curve:
The usual method is based on the determination of particle size distribution by shaking a dried sample of the soil (after washing) through a set sieves and recording the mass retained on each sieve. The results of the sieve analysis are plotted with particle size horizontal and the summation percentage vertical. As
soil particles vary in size from molecular to boulder is necessary to use a log scale from horizontal plot so that the full range can be shown on the one sheet smith (1998).
From the particle size distribution curve, the values of D10, D25, D30, D60, D75, and D90 were obtained and the mathematical values were calculated according to formulas of Hazen (1892).
Grain size parameters are uniformity coefficient (cu) and curvature coefficient (cc) used as principles classification of soil. From the result of table (1) the grain size parameters indicate poorly-graded soil, and from standpoint of classification engineering geology.
Table (1): Grain size data of the studied samples.
Sieve opening (mm) Sample No.
Finer (Passing) weight (%) Statistical parameters
4 -2 2 -1 1 -0.5 0.5 -0.25 0.25-0.125 0.125-0.063 0.063-0.032 D10 D30 D60 CU CC
1.2 95.5 93 73.5 49.5 3.5 3 2 0.29 0.38 0.64 2.20 0.77 2.2 93 89.8 68.8 45.4 4.2 3.4 2.4 0.29 0.39 0.74 2.55 0.71 3.2 96.5 95 75.7 50.16 3.76 3.16 0 0.29 0.38 0.61 2.10 0.82 4.2 87.5 77 53.3 39.8 10.3 4.8 1 0.26 0.40 1.3 5 0.48 5.1 91 79.5 58.8 41.3 23.7 6.3 2.7 0.16 0.31 1.00 6.25 0.56 5.2 95.8 94.3 77.3 53.1 4.8 3.5 2 0.28 0.38 0.59 2.10 0.87 6.1 34 24 11 6 2.6 2.1 1.1 0.91 1.30 0 0 1.69 6.2 94.5 91.8 72.6 49.3 15.1 1.5 1 0.21 0.34 0.69 3.28 0.78
7.2 96.6 89.6 62.6 32.6 6.3 1.3 0.3 0.29 0.49 0.95 3.27 0.88 8.2 98 93.2 60.9 24.1 1.9 1.7 0.7 0.35 0.58 1.00 2.85 0.94 9.1 85.8 73.8 48.8 33 0.9 0.6 0 0.32 0.48 1.4 4.37 0.52 9.2 83.6 72.4 48.4 29.5 3.1 1 0.4 0.31 0.50 1.5 4.83 0.54 10.1 74 65 43 42.66 22.54 5.34 1.01 0.16 0.31 1.8 11.25 0.32 10.2 71 55.5 34.5 21.2 2 1.5 0.5 0.35 0.49 2.3 8 0.30 12.2 79 62.6 43.6 29.3 1.1 1 0.5 0.32 0.50 1.9 5.93 0.41 13.1 100 100 100 95 13 6 1 0.24 0.30 0.38 1.58 1 13.2 100 100 100 51.9 1.3 1 0.5 0.30 0.39 0.57 1.9 0.88 15.1 79.2 64.7 40.1 25.6 3.2 1.9 0.5 0.32 0.60 1.8 5.62 0.36 15.2 95.7 93.5 71.1 46.6 1.5 1 0.6 0.3 0.39 0.70 2.33 0.88 16.1 100 100 100 57.8 3.8 2 0 0.29 0.37 0.51 1.75 0.92
1.2. Specific Gravity (Gs)
The specific gravity (Gs) is the ratio of the weight of the soil solids to the weight of water of equal volume. table (2) gives the calculated values of specific gravity of The New Alamein Area, its value range from (2.40 to 2.85). 1.3. Degree of Aggressive for Soil
The chemical analysis, in its simplest sense, is mainly used to determine the degree of aggressive of soils. By determine the organic, sulphate and chloride salts content. The water extraction method can be used for the sulphate, chloride, and PH values. These values
are occasionally required to confirm the degree of aggressive for soil. From Table (3) the studied samples at third industrial zone of New Al-Alamein Area according to So3 classified as non-aggressive soil, as (2-1,4-2,9-2,10-1 and 14-2) while some samples as (1-2,3-2,6-1,7-1,11-2,12-1,15-1 and 16-1) classified as moderately aggressive soil and samples (5-2, and 13-2) are classified as aggressive soil. The PH values indicate all of the samples are non-aggressive soil, while Cl values indicate the most of the samples are non-aggressive except sample (5-2, 13-2) are moderately aggressive.

Nature and Science 2017;15(12) http://www.sciencepub.net/nature
102
Fig. (4): Grain Size Distribution Curves of Samples.
Table (2): Specific gravity of the studied samples.
Specific gravity (g/cc) Sample No. Specific gravity (g/cc) Sample No. 2.44 9-1 2.80 1-1 2.48 9-2 2.73 1-2 2.59 10-1 2.70 2-1 2.68 10-2 2.48 2-2 2.52 11-1 2.73 3-1 2.73 11-2 2.76 3-2 2.52 12-1 2.63 4-1 2.68 12-2 2.55 4-2 2.70 13-1 2.40 5-1 2.58 13-2 2.60 5-2 2.60 14-1 2.56 6-1 2.49 14-2 2.67 6-2 2. 61 15-1 2.33 7-1 2.69 15-2 2.52 7-2 2.59 16-1 2.85 8-1 2.61 16-2 2.41 8-2
Nature and Science 2017;15(12) http://www.sciencepub.net/nature
103
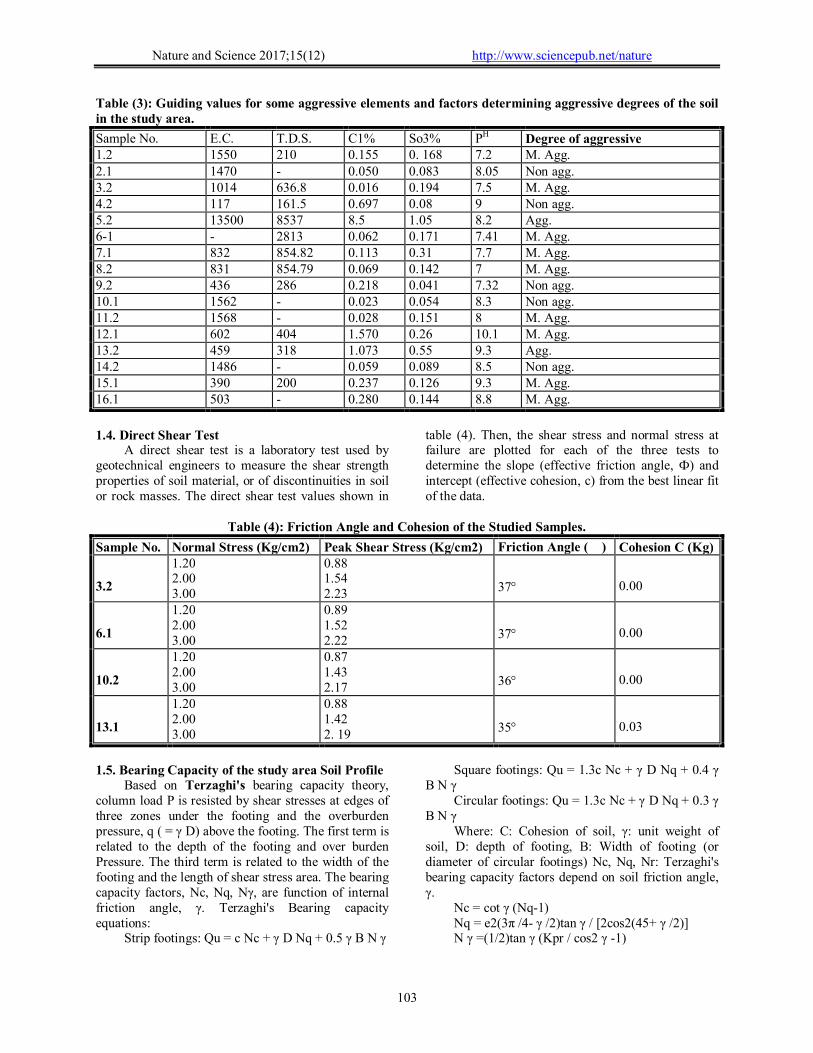
Table (3): Guiding values for some aggressive elements and factors determining aggressive degrees of the soil in the study area.
Sample No. E.C. T.D.S. C1% So3% PH Degree of aggressive 1.2 1550 210 0.155 0. 168 7.2 M. Agg. 2.1 1470 - 0.050 0.083 8.05 Non agg. 3.2 1014 636.8 0.016 0.194 7.5 M. Agg. 4.2 117 161.5 0.697 0.08 9 Non agg. 5.2 13500 8537 8.5 1.05 8.2 Agg. 6-1 - 2813 0.062 0.171 7.41 M. Agg. 7.1 832 854.82 0.113 0.31 7.7 M. Agg. 8.2 831 854.79 0.069 0.142 7 M. Agg. 9.2 436 286 0.218 0.041 7.32 Non agg. 10.1 1562 - 0.023 0.054 8.3 Non agg. 11.2 1568 - 0.028 0.151 8 M. Agg. 12.1 602 404 1.570 0.26 10.1 M. Agg. 13.2 459 318 1.073 0.55 9.3 Agg. 14.2 1486 - 0.059 0.089 8.5 Non agg. 15.1 390 200 0.237 0.126 9.3 M. Agg. 16.1 503 - 0.280 0.144 8.8 M. Agg.
1.4. Direct Shear Test
A direct shear test is a laboratory test used by geotechnical engineers to measure the shear strength properties of soil material, or of discontinuities in soil or rock masses. The direct shear test values shown in
table (4). Then, the shear stress and normal stress at failure are plotted for each of the three tests to determine the slope (effective friction angle, Ф) and intercept (effective cohesion, c) from the best linear fit of the data.
Table (4): Friction Angle and Cohesion of the Studied Samples.
Sample No. Normal Stress (Kg/cm2) Peak Shear Stress (Kg/cm2) Friction Angle () Cohesion C (Kg)
3.2
1.20 2.00 3.00
0.88 1.54 2.23
37
0.00
6.1
1.20 2.00 3.00
0.89 1.52 2.22
37
0.00
10.2
1.20 2.00 3.00
0.87 1.43 2.17
36
0.00
13.1
1.20 2.00 3.00
0.88 1.42 2. 19
35
0.03
1.5. Bearing Capacity of the study area Soil Profile
Based on Terzaghi's bearing capacity theory, column load P is resisted by shear stresses at edges of three zones under the footing and the overburden pressure, q ( = γ D) above the footing. The first term is related to the depth of the footing and over burden Pressure. The third term is related to the width of the footing and the length of shear stress area. The bearing capacity factors, Nc, Nq, Nγ, are function of internal friction angle, γ. Terzaghi's Bearing capacity equations:
Strip footings: Qu = c Nc + γ D Nq + 0.5 γ B N γ
Square footings: Qu = 1.3c Nc + γ D Nq + 0.4 γ B N γ
Circular footings: Qu = 1.3c Nc + γ D Nq + 0.3 γ B N γ
Where: C: Cohesion of soil, γ: unit weight of soil, D: depth of footing, B: Width of footing (or diameter of circular footings) Nc, Nq, Nr: Terzaghi's bearing capacity factors depend on soil friction angle, γ.
Nc = cot γ (Nq-1) Nq = e2(3π /4- γ /2)tan γ / [2cos2(45+ γ /2)] N γ =(1/2)tan γ (Kpr / cos2 γ -1)

Nature and Science 2017;15(12) http://www.sciencepub.net/nature
104
Kpr = Passive pressure coefficient. In this research, A square foundation is (1.5 x 1.5
m), the unit weigh of soil is 18 KN / m³, the depth of the foundation is 1.5 m. The results of the ultimate soil
bearing capacity for different friction angles of the studied samples are showed in table (5). The values range from 1576 KN / m² to 2059 KN / m².
Fig. (5): Shear Stress Versus Normal Stress of Samples No. (3.2, 6.1).
Table ( 5 ): The Ultimate Soil Bearing Capacity of the Studied Samples.
Sample No. Friction Angle () Cohesion (C) (Kg) Nc Nq N γ Qu (KN/m²) 3.2 37 0.00 57.8 52.7 58.9 2059
6.1 37 0.00 57.8 52.7 58.9 2059
10.2 36 0.00 68.2 51.1 48.3 1901
13.1 35 0.00 68.2 41.4 42.4 1576

http://www.sciencepub.net/nature(x) 5;17Nature and Science 201
- 105 -
2. Geotechical Properties of Fine Soiled: 2.1. Moisture Content:
The moisture content is defined as the ratio of the weight of water (Wow) present in a given soil mass to the dry weight of solid soil particles (Wd).
The results of this test of the studied samples are given in table (6). The values range between (11.55 to 19.58%). 2.2. Atterberg Limits and Consistency of Fine grained Soil:
Atterberg limits are empirically developed but widely used procedures for establishing and describing the consistency of soil. The engineering properties (uses) of fine grained soils are, generally, related to these index properties. The more plastic a soil means the more compressible, higher shrinkage-swell potential and the lower is its permeability will be (Abramson et al., 1996). Plastic index is important in classifying fine-grained soils and is fundamental to the Casagrande plasticity chart. Liquid Limit (L.L):
The liquid limit is the water content at the point of transition of the clay sample from a liquid state to the plastic state.
The results of the liquid limit of studied samples are given in table (7) results of the liquid limit range between (40 to 63%). Plastic Limit (P.L):
The plastic limit is determined by rolling a small soil sample into threads and finding the water content
at which threads approximately 3 mm in diameter will just start to crumble. The plastic limit depends on the type and amount of clay fraction in soil. The results of the plastic limit of studied samples are given in table (7). The values of the plastic limit range between (18 to 29% ). Shrinkage Limit (S.L):
According to (Arora, 1988) the shrinkage limit is the water content below which no appreciable change in volume is observed. The results of this test are given in table (7). The values of this limit range between ( 9.8 to 13.87%). The shrinkage and its counterpart swelling of a cohesive soil are greatly influenced by the mutual arrangement of its constituent particles, i.e., its structure. For disturbed clay paste, low shrinkage limit values indicate a flocculated structure. Plasticity Index (P.I):
The plasticity index is defined as the numerical difference between the liquid limit and the plastic limit. The values of the plasticity index are given in table (8). The value range from 19 (high plastic) to 34 high plastic). Liquidity Index (L.I):
It is the ratio of the difference between natural water content and plastic limit to the plasticity index.
The values of this liquidity index are given in table (7) and range between -0.15 to 0.04 an average (-0.055). The liquidity index of studied samples according to (Whitlow, 1983), is semi plastic or solid.
Table (7):Atterberg Limits and Free Swell Test of the Studied Samples.
Sample No. Liquid Limit (L.L.) Plastic Limit (P.L.) Shrinkage Limit (S.L.) Moisture Content% Free Swell% 1.1 54 28 11.51 19.58 210 2.1 47 27 13.87 18.26 70 3.1 56 29 11.47 11.55 210 3.2 63 29 13 13.20 80 4.1 43 24 11 18.5 180 5.1 49 23 12.7 19.1 80 8.1 40 18 9.8 19 190
Table (8):Plasticity Index, Iquidity Index and Consistency Index of the Studied Samples.
Sample No. Plasticity Index % (P.I.) Liquidity Index % (L.I.) Consistency Index% (C.I.) 1.1 26 -0.32 1.32 2.1 20 -0.43 1.43 3.1 27 -0.64 1.64 3.2 34 -0.46 1.46 4.1 19 -0.28 1.28 5.1 26 -0.15 1.15 8.1 22 0.045 0.95
Consistency Index (C.I): The consistency is defined as the resistance of
the soil to deformation (Arora, 1988). The values of

Nature and Science 2017;15(12) http://www.sciencepub.net/nature
106
this index are given in table (8). Results of the consistency index range between (0.95 to 1.64%). The studied samples consistency can be considered extremely stiff. 2.3. Free Swell Test:
The free swell tests consists of placing a known volume of dry soil in water and noting the swelled volume after the material settles, without any surcharge to the bottom of a graduated cylinder. The difference between the final and initial volume, expressed as a percentage of initial volume is the free swell value. According to Bell (1983), soils
havingfrees well value as high as 100% can cause considerable damage to lightly loaded structures, and soils having freeswell value below 50% seldom exhibit appreciable volume change even under very light loadings. The values of the free swelling of the studied samples are given in Table (7) and range between (70 to 210 %). All samples have free swell of greater 50%. Hence, considerable attention should be given in foundation design even for light structures on such soils because their value shows expansiveness property.
Fig. (6): Relationship between swelling percent and applied pressure ( samples No. 1-1 & 4-1 ).
Table (9): Swelling pressure values of some claystone samples obtained by Odometer test.
Sample No. Clay type Swelling pressure kg/cm2 1-1 Kaolinite + Illite 4.1 4-1 Kaolinite + Illite 4

http://www.sciencepub.net/nature(x) 5;17Nature and Science 201
- 107 -
8-1 Kaolinite + Illite 3.5
2.4. Swellig pressure Test: Swelling Pressure, According to (ASTM; D2435):
Swelling pressure of soil samples detected by Odometer test. The details of the test apparatus and the testing procedures are described in ASTM; D2435. A disk of soil is enclosed in a stiff metal ring and placed between two porous stones in a cylindrical container filled with water. A metal load platen mounted on top of the upper porous stone transmits the applied vertical stress to the soil sample. Both the metal platen and the upper porous stone can move vertically inside the ring as the soil settles under the applied vertical stress. The soil specimen is placed in a metal ring and porous stone discs are placed on the top and bottom of the specimen. The test specimen is allowed to consolidate under a number of increments of vertical stress, each stress being maintained constant until the compression ends. The stress usually employed are0.25, 0.5, 1, 2, 4, 8 and 16 kg/cm2. There are various methods for measuring the swelling pressure using the Odometer, one method will be studied in the present work, this method is different pressure method. In this method, three or more identical specimens loaded by different loads, and the final swelling or compression is recorded. Then the vertical deformation percent is drawn versus the vertical applied pressure. The pressure corresponding to zero swelling percent, can be determined as the swelling pressure.
In this work 3samples were obtained from the yclaystone samples encountered at different localities of the city to determine the swelling pressure. The swelling pressure values of the selected examined samples determined from this test are given in table (9), the final swelling percentage drawn versus the vertical applied pressure as shown in Fig. (6).
3. Classification of Engineering Properties of Soil:
Fig. (7): Classification of Fine – Grained Soil (After Casagrand, 1948).
The classification of coarse grained soils (sand and sand with gravel) according to USCS (unified soil classification system) is showed in table (1). Some samples of coarse grained soil contain more than 12% of finer fractions or contain from 5% to 12% of finer fractions. The fine grained soils of the studied sample are classified by using plasticity chart according to Casagrand's (1948), Fig. (7) shows the claystone of study area can be classified as inorganic clay of high and very high plastic soil. 4. Radioactivity
Radioactivity phenomenon is the effect of emitting radiation during decay of the radioactive elements. This decay is the spontaneous disintegration of one nuclide to another one. It is accompanied with the emission of alpha [2He4] and beta [-1e
0] particles and electromagnetic radiation known as gamma radiation (Read, 1984). The gamma rays are the most important in the prospection and exploration for nuclear raw materials due to their considerable range which may reach several hundreds of feet’s in air and so they can be detected from such relatively long distances using scintillometers as detectors. However, their range in rocks is less than five feet. The alpha and beta particles have much lower range of penetration than gamma ray (Darnely, 1982). Alpha particles, nuclei of [2He4] atoms, are tightly bound assemblies of two protons and two neutrons, have a positive charge of two units and a mass of four units. Beta particles [-1e
0] are electrons, having negligible mass in comparison with alpha particles, and a negative charge of one unit. Gamma – rays [ ] are emitted in packets (quanta) of energy known as photons (electromagnetic waves); the energy of each photon depends on its characteristic wavelength or frequency in space. Gamma-rays can be considered as a small packet of wave energy travelling with speed equal to that of light, and having a frequency that is directly proportional to the energy of radiation. The gamma-rays are the most important in prospection and exploration works due to their considerable range of penetration that reaches several hundred feet in air, and so they can be detected from long distances. However, their range in rocks is less than five feet. Beta particles have a range of few feet in air, and so their detection is useful in outlining the limits of local radioactive body (Darnely, 1982).
Also, accurate measurements of beta particles are applied for assay purposes and face-check in uranium mines. Alpha particles have a range of penetration of only few inches in air, and they can be used for assay purposes through the detection of radon (gaseous element in the uranium decay series). The radioactive
Nature and Science 2017;15(12) http://www.sciencepub.net/nature
108
elements group is named the actinide family in which the (5f) electronic orbital is progressively filled. The actinide family occupies the period seven in the periodic table which start with 90Th and ends with
103Lr and is represented by fourteen radioactive elements. There are only three elements of the actinide family naturally occurring in the earth crust (90Th,91Pa and 92U) but the other eleven elements were artificially prepared.
Equilibrium of uranium and thorium: The gamma-ray spectrometric determination of eU (Uequivalent) and eTh (Th equivalent) is based on the measurement of gamma-rays emitted by their daughters, because U and Th are not gamma-emitters. To get accurate measurements for U concentrations, the decay series of U238 must be in equilibrium, but any recent gain or loss of U gives incorrect values. The values of U/eU ratios are used to deduce whether U was added or leached from the rock; generally, ratios of the U/eU greater than one indicate recent U addition (the daughters which emit gamma-ray are not produced yet or at least the decay series does not reach the equilibrium state), while the ratios of U/eU less than one indicate recent U loss (daughter products from the radioactive decay of U have remained).
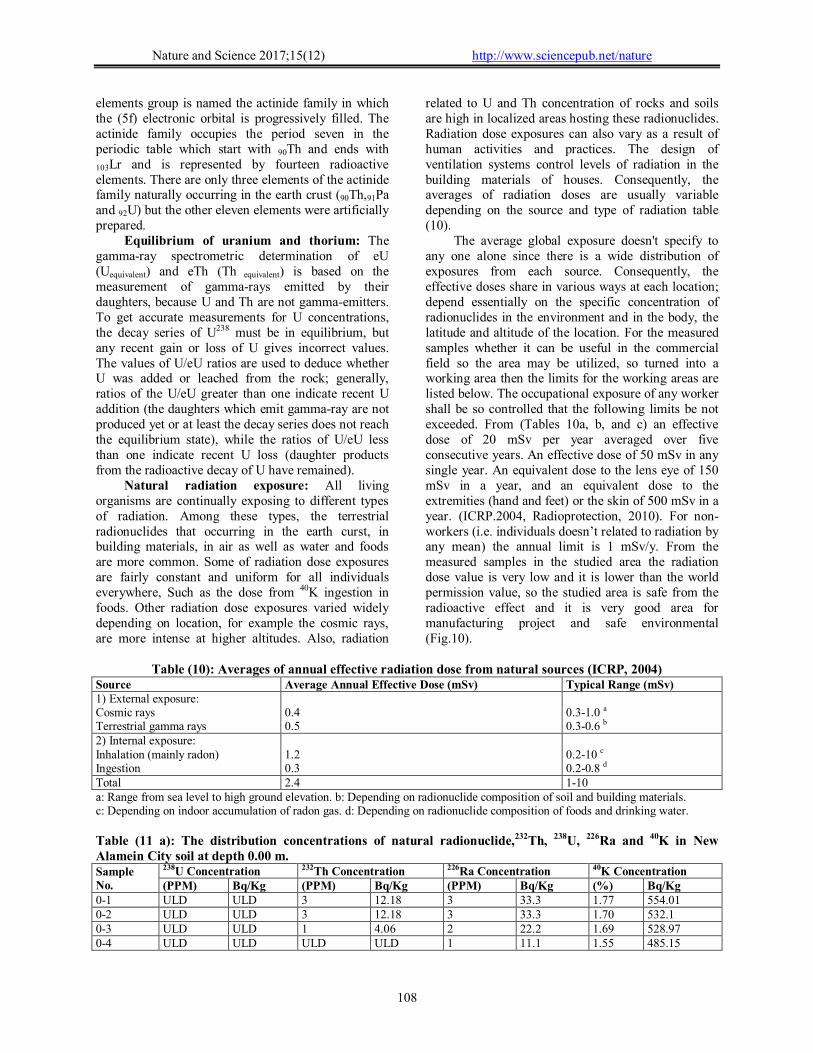
Natural radiation exposure: All living organisms are continually exposing to different types of radiation. Among these types, the terrestrial radionuclides that occurring in the earth curst, in building materials, in air as well as water and foods are more common. Some of radiation dose exposures are fairly constant and uniform for all individuals everywhere, Such as the dose from 40K ingestion in foods. Other radiation dose exposures varied widely depending on location, for example the cosmic rays, are more intense at higher altitudes. Also, radiation
related to U and Th concentration of rocks and soils are high in localized areas hosting these radionuclides. Radiation dose exposures can also vary as a result of human activities and practices. The design of ventilation systems control levels of radiation in the building materials of houses. Consequently, the averages of radiation doses are usually variable depending on the source and type of radiation table (10).
The average global exposure doesn't specify to any one alone since there is a wide distribution of exposures from each source. Consequently, the effective doses share in various ways at each location; depend essentially on the specific concentration of radionuclides in the environment and in the body, the latitude and altitude of the location. For the measured samples whether it can be useful in the commercial field so the area may be utilized, so turned into a working area then the limits for the working areas are listed below. The occupational exposure of any worker shall be so controlled that the following limits be not exceeded. From (Tables 10a, b, and c) an effective dose of 20 mSv per year averaged over five consecutive years. An effective dose of 50 mSv in any single year. An equivalent dose to the lens eye of 150 mSv in a year, and an equivalent dose to the extremities (hand and feet) or the skin of 500 mSv in a year. (ICRP.2004, Radioprotection, 2010). For non-workers (i.e. individuals doesn’t related to radiation by any mean) the annual limit is 1 mSv/y. From the measured samples in the studied area the radiation dose value is very low and it is lower than the world permission value, so the studied area is safe from the radioactive effect and it is very good area for manufacturing project and safe environmental (Fig.10).
Table (10): Averages of annual effective radiation dose from natural sources (ICRP, 2004)
Source Average Annual Effective Dose (mSv) Typical Range (mSv) 1) External exposure: Cosmic rays Terrestrial gamma rays
0.4 0.5
0.3-1.0 a 0.3-0.6 b
2) Internal exposure: Inhalation (mainly radon) Ingestion
1.2 0.3
0.2-10 c 0.2-0.8 d
Total 2.4 1-10 a: Range from sea level to high ground elevation. b: Depending on radionuclide composition of soil and building materials. c: Depending on indoor accumulation of radon gas. d: Depending on radionuclide composition of foods and drinking water.
Table (11 a): The distribution concentrations of natural radionuclide,232Th, 238U, 226Ra and 40K in New Alamein City soil at depth 0.00 m. Sample No.
238U Concentration 232Th Concentration 226Ra Concentration 40K Concentration (PPM) Bq/Kg (PPM) Bq/Kg (PPM) Bq/Kg (%) Bq/Kg
0-1 ULD ULD 3 12.18 3 33.3 1.77 554.01 0-2 ULD ULD 3 12.18 3 33.3 1.70 532.1 0-3 ULD ULD 1 4.06 2 22.2 1.69 528.97 0-4 ULD ULD ULD ULD 1 11.1 1.55 485.15

Nature and Science 2017;15(12) http://www.sciencepub.net/nature
109
Sample No.
238U Concentration 232Th Concentration 226Ra Concentration 40K Concentration (PPM) Bq/Kg (PPM) Bq/Kg (PPM) Bq/Kg (%) Bq/Kg
0-11 ULD ULD 3 12.18 3 33.3 1.65 516.45 0-12 ULD ULD ULD ULD 1 11.1 1.50 469.5 0-15 ULD ULD ULD ULD 2 22.2 1.27 397.51 0-8 ULD ULD 2 9.2 2 22.2 1.44 450.72 0-9 ULD ULD 1 4.06 1 11.1 1.40 438.2 Average ULD ULD 1.44 5.98 2 22.2 1.55 485.84
Table (11 b): The distribution concentrations of natural radionuclide, 232Th, 238U, 226Ra and 40K in New Alamein City soil at depth 5.00 m. Sample No.
238U Concentration 232Th Concentration 226Ra Concentration 40K Concentration (PPM) Bq/Kg (PPM) Bq/Kg (PPM) Bq/Kg (%) Bq/Kg
1-1 ULD ULD 2 9.2 2 22.2 1.66 519.58 2-2 ULD ULD 1 4.06 3 33.3 1.58 494.54 3-1 ULD ULD 1 4.06 1 11.1 1.49 466.37 5-2 ULD ULD 2 9.2 2 22.2 1.44 450.72 11-1 ULD ULD 3 12.18 3 33.1 1.61 503.93 12-2 ULD ULD ULD ULD 1 11.1 1.45 453.85 7-1 ULD ULD 1 4.06 2 22.2 1.56 516.45 8-1 ULD ULD 1 4.06 1 11.1 1.67 522.71 14-2 ULD ULD 2 9.2 2 22.2 1.60 500.8 Average ULD ULD 1.44 6.22 1.88 20.94 1.56 492.10
Table (11 c): The distribution concentrations of natural radionuclide, 232Th, 238U, 226Ra and 40K in Al-Alamein area soil at depth 10.00 m. Sample No.
238U Concentration 232Th Concentration 226Ra Concentration 40K Concentration (PPM) By/Kg (PPM) By/Kg (PPM) By/Kg (%) By/Kg
1-3 ULD ULD 4 16.24 4 44.4 1.90 594.7 2-3 ULD ULD 2 9.2 3 33.3 1.77 554.01 3-3 1 12.35 3 12.18 3 33.3 1.63 510.19 4-2 ULD ULD 2 9.2 2 22.2 1.59 497.67 5-3 ULD ULD 3 12.18 3 33.3 1.59 497.67 6-2 ULD ULD 3 12.18 3 33.3 1.87 585.31 7-3 ULD ULD 3 12.18 4 44.4 1.70 532.1 11-3 ULD ULD 1 4.06 2 22.2 1.54 482.02 15-3 ULD ULD 3 12.18 3 33.3 1.79 560.27 Average ULD 1.37 2.66 11.06 3 33.3 1.59 534.88

Nature and Science 2017;15(12) http://www.sciencepub.net/nature
110
Fig (8): Chart shows concentration of natural radionuclide, 232Th, 226Ra and 40K at New Alamein City soil. Conclusion
The present works have been carried out to study the geotechnical properties about the foundation beds of New Alamein city north western Desert of Egypt. Geotechnical studies dealt with the physical and engineering properties of soil samples, as well as theireffects on the construction stability. According to the Unified soil Classification system (USCS) of coarse grained indicate, all of the studiedsamples are SP (poorly graded soil), this type of soils have good load bearing capacities and good drainage qualities, and their strength and volume change characteristics are not significantly affected by changes in moisture conditions. Atterberg limits and consistency of cohesive soil indicate that, the studied samples are semi plastic or solid, extremely stiff and vary between intermediate and very high plasticity and high swelling pressure according to swell pressure test so this type of soil leads to risks to building. The averages of radiation doses are usually different depending on the source and type of radiation. The effective doses share in various ways at each location; depend essentially on the concentration of radionuclides in the environment and in the body. The occupational worker exposed to radiation doses not exceed. 20 mSv per year averaged over five consecutive years, 50 mSv in any single year, to 150 mSv in a year to the lens eye and 500 mSv in a year to the extremities (hand and feet) or the skin and for non-workers ( i.e individuals doesn’t related to radiation by any mean) the annual limit is 1 mSv/y. According to the radiometric measurements the study area is safefrom the radioactive effect environmental and it is very good area for any project.
References 1. Abramson, L. W., J. S. Lee, S. Sharma, G. M.
Boyce, 1996. Slope Stability and Stabilization Methods. John Wiley and Sons, Inc., New York, 629.
2. ASHTO (2001): Standard method of test for direct shear test of soil under consolidated drained conditions. T 236 –92. Washington, D. C.
3. ASTM D-3080 (2004): Standard testmethod for direct shear test of soils under consolidated drained conditions. Annual book of ASTM standards. D 3080, Sect. 4, Vol. 04.08. Philadelphia, Pa.
4. ASTM D - 422- 63 (2007): Standard test method for partical-size analysis of soils. West Conshohocken, USA: ASTM International; 2007.
5. ASTM D- 2216 (2010): standard test method for laboratory Determination of water (moisture) content of soil and rock by Mass, ASTM International, west conshohocken,2010.
6. ASTM D-4318 (2010): standard test method for liquid limit, plastic limit, and plasticity index of soils. West Conshohocken, USA: ASTM International; 2010.
7. ASTM D-854 (2014): Standard test method for specific Gravity of soil solids by water pycnometer. West Conshohocken, USA: American society of testing and materials (ASTM) International; 2014.
8. Bell, F. G., 1983: Fundamentals of Engineering Geology. Butterworth and Co. Ltd., London, 648.
9. Casagrande, A. (1948): Classification and identification of soils Am. Soc. Civ. Civ. Eng. Trans. Vol., 113, pp. 901 – 930.
10. CONOCO. (1987): Geological map of Egypt 1:50000. NH 36 NW CAIRO, Egypt.
11. Darnley, A. G. (1982): “Hot granites” Some general remarks, In: Maurice, Y. J. (ed.), Uranium in granites. Geol. Surv. Canada, paper No. 81-23, p. 1-10.
12. Hazen, A. (1892): Some physical properties of sands and gravels with special reference to their use in filtration. The 24th Annual Report of the State Board of Health of Massachusetts. Public Document No. 34, Boston, Wright and Potter Printing Co., p. 553.
13. ICRP, (2004a): Managing patient dose in digital radiology. ICRP Publication 93. Ann. ICRP 34 (1).
14. ICRP, (2004b): Release of patients after therapy with unsealed radionuclides. ICRP Publication 94. Ann. ICRP 34 (2).
15. ICRP, (2010): Preventing Accidental Exposures from New External Beam Radiation Therapy Technologies. ICRP Publication 112.
16. Selim, A. A. (1971): "Origin and lithification of the Pleistocene carbonates of the Salloum area, Western Coastal Plain of Egypt. Journal Geology Petrology, v. No.1.
17. Sofratome, (1984): “El-Dabaa Nuclear power plant, N. P. P. A., step 5, Report chap. 2 and 3, Ministry of Electricity and Energy, Egypt.”
18. Smith G. N. (1998): Element of soil mechanics, seven edition, black well science; UK. 494 P.
19. Terzaghi, K. and Peck, R. B. (1948): Soil mechanics in engineering practice. John Wiley and Sons, New York, 566 pp.
20. Read, H. H. (1984): Rutley’s elements of mineralogy. Published by S. K. Jain for CBS Publishers and Distributors, Delhi, India, 560 p.
21. Worly Parson, (2010): “El-Dabaa Nuclear power plant, N. P. P. A., Part 2, Seismic hazard assessment, Ministry of Electricity and Energy, Egypt.”

http://www.sciencepub.net/nature(x) 5;17Nature and Science 201
- 111 -
11/18/2017