Natural Selection on the Olfactory Receptor Gene Family …€¦ · Am. J. Hum. Genet....
13
Am. J. Hum. Genet. 73:489–501, 2003 489 Natural Selection on the Olfactory Receptor Gene Family in Humans and Chimpanzees Yoav Gilad, 1,2 Carlos D. Bustamante, 3 Doron Lancet, 2 and Svante Pa ¨a ¨bo 1 1 Max Planck Institute for Evolutionary Anthropology, Leipzig; 2 Department of Molecular Genetics, The Weizmann Institute of Science, Rehovot, Israel; and 3 Department of Biological Statistics and Computational Biology, Cornell University, Ithaca, NY The olfactory receptor (OR) genes constitute the largest gene family in mammalian genomes. Humans have 11,000 OR genes, of which only ∼40% have an intact coding region and are therefore putatively functional. In contrast, the fraction of intact OR genes in the genomes of the great apes is significantly greater (68%–72%), suggesting that selective pressures on the OR repertoire vary among these species. We have examined the evolutionary forces that shaped the OR gene family in humans and chimpanzees by resequencing 20 OR genes in 16 humans, 16 chimpanzees, and one orangutan. We compared the variation at the OR genes with that at intergenic regions. In both humans and chimpanzees, OR pseudogenes seem to evolve neutrally. In chimpanzees, patterns of variability are consistent with purifying selection acting on intact OR genes, whereas, in humans, there is suggestive evidence for positive selection acting on intact OR genes. These observations are likely due to differences in lifestyle, between humans and great apes, that have led to distinct sensory needs. Introduction Olfactory receptor (OR) genes were discovered more than a decade ago by Buck and Axel (1991). Since then, it has been shown that mammalian genomes contain 11,000 OR genes (Glusman et al. 2001; Zozulya et al. 2001). In humans, these genes are located on most chromosomes and are organized in gene clusters, within which intact genes and pseudogenes are interspersed (Ben-Arie et al. 1994; Trask et al. 1998; Glusman et al. 2001). Since the early observations of a human-specific OR-coding-region disruption (Rouquier et al. 1998), researchers have speculated that the accumulation of OR pseudogenes occurred in parallel to a reduction in the sense of smell in primates (Sharon et al. 1999; Rouquier et al. 2000). This hypothesis found support in the observation that the size of the putatively func- tional OR gene repertoire in mice is three times larger than in humans (Young et al. 2002; Zhang and Fire- stein 2002). Recently, we reported that humans have accumulated OR-coding-region disruptions ∼4.3 times faster than any great ape, a significant difference in rates (Gilad et al. 2003). On the basis of these results, we concluded that there seems to be human-specific acceleration in OR pseudogene accumulation relative to apes. Thus, it would appear that different evolu- Received January 27, 2003; accepted for publication June 10, 2003; electronically published August 7, 2003. Address for correspondence and reprints: Dr. Yoav Gilad, Max Planck Institute for Evolutionary Anthropology, Deutscher Platz 6, Leipzig D-04103, Germany. E-mail: [email protected] 2003 by The American Society of Human Genetics. All rights reserved. 0002-9297/2003/7303-0004$15.00 tionary forces shape the OR gene repertoires of hu- mans and of great apes. These findings suggest that a relaxation of evolu- tionary constraints on OR genes has occurred in hu- mans and, to a lesser extent, in other primates. How- ever, studies of diversity at OR genes in humans re- vealed a pattern of nucleotide diversity, consistent with positive selection acting on human intact OR genes (Gilad et al. 2000; Gilad and Lancet 2003). Although simple demographic models could be excluded as pos- sible explanations for the observed patterns, more com- plex demographic models could not (Gilad and Lancet 2003). Our goals here are to study the evolution of the OR gene family in humans and chimpanzees, with a study design that allows us to distinguish demographic from selective explanations, and to estimate the strength of directional selection operating on intact OR genes and pseudogenes in humans and chimpanzees. To do so, we contrast the patterns of variability in the OR genes to that of putatively neutral empirical controls—the ration- ale being that demographic factors affect all loci in a similar fashion, so that patterns of polymorphism seen at the OR genes should mirror patterns of polymorphism seen at intergenic loci (within evolutionary and sampling error). In contrast, if natural selection is acting on OR genes, then the pattern of variability at OR genes should differ from that of the putatively neutrally evolving loci. By using this approach, we can assess the evidence for natural selection empirically, thus sidestepping the thorny issues involved in specifying the parameters of a demo- graphic null model.
Transcript of Natural Selection on the Olfactory Receptor Gene Family …€¦ · Am. J. Hum. Genet....
Am. J. Hum. Genet. 73:489–501, 2003
489
Natural Selection on the Olfactory Receptor Gene Family in Humansand ChimpanzeesYoav Gilad,1,2 Carlos D. Bustamante,3 Doron Lancet,2 and Svante Paabo1
1Max Planck Institute for Evolutionary Anthropology, Leipzig; 2Department of Molecular Genetics, The Weizmann Institute of Science,Rehovot, Israel; and 3Department of Biological Statistics and Computational Biology, Cornell University, Ithaca, NY
The olfactory receptor (OR) genes constitute the largest gene family in mammalian genomes. Humans have 11,000OR genes, of which only ∼40% have an intact coding region and are therefore putatively functional. In contrast,the fraction of intact OR genes in the genomes of the great apes is significantly greater (68%–72%), suggestingthat selective pressures on the OR repertoire vary among these species. We have examined the evolutionary forcesthat shaped the OR gene family in humans and chimpanzees by resequencing 20 OR genes in 16 humans, 16chimpanzees, and one orangutan. We compared the variation at the OR genes with that at intergenic regions. Inboth humans and chimpanzees, OR pseudogenes seem to evolve neutrally. In chimpanzees, patterns of variabilityare consistent with purifying selection acting on intact OR genes, whereas, in humans, there is suggestive evidencefor positive selection acting on intact OR genes. These observations are likely due to differences in lifestyle, betweenhumans and great apes, that have led to distinct sensory needs.
Introduction
Olfactory receptor (OR) genes were discovered more thana decade ago by Buck and Axel (1991). Since then, it hasbeen shown that mammalian genomes contain 11,000OR genes (Glusman et al. 2001; Zozulya et al. 2001). Inhumans, these genes are located on most chromosomesand are organized in gene clusters, within which intactgenes and pseudogenes are interspersed (Ben-Arie et al.1994; Trask et al. 1998; Glusman et al. 2001).
Since the early observations of a human-specificOR-coding-region disruption (Rouquier et al. 1998),researchers have speculated that the accumulation ofOR pseudogenes occurred in parallel to a reductionin the sense of smell in primates (Sharon et al. 1999;Rouquier et al. 2000). This hypothesis found supportin the observation that the size of the putatively func-tional OR gene repertoire in mice is three times largerthan in humans (Young et al. 2002; Zhang and Fire-stein 2002). Recently, we reported that humans haveaccumulated OR-coding-region disruptions ∼4.3 timesfaster than any great ape, a significant difference inrates (Gilad et al. 2003). On the basis of these results,we concluded that there seems to be human-specificacceleration in OR pseudogene accumulation relativeto apes. Thus, it would appear that different evolu-
Received January 27, 2003; accepted for publication June 10, 2003;electronically published August 7, 2003.
Address for correspondence and reprints: Dr. Yoav Gilad, MaxPlanck Institute for Evolutionary Anthropology, Deutscher Platz 6,Leipzig D-04103, Germany. E-mail: [email protected]
� 2003 by The American Society of Human Genetics. All rights reserved.0002-9297/2003/7303-0004$15.00
tionary forces shape the OR gene repertoires of hu-mans and of great apes.
These findings suggest that a relaxation of evolu-tionary constraints on OR genes has occurred in hu-mans and, to a lesser extent, in other primates. How-ever, studies of diversity at OR genes in humans re-vealed a pattern of nucleotide diversity, consistent withpositive selection acting on human intact OR genes(Gilad et al. 2000; Gilad and Lancet 2003). Althoughsimple demographic models could be excluded as pos-sible explanations for the observed patterns, more com-plex demographic models could not (Gilad and Lancet2003).
Our goals here are to study the evolution of the ORgene family in humans and chimpanzees, with a studydesign that allows us to distinguish demographic fromselective explanations, and to estimate the strength ofdirectional selection operating on intact OR genes andpseudogenes in humans and chimpanzees. To do so, wecontrast the patterns of variability in the OR genes tothat of putatively neutral empirical controls—the ration-ale being that demographic factors affect all loci in asimilar fashion, so that patterns of polymorphism seenat the OR genes should mirror patterns of polymorphismseen at intergenic loci (within evolutionary and samplingerror). In contrast, if natural selection is acting on ORgenes, then the pattern of variability at OR genes shoulddiffer from that of the putatively neutrally evolving loci.By using this approach, we can assess the evidence fornatural selection empirically, thus sidestepping the thornyissues involved in specifying the parameters of a demo-graphic null model.

490 Am. J. Hum. Genet. 73:489–501, 2003
We present a parametric analysis of the data that isbased on the Poisson random field (PRF) model (Sawyerand Hartl 1992; Bustamante et al. 2002), to estimate thedirection and strength of selection acting on amino acidreplacement mutations in OR genes. The present analysiscompares patterns of variability within and between spe-cies for pooled data at silent sites (mutations that do notalter amino acids) and replacement sites (mutations thatdo alter amino acids) for intact OR genes and pseudo-genes. The PRF approach makes efficient use of the infor-mation in McDonald-Kreitman (MK) tables (McDonaldand Kreitman 1991) by explicitly taking into accountshared parameters across genes (e.g., species divergencetime).
Both approaches strongly support the action of puri-fying selection on chimpanzee intact OR genes, whereaschimpanzee OR pseudogenes seem to evolve under noevolutionary constraint. Similarly, human OR pseudo-genes appear to evolve neutrally. Interestingly, our dataalso suggest the action of positive selection on a subsetof intact OR genes in humans.
Methods
Genomic Loci
OR genes were obtained from the HORDE database(see the Human Olfactory Receptor Data ExploratoriumWeb site), which contains the inferred protein sequencefor every intact OR gene and pseudogene, as mined fromthe public database (Glusman et al. 2001). ORs were se-lected at random (using a random number-generator func-tion in Perl), ignoring functional annotation, with the soleconstraint that the coding-region length be 1870 bp.
Seven putatively neutral, ∼800-bp intergenic loci weresequenced from the chimpanzee sample. These loci wereamplified using primers that were designed on the basisof the human sequence of the intergenic regions studiedby Frisse et al. (2001).
PCR and DNA Sequencing
Primers for PCR amplification and for sequencing weredesigned as the first and last 22 bp of each OR codingregion, to amplify the entire open reading frame. The sameprimers were used for the three species (human, chim-panzee, and orangutan). PCR was performed in a totalvolume of 25 ml, containing 0.2 mM of each deoxynu-cleotide (Promega), 50 pmol of each primer, 1.5 mM ofMgCl2, 50 mM of KCl, 10 mM of Tris (pH 8.3), 2 U ofTaq DNA polymerase, and 50 ng of genomic DNA. PCRconditions were as follows: 35 cycles of denaturation at94�C; annealing at 53�C, 55�C, or 57�C, depending onthe primers; and extension at 72�C. The duration of eachstep was 1 min, with the exceptions of the first step ofdenaturation and the last step of extension, which were
3 min and 10 min, respectively. PCR products were sep-arated and visualized in a 1% agarose gel and were pu-rified using the High Pure PCR Product Purification Kit(Boehringer Mannheim). Sequencing reactions were per-formed in both directions on PCR products, using a dye-terminator cycle sequencing kit (Perkin Elmer) on an ABI3700 automated sequencer (Perkin Elmer).
Sequence Analysis
After base calling with the ABI Analysis software,version 3.0, the data were edited and assembled usingthe Sequencher program, version 4.0 (GeneCodes). Atboth ends of each coding sequence, ∼35 bp (includingthe PCR primers) was excluded from analysis. SinceOR genes share a high degree of similarity, we com-pared the consensus sequence of each gene sequencedfrom each species against the HORDE database (seethe Human Olfactory Receptor Data ExploratoriumWeb site). In all cases, the best hit was the desired gene.
Data Analysis
We calculated three summaries of diversity levels: Wat-terson’s (Watterson 1975), based on the number ofvW
segregating sites in the sample; p (Nei and Li 1979), theaverage number of pairwise differences in the sample; and
(Fay and Wu 2000), a measure of diversity that givesvH
more weight to high-frequency alleles. Under the standardneutral model of a randomly mating population of con-stant size, all three summaries are unbiased estimators ofthe population mutation rate , where N is thev p 4Nm
diploid effective population size and m is the mutationrate per generation per site. To test whether the frequencyspectrum of mutations conformed to the expectations ofthis standard neutral model, we calculated the value oftwo test statistics: Tajima’s D (Tajima 1989b), which con-siders the difference between p and , and Fay and Wu’svW
H (Fay and Wu 2000), which considers the differencebetween p and . The probability of a type I error (PvH
value), for the D and H statistics, was estimated fromcoalescent simulations of an infinite-sites locus that410
condition on the sample size. The coalescent model wasimplemented with a fixed number of segregating sites,rather than with a population mutation rate (cf. Wall andHudson 2001). For the H test, P values are reported in-stead of H values, since this test is not standardized forthe number of polymorphic sites. All the reported P valuesconservatively assume no recombination within loci (Wall1999). The P values for a multiple-locus Tajima’s D testwere estimated using a simulation kindly provided by J.Hey (Department of Genetics, Rutgers University). Thisapproach assumes that all loci are unlinked but that thereis no recombination within loci. It asks whether the meanTajima’s D across loci is unexpected under the standardneutral model by estimating the probability of observing

Gilad et al.: Selection on OR Genes 491
a mean that is this negative or more extreme in 10,000simulations. For all tests, significance is assessed at the5% level.
The sequence for the ancestor of humans and chim-panzees was inferred by maximum likelihood, using thePAML software package (Yang 1997), with the orangu-tan sequence as the outgroup. This allowed the assign-ment of each of the fixed nucleotide substitutions toeither the human lineage or the chimpanzee lineage. Toestimate nonsynonymous-to-synonymous substitutionrates, the coding region of pseudogenes was correctedby adding 1 (2) nt in cases in which the disruption wasa deletion (insertion). Nonsynonymous-to-synonymoussubstitution rates were estimated using DnaSP (Rozasand Rozas 1999). Since each OR gene is only ∼1 kblong, there was not enough information to analyze thedifferences between individual OR genes. We thereforepooled all intact genes and all pseudogenes in eachspecies.
PRF Model
To model directional and purifying selection oper-ating on OR genes, we used a modified version of thePRF model of polymorphism and divergence (Sawyerand Hartl 1992; Bustamante et al. 2002) to model theMK cell entries in a test comparing polymor-2 # 2phism and divergence at silent and replacement DNAsites (McDonald and Kreitman 1991). This approachmakes the following assumptions:
1. The number of mutations arising across a genomiccoding region of total length L in a given generation isa Poisson process with intensity , wherev/2 p 2N mLe
is the effective population size and m is the mutationNe
rate per generation per site (for a summary of notationused in the present article, see appendix A).
2. Some fraction, , of replacement muta-1 � f0
tions is lethal and never contributes to polymorphismor divergence. Consequently, the effective mutationrate at replacement sites after purifying selection is
, where is the number of DNA sitesv /2 p 2N mL f Lr e r 0 r
at which a mutation would generate an amino acidchange. Silent mutations are considered to be neu-tral, so that , where is the numberv /2 p 2N mL Ls e s s
of DNA sites at which a mutation would not gener-ate an amino acid change.
3. The mutation rate is low enough—or, alternatively,that the recombination rate is high enough that genomicregions evolve independently. This is equivalent to assum-ing that there are only a few polymorphisms per gene ata given point in time.
Replacement mutations that are not lethal evolve ac-cording to independent Wright-Fisher diffusion withhaploid selection (Ewens 1978), so that new mutations
have Malthusian fitness relative to a wild-type fit-1 � sness of 1 ( ). For estimation purposes, the parame-FsF K 1ter of interest is . We refer to “strong positive”g p 2N se
selection when , “weak positive” or “weak nega-g 1 1tive” selection when , and “strong negative”�1 ! g ! 1selection when . Furthermore, when , we sayg ! �1 f ! 10
that purifying selection is operating on amino acid re-placement mutations (“negative” selection and “purify-ing” selection are both forms of natural selection againstnew mutations and, as terms, are often used interchange-ably).
To complete the parameterization of the model, let t
represent the number of human generations since2Ne
the divergence of humans and chimpanzees and r rep-resent the ratio of chimpanzee to human . Also,N Ne e
let represent the number of sampled human chro-nh
mosomes and represent the number of sampled chim-nc
panzee chromosomes.The data on variable sites in the aligned sequences
of humans and chimpanzees can be cross-classified intoeight categories based on three criteria for each of thetwo classes of OR genes (intact genes and pseudogenes),resulting in a table. These criteria are as2 # 2 # 2 # 2follows: fixed between species (K) versus variable withinspecies (S); amino acid replacement (subscript “r”) ver-sus silent (subscript “s”) mutation; arose along the hu-man lineage (subscript “h”) versus the chimpanzee line-age (subscript “c”); and occurred in a functional gene(f) versus a pseudogene (w). The total number of SNPsand the total number of fixed differences expected acrossthe two classes of OR genes for both silent and replace-ment mutations are Poisson-distributed random varia-bles (Sawyer and Hartl 1992; Bustamante et al. 2002).
Within the PRF framework, there are several parame-terizations that can be used to model the cell entries. Forease of statistical computation and the ability to testassumptions of the model, we choose to model the chim-panzee and human cell entries independently, with ashared species divergence time for functional genes andpseudogenes. This choice results in the following param-eters for each of the chimpanzee and human analyses:
, , and g parameters for functional genes; , , andv v v vs r s r
g parameters for pseudogenes; and t. By factoring ofthe conditional posterior distribution of t given all oth-er parameters in the model, it can be shown that the pa-rameter t is influenced only by data on neutral variation,so long as the replacement mutation rate is allowed tovary independently among the classes of mutations(C.D.B., unpublished data). This implies that we canestimate the ratio of the effective population sizes ofhumans and chimpanzees by using the ratio of the spe-cies divergence times from the independent analyses.
To approximate the posterior distribution of the pa-rameters given the observed data (i.e., the joint probabilityfor parameter values given the data), we use the Markov-

492 Am. J. Hum. Genet. 73:489–501, 2003
Table 1
OR Genes Sequenced in the Human Sample
HumanOR Genea Intact?b Clusterc vW p Tajima’s D
No. of ReplacementFixed Sites
No. of SilentFixed Sites
No. of ReplacementPolymorphic Sites
No. of SilentPolymorphic Sites
4A13P 174-stop [email protected] .0018 .0008 �1.61 7 1 5 28J2P 208-stop [email protected] .0011 .0008 �.77 3 1 3 15AK4P 236-stop [email protected] .0008 .0002 �1.72 1 3 2 19i2P 257-del [email protected] .0018 .0012 �1.07 7 4 5 251A6P 373-del [email protected] .0012 .0005 �1.55 2 0 5 07A8P 430-del 19@190 .0012 .0015 .38 5 2 4 15M13P 471-ins [email protected] .0016 .0013 �.48 7 4 3 35H8P 687-del [email protected] .0015 .0015 �.02 3 1 4 211H7P 691-stop [email protected] .0008 .0011 .87 5 0 2 151A1P 77-del ? .0015 .0016 .04 3 3 4 210A3 Yes [email protected] .0003 .0001 �1.14 1 1 1 010J5 Yes 1@188 .0005 .0004 �.65 1 0 1 113H1 Yes X@132 .0005 .0003 �1.03 1 1 1 14F15 Yes [email protected] .0005 .0003 �1.81 3 3 2 09A2 Yes [email protected] .0011 .0007 �.78 5 1 1 352L1 Yes [email protected] .0008 .0010 .67 2 1 3 06M1 Yes [email protected] .0011 .0008 �.64 0 4 1 351G2 Yes [email protected] .0011 .0009 �.42 3 0 3 11J2 Yes 9@? .0005 .0002 �1.26 3 0 1 16F1 Yes [email protected] .0008 .0008 �.03 4 1 1 1
a For OR gene sequences, see Entrez-Nucleotide (accession numbers AY283941–AY284580).b For pseudogenes, the nature and the nucleotide position of the disruption are given.c Human OR genes are mapped to specific OR gene clusters. Cluster names consist of chromosomal number and position (in Mb) along the
chromosome.
chain Monte Carlo (MCMC) method (Bustamante et al.2002), modified such that we use a single value of g foreach class of genes, rather than a hierarchical model forthe distribution of selective effects among genes. Conse-quently, there is no updating of the hierarchical param-eters in the model; rather, they are chosen a priori to havea large variance. The reason for this is that the cell entriesin the individual table for each gene are small,2 # 2 # 2so there is little information on the variation among genesin selection intensity within each class of genes.
For each of the human and chimpanzee data sets, weran 10 independent MCMC chains with overdispersedstarting points for 150,000 iterations. We retained sam-ples after the 50,000th step in each chain to allow for“burn-in” of the chains and used every 10th sample fromthe chain as a quasi-independent draw.
Results
We selected 20 OR genes without regard to functionalannotation and sequenced them in 16 humans (from theHausa population in Nigeria), in 16 western chimpanzees(Pan troglodytes verus), and in one orangutan. The ORgenes selected are from 14 OR gene clusters on nine dif-ferent human chromosomes (table 1). The choice of theHausa for the human sample was motivated by the recentpublication of polymorphism data for 10 intergenic re-gions from this population (Frisse et al. 2001). Frisse et
al. (2001) reported that the patterns of variability in theseregions in the Hausa are roughly consistent with a stan-dard neutral Wright-Fisher model of constant populationsize. This suggests that it may be easier to interpret pat-terns of polymorphism in the Hausa as compared withpopulations that fit poorly to a neutral null hypothesis(e.g., Italians or Chinese [Frisse et al. 2001]). The inter-genic regions reported for the Hausa (Frisse et al. 2001)are used here as a set of putatively neutral reference re-gions with which the OR genes are compared.
In humans, 10 OR genes (50%) contain at least onecoding-region disruption and are thus pseudogenes. Inchimpanzees, this is the case for six genes (30%). Thefraction of pseudogenes in our samples is consistentwith the overall OR pseudogene fraction in the humangenome (Glusman et al. 2001) and with the finding ofGilad et al. (2003) for a sample of 60 chimpanzees’ ORgenes. We found no OR genes that were segregatingboth intact and pseudogene variants in our sample, suchas were observed by Gilad and Lancet (2003).
For chimpanzees, there exist very few studies ofDNA sequence variation in putatively neutral regions(Deinard and Kidd 1999; Kaessmann et al. 2001; Stoneet al. 2002). We therefore sequenced seven ∼800-bpsegments of the 10 putatively neutral intergenic regionsdescribed by Frisse et al. (2001) in western chimpan-zees. The average nucleotide diversity for the intergenicregions is ∼50% higher in chimpanzees than in humans

Gilad et al.: Selection on OR Genes 493
Table 2
OR Genes Sequenced in the Chimpanzee Sample
ChimpanzeeOR Genea Intact?b vW p Tajima’s D
No. of ReplacementFixed Sites
No. of SilentFixed Sites
No. of ReplacementPolymorphic Sites
No. of SilentPolymorphic Sites
5AK4P 236-stop .0019 .0019 .21 4 0 6 19i2P 257-del .0016 .0015 �.19 6 2 6 051A6P 373-del .0011 .0005 �1.48 3 1 3 17A8P 430-del .0019 .0021 .32 6 3 5 251A1P 77-del .0011 .0007 �.45 4 1 2 210A3 824-stop .0029 .0039 1.08 2 2 7 410J5 Yes .0011 .0005 �1.45 3 0 4 011H7P Yes .0003 .0001 �1.14 3 1 1 013H1 Yes .0008 .0005 �.95 4 0 1 25M13P Yes .0019 .0014 �1.12 1 1 5 24F15 Yes .0008 .0004 �1.07 2 1 1 29A2 Yes .0011 .0008 �.61 2 3 4 04A13P Yes .0011 .0005 �1.45 2 2 2 252L1 Yes .0029 .0029 .03 5 3 6 56M1 Yes .0011 .0005 �1.45 0 1 3 151G2 Yes .0011 .0009 �.48 2 0 4 08J2P Yes .0013 .0006 �1.40 2 3 2 35H8P Yes .0003 .0001 �1.14 2 3 0 11J2 Yes .0003 .0003 .44 0 0 0 16F1 Yes .0014 .0008 �1.06 1 3 2 3
a For OR gene sequences, see Entrez-Nucleotide (accession numbers AY283941–AY284580).b For pseudogenes, the nature and the nucleotide position of the disruption are given.
Table 3
Intergenic Regions Sequenced in the Chimpanzee Sample
ChimpanzeeIntergenicRegion vW p Tajima’s D
No. of NoncodingSNPs
NE1 .0011 .0007 �.54 4NE2 .0013 .0013 �.01 4NE3 .0019 .0027 1.03 7NE4 .0008 .0005 �.95 3NE5 .0011 .0011 .37 4NE6 .0016 .0017 .22 6NE7 .0011 .0011 .37 4
(0.0015 and 0.0010, respectively), in agreement witha previous report for a noncoding locus on the X chro-mosome (Kaessmann et al. 2001). Human-chimpanzeedivergence for the intergenic regions is 1.3%, similarto previous estimates of putatively neutral genomicregions (Chen et al. 2001; Ebersberger et al. 2002).
Chimpanzee OR Genes
We considered three aspects of the data to assess sup-port for different models of natural selection. First, wecalculated the nucleotide diversity (as summarized by p
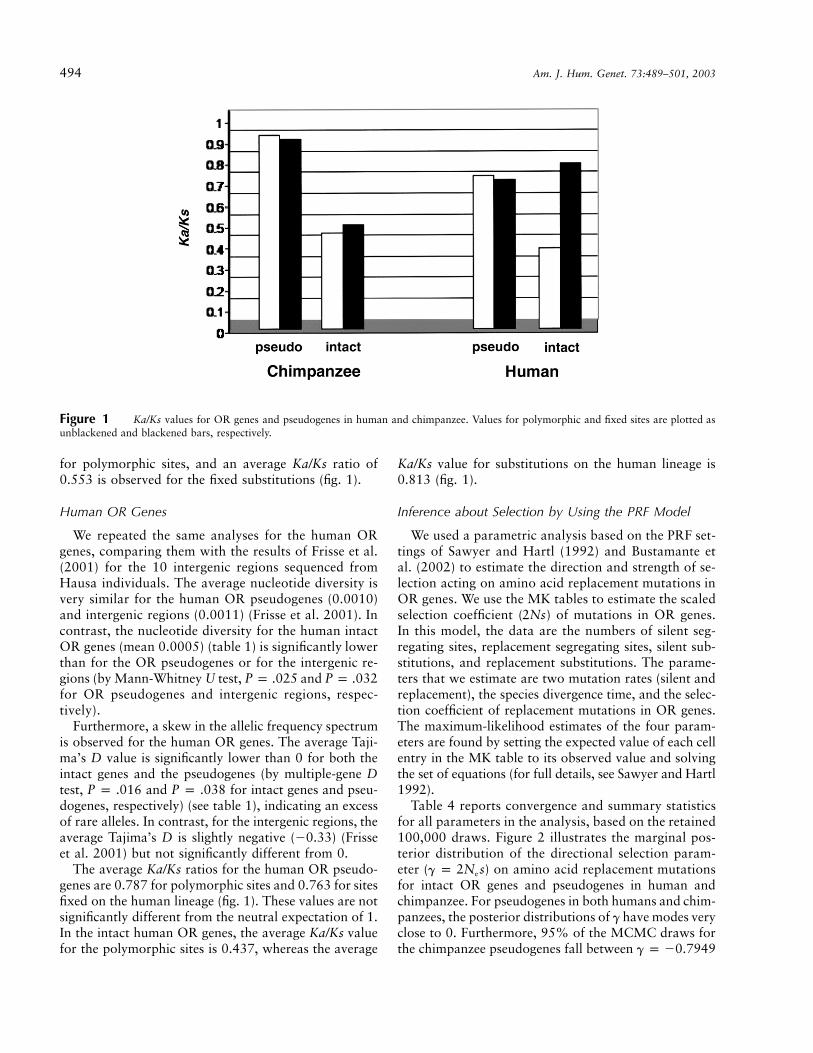
[Nei and Li 1979]). Second, we considered a summaryof the allelic frequency spectrum, Tajima’s D (Tajima1989b), the mean of which is expected to be ∼0 underthe standard neutral model. Negative D values reflectan excess of rare alleles, and positive D values reflect anexcess of intermediate-frequency alleles relative to neu-tral expectations. Third, we estimated the ratio of non-synonymous to synonymous (Ka/Ks) polymorphic siteswithin the species, as well as the Ka/Ks ratio for fixeddifferences between species. An average Ka/Ks of 1 isexpected if both amino acid replacement and silent mu-tations are selectively neutral. Lower values are consis-tent with selection against amino acid replacements (i.e.,purifying selection), whereas higher values reflect selec-tion that favors amino acid replacements (i.e., positiveselection).
We find that the average nucleotide-diversity valuesare roughly similar for the chimpanzee OR pseudogenes(0.0018) and the neutral regions (0.0013). In contrast,
the average nucleotide diversity of the intact chimpanzeeOR genes (0.0007) is significantly lower than that of thepseudogenes and that of the neutral regions (by Mann-Whitney U test, and for intact genesP p .033 P p .035and pseudogenes/neutral regions, respectively). The av-erage Tajima’s D values for the chimpanzee OR pseudo-genes and the neutral regions are �0.09 and 0.07, re-spectively—not significantly different from 0 at the 5%level. In contrast, Tajima’s D values for the chimpanzeeintact OR genes are negative for 12 of the 14 genes (tables2 and 3). The average D value, �0.92, is significantlydifferent from 0 (by multiple-locus D test, ), in-�5P ! 10dicating an excess of rare alleles as compared with neutralexpectations. The average Ka/Ks value for the chimpanzeeOR pseudogenes is ∼1, both for polymorphisms and forsubstitutions on the chimpanzee lineage (fig. 1). For theintact genes, an average Ka/Ks ratio of 0.509 is observed
494 Am. J. Hum. Genet. 73:489–501, 2003
Figure 1 Ka/Ks values for OR genes and pseudogenes in human and chimpanzee. Values for polymorphic and fixed sites are plotted asunblackened and blackened bars, respectively.
for polymorphic sites, and an average Ka/Ks ratio of0.553 is observed for the fixed substitutions (fig. 1).
Human OR Genes
We repeated the same analyses for the human ORgenes, comparing them with the results of Frisse et al.(2001) for the 10 intergenic regions sequenced fromHausa individuals. The average nucleotide diversity isvery similar for the human OR pseudogenes (0.0010)and intergenic regions (0.0011) (Frisse et al. 2001). Incontrast, the nucleotide diversity for the human intactOR genes (mean 0.0005) (table 1) is significantly lowerthan for the OR pseudogenes or for the intergenic re-gions (by Mann-Whitney U test, P p .025 and P p .032for OR pseudogenes and intergenic regions, respec-tively).
Furthermore, a skew in the allelic frequency spectrumis observed for the human OR genes. The average Taji-ma’s D value is significantly lower than 0 for both theintact genes and the pseudogenes (by multiple-gene Dtest, and for intact genes and pseu-P p .016 P p .038dogenes, respectively) (see table 1), indicating an excessof rare alleles. In contrast, for the intergenic regions, theaverage Tajima’s D is slightly negative (�0.33) (Frisseet al. 2001) but not significantly different from 0.
The average Ka/Ks ratios for the human OR pseudo-genes are 0.787 for polymorphic sites and 0.763 for sitesfixed on the human lineage (fig. 1). These values are notsignificantly different from the neutral expectation of 1.In the intact human OR genes, the average Ka/Ks valuefor the polymorphic sites is 0.437, whereas the average
Ka/Ks value for substitutions on the human lineage is0.813 (fig. 1).
Inference about Selection by Using the PRF Model
We used a parametric analysis based on the PRF set-tings of Sawyer and Hartl (1992) and Bustamante etal. (2002) to estimate the direction and strength of se-lection acting on amino acid replacement mutations inOR genes. We use the MK tables to estimate the scaledselection coefficient ( ) of mutations in OR genes.2NsIn this model, the data are the numbers of silent seg-regating sites, replacement segregating sites, silent sub-stitutions, and replacement substitutions. The parame-ters that we estimate are two mutation rates (silent andreplacement), the species divergence time, and the selec-tion coefficient of replacement mutations in OR genes.The maximum-likelihood estimates of the four param-eters are found by setting the expected value of each cellentry in the MK table to its observed value and solvingthe set of equations (for full details, see Sawyer and Hartl1992).
Table 4 reports convergence and summary statisticsfor all parameters in the analysis, based on the retained100,000 draws. Figure 2 illustrates the marginal pos-terior distribution of the directional selection param-eter ( ) on amino acid replacement mutationsg p 2N se
for intact OR genes and pseudogenes in human andchimpanzee. For pseudogenes in both humans and chim-panzees, the posterior distributions of g have modes veryclose to 0. Furthermore, 95% of the MCMC draws forthe chimpanzee pseudogenes fall between g p �0.7949

Gilad et al.: Selection on OR Genes 495
Table 4
Convergence and Summary Statistics of the Marginal Posterior Distributions for the Parameters in the PRF Model across 10 MCMC Chainswith Overdispersed Starting Points
PARAMETER
CONVERGENCE
STATES
POSTERIOR
DISTRIBUTION QUANTILES
Sqrt (R) Rejection Rate Mean Variance SD 2.50% 25% 50% 75% 97.50%
t:Human 1.000039 .392 9.583 7.458 2.731 5.272 7.642 9.230 11.142 15.883Chimpanzee 1.000114 .476 7.521 4.159 2.039 4.257 6.066 7.283 8.700 12.208
r …a … 1.370 .309 .556 .593 .978 1.268 1.648 2.732g:
Intact genes:Human 1.000068 .355 .741 .752 .867 �.534 .151 .602 1.165 2.845Chimpanzee 1.000061 .515 .066 .272 .521 �.806 �.291 .016 .362 1.251
Pseudogenes:Human 1.000050 .536 .198 .288 .537 �.685 �.171 .141 .499 1.415Chimpanzee 1.000032 .477 .131 .316 .562 �.795 �.256 .071 .446 1.415:log q
Intact genes:Human 1.000025 …b �.791 .292 .540 �1.870 �1.151 �.781 �.421 .242Chimpanzee 1.000025 …b �.532 .159 .398 �1.329 �.795 �.529 �.262 .239
Pseudogenes:Human 1.000037 …b �.335 .173 .416 �1.161 �.612 �.335 �.054 .474Chimpanzee 1.000007 …b �.110 .206 .453 �1.009 �.414 �.108 .194 .772
a Not applicable, since r is estimated from human t value divided by chimpanzee t value.b Not applicable, since is sampled by Gibbs sampling.log q
and g p 1.4151, whereas, for humans, 95% of thedraws fall between g p �0.6848 and g p 1.4146.Thus, in concordance with expectation, amino acid re-placement mutations in pseudogenes seem to have littleeffect on fitness.
For intact OR genes, we find a difference betweenhumans and chimpanzees. In the chimpanzees, 95% ofthe MCMC draws for the selection parameter fall be-tween �0.8063 and 1.251, with a mean of 0.0665. Thisrepresents a good fit to a simple neutral model for thenumber of fixed amino acid replacements when com-pared to amino acid polymorphisms. In humans, themean of the MCMC draws is 0.7405, and !17.59% ofdraws are !0. Thus, there is strong indication that mostof the amino acid replacements were positively selectedon the human lineage.
This conclusion is bolstered by considering the jointdistribution of the strength of selection and a proxy forthe rate of deleterious amino acid replacement muta-tions. To quantify the rate of deleterious mutations, wedefine the ratio , which is comparableq p (v /L )/(v /L )r r s s
to the Ka/Ks ratio, except that and are the measuresv vr s
of the effective rate of nonsynonymous and synonymousmutations, which takes into account the effect of strongpurifying selection (since strongly deleterious mutationstend to be very short-lived in the population, they willnot be found segregating in the sample). In figure 3, wesummarize the joint distribution of g and as es-log q
timated from the MCMC scheme. For OR pseudogenes,
the data are explained relatively well by neutrality ofreplacement mutations and near 0 (i.e., by thelog q
equality of silent and replacement effective mutationrates). For the intact OR genes in chimpanzees, the dataare consistent with constraint at most amino acid sites( ) and neutrality of the replacement sites. Inlog q ! 0other words, most amino acid replacement mutationsare highly deleterious and will never be seen in a sample,consistent with our previous observations of an overalllow Ka/Ks ratio for intact OR genes in the chimpanzee(fig. 1); however, the few replacement mutations thathave fixed in the chimpanzee lineage were neutral mu-tations. In humans, in contrast, intact OR genes showa signal for relatively strong constraint at most aminoacid sites ( ), but replacement substitutions ap-log q K 0pear to have been driven to fixation by positive selection( ) (i.e., most amino acid replacement mutations areg 1 0highly deleterious, but replacement mutations that havefixed were favored).
Note that this approach allows one to gauge the effectthat uncertainty in correlated human and chimpanzeedemographic parameters has on the inference about se-lection. Figure 4 shows the joint distribution of thestrength of selection on human OR genes and the timesince the human-chimpanzee species split. There is alarge variance in the estimate of the time since the speciessplit (table 4), but it is clear that, the more recent thesplit, the stronger selection must be to account for theobserved number of fixed amino acid differences in the

496 Am. J. Hum. Genet. 73:489–501, 2003
Figure 2 Marginal posterior distribution of the directional selection parameter ( ) on amino acid replacement mutations. A,g p 2N seChimpanzee intact OR genes and pseudogenes. B, Human intact OR genes and pseudogenes.
OR genes. Estimates of t can be translated into real timeby assuming a value of and a number of years perNe
generation (e.g., and 25 years per gener-N p 10,000e
ation for the mode of t will give ∼5 million years).
Discussion
Rejection of the standard neutral model of a randomlymating population of constant size by tests of neutralitymay be due to a violation of any of the model assump-tions, not only to the action of natural selection. Thus,on the basis of a single gene or a class of genes, discrim-ination between selection- and demographic-based ex-planation is not always possible. For example, both di-rectional positive selection and population growth canresult in a relative excess of rare alleles in DNA sequenc-es. It is furthermore known that the standard neutralmodel is a too simple representation of population his-tory and thus is easily rejected. An alternative approach
attempts to circumvent these problems by using a largenumber of putatively neutral loci as an empirical ref-erence, to test empirically the fit of the null hypothesisof no selection.
Our approach follows that of Hamblin et al. (2002),who used intergenic regions as references to identify thenature of selection acting on the Duffy gene. In the pres-ent study, we compared three classes of DNA sequences:intergenic regions, pseudogenes, and putatively function-al genes. An attractive feature of this approach is that,by using multiple genes for each class, we gain moreaccurate estimates of the population parameters, becausethe evolutionary variance within each class is taken intoaccount.
Selection on Intact OR Genes
In both humans and the chimpanzees, variability ofOR pseudogenes is similar to that of the intergenic re-gions, whereas intact OR genes have significantly lower

Gilad et al.: Selection on OR Genes 497
Figure 3 The joint distribution of g and , as estimated from the MCMC scheme. A, Chimpanzee OR pseudogenes. B, Chimpanzeelog q
intact OR genes. C, Human OR pseudogenes. D, Human intact OR genes.
nucleotide diversity, suggesting the action of natural se-lection. However, the selection mechanisms responsiblefor the decreased variability of intact OR genes appearto differ between the two species.
In the chimpanzees, demographic models (e.g., pop-ulation growth [Tajima 1989a]) are highly unlikely toexplain the excess of rare alleles observed among intactgenes, since we do not detect such a deviation either inthe putatively neutral regions or in the OR pseudogenes.In contrast, purifying selection on the chimpanzee intactOR genes can explain the low nucleotide-diversity valuesfor intact genes, the low Ka/Ks values, and the excessof rare alleles. Consistent with this explanation, we findthat the nucleotide diversity in the chimpanzee intactOR genes is significantly lower ( ) for silent sitesP p .028( ) as compared with replacement sites0.0015 � 0.0013( ). Also, Tajima’s D value is more neg-0.0006 � 0.0009ative for replacement sites (�1.02) than for silent sites
(�0.46). The action of purifying selection on intact ORgenes is also consistent with the observation that chim-panzees maintained a larger functional OR gene reper-toire than did humans (Gilad et al. 2003).
In humans, the excess of fixed amino acid replace-ments relative to amino acid polymorphisms suggeststhat positive selection has driven a subset of amino acidalleles to fixation (fig. 1). Also in support of this hypothe-sis, variability is reduced in human intact OR genes, andthere is a relative excess of rare alleles throughout humanOR gene clusters for both intact OR genes and pseudo-genes. Since intact OR genes and pseudogenes are in-terspersed within the same OR gene clusters (with a typ-ical distance of 20–50 kb from each other), it is expectedthat a selective sweep acting on an intact OR gene willresult in a hitchhiking effect on neighboring pseudogenes(Maynard-Smith and Haigh 1974).
The action of positive selection on intact human OR

498 Am. J. Hum. Genet. 73:489–501, 2003
Figure 4 Joint distribution of the scaled selection coefficient ( ) that is associated with mutations in OR genes and species divergence2Nsparameters (in units of t).
genes is furthermore supported by the PRF-model analy-sis. The excess of amino acid replacements fixed betweenspecies relative to polymorphic replacements within spe-cies suggests that positive selection favored the fixationof replacement mutations. However, the Ka/Ks divergencevalues for the human intact OR genes are not 11, asexpected for genes under positive selection. Similarly, wedo not observe significant differences in nucleotide diver-sity ( and for silent0.0007 � 0.0006 0.0006 � 0.0004and replacement sites, respectively) or in Tajima’s D val-ues (�0.82 and �0.68 for silent and replacement sites,respectively) between silent and replacement sites in hu-man intact OR genes. This said, these tests for positiveselection are conservative when some sites are understrong evolutionary constraint. The advantage of the useof the MK tables (McDonald and Kreitman 1991) andthe PRF model is that it allows for purifying selection tobe taken into account by comparing the ratio of variablesilent to variable replacement sites within and betweenspecies. Using this method, we do find evidence for pos-itive selection acting on intact OR genes in humans, asindicated by an estimated positive mean of the selectioncoefficient.
One interpretation is that most of the OR protein isunder evolutionary constraint, whereas very few aminoacid changes to the receptor’s biding site are favored.Chemosensory ligand specificity appears to rest in a rel-atively small number of complementarity-determiningres-idues (Pilpel and Lancet 1999). Thus, a small number ofmutations could alter the receptor’s function and be ben-eficial, whereas most of the protein is under constraint.In this respect, it is worth pointing out that one cannotestimate the variability in selection coefficient among siteswithin the same gene in the PRF model (since only fourparameters can be estimated from the four data points).
One feature is unexpected under this model, however:variability is not reduced in the human OR pseudogenes,as expected from a model of repeated selective sweeps inan OR gene cluster where genes and pseudogenes areinterspersed (Stephan et al. 1992; Braverman et al. 1995).Furthermore, the high rate of gene disruption in the hu-man lineage (Gilad et al. 2003) suggests that most humanOR genes are evolving neutrally. These apparently con-tradictory observations may be reconciled by the existenceof different categories of intact OR genes, whereby onlyfew intact OR genes experience selective sweeps and, as

Gilad et al.: Selection on OR Genes 499
Figure 5 Three OR genes studied on human chromosome 11.Rectangles represent the OR coding regions along the chromosome.Indicated are P value of the H test, ; Tajima’s D value; and nu-P(H)cleotide diversity, p.
a result, the signature of a sweep in the combined sampleis not very strong. Previously, we suggested that, althoughmost human OR genes are under no evolutionary con-straint, a subset may still be evolving under purifyingselection (Gilad et al. 2003). This was motivated by theobservation of 9 of 50 OR genes that were intact in hu-mans and in four nonhuman primates (Gilad et al. 2003)and that thus seemed to be under considerable evolution-ary constraint in all primates. Our results here suggestthat there is an additional category of OR genes in thehuman genome: genes that were under positive selectionin the human lineage, perhaps in response to human-specific needs. In contrast to highly conserved genes (Giladet al. 2003), the category of OR genes that evolve underpositive selection in the human lineage is not easily iden-tified. Currently, we do not have independent support forthe action of positive selection on specific OR genes;hence, the existence of this category of OR genes can beinferred only from the observation of an overall signatureof positive selection on OR gene clusters in the humangenome.
A Possible Example of an OR Gene Clusterunder Selection
Of the 20 OR genes that were chosen at random forthe present study, 3 were found to be located within 125kb in an OR gene cluster on human chromosome 11(fig. 5). Interestingly, we observed a gradient in both thevariability and the Tajima’s D values of these three ORgenes (fig. 5), whereby the most telomeric of the threehad the lowest nucleotide-diversity value and the mostnegative D value. We calculated the H statistic (Fay andWu 2000) for these three genes. A negative H valueindicates an excess of high-frequency derived alleles ascompared with standard neutral expectations. Such adeviation from a neutral frequency spectrum is expectedimmediately following a selective sweep at a linked butnot directly adjacent site (Fay and Wu 2000; Przeworski2002). A significant excess of high-frequency derivedalleles is observed for the most telomeric of the threeOR genes in this cluster, and the H-test P values increasetoward the centromere (fig. 5). This suggests a target ofselection on the telomeric side of 51A6P (fig. 5). Sevenintact OR genes are mapped within 500 kb of 51A6P,and no non-OR gene is predicted within this genomicdistance. If the signal that we observed in this gene clus-ter is indeed the result of a selective sweep, then it isreasonable to assume that the target of selection was oneof the intact OR genes close to the three ORs that wesampled.
The Difference between Humans and Chimpanzees
A possible explanation for the lower constraint on ORgenes in humans as compared with chimpanzees is areduction in the efficiency of purifying selection as a
result of the smaller effective population size in humans.However, our results and previous reports indicate thatthe difference in population size between humans andchimpanzees is two- or threefold (Hacia 2001; Jensen-Seaman et al. 2001; Kaessmann et al. 2001). For thisdifference to explain our observation, the selection co-efficients associated with an OR gene must be within anarrow range in both species across a large fraction ofthe OR gene repertoire ( , where is the1 ! N s ! 3 Ne e
effective population size and s is the selection coeffi-cient), which seems unlikely. Therefore, we suggest thatit is the selection coefficient that has changed betweenother apes and humans for most OR genes, possiblyowing to a decreased reliance on the sense of smell inhumans relative to chimpanzees.
The Ka/Ks values for the human OR pseudogenes,although not significantly different than 1, are slightlylower. It can also be seen from figure 3 that amino acidreplacement mutations in the human pseudogene areunder slight constraint (the mode of the distribution isslightly negative). If a subset of the human OR pseudo-genes were, until recently, intact genes, this could explainthese observations.
We did not detect the action of positive selection onthe chimpanzee OR genes. One explanation is that thestrong purifying selection acting on the chimpanzee ORgenes makes it harder to detect the traces of positiveselection. Alternatively, more OR genes have evolvedunder positive selection in the human lineage than in thechimpanzees. This could be caused by the larger differ-ence in lifestyle between humans and apes than amongother primates. Some aspects of these differences couldhave led to novel human olfactory needs not shared withother primates. For example, humans are the only pri-mates who consume cooked food, with potentially wide-

500 Am. J. Hum. Genet. 73:489–501, 2003
spread effects on nutrition, ecology, and social relation-ships (Wrangham et al. 1999). This may have had astrong impact on the OR gene repertoire, since the senseof taste is largely a function of olfaction. Specifically,one might speculate that cooking leads to a reduced needto identify toxins in foods (since these would are de-natured by cooking).
Conclusion
The present study was designed to explore selectionin the largest gene family in mammalian genomes. Theuse of intergenic reference regions enabled us to identifydiversity patterns more likely to be due to natural selec-tion than to demography, and the PRF model allowedus to estimate the strength and direction of selectionacting on these regions. We find evidence for naturalselection acting on OR genes in both human and chim-panzee. The data are consistent with purifying selectionacting on intact OR genes in chimpanzee and positiveselection acting on at least some of the intact OR genesin humans. We suggest that, whereas most human ORgenes are under no or little evolutionary constraint,others have important functions shared with the apesand that a subset have evolved under positive selectionin humans. Further studies of specific OR gene clustersin humans may identify the selected changes and shedlight on what olfactory stimuli have exercised selectivepressures on the human OR gene repertoire.
Acknowledgments
We thank the Primate Foundation of Arizona and P. Morin,for the DNA sampled from 16 chimpanzees, and M. Prze-worski, for helpful discussions and comments on the manu-script. The experimental work was financed by the Bundes-ministerium fur Bildung und Forschung (grant 01KW9959-4)and by the Max Planck Gesellschaft. Y.G. is supported by aClore doctoral fellowship; C.D.B. is supported by a grant fromthe Cornell Genomics Initiative; and D.L. holds the Ralph andLois Silver Chair in Human Genomics and is supported by theCrown Human Genome Center at the Weizmann Institute ofScience.
Appendix A
Notation Used in the Present Article
: Effective human population size.2Ne
: Number of silent sites sampled.Ls
: Number of replacement sites sampled.Lr
r: Ratio of chimpanzee to human .N Ne e
: Fraction of amino acid replacement mutations thatf0
are not lethal.m: Per-site per-generation mutation rate.
: Neutral mutation rate at silent sites.v /2 p 2N mLs e s
: Effective mutation rate at replace-v /2 p 2N mL fr e r 0
ment sites.t: Number of human generations since human-chim-
panzee divergence.: Scaled selection coefficient on replacementg p 2N se
mutations.K[class, species, gene type]: Number of fixed differenc-
es of type “class” along the “species” branch of the classof genes “gene type.”
S[class, species, gene type]: Number of SNPs of type“class” in the population “species” in genes of the class“gene type.”
Electronic-Database Information
Accession numbers and URLs for data presented herein areas follows:
Entrez-Nucleotide, http://www.ncbi.nlm.nih.gov/entrez/query.fcgi?dbpNucleotide (for all OR gene sequences [accessionnumbers AY283941–AY284580] from individuals in the pres-ent study)
Human Olfactory Receptor Data Exploratorium, The, http://bioinformatics.weizmann.ac.il/HORDE/
References
Ben-Arie N, Lancet D, Taylor C, Khen M, Walker N, LedbetterDH, Carrozzo R, Patel K, Sheer D, Lehrach H, North MA(1994) Olfactory receptor gene cluster on human chromo-some 17: possible duplication of an ancestral receptor rep-ertoire. Hum Mol Genet 3:229–235
Braverman JM, Hudson RR, Kaplan NL, Langley CH, StephanW (1995) The hitchhiking effect on the site frequency spec-trum of DNA polymorphisms. Genetics 140:783–796
Buck L, Axel R (1991) A novel multigene family may encodeodorant receptors: a molecular basis for odor recognition.Cell 65:175–187
Bustamante CD, Nielsen R, Sawyer SA, Olsen KM, Purug-ganan MD, Hartl DL (2002) The cost of inbreeding inArabidopsis. Nature 416:531–534
Chen FC, Vallender EJ, Wang H, Tzeng CS, Li WH (2001) Ge-nomic divergence between human and chimpanzee estimatedfrom large-scale alignments of genomic sequences. J Hered92:481–489
Deinard A, Kidd K (1999) Evolution of a HOXB6 intergenicregion within the great apes and humans. J Hum Evol 36:687–703
Ebersberger I, Metzler D, Schwarz C, Paabo S (2002) Genome-wide comparison of DNA sequences between humans andchimpanzees. Am J Hum Genet 70:1490–1497
Ewens WJ (1978) Tay-Sachs disease and theoretical populationgenetics. Am J Hum Genet 30:328–329
Fay JC, Wu CI (2000) Hitchhiking under positive Darwinianselection. Genetics 155:1405–1413
Frisse L, Hudson RR, Bartoszewicz A, Wall JD, Donfack J, DiRienzo A (2001) Gene conversion and different populationhistories may explain the contrast between polymorphism

Gilad et al.: Selection on OR Genes 501
and linkage disequilibrium levels. Am J Hum Genet 69:831–843
Gilad Y, Lancet D (2003) Population differences in the humanfunctional olfactory repertoire. Mol Biol Evol 20:307–314
Gilad Y, Man O, Paabo S, Lancet D (2003) Human specificloss of olfactory receptor genes. Proc Natl Acad Sci USA100:3324–3327
Gilad Y, Segre D, Skorecki K, Nachman MW, Lancet D, SharonD (2000) Dichotomy of single-nucleotide polymorphism hap-lotypes in olfactory receptor genes and pseudogenes. Nat Ge-net 26:221–224
Glusman G, Yanai I, Rubin I, Lancet D (2001) The completehuman olfactory subgenome. Genome Res 11:685–702
Hacia JG (2001) Genome of the apes. Trends Genet 17:637–645Hamblin MT, Thompson EE, Di Rienzo A (2002) Complex
signatures of natural selection at the Duffy blood group lo-cus. Am J Hum Genet 70:369–383
Jensen-Seaman MI, Deinard AS, Kidd KK (2001) Modern Af-rican ape populations as genetic and demographic modelsof the last common ancestor of humans, chimpanzees, andgorillas. J Hered 92:475–480
Kaessmann H, Wiebe V, Weiss G, Paabo S (2001) Great apeDNA sequences reveal a reduced diversity and an expansionin humans. Nat Genet 27:155–156
Maynard-Smith JM, Haigh J (1974) The hitch-hiking effectof a favourable gene. Genet Res 23:23–35
McDonald JH, Kreitman M (1991) Adaptive protein evolutionat the Adh locus in Drosophila. Nature 351:652–654
Nei M, Li WH (1979) Mathematical model for studying ge-netic variation in terms of restriction endonucleases. ProcNatl Acad Sci USA 76:5269–5273
Pilpel Y, Lancet D (1999) The variable and conserved inter-faces of modeled olfactory receptor proteins. Protein Sci8:969–977
Przeworski M (2002) The signature of positive selection atrandomly chosen loci. Genetics 160:1179–1189
Rouquier S, Blancher A, Giorgi D (2000) The olfactory re-ceptor gene repertoire in primates and mouse: evidence forreduction of the functional fraction in primates. Proc NatlAcad Sci USA 97:2870–2874
Rouquier S, Friedman C, Delettre C, van den Engh G, BlancherA, Crouau-Roy B, Trask BJ, Giorgi D (1998) A gene recentlyinactivated in human defines a new olfactory receptor familyin mammals. Hum Mol Genet 7:1337–1345
Rozas J, Rozas R (1999) DnaSP version 3: an integrated pro-
gram for molecular population genetics and molecular evo-lution analysis. Bioinformatics 15:174–175
Sawyer SA, Hartl DL (1992) Population genetics of polymor-phism and divergence. Genetics 132:1161–1176
Sharon D, Glusman G, Pilpel Y, Khen M, Gruetzner F, Haaf T,Lancet D (1999) Primate evolution of an olfactory receptorcluster: diversification by gene conversion and recent emer-gence of pseudogenes. Genomics 61:24–36
Stephan W, Thomas HEW, Lenz MW (1992) The effect ofstrongly selected substitutions on neutral polymorphism: an-alytical results based on diffusion theory. Theor Popul Biol41:237–254
Stone AC, Griffiths RC, Zegura SL, Hammer MF (2002) Highlevels of Y-chromosome nucleotide diversity in the genusPan. Proc Natl Acad Sci USA 99:43–48
Tajima F (1989a) The effect of change in population size onDNA polymorphism. Genetics 123:597–601
——— (1989b) Statistical method for testing the neutralmutation hypothesis by DNA polymorphism. Genetics123:585–595
Trask BJ, Massa H, Brand-Arpon V, Chan K, Friedman C, Ngu-yen OT, Eichler E, van den Engh G, Rouquier S, Shizuya H,Giorgi D (1998) Large multi-chromosomal duplications en-compass many members of the olfactory receptor gene fam-ily in the human genome. Hum Mol Genet 7:2007–2020
Wall JD (1999) Recombination and the power of statisticaltests of neutrality. Genet Res 74:65–79
Wall JD, Hudson RR (2001) Coalescent simulations and sta-tistical tests of neutrality. Mol Biol Evol 18:1134–1135
Watterson GA (1975) On the number of segregating sites ingenetical models without recombination. Theor Popul Biol7:256–276
Wrangham RW, Jones JH, Laden G, Pilbeam D, Conklin-BrittainN (1999) The raw and the stolen: cooking and the ecologyof human origins. Curr Anthropol 40:567–594
Yang Z (1997) PAML: a program package for phylogeneticanalysis by maximum likelihood. Comput Appl Biosci 13:555–556
Young JM, Friedman C, Williams EM, Ross JA, Tonnes-PriddyL, Trask BJ (2002) Different evolutionary processes shapedthe mouse and human olfactory receptor gene families. HumMol Genet 11:535–546
Zhang X, Firestein S (2002) The olfactory receptor gene super-family of the mouse. Nat Neurosci 5:124–133
Zozulya S, Echeverri F, Nguyen T (2001) The human olfactoryreceptor repertoire. Genome Biol 2:research0018