Natural resource consumption caused by Finnish households · Natural resource consumption caused by...
15
Proceedings of the Nordic Consumer Policy Research Conference 2007 Natural resource consumption caused by Finnish households Satu Lähteenoja, Michael Lettenmeier, Tommi Kauppinen, Karoliina Luoto, Tiina Moisio, Marja Salo, Petro Tamminen & Sini Veuro Finnish Association for Nature Conservation FIN-MIPS Household Research Project Kotkankatu 9 FIN-00510 Helsinki Finland [email protected], [email protected], [email protected], [email protected], [email protected], [email protected], [email protected], [email protected] Abstract The article is based on the results of the first phase of a research project on the natural resource consumption of households. The MIPS concept (material input per service unit) was chosen to assess the relevance of different activities and products of private households. The study covers the most common foods and drinks, ways of constructing houses, modes of transport, forms of sports, tourism and other leisure activities, as well as goods and appliances owned by households. The natural resource consumption caused by an average Finnish household is assessed for different activities and products. Food, transport and construction form relevant areas of the material input (MI) caused by private households. With sports, tourism and leisure activities, the contribution of transport, especially of private car traffic, in the resource consumption is appreciable. The most relevant goods in terms of household consumption are electronic appliances and jewellery. 1. Introduction Household consumption has grown and changed its form in the past few decades. Income is growing from year to year alongside the GDP over the whole of Europe, and we have more and more to consume. Household consumption expenditure in the EU-15 increased by almost one third per person between 1990 and 2002. At the same time households are becoming smaller and are tending to use more energy and water, in addition to generating more waste per person (EEA, 2005). If sustainability is to become a reality, a tremendous increase in resource efficiency is required. One target for sustainable production and consumption has been the reduction of material flows in the industrialised countries by a factor of 10 up to the middle of this century. This would allow a worldwide cut in material flows by half, while doubling worldwide prosperity, i.e. it would lead to an increase in worldwide resource productivity by a factor of four (Schmidt-Bleek, 1993; Schmidt- Bleek, 1998; von Weizsäcker, Lovins & Lovins, 1997). Meadows et al. (2003) propose, amongst other means, an increase in eco-efficiency by 4 % p.a. in order to achieve sustainability. This corresponds to a factor 8 increase in resource productivity. Household consumption has an appreciable impact on the environment. According to a calculation on the Finnish national TMR (Total Material Requirement), approximately 20% of the Finnish
Transcript of Natural resource consumption caused by Finnish households · Natural resource consumption caused by...

Proceedings of the Nordic Consumer Policy Research Conference 2007
Natural resource consumption caused by Finnish households Satu Lähteenoja, Michael Lettenmeier, Tommi Kauppinen, Karoliina Luoto, Tiina Moisio, Marja Salo, Petro Tamminen & Sini Veuro Finnish Association for Nature Conservation FIN-MIPS Household Research Project Kotkankatu 9 FIN-00510 Helsinki Finland [email protected], [email protected], [email protected], [email protected], [email protected], [email protected], [email protected], [email protected] Abstract The article is based on the results of the first phase of a research project on the natural resource consumption of households. The MIPS concept (material input per service unit) was chosen to assess the relevance of different activities and products of private households. The study covers the most common foods and drinks, ways of constructing houses, modes of transport, forms of sports, tourism and other leisure activities, as well as goods and appliances owned by households. The natural resource consumption caused by an average Finnish household is assessed for different activities and products. Food, transport and construction form relevant areas of the material input (MI) caused by private households. With sports, tourism and leisure activities, the contribution of transport, especially of private car traffic, in the resource consumption is appreciable. The most relevant goods in terms of household consumption are electronic appliances and jewellery. 1. Introduction Household consumption has grown and changed its form in the past few decades. Income is growing from year to year alongside the GDP over the whole of Europe, and we have more and more to consume. Household consumption expenditure in the EU-15 increased by almost one third per person between 1990 and 2002. At the same time households are becoming smaller and are tending to use more energy and water, in addition to generating more waste per person (EEA, 2005). If sustainability is to become a reality, a tremendous increase in resource efficiency is required. One target for sustainable production and consumption has been the reduction of material flows in the industrialised countries by a factor of 10 up to the middle of this century. This would allow a worldwide cut in material flows by half, while doubling worldwide prosperity, i.e. it would lead to an increase in worldwide resource productivity by a factor of four (Schmidt-Bleek, 1993; Schmidt-Bleek, 1998; von Weizsäcker, Lovins & Lovins, 1997). Meadows et al. (2003) propose, amongst other means, an increase in eco-efficiency by 4 % p.a. in order to achieve sustainability. This corresponds to a factor 8 increase in resource productivity. Household consumption has an appreciable impact on the environment. According to a calculation on the Finnish national TMR (Total Material Requirement), approximately 20% of the Finnish

Proceedings of the Nordic Consumer Policy Research Conference 2007
2
TMR is directly attributable to private households (Mäenpää, 2004). The indirect impact of household consumption in the TMR is much greater as almost all of the consumption can be indirectly connected to private consumption. In order to steer household consumption patterns towards sustainability, it is crucial to measure the magnitude of consumption and to identify the most relevant consumption. 2. Materials and methods 2.1. Background and system boundaries The Finnish Association for Nature Conservation is conducting a research project called FIN-MIPS Household – Promoting Sustainable Consumption in 2006-2008. The purpose of the project is to test the application of the MIPS concept for increasing the sustainability of private households. In the first stage of the research, material input data relevant to households has been gathered and new data generated. In the second stage, the material input data produced will be applied to approximately 30 Finnish households to develop options for the dematerialisation of household activities. This article presents some key findings of the first stage of the research.
According to the OECD definition, household consumption is the consumption of goods and services by households. It includes the selection, purchase, use, maintenance, repair and disposal of any product or service, but it does not include consumption by the public sector or intermediate consumption of products and services in the productive sector (OECD, 2002). However, the consumption by the public sector can still be indirectly appended to household consumption. 2.2. The application of the MIPS indicator in this study The promotion of sustainability requires appropriate indicators. Changes in production and consumption patterns must be measurable, e.g. in relation to the Factor 10 target. In 1992, the Wuppertal Institute for Climate, Energy and Environment proposed the amount of natural resources used to provide a certain benefit (Material Input Per Service unit, MIPS or MI/S) as a basic measure for assessing and comparing the ecological pressure caused by products and services. MIPS constitutes a tool for assessing and systematically reducing the resource consumption of products or activities. The basis of the MIPS values are the ecological rucksacks calculated for different goods or commodities. The ecological rucksack is the sum of natural resources moved away from their original place in the ecosphere during the entire life cycle of a certain raw material, product or activity, including indirect resource use as well. (Ritthoff et al., 2002.) The MIPS approach concentrates on the material input of products and activities. It differs from a life cycle assessment (LCA) in not providing detailed results on certain emissions and other output factors. However, the use of the MIPS concept is less time and cost intensive than the use of, for instance, LCA. In addition, the MIPS concept can easily be communicated to a non-expert. Kilograms and tonnes of resources are understandable concepts for guiding consumer decisions, as well as product development and macro-economic considerations. The wide potential for the application of the MIPS concept (product, service, household, company, municipality, region, national and global economy) promotes the understanding of the links between local activities and global sustainability.

Proceedings of the Nordic Consumer Policy Research Conference 2007
3
The service unit of MIPS must be defined separately in every study. By choosing the same service unit it is possible to compare different products or consumption areas with each other. In this study, the service unit is the consumption of one person in one year. Another choice would have been counting the MI values not just for one consumer but for the whole household. This would, however, complicate the comparison between consumers living in households of different sizes. The MIPS concept divides the natural resources used into five different categories, i.e. abiotic resources, biotic resources, water, air, and soil movement in agriculture and forestry (mainly erosion). In this paper, the term natural resources refers to the sum of abiotic and biotic raw materials as well as to top soil lost because of erosion. The consumption of water and air is beyond the focus of this paper. The study is based on MI and MIPS data gathered and produced in the FIN-MIPS Household project. A lot of existing MIPS data from different countries was gathered in a pre-study on existing material input and MIPS data (Lähteenoja et al., 2007). The project is producing six master’s theses on the material input of different consumption sectors. The material for the calculations presented in the paper is based on these studies. 3. Natural resource consumption of an average Finnish consumer This study focuses on the average Finnish consumer. The natural resource consumption is measured for one person for one year. The profile of the average household or consumer is mainly based on official statistics by Statistics Finland (2006). The average household size in Finland is 2.1 persons. Thus, the subject of the calculations in this study is a couple without children. The natural resource consumption of the apartment and its goods and appliances is divided by two in order to calculate the consumption of one person. The resource consumption of a household is divided into six fields: housing, eating and drinking, transport, leisure time activities, tourism, and household goods and devices. Each category will be presented before comparing and summarising them. The division of the total household consumption is based on previous studies concerning the importance of difference consumption fields (e.g. Michaelis & Lorek, 2004). 3.1. Housing The consumption area of housing includes construction, renovations and energy consumption by houses. The construction and use of the house are studied separately. Construction also includes built yard areas. The MI calculations of construction were conducted with a bottom-up method that gives minimum values of the resource consumption, although every small construction part is not included (Nässén et al., 2007). By calculating MI-values for different construction parts such as foundations, different wall and roof materials, etc., it is possible to model the most typical building types and variants of them. The useful life of the buildings has been assumed to be 50 years. Natural resource consumption for renovation is out of focus because the renovation materials, such as paint or window frames, during a life span of 50 years were not considered especially relevant in terms of total natural resource consumption. The average Finnish consumer lives in a block of flats built before the 1970s. The block is made of concrete and located in a town. The average living space per person is 38 m2. The average yearly

Proceedings of the Nordic Consumer Policy Research Conference 2007
4
electricity consumption of the household is 2,000 kWh. The apartment is heated by district heating, which consumes 210 kWh per square metre per year on average (Motiva, 2007). The average water consumption is 155 litres per person per day. This is roughly divisible as follows:
- 39 % (60 l) personal hygiene - 26 % (40 l) toilet flushing - 13 % (20 l) laundry - 22% (35 l) kitchen
Approximately 45 % of the water consumed is warm. Thus, heating the water requires approximately 1500 kWh per person p.a. The average resource consumption of housing is shown in figure 1.
Natural resource consumption of housing
(kg/person/year)
5,609
530
3,910
1,289 Building
Electricity
Heating
Warm and coldwater
Figure 1. Natural resource consumption of an average flat (per person per year) 3.2. Food and drinks Finnish people eat considerable amounts of meat (Statistics Finland, 2006). The average direct use of food products per person in 2005 is shown in figure 2.

Proceedings of the Nordic Consumer Policy Research Conference 2007
5
The use of food products (total 840 kg/person/year)
17 %
26 %
10 %
19 %
8 %
14 %
1 %1 %
4 %
grain and potatoes
milk products
meat and fish
eggs
margarine and oil
sugar
fruits and vegetables (incl. juices)
soft drinks
alcohol and coffee
Fig. 2. Food consumption in Finland in 2005 (Statistics Finland, 2006). In this study, only data for foodstuffs grown in Finland has been used for the calculation of the material input of foodstuff. The calculation of MI values for foodstuffs grown abroad was not possible within the resources of the FIN-MIPS Household project. In addition, the focus is on a general level as MI-calculations were conducted only on groups of food and drink products such as milk products. Based on these calculations and assumptions, the distribution of the material input of different foodstuff groups is given in Fig. 3.
Material input of food products (total 6,000 kg/person/year)
6 %
30 %
32 %
13 %
1 %8 %
3 %
5 %
2 %
grain and potatoes
milk products
meat and fish
eggs
margarine and oil
sugar
fruits and vegetables (incl. juices)
soft drinks
alcohol and coffee
Fig. 3. Distribution of the natural resource consumption of foodstuffs consumed in Finland.

Proceedings of the Nordic Consumer Policy Research Conference 2007
6
When comparing the distribution of the food products consumed (fig. 2) to the distribution of the material input of the food products consumed (fig. 3), the relevance of animal-based food, especially meat, is obvious. Animal-based foodstuffs in general (incl. milk) make up 36 % of the foodstuffs consumed, but their share of resource consumption is 51 %. Only 8 % of the foodstuffs consumed comprise meat, whereas the share of meat in the resource consumption of foodstuffs is 32 %. Animal-based food, especially meat, thus dominates the resource consumption caused by the average nutrition in Finland. 3.3. Transport The National Travel Survey provides an overall picture of Finnish passenger mobility and its background, as well as demographic, geographic and temporal variations in mobility (NTS, 2007). According to the survey, the total domestic travel distance per day is 42 km, out of which 4 km are business trips and thus allocated to work, whereas the rest is allocated to the household as private trips. The average travel distance of a domestic trip is 15 km. Most of the trips are made by car. Buses are the most common form of public transport. Holiday trips abroad are not included in the National Travel Survey. Due to calculations based on national statistics (Statistics Finland, 2006), their average distance per person is approximately 2,000 kilometres a year, which equals 5.5 km per day. The average Finn consumes 17 tonnes of natural resources in domestic transport. Travelling by car consumes five times more natural resources than travelling the same distance by bus. The share of different transport modes in total consumption is shown in fig. 4.
Natural resorce consumption of transport,
kg/person/year
16,064
264
646 243
private car (11,200 km)
public transport (2,000 km)
non-motorised transport (700 km)
plane and ferry (2,000 km)
Fig 4. Average natural resource consumption per person per year, by different transport modes.

Proceedings of the Nordic Consumer Policy Research Conference 2007
7
3.4. Leisure time An average Finn has 6.5 hours of leisure time every day. The real amount of leisure time and the use of it differs a lot. According to Liikanen et al. (2005), for example, television is watched 3 hours per day on average. Reading and listening to the radio are also very popular. Thus, daily leisure time could be divided up as follows:
- 3 hours per day for watching television - 0.5 hour per day for sports or other activities outside the home - 2.5 hours per day for daily routines, reading and listening to the radio.
The natural resource consumption of different activities has been calculated with the service unit of one hour of activity. This was done because otherwise comparing different activities would have been very difficult. As assumed and seen in table X, there are great differences between activities. With the assumptions presented above, the average person consumes approximately 2 tonnes of natural resources per year in leisure time activities. Transport and tourism is excluded from this estimation. Table 1. The natural resource consumption of some leisure time activities (kg/ person/ hour).
Hobby kg/hour Jogging on a jogging track 1 Roller skating 1 Swimming in a swimming hall 11 Ice hockey (indoor) 7 Going to a health club 6 Soccer on artificial grass (not heated) 6 Playing piano 4 Theatre visit 13 Boat rowing from a natural shore 0,7 Boating with a motorised aluminium deck boat from a harbour
70
Watching TV at home 1 Average transport to hobbies kg/trip 15 km by private car 22 15 km by bus 5
3.5. Goods and appliances In every household there are thousands of different goods and appliances. There have been only a few publications on the amount of goods in households. For the FIN-MIPS Household project, the 6,186 objects in a one-room flat listed by Liusvaara (1996) were used for a preliminary estimation of the material input and relevance of different product groups.
Proceedings of the Nordic Consumer Policy Research Conference 2007
8
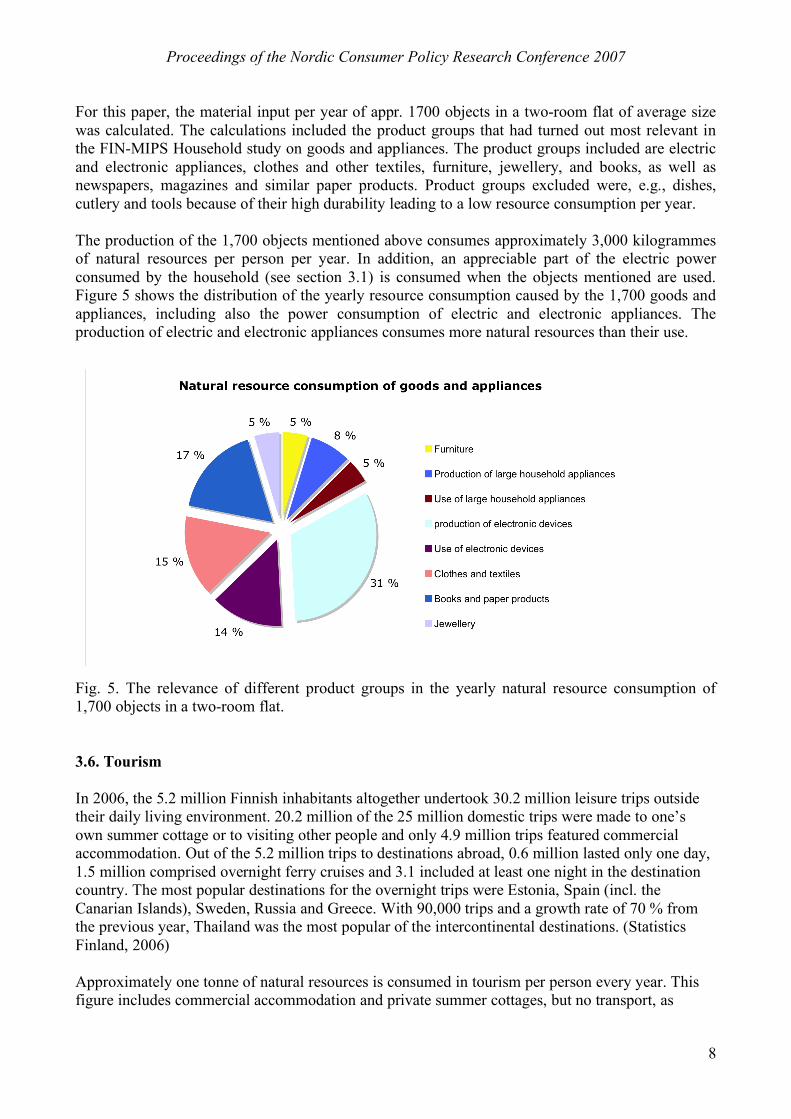
For this paper, the material input per year of appr. 1700 objects in a two-room flat of average size was calculated. The calculations included the product groups that had turned out most relevant in the FIN-MIPS Household study on goods and appliances. The product groups included are electric and electronic appliances, clothes and other textiles, furniture, jewellery, and books, as well as newspapers, magazines and similar paper products. Product groups excluded were, e.g., dishes, cutlery and tools because of their high durability leading to a low resource consumption per year. The production of the 1,700 objects mentioned above consumes approximately 3,000 kilogrammes of natural resources per person per year. In addition, an appreciable part of the electric power consumed by the household (see section 3.1) is consumed when the objects mentioned are used. Figure 5 shows the distribution of the yearly resource consumption caused by the 1,700 goods and appliances, including also the power consumption of electric and electronic appliances. The production of electric and electronic appliances consumes more natural resources than their use.
Fig. 5. The relevance of different product groups in the yearly natural resource consumption of 1,700 objects in a two-room flat. 3.6. Tourism In 2006, the 5.2 million Finnish inhabitants altogether undertook 30.2 million leisure trips outside their daily living environment. 20.2 million of the 25 million domestic trips were made to one’s own summer cottage or to visiting other people and only 4.9 million trips featured commercial accommodation. Out of the 5.2 million trips to destinations abroad, 0.6 million lasted only one day, 1.5 million comprised overnight ferry cruises and 3.1 included at least one night in the destination country. The most popular destinations for the overnight trips were Estonia, Spain (incl. the Canarian Islands), Sweden, Russia and Greece. With 90,000 trips and a growth rate of 70 % from the previous year, Thailand was the most popular of the intercontinental destinations. (Statistics Finland, 2006) Approximately one tonne of natural resources is consumed in tourism per person every year. This figure includes commercial accommodation and private summer cottages, but no transport, as

Proceedings of the Nordic Consumer Policy Research Conference 2007
9
transport is included in the figures for traffic (see section 3.3). Approximately half of these natural resources are accounted for in private summer cottages and the rest in accommodation in hotels and rental cottages. More than half of the Finnish population spends time in summer cottages. On average, 72 days per year are spent in cottages (Nieminen, 2004). An average cottage has 47 m2 of living space. The following table compares two different kinds of cottages. Both cottages are made of wood. The one is small and simple with only a little electric power used during the year. This is a traditional type of summer cottage, still representing most of the Finnish cottages, but with a declining trend. The second one is as big and well equipped as new detached houses for single families. The number of summer houses of the second kind is increasing rapidly. (Statistics Finland, 2005.) On average, two people stay at the cottage at the same time. The natural resource consumption of cottage use is calculated for one person in one year, which means that the MI figures of a cottage are divided by two. Table 2. Natural resource consumption (kg/person/year) of two types of holiday apartments, each of them used by two persons. Simple cottage (29 m2) Well-equipped cottage (140 m2) Building 1,902 4,944 Electricity 411 2,380 Firewood 963 963 Furniture and devices 341 501 Other 48 141 Total 3,666 8,929
The average distance to the holiday appartment is 214 km (total for both ways). When travelling this distance by private car, the natural resource consumption per person per year is 2,600 kg, and by bus 822 kg. 4. Total natural resource consumption of an average consumer 4.1. The relevance of different consumption areas With the system boundaries used in this study, the ecological rucksack of an average Finn is 40 tonnes every year. This corresponds to a full trailer lorry of natural resources consumed every year by each inhabitant. The following figure presents the distribution of the natural resource use in different consumption areas.

Proceedings of the Nordic Consumer Policy Research Conference 2007
10
The natural resource consumption (TMR) of an average Finnish consumer
(kg/person/year)
17,217
11,338
5,909
2,8832,000
987
0
2,000
4,000
6,000
8,000
10,000
12,000
14,000
16,000
18,000
20,000
Transport Housing Food Goods and
appliances
Hobbies and free
time
Accomodation on
leisure trips
Fig 6. The importance of different consumption areas in the total natural resource consumption of an average Finnish consumer. Personal transport contributes the biggest share in the natural resource consumption of an average Finnish household. Housing and nutrition are the following fields of relevance. Transport and housing also contain resources that are linked to the other fields of consumption. Part of the resource consumption of transport could also be shifted to the fields of food (purchasing trips), leisure and tourism. However, transport is treated in this paper as a field of consumption in its own right because the decisions of consumers and policy-makers tend to influence the choice of the amount and mode of transport independently from the purpose and overall motivation of the trips. Similarly, most of the natural resources consumed by electric power in the household are related to the use of appliances and the storage and preparation of food. In the case of electric power, decisions on the quality or origin of electricity are not related to the appliances using power. In contrast to this, decisions on energy efficiency, i.e. the amount of electricity consumed, are linked to the amount and performance of the devices using power. In this paper, power consumption in the household is completely calculated in the field of housing. This also prevents double counting of power consumption under two different areas. 4.2. Comparison to other studies The table below compares the amount and distribution of natural resource consumption between different consumption areas according to three different studies. In addition to the FIN-MIPS Household study, the results of two different studies by Mäenpää are presented. Mäenpää et al. (2000) compared the relevance of different household consumption areas on the basis of household consumption expenditure. Mäenpää’s (2004) results are based on physical input-output tables for various sectors of the economy. To allow their presentation in the same table 3, the consumption sectors of Mäenpää’s studies were related to the consumption sectors used in this study in the most appropriate way. Despite this, they do not entirely correspond to the consumption sectors presented in this paper.

Proceedings of the Nordic Consumer Policy Research Conference 2007
11
Table 3: Comparison of the TMR of different household consumption areas according to three different studies.
TMR FIN-MIPS Household TMR Mäenpää 2000 TMR Mäenpää 2004
Building 5,609 14 % 2,167 14 % 3,695 27 %
Energy consumption 5,729 14 % 2,554 17 % 2,171 16 %
Transport 17,217 43 % 1,166 8 % 1,774 13 %
Nutrition 5,909 15 % 5,377 36 % 2,234 16 %
Goods and appliances 2,883 7 % 1,709 11 % 1,506 11 %
Leisure time activities 2,000 5 % 1,132 7 % 1,500 11 %
Tourism: accomodation 987 2 % 986 7 % 710 5 %
Sum 40,335 100 % 15,090 100 % 13,590 100 %
Excluded: "miscellanous goods and services" 578 5,593 The total resource consumption in Mäenpää’s studies is less than half in comparison to the FIN-MIPS Household study, even if the category ”miscellanous goods and services”, not defined in detail in Mäenpää (2004), were to be included in the sum. The fields of transport, housing and nutrition are the ones contributing the biggest share of natural resource consumption in all three studies (except transport in Mäenpää et al. 2000), but they differ visibly from each other in terms of absolute values, relative share and order. One basic reason for the huge difference in total resource consumption is that transport infrastructure is excluded from Mäenpää’s studies. According to Lähteenoja et al. (2006), 92 % of the abiotic material input of the Finnish transport system is attributable to infrastructure like roads, railways and airports. Thus, the results of Mäenpää’s studies might be roughly doubled and transport become the most important field of consumption in all three studies, if transport infrastructure were to be included in the figures. Housing is an important field of consumption in all three studies. The absolute value for the resource consumption of housing in the FIN-MIPS Household study is about twice as high as in Mäenpää’s studies. One reason for this is that in micro or bottom-up approaches like FIN-MIPS Household more factors and aspects are covered than in aggregated MFA studies on a national or sectoral level. Nutrition plays an important role in all three studies, but its relevance and absolute values vary among the studies. The absolute amounts of resources consumed for foodstuff production are quite close to each other in FIN-MIPS Household and Mäenpää et al. (2000), whereas they are only half of these values according to Mäenpää (2004). One reason for this is that in the approach adopted by Mäenpää (2004) biotic resource consumption is not completely covered in the food category. For the fields of household goods and appliances, leisure time activities and tourism, there are some similarities between the studies in terms of relevance, absolute values and/or share in total consumption. However, these areas contain clear differences concerning the items included in each field of consumption. For instance, the area of telecommunication in Mäenpää’s studies is wholly included in the field of household goods and appliances of Table 3 although it may contain infrastructure outside households that is not included in the FIN-MIPS Household study.

Proceedings of the Nordic Consumer Policy Research Conference 2007
12
In general, one can state that the more detailed and also otherwise differing focus and approach in the FIN-MIPS Household study is a main reason for the differences in the results of the studies compared in Table 3. Despite this, there are also similarities in the results of the three studies. 4.3. How to decrease natural resource consumption of households? By measuring the MI values of a household it is possible to obtain a realistic picture of what is relevant and what is not. This is needed when considering ways of dematerialising households. Transport seems to be the most material-intensive activity of an average household. This may partly occur because the material intensity of transport has been studied much more intensively than food, for example. This would only mean that the material input of food is higher than in this study. In any case, the high share of constructed infrastructure in the values of transport and also housing (construction) increases their resource consumption in comparison to foodstuffs, as the built infrastructure is highly material-intensive in terms of abiotic natural resources. The transport of an average Finnish inhabitant consumes approximately 17 tonnes of natural resources. Part of this consumption could also be allocated to other consumption areas such as hobbies, tourism and also food and drinks. In terms of the total material requirement of leisure activities and tourism, transport plays an important role. For the most popular Finnish leisure and sport activities, transport easily corresponds to more than one half of the resource consumption. In the case of tourism transport is important, too, but the material consumption of hotels can in certain cases exceed the transport-related material input. For this paper, a mix of options for visibly decreasing the natural resource consumption of households was applied to the resource consumption of an average Finnish inhabitant. The results are given in Table 4. Table 4: Options for and effect of decreasing natural resource consumption of an average Finn
Option Change in resource consumption, p.cap. p.a.
Living space from 38 to 25 square metres p. cap. – 1,900 kg
Decrease of average room temperature by 2 degrees – 1,850 kg
Decrease of warm water consumption by 20 % (14 l) – 205 kg
Purchasing second hand furniture – 160 kg
Switching to vegetarian diet – 1,600 kg
Trips to work by bus instead of private car – 3,000 kg
Shopping and similar trips by bike instead of car – 2,200 kg
Combination of all options – 10,915 kg

Proceedings of the Nordic Consumer Policy Research Conference 2007
13
Relative change in total resource consumption – 27 %
With transport, housing and food being the most relevant fields of natural resource consumption by households, the options for reducing resource consumption are also the most promising in these fields. In the transport sector, the most relevant option for decreasing resource consumption is to reduce the amount of kilometres travelled every day and every year, especially by private car. This applies also to the fields of leisure activities and tourism. Energy consumption during the use phase is about equal to construction in terms of resource consumption from housing, but may be the easier or quicker way to achieve changes. With regard to construction, the most material-intensive aspects of houses are footings and foundations, the outer walls, and yard ditching and green areas. Cellars increase the resource consumption of houses. Wooden house construction saves resources in terms of wall structures, as well as by allowing lighter foundations and footings to be used. In the food and drinks sector, the contribution of animal-based food to the total material consumption is appreciable. Thus, the best option for reducing natural resource use is to reduce the consumption of animal-based foodstuffs, especially meat. In addition, transport distances, as well as appropriate growing conditions, areas and seasons may be of relevance. Packaging is usually of minor importance. With the goods and appliances owned by households, the material input during the production phase is usually more relevant than the material input for the energy consumption during the use phase. This applies to electric and electronic equipment, as well as to textiles, but may be a typical Finnish feature because of the relatively low material-intensity of average Finnish electricity. Although its use does not consume additional resources, jewellery plays a visible role in terms of abiotic material input due to the high resource intensity of gold and silver. By realising the options mentioned in Table 4, one can reduce the average natural resource consumption by more than a quarter. This constitutes a considerable reduction. However, for achieving targets like factor 10 (see section 1.1), changes are required that go beyond the decision-making options of the consumers themselves. This means that changes must also be envisaged in social structures and the supply structures consumers are facing. 5. Discussion and conclusions 5.1. Total natural resource consumption - a new aspect for the sustainability discussion Households are one of the major actors when striving for sustainability: it is the consumers who make the final choice of the goods and services consumed, although this choice is influenced by many external factors. Applying the MIPS methodology to consumer politics brings a new perspective to the discussion on the environmental impacts and sustainability of private consumption. In particular the TMR (Total Material Requirement, i.e. abiotic and biotic resources, as well as erosion) aspect enlarges the traditional environmental viewpoint by bringing out, for instance, the relevance of construction. Another strongpoint of the MIPS method is its simplicity: products and services differing from each other can be made comparable on the basis of kilograms of resources.

Proceedings of the Nordic Consumer Policy Research Conference 2007
14
The MIPS concept also broadens the more traditional focus on production and products towards structural aspects like infrastructure, housing space and car use. If eco-efficient solutions covering these structural aspects were found, the influence on promoting sustainability could be expected to be much broader than with traditional approaches. In this respect, the consideration of natural resource use in terms of sustainable consumption seems worthwhile. Sufficiency and moderation are other aspects arising when considering resource use within the framework of sustainable consumption. These aspects look even more challenging in terms of business, but if they were developed, the solutions might turn out to be even more effective. Furthermore, eco-efficiency on the basis of the MIPS concept can question the presently used concepts of efficiency, which often concentrate on increasing the role of infrastructure and technology. 5.2. Method for households to measure their own consumption One aim of the research is to allow any household to calculate its own natural resource consumption. In order to form an idea of the differences in household consumption, as well as to test the attitudes towards the new aspect on sustainability, 27 households will monitor their consumption with the material conducted in the research project. The households participating vary in terms of age, size and living environment. When the consumption has been monitored, the natural resource consumption or "ecological rucksacks" of participating households will be measured. By comparing the results of the participating households to each other and to the average Finnish consumer, the households will have a clue to their consumption level. The results will be further analysed together with the households in order to discuss and process their ideas of the possibilities for decreasing natural resource consumption. On the basis of these discussions and the results, a handbook on measuring and dematerialising household consumption, and possibly a web tool for this, will be developed. 5.3. From science to politics The options for dematerialising household consumption presented in table 4 show that even a 25 % reduction in natural resource use by private households would require measures only strongly committed households might undertake, at least so far. In order to achieve dematerialisation on a broad basis, efforts have to be made on different levels and by different actors, viz. consumers, infrastructure and municipal planners, infrastructure administration, producers of equipment, providers of services, and last but not least local and national political decision-makers. 6. References EEA (2005). Household consumption and the environment. EEA Report No 11/2005. Copenhagen:
European Environmental Agency.

Proceedings of the Nordic Consumer Policy Research Conference 2007
15
Lähteenoja, S., Lettenmeier, M., Kauppinen, T., Luoto, K., Moisio, T., Salo, M., Tamminen, P., & Veuro, S. (2007). FIN-MIPS Household - A prestudy on existing MI(PS) data related to household consumption. Draft 7.6.2007. Helsinki: Finnish Association for Nature Conservation.
Lähteenoja, S., Lettenmeier, M., & Saari, A. (2006). Liikenne MIPS – Suomen liikennejärjestelmän luonnonvarojen kulutus [Transport MIPS – Natural resource consumption of the Finnish transport system]. The Finnish Environment 820. Helsinki: Ministry of the Environment. English pdf-version coming in September 2007, www.ymparisto.fi.
Liikanen, M. & Hanifi, R. & Hannula, U. (toim.). (2005). Yksilöllisiä valintoja, kultturien pysyvyyttä. Vapaa-ajan muutokset 1981-2002. [Personal choices, permanent cultures. Changes in leisure time 1981-2002.] Helsinki: Statistics Finland, Edita Prima Oy.
Liusvaara, O. (1996). 6168 esinettä = kotini. [My home is 6168 objects. Bachelor thesis, Lahti University of Applied Science.] Lahti: Lahden ammattikorkeakoulun taideinstituutin opinnäytetyö.
Mäenpää, I. (2004). Kulutuksen ympäristökuormitus. [Environmental burden of consumption]. Oulu: Oulu University, Thule institute.
Mäenpää, I., Juutinen, A., Puustinen, K., Rintala, J., Risku-Norja, H., Veijalainen, S., & Viitanen, M. (2000). Luonnonvarojen kokonaiskäyttö Suomessa. [Natural resource use of Finland.] Suomen ympäristö 428. Helsinki: Ministry of the Environment.
Meadows, D., Randers, J. & Meadows, D. (2004). Limits to Growth. The 30 Years Update. White River Junction: Chelsea Green Publishing Company.
Michaelis, L., & Lorek, S. (2004). Consumption and the environment in Europe – trends and futures., Environmental Project No. 904 2004. Copenhagen: Danish Environmental Protection Agency.
Motiva (2007). Kimmo Rautiainen, specialist. Personal notice, 3.8.2007. Nieminen, M. (2004). Kesämökkibarometri 2003. [Summer Cottage barometer.] Statistics Finland
& Ministry of the Interior. <http://www.intermin.fi/suomi/saaristo>, visited 16.10.2006. NTS, 2007. The National Travel Survey 2004-2005. <http://www.hlt.fi/english/index.htm>, visited
16.7.2007. Nässén, Jonas, John Holmberg, Anders Wadeskog, Madeleine Nyman. 2007. Direct and indirect
energy use and carbon emissions in the production phase of buildings: An input-output analysis. ScienceDirect, Energy, 32 (2007) 1593-1602.
OECD (2002). Towards Sustainable Household Consumption. Paris: OECD. Ritthoff, M., Rohn, H., Liedtke, C., & Merten, T. (2002). Calculating MIPS. Resource productivity
of products and services. Wuppertal Speziel 27e. Wuppertal Institute for Climate, Energy and Environment. <www.wupperinst.org/Publikationen/Wuppertal_Spezial/ws27fi.pdf>.
Schmidt-Bleek, F. (1993). Wieviel Umwelt braucht der Mensch? MIPS - Das Maß für ökologisches Wirtschaften. Birkhäuser, Berlin, Basel, Boston. In English: Schmidt-Bleek, F. (1993). The Fossil Makers – Factor 10 and more. Available from: <www.factor10-institute.org/seitenges/Pdf-Files.htm>
Schmidt-Bleek, F. (1998). Das MIPS-Konzept: weniger Naturverbrauch – mehr Lebensqualität durch Faktor 10. [The MIPS Concept: Less Nature Consumption – More Quality of Life.] Droemersche Verlagsanstalt, München.
Statistics Finland. (2005). Kesämökit 2004. [Summer cottages 2004]. Helsinki: Statistics Finland. Statistics Finland. (2006). Suomen tilastollinen vuosikirja 2005. [Statistical Yearbook of Finland].
Helsinki: Statistics Finland. Von Weizsäcker, E. U., Lovins, A. B., & Lovins, L. H. (1998). Factor 4. Doubling Welfare,
Halving Resource Use. A Report to the Club of Rome. Earthscan, London, UK