Natural Resource Conservation Service Executive Summary MD-715
150
Civil Rights Division Federal Agency Annual EEO Program Report Management Directive – 715 Fiscal Year 2009 The purpose of the MD-715 is to provide policy guidance and standards for establishing and maintaining effective affirmative programs of Equal Employment Opportunity programs and activities in compliance with civil rights laws and USDA regulations, policies, and goals.
Transcript of Natural Resource Conservation Service Executive Summary MD-715

Civil Rights Division
Federal Agency Annual EEO Program Report Management Directive – 715
Fiscal Year 2009
The purpose of the MD-715 is to provide policy guidance and standards for establishing and maintaining effective affirmative programs of Equal Employment Opportunity programs and
activities in compliance with civil rights laws and USDA regulations, policies, and goals.


Agency Identifying Information (Parts A-D). . . . . . . . . . . . . . . . . . . . . . . . . . . . . . . . . . . . . . . . . . . . . . . pages 4-5 Executive Summary (Part E). . . . . . . . . . . . . . . . . . . . . . . . . . . . . . . . . . . . . . . . . . . . . . . . . . . . . . . . . . . pages 6-22 Certification of establishment of EEO Programs (Part F). . . . . . . . . . . . . . . . . . . . . . . . . . . . . . . . . . . . . pages - 23 Agency self assessment checklist – Essential Elements (Part G). . . . . . . . . . . . . . . . . . . . . . . . . . . . . . . pages 24-36 EEO Plan to attain essential elements of a model EEO program (Part H). . . . . . . . . . . . . . . . . . . . . . . . pages 37-44 EEO Plan to eliminate identified barriers (Part I). . . . . . . . . . . . . . . . . . . . . . . . . . . . . . . . . . . . . . . . . . pages 45-53 Special program plan for the recruitment, hiring and advancement of individuals with targeted disabilities (Part J). . . . . . . . . . . . . . . . . . . . . . . . . . . . . . . . . . . . . . . . . . . . . . . . . . . . . . . pages 54-55 Appendix. . . . . . . . . . . . . . . . . . . . . . . . . . . . . . . . . . . . . . . . . . . . . . . . . . . . . . . . . . . . . . . . . . . . . . . . . . pages 56-80 A. Acronyms;
B. Definitions; C. Complaint Processing Program Deficiencies; ADR; and Reasonable Accommodations D. 2008 Disabled Veterans Affirmative Action Program Plan and Accomplishments Report
E. NRCS Relevant EEO Policy Statements; F. Organizational Chart
Workforce data tables. . . . . . . . . . . . . . . . . . . . . . . . . . . . . . . . . . . . . . . . . . . . . . . . . . . . . . . . . . .. . . . . . .pages 81-180
Table A1: Total workforce - Distribution by race/ethnicity and sex Table A2: Workforce by component -Distribution by race/ethnicity and sex Table A3-1: Occupational categories (rates across) Table A3-2: Occupational categories (rates down) Table A4-1: Participation rates for general schedule (GS) grades Table A4-2: Participation rates for general schedule (GS) grades Table A5-1: Participation rates for wage grades Table A5-2: Participation rates for wage grades Table A6: Participation rates for major occupations Table A7: Applicant Flow Data for Major Occupations (Not Captured) Table A8: New Hires by Type of Appointment Table A9: Selection for Internal Competitive Promotions for Major Occupations (Not Captured) Table A10: Non-Competitive Promotion Time In Grade (Not Captured) . Table A11: Internal Selections for Senior Level Positions (Permanent Employees) Table A12: Participation in Career Development (Not Captured) Table A13: Employee Recognition & Awards Table A14: Separations by Type of Separations
3

Table B1: Total workforce - Distribution by Disability Table B2: Total workforce by Component Table B3-1: Occupational categories Distribution by Disability Table B3-2: Occupational categories Distribution by Disability Table B4-1: Participation rates for general schedule (GS) by Disability Table B4-2: Participation rates for general schedule (GS) by Disability Table B5-1: Participation rates for wage grades (WG) by Disability Table B5-2: Participation rates for wage grades (WG) by Disability Table B6: Participation rates for major occupations by Disability Table B7: Applicants and Hires by Disability (Not Captured) Table B8: New Hires by Type of Appointment by Disability Table B9: Selections for Internal Competitive Promotions by Disability
(Major Occupations) Table B10: Non-Competitive Promotions Time in Grade by Disability Table B11: Internal Selections for Senior Level Positions by Disability
(Not Captured) Table B12: Participation in Career Development by Disability Table B13: Employee Recognition & Awards Table B14: Separations by Type of Separation
4

EEOC FORM
715-01 PART A - D
U.S. Equal Employment Opportunity Commission FEDERAL AGENCY ANNUAL
EEO PROGRAM STATUS REPORT
For period covering October 1, 2008, to September 30, 2009.
1. Agency 1. U.S. Department of Agriculture
1.a. 2nd level reporting component Natural Resources Conservation Service
1.b. 3rd level reporting component
1.c. 4th level reporting component
2. Address 2. 1400 Independence Avenue, SW
3. City, State, Zip Code 3. Washington, DC 20020
PART A Department or Agency Identifying Information
4. CPDF Code 5. FIPS code(s) 4. DA 5. 16
1. Enter total number of permanent full-time and part-time employees 1. 11,185
2. Enter total number of temporary employees 2. 507
3. Enter total number employees paid from non-appropriated funds 3. 163
PART B Total
Employment
4. TOTAL EMPLOYMENT [add lines B 1 through 3] 4. 11,855
1. Head of Agency Official Title
Dave White Chief, Natural Resources Conservation Service
2. Agency Head Designee Virginia Murphy Associate Chief, Natural Resources Conservation Service
3. Principal EEO Director/Official Official Title/series/grade
Joseph E. Hairston Director, Civil Rights Division
4. Title VII Affirmative EEO Program Official
Samora Bennerman-Johnson Branch Chief, Affirmative Employment and Compliance Branch
5. Section 501 Affirmative Action Program Official
Clifford Denshire Disability Employment Program Manager
6. Complaint Processing Program Manager
Sandra McWhirter Acting Branch Chief, Complaints Branch
Barbara Taylor MD-715 Program Manager
Sharyn Alvarez, National Federal Women’s Program Manager
Jacqueline Padron, National Hispanic Program Manager
PART C Agency
Official(s) Responsible For Oversight
of EEO Program(s)
7. Other Responsible EEO Staff
Angela Biggs, National Asian American Special Emphasis Program Manager
5
Bennie Clark, National Black Emphasis Program Manager
Carol Crouch, National American Indian Alaska Native Special Emphasis Program Manager
EEOC FORM 715-01
PART A - D
U.S. Equal Employment Opportunity Commission FEDERAL AGENCY ANNUAL
EEO PROGRAM STATUS REPORT
Subordinate Component and Location (City/State) CPDF and FIPS codes
PART D List of Subordinate Components
Covered in This Report
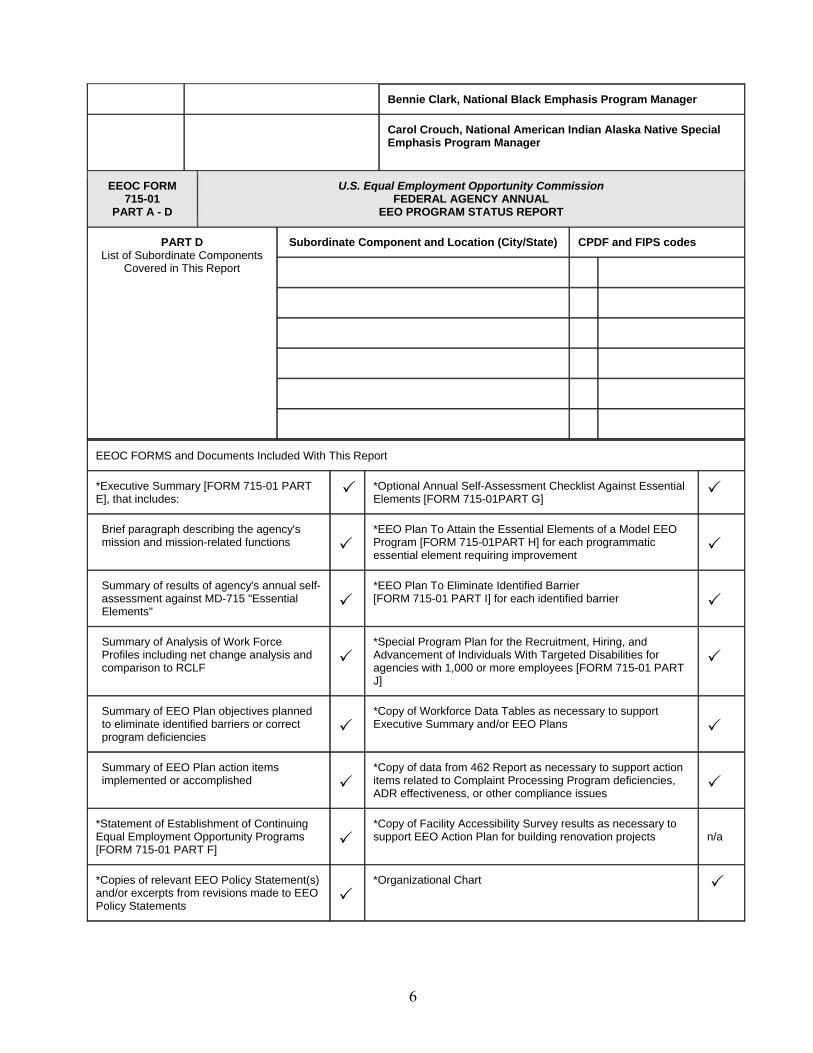
EEOC FORMS and Documents Included With This Report
*Executive Summary [FORM 715-01 PART E], that includes:
*Optional Annual Self-Assessment Checklist Against Essential Elements [FORM 715-01PART G]
Brief paragraph describing the agency's mission and mission-related functions
*EEO Plan To Attain the Essential Elements of a Model EEO Program [FORM 715-01PART H] for each programmatic essential element requiring improvement
Summary of results of agency's annual self-assessment against MD-715 "Essential Elements"
*EEO Plan To Eliminate Identified Barrier [FORM 715-01 PART I] for each identified barrier
Summary of Analysis of Work Force Profiles including net change analysis and comparison to RCLF
*Special Program Plan for the Recruitment, Hiring, and Advancement of Individuals With Targeted Disabilities for agencies with 1,000 or more employees [FORM 715-01 PART J]
Summary of EEO Plan objectives planned to eliminate identified barriers or correct program deficiencies
*Copy of Workforce Data Tables as necessary to support Executive Summary and/or EEO Plans
Summary of EEO Plan action items implemented or accomplished
*Copy of data from 462 Report as necessary to support action items related to Complaint Processing Program deficiencies, ADR effectiveness, or other compliance issues
*Statement of Establishment of Continuing Equal Employment Opportunity Programs [FORM 715-01 PART F]
*Copy of Facility Accessibility Survey results as necessary to support EEO Action Plan for building renovation projects
n/a
*Copies of relevant EEO Policy Statement(s) and/or excerpts from revisions made to EEO Policy Statements
*Organizational Chart
6

EEOC FORM 715-01 PART E
U.S. Equal Employment Opportunity Commission FEDERAL AGENCY ANNUAL
EEO PROGRAM STATUS REPORT
Natural Resource Conservation Service (NRCS)
For period covering October 1, 2008, to September 30, 2009.
EXECUTIVE SUMMARY
Mission: Helping People Help the Land. NRCS provides products and services that enable people to be good stewards of the Nation’s soil, water, and related natural resources on non-Federal lands. NRCS role is to provide technical and federal financial assistance to help customers care for the land. As a result of the Agency’s assistance, land managers and communities take a comprehensive approach to the use and protection of soil, water, and related resources in rural, suburban, urban, and developing areas. Vision: Productive Lands – Healthy Environment. Maintain a landscape in which a productive agricultural sector and a high quality environment are both achieved. Organizational Information: NRCS is a technical Agency of the United States Department of Agriculture (USDA). Since 1935, NRCS (originally called the Soil Conservation Service) continues to provide leadership in a partnership effort to help America's private land owners and managers conserve their soil, water, and other natural resources. The Secretary of Agriculture organized NRCS in 1994 through authority provided in the Federal Crop Insurance Reform and the Department of Agriculture Reorganization Act of 1994. NRCS combines the authorities of the former Soil Conservation Service as well as additional programs that provide federal financial assistance for natural resource conservation. NRCS’ employees provide technical assistance based on sound science and suited to a customer's specific needs. NRCS provides federal financial assistance for many conservation activities wherein participation in our programs is voluntary. People who make decisions about natural resources use and management on non-Federal lands are the Agency’s primary customers such as: farmers; ranchers; private sector members who support agriculture production and natural resources; government entities with natural resource use and management responsibilities; and non-profit organizations whose mission aligns with natural resource management aspects. NRCS reaches out to all segments of the agricultural community, including underserved and socially disadvantaged farmers and ranchers, to ensure that Agency programs and services are accessible to everyone. The NRCS’ science and technology activities provide technical expertise in such areas as animal husbandry and clean water, ecological sciences, engineering, resource economics, and social sciences. The Agency provides expertise in soil science and leadership for soil surveys and for the National Resources Inventory, which assesses natural resource conditions and trends in the United States. The Agency also provides technical assistance to foreign governments, and participates in international scientific and technical exchanges.
7

Location and Scope: Headquartered at Washington, DC, NRCS covers all fifty states and the U.S. Territories, and through our international program services we have people serving in Iraq and Afghanistan.
STATE OF EEO IN NATURAL RESOURCES CONSERVATION SERVICE (NRCS)
In fiscal year (FY) 2009, there were 11,855 women and men employed by Natural Resources Conservation Service across the United States and US Territories.
66.40% (7,822) were men and 33.60% (3,959) were women; the participation rate for women has slightly increased by 0.73% (111).
The number of employees with targeted disabilities in NRCS has been steadily declining within the last two fiscal years, from 1.03% (127) in FY 2007, to 0.98% (116) in FY 2008, to 0.91% (108) in FY 2009. Despite the net gain of 74 employees in FY 2009, Individuals with Targeted Disabilities still represent less than one percent (0.91%) of the total NRCS workforce.
Of the total NRCS’ workforce, 9.6% held senior pay level positions. White females
have made the most gains in securing senior level positions in NRCS over the past year increasing their participation rate by 20, while Black or African American women increased their participation rates by nine.
Of the total workforce, 94.27% (11,176) of NRCS’ employees occupied the General
Schedule (GS) pay system.
The most occupied GS grade for permanent employees in NRCS was GS-12.
The most occupied GS grade for permanent employees with targeted disabilities was at the GS-11 level, which is one grade below the average grade for permanent NRCS employees.
NRCS timely submitted a FY 2009 EEOC Form 462 report, NRCS reported that the
Civil Rights Director did not report directly to the Agency head.
A State of the Agency briefing was conducted by the Civil Rights Director and the Human Capital Officer, it was presented to the Agency head, Division Directors and above, and all State Conservationists, as required by MD-715 (The FY 2008 MD-715 report was submitted to the Department and EEOC on time.)
Informal EEO counseling and Alternative Dispute Resolution (ADR) programs
addressed many employee concerns before they resulted in formal complaints. Of the 62 counselings in FY 2009, 17 did not result in a formal complaint due to either settlement by the parties or withdrawal from the EEO process.
8

In FY 2009, 45 complaints were filed alleging employment discrimination against NRCS.
The number of complaints filed increased by .38% (45) from the number filed in the
previous year and there was a .36% (42) increase in the number of individuals who filed complaints over the same period.
A total of 31 investigations were completed by contractors with an average of 194.71
days in FY 2009. Of the 31 investigations, 16 were completed in 180 days or less with an average of 154 days. Fifteen were completed in 181-360 days with an average of 238 days.
NRCS issued 30 final agency decisions without an administrative judge decision
which resulted in one finding of discrimination with an average of 641 days; and 29 findings of no discrimination with an average of 819 days. There were no dismissals of complaints.
In FY 2009, as a result of final agency decisions, settlement agreements, and final
agency actions, NRCS paid out a total of $1,433,980.00.
In FY 2009, NRCS conducted 112 training sessions and outreach programs that reached approximately 2,785 NRCS’ employees with a total of 510 training days.
NRCS employs over 8,102 civilian employees in highly specialized occupations with
emphases in Soil Conservation, Soil Conservation Technician, Soil Scientist, General Biologist, Engineer Technician and Civil Engineering.
In FY 2009, statistics indicated that NRCS engaged in a myriad of personnel
activities (i.e., work force composition, new hires, promotions, awards, and separations).
USDA updated its Departmental Regulation (DR) 4230-002, Special Emphasis
Programs. The DR establishes a new Special Emphasis for Gay, Lesbian, Bisexual and Transgender (GLBT) employees. NRCS posted a vacancy announcement for its first National GLBT Special Emphasis Program Manager and will formally announce selection in December 2009.
DATABASE NOTES
1. The data for this report reflects the organization as of October 1, 2008. The HR database of records, the National Finance Center (NFC) and eVersity was used to obtain the data. It is recognized that the databases contain anomalies that affect the data reporting. The variance didn’t appear severe enough to affect the calculations. 2. Applicant pool dataset is not available, limiting conclusion on data tables.
9
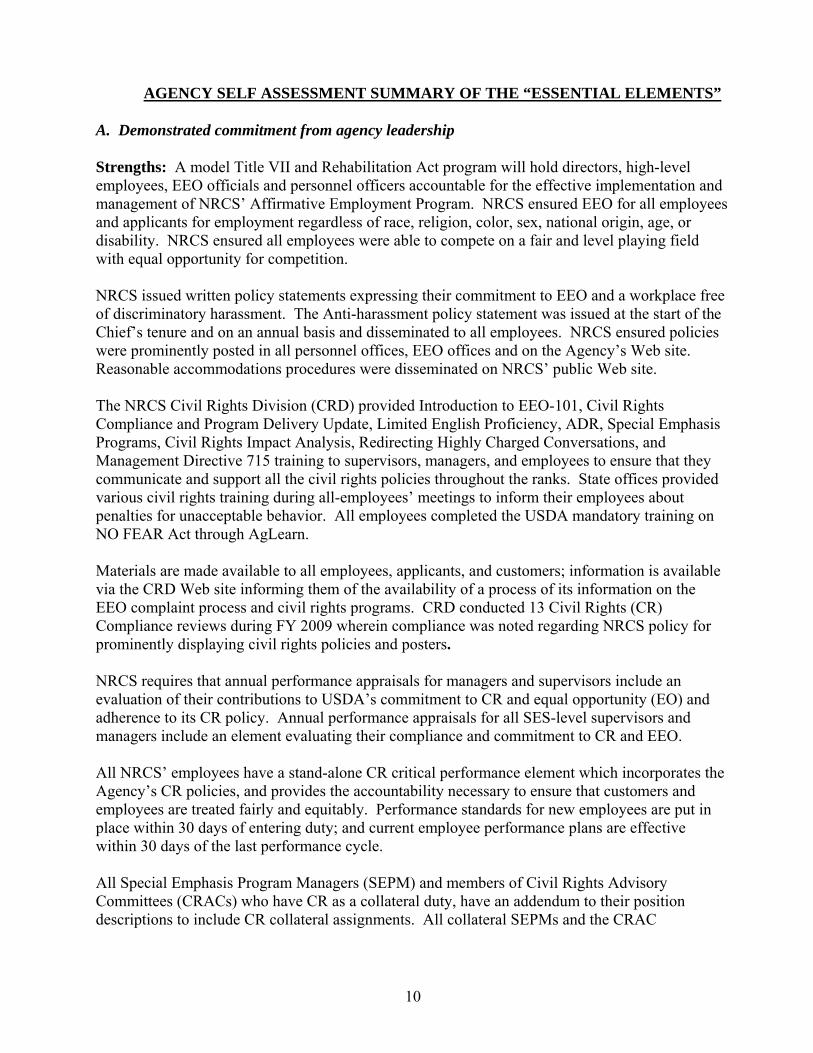
AGENCY SELF ASSESSMENT SUMMARY OF THE “ESSENTIAL ELEMENTS”
A. Demonstrated commitment from agency leadership
Strengths: A model Title VII and Rehabilitation Act program will hold directors, high-level employees, EEO officials and personnel officers accountable for the effective implementation and management of NRCS’ Affirmative Employment Program. NRCS ensured EEO for all employees and applicants for employment regardless of race, religion, color, sex, national origin, age, or disability. NRCS ensured all employees were able to compete on a fair and level playing field with equal opportunity for competition. NRCS issued written policy statements expressing their commitment to EEO and a workplace free of discriminatory harassment. The Anti-harassment policy statement was issued at the start of the Chief’s tenure and on an annual basis and disseminated to all employees. NRCS ensured policies were prominently posted in all personnel offices, EEO offices and on the Agency’s Web site. Reasonable accommodations procedures were disseminated on NRCS’ public Web site. The NRCS Civil Rights Division (CRD) provided Introduction to EEO-101, Civil Rights Compliance and Program Delivery Update, Limited English Proficiency, ADR, Special Emphasis Programs, Civil Rights Impact Analysis, Redirecting Highly Charged Conversations, and Management Directive 715 training to supervisors, managers, and employees to ensure that they communicate and support all the civil rights policies throughout the ranks. State offices provided various civil rights training during all-employees’ meetings to inform their employees about penalties for unacceptable behavior. All employees completed the USDA mandatory training on NO FEAR Act through AgLearn. Materials are made available to all employees, applicants, and customers; information is available via the CRD Web site informing them of the availability of a process of its information on the EEO complaint process and civil rights programs. CRD conducted 13 Civil Rights (CR) Compliance reviews during FY 2009 wherein compliance was noted regarding NRCS policy for prominently displaying civil rights policies and posters. NRCS requires that annual performance appraisals for managers and supervisors include an evaluation of their contributions to USDA’s commitment to CR and equal opportunity (EO) and adherence to its CR policy. Annual performance appraisals for all SES-level supervisors and managers include an element evaluating their compliance and commitment to CR and EEO. All NRCS’ employees have a stand-alone CR critical performance element which incorporates the Agency’s CR policies, and provides the accountability necessary to ensure that customers and employees are treated fairly and equitably. Performance standards for new employees are put in place within 30 days of entering duty; and current employee performance plans are effective within 30 days of the last performance cycle. All Special Emphasis Program Managers (SEPM) and members of Civil Rights Advisory Committees (CRACs) who have CR as a collateral duty, have an addendum to their position descriptions to include CR collateral assignments. All collateral SEPMs and the CRAC
10

Chairperson in each organizational unit report directly to the Deputy Equal Employment Officer for that unit. The Agency’s CRD program is allocated sufficient resources and funding to ensure success of its operation. The CRD’s Director has the authority to ensure implementation of Agency EEO action plans to improve EEO program efficiency and/or eliminate identified barriers to the realization of equality of opportunity. The Agency’s CRD produces a quarterly newsletter entitled “The Civil Rights Chronicle.” This newsletter is disseminated to all NRCS’ employees and is instrumental in providing and increasing an awareness of CR and EEO related matters. The newsletter is also available on the Agency’s CRD website. Deficiencies: Newly promoted supervisors are not provided a copy of the EEO policy when promoted into supervisory positions. The Human Capitol Office will develop a New Supervisors Packet that contains: Roles and Responsibilities of EEO and Roles and Responsibilities of Managers regarding EEO.
B. Integration of EEO into the agency’s strategic mission
Strengths: NRCS integrated EEO into the Agency’s strategic mission through direct involvement of leadership and stakeholders, consultation with CRD, and Human Resources, allocation of sufficient resources to create and maintain an effective program. In an effort to increase awareness, NRCS made great use of the Web site to communicate to all employees. NRCS utilized various media to distribute EEO information concerning federal EEO laws, regulations and requirements, rights, duties and responsibilities, and to promote best workplace practices. In efforts to keep the employees up to date changes were communicated through bulletins (i.e., information regarding inappropriate or unacceptable behaviors and the penalties for those behaviors, DM 4070-735-001 (Employee Responsibilities and Conduct) and National Bulletins). Further, supervisors are specifically targeted for training through the Agency’s national training course, Supervising for Excellence, which provides solutions and tools for addressing employee misconduct. The NRCS’ CRD’s Director and Human Capital Officer function as members of the National Leadership (senior management team) and actively participate in EEO/CR decision-making processes when it comes to the work force. The CRD management and staff are adequately trained to carry out their responsibilities, assuring the integrity of the Civil Rights program. The CRD, Human Capital Office, Outreach Director, and the Human Resource Management Department formed Strategic Partnerships by sharing responsibility for the National Recruitment Strategy and are working to strengthen their partners and identify additional opportunities to work together. Some of the on-going partnerships consist of the Human Capital Officer serving as advisor on the National Civil Rights Committee wherein the Human Capital Officer spoke at Quarterly Special Emphasis Program Managers meetings which continued to strengthen relationships.
11

The CRD’s Director also serves as an advisor to the NRCS’ National Civil Rights Committee (NCRC). The NCRC Chairperson is appointed by the NRCS Chief and serves at his discretion. The NCRC’s members are representative of all Agency employees in various occupations, grade levels, race, sex, national origin, disability status, and geographical locations within the organizational unit. The NCRC Chairpersons consist of the following advisors: HRMD Director, Outreach Director, CRD Director and the State Conservationist. The demographic makeup of NCRC’s membership consists of a male and female from each of the following groups: White, Black, Hispanic, American Indian/Alaska Native (AIAN), Asian American Pacific Islanders (AAPI), and Persons with Disabilities.
The NCRC performs the following functions:
A. Serves as an advisory body to the NRCS’ Chief to promote and assist in meaningful and effective affirmative action consistent with the goals and objectives set forth by management.
B. Provides feedback on the performance in equal opportunity and civil rights compliance, by identifying areas of weakness, and making recommendations for improvement.
C. Identifies emerging areas needing special attention by the Chief and NRCS top management.
D. Makes recommendations to the Chief regarding policies, practices, and procedures as they affect equal opportunity NRCS-wide.
CRD serves as a resource to managers and supervisors by providing direction, guidance and monitoring of key activities to achieve a diverse workplace free of barriers to equal opportunity. The Agency maintains three fulltime National Special Emphasis Program Managers (SEPMs): the Hispanic Emphasis Program Manager (HEPM), the Federal Women Program Manager (FWPM), and the Disability Emphasis Program Manager (DEPM) who report to the CRD Director. There are also three collateral duty National SEPMs: the Asian American Pacific Islanders (AAPI) SEPM, American Indian/Alaska Native (AIAN), SEPM, and the Black Emphasis Program Manager (BEPM) who also report to the CRD Director in regards to their collateral duty equal opportunity duties and responsibilities. The National SEPMs also provide technical advice to employees, management officials, and the Human Resources Division regarding recruitment strategies, vacancy projections, succession planning, selections for training/career development opportunities, and other workforce changes. Deficiencies: The CRD’s Director does not report directly to the Chief. C. Management and program accountability
Strengths: NRCS’ CRD advised and provided appropriate assistance to managers/supervisors about the status within each manager’s or supervisor’s area of responsibility. In an effort to make NRCS a model EEO program, the CRD provided a quarterly workforce analysis report throughout the fiscal year for State Conservationist and Regional Conservationist according to their respective areas. This report identified trends likely to influence diversity in the workplace.
12

CRD advised leadership that the key to attaining a Model Equal Employment Opportunity (EEO) program in NRCS are the managers and supervisors who make virtually all of the decisions that directly impact on the success – or failure – of any EEO program. Since managers and supervisors are the ones to fill vacant positions; make selections for promotions; approve training; provide detail opportunities; and set the tone for working relationships in the workplace, the CRD’s Director encouraged managers and supervisors to make sound personnel decisions based on the qualifications while taking into account EEO goals and objectives. The CRD advised managers and supervisors that the objectives of the EEO program are more than complaint processing. It is two fold: the first is to provide a complete and fair opportunity for all employees regardless of race, national origin, color, sex, religion, age, or disability to contribute to the maximum extent in pursuing a career in the federal government; and the second is to provide for the non-discriminatory treatment of all employees in carrying out their duties in the workplace including protecting them from reprisal should they exercise their right by participating in the EEO process. The NRCS’ CRD coordinated the development and implementation of the EEO Plan with all appropriate agency managers to include Agency Counsel, Human Resource Officials, Finance, and the Information Technology Officials. The NRCS CRD continued to utilized General Manual 230, Part 402A, “Civil Rights Accountability” which requires appropriate disciplinary and/or corrective actions to be taken against those employees who engage in discriminatory behavior or Civil Rights-related misconduct. When there is a finding of discrimination or misconduct, procedures are established whereby the Human Resources Management Division (HRMD) coordinates with the appropriate supervisor regarding appropriate disciplinary action. The Alternative Dispute Resolution (ADR) program is a component of the Agency’s CRD. The reason for the mergence is to resolve discriminatory issues and allegations of conflict early and effectively at the lowest level if possible. Supervisors are required to participate in ADR once it is accepted by the complainant. The Agency requires employees and supervisors to have a stand alone civil rights element on their performance appraisal standards. Procedures are in place to track and monitor reasonable accommodations through a full time position within the CRD. Deficiencies: In FY 2009, there was one finding of discrimination in NRCS. The case was sent to Employee Relations for review. D. Proactive prevention of unlawful discrimination
Strengths: The NRCS’ EEO Official (CRD Director) provides regular updates to the Chief, Associate Chief and Agency senior officials/leaders on EEO-related matters. The CRD’s Director, along with the HRMD and Outreach Director, coordinates the development and implementation of EEO plans with all appropriate Agency managers. The CRD Director, as a member of the Position Management Committee (PMC), is involved in reviewing the Agency’s Merit Promotion Program Policy and Procedures, Employee Recognition Awards Program, and Employee
13

Development/Training Programs, for barriers that may be impeding full participation in the aforementioned programs by all groups. Managers and supervisors are held accountable to take corrective actions on identified barriers that may hinder progress in creating and maintaining an environment free from discrimination, harassment on all protected bases, including, but not limited to, sexual harassment or intimidation of an employee or an applicant for employment (however, during the upcoming fiscal year focus will be on working together with all senior managers/officials (NHQ and field) in implementing action plans to eliminate identified barriers.) The Agency’s CRD conducted 13 national compliance reviews of its States to assess NRCS’ compliance with Equal Opportunity laws and regulations. During the reviews, the following trend analyses of the States were collected and analyzed: workforce profile by RSNOD; workforce major occupation by RSNOD; workforce grade level distribution by RSNOD; workforce compensation and reward system by RSNOD; and the effects of management/personnel policies, procedures and practices by RSNOD. Additional analyses were conducted as needed when disparities were noted. Action summaries of review activities, including a copy of each review report, findings, corrected actions, and recommendations was provided to the NRCS’ Chief, Regional Conservationist (RCs), and the USDA, Director of the Office of Adjudication and Compliance (OAC) at the end of the Fiscal Year via a FY 2009 CR Compliance Review Summary report. In addition to the Civil Rights Compliance Review trend and analysis reports, Senior Management (Deputy Chiefs excluded) including each State Conservationists are provided a monthly EEO complaint trend and analysis report which identifies EEO complaint activity for the official’s respective area. Senior officials received quarterly trends and analysis reports regarding affirmative employment which included RSNO data for the following: work force profile; awards; hires; promotions; and separations. National Headquarters, HRMD conducted compliance reviews. HRMD used comprehensive compliance review worksheets in order to thoroughly document their findings. The reviews focused on Merit Promotion, Delegated Examining, and Position Classification. All compliance reviews were beneficial in that HRMD was able to provide feedback to the states on a variety of issues. The State offices were provided a comprehensive list of procedural and regulatory actions that needed correcting. HRMD typically provides 60 days for all action to be corrected and reported to their office. USDA and NRCS’ Civil Rights and EEO Policy Statements and other EEO-related statements (i.e., sexual harassment, reasonable accommodations, etc.) are provided to all employees through the New Employee Orientation, email and available through the Agency’s website. Supervisors, managers, and employees are encouraged to resolve EEO issues at the lowest level, and utilize the Agency’s ADR (mediation for EEO issues/complaints); the Employee Assistance Program; and other workplace conflict resolution programs. The participation of supervisors and managers are required in the ADR process for EEO disputes. During FY 2009, good faith efforts were made repeatedly to resolve the EEO complaints throughout the Informal and Formal process. One hundred percent of complainants at both the Informal and Formal stages were offered ADR.
14

NRCS’ employees are contacted by an ADR Specialist within two (2) days of receiving a signed election form.
USDA has an adequate system for collecting employee data by Race and National Origin (RNO) and disability codes necessary for the MD-715. USDA is not currently collecting applicant flow data. The Agency’s HRMD and CRD worked on acquiring an automated system software system that will track applicant pool by race, sex, national origin, and disability. The estimated date for implementing an applicant pool data system is the FY 2010.
RNO, gender, and disability data for NRCS employees is collected and maintained for the purpose of reporting and monitoring employment trends. The Agency utilizes the data to determine low participation and making recommendations for improvement. Deficiencies: NRCS does not collect applicant flow data. E. Efficiency
Strengths: NRCS has a full-time National Disability Employment Program Manager who coordinates and assists with processing requests for reasonable accommodations in all major components of the Agency. The requests for reasonable accommodations are fulfilled after review by the Departmental Medical Officer and responsible Agency personnel. NRCS utilizes the Department’s enterprise system, iCompliants, for complaint tracking and monitoring which identifies and tracks the status of the EEO complaint process stages. iComplaints permitted the Complaints Manager to identify/analyze the location, status, and length of time elapsed at each stage of the Agency’s complaints resolution process; the issues and the bases of the complaints; the aggrieved individuals/complainants that involved management officials; and other information necessary to analyze complaint activity aimed at increasing the effectiveness of the agency’s EEO program. The Agency also implemented an internal tracking system to improve its EEO processing efficiency. For example, regarding the timeliness of investigations, wherein the Agency could determine when a contractor consistently did not meet the regulatory timeframes. The Agency did not re-hire contractors that failed to meet the time requirements. In accordance with EEO Management Directive MD-110, NRCS ensured that experienced counselors and contract investigators received the required 32 hours of training and the annual 8-hour refresher training. CRD discovered the best agency action practice, technique, strategy and initiative that successfully and positively advanced diversity and inclusion in the areas of recruitment, selection, employee development, and advancement of employees by representing NRCS at various events throughout the year such as Federal Asian Pacific American Council (FAPAC); Federally Employed Women (FEW); League of United Latin American Citizens (LULAC); and the American Indian Sciences and Engineering Society. The Special Emphasis Program Managers created a recruitment database from Career Fairs which provided the Agency with a pool of qualified students. CRD provides a variety of “Lunch and Learn” training sessions to all NRCS employees, customers, and partners on
15

subjects/topics pertaining to CRD, EEO, Diversity, Reasonable Accommodations and ADR. The CRD sponsored recruitment events at 1890, Hispanic, American Indian/Alaska Native and the Asian American Pacific Islander colleges, universities, and institutions. In an effort to increase the understanding and appreciation of workforce diversity, NRCS supports this initiative by approving special emphasis programs and other events. The NRCS continues to increase productivity and contributing to social responsibility by: sponsoring an annual Special Emphasis Program Poster Contest for each minority group; conduct Civil Rights Compliance Reviews and use this opportunity to meet field employees, interact with them, and gage the climate to learn the issues, barriers, and concerns of employees; and provide training to collateral-duty Special Emphasis Program Managers on an annual basis. Deficiencies: The Agency does not exercise total control over the Dismiss/Acceptance stage or the Final Agency Decision stage of the EEO process. Both cited stages are under the purview of the Department’s OAC. These processes impede the Agency’s ability to timely complete investigations and render decisions within the regulatory timeframes. F. Responsiveness and legal compliance Strengths: NRCS was in compliance with federal EEO statues and regulations, policy guidance, and other applicable written instructions with respect to our responsiveness and legal compliance. NRCS follows USDA and EEOC reporting requirements and complies with EEO orders and directives. The Agency ensures completion of ordered corrective actions and timely submits its compliance reports to EEOC. Processing of monetary agreements is processed by the responsible NHQ and/or State Official. Documentation for completing compliance is promptly provided and reviewed by CRD. Deficiencies: There are no weaknesses to this element.
SUMMARY OF ANALYSIS OF WORK FORCE PROFILES
Data Base Information
a. In accordance with the instructions received from the USDA, Assistant Secretary for Civil Rights, Office of Diversity, unless otherwise noted, NRCS utilized the data tables provided by the Department’s eVersity database (one of three subcomponents of the Department’s database enterprise system). eVersity data provides all of the analysis, tracking, management, reporting, and document generation functionality required by Federal departments and agencies to develop and manage EEO plans. The Agency’s official backup database source is the National Finance Center (NFC).
b. This report used the National Civilian Labor Force (NCLF), Relevant/Occupational Civilian Labor Force (RCLF), and the NRCS workforce as the comparison tools.
16
c. Appendix: A. Acronyms B. Definitions C. Form 462 D. FY 2008 Disability Veterans Affirmative Action Program Plan and Accomplishments Report E. NRCS EEO Policy statements and F. Organizational Chart
Workforce Composition
In FY 2009, there were 11,855 women and men employed by NRCS across the United States and US Territories. The participation rate for men were 66.40% (7,822) and for women 33.60% (3,959); the participation rate for women has slightly increased by .73% (111) since FY 2008, but women still continue to be well below the (CLF).
The distribution of the FY 2009 NRCS total work force by Race/Ethnicity and sex is as follows:
Hispanic or Latino males 3.07% (364), Hispanic or Latino females 1.64% (195); White males 55.77% (6,612), White females 27.87% (3,304); Black or African American males 4.31% (511), Black or African American females 3.21% (381); Asian males 0.77% (91), Asian females 0.62% (73); Native Hawaiian or Other Pacific Islander males 0.04% (5), Native Hawaiian or Other Pacific Islander females 0.07% (8); American Indian/Alaska Native males 1.67% (198), American Indian or Alaska Native females 0.84% (100); and Two or More Races males 0.03% (3), Two or More Races females 0.08% (9).
The distribution of the FY 2008 NRCS total work force by Race/Ethnicity and sex was as follows:
Hispanic or Latino males 2.91% (343), Hispanic or Latino females 1.49% (176); White males 56.51% (6,657), White females 27.43% (3,231); Black or African American males 4.33% (510), Black or African American females 3.14% (370); Asian males 0.81% (96), Asian females 0.56% (66); Native Hawaiian or Other Pacific Islander males 0.04% (5), Native Hawaiian or Other Pacific Islander females 0.06% (7); American Indian or Alaska Native males 1.77% (209), American Indian or Alaska Native females 0.87% (103); and Two or More Races males 0.02% (2), Two or More Races females 0.04% (5).
Between FY 2008 and FY 2009, Hispanic or Latinos, White females, Blacks or African Americans, Asians, Native Hawaiian or Other Pacific Islander, and Two or More Races remained below their overall availability in the National Civilian Labor Force, as reported in the 2000 census (CLF). White men and American Indian or Alaskan Native men and women remained above their overall availability in the CLF.
General Schedule (GS) grades represented 99.4 % (11,809), General Manager (GM) grades represented .3% (34), Wage Grade (WG) represented .07 % (8), and Senior Executive Service (SES) represented .23 % (27) of NRCS’ workforce.
Disability Workforce
Of the 11,855 total employee workforce, there were a total of 0.91% (108) employees that had targeted disabilities In FY2009. In FY 2008, there were a total of 0.98% (116) employees that had targeted disabilities. In FY 2009, compared to FY 2008, the number of employees with targeted
17

disabilities decreased by 8, but the representation remained constant at .91%. NRCS targeted disabilities participation rate remained below the federal high of 2.27%.
During the annual self-assessment, while performing barrier analysis it was discovered that NRCS has made a concerted effort to increase the Agency’s disabled workforce by hiring disabled veterans. It was also noted that individuals hired do not always list their disability on the SF-256, Self-Identification of Handicap.
Major Occupations
NRCS employs over 8,102 civilian employees in highly specialized occupations with emphasis in General Biologist Scientist, Soil Conservation, Soil Conservation Technician, Soil Scientist, Engineering Technician, and Civil Engineering.
The major occupation data indicated the following groups represent lower participation according to the RCLF:
General Biologist
Hispanic or Latino females White females Black or African American females Asian males and females Native Hawaiian or Other Pacific Islander males and females Two or More Races males and females
Soil Conservationist
White males Native Hawaiian or Other Pacific Islander males Two or More Races males and females
Soil Conservationist Technician
White females Hispanic or Latino males and females Black or African American males and females Asian females Native Hawaiian or Other Pacific Islander males
Soil Scientist
Hispanic or Latino males and females White females Black or African American females Asian males and females
18

Native Hawaiian or Other Pacific Islander males and females Two or More Races males and females
Engineer Technician
Hispanic or Latino males and females White females Black or African American males and females Asian males and females Native Hawaiian or Other Pacific Islander males and females Two or More Races males and females
Civil Engineering
Hispanic or Latino females White females Black or African American females Asian males and females Native Hawaiian or Other Pacific Islander males and females Two or More Races males and females
Overall women and minorities within the Agency’s major occupations continued to represent lower participation rates compared to White males. Compared to FY 2008, White males demonstrated a decrease in the participation rate in only one major occupation field which was Soil Conservationist.
Personnel Activity
Summary Analysis of Promotions
In FY 2009, there were a total of 1,179 promotions in NRCS. Of all the promotions distributed, males received 59.9% (706) and females received 40.1% (473). Of all the groups, White males and White females received the majority of the promotions 81.1% (956). The promotions were distributed by race/ethnicity and sex as follows:
Promotions
Total Hispanic White Black Asian Nat
Hawa/ Pac Isl
Amer Ind/ Alask Nat
Two or More Races
All M F M F M F M F M F M F M F M F
# of Promotions 1,179 706 473 34 21 593 363 53 64 13 14 0 1 13 10 N/A N/A
% of Promotions 100 59.9 40.1 2.9 1.8 50.3 30.8 4.5 5.4 1.1 1.2 0.0 0.1 1.1 0.8 N/A N/A
# of NRCS Workforce 11,184 7,472 3,712 343 184 6,356 2,991 489 358 89 73 5 5 187 92 3 9
19

In FY 2009, Individuals with Disabilities received a total of six promotions in NRCS. Of the six promotions distributed males received 83.3% (5) and females received 16.7% (1). Of all the groups White males and White females received all the promotions. As a result, NRCS is partnering with organizations and entities targeting individuals with disabilities in an effort to at least meet the participation rates of the disability community in the Federal Sector.
Promotions – Individuals with Disabilities
Total Hispanic White Black Asian Nat
Hawa/ Pac Isl
Amer Ind/ Alask Nat
Two or More Races
All M F M F M F M F M F M F M F M F
# of Promotions 6 5 1 0 0 5 1 0 0 0 0 0 0 0 0 N/A N/A
% of Promotions
100 83.3 16.7 0.0 0.0 83.3 16.7 0.0 0.0 0.0 0.0 0.0 0.0 0.0 0.0 N/A N/A
# of NRCS Workforce
11,184 7,472 3,712 343 184 6,356 2,991 489 358 89 73 5 5 187 92 3 9
Summary Analysis of Separations
In FY 2009, there were a total of 599 employees that separated from NRCS. The majority of the employees that separated were males 69.1% (185). The percentage of females that departed was 30.9% (185). The majority of the employees that separated from NRCS were White males and White females at 81.8% (490). The separation by minority profile is as follows:
Total Hispan White Black Asian Nat
Hawa/ Pac Isl
Amer Ind/
Alaskan Nat
Two or More Races
All M F M F M F M F M F M F M F M F
# or Separat
ions 599 414 185 10 7 344 146 32 22 8 3 0 0 20 6 0 1
% of Separat
ions
100%
69.1%
30.9%
1.7%
1.2%
57.4%
24.4%
5.3%
3.7%
1.3%
0.5%
0.0%
0.0%
3.3%
1.0%
0.0%
0.2%
# of NRCS
Workforce
11,184
7,472
3,712
343
184
6,356
2,991
489
358
89 73 5 5 187
92 3 9
Of the above separations, 92.3% (553) were voluntary and .77% (46) was involuntary. Human Resources, with the assistance of the CRD, have developed an Exit Survey and will be reviewing separation data in FY 2010 to determine reasons the separation rates were above specific participation rates.
20
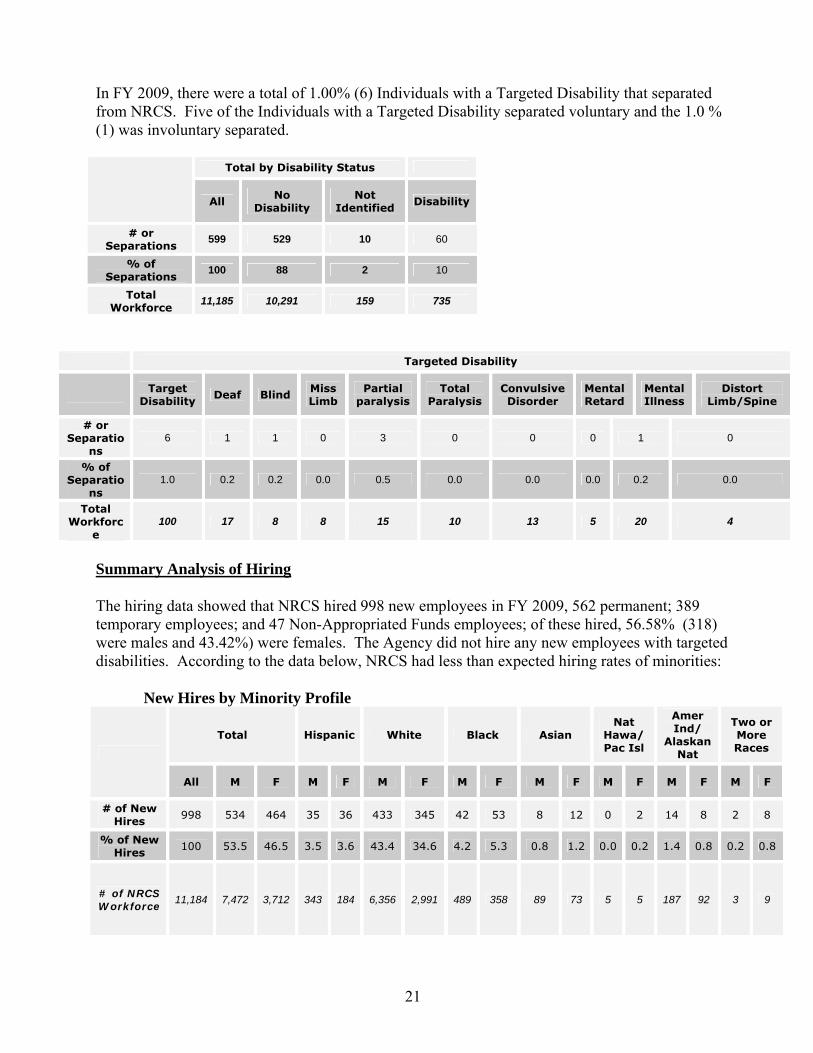
In FY 2009, there were a total of 1.00% (6) Individuals with a Targeted Disability that separated from NRCS. Five of the Individuals with a Targeted Disability separated voluntary and the 1.0 % (1) was involuntary separated.
Total by Disability Status
All No
Disability Not
Identified Disability
# or Separations
599 529 10 60
% of Separations
100 88 2 10
Total Workforce
11,185 10,291 159 735
Targeted Disability
Target Disability Deaf Blind Miss
Limb Partial
paralysis Total
Paralysis Convulsive Disorder
Mental Retard
Mental Illness
Distort Limb/Spine
# or Separatio
ns 6 1 1 0 3 0 0 0 1 0
% of Separatio
ns 1.0 0.2 0.2 0.0 0.5 0.0 0.0 0.0 0.2 0.0
Total Workforc
e 100 17 8 8 15 10 13 5 20 4
Summary Analysis of Hiring
The hiring data showed that NRCS hired 998 new employees in FY 2009, 562 permanent; 389 temporary employees; and 47 Non-Appropriated Funds employees; of these hired, 56.58% (318) were males and 43.42%) were females. The Agency did not hire any new employees with targeted disabilities. According to the data below, NRCS had less than expected hiring rates of minorities:
New Hires by Minority Profile
Total Hispanic White Black Asian Nat
Hawa/ Pac Isl
Amer Ind/
Alaskan Nat
Two or More Races
All M F M F M F M F M F M F M F M F
# of New Hires 998 534 464 35 36 433 345 42 53 8 12 0 2 14 8 2 8
% of New Hires 100 53.5 46.5 3.5 3.6 43.4 34.6 4.2 5.3 0.8 1.2 0.0 0.2 1.4 0.8 0.2 0.8
# of NRCS Workforce 11,184 7,472 3,712 343 184 6,356 2,991 489 358 89 73 5 5 187 92 3 9
21

Total Total by Disability Status
All No Disability Not Identified Disability
# of New Hires 999 922 15 62
% of New Hires 100.0% 92.3% 1.5% 6.2%
Total Workforce # 11,185 10,291 159 735
Targeted Disabilities
Target Disability Deaf Blind Miss
Limb Partial
paralysis Total
Paralysis Convulsive Disorder
Mental Retard
Mental Illness
Distort Limb/Spi
ne
# of New Hires 0 0 0 0 0 0 0 0 0 0
% of New Hires
0.0 0.0 0.0 0.0 0.0 0.0 0.0 0.0 0.0 0.0
Total Workforc
e # 100 17 8 8 15 10 13 5 20 4
Summary Analysis of Awards
In FY 2009, cash awards across NRCS remained largely representative of workforce profile population - White males and White females combined, received 74.4% of the total dollar amount awarded, $6,990,101. The average amount for cash awards in the $100-$500 category was $366; the males’ average was $372 and females averaged $358. White males and females, Black or African American females, American Indians or Alaskan Native males, and Asian females were awarded below the average. For the greater than $501 category, the average was $1,170; the males average was $1,172.91 and females averaged $1,167.17. White males and females, Hispanic or Latino males and females, American Indians or Alaskan Native females, Asian females were below the average.
22

RSNO data breakdown is as follows for the total amount awarded:
Employee Recognitions and Awards by Minority Profile
Hispanic White Black Asian Nat Hawa/ Pac Isl
Amer Ind/ Alaskan Nat
Two or More Races
M F M F M F M F M F M F M F
26 96 321 193 19 17 5 5 0 0 2 7 0 0
229,700 126,815 3,825,422 1,914,293 304,737 342,012 6,632 54,076 2,202 1,939 124,588 54,783 985 1,917
3.8% 13.9% 46.5% 27.9% 2.7% 2.5% 0.7% 0.7% 0.0% 0.0% 0.3% 1.0% 0.0% 0.0%
343 184 6,356 2,991 489 358 89 73 5 5 187 92 3 9
There were a total of 43 individuals with targeted disabilities awarded cash awards for a total of $36,059 between both dollar amount categories. The average in the $100 to $500 category was $366 which is the same average of the workforce’s average; and in the greater than $501 category, the average was $1,160 which is also the same as the workforce’s average. The targeted disability employees’ average was $350 for the $100 to $500 category; and $1,100 for the $501 greater than category.
Employee Recognition and Awards by Targeted Disability Total
All No
Disability Not
Identified Disability
Total Time Off Awards (#)
612 566 8 38
Total Cash Awards ($)
7,050,401 6,475,858 112,611 461,932
% of Awards 100% 92% 2% 6.2%
Total Workforce # 11,185 10,291 159 735
Targeted Disabilities
Targeted Disability Deaf Blind Missing
Limbs Partial
Paralysis Total
Paralysis
Convulsive
Disorder
Mental Retard
Mental Illness
Distort Limb/Spin
e
Total Time Off
Awards (#)
8 0 0 2 2 1 1 0 2 0
Total Cash
Awards ($)
36,059 4,882 6,571 0 6,319 700 3,244 100 12,143 0
% of Awards
1.3% 0.0% 0.0% 0.3% 0.3% 0.2% 0.2% 0.0% 0.3% 0.0%
Total Workfor
ce # 100 17 8 8 15 10 13 5 20 4
23
EEOC FORM 715-01
PART G
U.S. Equal Employment Opportunity Commission FEDERAL AGENCY ANNUAL
EEO PROGRAM STATUS REPORT
Natural Resource Conservation Service (NRCS)
For period covering October 1, 2008, to September 30, 2009.
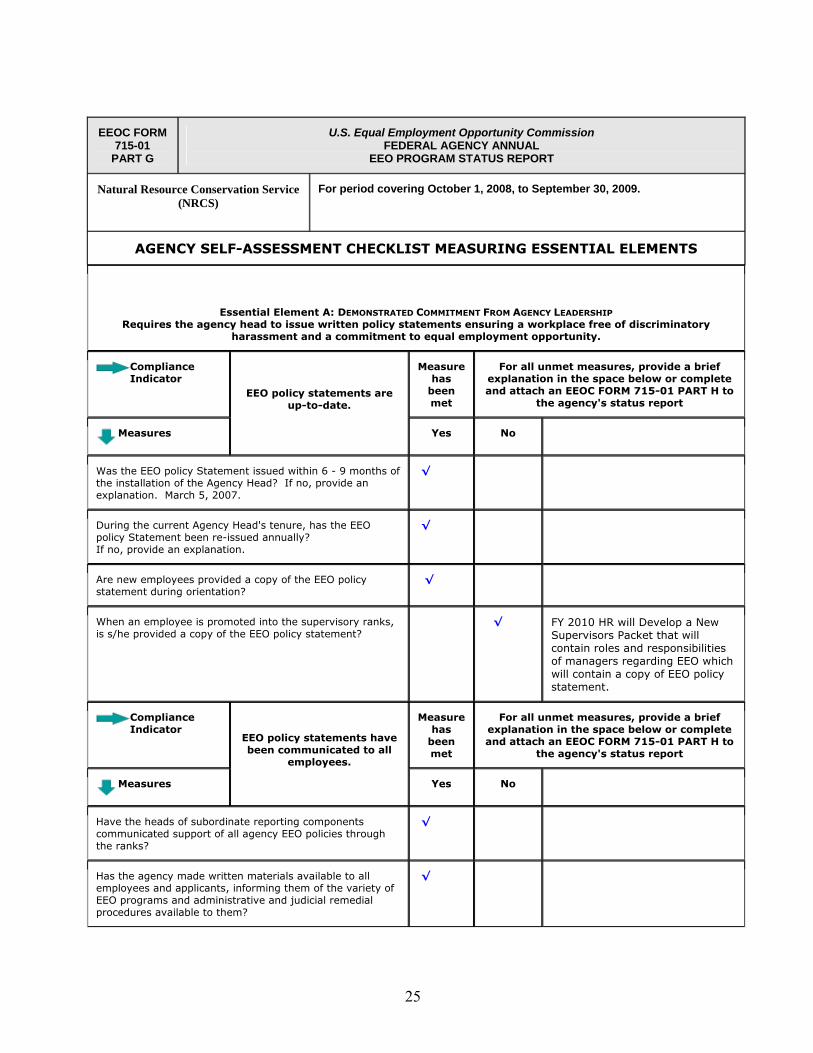
AGENCY SELF-ASSESSMENT CHECKLIST MEASURING ESSENTIAL ELEMENTS
Essential Element A: DEMONSTRATED COMMITMENT FROM AGENCY LEADERSHIP Requires the agency head to issue written policy statements ensuring a workplace free of discriminatory
harassment and a commitment to equal employment opportunity.
Compliance Indicator
Measure has
been met
For all unmet measures, provide a brief explanation in the space below or complete and attach an EEOC FORM 715-01 PART H to
the agency's status report
Measures
EEO policy statements are up-to-date.
Yes No
Was the EEO policy Statement issued within 6 - 9 months of the installation of the Agency Head? If no, provide an explanation. March 5, 2007.
√
During the current Agency Head's tenure, has the EEO policy Statement been re-issued annually? If no, provide an explanation.
√
Are new employees provided a copy of the EEO policy statement during orientation?
√
When an employee is promoted into the supervisory ranks, is s/he provided a copy of the EEO policy statement? √ FY 2010 HR will Develop a New
Supervisors Packet that will contain roles and responsibilities of managers regarding EEO which will contain a copy of EEO policy statement.
Compliance Indicator
Measure has
been met
For all unmet measures, provide a brief explanation in the space below or complete and attach an EEOC FORM 715-01 PART H to
the agency's status report
Measures
EEO policy statements have been communicated to all
employees. Yes No
Have the heads of subordinate reporting components communicated support of all agency EEO policies through the ranks?
√
Has the agency made written materials available to all employees and applicants, informing them of the variety of EEO programs and administrative and judicial remedial procedures available to them?
√
25

Has the agency prominently posted such written materials in all personnel offices, EEO offices, and on the agency
's
internal website? [see 29 CFR §1614.102(b)(5)]
√
Compliance Indicator
Measure
metand attac RT H to
the agency's status report
has been
For all unmet measures, provide a brief explanation in the space below or complete
h an EEOC FORM 715-01 PA
Measures
agency management.
Yes No
Agency EEO policy is vigorously enforced by
Are managers and supervisors evaluated on their commitment to agency EEO policies and principles, including their efforts to:
√
resolve problems/disagreements and other conflicts in their respective work environments as they arise?
√
address concerns, whether perceived or real, raised by employees and following-up with appropriate ac
tion to
correct or eliminate tension in the workplace?
√
support the agency's EEO program through allocation of mission personnel to participate in communireach and recruitment programs with private
ty out-
employers, public schools and universities?
√
ensure full cooperation of employees under his/hesupervision with EEO office officials su
r
ch as EEO Counselors, EEO Investigators, etc.?
√
ensure a workplace that is free from all form
s of discrimination, harassment and retaliation?
√
ensure that subordinate supervisors have effective managerial, communication and interpersonal skills in order to supervise most effectively in a workplace wdiverse employees and avoid d
ith
isputes arising from ineffective communications ?
√
ensure the provision of requested religious accommodations when such accommodations do not cause an undue hardship?
√
ensure the provision of requested disability accommodations to qualified individuals with disabilities when such accommodations do not cause an undue hardship?
√
Have all employees been informed about what behaviors are inappropriate in the workplace and that this behavior may result in disciplinary actions?
√
Describe what means were utilized by the agency to so inform its workforce about the penalties for unacceptable behavior.
f
e ing
by all employees during FY 2008.
Employees are informed by various methods such as training; staffmeetings; NRCS Standards oConduct; EEO policies; and Employee Relations policies – all policies published and posted on thAgency’s website. Ethics trainwas provided and completion required
26
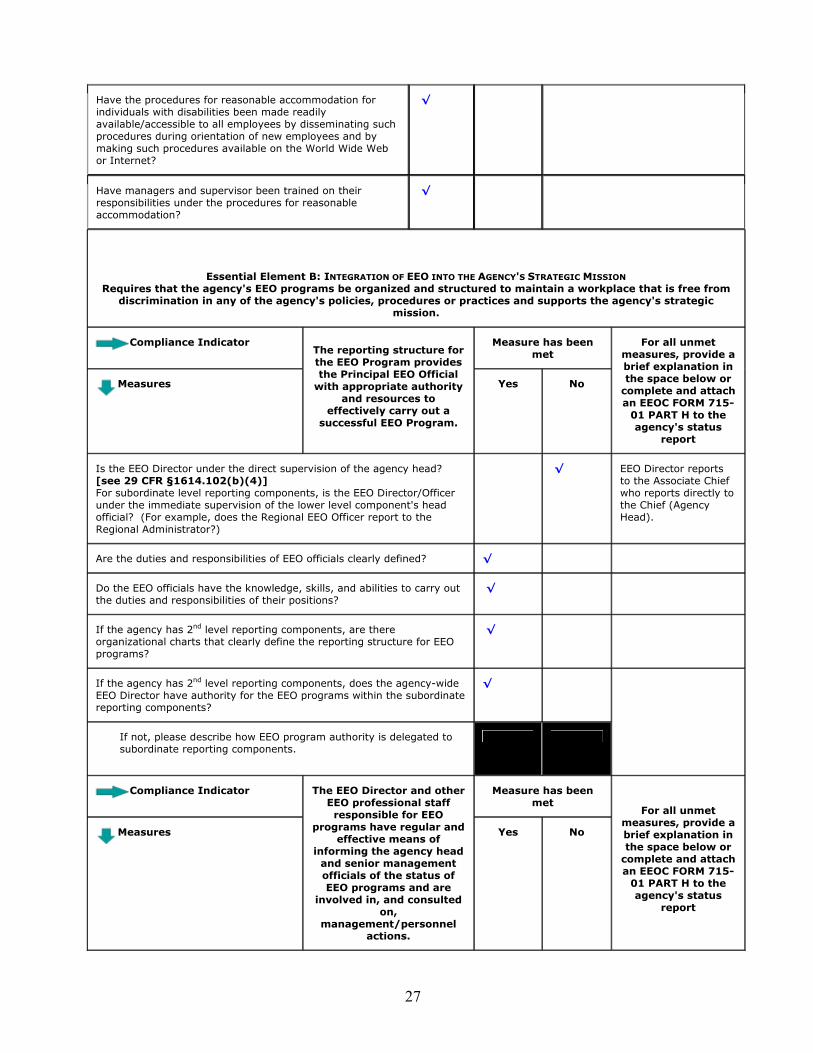
Have the procedures for reasonable accommodation for individuals with disabilities been made readily available/accessible to all employees by disseminating suchprocedures du
ring orientation of new employees and by
making such procedures available on the World Wide Web
√
or Internet?
Have managers and supervisor been trained on their responsibilities under the procedures for reasonable accommodation?
√
Essential Element B: INTEGRATION OF EEO INTO THE AGENCY'S STRATEGIC MISSION zed and stRequires that the agency's EEO programs be organi ructured to maintain a workplace that is free from
discrimination in any of the agency's policies, procedures or practices and supports the agency's strategic mission.
Compliance Indicator Measure has been met
Measures
The reporting structure for
the ial wi
effectively carry out a successful EEO Program.
Yes No complete and attach an -
01 PA the agency's status
the EEO Program provides Principal EEO Offic
th appropriate authority and resources to
For all unmet measures, provide a brief explanation in the space below or
EEOC FORM 715RT H to
report
Is the EEO Director under the direct supervision of the agency head? [see 29 CFR §1614.102(b)(4)] For subordinate level reporting components, is the EEO Director/Officunder the immediate supe
er rvision of the lower level component's head
official? (For example, does the Regional EEO Officer report to the
√ ief
orts directly to the Chief (Agency Head).
Regional Administrator?)
EEO Director reports to the Associate Chwho rep
Are the duties and responsibilities of EEO officials clearly defined? √
Do the EEO officials have the knowledge, skills, and abilities to carry out √ the duties and responsibilities of their positions?
If the agenc ndy has 2 level reporting components, are there organizational charts that clearly define the reporting structure for EEO
√ programs?
If the agency has 2nd level reporting components, does the agency-wide EEO Director have authority for the EEO programs within the subordinate repo
√ rting components?
If not, please describe how EEO program authority is delegated to subordinate reporting components.
Compliance Indicator Measure has been met
Measures
The er
in and senior management
EEO prog and are i
management/personnel
Yes No
complete and attach an -
01 PA the agency's status
report
EEO Director and othEEO professional staff
responsible for EEO programs have regular and
effective means of forming the agency head
officials of the status of rams
nvolved in, and consultedon,
actions.
For all unmet measures, provide a brief explanation in the space below or
EEOC FORM 715RT H to
27

Does the EEO Director/Officer have a regular and effective means of informing the agency head and other top management officials of theffectivene
e
ss, efficiency and legal compliance of the agency's EEO program?
√
Following the submission of the immediately preceding FORM 715-01, did the EEO Director/Officer present to the head of the agencysenior officials the "State of the Agency" briefing covering all components of the EEO report, including an assessment of the performance of the agency in each of the six elements of the Model EEProgram and a report on the progress of the agency in completing its barrier analysis including
and other
O
any barriers it identified and/or eliminated or reduced the impact of?
√
Are EEO program officials present during agency deliberations pridecisions regarding recruitment strategies, vacancy projections, succession planning, selections for training/ca
or to
reer development opportunities, and other workforce changes?
√
Does the agency consider whether any group of employees or applicants might be negatively impacted prior to making human
resource decisions such as re-organizations and re-alignments?
√
Are management/personnel policies, procedures and practices examined at regular intervals to assess whether there are hiddenimpediments to the realization of equality of opportunity group(s) of employee
for any
s or applicants? [see 29 C.F.R. § 1614.102(b)(3)]
√
Is the EEO Director included in the agency's strategic planning, especially the agency's human capital plan, regarding succession planning, training, etc., to ensure
that EEO concerns are integrated into
the agency's strategic mission?
√
Compliance Indicator Measumet
re has been
Measures s
its e successful operation.
Yes No
a
agen tus report
The agency has committed ufficient human resources and budget allocations to
EEO programs to ensur
For all unmet measures, provide a brief explanation in the space below or
complete and attach n EEOC FORM 715-01 PART H to the
cy's sta
Does the EEO Director have the authority and funding to ensure implementation of agency EEO action plans to improve EEO prograefficiency and/or eliminat
m
e identified barriers to the realization of equality of opportunity?
√
Are sufficient personnel resources allocated to the EEO Program to ensure that agency self-assessments and self-analyses prescribed EEO MD-715 are conducted annua
by
lly and to maintain an effective complaint processing system?
√
Are statutory/regulat
ory EEO related Special Emphasis Programs sufficiently staffed?
√
Federal Women's Program - 5 U.S.C. 7201; 38 U.S.C. 4214; Title 5
CFR, Subpart B, 720.204 √
Hispanic Employment Program - Title 5 CFR, Subpart B, 720.204 √
People With Disabilities Program Manager; Selective PlacemenProgram for Individuals With Disabilities - Section 501 of the Rehabilitation Act; Title 5 U.S.C. Subpart B, Chapter
t
31, Subchapter
√
28

I-3102; 5 CFR 213.3102(t) and (u); 5 CFR 315.709
Are other agency special emphasis programs monitored by the EEO Office for coordination and compliance with EEO guidelines and principles, such as FEORP - 5 CFR 720; Veterans Employment Programs; and Black/African American; American Indian/Alaska Native, Asian
ms?
√
ican/Pacific Islander prograAmer
Compli icator Measure has been met
ance Ind
Measures su o support the success of its
EEO Programs. Yes No
complete and attach an -
01 PA the agency's status
report
The agency has committed fficient budget t
For all unmet measures, provide a brief explanation in the space below or
EEOC FORM 715RT H to
Are there sufficient resources to enable the agency to conduct a thorough barrier analysis of its workforce, including the provision of
√ adequate data collection and tracking systems
Is there sufficient budget allocated to all employees to utilize, whedesired, all EEO programs, including the complaint pro
n cessing program
and ADR, and to make a request for reasonable accommodation?
√
(Including subordinate level reporting components?)
Has funding been secured for publication and distribution of EEO materials (e.g. harassment policies, EEO posters, reasonable
√ accommodations procedures, etc.)?
Is there a central fund or other mechanism for funding supplies, tions?
√equipment and services necessary to provide disability accommoda
Does the agency fund major renovation projects to ensure timely √compliance with Uniform Federal Accessibility Standards?
Is the EEO Program allocated sufficient resources to train all employees on EEO Programs, including administrative and judicial remedial proc
√ edures available to employees?
Is there sufficient funding to ensure the prominent posting of written materials in all personnel and EEO offices? [see 29 C.F.R. § 1614.102(b)(5)]
√
Is there sufficient funding to ensure that all employees have access √to this training and information?
Is there sufficient funding to provide all managers and supervisors with train
√ing and periodic up-dates on their EEO responsibilities:
for ensuring a workplace that is free fd retaliation?
√rom all forms of discrimination, including harassment an
to provide religious accommodations? √
to provide disability accommodations in accordance with the √agency's written procedures?
in the EEO discrimination complaint process? √
to participate in ADR? √
29

Essential Element C: MANAGEMENT AND PROGRAM ACCOUNTABILITY This element requires the Agency Head to hold all managers, supervisors, and EEO Officials responsible for the
effective implementation of the agency's EEO Program and Plan.
Compliance Indicator
Measure has been met
Measures EEO program officials advise and provide appropriate assistance to
managers/supervisors about the status of EEO programs within each manager's
or supervisor's area or responsibility.
Yes No
For all unmet measures, provide a brief explanation in the space below or
complete and attach an EEOC FORM 715-
01 PART H to the agency's status
report
Are regular (monthly/quarterly/semi-annually) EEO updates provided to management/supervisory officials by EEO program officials?
√
Do EEO program officials coordinate the development and implementation of EEO Plans with all appropriate agency managers to include Agency Counsel, Human Resource Officials, Finance, and the Chief information Officer?
√
Compliance Indicator
Measure has been met
Measures
The Human Resources Director and the EEO Director meet regularly to assess whether personnel programs, policies, and procedures are in conformity with
instructions contained in EEOC management directives. [see 29 CFR §
1614.102(b)(3)]
Yes No
For all unmet measures, provide a brief explanation in the space below or
complete and attach an EEOC FORM 715-
01 PART H to the agency's status
report
Have time-tables or schedules been established for the agency to review its Merit Promotion Program Policy and Procedures for systemic barriers that may be impeding full participation in promotion opportunities by all groups?
√
Have time-tables or schedules been established for the agency to review its Employee Recognition Awards Program and Procedures for systemic barriers that may be impeding full participation in the program by all groups?
√
Have time-tables or schedules been established for the agency to review its Employee Development/Training Programs for systemic barriers that may be impeding full participation in training opportunities by all groups?
√
Compliance Indicator
Measure has been met
Measures When findings of discrimination are made, the agency explores whether or
not disciplinary actions should be taken. Yes No
For all unmet measures, provide a brief explanation in the space below or
complete and attach an EEOC FORM 715-
01 PART H to the agency's status
report
Does the agency have a disciplinary policy and/or a table of penalties that covers employees found to have committed discrimination?
√
Have all employees, supervisors, and managers been informed as to the penalties for being found to perpetrate discriminatory behavior or for taking personnel actions based upon a prohibited basis?
√
30

Has the agency, when appropriate, disciplined or sanctioned managers/supervisors or employees found to have discriminated over the past two years?
√ There was one finding of discrimination in FY 2009; the case was sent to ER for review.
If so, cite number found to have discriminated and list penalty /disciplinary action for each type of violation.
Does the agency promptly (within the established time frame) comply with EEOC, Merit Systems Protection Board, Federal Labor Relations Authority, labor arbitrators, and District Court orders?
√
Does the agency review disability accommodation decisions/actions to ensure compliance with its written procedures and analyze the information tracked for trends, problems, etc.?
√
Essential Element D: PROACTIVE PREVENTION Requires that the agency head makes early efforts to prevent discriminatory actions and eliminate barriers to
equal employment opportunity in the workplace.
Compliance Indicator
Measure has been met
Measures Analyses to identify and remove unnecessary barriers to employment are conducted throughout the year.
Yes No
For all unmet measures, provide a brief explanation in the space below or
complete and attach an EEOC FORM 715-
01 PART H to the agency's status
report
Do senior managers meet with and assist the EEO Director and/or other EEO Program Officials in the identification of barriers that may be impeding the realization of equal employment opportunity?
√
When barriers are identified, do senior managers develop and implement, with the assistance of the agency EEO office, agency EEO Action Plans to eliminate said barriers?
√
Do senior managers successfully implement EEO Action Plans and incorporate the EEO Action Plan Objectives into agency strategic plans?
√
Are trend analyses of workforce profiles conducted by race, national origin, sex and disability?
√
Are trend analyses of the workforce's major occupations conducted by race, national origin, sex and disability?
√
Are trends analyses of the workforce's grade level distribution conducted by race, national origin, sex and disability?
√
Are trend analyses of the workforce's compensation and reward system conducted by race, national origin, sex and disability?
√
Are trend analyses of the effects of management/personnel policies, procedures and practices conducted by race, national origin, sex and disability?
√
Compliance Indicator The use of Alternative Dispute
Resolution (ADR) is encouraged by senior management. Measure has been
met For all unmet
measures, provide a brief explanation in the space below or
complete and attach
31

an EEOC FORM 715-01 PART H to the agency's status
report
Measures Yes No
Are all employees encouraged to use ADR? √
Is the participation of supervisors and managers in the ADR process required?
√
Essential Element E: EFFICIENCY Requires that the agency head ensure that there are effective systems in place for evaluating the impact and
effectiveness of the agency's EEO Programs as well as an efficient and fair dispute resolution process.
Compliance Indicator Measure has been met
Measures
The agency has sufficient staffing,
funding, and authority to achieve the elimination of identified barriers. Yes No
For all unmet measures, provide a brief explanation in the space below or complete
and attach an EEOC FORM 715-01 PART H to the agency's
status report
Does the EEO Office employ personnel with adequate training and experience to conduct the analyses required by MD-715 and these instructions?
√
Has the agency implemented an adequate data collection and analysis systems that permit tracking of the information required by MD-715 and these instructions?
√
Have sufficient resources been provided to conduct effective audits of field facilities' efforts to achieve a model EEO program and eliminate discrimination under Title VII and the Rehabilitation Act?
√
Is there a designated agency official or other mechanism in place to coordinate or assist with processing requests for disability accommodations in all major components of the agency?
√
Are 90% of accommodation requests processed within the time frame set forth in the agency procedures for reasonable accommodation?
√
Compliance Indicator Measure has been met
Measures
The agency has an effective complaint
tracking and monitoring system in place to
increase the effectiveness of the
agency's EEO Programs.
Yes No
For all unmet measures, provide a brief explanation in the space below or complete
and attach an EEOC FORM 715-01 PART H to the agency's
status report
Does the agency use a complaint tracking and monitoring system that allows identification of the location, and status of complaints and length of time elapsed at each stage of the agency's complaint resolution process?
√
Does the agency's tracking system identify the issues √
32

and bases of the complaints, the aggrieved individuals/complainants, the involved management officials and other information to analyze complaint activity and trends?
Does the agency hold contractors accountable for delay in counseling and investigation processing times?
√
If yes, briefly describe how: In accordance with pre-established Statement of Work and Procurement procedures.
Does the agency monitor and ensure that new investigators, counselors, including contract and collateral duty investigators, receive the 32 hours of training required in accordance with EEO Management Directive MD-110?
√
Does the agency monitor and ensure that experienced counselors, investigators, including contract and collateral duty investigators, receive the 8 hours of refresher training required on an annual basis in accordance with EEO Management Directive MD-110?
√
Compliance Indicator Measure has been met
Measures
The agency has sufficient staffing,
funding and authority to comply with the time frames in accordance
with the EEOC (29 C.F.R. Part 1614) regulations
for processing EEO complaints of employment
discrimination.
Yes No For all unmet measures,
provide a brief explanation in the space below or complete
and attach an EEOC FORM 715-01 PART H to the agency's
status report
Are benchmarks in place that compares the agency's discrimination complaint processes with 29 C.F.R. Part 1614?
√
Does the agency provide timely EEO counseling within 30 days of the initial request or within an agreed upon extension in writing, up to 60 days?
√
Does the agency provide an aggrieved person with written notification of his/her rights and responsibilities in the EEO process in a timely fashion?
√
Does the agency complete the investigations within the applicable prescribed time frame?
√
When a complainant requests a final agency decision, does the agency issue the decision within 60 days of the request?
√ Final Agency Decisions are issued by ASCR and not NRCS.
When a complainant requests a hearing, does the agency immediately upon receipt of the request from the EEOC AJ forward the investigative file to the EEOC Hearing Office?
√
When a settlement agreement is entered into, does the agency timely complete any obligations
√
33

provided for in such agreements?
Does the agency ensure timely compliance with EEOC AJ decisions which are not the subject of an appeal by the agency?
√
Compliance Indicator Measure has been met
Measures
There is an efficient and fair dispute resolution process and effective
systems for evaluating the impact and
effectiveness of the agency's EEO complaint
processing program.
Yes No
For all unmet measures, provide a brief explanation in the space below or complete
and attach an EEOC FORM 715-01 PART H to the agency's
status report
In accordance with 29 C.F.R. §1614.102(b), has the agency established an ADR Program during the pre-complaint and formal complaint stages of the EEO process?
√
Does the agency require all managers and supervisors to receive ADR training in accordance with EEOC (29 C.F.R. Part 1614) regulations, with emphasis on the federal government's interest in encouraging mutual resolution of disputes and the benefits associated with utilizing ADR?
√
After the agency has offered ADR and the complainant has elected to participate in ADR, are the managers required to participate?
√
Does the responsible management official directly involved in the dispute have settlement authority? √ Agency practice that the RMO’s
immediate supervisor serves as the RO.
Compliance Indicator Measure has been met
Measures
The agency has effective systems in place for
maintaining and evaluating the impact
and effectiveness of its EEO programs.
Yes No
For all unmet measures, provide a brief explanation in the space below or complete
and attach an EEOC FORM 715-01 PART H to the agency's
status report
Does the agency have a system of management controls in place to ensure the timely, accurate, complete and consistent reporting of EEO complaint data to the EEOC?
√
Does the agency provide reasonable resources for the EEO complaint process to ensure efficient and successful operation in accordance with 29 C.F.R. § 1614.102(a)(1)?
√
Does the agency EEO office have management controls in place to monitor and ensure that the data received from Human Resources is accurate, timely received, and contains all the required data elements for submitting annual reports to the EEOC?
√
Do the agency's EEO programs address all of the laws enforced by the EEOC?
√
Does the agency identify and monitor significant trends in complaint processing to determine whether the agency is meeting its obligations under Title VII and the Rehabilitation Act?
√
34

Does the agency track recruitment efforts and analyze efforts to identify potential barriers in accordance with MD-715 standards?
√
Does the agency consult with other agencies of similar size on the effectiveness of their EEO programs to identify best practices and share ideas?
√
Compliance Indicator Measure has been met
Measures
The agency ensures that the investigation and
adjudication function of its complaint resolution
process are separate from its legal defense
arm of agency or other offices with conflicting or competing interests.
Yes No
For all unmet measures, provide a brief explanation in the space below or complete
and attach an EEOC FORM 715-01 PART H to the agency's
status report
Are legal sufficiency reviews of EEO matters handled by a functional unit that is separate and apart from the unit which handles agency representation in EEO complaints?
√
Does the agency discrimination complaint process ensure a neutral adjudication function?
√
If applicable, are processing time frames incorporated for the legal counsel's sufficiency review for timely processing of complaints?
Not Applicable the USDA Office of Adjudication and Compliance is responsible for this function.
Essential Element F: RESPONSIVENESS AND LEGAL COMPLIANCE This element requires that federal agencies are in full compliance with EEO statutes and EEOC regulations, policy
guidance, and other written instructions.
Compliance Indicator
Measure has been met
Measures
Agency personnel are accountable for timely compliance with orders
issued by EEOC Administrative Judges. Yes No
For all unmet measures, provide a brief explanation in the space below or complete
and attach an EEOC FORM 715-01 PART H to the agency's
status report
Does the agency have a system of management control to ensure that agency officials timely comply with any orders or directives issued by EEOC Administrative Judges?
√
Compliance Indicator
Measure has been met
Measures
The agency's system of management controls
ensures that the agency timely completes all ordered
corrective action and submits its compliance
report to EEOC within 30 days of such completion.
Yes No
For all unmet measures, provide a brief explanation in the space below or complete
and attach an EEOC FORM 715-01 PART H to the agency's
status report
Does the agency have control over the payroll processing function of the agency? If Yes, answer the two questions below.
√
Are there steps in place to guarantee responsive, timely, and predictable processing of ordered monetary
√
35

relief?
Are procedures in place to promptly process other forms of ordered relief?
√
Compliance Indicator
Measure has been met
Measures
Agency personnel are accountable for the timely
completion of actions required to comply with
orders of EEOC. Yes No
For all unmet measures, provide a brief explanation in the space below or complete
and attach an EEOC FORM 715-01 PART H to the agency's
status report
Is compliance with EEOC orders encompassed in the performance standards of any agency employees?
√
If so, please identify the employees by title in the comments section, and state how performance is measured.
CR Director; stand alone CR/EEO performance standard
Is the unit charged with the responsibility for compliance with EEOC orders located in the EEO office?
√
If not, please identify the unit in which it is located, the number of employees in the unit, and their grade levels in the comments section.
Have the involved employees received any formal training in EEO compliance?
√
Does the agency promptly provide to the EEOC the following documentation for completing compliance:
√
Attorney Fees: Copy of check issued for attorney fees and /or a narrative statement by an appropriate agency official, or agency payment order dating the dollar amount of attorney fees paid?
√
Awards: A narrative statement by an appropriate agency official stating the dollar amount and the criteria used to calculate the award?
√
Back Pay and Interest: Computer print-outs or payroll documents outlining gross back pay and interest, copy of any checks issued, narrative statement by an appropriate agency official of total monies paid?
√
Compensatory Damages: The final agency decision and evidence of payment, if made?
√
Training: Attendance roster at training session(s) or a narrative statement by an appropriate agency official confirming that specific persons or groups of persons attended training on a date certain?
√
Personnel Actions (e.g., Reinstatement, Promotion, Hiring, Reassignment): Copies of SF-50s
√
Posting of Notice of Violation: Original signed and dated notice reflecting the dates that the notice was posted. A copy of the notice will suffice if the original is not available.
√
Supplemental Investigation: 1. Copy of letter to √
36

complainant acknowledging receipt from EEOC of remanded case. 2. Copy of letter to complainant transmitting the Report of Investigation (not the ROI itself unless specified). 3. Copy of request for a hearing (complainant's request or agency's transmittal letter).
Final Agency Decision (FAD): FAD or copy of the complainant's request for a hearing.
√
Restoration of Leave: Print-out or statement identifying the amount of leave restored, if applicable. If not, an explanation or statement.
√
Civil Actions: A complete copy of the civil action complaint demonstrating same issues raised as in compliance matter.
√
Settlement Agreements: Signed and dated agreement with specific dollar amounts, if applicable. Also, appropriate documentation of relief is provided.
√
Footnotes:
1. See 29 C.F.R. § 1614.102.
2. When an agency makes modifications to its procedures, the procedures must be resubmitted to the Commission. See EEOC Policy Guidance on Executive Order 13164: Establishing Procedures to Facilitate the Provision of Reasonable Accommodation (10/20/00), Question 28.
37

EEOC FORM 715-01
PART H
U.S. Equal Employment Opportunity Commission FEDERAL AGENCY ANNUAL
EEO PROGRAM STATUS REPORT
Natural Resource Conservation Service (NRCS)
For period covering October 1, 2008, to September 30, 2009.
EEO PLAN TO ATTAIN THE ESSENTIAL ELEMENTS OF A MODEL EEO PROGRAM
STATEMENT of MODEL PROGRAM ESSENTIAL ELEMENT DEFICIENCY:
The total number of employees in NRCS increased from 11,781 in FY 2008 to 11,855 in FY 2009. The number of women, minorities, and persons with disabilities in all major job categories continues to be low in participation rate.
OBJECTIVE: Begin increasing the number of females, minorities, and persons with disabilities in order to reverse the current trend of low participation rates in these areas.
RESPONSIBLE OFFICIAL: Deputy Chief for Management.
DATE OBJECTIVE INITIATED: January 1, 2009
TARGET DATE FOR COMPLETION OF OBJECTIVE:
September 30, 2010
PLANNED ACTIVITIES TOWARD COMPLETION OF OBJECTIVE: TARGET DATE (Must be specific)
Develop a specific recruitment plan for increasing the number of women, minorities and persons with disabilities in the NRCS workforce.
Completed
Implement the Human Capital Strategic Plan for Recruitment and Retention as outlined in the agency’s report.
Completed
Train managers and supervisors on the MD-715. Completed
REPORT OF ACCOMPLISHMENTS and MODIFICATIONS TO OBJECTIVE A recruitment and retention task force was established in FY 2009 to develop and implement a national recruitment policy. The task force members include the Civil Rights Director, Human Resources Management Division Director, Human Capital Officer and the Outreach Division Director. Development and implement accountability measures to track and report the progress of recruitment efforts. The recruitment strategy has been drafted and is currently being vetted to senior leadership. A two year implementation plan has been developed, with implementation of selected initiatives beginning in the fourth quarter of FY 2009 such as implementation of a New Hire Survey, streamlining job opportunity announcements, use of an Automated Hiring system. NRCS’ Director of Civil Rights and the Human Capital Officer conducted a webinar on the Equal Employment Opportunity Commission’s Management Directive 715 state of the agency and recruitment strategies, May 14, 2009 and May 20, 2009.
38

Participation was mandatory for all State Conservationists and Division Directors and above. The webinar provided information about NRCS’ workforce demographics at all levels of the agency and for all employment aspects (hiring, promotion, career development, and separations). The webinar also included an analysis of identified barriers that impede the full participation of any one particular group of employees in any aspect of employment, and action plans to eliminate such barriers. The group also discussed the agency’s recruitment strategies. As a result of the State of the Agency Briefing conducted by NRCS’ CRD’s Director and Human Capital Officer a task force was developed as a priority of the Chief to offer NRCS leadership recommendations that could be incorporated into the Agency Business Plan for recruitment and retention implementation.
39

EEOC FORM 715-01
PART H
U.S. Equal Employment Opportunity Commission FEDERAL AGENCY ANNUAL
EEO PROGRAM STATUS REPORT
Natural Resource Conservation Service (NRCS)
For period covering October 1, 2008, to September 30, 2009.
EEO PLAN TO ATTAIN THE ESSENTIAL ELEMENTS OF A MODEL EEO PROGRAM
STATEMENT of MODEL PROGRAM ESSENTIAL ELEMENT DEFICIENCY:
There is low participation and in some cases no participation of women, minorities, and persons with disabilities in agency leadership positions.
OBJECTIVE: Establish a national internal leadership program comprised of training and promotion opportunities designed to attract qualified women, minorities, and people with disabilities. Retentions will improve as opportunities for advancement improve.
RESPONSIBLE OFFICIAL: Deputy Chief for Management.
DATE OBJECTIVE INITIATED: January 1, 2009
TARGET DATE FOR COMPLETION OF OBJECTIVE:
September 30, 2010
PLANNED ACTIVITIES TOWARD COMPLETION OF OBJECTIVE: TARGET DATE (Must be specific)
Gain commitment to diversity from agency leaders and selecting officials through diversity training awareness.
September 30, 2010
Determine the feasibility of establishing more developmental level positions (GS-7 and GS-9) in order to locate and recruit applicants that may have the educational requirements, but not the experience to qualify at higher grade levels, in order to position these employees to fill in behind more experienced employees in the same field who leave the Agency.
September 30, 2010
Design and implement a tracking system for all Human Resources offices to use in order to retrieve and analyze data regarding the RSNOD of applicants and documenting the actions of selecting officials and activities of recruiters. Recommend that reports of findings be sent to the Human Resources and Civil Rights Divisions on a quarterly basis; and analyzed and compiled into the annual performance report.
September 30, 2010
REPORT OF ACCOMPLISHMENTS and MODIFICATIONS TO OBJECTIVE
The National Leadership Development Program (NLDP) is a major component in an agency-wide strategic approach to developing leadership talent for the future of NRCS. There are 30 diverse participants in the program and half are women. The program theme is “Leaders Growing Leaders.” The Agency leadership at the State Conservationist level and above plays an active role in the program, serving as behavioral interviewers, learning coaches, mentors, action learning project sponsors, tutors, speakers, presenters, facilitators, and panel members. The NLDP is a 15-month training program. The target audience includes high performing, high potential employees at the GS-13 and GS-14 grade levels. Exceptional GS-12s are also considered. Participants are selected through a rigorous application and nomination process. The NLDP guarantees the participant a unique opportunity to develop leadership competencies, but there is no guarantee of placement for a promotion or a particular position. Participants are not required to complete a Mobility or Service Agreement. The training program includes, but is not limited to:
Four residential sessions [Orientation Training (one week), Cohort Workshop (one week), Policy Seminar (two weeks), Capstone Symposium (one week)];
40

Assessment instruments for developmental purposes; One 3-month detail; Action learning team project; Online learning and required reading; and Comprehensive learning review.
NRCS concluded a National Mentoring Framework Program pilot during fiscal year 2008 and during fiscal year 2009 rolled out the program on a national basis. Each state and national headquarters established mentor coordinators who, after receiving training, are to manage program agency-wide. In the first year, approximately 600 NRCS’ employees are involved in the program as mentors, protégés mentor coordinators. This program is designed to enhance the career development of employees; provide a forum for knowledge transfer; and is a retention tool while providing support and guidance that employees need.
NRCS has four employee National Organization Groups (i.e., Asian, American Indian, Black, and Hispanic). In 2009 the President of the National Organizations Groups, with the assistance of NRCS staff members, conducted a career development survey to provide members and NRCS leadership a better understanding of the career status and goals of the members of the above minority groups in the Agency. Following is an example of the results of the National Organization of Hispanic NRCS Employees (NOPHNCSE). Approximately 85 respondents completed the survey. A profile of respondents indicates that they are highly mobile, young, higher graded Hispanics, who generally want to advance in NRCS. Compared to other studies, more respondents in this current survey are supervisors and over 70 percent are located at the field or area office. The respondents are less likely to retire during the next decade, compared to NRCS' general workforce. Respondents identified several obstacles to career advancement: (1) low opportunity to serve on out-of-state details, (2) unavailability of leadership programs, and (3) lack of support for taking specialized college classes or participating in educational degree programs. If the agency did offer a leadership program and a mentoring program, well over half the respondents would participate over the next 2 years. Respondents also gave high support for NOPHNRCSE sponsorship of a mentoring program.
The four NRCS’ President of National Organization Groups employee resource groups, with the support of NRCS leadership, host annual employee development conferences. These conferences also provide employees the opportunity to network and speak with NRCS leaders and employees who can serve as role models and mentors.
41

EEOC FORM
715-01 PART H
U.S. Equal Employment Opportunity Commission FEDERAL AGENCY ANNUAL
EEO PROGRAM STATUS REPORT
Natural Resource Conservation Service (NRCS)
For period covering October 1, 2008, to September 30, 2009.
EEO PLAN TO ATTAIN THE ESSENTIAL ELEMENTS OF A MODEL EEO PROGRAM
STATEMENT of MODEL PROGRAM ESSENTIAL ELEMENT DEFICIENCY:
The total number of employees in NRCS increased from 11,781 in FY 2008 to 11,855 in FY 2009. The number of women, minorities, and persons with disabilities in all major job categories continues to be significantly low in participation rate.
OBJECTIVE: Retain a diverse workforce by implementing a national retention plan.
RESPONSIBLE OFFICIAL: Deputy Chief for Management
DATE OBJECTIVE INITIATED: January 1, 2009
TARGET DATE FOR COMPLETION OF OBJECTIVE:
September 30, 2010
PLANNED ACTIVITIES TOWARD COMPLETION OF OBJECTIVE: TARGET DATE (Must be specific)
National SEPMs partner with the Human Capital Officer to complete work on the Strategic Plan for Retention as outlined in the Human Capital Strategic Plan report through joint quarterly meetings.
Completed
Determine the feasibility of establishing more developmental level positions (GS-7 and GS-9) in order to locate and recruit applicants that may have the educational requirements, but not the experience to qualify at higher grade levels, in order position these employees to fill in behind more experienced employees in the same field who leave the Agency.
September 30, 2010
Identify those series which have the highest turnover rate and determine if applicable pay incentives (i.e. retention allowance) would be effective in retaining these employees.
June 15, 2010
Identify those series which are most difficult to fill and determine if pay incentives (i.e. special salary rates, relocation bonuses, etc) would increase the applicant pools for these positions.
June 15, 2010
REPORT OF ACCOMPLISHMENTS and MODIFICATIONS TO OBJECTIVE The recruitment and retention task force was established in FY 2009 to develop and implement a national recruitment and retention policy. The task force members include the Civil Rights Director, Human Capital Officer and the Outreach Division Director. NRCS Human Resources Office hired a full time staff member to focus on recruitment and retention. An agency-wide survey was conducted to collect data from staff regarding retention issues. The survey results are being analyzed and will result in future development of retention strategies. NRCS’ CRD National Federal Women’s Program Manager is a civil rights advisor to the Recruitment and Retention Cadre and is participating in the development of the strategic plan to recruit and retain employees. The Strategic Plan development began in March 2009 and plans to have a strategy documented by FY 2009.
NRCS Human Capital Office has designated a staff member as the National Mentor Coordinator. Working with a contractor, a national mentoring framework has been developed. Each State has selected state mentoring coordinators and two mentoring coordinators have been selected for National Headquarter employees. Training sessions to train the Mentoring Coordinators have been completed. The mentor program was opened for mentors and protégés to sign up beginning June
42

2009. The implementation of the mentoring program should begin in FY 2010. This mentoring program will be used in conjunction with what States are already doing.
43
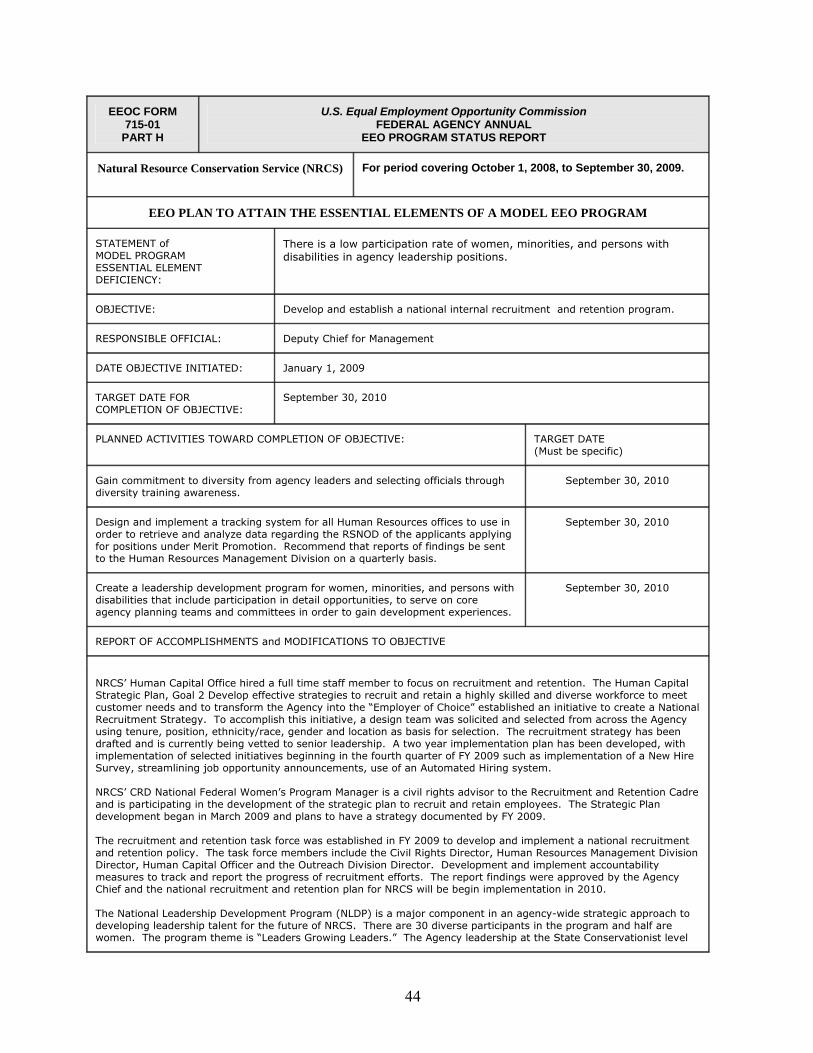
EEOC FORM 715-01
PART H
U.S. Equal Employment Opportunity Commission FEDERAL AGENCY ANNUAL
EEO PROGRAM STATUS REPORT
Natural Resource Conservation Service (NRCS)
For period covering October 1, 2008, to September 30, 2009.
EEO PLAN TO ATTAIN THE ESSENTIAL ELEMENTS OF A MODEL EEO PROGRAM
STATEMENT of MODEL PROGRAM ESSENTIAL ELEMENT DEFICIENCY:
There is a low participation rate of women, minorities, and persons with disabilities in agency leadership positions.
OBJECTIVE: Develop and establish a national internal recruitment and retention program.
RESPONSIBLE OFFICIAL: Deputy Chief for Management
DATE OBJECTIVE INITIATED: January 1, 2009
TARGET DATE FOR COMPLETION OF OBJECTIVE:
September 30, 2010
PLANNED ACTIVITIES TOWARD COMPLETION OF OBJECTIVE: TARGET DATE (Must be specific)
Gain commitment to diversity from agency leaders and selecting officials through diversity training awareness.
September 30, 2010
Design and implement a tracking system for all Human Resources offices to use in order to retrieve and analyze data regarding the RSNOD of the applicants applying for positions under Merit Promotion. Recommend that reports of findings be sent to the Human Resources Management Division on a quarterly basis.
September 30, 2010
Create a leadership development program for women, minorities, and persons with disabilities that include participation in detail opportunities, to serve on core agency planning teams and committees in order to gain development experiences.
September 30, 2010
REPORT OF ACCOMPLISHMENTS and MODIFICATIONS TO OBJECTIVE
NRCS’ Human Capital Office hired a full time staff member to focus on recruitment and retention. The Human Capital Strategic Plan, Goal 2 Develop effective strategies to recruit and retain a highly skilled and diverse workforce to meet customer needs and to transform the Agency into the “Employer of Choice” established an initiative to create a National Recruitment Strategy. To accomplish this initiative, a design team was solicited and selected from across the Agency using tenure, position, ethnicity/race, gender and location as basis for selection. The recruitment strategy has been drafted and is currently being vetted to senior leadership. A two year implementation plan has been developed, with implementation of selected initiatives beginning in the fourth quarter of FY 2009 such as implementation of a New Hire Survey, streamlining job opportunity announcements, use of an Automated Hiring system. NRCS’ CRD National Federal Women’s Program Manager is a civil rights advisor to the Recruitment and Retention Cadre and is participating in the development of the strategic plan to recruit and retain employees. The Strategic Plan development began in March 2009 and plans to have a strategy documented by FY 2009. The recruitment and retention task force was established in FY 2009 to develop and implement a national recruitment and retention policy. The task force members include the Civil Rights Director, Human Resources Management Division Director, Human Capital Officer and the Outreach Division Director. Development and implement accountability measures to track and report the progress of recruitment efforts. The report findings were approved by the Agency Chief and the national recruitment and retention plan for NRCS will be begin implementation in 2010. The National Leadership Development Program (NLDP) is a major component in an agency-wide strategic approach to developing leadership talent for the future of NRCS. There are 30 diverse participants in the program and half are women. The program theme is “Leaders Growing Leaders.” The Agency leadership at the State Conservationist level
44

and above plays an active role in the program, serving as behavioral interviewers, learning coaches, mentors, action learning project sponsors, tutors, speakers, presenters, facilitators, and panel members. The NLDP is a 15-month training program. The target audience includes high performing, high potential employees at the GS-13 and GS-14 grade levels. Exceptional GS-12s are also considered. Participants are selected through a rigorous application and nomination process. The NLDP guarantees the participant a unique opportunity to develop leadership competencies, but there is no guarantee of placement for a promotion or a particular position. Participants are not required to complete a Mobility or Service Agreement. The training program includes, but is not limited to:
Four residential sessions [Orientation Training (one week), Cohort Workshop (one week), Policy Seminar (two weeks), Capstone Symposium (one week)];
Assessment instruments for developmental purposes; One 3-month detail; Action learning team project; Online learning and required reading; and Comprehensive learning review.
45

EEOC FORM 715-01 PART I
U.S. Equal Employment Opportunity Commission FEDERAL AGENCY ANNUAL
EEO PROGRAM STATUS REPORT
Natural Resource Conservation Service (NRCS)
For period covering October 1, 2008, to September 30, 2009.
EEO PLAN TO ELIMINATE IDENTIFIED BARRIER
STATEMENT OF
CONDITION THAT WAS
A TRIGGER FOR A
POTENTIAL BARRIER:
Provide a brief narrative
describing the condition at
issue.
How was the condition
recognized as a potential
barrier?
There is low participation of women, minorities, and persons with disabilities in agency leadership positions and agency major occupations.
BARRIER ANALYSIS:
Provide a description of the
steps taken and data
analyzed to determine
cause of the condition.
Occupational Groups (Tables A3-1, A3-2) – Distribution by Race/Ethnicity and Sex; Participation Rates Across General Schedule (GS) Grades (Table A4-1P, A4-1T, A4-2P, A4-2T, )– by Race/National Origin and Sex; and Participation Rates for Major Occupations (Table A6P and A6T) Distribution by Race/National Origin and Sex.
STATEMENT OF
IDENTIFIED BARRIER:
Provide a succinct
statement of the agency
policy, procedure or
practice that has been
determined to be the
barrier of the undesired
condition.
OBJECTIVE: State the FY 2009: Provide MD-715 and diversity training to all leaders, supervisors, and selecting officials and accountability measures to determine accomplishments.
46

alternative or revised
agency policy, procedure
or practice to be
implemented to correct the
undesired condition.
Create and implement a leadership development program for women, minorities and persons with disabilities. To ensure that managers, supervisors and human resources staff are included when barriers are being identified by civil rights division.
FY 2010: Develop a diverse pool of qualified successors for NRCS’ leadership positions.
RESPONSIBLE OFFICIAL: Deputy Chief for Management
DATE OBJECTIVE INITIATED:
January 1, 2009
TARGET DATE FOR COMPLETION OF OBJECTIVE:
September 30, 2009
PLANNED ACTIVITIES TOWARD COMPLETION OF OBJECTIVE: TARGET DATE
Provide mandatory training to all leaders, supervisors and selecting officials on diversity and MD-175.
Completed
Strengthen partnerships with groups that can assist us in improving diversity in the agency Completed
Use the applicant tracking feature of Quick-Hire to track and identify applicant pool to ensure that women, minorities and persons with disabilities are applying and being selected for positions throughout the agency
September 30, 2010
REPORT OF ACCOMPLISHMENTS and MODIFICATIONS TO OBJECTIVE
NRCS’ Director of Civil Rights and the Human Capital Officer conducted a webinar on the Equal Employment Opportunity Commission’s Management Directive 715 state of the agency and recruitment strategies, May 14, 2009 and May 20, 2009. Participation was mandatory for all State Conservationists and Division Directors and above. The webinar provided information about NRCS’ workforce demographics at all levels of the agency and for all employment aspects (hiring, promotion, career development, and separations). The webinar also included an analysis of identified barriers that impede the full participation of any one particular group of employees in any aspect of employment, and action plans to eliminate such barriers. The group also discussed the agency’s recruitment strategies. The National Leadership Development Program (NLDP) is a major component in an agency-wide strategic approach to developing leadership talent for the future of NRCS. There are 30 diverse participants in the program and half are women. The program theme is “Leaders Growing Leaders.” The Agency leadership at the State Conservationist level and above plays an active role in the program, serving as behavioral interviewers, learning coaches, mentors, action learning project sponsors, tutors, speakers, presenters, facilitators, and panel members. The NLDP is a 15-month training program. The target audience includes high performing, high potential employees at the GS-13 and GS-14 grade levels. Exceptional GS-12s are also considered. Participants are selected through a rigorous application and nomination process. The NLDP guarantees the participant a unique opportunity to develop leadership competencies, but there is no guarantee of placement for a promotion or a particular position. Participants are not required to complete a Mobility or Service Agreement. The training program includes, but is not limited to:
Four residential sessions [Orientation Training (one week), Cohort Workshop (one week), Policy Seminar (two weeks), Capstone Symposium (one week)];
Assessment instruments for developmental purposes; One 3-month detail; Action learning team project; Online learning and required reading; and Comprehensive learning review.
47

NRCS concluded a National Mentoring Framework Program pilot during fiscal year 2008 and during fiscal year 2009 rolled out the program on a national basis. Each state and national headquarters established mentor coordinators who, after receiving training, are to manage program agency-wide. In the first year, approximately 600 NRCS employees are involved in the program as mentors, protégés mentor coordinators. This program is designed to enhance the career development of employees; provide a forum for knowledge transfer; and is a retention tool while providing support and guidance that employees need.
NRCS has four President of National Organization Groups (i.e., Asian, American Indian, Black, and Hispanic). In 2009 the organizations, with the assistance of NRCS professional staff members, conducted a career development survey to provide members and NRCS leadership a better understanding of the career status and goals of the members of the above minority groups in the Agency. Following is an example of the results of the National Organization of Hispanic NRCS Employees (NOPHNCSE). Approximately 85 respondents completed the survey. A profile of respondents indicates that they are highly mobile, young, higher graded Hispanics, who generally want to advance in NRCS. Compared to other studies, more respondents in this current survey are supervisors and over 70 percent are located at the field or area office. The respondents are less likely to retire during the next decade, compared to NRCS' general workforce. Respondents identified several obstacles to career advancement: (1) low opportunity to serve on out-of-state details, (2) unavailability of leadership programs, and (3) lack of support for taking specialized college classes or participating in educational degree programs. If the agency did offer a leadership program and a mentoring program, well over half the respondents would participate over the next 2 years. Respondents also gave high support for NOPHNRCSE sponsorship of a mentoring program. The employee resource groups surveys will be used to help develop initiatives to address their concerns.
The four NRCS employee resource groups, with the support of NRCS leadership, host annual employee development conferences. These conferences also provide employees the opportunity to network and speak with NRCS leaders and employees who can serve as role models and mentors.
48

EEOC FORM 715-01 PART I
U.S. Equal Employment Opportunity Commission FEDERAL AGENCY ANNUAL
EEO PROGRAM STATUS REPORT
Natural Resource Conservation Service (NRCS)
For period covering October 1, 2008, to September 30, 2009.
EEO PLAN TO ELIMINATE IDENTIFIED BARRIER
STATEMENT OF
CONDITION THAT WAS
A TRIGGER FOR A
POTENTIAL BARRIER:
Provide a brief narrative
describing the condition at
issue.
How was the condition
recognized as a potential
barrier?
The total number of employees in NRCS increased from 11,781 in FY 2008 to 11,855 in FY 2009. The number of women, minorities, and persons with disabilities in all major job categories continues to be significantly low in participation rate.
BARRIER ANALYSIS:
Provide a description of the
steps taken and data
analyzed to determine
cause of the condition.
Analysis of the Total Workforce (Table A1, B1), illustrating distribution by Race/Ethnicity and Sex; and New Hires by Type of Appointment (Table A8, B8) – by Race/Ethnicity and Sex.
STATEMENT OF
IDENTIFIED BARRIER:
Provide a succinct
statement of the agency
policy, procedure or
practice that has been
determined to be the
barrier of the undesired
condition.
NRCS continues to focus on the technical and professional development of women, minorities, persons with disabilities. The Agency did not have a national recruitment plan in place for FY 2008.
OBJECTIVE: State the
alternative or revised
A task force has been established to develop and implement a national recruitment policy. The task force members include the Civil Rights Director, Human Capital Officer, and the Outreach Division Director. Development and implement accountability measures to track and report the progress of recruitment efforts. NRCS implemented a
49

agency policy, procedure
or practice to be
implemented to correct the
undesired condition.
comprehensive Human Capital Plan wherein human capital objectives from the Proud-to-Be VI goals are included in the draft Agency National Business Plan for FY 2009. In addition an Implementation Plan has been drafted in conjunction with the 5-year Investment Strategy.
RESPONSIBLE OFFICIAL: Civil Rights Director and Deputy Chief for Management
DATE OBJECTIVE INITIATED:
January 1, 2009
TARGET DATE FOR COMPLETION OF OBJECTIVE:
September 30, 2010
PLANNED ACTIVITIES TOWARD COMPLETION OF OBJECTIVE: TARGET DATE
Develop and implement a national recruitment policy, strategy and cadre. Completed
Implement the national recruitment policy and strategies. September 30, 2010
Conduct Human Resources training throughout the Agency on the use and importance of using the Workforce Recruitment Program for College Students with Disabilities, Schedule A and other Hiring Authorities to increase the number of persons with disabilities in the workforce.
September 1, 2010
Provided a briefing to hiring officials on the use and value of special hiring authorities. (Schedule A , Veterans preferences, VEOA etc)
July 30, 2010
Target hiring Veterans and persons with Targeted Disabilities for those series which are most difficult to fill and determine if pay incentives (i.e. special salary rates, relocation bonuses, etc) would increase the applicant pools for these positions.
July 30, 2010
Design and implement a tracking system for all Human Resources offices to use in order to retrieve and analyze data regarding the RSNOD (applicant flow data) of the applicants applying for positions under Merit Promotion.
September 30, 2010
Design and mass-produce media material aimed at women, minorities and persons with disabilities promoting NRCS major occupation positions.
September 30, 2010
Develop and implement specific recruitment plans for women, minorities, and persons with disabilities.
September 30, 2010
REPORT OF ACCOMPLISHMENTS and MODIFICATIONS TO OBJECTIVE
The recruitment and retention task force was established in FY 2009 to develop and implement a national recruitment and retention policy. The task force members include the Civil Rights Director, Human Capital Officer and the Outreach Division Director. Development and implement accountability measures to track and report the progress of recruitment efforts. NRCS Human Capital Office hired a full time staff member to focus on recruitment and retention. The Human Capital Strategic Plan, Goal 2 “Develop effective strategies to recruit and retain a highly skilled and diverse workforce to meet customer needs and to transform the Agency into the “Employer of Choice” established an initiative to create a National Recruitment Strategy. To accomplish this initiative, a design team was solicited and selected from across the Agency using tenure, position, ethnicity/race, gender and location as basis for selection. The recruitment strategy has been drafted and is currently being vetted to senior leadership. A two year implementation plan has been developed, with implementation of selected initiatives beginning in the fourth quarter of FY 2009 such as implementation of a New
50
Hire Survey, streamlining job opportunity announcements, use of an Automated Hiring system. NRCS’ CRD National Federal Women’s Program Manager is a civil rights advisor to the Recruitment and Retention Cadre and is participating in the development of the strategic plan to recruit and retain employees. The Strategic Plan development began in March 2009 and plans to have a strategy documented by FY 2009. The Workforce Recruitment Program for College Students with Disabilities database is provided to all Disability Emphasis Program Managers (DEPMs) and the link is identified on the NRCS CRD Web site. On March 18, the 2009 Workforce Recruitment Program for College Students with Disabilities (WRP) data was available on the website (www.wrp.gov). It provides information on over 1,800 college students with disabilities who are seeking summer or permanent employment in federal agencies nationwide. In order to access the database you must request your ID/PW through the above-noted Web site. Because of the confidential information within the database access is restricted to DEPMs, HRM and hiring officials. A module on the use and significance of the WRP was developed and provided to all levels of the Agency. This resulted in one (1) WRP summer hire. CRD’s Director submitted an issue paper explaining the changes to the ADA in 2008. The information on the Americans with Disability Act Amendment Act of 2008 was sent out to Directors and above from the Chief including a link to the Job Accommodation Network (JAN) Web site for additional information. An issue paper was submitted to the Chief on Inter-Agency Accessibility Review Teams, following prior year agreement by NRCS, RD and FSA on the use of accessibility checklist AD-2056 for National level Civil Rights compliance reviews. The Disabled Veterans Affirmative Action Plan was provided to Veterans Employment Program Managers, Disability Employment Program Managers and Human Resources Ms in each state to improve outreach efforts in recruiting Veterans. NRCS NDEPM provided training to USDA NDEPMs and NRCS collateral duty DEPMs and VEMPs the day prior to the Perspectives Conference on the Employment of Persons with Disabilities held in Bethesda, MD. Resumes of persons with targeted disabilities were provided to all collateral duty Disability Emphasis Program Managers, Veteran Emphasis Program Managers (DEPM, VEPM) and the NRCS selective placement coordinator for consideration. Training and specific information was provided to collateral duty DEPMs & VEPMs during teleconferences with the National DEPM on how to search for qualified individuals with targeted disabilities. NRCS’ Civil Rights Division coordinates participation at a number of diverse colleges, universities, and associations throughout the year. The Civil Rights Division developed, from the visits to the diverse events, a Student Database listing qualified women and minority students. The database has proven to be a good source to recruit women and minority interns and new permanent employees. The database is provided to NRCS leadership in an effort to move us towards our goal of becoming an employer of choice and ensure that we are actively seeking the best talent from the diverse communities we serve. Following are a few of the events we attended: New Mexico State University Career Fair, Las Cruces, NM University of Texas Career Fair, El Paso, TX University of Puerto Rico Career Fair, Mayaguez, PR Texas A&M University Career Fair, Kingsville, TX California State Polytechnic University Career Fair, Pomona, CA American Indian Science and Engineering Society (Attended several events.) 8th Annual Thurgood Marshall Leadership Institute and Recruitment Conference Trip Report Summary Minorities in Agriculture, Natural Resources and Related Sciences (MANRRS) League of United Latin American Citizens (LULAC) Society of American Indian Government Employees (NRCS employees attended.) Federal Asian Pacific American Council (FAPAC) Federally Employed Women (FEW) 2009 Partners for Public Service Career and Internship Fair Additionally, NRCS has 300 State collateral duty special emphasis program managers. Many of those individuals participate in recruiting for SCEP and STEP students hired for summer work. Each state that hires students ensures that they are a diverse group that consists of women, minorities, and people with disabilities. Students are regularly converted upon graduation so the student hiring is a useful tool in our efforts to increase diversity in permanent staff as well. NRCS is sponsoring two USDA Public Service Leaders Scholarship Program (PSLSP) students. One of the students we anticipate will complete the program later this year making him eligible for non-competitive conversion appointment as a Soil Conservationist by the agency. The other student was converted to a new hire this year. The USDA PSLSP combines an internship with a scholarship to fill critical positions. This is a win-win program for the agency as the investment made in a student returns to the agency as a new permanent employee well prepared to contribute to that agency’s mission and goals. NRCS provided a career work experience in addition to a scholarship covering: college tuition, books, and
51
related fees and travel. The students’ initial appointment under the SCEP program allowed them to gain valuable hands-on experience and knowledge of the agency. The scholars are eligible for non-competitive conversion appointment in the agency within 120 days of graduation. NRCS is also sponsoring the following student scholarships: 1890 National Scholars Program. We have nine students in the program and two, of the nine students, were
hired/converted. Asian Pacific Islander Scholar (API). We have four students in the program and three, of the four students, were
hired/converted. Basu Settlement Agreement Graduate Scholarships to Asian American/Pacific Islander students. NRCS awarded four
graduate scholarships to AA/PI students; two of these students were also on the rolls for the SCEP internship. There were a total of nine students involved in the Basu Scholarship Program, seven in FY 2009.
Hispanic Association of Colleges and Universities (HACU). We had one HACU student intern. USDA 1994 Land Grant Institutions (Tribal Colleges) Programs. Please check with the Outreach Office;
they coordinate this program. There appears to be four students in this program. NRCS has purchased license agreemeHR staff and within the 2009 calendar year, plans to have an automated hiring system in place. This will ensure that applicants are notified throughout the hiring process and will also ensure that we are able to collect applicant demograpdata. USA Staffing, our new hiring system, collects data from each applicant (on a voluntary basis). The demographic not available individually but can be accessed after the selection is made in a consolidated manner.
52
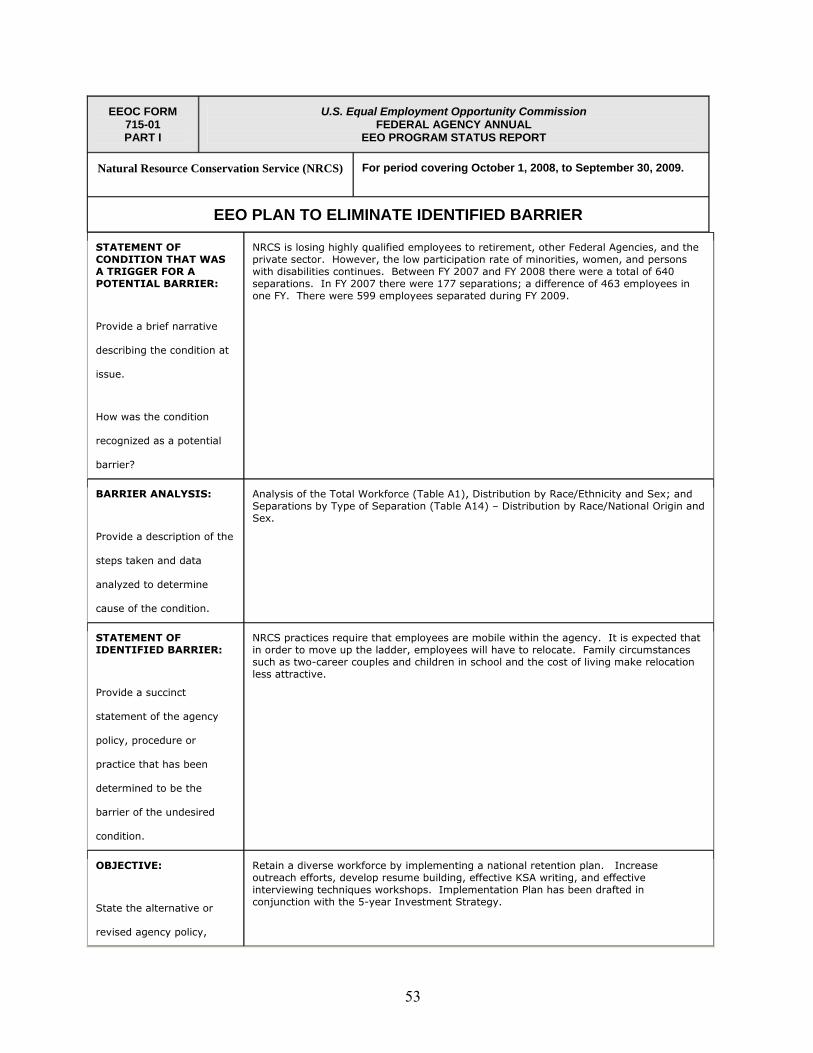
EEOC FORM 715-01 PART I
U.S. Equal Employment Opportunity Commission FEDERAL AGENCY ANNUAL
EEO PROGRAM STATUS REPORT
Natural Resource Conservation Service (NRCS)
For period covering October 1, 2008, to September 30, 2009.
EEO PLAN TO ELIMINATE IDENTIFIED BARRIER
STATEMENT OF CONDITION THAT WAS A TRIGGER FOR A POTENTIAL BARRIER:
Provide a brief narrative
describing the condition at
issue.
How was the condition
recognized as a potential
barrier?
NRCS is losing highly qualified employees to retirement, other Federal Agencies, and the private sector. However, the low participation rate of minorities, women, and persons with disabilities continues. Between FY 2007 and FY 2008 there were a total of 640 separations. In FY 2007 there were 177 separations; a difference of 463 employees in one FY. There were 599 employees separated during FY 2009.
BARRIER ANALYSIS:
Provide a description of the
steps taken and data
analyzed to determine
cause of the condition.
Analysis of the Total Workforce (Table A1), Distribution by Race/Ethnicity and Sex; and Separations by Type of Separation (Table A14) – Distribution by Race/National Origin and Sex.
STATEMENT OF IDENTIFIED BARRIER:
Provide a succinct
statement of the agency
policy, procedure or
practice that has been
determined to be the
barrier of the undesired
condition.
NRCS practices require that employees are mobile within the agency. It is expected that in order to move up the ladder, employees will have to relocate. Family circumstances such as two-career couples and children in school and the cost of living make relocation less attractive.
OBJECTIVE:
State the alternative or
revised agency policy,
Retain a diverse workforce by implementing a national retention plan. Increase outreach efforts, develop resume building, effective KSA writing, and effective interviewing techniques workshops. Implementation Plan has been drafted in conjunction with the 5-year Investment Strategy.
53

procedure or practice to be
implemented to correct the
undesired condition.
RESPONSIBLE OFFICIAL:
Director of Civil Rights and Deputy Chief for Management
DATE OBJECTIVE INITIATED:
January 1, 2009
TARGET DATE FOR COMPLETION OF OBJECTIVE:
September 30, 2010
PLANNED ACTIVITIES TOWARD COMPLETION OF OBJECTIVE: TARGET DATE (Must be specific)
Determine the feasibility of establishing more developmental level positions in order to locate and recruit applicants that may have the educational requirements, but not the experience to qualify at higher grade levels, in order to groom these employees to fill in behind more experienced employees in the same field who leave the Agency.
September 30, 2010
Include in vacancy announcements, advertised through USAJobs, information that illustrates persons with a targeted disability are eligible to apply for the positions.
Completed
Identify those series which have the highest turnover rate and determine if such any pay incentives (i.e. retention allowance) would be effective in retaining these employees
July 30, 2010
Identify those series which are most difficult to fill and determine if pay incentives (i.e. special salary rates, relocation bonuses, etc) would increase the applicant pools for these positions.
July 30, 2010
REPORT OF ACCOMPLISHMENTS and MODIFICATIONS TO OBJECTIVE
NRCS’ Human Capital Office has hired a full time staff member to focus on recruitment and retention. An agency-wide survey was conducted to collect data from staff regarding retention issues. The survey results are being analyzed and will result in future development of retention strategies.
NRCS’ Human Capital Office has designated a staff member as the National Mentor Coordinator. Working with a contractor, a national mentoring framework has been developed. Each State has selected state mentoring coordinators and two mentoring coordinators have been selected for National Headquarter employees. Training sessions to train the Mentoring Coordinators have been completed. The mentor program was opened for mentors and protégés to sign up beginning June 2009. The implementation of the mentoring program should begin in FY 2010. This mentoring program will be used in conjunction with what States are already doing.
The National Federal Women’s Program Manager (NFWPM) created and presents a workshop called “Writing Effective KSAs, Applying for Federal Jobs Online, and Preparing for your Job Interview.” This two-hour workshop along with a corresponding handbook was given to 200 HACU students and 100 USDA employees.
NRCS has four President of National Organization Groups (i.e., Asian, American Indian, Black, and Hispanic). These NRCS resource groups provide employees the opportunity to network and speak with NRCS leaders and employees who can serve as role models and mentors. These groups are helping address this barrier by providing support and examples of successful employment relocations.
54
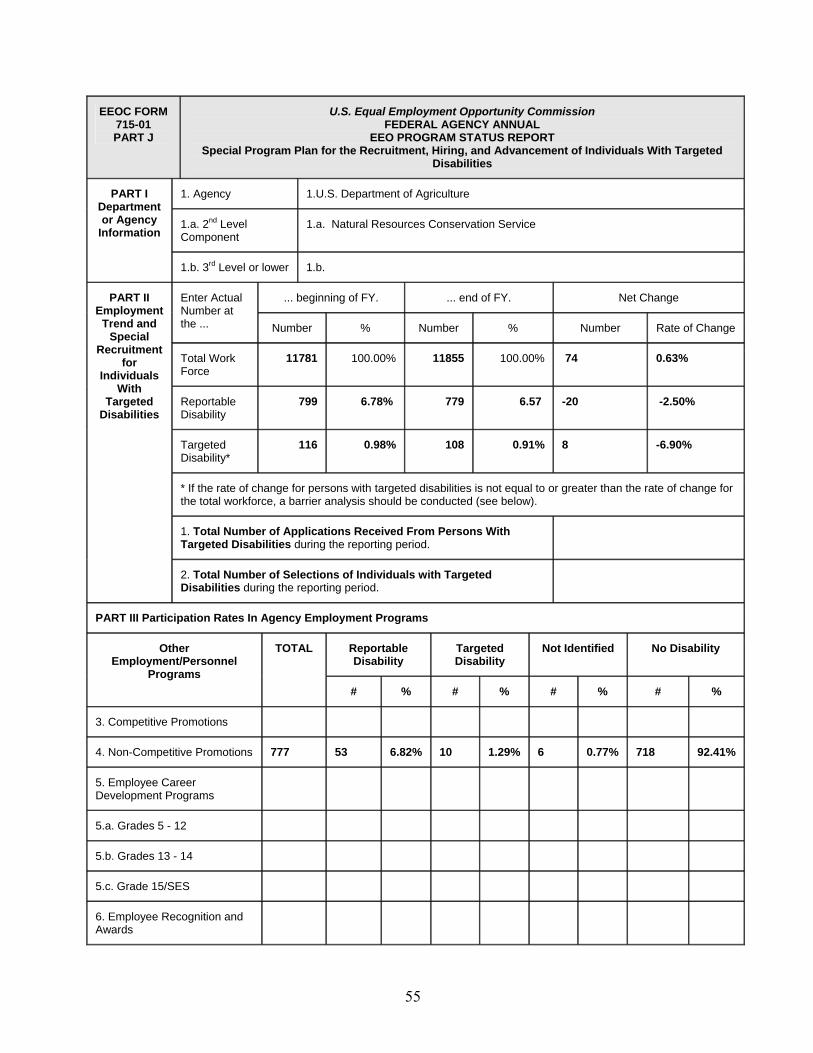
EEOC FORM 715-01 PART J
U.S. Equal Employment Opportunity Commission FEDERAL AGENCY ANNUAL
EEO PROGRAM STATUS REPORT Special Program Plan for the Recruitment, Hiring, and Advancement of Individuals With Targeted
Disabilities
1. Agency 1.U.S. Department of Agriculture
1.a. 2nd Level Component
1.a. Natural Resources Conservation Service
PART I Department or Agency
Information
1.b. 3rd Level or lower 1.b.
... beginning of FY. ... end of FY. Net Change Enter Actual Number at the ... Number % Number % Number Rate of Change
Total Work Force
11781 100.00% 11855 100.00% 74 0.63%
Reportable Disability
799 6.78% 779 6.57 -20 -2.50%
Targeted Disability*
116 0.98% 108 0.91% 8 -6.90%
* If the rate of change for persons with targeted disabilities is not equal to or greater than the rate of change for the total workforce, a barrier analysis should be conducted (see below).
1. Total Number of Applications Received From Persons With Targeted Disabilities during the reporting period.
PART II Employment
Trend and Special
Recruitment for
Individuals With
Targeted Disabilities
2. Total Number of Selections of Individuals with Targeted Disabilities during the reporting period.
PART III Participation Rates In Agency Employment Programs
Reportable Disability
Targeted Disability
Not Identified No Disability Other Employment/Personnel
Programs
TOTAL
# % # % # % # %
3. Competitive Promotions
4. Non-Competitive Promotions 777 53 6.82% 10 1.29% 6 0.77% 718 92.41%
5. Employee Career Development Programs
5.a. Grades 5 - 12
5.b. Grades 13 - 14
5.c. Grade 15/SES
6. Employee Recognition and Awards
55

6.a. Time-Off Awards (Total hrs awarded)
6562 38 6.20% 8 1.31% 8 1.31% 566 92.48%
6.b. Cash Awards (total $$$ awarded)
7050401 510 6.74% 36059 0.56% 114 1.51% 6475858 91.85%
6.c. Quality-Step Increase 282 19 6.74 3 1.06 3 1.06 260 92.2
EEOC FORM 715-01
Part J
Special Program Plan for the Recruitment, Hiring, and Advancement of Individuals With Targeted Disabilities
Part IV
Identification and Elimination of
Barriers
Agencies with 1,000 or more permanent employees MUST conduct a barrier analysis to address any barriers to increasing employment opportunities for employees and applicants with targeted disabilities using FORM 715-01 PART I. Agencies should review their recruitment, hiring, career development, promotion, and retention of individuals with targeted disabilities in order to determine whether there are any barriers.
Part V
Goals for Targeted Disabilities
Agencies with 1,000 or more permanent employees are to use the space provided below to describe the strategies and activities that will be undertaken during the coming fiscal year to maintain a special recruitment program for individuals with targeted disabilities and to establish specific goals for the employment and advancement of such individuals. For these purposes, targeted disabilities may be considered as a group. Agency goals should be set and accomplished in such a manner as will effect measurable progress from the preceding fiscal year. Agencies are encouraged to set a goal for the hiring of individuals with targeted disabilities that is at least as high as the anticipated losses from this group during the next reporting period, with the objective of avoiding a decrease in the total participation rate of employees with disabilities.
Goals, objectives and strategies described below should focus on internal as well as external sources of candidates and include discussions of activities undertaken to identify individuals with targeted disabilities who can be (1) hired; (2) placed in such a way as to improve possibilities for career development; and (3) advanced to a position at a higher level or with greater potential than the position currently occupied.
56
APPENDIX A
MD-715 report Acronyms List
ADR – Alternative Dispute Resolution AI/ANEPM – Asian American/Pacific Islander Emphasis Program, American Indian/Alaska
Native Emphasis Program Manager AISES – American Indian Sciences and Engineering Society BEPM – Black Emphasis Program Manager CEP – Career Enhancement Program CR – Civil Rights CRAC – Civil Rights Advisory Committee CRD – Civil Rights Division CRIA – Civil Rights Impact Analysis DEPM – Disability Emphasis Program Manager DR – Departmental Regulations EEOC – Equal Employment Opportunity Commission EEO – Equal Employment Opportunity EO – Equal Opportunity FAPAC – Federal Asian Pacific American Council FEORP – Federal Equal Opportunity Recruitment Plan FWPM – Federal Women Program Manager GM – General Manager GS – General Schedule HACU – Hispanic Association of Colleges and Universities HBCU – Historically Black Colleges and Universities HEPM – Hispanic Emphasis Program Manager HR – Human Resources HRMD – Human Resource Management Division HSI – Hispanic Serving Institutions LEAD – Leadership for the Employment of Americans with Disabilities LULAC – League of United Latin American Citizens MANRRS – Minorities in Agriculture, Natural Resources and Related Sciences MD – Management Directive NCLF – National Civilian Labor Force NCRC – National Civil Rights Committee NFC – National Finance Center NHQ – National Headquarters NRCS – Natural Resources Conservation Service NSEPM – National Special Emphasis Program Manager OAC – Office of Adjudication and Compliance OMB – Office of Management and Budget OPM – Office of Personnel Management OSC – Office of Special Counsel PMC – Position Management Committee
57

RA – Reasonable Accommodation RAC – Regional Assistant Chief RCLF – Relevant/Occupational Civilian Labor Force RSNOD – Race, Sex, National Origin and Disability SES – Senior Executive Service SEPM – Special Emphasis Program Manager USDA – United States Department of Agriculture WINS – Washington Internships for Native Students WG – Wage Grade
58

APPENDIX B
MD-715 report Definitions List (The following definitions apply to Management Directive 715)
Administrative Support Workers – Includes all clerical-type work regardless of level of difficulty, where the activities are predominately non-manual though some manual work not directly involved with altering or transporting the products included. Includes: bookkeepers, collectors (bills an accounts), messenger and office helpers, stenographers, typist and secretaries, telegraph and telephone operators, legal assistants, and kindred workers.
Applicant Flow Data - Information reflecting characteristics of the pool of individuals
applying for an employment opportunity.
Barrier - An agency policy, principle, practice or condition that limits or tends to limit employment opportunities for members of a particular gender, race or ethnic background or for an individual (or individuals) based on disability status.
Civilian Labor Force - Persons 16 years of age and over, except those in the armed
forces, who are employed or are unemployed and seeking work.
Craft Workers (Skilled) – Manual workers of relatively high skill level having a thorough and comprehensive knowledge of the processes involved in their work. Exercise considerable independent judgment and usually receive an extensive period of training. Includes: the building trades, hourly paid supervisors and lead operators who are not members of management, mechanics and repairers, skilled machining occupations, compositors and typesetters, electricians, engravers, painters (construction and maintenance), motion picture projectionists, pattern and model makers, stationary engineers, tailors, arts occupations, hand painters, coaters, bakers, decorating occupations, and kindred workers.
Disability - For the purpose of statistics, recruitment, and targeted goals, the number of
employees in the workforce who have indicated having a disability on an Office of Personnel Management Standard Form (SF) 256. For all other purposes, the definition contained in 29 C.F.R. parts 1630.2 applies.
EEO Groups - Members of groups protected under Title VII of the Civil Rights Act and
other Federal guidelines. Includes White Men, White Women, Black Men, Black Women, Hispanic Men, Hispanic Women, Asian Men, Asian Women, Native American Men, Native Hawaiian Other Pacific Islander Men, Native Hawaiian Other Pacific Islander Women, and Persons with Disabilities.
59

Employees - Members of the agency’s permanent or temporary workforce, whether full or part-time and whether in competitive or excepted service positions.
Employment Decision: Any decision affecting the terms and conditions of an individual’s
employment, including but not limited to hiring, promotion, disciplinary action and termination.
Federal Categories (Fed9) - For the first time EEOC is requiring agencies to report their
workforce data by aggregating it into nine employment categories. These categories are more consistent with those EEOC uses in private sector enforcement and will permit better analysis of trends in the federal workplace than previous categories used. The Commission has created a Census/OPM Occupation Cross-Classification Table by OPM Occupational Code (crosswalk) which assists agencies in determining the categories in which to place a position through use of the position’s OPM or SOC codes or the OPM or Census Occupation Title. The crosswalk may be accessed at the Commission’s website.
Fiscal Year - The period from October 1 of one year to September 30 of the following
year.
Goal - Under the Rehabilitation Act, an identifiable objective set by an agency to address or eliminate barriers to equal employment opportunity or to address the lingering effects of past discrimination.
Laborers (Unskilled) - Workers in manual occupations which generally require no special
training who perform elementary duties that may be learned in a few days and require the application of little or no independent judgment. Includes: garage laborers, car washers and greasers, ground keepers and gardeners, farm workers, stevedores, wood choppers, laborers performing lifting, digging, mixing, loading and pulling operations, and kindred workers.
Major Occupation - Agency occupations that are mission related and heavily populated,
relative to other occupations within the agency.
Officials and Manager – Occupations requiring administrative and managerial personnel who set broad policies, exercise overall responsibility for execution of these policies, and direct individual offices, programs, division or other units or special phases of an agency’s operations. In the federal sector, this category is further broken out into four sub-categories: (1) Executive/Senior-Level, (2) Mid-Level, (3) First-Level and (4) Other. When an employee is classified as a supervisor or manager, that employee should be placed in the Officials and Managers category rather than in the category in the crosswalk that they would otherwise be placed in based on the on their OPM occupational code. Those employees classified as supervisors or managers who are at the GS-12 level or below should be placed in the First-Level sub-category of Officials and Managers, those at the GS-13 or 14 should be in the Mid-Level sub-category and those at GS-15 or in the SES should be in the Executive/Senior-Level sub-category. An agency may also choose to place employees who have significant policy-making responsibilities, but do not supervise other employees, in these three sub-categories. The forth category called “Other” contains
60

Operatives (Semiskilled) - Workers who operate machine or processing equipment or
perform other factory-type duties of intermediate skill level which can be mastered in a few weeks and require only limited training. Includes: apprentices (auto mechanic, plumbers, bricklayers, carpenters, electricians, machinists, mechanics, building trades, metalworking trades, printing trades, etc.), operatives, attendants (auto service and parking), blasters, chauffeurs, delivery workers, sewer and stitchers, dryers, furnace workers, heaters, laundry and dry cleaning operatives, milliners, mine operatives and laborers, motor operators, oilier and greasers (except auto), painters (manufactured articles), photographic process workers, truck and tractor drivers, knitting, looping, taping and weaving machine operators, welders and flame cutters, electrical and electronic equipment assemblers, butchers and meat cutters, inspectors, testers and graders, hand packers and packagers, and kindred workers.
Professionals - Occupations requiring either college graduation or experience of such kind
and amount as to provide a comparable background. Includes: accountants and auditors, airplane pilots and navigators, architects, artists, chemists, designers, dietitians, editors, engineers, lawyers, librarians, mathematicians, natural scientists, registered professional nurses, personnel and labor relations specialists, physical scientists, physicians, social scientists, teachers, surveyors, and kindred workers.
Reasonable Accommodations - Generally, any modification or adjustment to the work
environment, or to the manner or circumstances under which work is customarily performed, that enables an individual with a disability to perform the essential functions of a position or enjoy equal benefits and privileges of employment as are enjoyed by similarly situated individuals without a disability.
Relevant Labor Force - The source from which an agency draws or recruits applicants for
employment or an internal selection such as a promotion.
Sales - Occupations engaging wholly or primarily in direct selling. Includes: advertising agents and sales workers, insurance agents and brokers, real estate agents and brokers, stock and bond sales-workers, demonstrators, sales workers and sales clerks, grocery clerks, and cashiers/checkers, and kindred workers.
Service workers - Workers in both protective and non-protective service occupations.
Includes: attendants (hospital and other institutions, professional and personal service, including nurses aides, and orderlies), barbers, char workers and cleaners, cooks, counter and fountain workers, elevator operators, firefighters and fire protection, guards, door-keepers, stewards, janitors, police officers and detectives, porters waiters and waitresses, amusement and recreation facilities attendants, guides, ushers, public transportation attendants, and kindred workers.
61

Technicians - Occupations requiring a combination of basic scientific knowledge and manual skill which can be obtained through two years of post high school education, such as is offered in many technical institutes and junior colleges, or through equivalent on-the-job-training. Includes: computer programmers, drafters, engineering aides, junior engineers, mathematical aides, licensed, practical or vocational nurses, photographers, radio operators, scientific assistants, technical illustrators, technicians (medical, dental, electronic, physical science), and kindred workers.
62

APPENDIX C
SUPPORTING DATA DOCUMENTATION FROM 462 REPORT; COMPLAINT PROCESSING PROGRAM DEFICIENCIES; ADR;
AND REASONABLE ACCOMMODATIONS
Program Status for NRCS Complaints (FY2009)
Informal Complaints: There were 58 pre-complaints initiated and 13 pre-complaints at the beginning of the reporting period. Sixty-two pre-complaints were completed and of the 62, 8 were settled, 13 were withdrawn, and 41 completed counseling which resulted in formal complaints filed. At the end of FY 2009, there were 2 pending decisions to file complaints and 9 pending counseling.
Formal Complaints: There were 45 formal complaints filed during FY 2009, and 78 complaints at the beginning of the reporting period. Of the 124 complaints, one (1) complaint was remanded. Sixty-four complaints were closed and 60 complaints were open at the end of the fiscal year. During the process, time of counseling through closure of the complaint, the trend analysis revealed complaints processing exceeded regulatory time frames, but at an improvement rate over FY 2008.
63

Bases Summary
Comparative Data
Complaints by Bases
Previous Fiscal Year Data
Note: Complaints can be filed alleging multiple bases.
The sum of the bases may not equal total complaints filed. 2005 2006 2007 2008
2009
Appointment/Hire 2 6 2 0 1
Assignment of Duties 5 16 6 8 5
Awards 3 0 0 2 1
Conversion to Full-time 0 0 0 0 0
Disciplinary Action
Demotion 2 4 0 1 1
Reprimand 1 2 2 1 4
Suspension 0 0 0 1 1
Other 0 1 0 0 0
Duty Hours 1 0 0 0 0
Evaluation Appraisal 1 6 4 5 2
Examination/Test 0 0 0 0 1
Harassment
Non-Sexual 5 15 13 20 17
Sexual 1 2 1 2 4
Pay (Including Overtime) 0 0 0 1 0
Promotion/Non-Selection 17 18 24 21 8
Reassignment
Denied 0 1 0 0 0
Directed 2 6 2 3 3
Reasonable Accommodation 1 2 1 4 4
Reinstatement 1 1 0 0 0
64

Retirement 0 1 0 0 0
Termination 2 5 4 3 1
Terms/Conditions of Employment
6 15 4 1 0
Time and Attendance 0 2 1 2 5
Training 1 4 2 0 3
Other 8 15 22 23 12
Issues Summary
Comparative Data Complaints by Issue Previous Fiscal Year Data
Note: Complaints can be filed alleging multiple bases.
The sum of the bases may not equal total complaints filed.
2005 2006 2007 2008
2009
Appointment/Hire 2 6 2 0 1
Assignment of Duties 5 16 6 8 5
Awards 3 0 0 2 1
Conversion to Full-time 0 0 0 0 0
Disciplinary Action
Demotion 2 4 0 1 1
Reprimand 1 2 2 1 4
Suspension 0 0 0 1 1
Other 0 1 0 0 0
Duty Hours 1 0 0 0 0
Evaluation Appraisal 1 6 4 5 2
Examination/Test 0 0 0 0 1
Harassment
Non-Sexual 5 15 13 20 17
Sexual 1 2 1 2 4
Pay (Including Overtime) 0 0 0 1 0
Promotion/Non-Selection 17 18 24 21 8
65

Reassignment
Denied 0 1 0 0 0
Directed 2 6 2 3 3
Reasonable Accommodation 1 2 1 4 4
Reinstatement 1 1 0 0 0
Retirement 0 1 0 0 0
Termination 2 5 4 3 1
Terms/Conditions of Employment
6 15 4 1 0
Time and Attendance 0 2 1 2 5
Training 1 4 2 0 3
Other 8 15 22 23 12
Discrimination Finding Summary
Findings of Discrimination Comparative Data
Rendered by Basis Previous Fiscal Year Data
Note: Complaints can be filed alleging multiple bases 2005 2006 2007 2008 2009
The sum of the bases may not equal total complaints and findings. # % # % # % # % # %
Total Number Findings 1 2 1 0 1
Reprisal 1 100 1 50 0 0 0 0 0 100
Sex 0 0 2 100 0 0 0 0 0 100
Age 0 0 1 50 1 100 0 0 0 100
Disability 0 0 1 50 0 0 0 0 0 0
Findings After Hearing 0 1 1 0
Reprisal 0 0 1 100 0 0 0 0 0 100
Sex 0 0 1 100 0 0 0 0 0 100
National Origin 0 0 0 0 0 0 0 0 0 0
66
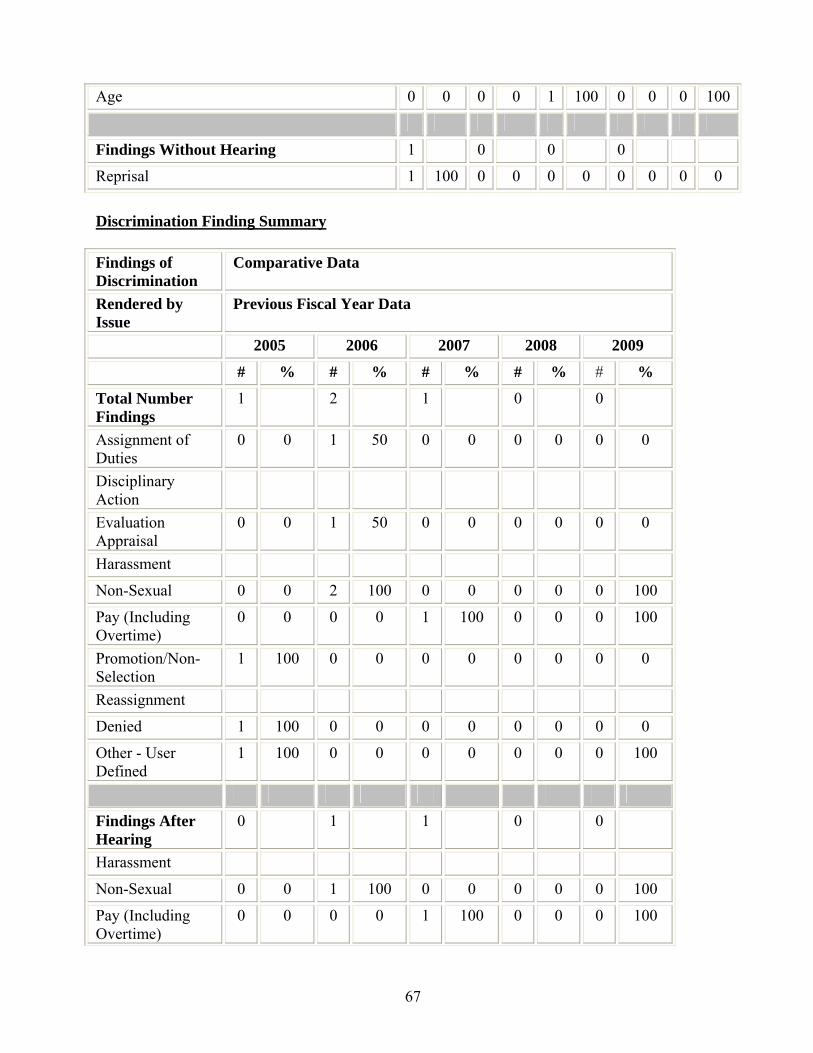
Age 0 0 0 0 1 100 0 0 0 100
Findings Without Hearing 1 0 0 0
Reprisal 1 100 0 0 0 0 0 0 0 0
Discrimination Finding Summary
Findings of Discrimination
Comparative Data
Rendered by Issue
Previous Fiscal Year Data
2005 2006 2007 2008 2009
# % # % # % # % # %
Total Number Findings
1 2 1 0 0
Assignment of Duties
0 0 1 50 0 0 0 0 0 0
Disciplinary Action
Evaluation Appraisal
0 0 1 50 0 0 0 0 0 0
Harassment
Non-Sexual 0 0 2 100 0 0 0 0 0 100
Pay (Including Overtime)
0 0 0 0 1 100 0 0 0 100
Promotion/Non-Selection
1 100 0 0 0 0 0 0 0 0
Reassignment
Denied 1 100 0 0 0 0 0 0 0 0
Other - User Defined
1 100 0 0 0 0 0 0 0 100
Findings After Hearing
0 1 1 0 0
Harassment
Non-Sexual 0 0 1 100 0 0 0 0 0 100
Pay (Including Overtime)
0 0 0 0 1 100 0 0 0 100
67
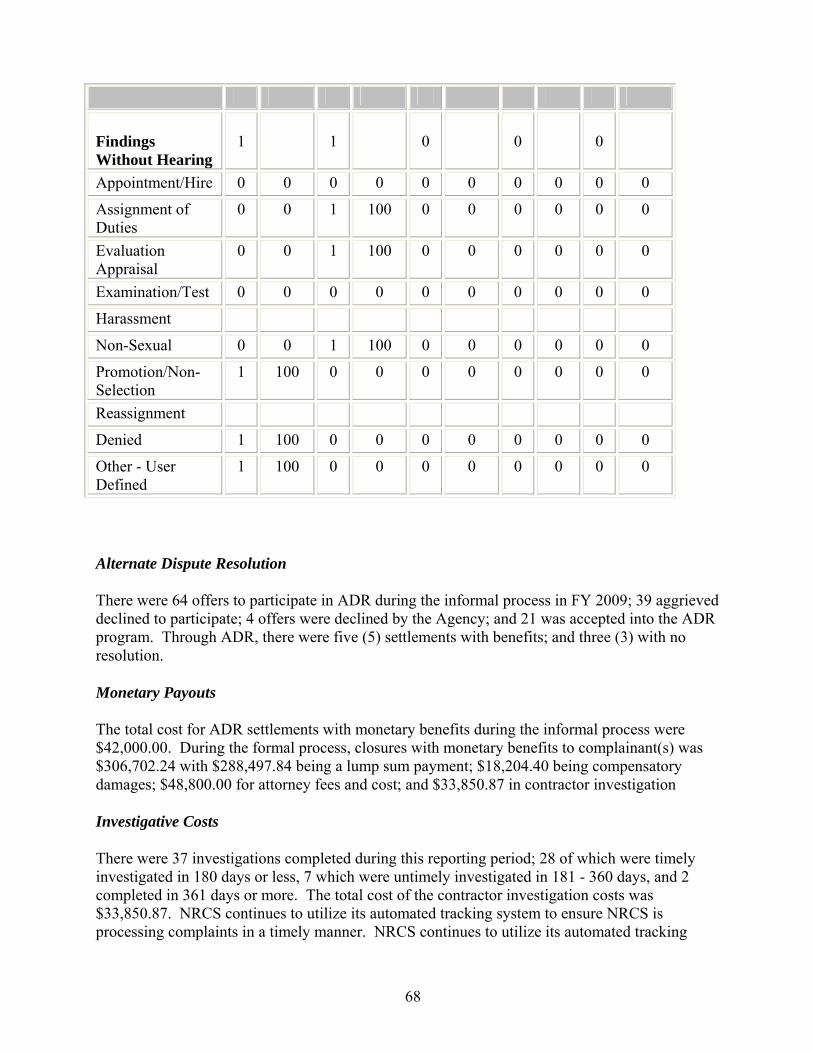
Findings Without Hearing
1
1
0
0
0
Appointment/Hire 0 0 0 0 0 0 0 0 0 0
Assignment of Duties
0 0 1 100 0 0 0 0 0 0
Evaluation Appraisal
0 0 1 100 0 0 0 0 0 0
Examination/Test 0 0 0 0 0 0 0 0 0 0
Harassment
Non-Sexual 0 0 1 100 0 0 0 0 0 0
Promotion/Non-Selection
1 100 0 0 0 0 0 0 0 0
Reassignment
Denied 1 100 0 0 0 0 0 0 0 0
Other - User Defined
1 100 0 0 0 0 0 0 0 0
Alternate Dispute Resolution
There were 64 offers to participate in ADR during the informal process in FY 2009; 39 aggrieved declined to participate; 4 offers were declined by the Agency; and 21 was accepted into the ADR program. Through ADR, there were five (5) settlements with benefits; and three (3) with no resolution.
Monetary Payouts
The total cost for ADR settlements with monetary benefits during the informal process were $42,000.00. During the formal process, closures with monetary benefits to complainant(s) was $306,702.24 with $288,497.84 being a lump sum payment; $18,204.40 being compensatory damages; $48,800.00 for attorney fees and cost; and $33,850.87 in contractor investigation
Investigative Costs
There were 37 investigations completed during this reporting period; 28 of which were timely investigated in 180 days or less, 7 which were untimely investigated in 181 - 360 days, and 2 completed in 361 days or more. The total cost of the contractor investigation costs was $33,850.87. NRCS continues to utilize its automated tracking system to ensure NRCS is processing complaints in a timely manner. NRCS continues to utilize its automated tracking
68

system to ensure NRCS is processing complaints in a timely manner. The investigations that exceeded the required 180 days are attributed to the delay in OAC’s accept/dismiss responsible function of the formal complaint. NRCS will continue to work with our liaison at OAC to overcome these barriers. The costs of the investigations are not affected by any delay in processing as there is a set fee in each complaint.
Corrective/Plan of Actions
Review of ADR data: ADR is offered to all employees during the Pre-complaint (informal) and Formal stage of the EEO process. The decision to elect ADR is determined by the complainant. However, statutes prohibit mediating complaints alleging sexual harassment and workplace violence. Harassment Training: Through the results of trend analysis, CRD determined the type of training to fit the needs identified. This training was provided to all NRCS managers/supervisors and employees. The training modules implemented included such topics as ADR Awareness, Conflict Management and Effective Communication, Sexual Harassment, Non-Sexual Harassment and Preventing a Hostile Work Environment. The table represents reasonable accommodations requested through the NDEPM because employees were not known to be a person with a disability.
Type of Accommodation
Requested
Number Requested
Number Granted
Value of Accommodations
($) Accessible
Parking Space 4 3 N/A
GPS/Survey Equipment 1 1
** Telework 4 3 N/A
Leave 1 1 N/A Approval to
relocate GOV 1 1 N/A
Adjustable compute desk and
Keyboard Tray and Ergo chair
2
1
1
1
1075.00
450.00 Inter-office move 1 1 N/A
Larger Flat Screen Monitors 2 2 1200.00
Flexible Leave 1 1 N/A
69

Type of Accommodation
Requested
Number Requested
Value of Number Granted
Accommodations ($)
Sign Language Interpreters
Ongoing As needed 6,000.00 to 10,000.00
Reassignment to lower grade 1 1 N/A
Change work hours 1 0
Air quality improvements 1 1 N/A
Treadmill 1 0 Remove driving
restrictions 1 1 N/A
Step for vehicle 1 1 10.00 Remove essential
functions 1 1 N/A
VPAD+ 1 1 ** Larger GOV 1 1 N/A
TOTAL 35 22 $2,735.00 ** denotes items provided through The Department of Defense’s Computer/Electronics Accommodations Program Via a 2002 Memorandum of Understanding between the Department of Defense and the USDA
70
APPENDIX D
NATURAL RESOURCES CONSERVATION SERVICE DISABLED VETERANS AFFIRMATIVE ACTION PROGRAM (DVAAP) PLAN Fiscal Year (FY) 2010 1. AUTHORITY AND PURPOSE Pursuant to section 403 of the Vietnam Era Readjustment Assistance Act of 1974, as amended (38 U.S.C. 2014), and section 307 of the Civil Rights Reforms Act of 1978 (5 U.S.C. 3112), and section 307 of the Civil Rights Reform Act of 1978 (5 U.S.C. 3112), the Natural Resources Conservation Service (NRCS) is required to have an up to date affirmative action plan to promote employment and advancement opportunities for qualified disabled veterans. Accordingly, the purpose of this document is to serve as the agency’s Disabled Veteran Affirmative Action Program (DVAAP) Plan for FY 2010. 2. PLAN COVERAGE The DVAAP Plan covers all NRCS offices: National Headquarters (NHQ), Regional Offices, State Offices, Centers, and Field Offices. This plan also includes specific affirmative actions to be taken by all offices, as appropriate, to promote the employment and advancement of disabled veterans. All employing offices are required to have a copy of the current NRCS DVAAP plan to facilitate the implementation of agency policy, to carry out their responsibilities under the national plan, and to accomplish all program objectives and goals as established by NHQ.
3. POLICY It is the policy of NRCS to promote equal employment and advancement opportunities for disabled veterans, especially those who are 30 percent or more disabled. NRCS is committed to the employment of and advancement opportunities for disabled veterans regardless of race, color, religion, sex, national origin, disability, age, marital status, political beliefs, familiar status or any other non-merit reason, as we are an equal opportunity employer. 4. PROGRAM LEADERSHIP AND RESPONSIBILITY The responsibility for the success of the DVAAP is permeated throughout all levels of the agency.
A. Overall responsibility for the development and implementation of this action plan is assigned to the Director of the Human Resource Management Division. The Director is designated by the NRCS DVAAP Manager. The day to day operations of the DVAAP are assigned to a Personnel Management Specialist in the Human Resources Management
71

B. The overall management of the Agency’s Disability Employment Program is delegated to
the Civil Rights Division. The National Disability Employment Program Manager (NDEPM) is assigned to that office. The National DEPM is responsible for coordinating the Disability Awareness Program to ensure that managers, supervisors, and employees have a full understanding of the program. In this endeavor, that individual also provides support and assistance to the awareness of the Agency.
C. Regional Assistant Chiefs and State Conservationists are responsible for the success of the
program in their respective areas. This includes ensuring vacancy announcements are open to disabled veterans, providing accommodations when necessary to employ disabled veterans, and publicizing the program through various media.
D. Human Resources Managers are responsible for implementing, evaluating and monitoring
the DVAAP within their respective State. This includes publicizing the program through job fair, seminars, newsletters, and all employee meetings.
E. Disability and Veterans Employment Program Managers are responsible for coordinating
the awareness of the Disabilities Program including the DVAAP, within their respective State and region. They serve as a link between the program operations in the State and National DEPM. They assist in recruitment efforts for the DVAAP and provide on-going assistance to employees and applicants, as required.
F. All managers and supervisors are responsible for providing Equal Employment
Opportunity for disabled veterans.
5. PROGRAM ASSESSMENT Reorganization, cost cutting, downsizing, administrative convergence and the National Performance Review (NPR) initiative continue to strongly impact recruitment activities. A continuing appraisal of the program will be made throughout the year using the personnel management evaluation system of monitoring and evaluation workforce statistical data.
6. RECRUITMENT/OUTREACH/ADVANCEMENT ACTIVITIES It is NRCS’ objective to utilize various recruitment initiatives, when possible, to inform disabled veterans of vacancies within the agency and to obtain qualified applicants for those positions.
72
A. Externa l Recruitment Although there is limited recruitment, Human Resources Officers, Veterans Employment Program Managers (VEPM) and DEPM’s should continue to establish and maintain contacts with veteran’s organizations, such as: the Veterans Employment Service of the Department of Veterans Affairs; and other similar organizations which foster the employment of disabled veterans. Servicing human resources officers are also encouraged to utilize the U.S. Office of Personnel Management (OPM) and the Department of Veterans Affairs automated applicant databases to identify qualified candidates in those instances where active recruitment is conducted. Additionally, they should participate in special events such as career days, Veterans job fairs, and conferences that promote awareness of the DVAAP. The Agency is aware that many veterans are currently attending post secondary educational institutions. Therefore, where possible, recruitment efforts should be targeted to include veterans when conducting general recruiting at those venues. B. Internal Recruitment All employees, including disabled veterans, are to be notified of vacancies that will be filled through placement and provided with information about procedures to follow in order to be considered for positions. This includes regular vacancies, as well as, vacancies to be filled through career enhancement or similar programs. All servicing personnel offices are requested to utilize electronic national resume databases. Each servicing personnel office is encouraged to obtain a user code to utilize the OPM nationwide automated resume databases: Job Ready Disabled Veterans Connection (JRDVC) and the OPM/Social Security Administration, Project Able Resume Bank, in order to search for qualified candidates with disabilities. The Department of Veteran Affair's Veteran Benefits Administration's Vocational Rehabilitation and Employment (VR & E) Program is a national employment resource for employers. The VR & E Service provides effective vocational rehabilitation services to veterans with service-connected disabilities. Thereby enabling our injured soldiers, sailors, airmen, and other veterans with disabilities, a seamless transition from military service, to successful rehabilitation, and on to suitable employment after service to our Nation. C. Special Appointing Authorities
VEPMs, DEPMs and servicing human resources offices will remind managers of the availability of special hiring authorities, such as the Veterans Readjustment Appointment (VRA) Authority and the hiring authority for veterans with 30 percent or more disability. Any new appointing authorities resulting from new legislation will be incorporated into this plan as they arise during the reporting period.
73

Managers will be encouraged to give consideration for using all appropriate authorities when filling positions.
D. Vacancy Announcements
Servicing personnel offices are required to accept applications from persons eligible for consideration under special hiring authorities (including VRA, appointment of veterans with 30 percent or more disability etc.) at all times. Vacancy announcements will include a statement that voluntary applications from persons who want to be considered under special hiring will be accepted and considered at all times.
E. Special Events
Servicing personnel offices should participate in special events, such as career days, veterans’ job fairs, employer seminars, conferences, etc. that promote awareness of the DVAAP.
F. Unpaid Training or Work Experience
Disabled veterans may work for a Federal agency while in training in accordance with the requirements in 38 U.S.C. Chapter 31 (Veterans Administration Vocational Rehabilitation). Subsequently, a veteran may receive a non-competitive appointment to a vacancy for which he or she is qualified when training is completed. Placement does not have to be in the agency in which training was received.
7. MONITORING, REVIEW, AND EVALUATION The DVAAP Manager will provide oversight of the program agency-wide through periodic reviews of statistical data, inclusion of the program in any personnel management evaluations or civil right reviews which may be conducted throughout the year and similar oversight activities.
DVAAP Working Outline 2009 1. Methods Used to Recruit and Employ Disabled Veterans
A. FY 2009 Statistics for Disabled Veterans Affirmative Action Program ________________________________________________________________________ ALL DISABLED VETERANS # ACCESSIONS 19 = 57 % increase # PROMOTIONS 19 = 63 % increase # SEPARATIONS 6 = 31 % decrease VETERANS WITH 30% OR MORE DISABILITY # ACCESSIONS 11 = 63 % increase
74
# PROMOTIONS 7 = 30 % decrease # SEPARATIONS 1 = 66 % decrease B. Recruitment i. External Recruitment
Email sent to the American Legion Department in Louisiana advising them of my role and responsibilities as the NRCS Veteran’s SEPM. Supplied an open invitation to discuss employment opportunities with members on an individual or group basis. July 14, 2009 via La Legion Webmaster.
Set up visit to Tripler Hospital to attend meeting regarding the Wounded Warrior Program to expand possible recruitment of veterans.
Sent Indiana Department of Veteran Affairs the Indiana NRCS SCEP job announcements. Communicated with Sean McLain, West Virginia Veterans Employment Coordinator, to
make him aware of NRCS employment opportunities. Introduced HR Manager to the West Virginia State Employment Coordinator for disabled
veterans. Participated in a presentation with the AAPI SEPM to the Spokane Community College
Veterans Environmental Academy to discuss the Veterans Preference for federal employment, NRCS STEP/SCEP programs, and the Earth Team Volunteer Programs.
Returning Veterans Earth Team – Veteran was brought on through this program Phone communications with the U.S. Department of Labor, Sharon Muraki regarding the
Veterans Transition Assistance Program in Hawaii. Recruiting display at NACTA competition held at OSU-ATI in Wooster, Ohio April 16-18. Sent 2 veterans informational e-mails to Ohio Conservation Partnership veterans
(developed e-mail address list for all Ohio Partnership vets). ii. Internal Recruitment
DVAAP was provided to all State Human Resources. DVAAP was provided to all collateral duty DEPMs and VEPMs. Meet with HR and Veteran to discuss Volunteer work and potential employment
opportunities with NRCS. NRCS employees Debbie Surabian and Shawn McVey were featured in articles in the
GSSI newsletter: Subsurface Solutions, June 2009 and Connecticut GeoSpatial Summer Newsletter. They were featured for their work finding a WWII crash site at Bradley International Airport.
Communicated with NRCS veteran on Veterans Affairs funded program to place veteran college students for part-time employment while in college.
Veterans SEPM page was a feature on the Indiana NRCS homepage. Sent Veterans Awareness day Presidential Proclamation to all employees. Sent Indiana Veterans instructions on electronically obtaining DD-214.
75
C. Special Appointing Authorities Veterans Recruitment Appointment VEOA 30 % Service connected disabled All OPM authorities
D. Manager Education
As cited from Veterans SEPMs E. Workshops and Career (Job) Fairs
As cited from Veterans SEPMs F. Conferences and Training
Perspectives on the Employment of Persons With Disabilities Conference VEPM annual training Quarterly teleconferences with Collateral Duty VEPMs
2. Methods Used to Provide or Improve Internal Advancement Opportunities
A. See VEPM information provided above
3. How were the Activities of Major Operating Components and Field Installations
monitored, reviewed, and evaluated?
A. Civil Rights Compliance Reviews B. Feedback requested from employees regarding reasonable accommodation and
accessibility C. Quarterly reports from Collateral Duty VEPMs
4. Explain the Agency’s progress in implementing its Affirmative Action Plan during the
Fiscal Year.
A. DVAAP is shared with all Human Resources Managers and Veterans Employment Program Managers ( > 50 individuals)
B. VEPM provided training and awareness throughout the year C. Veterans with disabilities increased in the workforce 26 % higher than separations.
76

APPENDIX E
NRCS RELATED EEO POLICY STATEMENTS
77

USDA iiiiiii.
United States Deperbnenl of Agriculture
OfIice 01 the Secrelary Washington, D.G. 20250
FEB 25 2009
Civil Rights PoJi~y Statement
As Secretary of Agriculture, 1 fully support the U.S. Department of Agricullurc's (USDA) civil righl::i. equal employment opportunity, and diversity policies and programs. Improving civil rights throughout USDA is one of my top priorities, and by pursuing this goallogelher in a mmsparent ~nd ethical manner we can lead the way in making USDA a model organization.
The success oftoday's "People's Departmem" requires the steadfast suppol1 ond commitment of every USDA employee. We will have zero tolerance for any form of discrimination or reprisal. There exists no reason to discriminate based on race, color, religion, nalional origin, age, :sex, sexual orientalion, disability, maril~1 or familial stalus, political heliefs, parental slotus, receipt of public assistonce. or protected genetic information. Our policy at USDA is simply to understand lh~t there will be zero tolerance for any fonn of discrimination. This standard is appUcabie 10
every employee at USDA and to cvery action takcn al USDA
To reolize our vision of a modcm workforce working in a modern workplace, USDA must become a model department of tolerance and inclusion. Only then will we live up to President Lincoln's description of USDA as 'The People's Department" This is my eommitment to you, and I expect every employee to demonstrate respect for ond adherence to USDA civil rights, equfll employmcnt opportunity, and diversity policies.
To this end. accountability is key. USDA employees will be held accountable for doing their part to ensure that fill USDA applicants, customers, eonstituents, and stakeholders as well as other USDA employees ~re provided equal access to the opportunities, programs, find services available through "The People's Deportment." Aceordingly, J am counting on all senior leaders, managers, and supervisors to model appropriate behavior and to lead by example.
We must all strive to create an inclusive environment in which every employee is respected, trusted, and valued. Let us continue to cultivate and reap the benefits of a diverse USDA workforce that is rich in talent, ideas, background, and experience. The USUA mission depends on it.
f~21~2~L Secretary
An Equal OpportunIty E~k!yvr
~NRCS HaturtJl Rc$o:nlrr:>es C.onoorvarion 5ervice P,O 1lo1l25?'J Wlil:£hinglfJn. e.c 20013
APR 1l1DJ9 SUBJECT: EOP - Civil Rights Policy Swrelllent
TO: All NRCS Empl()yc~s
As Chief of the Natural Resources Conscrvatiml St.~l"\'kc (NRCS). I am dedicated 10 ensuring tha.t all pt;rsons ass<.ldatcd Wilh NRCS t~()rnply with every aspect ofou.r N<tllon's C:jvil RighlS laws and policies. NRCS (~nlployc<;.s arc charged with. ami held accolluhlbk ror. lrt."'-dting cadI other tmd cuslOlJwr<; with respt.-ct, dignity.•md cqualit,Y while providing a prof~sioual work cnviromflcnt that delivers scrvicl::s in (l fair, t.."'quitablc, and rcspeclJul nl,t1UI(.'1'.
NRCS is committed to ens.uring tho.: Civil Rights uf every individual Vi.hO requesl.S acct."Ss t.o the progrJ.ITI.S admini~It:Jt:t1 hj' lbe Agency. FUllhcnnore, c-mr1o)'ces and applicanl'> forcmploymenl will be provided employment opportunities wittwUf regard to race. color, national urigin. religiOll, sex, age, disabilities, marital and tamilial stains, sexual orjt~IH.ation, genetic information. polilicol belief};. or relali:.uion for prior EqUi;\t Employment OppnrtlUlit} (EEO) activity.
Recogni?ing that our empIoyCl~~ aiL' our greatest asset, it IS imper.:llh:e that we embrace divcriity within the Agcn~y. NRCS ITlih' continue to strive tn crcall: and maintain an inclusive \.\ork. environment. wherein every emplu)'ee and eustOITH.:r i... rC~'lx~'~l.,;;d and valued regardless of di ffcrences. l am ((Immllted to cfCating and supporting <t glOwing diverse w(wk[orce within NR(~S Ihat rclk"l:ls ll1l' divcriity of the Nminn we serve.
NRCS shan.'~"l tIll' res.ponsibilit.y f(u enforcing Civil Rights by C).('rcjsing a Zf;;.TO tolerance of unlav.·ful discrimination. harassment or reprisal. I. (:XPCCl all NRCS employees to adher~ 10 this policy and demoll::.ir::lte rheir support and commitment uf Civil ftighlS. EEO, and diwf'5ily. Thil, musl bt., our vision, mission, g("tll. and commitm(:nt
f2wJ5t Dave Whill: ('hid
Hr:Jping Ptwpi& Help /he Land

United 5tc1tes o.p.rtment Df Agriculture
~f\IRCS Natural Resources Conservation Service P.O. Bo)( 2690 Washington, D.C, '::00 13
HAY () 1 2OOit, .
SUBJECT: EOP ~ Anti-Harassment Policy Statement
TO: All Natural Resources Conseniation Service Employees File Code: 230-15
The Natural Resourecs Con:;ervation Service (NRCS) Anti-Har~smentPolicy Statement reaffinns my commitment to prohibit sex.ual and non-sexnal hlll"assment in the Agency's work environment and program delivery.
Sexual illld/or non-sexual harassment (a form ofdiscrimination) based on a prohibited basi~ of race, color, national origin, gender, religion, age (40 and over), mental or physjcal disability, political affiliation or belief, sexual orientation, marital or familial status, genetic information, and reprisal (retaliation) for prior Equal Employment Opp0l1unity activity is prohihited by the Agency.
For the purpo~e of this policy, harassment is delined as any objectionable verbal or physical conduct, comment. Of display which demeans, disparages, aggravates, intimidates, or causes humiliation or embarrassment to another per~on. Harassment is (I reasonably known unwelcome offense and serves no legitimate work purpose. Harassment occurs based on any of the above protecled characteristics when:
A. The behavior can reasonably be considered to ndversely affect the work environment (create all intimidating, hostile. or offensive work environment);
B. An employment decision aHecting the employee is based upon the employee's acceptance or rejection of such conduct;
C. Unreasonable interlerence with an individual's work performance; and D. An individual's employment opportunities are affected.
Harassing conduct includes, bnt is not limited to:
Physil':al - Actual or threatened assaull induding hitting. tripping, kicking, punching, or unwanlcd touching: malicious or insulting gestures.
Vcrbal- Unwelcome remarks,jokes, ililluendos. or taunts eilllsing offense or embarrassment: name calling, swearing, bullying, expressing or insinuating lhreats, incessant teasing, wolf whistling, or spreading fumors.
HBlping People Help the Land

Page 2
Psychological- Shunning or ostracizing, stalking, staring, geshlring. preventing someone from joining in an activity; hiding, damaging, or taking another"s property; displaying objectionable materials, graffiti, or pietnres.
Intimidation - Use of physical or organizational power to coerce a person to perform a particular action, or to instill a feeling of humiliation or intimidation. Intimidation does not include the exerci.<;e of supervisory authority in the ordinary course of Agency business.
NRCS strictly pro]1iblts the use ofabuse of official authority or position La intimidate, coerce, or harass employees or customers. Managers and supervisors are suhject to receive disciplinary or adverse action for tolerating harassment and failing to lake appropriate and immediate action when harassment is reported.
Personnel actions that a supervisor or manager takes for val id reasons do not constitute harassment in the workplace. Please note that this notice doe:; nollimillhe supervisor's right to manage effectively. All employees must he proactive in preventing harassment and promoting a discrimination free workplace.
Any employee who is subjected to, witnesses' conduct which is Ull\\'elcome and perceived to he harassment, or receives a report of nlleged harflssment should immediately report the incidcms to a NRCS of1icial. Iran intonnal attempt nt resolution fails or is impractical, employees may seek relief from harassment based on one or more ofthe abovc cited prohibited basis by contacting the NRCS Civil Ilighls Division, Complaints Branch, at 1-866,NRCS-295, or TTY at (30 I) 504,2439, within 4S days of the alleged incident. All other allegations of harassment (non-discriminatory) may be reported directly to an official.
As Chief of the Agency, I am fully committed to ensuring that every employee nnd customer is treated with respcet and dignity. Managers, supervisors, and employees must remain cognizant of this policy and refrain from perpetuating acts of harassment. All employees, induding eontrflctors and oth(,f3 perfunning oHicial work lor lhe Agency, must fully support this zero tolerance harassment olicy.
"-,, '
(',<",~_ L:JrA---<~
", Dave White Chief

APPENDIX F
ORGANIZATIONAL CHART

81

All Male Female Male Female Male Female Male Female Male Female Male Female Male Female Male Female
# 11,780 7,821 3,959 343 176 6,656 3,231 510 370 96 67 5 7 209 103 2 4
% 100% 66.39% 33.61% 2.91% 1.49% 56.50% 27.43% 4.33% 3.14% 0.81% 0.57% 0.04% 0.06% 1.77% 0.87% 0.02% 0.03%
# 11,853 7,786 4,067 364 194 6,613 3,301 511 381 91 74 5 8 198 100 3 8
% 100% 65.69% 34.31% 3.07% 1.64% 55.79% 27.85% 4.31% 3.21% 0.77% 0.62% 0.04% 0.07% 1.67% 0.84% 0.03% 0.07%
CLF (2000) % 100% 53.20% 46.80% 6.20% 4.50% 39.00% 33.70% 4.80% 5.70% 1.90% 1.70% 0.10% 0.10% 0.30% 0.30% 0.80% 0.80%
Difference # 73 -35 108 21 18 -43 70 1 11 -5 7 0 1 -11 -3 1 4
Ratio Change % 0% -0.70% 0.70% 0.16% 0.14% -0.71% 0.42% -0.02% 0.07% -0.05% 0.06% 0% 0.01% -0.10% -0.03% 0.01% 0.03%
Net Change % 0.62% -0.45% 2.73% 6.12% 10.23% -0.65% 2.17% 0.20% 2.97% -5.21% 10.45% 0% 14.29% -5.26% -2.91% 50.00% 100%
# 11,128 7,528 3,600 331 163 6,402 2,918 496 352 91 66 5 5 201 92 2 3
% 100% 67.65% 32.35% 2.97% 1.46% 57.53% 26.22% 4.46% 3.16% 0.82% 0.59% 0.04% 0.04% 1.81% 0.83% 0.02% 0.03%
# 11,187 7,475 3,712 343 183 6,358 2,991 489 358 89 72 5 7 187 92 3 8
% 100% 66.82% 33.18% 3.07% 1.64% 56.83% 26.74% 4.37% 3.20% 0.80% 0.64% 0.04% 0.06% 1.67% 0.82% 0.03% 0.07%
Difference # 59 -53 112 12 20 -44 73 -7 6 -2 6 0 2 -14 0 1 5
Ratio Change % 0% -0.83% 0.83% 0.09% 0.17% -0.70% 0.51% -0.09% 0.04% -0.02% 0.05% 0% 0.02% -0.13% 0% 0.01% 0.04%
Net Change % 0.53% -0.70% 3.11% 3.63% 12.27% -0.69% 2.50% -1.41% 1.70% -2.20% 9.09% 0% 40.00% -6.97% 0% 50.00% 166.67%
# 461 202 259 6 10 174 221 12 17 4 1 0 0 6 9 0 1
% 100% 43.82% 56.18% 1.30% 2.17% 37.74% 47.94% 2.60% 3.69% 0.87% 0.22% 0% 0% 1.30% 1.95% 0% 0.22%
# 503 233 270 16 7 187 235 19 20 2 2 0 0 9 6 0 0
% 100% 46.32% 53.68% 3.18% 1.39% 37.18% 46.72% 3.78% 3.98% 0.40% 0.40% 0% 0% 1.79% 1.19% 0% 0%
Difference # 42 31 11 10 -3 13 14 7 3 -2 1 0 0 3 -3 0 -1
Ratio Change % 0% 2.50% -2.50% 1.88% -0.78% -0.57% -1.22% 1.17% 0.29% -0.47% 0.18% 0% 0% 0.49% -0.76% 0% -0.22%
Net Change % 9.11% 15.35% 4.25% 166.67% -30.00% 7.47% 6.33% 58.33% 17.65% -50.00% 100% 0% 0% 50.00% -33.33% 0% -100%
# 191 91 100 6 3 80 92 2 1 1 0 0 2 2 2 0 0
% 100% 47.64% 52.36% 3.14% 1.57% 41.88% 48.17% 1.05% 0.52% 0.52% 0% 0% 1.05% 1.05% 1.05% 0% 0%
# 163 78 85 5 4 68 75 3 3 0 0 0 1 2 2 0 0
% 100% 47.85% 52.15% 3.07% 2.45% 41.72% 46.01% 1.84% 1.84% 0% 0% 0% 0.61% 1.23% 1.23% 0% 0%
Difference # -28 -13 -15 -1 1 -12 -17 1 2 -1 0 0 -1 0 0 0 0
Ratio Change % 0% 0.21% -0.21% -0.07% 0.88% -0.17% -2.16% 0.79% 1.32% -0.52% 0% 0% -0.43% 0.18% 0.18% 0% 0%
Net Change % -14.66% -14.29% -15.00% -16.67% 33.33% -15.00% -18.48% 50.00% 200.00% -100% 0% 0% -50.00% 0% 0% 0% 0%
Current FY
Prior FY
Current FY
NON-APPROPRIATEDPrior FY
PERMANENTPrior FY
Current FY
TEMPORARY
TOTALPrior FY
Current FY
Two or More Races
American or Other Pacific Indian or
Black or African
Asian
Native Hawaiian American
Islander Alaska Native
Latino
White
EMPLOYMENT TOTAL RACE/ETHNICITYTENURE WORKFORCE Hispanic or Non-Hispanic or Latino
U. S. DEPARTMENT OF AGRICULTURE - NATURAL RESOURCES CONSV SERVCETable A1: Total Workforce - Distribution by Race/Ethnicity and Sex
Year = FY 2009

All Male Female Male Female Male Female Male Female Male Female Male Female Male Female Male Female# 11,187 7,475 3,712 343 183 6,358 2,991 489 358 89 74 5 5 187 92 3 8
% 100% 66.82% 33.18% 3.07% 1.64% 56.83% 26.74% 4.37% 3.20% 0.80% 0.66% 0.04% 0.04% 1.67% 0.82% 0.03% 0.07%
CLF (2000) % 100% 53.20% 46.80% 6.20% 4.50% 39.00% 33.70% 4.80% 5.70% 1.90% 1.70% 0.10% 0.10% 0.30% 0.30% 0.80% 0.80%
# 186 134 52 0 2 103 41 27 8 0 0 0 0 4 1 0 0
% 100% 72.04% 27.96% 0% 1.08% 55.38% 22.04% 14.52% 4.30% 0% 0% 0% 0% 2.15% 0.54% 0% 0%
# 65 39 26 1 3 37 20 0 0 0 1 0 0 1 2 0 0
% 100% 60.00% 40.00% 1.54% 4.62% 56.92% 30.77% 0% 0% 0% 1.54% 0% 0% 1.54% 3.08% 0% 0%
# 144 97 47 15 4 63 32 2 3 2 2 0 0 15 6 0 0
% 100% 67.36% 32.64% 10.42% 2.78% 43.75% 22.22% 1.39% 2.08% 1.39% 1.39% 0% 0% 10.42% 4.17% 0% 0%
# 223 158 65 2 1 120 47 28 14 0 1 0 0 8 2 0 0
% 100% 70.85% 29.15% 0.90% 0.45% 53.81% 21.08% 12.56% 6.28% 0% 0.45% 0% 0% 3.59% 0.90% 0% 0%
# 368 208 160 18 16 163 122 9 3 15 13 0 0 3 5 0 1
% 100% 56.52% 43.48% 4.89% 4.35% 44.29% 33.15% 2.45% 0.82% 4.08% 3.53% 0% 0% 0.82% 1.36% 0% 0.27%
# 278 193 85 23 8 160 67 4 6 4 1 0 0 2 3 0 0
% 100% 69.42% 30.58% 8.27% 2.88% 57.55% 24.10% 1.44% 2.16% 1.44% 0.36% 0% 0% 0.72% 1.08% 0% 0%
# 51 30 21 4 0 26 19 0 0 0 0 0 0 0 2 0 0
% 100% 58.82% 41.18% 7.84% 0% 50.98% 37.25% 0% 0% 0% 0% 0% 0% 0% 3.92% 0% 0%
# 39 24 15 0 1 20 12 4 2 0 0 0 0 0 0 0 0
% 100% 61.54% 38.46% 0% 2.56% 51.28% 30.77% 10.26% 5.13% 0% 0% 0% 0% 0% 0% 0% 0%
# 181 125 56 15 3 87 42 20 9 1 1 0 0 2 1 0 0
% 100% 69.06% 30.94% 8.29% 1.66% 48.07% 23.20% 11.05% 4.97% 0.55% 0.55% 0% 0% 1.10% 0.55% 0% 0%
# 230 157 73 6 2 119 52 29 18 1 0 0 0 2 1 0 0
% 100% 68.26% 31.74% 2.61% 0.87% 51.74% 22.61% 12.61% 7.83% 0.43% 0% 0% 0% 0.87% 0.43% 0% 0%
# 102 66 36 2 1 36 13 0 0 22 17 5 5 1 0 0 0
% 100% 64.71% 35.29% 1.96% 0.98% 35.29% 12.75% 0% 0% 21.57% 16.67% 4.90% 4.90% 0.98% 0% 0% 0%
# 181 120 61 3 5 115 53 0 0 0 0 0 0 2 2 0 1
% 100% 66.30% 33.70% 1.66% 2.76% 63.54% 29.28% 0% 0% 0% 0% 0% 0% 1.10% 1.10% 0% 0.55%
# 297 220 77 3 0 198 69 11 8 1 0 0 0 7 0 0 0
% 100% 74.07% 25.93% 1.01% 0% 66.67% 23.23% 3.70% 2.69% 0.34% 0% 0% 0% 2.36% 0% 0% 0%
# 253 168 85 4 1 154 78 5 3 3 0 0 0 2 3 0 0
% 100% 66.40% 33.60% 1.58% 0.40% 60.87% 30.83% 1.98% 1.19% 1.19% 0% 0% 0% 0.79% 1.19% 0% 0%
# 425 285 140 1 2 270 132 7 4 0 0 0 0 7 2 0 0
% 100% 67.06% 32.94% 0.24% 0.47% 63.53% 31.06% 1.65% 0.94% 0% 0% 0% 0% 1.65% 0.47% 0% 0%
# 336 255 81 2 4 238 69 10 3 0 0 0 0 5 4 0 1
% 100% 75.89% 24.11% 0.60% 1.19% 70.83% 20.54% 2.98% 0.89% 0% 0% 0% 0% 1.49% 1.19% 0% 0.30%
# 233 173 60 1 1 158 56 13 3 0 0 0 0 1 0 0 0
% 100% 74.25% 25.75% 0.43% 0.43% 67.81% 24.03% 5.58% 1.29% 0% 0% 0% 0% 0.43% 0% 0% 0%
# 220 178 42 3 1 150 38 22 2 0 1 0 0 3 0 0 0
% 100% 80.91% 19.09% 1.36% 0.45% 68.18% 17.27% 10.00% 0.91% 0% 0.45% 0% 0% 1.36% 0% 0% 0%
IA STATE CONSERVATIONISTS OFF
KS STATE CONSERVATIONISTS OFF
KY STATE CONSERVATIONISTS OFFI
LA STATE CONSERVATIONIST OFF
PACIFIC ISLANDS STATE OFFICE
IDAHO STATE CONSERVATIONIST OFFICE
IL STATE CONSERVATIONISTS OFF
IN STATE CONSERVATIONISTS OFF
CT STATE CONSERVATIONISTS OFFC
DE STATE CONSERVATIONISTS OFF
FL STATE CONSERVATIONIST OFF.
GA STATE CONSERVATIONISTS OFFC
AZ STATE CONSERVATIONISTS OFF
AR STATE CONSERVATIONISTS OFF
CA STATE CONSERVATIONISTS OFF
CO STATE CONSERVATIONISTS OFF
TOTAL
AL STATE CONSERVATIONIST OFF
AK STATE CONSVST OFFICE
Two or More Races
American or Other Pacific Indian or
Black or African
Asian
Native Hawaiian American
Islander Alaska Native
Latino
White
ORGANIZATIONAL TOTAL RACE/ETHNICITYCOMPONENT WORKFORCE Hispanic or Non-Hispanic or Latino
U. S. DEPARTMENT OF AGRICULTURE - NATURAL RESOURCES CONSV SERVCETable A2: Total Workforce By Component - Distribution by Race/Ethnicity and Sex
Year = FY 2009

All Male Female Male Female Male Female Male Female Male Female Male Female Male Female Male FemaleTwo or More Races
American or Other Pacific Indian or
Black or African
Asian
Native Hawaiian American
Islander Alaska Native
Latino
White
ORGANIZATIONAL TOTAL RACE/ETHNICITYCOMPONENT WORKFORCE Hispanic or Non-Hispanic or Latino
U. S. DEPARTMENT OF AGRICULTURE - NATURAL RESOURCES CONSV SERVCETable A2: Total Workforce By Component - Distribution by Race/Ethnicity and Sex
Year = FY 2009
# 80 53 27 1 1 49 26 1 0 1 0 0 0 1 0 0 0
% 100% 66.25% 33.75% 1.25% 1.25% 61.25% 32.50% 1.25% 0% 1.25% 0% 0% 0% 1.25% 0% 0% 0%
# 95 60 35 0 3 50 28 9 2 1 2 0 0 0 0 0 0
% 100% 63.16% 36.84% 0% 3.16% 52.63% 29.47% 9.47% 2.11% 1.05% 2.11% 0% 0% 0% 0% 0% 0%
# 57 29 28 1 1 27 27 0 0 1 0 0 0 0 0 0 0
% 100% 50.88% 49.12% 1.75% 1.75% 47.37% 47.37% 0% 0% 1.75% 0% 0% 0% 0% 0% 0% 0%
# 199 130 69 3 7 113 52 11 6 0 3 0 0 3 1 0 0
% 100% 65.33% 34.67% 1.51% 3.52% 56.78% 26.13% 5.53% 3.02% 0% 1.51% 0% 0% 1.51% 0.50% 0% 0%
# 346 220 126 2 2 202 112 11 7 1 3 0 0 4 2 0 0
% 100% 63.58% 36.42% 0.58% 0.58% 58.38% 32.37% 3.18% 2.02% 0.29% 0.87% 0% 0% 1.16% 0.58% 0% 0%
# 292 225 67 0 0 168 44 55 22 1 0 0 0 1 1 0 0
% 100% 77.05% 22.95% 0% 0% 57.53% 15.07% 18.84% 7.53% 0.34% 0% 0% 0% 0.34% 0.34% 0% 0%
# 411 297 114 4 1 278 105 7 3 1 1 0 0 7 4 0 0
% 100% 72.26% 27.74% 0.97% 0.24% 67.64% 25.55% 1.70% 0.73% 0.24% 0.24% 0% 0% 1.70% 0.97% 0% 0%
# 302 177 125 5 0 164 119 0 2 0 0 0 0 8 4 0 0
% 100% 58.61% 41.39% 1.66% 0% 54.30% 39.40% 0% 0.66% 0% 0% 0% 0% 2.65% 1.32% 0% 0%
# 311 211 100 5 3 198 94 5 2 1 0 0 0 1 1 0 0
% 100% 67.85% 32.15% 1.61% 0.96% 63.67% 30.23% 1.61% 0.64% 0.32% 0% 0% 0% 0.32% 0.32% 0% 0%
# 73 45 28 2 4 41 22 0 0 0 1 0 0 2 1 0 0
% 100% 61.64% 38.36% 2.74% 5.48% 56.16% 30.14% 0% 0% 0% 1.37% 0% 0% 2.74% 1.37% 0% 0%
# 48 20 28 0 1 20 26 0 0 0 0 0 0 0 1 0 0
% 100% 41.67% 58.33% 0% 2.08% 41.67% 54.17% 0% 0% 0% 0% 0% 0% 0% 2.08% 0% 0%
# 68 32 36 2 3 27 29 2 4 1 0 0 0 0 0 0 0
% 100% 47.06% 52.94% 2.94% 4.41% 39.71% 42.65% 2.94% 5.88% 1.47% 0% 0% 0% 0% 0% 0% 0%
# 184 126 58 34 15 82 39 2 0 1 1 0 0 7 3 0 0
% 100% 68.48% 31.52% 18.48% 8.15% 44.57% 21.20% 1.09% 0% 0.54% 0.54% 0% 0% 3.80% 1.63% 0% 0%
# 172 96 76 2 2 87 71 5 2 1 1 0 0 1 0 0 0
% 100% 55.81% 44.19% 1.16% 1.16% 50.58% 41.28% 2.91% 1.16% 0.58% 0.58% 0% 0% 0.58% 0% 0% 0%
# 174 123 51 3 5 108 36 9 8 1 1 0 0 2 1 0 0
% 100% 70.69% 29.31% 1.72% 2.87% 62.07% 20.69% 5.17% 4.60% 0.57% 0.57% 0% 0% 1.15% 0.57% 0% 0%
# 251 147 104 3 3 139 96 2 0 0 1 0 0 3 2 0 2
% 100% 58.57% 41.43% 1.20% 1.20% 55.38% 38.25% 0.80% 0% 0% 0.40% 0% 0% 1.20% 0.80% 0% 0.80%
# 231 158 73 1 2 142 57 13 11 1 2 0 0 1 1 0 0
% 100% 68.40% 31.60% 0.43% 0.87% 61.47% 24.68% 5.63% 4.76% 0.43% 0.87% 0% 0% 0.43% 0.43% 0% 0%
# 307 243 64 7 2 196 46 12 3 0 2 0 0 28 11 0 0
% 100% 79.15% 20.85% 2.28% 0.65% 63.84% 14.98% 3.91% 0.98% 0% 0.65% 0% 0% 9.12% 3.58% 0% 0%
# 169 95 74 3 4 87 64 0 1 3 3 0 0 2 2 0 0
% 100% 56.21% 43.79% 1.78% 2.37% 51.48% 37.87% 0% 0.59% 1.78% 1.78% 0% 0% 1.18% 1.18% 0% 0%
# 196 133 63 1 3 118 55 10 3 0 1 0 0 4 1 0 0
% 100% 67.86% 32.14% 0.51% 1.53% 60.20% 28.06% 5.10% 1.53% 0% 0.51% 0% 0% 2.04% 0.51% 0% 0%
# 28 17 11 0 1 14 9 0 0 2 1 0 0 0 0 1 0
% 100% 60.71% 39.29% 0% 3.57% 50.00% 32.14% 0% 0% 7.14% 3.57% 0% 0% 0% 0% 3.57% 0%
RI STATE CONSERVATIONIST OFFC
OH STATE CONSERVATIONIST OFF
OKLA STATE CONVST OFF-STILLWTR
OR STATE CONSERVATIONISTS OFF
PA STATE CONS OFF
NM STATE CONSERVATION SERVICE
NY STATE CONSVST S OFFICE
NC STATE CONSERVATIONISTS OFF
ND STATE CONSERVATIONIST OFF
NEBRASKA STATE CONSERVATIONIST OFFICE
NV STATE CONSVST OFFICE
NH STATE CONSERVATIONISTS OFC
NJ STATE CONSERVATIONISTS OFF
MN STATE CONSERVATIONISTS OFF
MS STATE CONSVST OFFICE
MO STATE CONSERVATIONISTS OFF
MT STATE CONSERVATIONIST OFF
MAINE STATE CONSERVATIONISTS OFFICE
MD STATE CONSERVATIONIST S OFF
MA STATE CONSERVATIONISTS OFF
MI STATE CONSERVATIONISTS OFF

All Male Female Male Female Male Female Male Female Male Female Male Female Male Female Male FemaleTwo or More Races
American or Other Pacific Indian or
Black or African
Asian
Native Hawaiian American
Islander Alaska Native
Latino
White
ORGANIZATIONAL TOTAL RACE/ETHNICITYCOMPONENT WORKFORCE Hispanic or Non-Hispanic or Latino
U. S. DEPARTMENT OF AGRICULTURE - NATURAL RESOURCES CONSV SERVCETable A2: Total Workforce By Component - Distribution by Race/Ethnicity and Sex
Year = FY 2009
# 143 93 50 2 0 74 34 14 16 1 0 0 0 2 0 0 0
% 100% 65.03% 34.97% 1.40% 0% 51.75% 23.78% 9.79% 11.19% 0.70% 0% 0% 0% 1.40% 0% 0% 0%
# 239 161 78 3 0 152 69 0 0 1 1 0 0 5 7 0 0
% 100% 67.36% 32.64% 1.26% 0% 63.60% 28.87% 0% 0% 0.42% 0.42% 0% 0% 2.09% 2.93% 0% 0%
# 197 138 59 1 2 121 46 15 10 0 1 0 0 1 0 0 0
% 100% 70.05% 29.95% 0.51% 1.02% 61.42% 23.35% 7.61% 5.08% 0% 0.51% 0% 0% 0.51% 0% 0% 0%
# 796 604 192 78 19 481 152 32 13 1 4 0 0 12 4 0 0
% 100% 75.88% 24.12% 9.80% 2.39% 60.43% 19.10% 4.02% 1.63% 0.13% 0.50% 0% 0% 1.51% 0.50% 0% 0%
# 170 122 48 2 1 114 45 2 2 0 0 0 0 4 0 0 0
% 100% 71.76% 28.24% 1.18% 0.59% 67.06% 26.47% 1.18% 1.18% 0% 0% 0% 0% 2.35% 0% 0% 0%
# 69 41 28 0 0 39 26 0 0 0 1 0 0 2 1 0 0
% 100% 59.42% 40.58% 0% 0% 56.52% 37.68% 0% 0% 0% 1.45% 0% 0% 2.90% 1.45% 0% 0%
# 173 120 53 2 2 103 42 15 9 0 0 0 0 0 0 0 0
% 100% 69.36% 30.64% 1.16% 1.16% 59.54% 24.28% 8.67% 5.20% 0% 0% 0% 0% 0% 0% 0% 0%
# 185 115 70 8 2 95 65 1 0 4 0 0 0 7 2 0 1
% 100% 62.16% 37.84% 4.32% 1.08% 51.35% 35.14% 0.54% 0% 2.16% 0% 0% 0% 3.78% 1.08% 0% 0.54%
# 153 99 54 0 0 96 52 2 0 0 1 0 0 1 1 0 0
% 100% 64.71% 35.29% 0% 0% 62.75% 33.99% 1.31% 0% 0% 0.65% 0% 0% 0.65% 0.65% 0% 0%
# 242 148 94 2 5 140 87 1 1 1 0 0 0 4 1 0 0
% 100% 61.16% 38.84% 0.83% 2.07% 57.85% 35.95% 0.41% 0.41% 0.41% 0% 0% 0% 1.65% 0.41% 0% 0%
# 151 102 49 5 1 92 45 0 1 2 0 0 0 2 2 1 0
% 100% 67.55% 32.45% 3.31% 0.66% 60.93% 29.80% 0% 0.66% 1.32% 0% 0% 0% 1.32% 1.32% 0.66% 0%
# 23 6 17 1 2 3 8 2 7 0 0 0 0 0 0 0 0
% 100% 26.09% 73.91% 4.35% 8.70% 13.04% 34.78% 8.70% 30.43% 0% 0% 0% 0% 0% 0% 0% 0%
# 4 2 2 0 0 2 2 0 0 0 0 0 0 0 0 0 0
% 100% 50.00% 50.00% 0% 0% 50.00% 50.00% 0% 0% 0% 0% 0% 0% 0% 0% 0% 0%
# 58 38 20 36 18 1 1 1 1 0 0 0 0 0 0 0 0
% 100% 65.52% 34.48% 62.07% 31.03% 1.72% 1.72% 1.72% 1.72% 0% 0% 0% 0% 0% 0% 0% 0%
# 8 3 5 1 0 2 5 0 0 0 0 0 0 0 0 0 0
% 100% 37.50% 62.50% 12.50% 0% 25.00% 62.50% 0% 0% 0% 0% 0% 0% 0% 0% 0% 0%
# 14 10 4 3 0 6 3 0 1 1 0 0 0 0 0 0 0
% 100% 71.43% 28.57% 21.43% 0% 42.86% 21.43% 0% 7.14% 7.14% 0% 0% 0% 0% 0% 0% 0%
# 401 172 229 8 5 116 93 41 121 2 5 0 0 4 3 1 2
% 100% 42.89% 57.11% 2.00% 1.25% 28.93% 23.19% 10.22% 30.17% 0.50% 1.25% 0% 0% 1.00% 0.75% 0.25% 0.50%
# 11 9 2 0 0 8 1 1 1 0 0 0 0 0 0 0 0
% 100% 81.82% 18.18% 0% 0% 72.73% 9.09% 9.09% 9.09% 0% 0% 0% 0% 0% 0% 0% 0%
# 34 20 14 3 1 14 8 1 4 2 0 0 0 0 1 0 0
% 100% 58.82% 41.18% 8.82% 2.94% 41.18% 23.53% 2.94% 11.76% 5.88% 0% 0% 0% 0% 2.94% 0% 0%
# 59 34 25 1 6 23 15 7 4 2 0 0 0 1 0 0 0
% 100% 57.63% 42.37% 1.69% 10.17% 38.98% 25.42% 11.86% 6.78% 3.39% 0% 0% 0% 1.69% 0% 0% 0%
# 18 11 7 0 0 7 6 2 1 2 0 0 0 0 0 0 0
% 100% 61.11% 38.89% 0% 0% 38.89% 33.33% 11.11% 5.56% 11.11% 0% 0% 0% 0% 0% 0% 0%
NATIONAL CARTOGRAPHY & GEOSPATIAL CENTER
NATIONAL EMPLOYEE DEVELOPMENT CENTER
CENTRAL REMOTE SENSING LAB
NHQ - DC
NATIONAL WATER MANAGEMENT CENTER
INFORMATION TECHNOLOGY CENTER
NATIONAL CENTERS SERVICING UNIT
NATIONAL GEOSPATIAL DEV CENTER
CARIBBEAN AREA DIR OFF SN JUAN
EAST REMOTE SENSING LAB
WA STATE CONSVST OFFICE
WV STATE CONSERVATIONIST S OFF
WI STATE CONSERVATIONISTS OFF
WYOMING STATE CONSERVATIONISTS OFFICE-CASPE
TX STATE CONSERVATIONISTS OFF
UT STATE CONSERVATIONISTS OFF
VERMONT STATE CONSERVATIONISTS OFFICE-COLCH
VA STATE CONSERVATIONIST OFF
SC STATE CONSERVATIONISTS OFF
SD STATE CONSERVATIONISTS OFF
TENNESSEE

All Male Female Male Female Male Female Male Female Male Female Male Female Male Female Male FemaleTwo or More Races
American or Other Pacific Indian or
Black or African
Asian
Native Hawaiian American
Islander Alaska Native
Latino
White
ORGANIZATIONAL TOTAL RACE/ETHNICITYCOMPONENT WORKFORCE Hispanic or Non-Hispanic or Latino
U. S. DEPARTMENT OF AGRICULTURE - NATURAL RESOURCES CONSV SERVCETable A2: Total Workforce By Component - Distribution by Race/Ethnicity and Sex
Year = FY 2009
# 5 3 2 0 0 3 2 0 0 0 0 0 0 0 0 0 0
% 100% 60.00% 40.00% 0% 0% 60.00% 40.00% 0% 0% 0% 0% 0% 0% 0% 0% 0% 0%
# 4 3 1 0 0 3 1 0 0 0 0 0 0 0 0 0 0
% 100% 75.00% 25.00% 0% 0% 75.00% 25.00% 0% 0% 0% 0% 0% 0% 0% 0% 0% 0%
# 35 26 9 2 1 22 8 1 0 1 0 0 0 0 0 0 0
% 100% 74.29% 25.71% 5.71% 2.86% 62.86% 22.86% 2.86% 0% 2.86% 0% 0% 0% 0% 0% 0% 0%
# 62 39 23 0 0 38 23 0 0 0 0 0 0 1 0 0 0
% 100% 62.90% 37.10% 0% 0% 61.29% 37.10% 0% 0% 0% 0% 0% 0% 1.61% 0% 0% 0%
# 20 11 9 0 0 11 8 0 1 0 0 0 0 0 0 0 0
% 100% 55.00% 45.00% 0% 0% 55.00% 40.00% 0% 5.00% 0% 0% 0% 0% 0% 0% 0% 0%
# 7 3 4 0 0 3 4 0 0 0 0 0 0 0 0 0 0
% 100% 42.86% 57.14% 0% 0% 42.86% 57.14% 0% 0% 0% 0% 0% 0% 0% 0% 0% 0%
# 29 19 10 1 0 15 7 3 2 0 1 0 0 0 0 0 0
% 100% 65.52% 34.48% 3.45% 0% 51.72% 24.14% 10.34% 6.90% 0% 3.45% 0% 0% 0% 0% 0% 0%
# 37 28 9 0 0 24 8 0 1 3 0 0 0 1 0 0 0
% 100% 75.68% 24.32% 0% 0% 64.86% 21.62% 0% 2.70% 8.11% 0% 0% 0% 2.70% 0% 0% 0%
# 34 28 6 2 0 23 6 3 0 0 0 0 0 0 0 0 0
% 100% 82.35% 17.65% 5.88% 0% 67.65% 17.65% 8.82% 0% 0% 0% 0% 0% 0% 0% 0% 0%
EAST NATIONAL TECHNOLOGY SUPPORT CENTER
WEST NATIONAL TECHNOLOGY SUPPORT CENTER
CENTRAL NATIONAL TECHNOLOGY SUPPORT CENTER
NDCSM CENTER
NATIONAL SOIL SURVEY CENTER
NATIONAL WATER AND CLIMATE CENTER
WEST REMOTE SENSING LAB
AGRICULTURAL WILDLIFE CONSERVATION CENTER
NATIONAL PLANT DATA CENTER
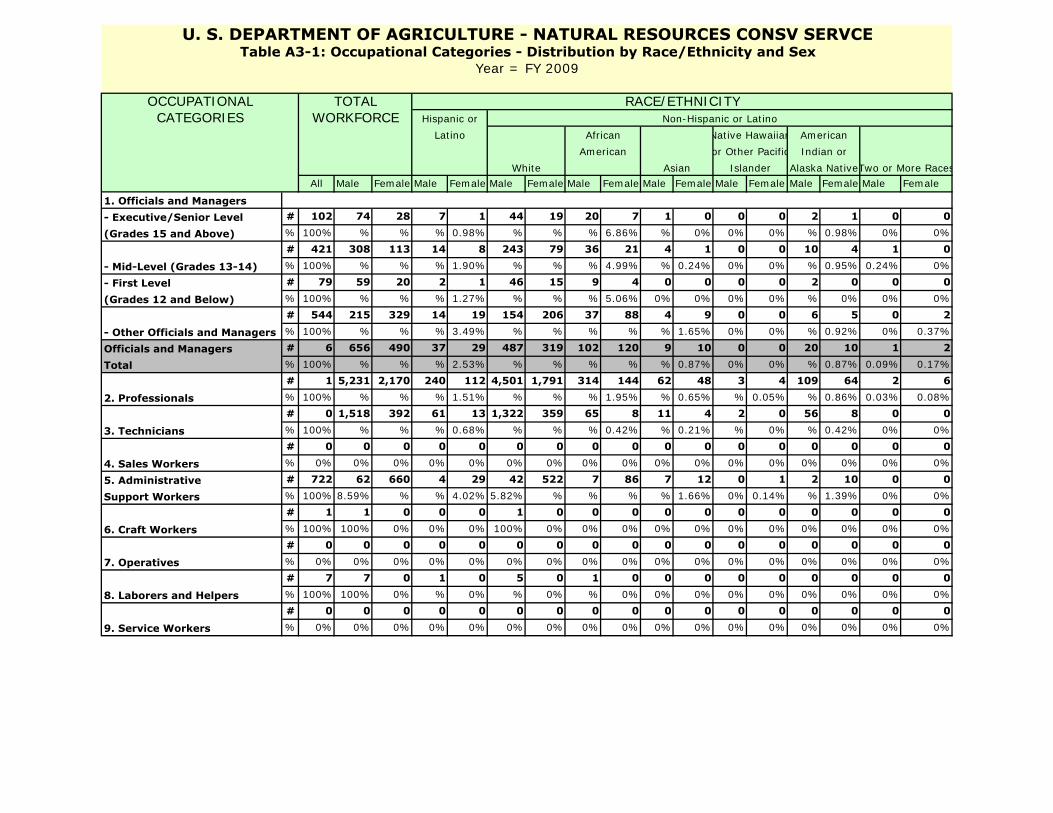
All Male Female Male Female Male Female Male Female Male Female Male Female Male Female Male Female
1. Officials and Managers- Executive/Senior Level # 102 74 28 7 1 44 19 20 7 1 0 0 0 2 1 0 0
(Grades 15 and Above) % 100% % % % 0.98% % % % 6.86% % 0% 0% 0% % 0.98% 0% 0%
# 421 308 113 14 8 243 79 36 21 4 1 0 0 10 4 1 0% 100% % % % 1.90% % % % 4.99% % 0.24% 0% 0% % 0.95% 0.24% 0%
- First Level # 79 59 20 2 1 46 15 9 4 0 0 0 0 2 0 0 0
(Grades 12 and Below) % 100% % % % 1.27% % % % 5.06% 0% 0% 0% 0% % 0% 0% 0%
# 544 215 329 14 19 154 206 37 88 4 9 0 0 6 5 0 2% 100% % % % 3.49% % % % % % 1.65% 0% 0% % 0.92% 0% 0.37%
Officials and Managers # 6 656 490 37 29 487 319 102 120 9 10 0 0 20 10 1 2
Total % 100% % % % 2.53% % % % % % 0.87% 0% 0% % 0.87% 0.09% 0.17%
# 1 5,231 2,170 240 112 4,501 1,791 314 144 62 48 3 4 109 64 2 6% 100% % % % 1.51% % % % 1.95% % 0.65% % 0.05% % 0.86% 0.03% 0.08%
# 0 1,518 392 61 13 1,322 359 65 8 11 4 2 0 56 8 0 0% 100% % % % 0.68% % % % 0.42% % 0.21% % 0% % 0.42% 0% 0%
# 0 0 0 0 0 0 0 0 0 0 0 0 0 0 0 0 0% 0% 0% 0% 0% 0% 0% 0% 0% 0% 0% 0% 0% 0% 0% 0% 0% 0%
5. Administrative # 722 62 660 4 29 42 522 7 86 7 12 0 1 2 10 0 0
Support Workers % 100% 8.59% % % 4.02% 5.82% % % % % 1.66% 0% 0.14% % 1.39% 0% 0%
# 1 1 0 0 0 1 0 0 0 0 0 0 0 0 0 0 0% 100% 100% 0% 0% 0% 100% 0% 0% 0% 0% 0% 0% 0% 0% 0% 0% 0%
# 0 0 0 0 0 0 0 0 0 0 0 0 0 0 0 0 0% 0% 0% 0% 0% 0% 0% 0% 0% 0% 0% 0% 0% 0% 0% 0% 0% 0%
# 7 7 0 1 0 5 0 1 0 0 0 0 0 0 0 0 0% 100% 100% 0% % 0% % 0% % 0% 0% 0% 0% 0% 0% 0% 0% 0%
# 0 0 0 0 0 0 0 0 0 0 0 0 0 0 0 0 0% 0% 0% 0% 0% 0% 0% 0% 0% 0% 0% 0% 0% 0% 0% 0% 0% 0%
7. Operatives
8. Laborers and Helpers
9. Service Workers
2. Professionals
3. Technicians
4. Sales Workers
6. Craft Workers
- Mid-Level (Grades 13-14)
- Other Officials and Managers
Two or More Races
American or Other Pacific Indian or
African
Asian
Native Hawaiian American
Islander Alaska Native
Latino
White
OCCUPATIONAL TOTAL RACE/ETHNICITYCATEGORIES WORKFORCE Hispanic or Non-Hispanic or Latino
U. S. DEPARTMENT OF AGRICULTURE - NATURAL RESOURCES CONSV SERVCETable A3-1: Occupational Categories - Distribution by Race/Ethnicity and Sex
Year = FY 2009

All Male Female Male Female Male Female Male Female Male Female Male Female Male Female Male Female
1. Officials and Managers- Executive/Senior Level # 102 74 28 7 1 44 19 20 7 1 0 0 0 2 1 0 0
(Grades 15 and Above) % 0.91% 0.99% 0.75% 2.04% 0.55% 0.69% 0.64% 4.09% 1.96% 1.12% 0% 0% 0% 1.07% 1.09% 0% 0%
# 421 308 113 14 8 243 79 36 21 4 1 0 0 10 4 1 0% 3.76% 4.12% 3.04% 4.08% 4.37% 3.82% 2.64% 7.36% 5.87% 4.49% 1.35% 0% 0% 5.35% 4.35% 33.33% 0%
- First Level # 79 59 20 2 1 46 15 9 4 0 0 0 0 2 0 0 0
(Grades 12 and Below) % 0.71% 0.79% 0.54% 0.58% 0.55% 0.72% 0.50% 1.84% 1.12% 0% 0% 0% 0% 1.07% 0% 0% 0%
# 544 215 329 14 19 154 206 37 88 4 9 0 0 6 5 0 2% 4.86% 2.88% 8.86% 4.08% % 2.42% 6.89% 7.57% % 4.49% % 0% 0% 3.21% 5.43% 0% 25.00%
Officials and Managers # 1,146 656 490 37 29 487 319 102 120 9 10 0 0 20 10 1 2
Total % % 8.78% % % % 7.66% % % % % % 0% 0% % % 33.33% 25.00%
# 7,401 5,231 2,170 240 112 4,501 1,791 314 144 62 48 3 4 109 64 2 6% % % % % % % % % % % % % % % % 66.67% 75.00%
# 1,910 1,518 392 61 13 1,322 359 65 8 11 4 2 0 56 8 0 0% % % % % 7.10% % % % 2.23% % 5.41% % 0% % 8.70% 0% 0%
# 0 0 0 0 0 0 0 0 0 0 0 0 0 0 0 0 0% 0% 0% 0% 0% 0% 0% 0% 0% 0% 0% 0% 0% 0% 0% 0% 0% 0%
5. Administrative # 722 62 660 4 29 42 522 7 86 7 12 0 1 2 10 0 0
Support Workers % 6.45% 0.83% % 1.17% % 0.66% % 1.43% % 7.87% % 0% % 1.07% % 0% 0%
# 1 1 0 0 0 1 0 0 0 0 0 0 0 0 0 0 0% 0.01% 0.01% 0% 0% 0% 0.02% 0% 0% 0% 0% 0% 0% 0% 0% 0% 0% 0%
# 0 0 0 0 0 0 0 0 0 0 0 0 0 0 0 0 0% 0% 0% 0% 0% 0% 0% 0% 0% 0% 0% 0% 0% 0% 0% 0% 0% 0%
# 7 7 0 1 0 5 0 1 0 0 0 0 0 0 0 0 0% 0.06% 0.09% 0% 0.29% 0% 0.08% 0% 0.20% 0% 0% 0% 0% 0% 0% 0% 0% 0%
# 0 0 0 0 0 0 0 0 0 0 0 0 0 0 0 0 0% 0% 0% 0% 0% 0% 0% 0% 0% 0% 0% 0% 0% 0% 0% 0% 0% 0%
# 7 7,475 3,712 343 183 6,358 2,991 489 358 89 74 5 5 187 92 3 8% 100% 100% 100% 100% 100% 100% 100% 100% 100% 100% 100% 100% 100% 100% 100% 100% 100%
NOTE: Percentages computed down columns and NOT across rows
7. Operatives
8. Laborers and Helpers
9. Service Workers
TOTAL
2. Professionals
3. Technicians
4. Sales Workers
6. Craft Workers
- Mid-Level (Grades 13-14)
- Other Officials and Managers
Two or More Races
American or Other Pacific Indian or
African
Asian
Native Hawaiian American
Islander Alaska Native
Latino
White
OCCUPATIONAL TOTAL RACE/ETHNICITYCATEGORIES WORKFORCE Hispanic or Non-Hispanic or Latino
U. S. DEPARTMENT OF AGRICULTURE - NATURAL RESOURCES CONSV SERVCETable A3-2: Occupational Categories - Distribution by Race/Ethnicity and Sex
Year = FY 2009

All Male Female Male Female Male Female Male Female Male Female Male Female Male Female Male Female
# 2 2 0 0 0 0 0 0 0 0 0 0 0 2 0 0 0
% 100% 100% 0% 0% 0% 0% 0% 0% 0% 0% 0% 0% 0% 100% 0% 0% 0%
# 13 6 7 2 1 2 4 2 0 0 1 0 0 0 1 0 0
% 100% 46.15% 53.85% 15.38% 7.69% 15.38% 30.77% 15.38% 0% 0% 7.69% 0% 0% 0% 7.69% 0% 0%
# 54 31 23 3 1 26 18 2 4 0 0 0 0 0 0 0 0
% 100% 57.41% 42.59% 5.56% 1.85% 48.15% 33.33% 3.70% 7.41% 0% 0% 0% 0% 0% 0% 0% 0%
# 175 69 106 6 9 47 81 10 7 5 3 0 0 1 4 0 2
% 100% 39.43% 60.57% 3.43% 5.14% 26.86% 46.29% 5.71% 4.00% 2.86% 1.71% 0% 0% 0.57% 2.29% 0% 1.14%
# 302 138 164 12 8 109 138 8 9 4 4 2 0 2 5 0 0
% 100% 45.70% 54.30% 3.97% 2.65% 36.09% 45.70% 2.65% 2.98% 1.32% 1.32% 0.66% 0% 0.66% 1.66% 0% 0%
# 380 179 201 3 8 154 162 12 23 4 3 0 0 6 5 0 0
% 100% 47.11% 52.89% 0.79% 2.11% 40.53% 42.63% 3.16% 6.05% 1.05% 0.79% 0% 0% 1.58% 1.32% 0% 0%
# 1,454 853 601 28 37 746 490 45 53 5 9 0 2 29 8 0 2
% 100% 58.67% 41.33% 1.93% 2.54% 51.31% 33.70% 3.09% 3.65% 0.34% 0.62% 0% 0.14% 1.99% 0.55% 0% 0.14%
# 484 358 126 19 5 301 101 13 14 7 4 0 1 18 1 0 0
% 100% 73.97% 26.03% 3.93% 1.03% 62.19% 20.87% 2.69% 2.89% 1.45% 0.83% 0% 0.21% 3.72% 0.21% 0% 0%
# 1,587 946 641 61 36 788 515 68 55 11 16 2 0 15 18 1 1
% 100% 59.61% 40.39% 3.84% 2.27% 49.65% 32.45% 4.28% 3.47% 0.69% 1.01% 0.13% 0% 0.95% 1.13% 0.06% 0.06%
# 32 28 4 2 0 23 3 0 1 1 0 0 0 2 0 0 0
% 100% 87.50% 12.50% 6.25% 0% 71.88% 9.38% 0% 3.13% 3.13% 0% 0% 0% 6.25% 0% 0% 0%
# 2,462 1,711 751 77 30 1,494 623 83 57 15 14 0 1 42 23 0 2
% 100% 69.50% 30.50% 3.13% 1.22% 60.68% 25.30% 3.37% 2.32% 0.61% 0.57% 0% 0.04% 1.71% 0.93% 0% 0.08%
# 3,171 2,391 780 91 35 2,082 642 145 68 20 16 1 1 51 18 1 0
% 100% 75.40% 24.60% 2.87% 1.10% 65.66% 20.25% 4.57% 2.14% 0.63% 0.50% 0.03% 0.03% 1.61% 0.57% 0.03% 0%
# 580 418 162 14 9 334 121 48 25 10 3 0 0 11 4 1 0
% 100% 72.07% 27.93% 2.41% 1.55% 57.59% 20.86% 8.28% 4.31% 1.72% 0.52% 0% 0% 1.90% 0.69% 0.17% 0%
# 309 209 100 13 3 161 59 27 33 5 1 0 0 3 3 0 1
% 100% 67.64% 32.36% 4.21% 0.97% 52.10% 19.09% 8.74% 10.68% 1.62% 0.32% 0% 0% 0.97% 0.97% 0% 0.32%
# 153 112 41 11 1 73 29 23 9 2 0 0 0 3 2 0 0
% 100% 73.20% 26.80% 7.19% 0.65% 47.71% 18.95% 15.03% 5.88% 1.31% 0% 0% 0% 1.96% 1.31% 0% 0%
All other # 0 0 0 0 0 0 0 0 0 0 0 0 0 0 0 0 0
(unspecified GS) % 0% 0% 0% 0% 0% 0% 0% 0% 0% 0% 0% 0% 0% 0% 0% 0% 0%
# 20 15 5 0 0 11 5 2 0 0 0 0 0 2 0 0 0
% 100% 75.00% 25.00% 0% 0% 55.00% 25.00% 10.00% 0% 0% 0% 0% 0% 10.00% 0% 0% 0%
U. S. DEPARTMENT OF AGRICULTURE - NATURAL RESOURCES CONSV SERVCETable A4-1: Participation Rates for General Schedule(GS) Grades by Race/Ethnicity and Sex (Perm)
Year = FY 2009
GS/GM,SES,and TOTAL RACE/ETHNICITYRelated Grades WORKFORCE Hispanic or Non-Hispanic or Latino
Latino
White
Black or African
Asian
Native Hawaiian American
Islander Alaska Native Two or More Races
American or Other Pacific Indian or
GS-01
GS-02
GS-03
GS-04
GS-05
GS-06
GS-07
GS-08
GS-09
GS-10
GS-11
Senior EX. Service
GS-12
GS-13
GS-14
GS-15

All Male Female Male Female Male Female Male Female Male Female Male Female Male Female Male Female
# 37 15 22 0 1 11 19 4 1 0 1 0 0 0 0 0 0
% 100% 40.54% 59.46% 0% 2.70% 29.73% 51.35% 10.81% 2.70% 0% 2.70% 0% 0% 0% 0% 0% 0%
# 54 24 30 5 2 14 28 0 0 2 0 0 0 3 0 0 0
% 100% 44.44% 55.56% 9.26% 3.70% 25.93% 51.85% 0% 0% 3.70% 0% 0% 0% 5.56% 0% 0% 0%
# 177 72 105 2 2 58 88 9 12 0 0 0 0 3 3 0 0
% 100% 40.68% 59.32% 1.13% 1.13% 32.77% 49.72% 5.08% 6.78% 0% 0% 0% 0% 1.69% 1.69% 0% 0%
# 140 71 69 9 1 54 60 6 6 0 0 0 0 2 2 0 0
% 100% 50.71% 49.29% 6.43% 0.71% 38.57% 42.86% 4.29% 4.29% 0% 0% 0% 0% 1.43% 1.43% 0% 0%
# 67 36 31 0 1 36 27 0 1 0 1 0 0 0 1 0 0
% 100% 53.73% 46.27% 0% 1.49% 53.73% 40.30% 0% 1.49% 0% 1.49% 0% 0% 0% 1.49% 0% 0%
# 9 3 6 0 0 3 6 0 0 0 0 0 0 0 0 0 0
% 100% 33.33% 66.67% 0% 0% 33.33% 66.67% 0% 0% 0% 0% 0% 0% 0% 0% 0% 0%
# 8 4 4 0 0 4 4 0 0 0 0 0 0 0 0 0 0
% 100% 50.00% 50.00% 0% 0% 50.00% 50.00% 0% 0% 0% 0% 0% 0% 0% 0% 0% 0%
# 0 0 0 0 0 0 0 0 0 0 0 0 0 0 0 0 0
% 0% 0% 0% 0% 0% 0% 0% 0% 0% 0% 0% 0% 0% 0% 0% 0% 0%
# 6 4 2 0 0 4 2 0 0 0 0 0 0 0 0 0 0
% 100% 66.67% 33.33% 0% 0% 66.67% 33.33% 0% 0% 0% 0% 0% 0% 0% 0% 0% 0%
# 0 0 0 0 0 0 0 0 0 0 0 0 0 0 0 0 0
% 0% 0% 0% 0% 0% 0% 0% 0% 0% 0% 0% 0% 0% 0% 0% 0% 0%
# 4 3 1 0 0 2 1 0 0 0 0 0 0 1 0 0 0
% 100% 75.00% 25.00% 0% 0% 50.00% 25.00% 0% 0% 0% 0% 0% 0% 25.00% 0% 0% 0%
# 1 1 0 0 0 1 0 0 0 0 0 0 0 0 0 0 0
% 100% 100% 0% 0% 0% 100% 0% 0% 0% 0% 0% 0% 0% 0% 0% 0% 0%
# 0 0 0 0 0 0 0 0 0 0 0 0 0 0 0 0 0
% 0% 0% 0% 0% 0% 0% 0% 0% 0% 0% 0% 0% 0% 0% 0% 0% 0%
# 0 0 0 0 0 0 0 0 0 0 0 0 0 0 0 0 0
% 0% 0% 0% 0% 0% 0% 0% 0% 0% 0% 0% 0% 0% 0% 0% 0% 0%
# 0 0 0 0 0 0 0 0 0 0 0 0 0 0 0 0 0
% 0% 0% 0% 0% 0% 0% 0% 0% 0% 0% 0% 0% 0% 0% 0% 0% 0%
All other # 0 0 0 0 0 0 0 0 0 0 0 0 0 0 0 0 0
(unspecified GS) % 0% 0% 0% 0% 0% 0% 0% 0% 0% 0% 0% 0% 0% 0% 0% 0% 0%
# 0 0 0 0 0 0 0 0 0 0 0 0 0 0 0 0 0
% 0% 0% 0% 0% 0% 0% 0% 0% 0% 0% 0% 0% 0% 0% 0% 0% 0%
U. S. DEPARTMENT OF AGRICULTURE - NATURAL RESOURCES CONSV SERVCETable A4-1: Participation Rates for General Schedule(GS) Grades by Race/Ethnicity and Sex (Temp)
Year = FY 2009
GS/GM,SES,and TOTAL RACE/ETHNICITYRelated Grades WORKFORCE Hispanic or Non-Hispanic or Latino
Latino
White
Black or African
Asian
Native Hawaiian American
Islander Alaska Native Two or More Races
American or Other Pacific Indian or
GS-01
GS-02
GS-03
GS-04
GS-05
GS-06
GS-07
GS-08
GS-09
GS-10
GS-11
Senior EX. Service
GS-12
GS-13
GS-14
GS-15

All Male Female Male Female Male Female Male Female Male Female Male Female Male Female Male Female
# 2 2 0 0 0 0 0 0 0 0 0 0 0 2 0 0 0
% 0.02% 0.03% 0% 0% 0% 0% 0% 0% 0% 0% 0% 0% 0% 1.07% 0% 0% 0%
# 13 6 7 2 1 2 4 2 0 0 1 0 0 0 1 0 0
% 0.12% 0.08% 0.19% 0.58% 0.55% 0.03% 0.13% 0.41% 0% 0% 1.35% 0% 0% 0% 1.09% 0% 0%
# 54 31 23 3 1 26 18 2 4 0 0 0 0 0 0 0 0
% 0.48% 0.42% 0.62% 0.88% 0.55% 0.41% 0.60% 0.41% 1.12% 0% 0% 0% 0% 0% 0% 0% 0%
# 175 69 106 6 9 47 81 10 7 5 3 0 0 1 4 0 2
% 1.57% 0.92% 2.86% 1.75% 4.92% 0.74% 2.71% 2.05% 1.96% 5.62% 4.05% 0% 0% 0.53% 4.35% 0% 25.00%
# 302 138 164 12 8 109 138 8 9 4 4 2 0 2 5 0 0
% 2.70% 1.85% 4.42% 3.51% 4.37% 1.72% 4.61% 1.64% 2.51% 4.49% 5.41% 40.00% 0% 1.07% 5.43% 0% 0%
# 380 179 201 3 8 154 162 12 23 4 3 0 0 6 5 0 0
% 3.40% 2.40% 5.41% 0.88% 4.37% 2.42% 5.42% 2.46% 6.42% 4.49% 4.05% 0% 0% 3.21% 5.43% 0% 0%
# 1,454 853 601 28 37 746 490 45 53 5 9 0 2 29 8 0 2
% 13.01% 11.43% 16.19% 8.19% 20.22% 11.75% 16.38% 9.22% 14.80% 5.62% 12.16% 0% 40.00% 15.51% 8.70% 0% 25.00%
# 484 358 126 19 5 301 101 13 14 7 4 0 1 18 1 0 0
% 4.33% 4.80% 3.39% 5.56% 2.73% 4.74% 3.38% 2.66% 3.91% 7.87% 5.41% 0% 20.00% 9.63% 1.09% 0% 0%
# 1,587 946 641 61 36 788 515 68 55 11 16 2 0 15 18 1 1
% 14.20% 12.67% 17.27% 17.84% 19.67% 12.41% 17.22% 13.93% 15.36% 12.36% 21.62% 40.00% 0% 8.02% 19.57% 33.33% 12.50%
# 32 28 4 2 0 23 3 0 1 1 0 0 0 2 0 0 0
% 0.29% 0.38% 0.11% 0.58% 0% 0.36% 0.10% 0% 0.28% 1.12% 0% 0% 0% 1.07% 0% 0% 0%
# 2,462 1,711 751 77 30 1,494 623 83 57 15 14 0 1 42 23 0 2
% 22.03% 22.92% 20.23% 22.51% 16.39% 23.52% 20.83% 17.01% 15.92% 16.85% 18.92% 0% 20.00% 22.46% 25.00% 0% 25.00%
# 3,171 2,391 780 91 35 2,082 642 145 68 20 16 1 1 51 18 1 0
% 28.37% 32.03% 21.01% 26.61% 19.13% 32.78% 21.46% 29.71% 18.99% 22.47% 21.62% 20.00% 20.00% 27.27% 19.57% 33.33% 0%
# 580 418 162 14 9 334 121 48 25 10 3 0 0 11 4 1 0
% 5.19% 5.60% 4.36% 4.09% 4.92% 5.26% 4.05% 9.84% 6.98% 11.24% 4.05% 0% 0% 5.88% 4.35% 33.33% 0%
# 309 209 100 13 3 161 59 27 33 5 1 0 0 3 3 0 1
% 2.76% 2.80% 2.69% 3.80% 1.64% 2.54% 1.97% 5.53% 9.22% 5.62% 1.35% 0% 0% 1.60% 3.26% 0% 12.50%
# 153 112 41 11 1 73 29 23 9 2 0 0 0 3 2 0 0
% 1.37% 1.50% 1.10% 3.22% 0.55% 1.15% 0.97% 4.71% 2.51% 2.25% 0% 0% 0% 1.60% 2.17% 0% 0%
All other # 0 0 0 0 0 0 0 0 0 0 0 0 0 0 0 0 0
(unspecified GS) % 0% 0% 0% 0% 0% 0% 0% 0% 0% 0% 0% 0% 0% 0% 0% 0% 0%
# 20 15 5 0 0 11 5 2 0 0 0 0 0 2 0 0 0
% 0.18% 0.20% 0.13% 0% 0% 0.17% 0.17% 0.41% 0% 0% 0% 0% 0% 1.07% 0% 0% 0%
# 11,178 7,466 3,712 342 183 6,351 2,991 488 358 89 74 5 5 187 92 3 8
% 100% 100% 100% 100% 100% 100% 100% 100% 100% 100% 100% 100% 100% 100% 100% 100% 100%
U. S. DEPARTMENT OF AGRICULTURE - NATURAL RESOURCES CONSV SERVCETable A4-2: Participation Rates for General Schedule(GS) Grades by Race/Ethnicity and Sex (Perm)
Year = FY 2009
GS/GM,SES,and TOTAL RACE/ETHNICITYRelated Grades WORKFORCE Hispanic or Non-Hispanic or Latino
Latino
White
Black or African
Asian
Native Hawaiian American
Islander Alaska Native Two or More Races
American or Other Pacific Indian or
GS-01
GS-02
GS-03
GS-04
GS-05
GS-06
GS-07
GS-08
GS-09
GS-10
GS-11
Senior EX. Service
TOTAL
NOTE: Percentages computed down columns and NOT across rows
GS-12
GS-13
GS-14
GS-15

All Male Female Male Female Male Female Male Female Male Female Male Female Male Female Male Female
# 37 15 22 0 1 11 19 4 1 0 1 0 0 0 0 0 0
% 7.36% 6.44% 8.15% 0% 14.29% 5.88% 8.09% 21.05% 5.00% 0% 50.00% 0% 0% 0% 0% 0% 0%
# 54 24 30 5 2 14 28 0 0 2 0 0 0 3 0 0 0
% 10.74% 10.30% 11.11% 31.25% 28.57% 7.49% 11.91% 0% 0% 100% 0% 0% 0% 33.33% 0% 0% 0%
# 177 72 105 2 2 58 88 9 12 0 0 0 0 3 3 0 0
% 35.19% 30.90% 38.89% 12.50% 28.57% 31.02% 37.45% 47.37% 60.00% 0% 0% 0% 0% 33.33% 50.00% 0% 0%
# 140 71 69 9 1 54 60 6 6 0 0 0 0 2 2 0 0
% 27.83% 30.47% 25.56% 56.25% 14.29% 28.88% 25.53% 31.58% 30.00% 0% 0% 0% 0% 22.22% 33.33% 0% 0%
# 67 36 31 0 1 36 27 0 1 0 1 0 0 0 1 0 0
% 13.32% 15.45% 11.48% 0% 14.29% 19.25% 11.49% 0% 5.00% 0% 50.00% 0% 0% 0% 16.67% 0% 0%
# 9 3 6 0 0 3 6 0 0 0 0 0 0 0 0 0 0
% 1.79% 1.29% 2.22% 0% 0% 1.60% 2.55% 0% 0% 0% 0% 0% 0% 0% 0% 0% 0%
# 8 4 4 0 0 4 4 0 0 0 0 0 0 0 0 0 0
% 1.59% 1.72% 1.48% 0% 0% 2.14% 1.70% 0% 0% 0% 0% 0% 0% 0% 0% 0% 0%
# 0 0 0 0 0 0 0 0 0 0 0 0 0 0 0 0 0
% 0% 0% 0% 0% 0% 0% 0% 0% 0% 0% 0% 0% 0% 0% 0% 0% 0%
# 6 4 2 0 0 4 2 0 0 0 0 0 0 0 0 0 0
% 1.19% 1.72% 0.74% 0% 0% 2.14% 0.85% 0% 0% 0% 0% 0% 0% 0% 0% 0% 0%
# 0 0 0 0 0 0 0 0 0 0 0 0 0 0 0 0 0
% 0% 0% 0% 0% 0% 0% 0% 0% 0% 0% 0% 0% 0% 0% 0% 0% 0%
# 4 3 1 0 0 2 1 0 0 0 0 0 0 1 0 0 0
% 0.80% 1.29% 0.37% 0% 0% 1.07% 0.43% 0% 0% 0% 0% 0% 0% 11.11% 0% 0% 0%
# 1 1 0 0 0 1 0 0 0 0 0 0 0 0 0 0 0
% 0.20% 0.43% 0% 0% 0% 0.53% 0% 0% 0% 0% 0% 0% 0% 0% 0% 0% 0%
# 0 0 0 0 0 0 0 0 0 0 0 0 0 0 0 0 0
% 0% 0% 0% 0% 0% 0% 0% 0% 0% 0% 0% 0% 0% 0% 0% 0% 0%
# 0 0 0 0 0 0 0 0 0 0 0 0 0 0 0 0 0
% 0% 0% 0% 0% 0% 0% 0% 0% 0% 0% 0% 0% 0% 0% 0% 0% 0%
# 0 0 0 0 0 0 0 0 0 0 0 0 0 0 0 0 0
% 0% 0% 0% 0% 0% 0% 0% 0% 0% 0% 0% 0% 0% 0% 0% 0% 0%
All other # 0 0 0 0 0 0 0 0 0 0 0 0 0 0 0 0 0
(unspecified GS) % 0% 0% 0% 0% 0% 0% 0% 0% 0% 0% 0% 0% 0% 0% 0% 0% 0%
# 0 0 0 0 0 0 0 0 0 0 0 0 0 0 0 0 0
% 0% 0% 0% 0% 0% 0% 0% 0% 0% 0% 0% 0% 0% 0% 0% 0% 0%
# 503 233 270 16 7 187 235 19 20 2 2 0 0 9 6 0 0
% 100% 100% 100% 100% 100% 100% 100% 100% 100% 100% 100% 100% 100% 100% 100% 100% 100%
U. S. DEPARTMENT OF AGRICULTURE - NATURAL RESOURCES CONSV SERVCETable A4-2: Participation Rates for General Schedule(GS) Grades by Race/Ethnicity and Sex (Temp)
Year = FY 2009
GS/GM,SES,and TOTAL RACE/ETHNICITYRelated Grades WORKFORCE Hispanic or Non-Hispanic or Latino
Latino
White
Black or African
Asian
Native Hawaiian American
Islander Alaska Native Two or More Races
American or Other Pacific Indian or
GS-01
GS-02
GS-03
GS-04
GS-05
GS-06
GS-07
GS-08
GS-09
GS-10
GS-11
Senior EX. Service
TOTAL
NOTE: Percentages computed down columns and NOT across rows
GS-12
GS-13
GS-14
GS-15

All Male Female Male Female Male Female Male Female Male Female Male Female Male Female Male Female
# 0 0 0 0 0 0 0 0 0 0 0 0 0 0 0 0 0
% 0% 0% 0% 0% 0% 0% 0% 0% 0% 0% 0% 0% 0% 0% 0% 0% 0%
# 0 0 0 0 0 0 0 0 0 0 0 0 0 0 0 0 0
% 0% 0% 0% 0% 0% 0% 0% 0% 0% 0% 0% 0% 0% 0% 0% 0% 0%
# 0 0 0 0 0 0 0 0 0 0 0 0 0 0 0 0 0
% 0% 0% 0% 0% 0% 0% 0% 0% 0% 0% 0% 0% 0% 0% 0% 0% 0%
# 2 2 0 1 0 1 0 0 0 0 0 0 0 0 0 0 0
% 100% 100% 0% 50.00% 0% 50.00% 0% 0% 0% 0% 0% 0% 0% 0% 0% 0% 0%
# 1 1 0 0 0 1 0 0 0 0 0 0 0 0 0 0 0
% 100% 100% 0% 0% 0% 100% 0% 0% 0% 0% 0% 0% 0% 0% 0% 0% 0%
# 0 0 0 0 0 0 0 0 0 0 0 0 0 0 0 0 0
% 0% 0% 0% 0% 0% 0% 0% 0% 0% 0% 0% 0% 0% 0% 0% 0% 0%
# 2 2 0 0 0 1 0 1 0 0 0 0 0 0 0 0 0
% 100% 100% 0% 0% 0% 50.00% 0% 50.00% 0% 0% 0% 0% 0% 0% 0% 0% 0%
# 2 2 0 0 0 2 0 0 0 0 0 0 0 0 0 0 0
% 100% 100% 0% 0% 0% 100% 0% 0% 0% 0% 0% 0% 0% 0% 0% 0% 0%
# 0 0 0 0 0 0 0 0 0 0 0 0 0 0 0 0 0
% 0% 0% 0% 0% 0% 0% 0% 0% 0% 0% 0% 0% 0% 0% 0% 0% 0%
# 1 1 0 0 0 1 0 0 0 0 0 0 0 0 0 0 0
% 100% 100% 0% 0% 0% 100% 0% 0% 0% 0% 0% 0% 0% 0% 0% 0% 0%
# 0 0 0 0 0 0 0 0 0 0 0 0 0 0 0 0 0
% 0% 0% 0% 0% 0% 0% 0% 0% 0% 0% 0% 0% 0% 0% 0% 0% 0%
# 0 0 0 0 0 0 0 0 0 0 0 0 0 0 0 0 0
% 0% 0% 0% 0% 0% 0% 0% 0% 0% 0% 0% 0% 0% 0% 0% 0% 0%
# 0 0 0 0 0 0 0 0 0 0 0 0 0 0 0 0 0
% 0% 0% 0% 0% 0% 0% 0% 0% 0% 0% 0% 0% 0% 0% 0% 0% 0%
# 0 0 0 0 0 0 0 0 0 0 0 0 0 0 0 0 0
% 0% 0% 0% 0% 0% 0% 0% 0% 0% 0% 0% 0% 0% 0% 0% 0% 0%
# 0 0 0 0 0 0 0 0 0 0 0 0 0 0 0 0 0
% 0% 0% 0% 0% 0% 0% 0% 0% 0% 0% 0% 0% 0% 0% 0% 0% 0%
All other # 0 0 0 0 0 0 0 0 0 0 0 0 0 0 0 0 0
(unspecified WG) % 0% 0% 0% 0% 0% 0% 0% 0% 0% 0% 0% 0% 0% 0% 0% 0% 0%
U. S. DEPARTMENT OF AGRICULTURE - NATURAL RESOURCES CONSV SERVCETable A5-1: Participation Rates for Wage Grades by Race/Ethnicity and Sex (Perm)
Year = FY 2009
WD/WG,WL/WS, and TOTAL RACE/ETHNICITYOther Wage Grades WORKFORCE Hispanic or Non-Hispanic or Latino
Latino
White
Black or African
Asian
Native Hawaiian American
Islander Alaska Native Two or More Races
American or Other Pacific Indian or
WG-01
WG-02
WG-03
WG-04
WG-05
WG-06
WG-07
WG-08
WG-09
WG-10
WG-11
WG-12
WG-13
WG-14
WG-15
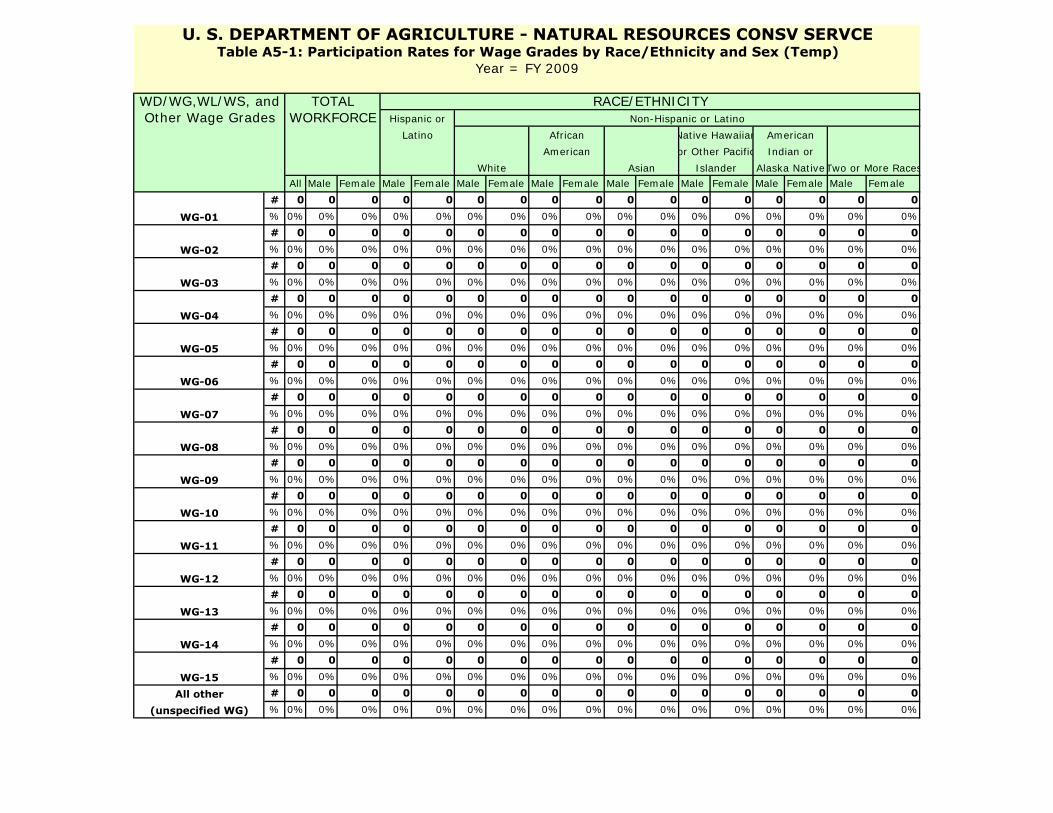
All Male Female Male Female Male Female Male Female Male Female Male Female Male Female Male Female
# 0 0 0 0 0 0 0 0 0 0 0 0 0 0 0 0 0% 0% 0% 0% 0% 0% 0% 0% 0% 0% 0% 0% 0% 0% 0% 0% 0% 0%
# 0 0 0 0 0 0 0 0 0 0 0 0 0 0 0 0 0% 0% 0% 0% 0% 0% 0% 0% 0% 0% 0% 0% 0% 0% 0% 0% 0% 0%
# 0 0 0 0 0 0 0 0 0 0 0 0 0 0 0 0 0% 0% 0% 0% 0% 0% 0% 0% 0% 0% 0% 0% 0% 0% 0% 0% 0% 0%
# 0 0 0 0 0 0 0 0 0 0 0 0 0 0 0 0 0% 0% 0% 0% 0% 0% 0% 0% 0% 0% 0% 0% 0% 0% 0% 0% 0% 0%
# 0 0 0 0 0 0 0 0 0 0 0 0 0 0 0 0 0% 0% 0% 0% 0% 0% 0% 0% 0% 0% 0% 0% 0% 0% 0% 0% 0% 0%
# 0 0 0 0 0 0 0 0 0 0 0 0 0 0 0 0 0% 0% 0% 0% 0% 0% 0% 0% 0% 0% 0% 0% 0% 0% 0% 0% 0% 0%
# 0 0 0 0 0 0 0 0 0 0 0 0 0 0 0 0 0% 0% 0% 0% 0% 0% 0% 0% 0% 0% 0% 0% 0% 0% 0% 0% 0% 0%
# 0 0 0 0 0 0 0 0 0 0 0 0 0 0 0 0 0% 0% 0% 0% 0% 0% 0% 0% 0% 0% 0% 0% 0% 0% 0% 0% 0% 0%
# 0 0 0 0 0 0 0 0 0 0 0 0 0 0 0 0 0% 0% 0% 0% 0% 0% 0% 0% 0% 0% 0% 0% 0% 0% 0% 0% 0% 0%
# 0 0 0 0 0 0 0 0 0 0 0 0 0 0 0 0 0% 0% 0% 0% 0% 0% 0% 0% 0% 0% 0% 0% 0% 0% 0% 0% 0% 0%
# 0 0 0 0 0 0 0 0 0 0 0 0 0 0 0 0 0% 0% 0% 0% 0% 0% 0% 0% 0% 0% 0% 0% 0% 0% 0% 0% 0% 0%
# 0 0 0 0 0 0 0 0 0 0 0 0 0 0 0 0 0% 0% 0% 0% 0% 0% 0% 0% 0% 0% 0% 0% 0% 0% 0% 0% 0% 0%
# 0 0 0 0 0 0 0 0 0 0 0 0 0 0 0 0 0% 0% 0% 0% 0% 0% 0% 0% 0% 0% 0% 0% 0% 0% 0% 0% 0% 0%
# 0 0 0 0 0 0 0 0 0 0 0 0 0 0 0 0 0% 0% 0% 0% 0% 0% 0% 0% 0% 0% 0% 0% 0% 0% 0% 0% 0% 0%
# 0 0 0 0 0 0 0 0 0 0 0 0 0 0 0 0 0% 0% 0% 0% 0% 0% 0% 0% 0% 0% 0% 0% 0% 0% 0% 0% 0% 0%
All other # 0 0 0 0 0 0 0 0 0 0 0 0 0 0 0 0 0
(unspecified WG) % 0% 0% 0% 0% 0% 0% 0% 0% 0% 0% 0% 0% 0% 0% 0% 0% 0%
U. S. DEPARTMENT OF AGRICULTURE - NATURAL RESOURCES CONSV SERVCETable A5-1: Participation Rates for Wage Grades by Race/Ethnicity and Sex (Temp)
Year = FY 2009
WD/WG,WL/WS, and TOTAL RACE/ETHNICITYOther Wage Grades WORKFORCE Hispanic or Non-Hispanic or Latino
Latino
White
African
Asian
Native Hawaiian American
Islander Alaska NativeTwo or More Races
American or Other Pacific Indian or
WG-01
WG-02
WG-03
WG-04
WG-05
WG-06
WG-07
WG-08
WG-09
WG-10
WG-11
WG-12
WG-13
WG-14
WG-15

All Male Female Male Female Male Female Male Female Male Female Male Female Male Female Male Female
# 0 0 0 0 0 0 0 0 0 0 0 0 0 0 0 0 0
% 0% 0% 0% 0% 0% 0% 0% 0% 0% 0% 0% 0% 0% 0% 0% 0% 0%
# 0 0 0 0 0 0 0 0 0 0 0 0 0 0 0 0 0
% 0% 0% 0% 0% 0% 0% 0% 0% 0% 0% 0% 0% 0% 0% 0% 0% 0%
# 0 0 0 0 0 0 0 0 0 0 0 0 0 0 0 0 0
% 0% 0% 0% 0% 0% 0% 0% 0% 0% 0% 0% 0% 0% 0% 0% 0% 0%
# 2 2 0 1 0 1 0 0 0 0 0 0 0 0 0 0 0
% 25.00% 25.00% 0% 100% 0% 16.67% 0% 0% 0% 0% 0% 0% 0% 0% 0% 0% 0%
# 1 1 0 0 0 1 0 0 0 0 0 0 0 0 0 0 0
% 12.50% 12.50% 0% 0% 0% 16.67% 0% 0% 0% 0% 0% 0% 0% 0% 0% 0% 0%
# 0 0 0 0 0 0 0 0 0 0 0 0 0 0 0 0 0
% 0% 0% 0% 0% 0% 0% 0% 0% 0% 0% 0% 0% 0% 0% 0% 0% 0%
# 2 2 0 0 0 1 0 1 0 0 0 0 0 0 0 0 0
% 25.00% 25.00% 0% 0% 0% 16.67% 0% 100% 0% 0% 0% 0% 0% 0% 0% 0% 0%
# 2 2 0 0 0 2 0 0 0 0 0 0 0 0 0 0 0
% 25.00% 25.00% 0% 0% 0% 33.33% 0% 0% 0% 0% 0% 0% 0% 0% 0% 0% 0%
# 0 0 0 0 0 0 0 0 0 0 0 0 0 0 0 0 0
% 0% 0% 0% 0% 0% 0% 0% 0% 0% 0% 0% 0% 0% 0% 0% 0% 0%
# 1 1 0 0 0 1 0 0 0 0 0 0 0 0 0 0 0
% 12.50% 12.50% 0% 0% 0% 16.67% 0% 0% 0% 0% 0% 0% 0% 0% 0% 0% 0%
# 0 0 0 0 0 0 0 0 0 0 0 0 0 0 0 0 0
% 0% 0% 0% 0% 0% 0% 0% 0% 0% 0% 0% 0% 0% 0% 0% 0% 0%
# 0 0 0 0 0 0 0 0 0 0 0 0 0 0 0 0 0
% 0% 0% 0% 0% 0% 0% 0% 0% 0% 0% 0% 0% 0% 0% 0% 0% 0%
# 0 0 0 0 0 0 0 0 0 0 0 0 0 0 0 0 0
% 0% 0% 0% 0% 0% 0% 0% 0% 0% 0% 0% 0% 0% 0% 0% 0% 0%
# 0 0 0 0 0 0 0 0 0 0 0 0 0 0 0 0 0
% 0% 0% 0% 0% 0% 0% 0% 0% 0% 0% 0% 0% 0% 0% 0% 0% 0%
# 0 0 0 0 0 0 0 0 0 0 0 0 0 0 0 0 0
% 0% 0% 0% 0% 0% 0% 0% 0% 0% 0% 0% 0% 0% 0% 0% 0% 0%
All other # 0 0 0 0 0 0 0 0 0 0 0 0 0 0 0 0 0
(unspecified WG) % 0% 0% 0% 0% 0% 0% 0% 0% 0% 0% 0% 0% 0% 0% 0% 0% 0%
# 8 8 0 1 0 6 0 1 0 0 0 0 0 0 0 0 0
% 100% 100% 100% 100% 100% 100% 100% 100% 100% 100% 100% 100% 100% 100% 100% 100% 100%
U. S. DEPARTMENT OF AGRICULTURE - NATURAL RESOURCES CONSV SERVCETable A5-2: Participation Rates for Wage Grades by Race/Ethnicity and Sex (Perm)
Year = FY 2009
WD/WG,WL/WS, and TOTAL RACE/ETHNICITYOther Wage Grades WORKFORCE Hispanic or Non-Hispanic or Latino
Latino
White
Black or African
Asian
Native Hawaiian American
Islander Alaska Native Two or More Races
American or Other Pacific Indian or
WG-01
WG-02
WG-03
WG-04
WG-05
WG-06
WG-07
WG-08
WG-09
WG-10
WG-11
TOTAL
NOTE: Percentages computed down columns and NOT across rows
WG-12
WG-13
WG-14
WG-15

All Male Female Male Female Male Female Male Female Male Female Male Female Male Female Male Female
# 0 0 0 0 0 0 0 0 0 0 0 0 0 0 0 0 0% 0% 0% 0% 0% 0% 0% 0% 0% 0% 0% 0% 0% 0% 0% 0% 0% 0%
# 0 0 0 0 0 0 0 0 0 0 0 0 0 0 0 0 0% 0% 0% 0% 0% 0% 0% 0% 0% 0% 0% 0% 0% 0% 0% 0% 0% 0%
# 0 0 0 0 0 0 0 0 0 0 0 0 0 0 0 0 0% 0% 0% 0% 0% 0% 0% 0% 0% 0% 0% 0% 0% 0% 0% 0% 0% 0%
# 0 0 0 0 0 0 0 0 0 0 0 0 0 0 0 0 0% 0% 0% 0% 0% 0% 0% 0% 0% 0% 0% 0% 0% 0% 0% 0% 0% 0%
# 0 0 0 0 0 0 0 0 0 0 0 0 0 0 0 0 0% 0% 0% 0% 0% 0% 0% 0% 0% 0% 0% 0% 0% 0% 0% 0% 0% 0%
# 0 0 0 0 0 0 0 0 0 0 0 0 0 0 0 0 0% 0% 0% 0% 0% 0% 0% 0% 0% 0% 0% 0% 0% 0% 0% 0% 0% 0%
# 0 0 0 0 0 0 0 0 0 0 0 0 0 0 0 0 0% 0% 0% 0% 0% 0% 0% 0% 0% 0% 0% 0% 0% 0% 0% 0% 0% 0%
# 0 0 0 0 0 0 0 0 0 0 0 0 0 0 0 0 0% 0% 0% 0% 0% 0% 0% 0% 0% 0% 0% 0% 0% 0% 0% 0% 0% 0%
# 0 0 0 0 0 0 0 0 0 0 0 0 0 0 0 0 0% 0% 0% 0% 0% 0% 0% 0% 0% 0% 0% 0% 0% 0% 0% 0% 0% 0%
# 0 0 0 0 0 0 0 0 0 0 0 0 0 0 0 0 0% 0% 0% 0% 0% 0% 0% 0% 0% 0% 0% 0% 0% 0% 0% 0% 0% 0%
# 0 0 0 0 0 0 0 0 0 0 0 0 0 0 0 0 0% 0% 0% 0% 0% 0% 0% 0% 0% 0% 0% 0% 0% 0% 0% 0% 0% 0%
# 0 0 0 0 0 0 0 0 0 0 0 0 0 0 0 0 0% 0% 0% 0% 0% 0% 0% 0% 0% 0% 0% 0% 0% 0% 0% 0% 0% 0%
# 0 0 0 0 0 0 0 0 0 0 0 0 0 0 0 0 0% 0% 0% 0% 0% 0% 0% 0% 0% 0% 0% 0% 0% 0% 0% 0% 0% 0%
# 0 0 0 0 0 0 0 0 0 0 0 0 0 0 0 0 0% 0% 0% 0% 0% 0% 0% 0% 0% 0% 0% 0% 0% 0% 0% 0% 0% 0%
# 0 0 0 0 0 0 0 0 0 0 0 0 0 0 0 0 0% 0% 0% 0% 0% 0% 0% 0% 0% 0% 0% 0% 0% 0% 0% 0% 0% 0%
All other # 0 0 0 0 0 0 0 0 0 0 0 0 0 0 0 0 0
(unspecified WG) % 0% 0% 0% 0% 0% 0% 0% 0% 0% 0% 0% 0% 0% 0% 0% 0% 0%
# 0 0 0 0 0 0 0 0 0 0 0 0 0 0 0 0 0% 100% 100% 100% 100% 100% 100% 100% 100% 100% 100% 100% 100% 100% 100% 100% 100% 100%
U. S. DEPARTMENT OF AGRICULTURE - NATURAL RESOURCES CONSV SERVCETable A5-2: Participation Rates for Wage Grades by Race/Ethnicity and Sex (Temp)
Year = FY 2009
WD/WG,WL/WS, and TOTAL RACE/ETHNICITYOther Wage Grades WORKFORCE Hispanic or Non-Hispanic or Latino
Latino
White
Black or African
Asian
Native Hawaiian American
Islander Alaska Native Two or More Races
American or Other Pacific Indian or
WG-01
WG-02
WG-03
WG-04
WG-05
WG-06
WG-07
WG-08
WG-09
WG-10
WG-11
TOTAL NOTE: Percentages computed down columns and NOT across rows
WG-12
WG-13
WG-14
WG-15

All Male Female Male Female Male Female Male Female Male Female Male Female Male Female Male Female# 6 2 4 0 0 1 4 1 0 0 0 0 0 0 0 0 0
% 100% 33.33% 66.67% 0% 0% 16.67% 66.67% 16.67% 0% 0% 0% 0% 0% 0% 0% 0% 0%
# 2 0 2 0 0 0 2 0 0 0 0 0 0 0 0 0 0
% 100% 0% 100% 0% 0% 0% 100% 0% 0% 0% 0% 0% 0% 0% 0% 0% 0%
# 1 0 1 0 0 0 0 0 1 0 0 0 0 0 0 0 0
% 100% 0% 100% 0% 0% 0% 0% 0% 100% 0% 0% 0% 0% 0% 0% 0% 0%
# 40 25 15 0 0 21 12 4 2 0 1 0 0 0 0 0 0
% 100% 62.50% 37.50% 0% 0% 52.50% 30.00% 10.00% 5.00% 0% 2.50% 0% 0% 0% 0% 0% 0%
# 16 12 4 0 0 11 4 1 0 0 0 0 0 0 0 0 0
% 100% 75.00% 25.00% 0% 0% 68.75% 25.00% 6.25% 0% 0% 0% 0% 0% 0% 0% 0% 0%
# 1 1 0 0 0 1 0 0 0 0 0 0 0 0 0 0 0
% 100% 100% 0% 0% 0% 100% 0% 0% 0% 0% 0% 0% 0% 0% 0% 0% 0%
# 4 2 2 0 0 2 1 0 1 0 0 0 0 0 0 0 0
% 100% 50.00% 50.00% 0% 0% 50.00% 25.00% 0% 25.00% 0% 0% 0% 0% 0% 0% 0% 0%
# 38 25 13 0 0 25 12 0 0 0 1 0 0 0 0 0 0
% 100% 65.79% 34.21% 0% 0% 65.79% 31.58% 0% 0% 0% 2.63% 0% 0% 0% 0% 0% 0%
# 2 1 1 0 0 1 0 0 0 0 1 0 0 0 0 0 0
% 100% 50.00% 50.00% 0% 0% 50.00% 0% 0% 0% 0% 50.00% 0% 0% 0% 0% 0% 0%
# 116 14 102 0 8 9 65 5 21 0 2 0 0 0 5 0 1
% 100% 12.07% 87.93% 0% 6.90% 7.76% 56.03% 4.31% 18.10% 0% 1.72% 0% 0% 0% 4.31% 0% 0.86%
# 46 7 39 0 3 6 23 1 11 0 2 0 0 0 0 0 0
% 100% 15.22% 84.78% 0% 6.52% 13.04% 50.00% 2.17% 23.91% 0% 4.35% 0% 0% 0% 0% 0% 0%
# 16 6 10 0 1 2 3 4 6 0 0 0 0 0 0 0 0
% 100% 37.50% 62.50% 0% 6.25% 12.50% 18.75% 25.00% 37.50% 0% 0% 0% 0% 0% 0% 0% 0%
# 89 31 58 2 3 17 29 12 22 0 0 0 0 0 2 0 2
% 100% 34.83% 65.17% 2.25% 3.37% 19.10% 32.58% 13.48% 24.72% 0% 0% 0% 0% 0% 2.25% 0% 2.25%
# 289 23 266 1 10 18 209 3 38 1 1 0 1 0 7 0 0
% 100% 7.96% 92.04% 0.35% 3.46% 6.23% 72.32% 1.04% 13.15% 0.35% 0.35% 0% 0.35% 0% 2.42% 0% 0%
U. S. DEPARTMENT OF AGRICULTURE - NATURAL RESOURCES CONSV SERVCETable A6: Participation Rates for Major Occupations - Distribution by Race/Ethnicity and Sex (Perm)
Year = FY 2009
SERIES/JOB TITLE
TOTAL RACE/ETHNICITYWORKFORCE Hispanic or Non-Hispanic or Latino
Latino
White
Black or African American
Two or More Races
Indian or
Alaska Native
American or Other Pacific
Asian
Native Hawaiian
Islander
0020 - COMMUNITY PLANNING
Occupational CLF0029 - ENVIRONMENTAL PROTECTION ASSISTANT
Occupational CLF0080 - SECURITY ADMINISTRATION
Occupational CLF0110 - ECONOMIST
Occupational CLF0150 - GEOGRAPHY
Occupational CLF0170 - HISTORY
Occupational CLF0184 - SOCIOLOGY
Occupational CLF0193 - ARCHEOLOGY
Occupational CLF0199 - SOCIAL SCIENCE STUDENT TRAINEE
Occupational CLF0201 - HUMAN RESOURCES MANAGEMENT
Occupational CLF0203 - HUMAN RESOURCES CLERICAL & ASSISTANC
Occupational CLF0260 - EQUAL EMPLOYMENT OPPORTUNITY
Occupational CLF0301 - MISCELLANEOUS ADMINISTRATION & PROGR
Occupational CLF0303 - MISCELLANEOUS CLERK & ASSISTANT
Occupational CLF
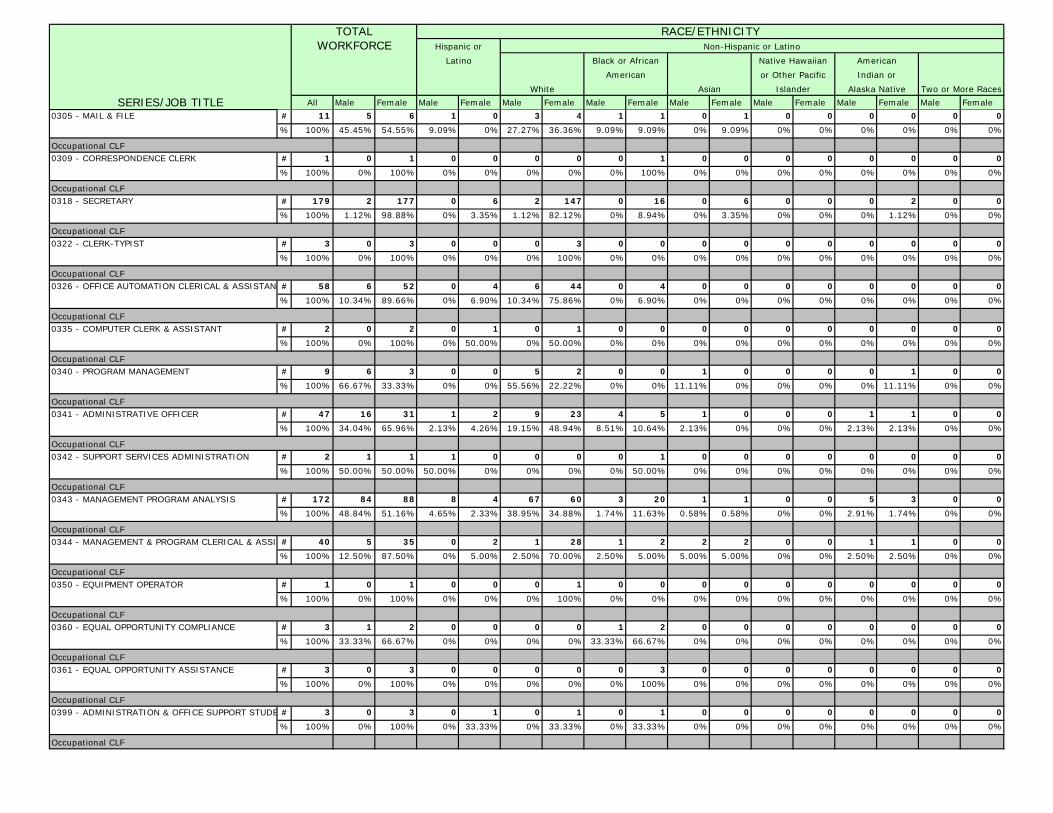
All Male Female Male Female Male Female Male Female Male Female Male Female Male Female Male FemaleSERIES/JOB TITLE
TOTAL RACE/ETHNICITYWORKFORCE Hispanic or Non-Hispanic or Latino
Latino
White
Black or African American
Two or More Races
Indian or
Alaska Native
American or Other Pacific
Asian
Native Hawaiian
Islander
# 11 5 6 1 0 3 4 1 1 0 1 0 0 0 0 0 0
% 100% 45.45% 54.55% 9.09% 0% 27.27% 36.36% 9.09% 9.09% 0% 9.09% 0% 0% 0% 0% 0% 0%
# 1 0 1 0 0 0 0 0 1 0 0 0 0 0 0 0 0
% 100% 0% 100% 0% 0% 0% 0% 0% 100% 0% 0% 0% 0% 0% 0% 0% 0%
# 179 2 177 0 6 2 147 0 16 0 6 0 0 0 2 0 0
% 100% 1.12% 98.88% 0% 3.35% 1.12% 82.12% 0% 8.94% 0% 3.35% 0% 0% 0% 1.12% 0% 0%
# 3 0 3 0 0 0 3 0 0 0 0 0 0 0 0 0 0
% 100% 0% 100% 0% 0% 0% 100% 0% 0% 0% 0% 0% 0% 0% 0% 0% 0%
# 58 6 52 0 4 6 44 0 4 0 0 0 0 0 0 0 0
% 100% 10.34% 89.66% 0% 6.90% 10.34% 75.86% 0% 6.90% 0% 0% 0% 0% 0% 0% 0% 0%
# 2 0 2 0 1 0 1 0 0 0 0 0 0 0 0 0 0
% 100% 0% 100% 0% 50.00% 0% 50.00% 0% 0% 0% 0% 0% 0% 0% 0% 0% 0%
# 9 6 3 0 0 5 2 0 0 1 0 0 0 0 1 0 0
% 100% 66.67% 33.33% 0% 0% 55.56% 22.22% 0% 0% 11.11% 0% 0% 0% 0% 11.11% 0% 0%
# 47 16 31 1 2 9 23 4 5 1 0 0 0 1 1 0 0
% 100% 34.04% 65.96% 2.13% 4.26% 19.15% 48.94% 8.51% 10.64% 2.13% 0% 0% 0% 2.13% 2.13% 0% 0%
# 2 1 1 1 0 0 0 0 1 0 0 0 0 0 0 0 0
% 100% 50.00% 50.00% 50.00% 0% 0% 0% 0% 50.00% 0% 0% 0% 0% 0% 0% 0% 0%
# 172 84 88 8 4 67 60 3 20 1 1 0 0 5 3 0 0
% 100% 48.84% 51.16% 4.65% 2.33% 38.95% 34.88% 1.74% 11.63% 0.58% 0.58% 0% 0% 2.91% 1.74% 0% 0%
# 40 5 35 0 2 1 28 1 2 2 2 0 0 1 1 0 0
% 100% 12.50% 87.50% 0% 5.00% 2.50% 70.00% 2.50% 5.00% 5.00% 5.00% 0% 0% 2.50% 2.50% 0% 0%
# 1 0 1 0 0 0 1 0 0 0 0 0 0 0 0 0 0
% 100% 0% 100% 0% 0% 0% 100% 0% 0% 0% 0% 0% 0% 0% 0% 0% 0%
# 3 1 2 0 0 0 0 1 2 0 0 0 0 0 0 0 0
% 100% 33.33% 66.67% 0% 0% 0% 0% 33.33% 66.67% 0% 0% 0% 0% 0% 0% 0% 0%
# 3 0 3 0 0 0 0 0 3 0 0 0 0 0 0 0 0
% 100% 0% 100% 0% 0% 0% 0% 0% 100% 0% 0% 0% 0% 0% 0% 0% 0%
# 3 0 3 0 1 0 1 0 1 0 0 0 0 0 0 0 0
% 100% 0% 100% 0% 33.33% 0% 33.33% 0% 33.33% 0% 0% 0% 0% 0% 0% 0% 0%
0305 - MAIL & FILE
Occupational CLF0309 - CORRESPONDENCE CLERK
Occupational CLF0318 - SECRETARY
Occupational CLF0322 - CLERK-TYPIST
Occupational CLF0326 - OFFICE AUTOMATION CLERICAL & ASSISTANC
Occupational CLF0335 - COMPUTER CLERK & ASSISTANT
Occupational CLF0340 - PROGRAM MANAGEMENT
Occupational CLF0341 - ADMINISTRATIVE OFFICER
Occupational CLF0342 - SUPPORT SERVICES ADMINISTRATION
Occupational CLF0343 - MANAGEMENT PROGRAM ANALYSIS
Occupational CLF0344 - MANAGEMENT & PROGRAM CLERICAL & ASSI
Occupational CLF0350 - EQUIPMENT OPERATOR
Occupational CLF0360 - EQUAL OPPORTUNITY COMPLIANCE
Occupational CLF0361 - EQUAL OPPORTUNITY ASSISTANCE
Occupational CLF0399 - ADMINISTRATION & OFFICE SUPPORT STUDE
Occupational CLF

All Male Female Male Female Male Female Male Female Male Female Male Female Male Female Male FemaleSERIES/JOB TITLE
TOTAL RACE/ETHNICITYWORKFORCE Hispanic or Non-Hispanic or Latino
Latino
White
Black or African American
Two or More Races
Indian or
Alaska Native
American or Other Pacific
Asian
Native Hawaiian
Islander
# 878 636 242 39 9 522 207 51 13 2 2 1 1 20 9 1 0
% 100% 72.44% 27.56% 4.44% 1.03% 59.45% 23.58% 5.81% 1.48% 0.23% 0.23% 0.11% 0.11% 2.28% 1.03% 0.11% 0%
# 37 35 2 2 0 29 2 2 0 0 0 1 0 1 0 0 0
% 100% 94.59% 5.41% 5.41% 0% 78.38% 5.41% 5.41% 0% 0% 0% 2.70% 0% 2.70% 0% 0% 0%
# 9 3 6 0 0 3 6 0 0 0 0 0 0 0 0 0 0
% 100% 33.33% 66.67% 0% 0% 33.33% 66.67% 0% 0% 0% 0% 0% 0% 0% 0% 0% 0%
# 2 2 0 0 0 2 0 0 0 0 0 0 0 0 0 0 0
% 100% 100% 0% 0% 0% 100% 0% 0% 0% 0% 0% 0% 0% 0% 0% 0% 0%
# 3 3 0 0 0 3 0 0 0 0 0 0 0 0 0 0 0
% 100% 100% 0% 0% 0% 100% 0% 0% 0% 0% 0% 0% 0% 0% 0% 0% 0%
# 298 223 75 23 4 195 67 0 0 0 2 0 0 5 2 0 0
% 100% 74.83% 25.17% 7.72% 1.34% 65.44% 22.48% 0% 0% 0% 0.67% 0% 0% 1.68% 0.67% 0% 0%
# 1 1 0 0 0 0 0 0 0 0 0 0 0 1 0 0 0
% 100% 100% 0% 0% 0% 0% 0% 0% 0% 0% 0% 0% 0% 100% 0% 0% 0%
# 4,121 2,943 1,178 117 63 2,511 972 224 78 23 23 2 3 65 37 1 2
% 100% 71.41% 28.59% 2.84% 1.53% 60.93% 23.59% 5.44% 1.89% 0.56% 0.56% 0.05% 0.07% 1.58% 0.90% 0.02% 0.05%
# 1,347 1,043 304 31 10 925 280 39 6 7 2 1 0 39 6 0 0
% 100% 77.43% 22.57% 2.30% 0.74% 68.67% 20.79% 2.90% 0.45% 0.52% 0.15% 0.07% 0% 2.90% 0.45% 0% 0%
# 40 30 10 0 0 30 9 0 0 0 0 0 0 0 1 0 0
% 100% 75.00% 25.00% 0% 0% 75.00% 22.50% 0% 0% 0% 0% 0% 0% 0% 2.50% 0% 0%
# 807 666 141 21 5 586 128 46 5 6 2 0 0 7 0 0 1
% 100% 82.53% 17.47% 2.60% 0.62% 72.61% 15.86% 5.70% 0.62% 0.74% 0.25% 0% 0% 0.87% 0% 0% 0.12%
# 121 107 14 9 0 89 14 2 0 3 0 0 0 4 0 0 0
% 100% 88.43% 11.57% 7.44% 0% 73.55% 11.57% 1.65% 0% 2.48% 0% 0% 0% 3.31% 0% 0% 0%
# 1 1 0 0 0 1 0 0 0 0 0 0 0 0 0 0 0
% 100% 100% 0% 0% 0% 100% 0% 0% 0% 0% 0% 0% 0% 0% 0% 0% 0%
# 7 5 2 0 0 5 2 0 0 0 0 0 0 0 0 0 0
% 100% 71.43% 28.57% 0% 0% 71.43% 28.57% 0% 0% 0% 0% 0% 0% 0% 0% 0% 0%
# 44 35 9 5 2 27 7 0 0 0 0 0 0 3 0 0 0
% 100% 79.55% 20.45% 11.36% 4.55% 61.36% 15.91% 0% 0% 0% 0% 0% 0% 6.82% 0% 0% 0%
0401 - GENERAL BIOLOGICAL SCIENCE
Occupational CLF0404 - BIOLOGICAL SCIENCE TECHNICIAN
Occupational CLF0408 - ECOLOGY
Occupational CLF0430 - BOTANY
Occupational CLF0437 - HORTICULTURE
Occupational CLF0454 - RANGELAND MANAGEMENT
Occupational CLF0455 - RANGE TECHNICIAN
Occupational CLF0457 - SOIL CONSERVATION
Occupational CLF0458 - SOIL CONSERVATION TECHNICIAN
Occupational CLF0460 - FORESTRY
Occupational CLF0470 - SOIL SCIENCE
Occupational CLF0471 - AGRONOMY
Occupational CLF0480 - GENERAL FISH & WILDLIFE ADMINISTRATION
Occupational CLF0482 - FISHERY BIOLOGY
Occupational CLF0486 - WILDLIFE BIOLOGY
Occupational CLF

All Male Female Male Female Male Female Male Female Male Female Male Female Male Female Male FemaleSERIES/JOB TITLE
TOTAL RACE/ETHNICITYWORKFORCE Hispanic or Non-Hispanic or Latino
Latino
White
Black or African American
Two or More Races
Indian or
Alaska Native
American or Other Pacific
Asian
Native Hawaiian
Islander
# 160 71 89 7 6 45 62 11 8 6 7 0 0 2 5 0 1
% 100% 44.38% 55.63% 4.38% 3.75% 28.13% 38.75% 6.88% 5.00% 3.75% 4.38% 0% 0% 1.25% 3.13% 0% 0.63%
# 12 2 10 0 0 0 9 2 1 0 0 0 0 0 0 0 0
% 100% 16.67% 83.33% 0% 0% 0% 75.00% 16.67% 8.33% 0% 0% 0% 0% 0% 0% 0% 0%
# 33 3 30 0 0 1 24 0 6 2 0 0 0 0 0 0 0
% 100% 9.09% 90.91% 0% 0% 3.03% 72.73% 0% 18.18% 6.06% 0% 0% 0% 0% 0% 0% 0%
# 2 1 1 0 0 1 1 0 0 0 0 0 0 0 0 0 0
% 100% 50.00% 50.00% 0% 0% 50.00% 50.00% 0% 0% 0% 0% 0% 0% 0% 0% 0% 0%
# 10 2 8 0 0 2 3 0 4 0 1 0 0 0 0 0 0
% 100% 20.00% 80.00% 0% 0% 20.00% 30.00% 0% 40.00% 0% 10.00% 0% 0% 0% 0% 0% 0%
# 18 1 17 0 0 1 15 0 2 0 0 0 0 0 0 0 0
% 100% 5.56% 94.44% 0% 0% 5.56% 83.33% 0% 11.11% 0% 0% 0% 0% 0% 0% 0% 0%
# 14 1 13 0 1 0 11 1 1 0 0 0 0 0 0 0 0
% 100% 7.14% 92.86% 0% 7.14% 0% 78.57% 7.14% 7.14% 0% 0% 0% 0% 0% 0% 0% 0%
# 111 20 91 3 5 15 54 2 25 0 7 0 0 0 0 0 0
% 100% 18.02% 81.98% 2.70% 4.50% 13.51% 48.65% 1.80% 22.52% 0% 6.31% 0% 0% 0% 0% 0% 0%
# 1 0 1 0 0 0 1 0 0 0 0 0 0 0 0 0 0
% 100% 0% 100% 0% 0% 0% 100% 0% 0% 0% 0% 0% 0% 0% 0% 0% 0%
# 6 3 3 0 0 2 3 0 0 1 0 0 0 0 0 0 0
% 100% 50.00% 50.00% 0% 0% 33.33% 50.00% 0% 0% 16.67% 0% 0% 0% 0% 0% 0% 0%
# 435 388 47 23 0 331 45 16 0 3 1 0 0 15 1 0 0
% 100% 89.20% 10.80% 5.29% 0% 76.09% 10.34% 3.68% 0% 0.69% 0.23% 0% 0% 3.45% 0.23% 0% 0%
# 4 2 2 1 1 1 1 0 0 0 0 0 0 0 0 0 0
% 100% 50.00% 50.00% 25.00% 25.00% 25.00% 25.00% 0% 0% 0% 0% 0% 0% 0% 0% 0% 0%
# 31 31 0 2 0 25 0 3 0 0 0 0 0 1 0 0 0
% 100% 100% 0% 6.45% 0% 80.65% 0% 9.68% 0% 0% 0% 0% 0% 3.23% 0% 0% 0%
# 516 429 87 18 11 375 69 8 2 16 2 0 0 12 3 0 0
% 100% 83.14% 16.86% 3.49% 2.13% 72.67% 13.37% 1.55% 0.39% 3.10% 0.39% 0% 0% 2.33% 0.58% 0% 0%
# 3 3 0 0 0 2 0 1 0 0 0 0 0 0 0 0 0
% 100% 100% 0% 0% 0% 66.67% 0% 33.33% 0% 0% 0% 0% 0% 0% 0% 0% 0%
0499 - BIOLOGICAL SCIENCE STUDENT TRAINEE
Occupational CLF0501 - FINANCIAL ADMINISTRATION & PROGRAM
Occupational CLF0503 - FINANCIAL CLERICAL & TECHNICIAN
Occupational CLF0505 - FINANCIAL MANAGEMENT
Occupational CLF0510 - ACCOUNTING
Occupational CLF0525 - ACCOUNTING TECHNICIAN
Occupational CLF0540 - VOUCHER EXAMINING
Occupational CLF0560 - BUDGET ANALYSIS
Occupational CLF0561 - BUDGET CLERICAL & ASSISTANCE
Occupational CLF0801 - GENERAL ENGINEERING
Occupational CLF0802 - ENGINEERING TECHNICIAN
Occupational CLF0807 - LANDSCAPE ARCHITECTURE
Occupational CLF0809 - CONSTRUCTION CONTROL
Occupational CLF0810 - CIVIL ENGINEERING
Occupational CLF0817 - SURVEYING TECHNICIAN
Occupational CLF

All Male Female Male Female Male Female Male Female Male Female Male Female Male Female Male FemaleSERIES/JOB TITLE
TOTAL RACE/ETHNICITYWORKFORCE Hispanic or Non-Hispanic or Latino
Latino
White
Black or African American
Two or More Races
Indian or
Alaska Native
American or Other Pacific
Asian
Native Hawaiian
Islander
# 21 16 5 1 0 13 5 1 0 1 0 0 0 0 0 0 0
% 100% 76.19% 23.81% 4.76% 0% 61.90% 23.81% 4.76% 0% 4.76% 0% 0% 0% 0% 0% 0% 0%
# 7 7 0 0 0 7 0 0 0 0 0 0 0 0 0 0 0
% 100% 100% 0% 0% 0% 100% 0% 0% 0% 0% 0% 0% 0% 0% 0% 0% 0%
# 255 185 70 7 2 167 62 8 2 2 2 0 0 1 2 0 0
% 100% 72.55% 27.45% 2.75% 0.78% 65.49% 24.31% 3.14% 0.78% 0.78% 0.78% 0% 0% 0.39% 0.78% 0% 0%
# 42 23 19 5 4 14 13 3 0 0 0 0 0 1 1 0 1
% 100% 54.76% 45.24% 11.90% 9.52% 33.33% 30.95% 7.14% 0% 0% 0% 0% 0% 2.38% 2.38% 0% 2.38%
# 1 0 1 0 0 0 1 0 0 0 0 0 0 0 0 0 0
% 100% 0% 100% 0% 0% 0% 100% 0% 0% 0% 0% 0% 0% 0% 0% 0% 0%
# 3 0 3 0 0 0 3 0 0 0 0 0 0 0 0 0 0
% 100% 0% 100% 0% 0% 0% 100% 0% 0% 0% 0% 0% 0% 0% 0% 0% 0%
# 1 0 1 0 0 0 1 0 0 0 0 0 0 0 0 0 0
% 100% 0% 100% 0% 0% 0% 100% 0% 0% 0% 0% 0% 0% 0% 0% 0% 0%
# 84 25 59 0 0 24 50 1 7 0 2 0 0 0 0 0 0
% 100% 29.76% 70.24% 0% 0% 28.57% 59.52% 1.19% 8.33% 0% 2.38% 0% 0% 0% 0% 0% 0%
# 1 0 1 0 0 0 1 0 0 0 0 0 0 0 0 0 0
% 100% 0% 100% 0% 0% 0% 100% 0% 0% 0% 0% 0% 0% 0% 0% 0% 0%
# 2 2 0 0 0 2 0 0 0 0 0 0 0 0 0 0 0
% 100% 100% 0% 0% 0% 100% 0% 0% 0% 0% 0% 0% 0% 0% 0% 0% 0%
# 18 4 14 0 1 3 11 0 2 0 0 0 0 0 0 1 0
% 100% 22.22% 77.78% 0% 5.56% 16.67% 61.11% 0% 11.11% 0% 0% 0% 0% 0% 0% 5.56% 0%
# 1 0 1 0 0 0 1 0 0 0 0 0 0 0 0 0 0
% 100% 0% 100% 0% 0% 0% 100% 0% 0% 0% 0% 0% 0% 0% 0% 0% 0%
# 17 1 16 0 2 1 10 0 3 0 1 0 0 0 0 0 0
% 100% 5.88% 94.12% 0% 11.76% 5.88% 58.82% 0% 17.65% 0% 5.88% 0% 0% 0% 0% 0% 0%
# 2 0 2 0 0 0 2 0 0 0 0 0 0 0 0 0 0
% 100% 0% 100% 0% 0% 0% 100% 0% 0% 0% 0% 0% 0% 0% 0% 0% 0%
# 4 1 3 0 0 1 1 0 2 0 0 0 0 0 0 0 0
% 100% 25.00% 75.00% 0% 0% 25.00% 25.00% 0% 50.00% 0% 0% 0% 0% 0% 0% 0% 0%
0819 - ENVIRONMENTAL ENGINEERING
Occupational CLF0856 - ELECTRONICS TECHNICIAN
Occupational CLF0890 - AGRICULTURAL ENGINEERING
Occupational CLF0899 - ENGINEERING & ARCHITECTURE STUDENT TR
Occupational CLF0963 - LEGAL INSTRUMENTS EXAMINING
Occupational CLF1001 - GENERAL ARTS & INFORMATION
Occupational CLF1020 - ILLUSTRATING
Occupational CLF1035 - PUBLIC AFFAIRS
Occupational CLF1060 - PHOTOGRAPHY
Occupational CLF1071 - AUDIOVISUAL PRODUCTION
Occupational CLF1082 - WRITING & EDITING
Occupational CLF1083 - TECHNICAL WRITING & EDITING
Occupational CLF1084 - VISUAL INFORMATION
Occupational CLF1087 - EDITORIAL ASSISTANCE
Occupational CLF1099 - INFORMATION & ARTS STUDENT TRAINEE
Occupational CLF

All Male Female Male Female Male Female Male Female Male Female Male Female Male Female Male FemaleSERIES/JOB TITLE
TOTAL RACE/ETHNICITYWORKFORCE Hispanic or Non-Hispanic or Latino
Latino
White
Black or African American
Two or More Races
Indian or
Alaska Native
American or Other Pacific
Asian
Native Hawaiian
Islander
# 23 5 18 0 0 2 10 3 7 0 1 0 0 0 0 0 0
% 100% 21.74% 78.26% 0% 0% 8.70% 43.48% 13.04% 30.43% 0% 4.35% 0% 0% 0% 0% 0% 0%
# 84 33 51 0 3 23 37 9 11 1 0 0 0 0 0 0 0
% 100% 39.29% 60.71% 0% 3.57% 27.38% 44.05% 10.71% 13.10% 1.19% 0% 0% 0% 0% 0% 0% 0%
# 28 7 21 0 3 5 14 1 4 1 0 0 0 0 0 0 0
% 100% 25.00% 75.00% 0% 10.71% 17.86% 50.00% 3.57% 14.29% 3.57% 0% 0% 0% 0% 0% 0% 0%
# 4 2 2 1 0 0 2 0 0 0 0 0 0 1 0 0 0
% 100% 50.00% 50.00% 25.00% 0% 0% 50.00% 0% 0% 0% 0% 0% 0% 25.00% 0% 0% 0%
# 3 2 1 0 0 2 1 0 0 0 0 0 0 0 0 0 0
% 100% 66.67% 33.33% 0% 0% 66.67% 33.33% 0% 0% 0% 0% 0% 0% 0% 0% 0% 0%
# 1 1 0 0 0 1 0 0 0 0 0 0 0 0 0 0 0
% 100% 100% 0% 0% 0% 100% 0% 0% 0% 0% 0% 0% 0% 0% 0% 0% 0%
# 8 4 4 0 0 4 3 0 1 0 0 0 0 0 0 0 0
% 100% 50.00% 50.00% 0% 0% 50.00% 37.50% 0% 12.50% 0% 0% 0% 0% 0% 0% 0% 0%
# 20 10 10 0 0 10 10 0 0 0 0 0 0 0 0 0 0
% 100% 50.00% 50.00% 0% 0% 50.00% 50.00% 0% 0% 0% 0% 0% 0% 0% 0% 0% 0%
# 35 29 6 0 0 29 6 0 0 0 0 0 0 0 0 0 0
% 100% 82.86% 17.14% 0% 0% 82.86% 17.14% 0% 0% 0% 0% 0% 0% 0% 0% 0% 0%
# 9 8 1 3 0 5 1 0 0 0 0 0 0 0 0 0 0
% 100% 88.89% 11.11% 33.33% 0% 55.56% 11.11% 0% 0% 0% 0% 0% 0% 0% 0% 0% 0%
# 1 1 0 0 0 1 0 0 0 0 0 0 0 0 0 0 0
% 100% 100% 0% 0% 0% 100% 0% 0% 0% 0% 0% 0% 0% 0% 0% 0% 0%
# 1 1 0 0 0 1 0 0 0 0 0 0 0 0 0 0 0
% 100% 100% 0% 0% 0% 100% 0% 0% 0% 0% 0% 0% 0% 0% 0% 0% 0%
# 33 27 6 0 0 26 6 0 0 0 0 0 0 1 0 0 0
% 100% 81.82% 18.18% 0% 0% 78.79% 18.18% 0% 0% 0% 0% 0% 0% 3.03% 0% 0% 0%
1101 - GENERAL BUSINESS & INDUSTRY
Occupational CLF1102 - CONTRACTING
Occupational CLF1105 - PURCHASING
Occupational CLF1106 - PROCUREMENT CLERICAL & ASSISTANCE
Occupational CLF1170 - REALTY
Occupational CLF1171 - APPRAISING
Occupational CLF1301 - GENERAL PHYSICAL SCIENCE
Occupational CLF1311 - PHYSICAL SCIENCE TECHNICIAN
Occupational CLF1315 - HYDROLOGY
Occupational CLF1316 - HYDROLOGIC TECHNICIAN
Occupational CLF1320 - CHEMISTRY
Occupational CLF1340 - METEOROLOGY
Occupational CLF1350 - GEOLOGY
Occupational CLF
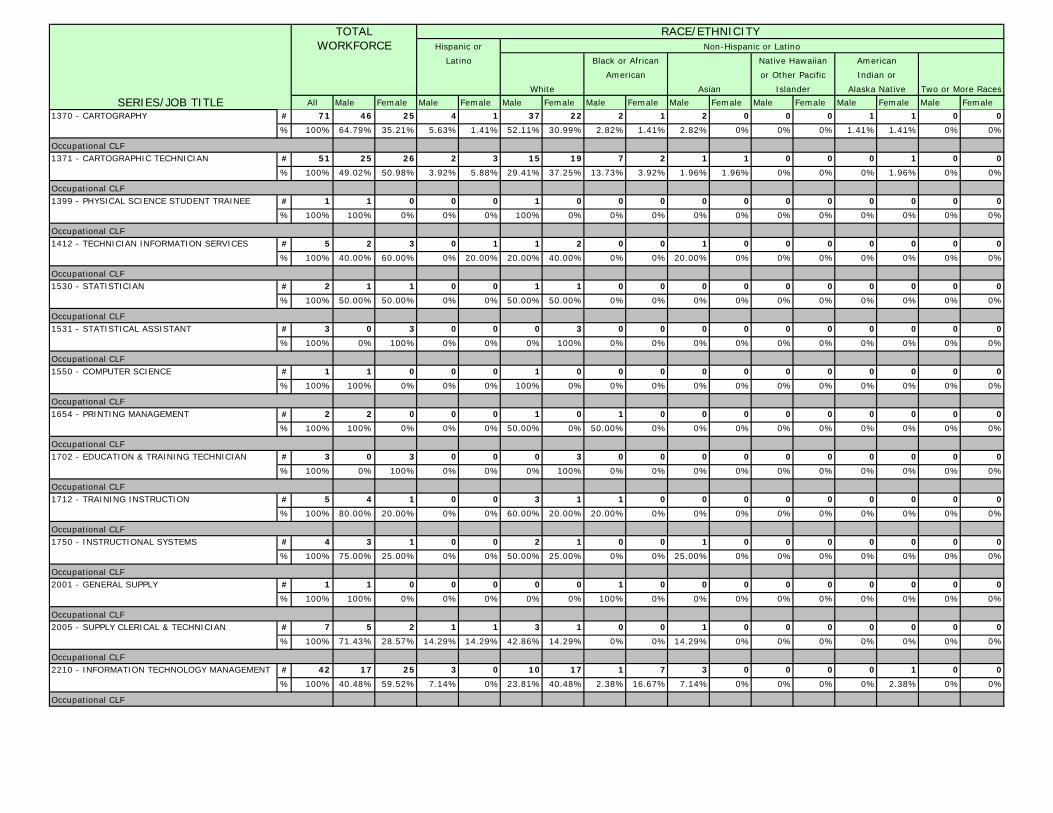
All Male Female Male Female Male Female Male Female Male Female Male Female Male Female Male FemaleSERIES/JOB TITLE
TOTAL RACE/ETHNICITYWORKFORCE Hispanic or Non-Hispanic or Latino
Latino
White
Black or African American
Two or More Races
Indian or
Alaska Native
American or Other Pacific
Asian
Native Hawaiian
Islander
# 71 46 25 4 1 37 22 2 1 2 0 0 0 1 1 0 0
% 100% 64.79% 35.21% 5.63% 1.41% 52.11% 30.99% 2.82% 1.41% 2.82% 0% 0% 0% 1.41% 1.41% 0% 0%
# 51 25 26 2 3 15 19 7 2 1 1 0 0 0 1 0 0
% 100% 49.02% 50.98% 3.92% 5.88% 29.41% 37.25% 13.73% 3.92% 1.96% 1.96% 0% 0% 0% 1.96% 0% 0%
# 1 1 0 0 0 1 0 0 0 0 0 0 0 0 0 0 0
% 100% 100% 0% 0% 0% 100% 0% 0% 0% 0% 0% 0% 0% 0% 0% 0% 0%
# 5 2 3 0 1 1 2 0 0 1 0 0 0 0 0 0 0
% 100% 40.00% 60.00% 0% 20.00% 20.00% 40.00% 0% 0% 20.00% 0% 0% 0% 0% 0% 0% 0%
# 2 1 1 0 0 1 1 0 0 0 0 0 0 0 0 0 0
% 100% 50.00% 50.00% 0% 0% 50.00% 50.00% 0% 0% 0% 0% 0% 0% 0% 0% 0% 0%
# 3 0 3 0 0 0 3 0 0 0 0 0 0 0 0 0 0
% 100% 0% 100% 0% 0% 0% 100% 0% 0% 0% 0% 0% 0% 0% 0% 0% 0%
# 1 1 0 0 0 1 0 0 0 0 0 0 0 0 0 0 0
% 100% 100% 0% 0% 0% 100% 0% 0% 0% 0% 0% 0% 0% 0% 0% 0% 0%
# 2 2 0 0 0 1 0 1 0 0 0 0 0 0 0 0 0
% 100% 100% 0% 0% 0% 50.00% 0% 50.00% 0% 0% 0% 0% 0% 0% 0% 0% 0%
# 3 0 3 0 0 0 3 0 0 0 0 0 0 0 0 0 0
% 100% 0% 100% 0% 0% 0% 100% 0% 0% 0% 0% 0% 0% 0% 0% 0% 0%
# 5 4 1 0 0 3 1 1 0 0 0 0 0 0 0 0 0
% 100% 80.00% 20.00% 0% 0% 60.00% 20.00% 20.00% 0% 0% 0% 0% 0% 0% 0% 0% 0%
# 4 3 1 0 0 2 1 0 0 1 0 0 0 0 0 0 0
% 100% 75.00% 25.00% 0% 0% 50.00% 25.00% 0% 0% 25.00% 0% 0% 0% 0% 0% 0% 0%
# 1 1 0 0 0 0 0 1 0 0 0 0 0 0 0 0 0
% 100% 100% 0% 0% 0% 0% 0% 100% 0% 0% 0% 0% 0% 0% 0% 0% 0%
# 7 5 2 1 1 3 1 0 0 1 0 0 0 0 0 0 0
% 100% 71.43% 28.57% 14.29% 14.29% 42.86% 14.29% 0% 0% 14.29% 0% 0% 0% 0% 0% 0% 0%
# 42 17 25 3 0 10 17 1 7 3 0 0 0 0 1 0 0
% 100% 40.48% 59.52% 7.14% 0% 23.81% 40.48% 2.38% 16.67% 7.14% 0% 0% 0% 0% 2.38% 0% 0%
1370 - CARTOGRAPHY
Occupational CLF1371 - CARTOGRAPHIC TECHNICIAN
Occupational CLF1399 - PHYSICAL SCIENCE STUDENT TRAINEE
Occupational CLF1412 - TECHNICIAN INFORMATION SERVICES
Occupational CLF1530 - STATISTICIAN
Occupational CLF1531 - STATISTICAL ASSISTANT
Occupational CLF1550 - COMPUTER SCIENCE
Occupational CLF1654 - PRINTING MANAGEMENT
Occupational CLF1702 - EDUCATION & TRAINING TECHNICIAN
Occupational CLF1712 - TRAINING INSTRUCTION
Occupational CLF1750 - INSTRUCTIONAL SYSTEMS
Occupational CLF2001 - GENERAL SUPPLY
Occupational CLF2005 - SUPPLY CLERICAL & TECHNICIAN
Occupational CLF2210 - INFORMATION TECHNOLOGY MANAGEMENT
Occupational CLF

All Male Female Male Female Male Female Male Female Male Female Male Female Male Female Male FemaleSERIES/JOB TITLE
TOTAL RACE/ETHNICITYWORKFORCE Hispanic or Non-Hispanic or Latino
Latino
White
Black or African American
Two or More Races
Indian or
Alaska Native
American or Other Pacific
Asian
Native Hawaiian
Islander
# 1 1 0 0 0 1 0 0 0 0 0 0 0 0 0 0 0
% 100% 100% 0% 0% 0% 100% 0% 0% 0% 0% 0% 0% 0% 0% 0% 0% 0%
# 6 6 0 1 0 4 0 1 0 0 0 0 0 0 0 0 0
% 100% 100% 0% 16.67% 0% 66.67% 0% 16.67% 0% 0% 0% 0% 0% 0% 0% 0% 0%
# 1 1 0 0 0 1 0 0 0 0 0 0 0 0 0 0 0
% 100% 100% 0% 0% 0% 100% 0% 0% 0% 0% 0% 0% 0% 0% 0% 0% 0%
5002 - FARMING
Occupational CLF5003 - GARDENING
Occupational CLF5729 - DRILL RIG OPERATING
Occupational CLF
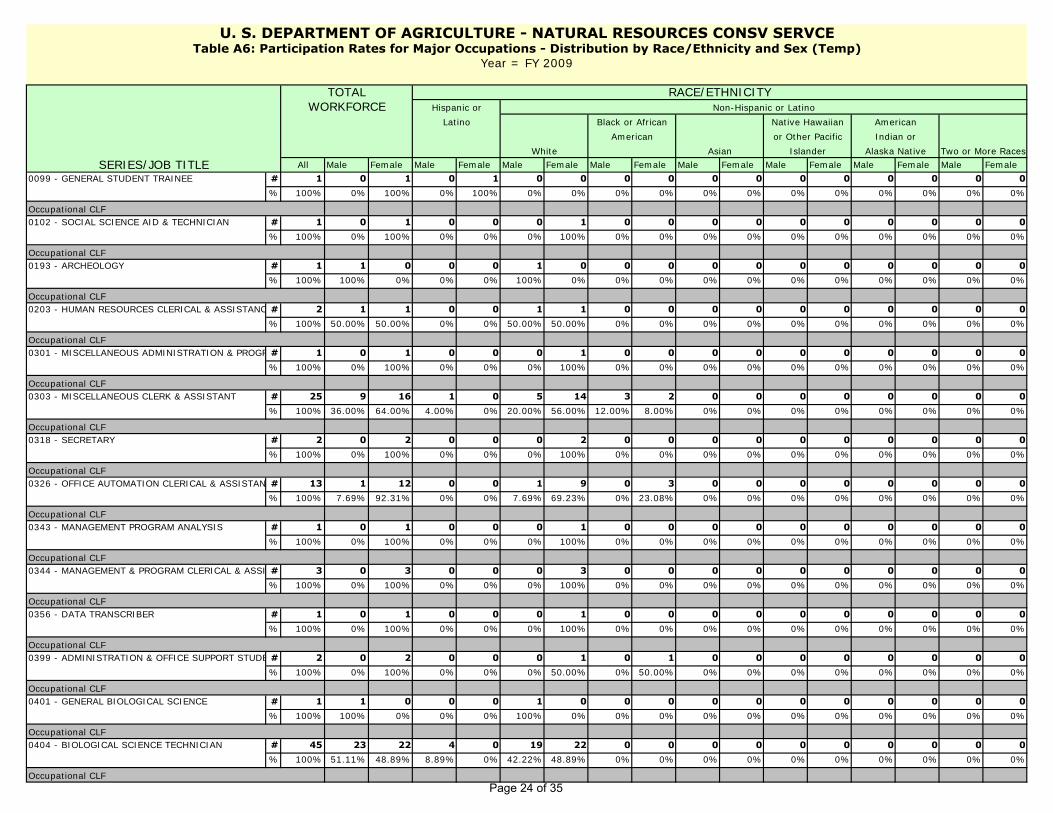
All Male Female Male Female Male Female Male Female Male Female Male Female Male Female Male Female# 1 0 1 0 1 0 0 0 0 0 0 0 0 0 0 0 0% 100% 0% 100% 0% 100% 0% 0% 0% 0% 0% 0% 0% 0% 0% 0% 0% 0%
# 1 0 1 0 0 0 1 0 0 0 0 0 0 0 0 0 0% 100% 0% 100% 0% 0% 0% 100% 0% 0% 0% 0% 0% 0% 0% 0% 0% 0%
# 1 1 0 0 0 1 0 0 0 0 0 0 0 0 0 0 0% 100% 100% 0% 0% 0% 100% 0% 0% 0% 0% 0% 0% 0% 0% 0% 0% 0%
# 2 1 1 0 0 1 1 0 0 0 0 0 0 0 0 0 0% 100% 50.00% 50.00% 0% 0% 50.00% 50.00% 0% 0% 0% 0% 0% 0% 0% 0% 0% 0%
# 1 0 1 0 0 0 1 0 0 0 0 0 0 0 0 0 0% 100% 0% 100% 0% 0% 0% 100% 0% 0% 0% 0% 0% 0% 0% 0% 0% 0%
# 25 9 16 1 0 5 14 3 2 0 0 0 0 0 0 0 0% 100% 36.00% 64.00% 4.00% 0% 20.00% 56.00% 12.00% 8.00% 0% 0% 0% 0% 0% 0% 0% 0%
# 2 0 2 0 0 0 2 0 0 0 0 0 0 0 0 0 0% 100% 0% 100% 0% 0% 0% 100% 0% 0% 0% 0% 0% 0% 0% 0% 0% 0%
# 13 1 12 0 0 1 9 0 3 0 0 0 0 0 0 0 0% 100% 7.69% 92.31% 0% 0% 7.69% 69.23% 0% 23.08% 0% 0% 0% 0% 0% 0% 0% 0%
# 1 0 1 0 0 0 1 0 0 0 0 0 0 0 0 0 0% 100% 0% 100% 0% 0% 0% 100% 0% 0% 0% 0% 0% 0% 0% 0% 0% 0%
# 3 0 3 0 0 0 3 0 0 0 0 0 0 0 0 0 0% 100% 0% 100% 0% 0% 0% 100% 0% 0% 0% 0% 0% 0% 0% 0% 0% 0%
# 1 0 1 0 0 0 1 0 0 0 0 0 0 0 0 0 0% 100% 0% 100% 0% 0% 0% 100% 0% 0% 0% 0% 0% 0% 0% 0% 0% 0%
# 2 0 2 0 0 0 1 0 1 0 0 0 0 0 0 0 0% 100% 0% 100% 0% 0% 0% 50.00% 0% 50.00% 0% 0% 0% 0% 0% 0% 0% 0%
# 1 1 0 0 0 1 0 0 0 0 0 0 0 0 0 0 0% 100% 100% 0% 0% 0% 100% 0% 0% 0% 0% 0% 0% 0% 0% 0% 0% 0%
# 45 23 22 4 0 19 22 0 0 0 0 0 0 0 0 0 0% 100% 51.11% 48.89% 8.89% 0% 42.22% 48.89% 0% 0% 0% 0% 0% 0% 0% 0% 0% 0%
U. S. DEPARTMENT OF AGRICULTURE - NATURAL RESOURCES CONSV SERVCETable A6: Participation Rates for Major Occupations - Distribution by Race/Ethnicity and Sex (Temp)
Year = FY 2009
SERIES/JOB TITLE
TOTAL RACE/ETHNICITYWORKFORCE Hispanic or Non-Hispanic or Latino
Latino
White
Black or African American
Two or More RacesIndian or
Alaska NativeAmerican or Other Pacific
Asian
Native Hawaiian
Islander
0099 - GENERAL STUDENT TRAINEE
Occupational CLF0102 - SOCIAL SCIENCE AID & TECHNICIAN
Occupational CLF0193 - ARCHEOLOGY
Occupational CLF0203 - HUMAN RESOURCES CLERICAL & ASSISTANC
Occupational CLF0301 - MISCELLANEOUS ADMINISTRATION & PROGR
Occupational CLF0303 - MISCELLANEOUS CLERK & ASSISTANT
Occupational CLF0318 - SECRETARY
Occupational CLF0326 - OFFICE AUTOMATION CLERICAL & ASSISTAN
Occupational CLF0343 - MANAGEMENT PROGRAM ANALYSIS
Occupational CLF0344 - MANAGEMENT & PROGRAM CLERICAL & ASSI
Occupational CLF0356 - DATA TRANSCRIBER
Occupational CLF0399 - ADMINISTRATION & OFFICE SUPPORT STUDE
Occupational CLF0401 - GENERAL BIOLOGICAL SCIENCE
Occupational CLF0404 - BIOLOGICAL SCIENCE TECHNICIAN
Occupational CLFPage 24 of 35
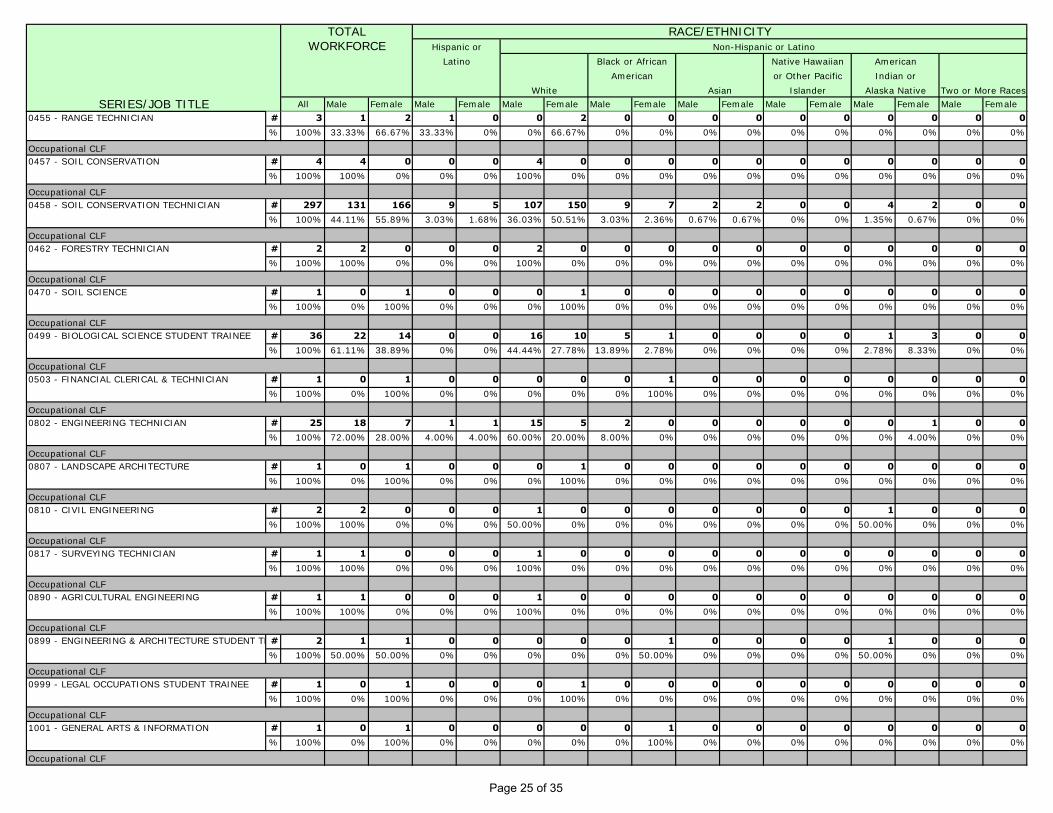
All Male Female Male Female Male Female Male Female Male Female Male Female Male Female Male FemaleSERIES/JOB TITLE
TOTAL RACE/ETHNICITYWORKFORCE Hispanic or Non-Hispanic or Latino
Latino
White
Black or African American
Two or More RacesIndian or
Alaska NativeAmerican or Other Pacific
Asian
Native Hawaiian
Islander
# 3 1 2 1 0 0 2 0 0 0 0 0 0 0 0 0 0% 100% 33.33% 66.67% 33.33% 0% 0% 66.67% 0% 0% 0% 0% 0% 0% 0% 0% 0% 0%
# 4 4 0 0 0 4 0 0 0 0 0 0 0 0 0 0 0% 100% 100% 0% 0% 0% 100% 0% 0% 0% 0% 0% 0% 0% 0% 0% 0% 0%
# 297 131 166 9 5 107 150 9 7 2 2 0 0 4 2 0 0% 100% 44.11% 55.89% 3.03% 1.68% 36.03% 50.51% 3.03% 2.36% 0.67% 0.67% 0% 0% 1.35% 0.67% 0% 0%
# 2 2 0 0 0 2 0 0 0 0 0 0 0 0 0 0 0% 100% 100% 0% 0% 0% 100% 0% 0% 0% 0% 0% 0% 0% 0% 0% 0% 0%
# 1 0 1 0 0 0 1 0 0 0 0 0 0 0 0 0 0% 100% 0% 100% 0% 0% 0% 100% 0% 0% 0% 0% 0% 0% 0% 0% 0% 0%
# 36 22 14 0 0 16 10 5 1 0 0 0 0 1 3 0 0% 100% 61.11% 38.89% 0% 0% 44.44% 27.78% 13.89% 2.78% 0% 0% 0% 0% 2.78% 8.33% 0% 0%
# 1 0 1 0 0 0 0 0 1 0 0 0 0 0 0 0 0% 100% 0% 100% 0% 0% 0% 0% 0% 100% 0% 0% 0% 0% 0% 0% 0% 0%
# 25 18 7 1 1 15 5 2 0 0 0 0 0 0 1 0 0% 100% 72.00% 28.00% 4.00% 4.00% 60.00% 20.00% 8.00% 0% 0% 0% 0% 0% 0% 4.00% 0% 0%
# 1 0 1 0 0 0 1 0 0 0 0 0 0 0 0 0 0% 100% 0% 100% 0% 0% 0% 100% 0% 0% 0% 0% 0% 0% 0% 0% 0% 0%
# 2 2 0 0 0 1 0 0 0 0 0 0 0 1 0 0 0% 100% 100% 0% 0% 0% 50.00% 0% 0% 0% 0% 0% 0% 0% 50.00% 0% 0% 0%
# 1 1 0 0 0 1 0 0 0 0 0 0 0 0 0 0 0% 100% 100% 0% 0% 0% 100% 0% 0% 0% 0% 0% 0% 0% 0% 0% 0% 0%
# 1 1 0 0 0 1 0 0 0 0 0 0 0 0 0 0 0% 100% 100% 0% 0% 0% 100% 0% 0% 0% 0% 0% 0% 0% 0% 0% 0% 0%
# 2 1 1 0 0 0 0 0 1 0 0 0 0 1 0 0 0% 100% 50.00% 50.00% 0% 0% 0% 0% 0% 50.00% 0% 0% 0% 0% 50.00% 0% 0% 0%
# 1 0 1 0 0 0 1 0 0 0 0 0 0 0 0 0 0% 100% 0% 100% 0% 0% 0% 100% 0% 0% 0% 0% 0% 0% 0% 0% 0% 0%
# 1 0 1 0 0 0 0 0 1 0 0 0 0 0 0 0 0% 100% 0% 100% 0% 0% 0% 0% 0% 100% 0% 0% 0% 0% 0% 0% 0% 0%
0455 - RANGE TECHNICIAN
Occupational CLF0457 - SOIL CONSERVATION
Occupational CLF0458 - SOIL CONSERVATION TECHNICIAN
Occupational CLF0462 - FORESTRY TECHNICIAN
Occupational CLF0470 - SOIL SCIENCE
Occupational CLF0499 - BIOLOGICAL SCIENCE STUDENT TRAINEE
Occupational CLF0503 - FINANCIAL CLERICAL & TECHNICIAN
Occupational CLF0802 - ENGINEERING TECHNICIAN
Occupational CLF0807 - LANDSCAPE ARCHITECTURE
Occupational CLF0810 - CIVIL ENGINEERING
Occupational CLF0817 - SURVEYING TECHNICIAN
Occupational CLF0890 - AGRICULTURAL ENGINEERING
Occupational CLF0899 - ENGINEERING & ARCHITECTURE STUDENT TR
Occupational CLF0999 - LEGAL OCCUPATIONS STUDENT TRAINEE
Occupational CLF1001 - GENERAL ARTS & INFORMATION
Occupational CLF
Page 25 of 35

All Male Female Male Female Male Female Male Female Male Female Male Female Male Female Male FemaleSERIES/JOB TITLE
TOTAL RACE/ETHNICITYWORKFORCE Hispanic or Non-Hispanic or Latino
Latino
White
Black or African American
Two or More RacesIndian or
Alaska NativeAmerican or Other Pacific
Asian
Native Hawaiian
Islander
# 1 0 1 0 0 0 1 0 0 0 0 0 0 0 0 0 0% 100% 0% 100% 0% 0% 0% 100% 0% 0% 0% 0% 0% 0% 0% 0% 0% 0%
# 2 1 1 0 0 0 1 0 0 0 0 0 0 1 0 0 0% 100% 50.00% 50.00% 0% 0% 0% 50.00% 0% 0% 0% 0% 0% 0% 50.00% 0% 0% 0%
# 2 0 2 0 0 0 1 0 1 0 0 0 0 0 0 0 0% 100% 0% 100% 0% 0% 0% 50.00% 0% 50.00% 0% 0% 0% 0% 0% 0% 0% 0%
# 3 3 0 0 0 3 0 0 0 0 0 0 0 0 0 0 0% 100% 100% 0% 0% 0% 100% 0% 0% 0% 0% 0% 0% 0% 0% 0% 0% 0%
# 5 4 1 0 0 4 1 0 0 0 0 0 0 0 0 0 0% 100% 80.00% 20.00% 0% 0% 80.00% 20.00% 0% 0% 0% 0% 0% 0% 0% 0% 0% 0%
# 11 4 7 0 0 3 5 0 2 0 0 0 0 1 0 0 0% 100% 36.36% 63.64% 0% 0% 27.27% 45.45% 0% 18.18% 0% 0% 0% 0% 9.09% 0% 0% 0%
# 1 1 0 0 0 1 0 0 0 0 0 0 0 0 0 0 0% 100% 100% 0% 0% 0% 100% 0% 0% 0% 0% 0% 0% 0% 0% 0% 0% 0%
# 1 1 0 0 0 1 0 0 0 0 0 0 0 0 0 0 0% 100% 100% 0% 0% 0% 100% 0% 0% 0% 0% 0% 0% 0% 0% 0% 0% 0%
1035 - PUBLIC AFFAIRS
Occupational CLF1087 - EDITORIAL ASSISTANCE
Occupational CLF1101 - GENERAL BUSINESS & INDUSTRY
Occupational CLF1311 - PHYSICAL SCIENCE TECHNICIAN
Occupational CLF1316 - HYDROLOGIC TECHNICIAN
Occupational CLF
2005 - SUPPLY CLERICAL & TECHNICIAN
Occupational CLF
1371 - CARTOGRAPHIC TECHNICIAN
Occupational CLF1399 - PHYSICAL SCIENCE STUDENT TRAINEE
Occupational CLF
Page 26 of 35

All Male Female Male Female Male Female Male Female Male Female Male Female Male Female Male Female
Total Received #
#
% 100%
Qualified of those #
Identified % 100%
#
% 100%
Total Received #
#
% 100%
Qualified of those #
Identified % 100%
#
% 100%
Total Received #
#
% 100%
Qualified of those #
Identified % 100%
#
% 100%
Total Received #
#
% 100%
Qualified of those #
Identified % 100%
#
% 100%
U. S. DEPARTMENT OF AGRICULTURE - NATURAL RESOURCES CONSV SERVCETable A7: Applicants and Hires for Major Occupations - Distribution by Race/Ethnicity and Sex (Perm)
Year = FY 2009
TOTAL RACE/ETHNICITYWORKFORCE Hispanic or Non-Hispanic or Latino
Latino
White
African American
Two or More Races
Indian or
Alaska Native
American or Other Pacific
Asian
Native Hawaiian
Islander
Job Title/Series:
Voluntarily Identified
Selected of those Identif
CLF
Job Title/Series:
Voluntarily Identified
Selected of those Identif
CLF
Job Title/Series:
Voluntarily Identified
Selected of those Identif
CLF
Job Title/Series:
Voluntarily Identified
Selected of those Identif
CLF

All Male Female Male Female Male Female Male Female Male Female Male Female Male Female Male Female
Total Received #
#
% 100%
Qualified of those #
Identified % 100%
#
% 100%
Total Received #
#
% 100%
Qualified of those #
Identified % 100%
#
% 100%
Total Received #
#
% 100%
Qualified of those #
Identified % 100%
#
% 100%
Total Received #
#
% 100%
Qualified of those #
Identified % 100%
#
% 100%
U. S. DEPARTMENT OF AGRICULTURE - NATURAL RESOURCES CONSV SERVCETable A7: Applicants and Hires for Major Occupations - Distribution by Race/Ethnicity and Sex (Temp)
Year = FY 2009
TOTAL RACE/ETHNICITYWORKFORCE Hispanic or Non-Hispanic or Latino
Latino
White
African American
Two or More Races
Indian or
Alaska Native
American or Other Pacific
Asian
Native Hawaiian
Islander
Job Title/Series:
Voluntarily Identified
Selected of those Identified
CLF
Job Title/Series:
Voluntarily Identified
Selected of those Identified
CLF
Job Title/Series:
Voluntarily Identified
Selected of those Identified
CLF
Job Title/Series:
Voluntarily Identified
Selected of those Identified
CLF

All Male Female Male Female Male Female Male Female Male Female Male Female Male Female Male Female# 562 318 244 19 21 262 177 22 28 7 7 0 2 6 3 1 5% 100% 56.58% 43.42% 3.38% 3.74% 46.62% 31.49% 3.91% 4.98% 1.25% 1.25% 0% 0.36% 1.07% 0.53% 0.18% 0.89%
# 389 193 196 15 12 150 149 19 23 1 5 0 0 7 4 1 3% 100% 49.61% 50.39% 3.86% 3.08% 38.56% 38.30% 4.88% 5.91% 0.26% 1.29% 0% 0% 1.80% 1.03% 0.26% 0.77%
NON- # 47 24 23 1 2 21 19 1 2 0 0 0 0 1 0 0 0APPROPRIATED % 100% 51.06% 48.94% 2.13% 4.26% 44.68% 40.43% 2.13% 4.26% 0% 0% 0% 0% 2.13% 0% 0% 0%
CLF % 100% 53.20% 46.80% 6.20% 4.50% 39.00% 33.70% 4.80% 5.70% 1.90% 1.70% 0.10% 0.10% 0.30% 0.30% 0.80% 0.80%
U. S. DEPARTMENT OF AGRICULTURE - NATURAL RESOURCES CONSV SERVCETable A8: New Hires By Type of Appointment - Distribution by Race/Ethnicity and Sex
Year = FY 2009
TYPE TOTAL RACE/ETHNICITYOF WORKFORCE Hispanic or Non-Hispanic or Latino
Asian
Native Hawaiian American
Islander Alaska Native
Black or AfricanAPPOINTMENT Latino
White
PERMANENT
TEMPORARY
Two or More Races
American or Other Pacific Indian or

All Male Female Male Female Male Female Male Female Male Female Male Female Male Female Male Female
Total Applications
Received
#
% 100%
#
% 100%
Total Applications
Received
#
% 100%
#
% 100%
Total Applications
Received
#
% 100%
#
% 100%
Total Applications
Received
#
% 100%
#
% 100%
U. S. DEPARTMENT OF AGRICULTURE - NATURAL RESOURCES CONSV SERVCETable A9: Selections for Internal Competitive Promotions for Major Occupations - Distribution by Race/Ethnicity and Sex
Year = FY 2009
TOTAL RACE/ETHNICITYWORKFORCE Hispanic or Non-Hispanic or Latino
Latino
White
Black or African American
Two or More Races
Indian or
Alaska Native
American or Other Pacific
Asian
Native Hawaiian
Islander
Job Series of Vacancy:
#
Qualified
Selected
Relevant Applicant Pool
Job Series of Vacancy:
#
Qualified
Selected
Relevant Applicant Pool
Job Series of Vacancy:
#
Qualified
Selected
Relevant Applicant Pool
Job Series of Vacancy:
#
"Relevant Applicant Pool" = all employees in the next lower pay grade and in all series that qualify them for the position announced.
Qualified
Selected
Relevant Applicant Pool

All Male Female Male Female Male Female Male Female Male Female Male Female Male Female Male Female
Total EmployeesEligible for CareerLadder Promotions % 100% 59.20% 40.80% 1.67% 2.06% 40.03% 26.51% 1.80% 1.80% 1.67% 0.51% 0.13% 0.26% 1.42% 0.77% 0.00% 0.00%
# 118 67 51 6 2 54 40 4 6 2 2 1 0 0 1 0 0% 100% 56.78% 43.22% 5.08% 1.69% 45.76% 33.90% 3.39% 5.08% 1.69% 1.69% 0.85% 0.00% 0.00% 0.85% 0.00% 0.00%
# 63 42 21 1 2 37 16 1 0 1 1 0 0 0 2 0 0% 100% 66.67% 33.33% 1.59% 3.17% 58.73% 25.40% 1.59% 0.00% 1.59% 1.59% 0.00% 0.00% 0.00% 3.17% 0.00% 0.00%
# 241 148 93 1 4 129 82 6 3 4 1 0 0 8 3 0 0% 100% 61.41% 38.59% 0.41% 1.66% 53.53% 34.02% 2.49% 1.24% 1.66% 0.41% 0.00% 0.00% 3.32% 1.24% 0.00% 0.00%
U. S. DEPARTMENT OF AGRICULTURE - NATURAL RESOURCES CONSV SERVCETable A10: NON-COMPETITIVE PROMOTIONS - TIME IN GRADE - Distribution by Race/Ethnicity and Sex
Year = FY 2009
TOTAL RACE/ETHNICITYWORKFORCE Hispanic or Non-Hispanic or Latino
Latino
White
Black or African American
Two or More Races
Indian or
Alaska NativeIslander
American or Other Pacific
Asian
Native Hawaiian
777 460 317 0
Time in grade in excess of minimum
1 2 11 614 14 13
1 - 12 months
13 - 24 months
25+ months
0413 16 311 206#

All Male Female Male Female Male Female Male Female Male Female Male Female Male Female Male Female
Total Applications #
Received % 100%
#
% 100%
#
% 100%
Total Applications #
Received % 100%
#
% 100%
#
% 100%
Total Applications #
Received % 100%
#
% 100%
#
% 100%
U. S. DEPARTMENT OF AGRICULTURE - NATURAL RESOURCES CONSV SERVCETable A11: Internal Selections for Senior Level Positions (GS 13/14, GS 15, and SES) - Distribution by Race/Ethnicity and Sex
Year = FY 2009
TOTAL RACE/ETHNICITYWORKFORCE Hispanic or Non-Hispanic or Latino
Latino
White
Black or African American
Two or More Races
Indian or
Alaska Native
American or Other Pacific
Asian
Native Hawaiian
Islander
Grade(s) of Vacancy:
Qualified
Selected
Relevant Applicant Pool
Grade(s) of Vacancy:
Qualified
Selected
Relevant Applicant Pool
"Relevant Applicant Pool" = all employees in the next lower pay grade and in all series that qualify them for the position announced.
Grade(s) of Vacancy:
Qualified
Selected
Relevant Applicant Pool

All Male Female Male Female Male Female Male Female Male Female Male Female Male Female Male Female
Slots #
%
#
%
#
%
Slots #
%
#
%
#
%
Slots #
%
#
%
#
%
U. S. DEPARTMENT OF AGRICULTURE - NATURAL RESOURCES CONSV SERVCETable A12: Participation in Career Development - Distribution by Race/Ethnicity and Sex
Year = FY 2009
TOTAL RACE/ETHNICITYWORKFORCE Hispanic or Non-Hispanic or Latino
Latino
White
African American
Two or More Races
Indian or
Alaska Native
American or Other Pacific
Asian
Native Hawaiian
Islander
Career Development Programs for GS 5-12:
Relevant Pool
Applied
Participants
Career Development Programs for GS 13 - 14:
Relevant Pool
Applied
Participants
Career Development Programs for GS 15 and SES:
Relevant Pool
Applied
Participants
"Relevant Applicant Pool" = all employees in the next lower pay grade and in all series that qualify them for the position announced.

All Male Female Male Female Male Female Male Female Male Female Male Female Male Female Male Female
Total Time-Off # 454 296 158 25 12 251 128 13 12 5 3 0 0 2 3 0 0
Awards Given % 100% 65.20% 34.80% 5.51% 2.64% 55.29% 28.19% 2.86% 2.64% 1.10% 0.66% 0% 0% 0.44% 0.66% 0% 0%
3,206 2,118 1,088 196 84 1,788 896 79 67 39 17 0 0 16 24 0 07 7 7 8 7 7 7 6 6 8 6 0 0 8 8 0 0
Total Time-Off # 160 77 83 1 5 70 67 6 5 0 2 0 0 0 4 0 0
Awards Given % 100% 48.13% 51.88% 0.63% 3.13% 43.75% 41.88% 3.75% 3.13% 0% 1.25% 0% 0% 0% 2.50% 0% 0%
3,374 1,648 1,726 24 95 1,473 1,375 151 123 0 29 0 0 0 104 0 021 21 21 24 19 21 21 25 25 0 15 0 0 0 26 0 0
Total Cash Awards # 2,194 1,284 910 63 39 1,064 744 90 82 23 24 1 1 42 17 1 3
Given % 100% 58.52% 41.48% 2.87% 1.78% 48.50% 33.91% 4.10% 3.74% 1.05% 1.09% 0.05% 0.05% 1.91% 0.77% 0.05% 0.14%
802,950 477,278 325,672 24,998 15,006 395,423 265,191 31,944 29,495 8,580 8,267 437 153 15,761 6,643 135 917366 372 358 397 385 372 356 355 360 373 344 437 153 375 391 135 306
Total Cash Awards # 5,396 3,514 1,882 187 96 2,970 1,473 217 226 47 40 2 2 90 45 1 0
Given % 100% 65.12% 34.88% 3.47% 1.78% 55.04% 27.30% 4.02% 4.19% 0.87% 0.74% 0.04% 0.04% 1.67% 0.83% 0.02% 0%
6,259,950 4,084,853 2,175,097 205,084 111,809 3,436,763 1,650,999 273,212 315,554 58,352 46,809 1,765 1,786 108,827 48,140 850 01,160 1,162 1,156 1,097 1,165 1,157 1,121 1,259 1,396 1,242 1,170 883 893 1,209 1,070 850 0
# 304 155 149 11 11 128 106 14 22 1 3 0 0 1 7 0 0% 100% 50.99% 49.01% 3.62% 3.62% 42.11% 34.87% 4.61% 7.24% 0.33% 0.99% 0% 0% 0.33% 2.30% 0% 0%
559,208 288,110 271,098 21,087 20,799 233,752 185,516 29,423 47,484 1,924 5,134 0 0 1,924 12,165 0 01,840 1,859 1,819 1,917 1,891 1,826 1,750 2,102 2,158 1,924 1,711 0 0 1,924 1,738 0 0
U. S. DEPARTMENT OF AGRICULTURE - NATURAL RESOURCES CONSV SERVCETable A13: Employee Recognition and Awards - Distribution by Race/Ethnicity and Sex
Year = FY 2009
RECOGNITION OR AWARD
TOTAL RACE/ETHNICITYWORKFORCE Hispanic or Non-Hispanic or Latino
Latino
White
Black or African American
Two or More Races
Indian or
Alaska Native
American or Other Pacific
Asian
Native Hawaiian
Islander
TIME-OFF AWARDS - 1-9 HOURS
Total HoursAverage Hours
TIME-OFF AWARDS - 9+ HOURS
Total HoursAverage Hours
CASH AWARDS - $100 - $500
Total AmountAverage Amount
CASH AWARDS - $500+
Total AmountAverage Amount
QUALITY STEP INCREASES (QSI)
Total QSI's AwardedTotal Benefit
Average Benefit

All Male Female Male Female Male Female Male Female Male Female Male Female Male Female Male Female# 552 382 170 9 6 324 134 26 20 6 3 0 0 17 6 0 1% 100% 69.20% 30.80% 1.63% 1.09% 58.70% 24.28% 4.71% 3.62% 1.09% 0.54% 0% 0% 3.08% 1.09% 0% 0.18%
# 46 31 15 1 1 19 12 6 2 2 0 0 0 3 0 0 0% 100% 67.39% 32.61% 2.17% 2.17% 41.30% 26.09% 13.04% 4.35% 4.35% 0% 0% 0% 6.52% 0% 0% 0%
# 598 413 185 10 7 343 146 32 22 8 3 0 0 20 6 0 1% 100% 69.06% 30.94% 1.67% 1.17% 57.36% 24.41% 5.35% 3.68% 1.34% 0.50% 0% 0% 3.34% 1.00% 0% 0.17%
# 11,187 7,475 3,712 343 183 6,358 2,991 489 358 89 74 5 5 187 92 3 8% 100% 66.82% 33.18% 3.07% 1.64% 56.83% 26.74% 4.37% 3.20% 0.80% 0.66% 0.04% 0.04% 1.67% 0.82% 0.03% 0.07%
U. S. DEPARTMENT OF AGRICULTURE - NATURAL RESOURCES CONSV SERVCETable A14: Separations by Type of Separation - Distribution by Race/Ethnicity and Sex
Year = FY 2009
TYPE TOTAL RACE/ETHNICITYOF WORKFORCE Hispanic or Non-Hispanic or Latino
SEPARATION Latino
White
Black or African
Asian
Native Hawaiian American
Islander Alaska Native Two or More Races
American or Other Pacific Indian or
VOLUNTARY
INVOLUNTARY
TOTAL SEPARATIONS
TOTAL WORKFORCE

TOTALWORKFORCE [05] No [01] Not [06-94] Targeted [16,17] [23,25] [28,32-38] [64-68] [71-78] [82] [90] Menta[91] Menta [92]
Disability Identified Disability Disability Deafness Blindness Missing Partial Total ConvulsiveRetardation Illness Distortion of
Limbs Paralysis Paralysis Disorder Limb/Spine
# 11,780 10,816 165 799 116 18 11 8 22 11 13 5 24 4% 100% 91.82% 1.40% 6.78% 0.98% 0.15% 0.09% 0.07% 0.19% 0.09% 0.11% 0.04% 0.20% 0.03%
# 11,853 10,909 166 778 108 17 9 8 19 11 13 5 22 4% 100% 92.04% 1.40% 6.56% 0.91% 0.14% 0.08% 0.07% 0.16% 0.09% 0.11% 0.04% 0.19% 0.03%
Federal High % 2.00%
Difference # 73 93 1 -21 -8 -1 -2 0 -3 0 0 0 -2 0Ratio Change % 0% 0.22% 0% -0.22% -0.07% -0.01% -0.02% 0% -0.03% 0% 0% 0% -0.02% 0%
Net Change % 0.62% 0.86% 0.61% -2.63% -6.90% -5.56% -18.18% 0% -13.64% 0% 0% 0% -8.33% 0%
# 11,128 10,205 162 761 107 18 9 8 19 10 13 5 21 4% 100% 91.71% 1.46% 6.84% 0.96% 0.16% 0.08% 0.07% 0.17% 0.09% 0.12% 0.04% 0.19% 0.04%
# 11,187 10,293 159 735 100 17 8 8 15 10 13 5 20 4% 100% 92.01% 1.42% 6.57% 0.89% 0.15% 0.07% 0.07% 0.13% 0.09% 0.12% 0.04% 0.18% 0.04%
Difference # 59 88 -3 -26 -7 -1 -1 0 -4 0 0 0 -1 0Ratio Change % 0% 0.30% -0.03% -0.27% -0.07% -0.01% -0.01% 0% -0.04% 0% 0% 0% -0.01% 0%
Net Change % 0.53% 0.86% -1.85% -3.42% -6.54% -5.56% -11.11% 0% -21.05% 0% 0% 0% -4.76% 0%
# 461 439 2 20 4 0 1 0 2 1 0 0 0 0% 100% 95.23% 0.43% 4.34% 0.87% 0% 0.22% 0% 0.43% 0.22% 0% 0% 0% 0%
# 503 471 6 26 3 0 0 0 2 1 0 0 0 0% 100% 93.64% 1.19% 5.17% 0.60% 0% 0% 0% 0.40% 0.20% 0% 0% 0% 0%
Difference # 42 32 4 6 -1 0 -1 0 0 0 0 0 0 0Ratio Change % 0% -1.59% 0.76% 0.83% -0.27% 0% -0.22% 0% -0.04% -0.02% 0% 0% 0% 0%
Net Change % 9.11% 7.29% 200.00% 30.00% -25.00% 0% -100% 0% 0% 0% 0% 0% 0% 0%
# 191 172 1 18 5 0 1 0 1 0 0 0 3 0% 100% 90.05% 0.52% 9.42% 2.62% 0% 0.52% 0% 0.52% 0% 0% 0% 1.57% 0%
# 163 145 1 17 5 0 1 0 2 0 0 0 2 0% 100% 88.96% 0.61% 10.43% 3.07% 0% 0.61% 0% 1.23% 0% 0% 0% 1.23% 0%
Difference # -28 -27 0 -1 0 0 0 0 1 0 0 0 -1 0Ratio Change % 0% -1.10% 0.09% 1.01% 0.45% 0% 0.09% 0% 0.70% 0% 0% 0% -0.34% 0%
Net Change % -14.66% -15.70% 0% -5.56% 0% 0% 0% 0% 100% 100% 0% 0% -33.33% 0%
U. S. DEPARTMENT OF AGRICULTURE - NATURAL RESOURCES CONSV SERVCETable B1: Total Workforce - Distribution by Disability [OPM Form 256 Self-Identification Codes]
Year = FY 2009
EMPLOYMENT Total by Disability Status Total for Targeted DisabilitiesTENURE
TOTALPrior FY
Current FY
PERMANENTPrior FY
Current FY
Prior FY
Current FY
TEMPORARYPrior FY
Current FY
NON-APPROPRIATED

TOTALWORKFORCE [05] No [01] Not [06-94] Targeted [16,17] [23,25] [28,32-38] [64-68] [71-78] [82] [90] Mental[91] Menta [92]
Disability IdentifiedDisability Disability Deafness Blindness Missing Partial Total Convulsive Retardation Illness Distortion of
Limbs Paralysis Paralysis Disorder Limb/Spine# 11,187 10,293 159 735 100 17 8 8 15 10 13 5 20 4% 100% 92.01% 1.42% 6.57% 0.89% 0.15% 0.07% 0.07% 0.13% 0.09% 0.12% 0.04% 0.18% 0.04%
Federal High % 2.00%
# 186 170 1 15 1 0 0 0 0 0 0 0 1 0% 100% 91.40% 0.54% 8.06% 0.54% 0% 0% 0% 0% 0% 0% 0% 0.54% 0%
# 65 57 1 7 1 0 0 0 1 0 0 0 0 0% 100% 87.69% 1.54% 10.77% 1.54% 0% 0% 0% 1.54% 0% 0% 0% 0% 0%
# 144 133 4 7 1 1 0 0 0 0 0 0 0 0% 100% 92.36% 2.78% 4.86% 0.69% 0.69% 0% 0% 0% 0% 0% 0% 0% 0%
# 223 202 2 19 3 1 0 0 0 0 0 1 1 0% 100% 90.58% 0.90% 8.52% 1.35% 0.45% 0% 0% 0% 0% 0% 0.45% 0.45% 0%
# 368 344 4 20 1 0 0 0 0 0 0 0 1 0% 100% 93.48% 1.09% 5.43% 0.27% 0% 0% 0% 0% 0% 0% 0% 0.27% 0%
# 278 258 4 16 3 0 0 1 0 0 0 0 2 0% 100% 92.81% 1.44% 5.76% 1.08% 0% 0% 0.36% 0% 0% 0% 0% 0.72% 0%
# 51 47 0 4 1 0 0 1 0 0 0 0 0 0% 100% 92.16% 0% 7.84% 1.96% 0% 0% 1.96% 0% 0% 0% 0% 0% 0%
# 39 35 2 2 0 0 0 0 0 0 0 0 0 0% 100% 89.74% 5.13% 5.13% 0% 0% 0% 0% 0% 0% 0% 0% 0% 0%
# 181 169 2 10 0 0 0 0 0 0 0 0 0 0% 100% 93.37% 1.10% 5.52% 0% 0% 0% 0% 0% 0% 0% 0% 0% 0%
# 230 219 1 10 2 0 0 0 0 0 1 0 1 0% 100% 95.22% 0.43% 4.35% 0.87% 0% 0% 0% 0% 0% 0.43% 0% 0.43% 0%
# 102 92 1 9 2 2 0 0 0 0 0 0 0 0% 100% 90.20% 0.98% 8.82% 1.96% 1.96% 0% 0% 0% 0% 0% 0% 0% 0%
# 181 171 3 7 2 0 0 0 2 0 0 0 0 0% 100% 94.48% 1.66% 3.87% 1.10% 0% 0% 0% 1.10% 0% 0% 0% 0% 0%
# 297 281 4 12 3 0 0 0 2 1 0 0 0 0% 100% 94.61% 1.35% 4.04% 1.01% 0% 0% 0% 0.67% 0.34% 0% 0% 0% 0%
# 253 241 0 12 1 0 0 0 0 0 0 0 1 0% 100% 95.26% 0% 4.74% 0.40% 0% 0% 0% 0% 0% 0% 0% 0.40% 0%
# 425 391 4 30 5 0 0 0 0 1 1 1 0 2% 100% 92.00% 0.94% 7.06% 1.18% 0% 0% 0% 0% 0.24% 0.24% 0.24% 0% 0.47%
# 336 308 5 23 4 0 0 1 1 0 2 0 0 0% 100% 91.67% 1.49% 6.85% 1.19% 0% 0% 0.30% 0.30% 0% 0.60% 0% 0% 0%
# 233 217 6 10 2 1 1 0 0 0 0 0 0 0% 100% 93.13% 2.58% 4.29% 0.86% 0.43% 0.43% 0% 0% 0% 0% 0% 0% 0%
# 220 203 2 15 1 0 0 0 0 0 0 0 0 1% 100% 92.27% 0.91% 6.82% 0.45% 0% 0% 0% 0% 0% 0% 0% 0% 0.45%
# 80 71 2 7 0 0 0 0 0 0 0 0 0 0% 100% 88.75% 2.50% 8.75% 0% 0% 0% 0% 0% 0% 0% 0% 0% 0%
LA STATE CONSERVATIONIST OFF
MAINE STATE CONSERVATIONISTS OFFICE
IN STATE CONSERVATIONISTS OFF
IA STATE CONSERVATIONISTS OFF
KS STATE CONSERVATIONISTS OFF
KY STATE CONSERVATIONISTS OFFI
GA STATE CONSERVATIONISTS OFFC
PACIFIC ISLANDS STATE OFFICE
IDAHO STATE CONSERVATIONIST OFFICE
IL STATE CONSERVATIONISTS OFF
CO STATE CONSERVATIONISTS OFF
CT STATE CONSERVATIONISTS OFFC
DE STATE CONSERVATIONISTS OFF
FL STATE CONSERVATIONIST OFF.
AK STATE CONSVST OFFICE
AZ STATE CONSERVATIONISTS OFF
AR STATE CONSERVATIONISTS OFF
CA STATE CONSERVATIONISTS OFF
TOTAL
AL STATE CONSERVATIONIST OFF
ORGANIZATIONAL Total by Disability Status Total for Targeted DisabilitiesCOMPONENT
U. S. DEPARTMENT OF AGRICULTURE - NATURAL RESOURCES CONSV SERVCETable B2: Total Workforce By Component - Distribution by Disability [OPM Form 256 Self-Identification Codes]
Year = FY 2009
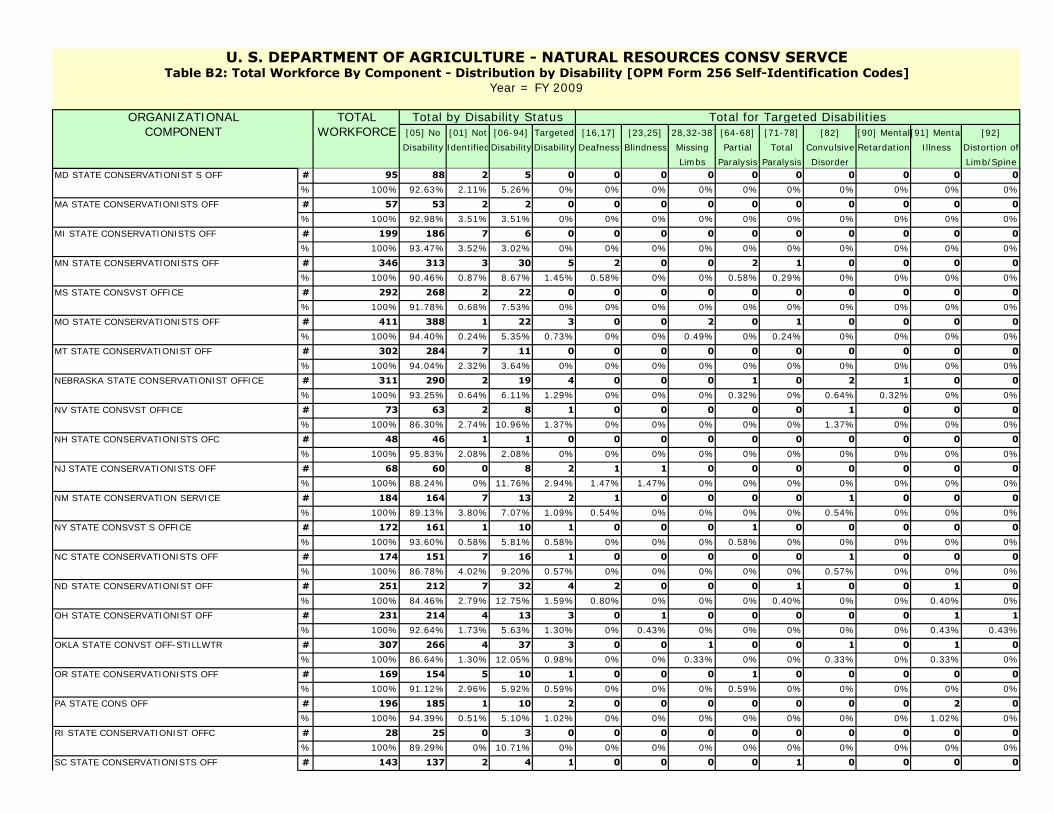
TOTALWORKFORCE [05] No [01] Not [06-94] Targeted [16,17] [23,25] [28,32-38] [64-68] [71-78] [82] [90] Mental[91] Menta [92]
Disability IdentifiedDisability Disability Deafness Blindness Missing Partial Total Convulsive Retardation Illness Distortion of
Limbs Paralysis Paralysis Disorder Limb/Spine
ORGANIZATIONAL Total by Disability Status Total for Targeted DisabilitiesCOMPONENT
U. S. DEPARTMENT OF AGRICULTURE - NATURAL RESOURCES CONSV SERVCETable B2: Total Workforce By Component - Distribution by Disability [OPM Form 256 Self-Identification Codes]
Year = FY 2009
# 95 88 2 5 0 0 0 0 0 0 0 0 0 0% 100% 92.63% 2.11% 5.26% 0% 0% 0% 0% 0% 0% 0% 0% 0% 0%
# 57 53 2 2 0 0 0 0 0 0 0 0 0 0% 100% 92.98% 3.51% 3.51% 0% 0% 0% 0% 0% 0% 0% 0% 0% 0%
# 199 186 7 6 0 0 0 0 0 0 0 0 0 0% 100% 93.47% 3.52% 3.02% 0% 0% 0% 0% 0% 0% 0% 0% 0% 0%
# 346 313 3 30 5 2 0 0 2 1 0 0 0 0% 100% 90.46% 0.87% 8.67% 1.45% 0.58% 0% 0% 0.58% 0.29% 0% 0% 0% 0%
# 292 268 2 22 0 0 0 0 0 0 0 0 0 0% 100% 91.78% 0.68% 7.53% 0% 0% 0% 0% 0% 0% 0% 0% 0% 0%
# 411 388 1 22 3 0 0 2 0 1 0 0 0 0% 100% 94.40% 0.24% 5.35% 0.73% 0% 0% 0.49% 0% 0.24% 0% 0% 0% 0%
# 302 284 7 11 0 0 0 0 0 0 0 0 0 0% 100% 94.04% 2.32% 3.64% 0% 0% 0% 0% 0% 0% 0% 0% 0% 0%
# 311 290 2 19 4 0 0 0 1 0 2 1 0 0% 100% 93.25% 0.64% 6.11% 1.29% 0% 0% 0% 0.32% 0% 0.64% 0.32% 0% 0%
# 73 63 2 8 1 0 0 0 0 0 1 0 0 0% 100% 86.30% 2.74% 10.96% 1.37% 0% 0% 0% 0% 0% 1.37% 0% 0% 0%
# 48 46 1 1 0 0 0 0 0 0 0 0 0 0% 100% 95.83% 2.08% 2.08% 0% 0% 0% 0% 0% 0% 0% 0% 0% 0%
# 68 60 0 8 2 1 1 0 0 0 0 0 0 0% 100% 88.24% 0% 11.76% 2.94% 1.47% 1.47% 0% 0% 0% 0% 0% 0% 0%
# 184 164 7 13 2 1 0 0 0 0 1 0 0 0% 100% 89.13% 3.80% 7.07% 1.09% 0.54% 0% 0% 0% 0% 0.54% 0% 0% 0%
# 172 161 1 10 1 0 0 0 1 0 0 0 0 0% 100% 93.60% 0.58% 5.81% 0.58% 0% 0% 0% 0.58% 0% 0% 0% 0% 0%
# 174 151 7 16 1 0 0 0 0 0 1 0 0 0% 100% 86.78% 4.02% 9.20% 0.57% 0% 0% 0% 0% 0% 0.57% 0% 0% 0%
# 251 212 7 32 4 2 0 0 0 1 0 0 1 0% 100% 84.46% 2.79% 12.75% 1.59% 0.80% 0% 0% 0% 0.40% 0% 0% 0.40% 0%
# 231 214 4 13 3 0 1 0 0 0 0 0 1 1% 100% 92.64% 1.73% 5.63% 1.30% 0% 0.43% 0% 0% 0% 0% 0% 0.43% 0.43%
# 307 266 4 37 3 0 0 1 0 0 1 0 1 0% 100% 86.64% 1.30% 12.05% 0.98% 0% 0% 0.33% 0% 0% 0.33% 0% 0.33% 0%
# 169 154 5 10 1 0 0 0 1 0 0 0 0 0% 100% 91.12% 2.96% 5.92% 0.59% 0% 0% 0% 0.59% 0% 0% 0% 0% 0%
# 196 185 1 10 2 0 0 0 0 0 0 0 2 0% 100% 94.39% 0.51% 5.10% 1.02% 0% 0% 0% 0% 0% 0% 0% 1.02% 0%
# 28 25 0 3 0 0 0 0 0 0 0 0 0 0% 100% 89.29% 0% 10.71% 0% 0% 0% 0% 0% 0% 0% 0% 0% 0%
# 143 137 2 4 1 0 0 0 0 1 0 0 0 0
PA STATE CONS OFF
RI STATE CONSERVATIONIST OFFC
SC STATE CONSERVATIONISTS OFF
ND STATE CONSERVATIONIST OFF
OH STATE CONSERVATIONIST OFF
OKLA STATE CONVST OFF-STILLWTR
OR STATE CONSERVATIONISTS OFF
NJ STATE CONSERVATIONISTS OFF
NM STATE CONSERVATION SERVICE
NY STATE CONSVST S OFFICE
NC STATE CONSERVATIONISTS OFF
MT STATE CONSERVATIONIST OFF
NEBRASKA STATE CONSERVATIONIST OFFICE
NV STATE CONSVST OFFICE
NH STATE CONSERVATIONISTS OFC
MI STATE CONSERVATIONISTS OFF
MN STATE CONSERVATIONISTS OFF
MS STATE CONSVST OFFICE
MO STATE CONSERVATIONISTS OFF
MD STATE CONSERVATIONIST S OFF
MA STATE CONSERVATIONISTS OFF

TOTALWORKFORCE [05] No [01] Not [06-94] Targeted [16,17] [23,25] [28,32-38] [64-68] [71-78] [82] [90] Mental[91] Menta [92]
Disability IdentifiedDisability Disability Deafness Blindness Missing Partial Total Convulsive Retardation Illness Distortion of
Limbs Paralysis Paralysis Disorder Limb/Spine
ORGANIZATIONAL Total by Disability Status Total for Targeted DisabilitiesCOMPONENT
U. S. DEPARTMENT OF AGRICULTURE - NATURAL RESOURCES CONSV SERVCETable B2: Total Workforce By Component - Distribution by Disability [OPM Form 256 Self-Identification Codes]
Year = FY 2009
% 100% 95.80% 1.40% 2.80% 0.70% 0% 0% 0% 0% 0.70% 0% 0% 0% 0%
# 239 221 1 17 3 0 0 0 0 0 0 0 3 0% 100% 92.47% 0.42% 7.11% 1.26% 0% 0% 0% 0% 0% 0% 0% 1.26% 0%
# 197 185 3 9 2 0 0 0 1 0 1 0 0 0% 100% 93.91% 1.52% 4.57% 1.02% 0% 0% 0% 0.51% 0% 0.51% 0% 0% 0%
# 796 740 8 48 4 0 2 0 1 0 0 1 0 0% 100% 92.96% 1.01% 6.03% 0.50% 0% 0.25% 0% 0.13% 0% 0% 0.13% 0% 0%
# 170 146 4 20 2 0 0 1 0 0 0 0 1 0% 100% 85.88% 2.35% 11.76% 1.18% 0% 0% 0.59% 0% 0% 0% 0% 0.59% 0%
# 69 64 1 4 1 0 0 0 0 0 1 0 0 0% 100% 92.75% 1.45% 5.80% 1.45% 0% 0% 0% 0% 0% 1.45% 0% 0% 0%
# 173 162 3 8 4 0 0 0 1 2 1 0 0 0% 100% 93.64% 1.73% 4.62% 2.31% 0% 0% 0% 0.58% 1.16% 0.58% 0% 0% 0%
# 185 168 4 13 0 0 0 0 0 0 0 0 0 0% 100% 90.81% 2.16% 7.03% 0% 0% 0% 0% 0% 0% 0% 0% 0% 0%
# 153 146 0 7 2 0 0 0 0 1 0 0 1 0% 100% 95.42% 0% 4.58% 1.31% 0% 0% 0% 0% 0.65% 0% 0% 0.65% 0%
# 242 221 2 19 4 2 0 1 1 0 0 0 0 0% 100% 91.32% 0.83% 7.85% 1.65% 0.83% 0% 0.41% 0.41% 0% 0% 0% 0% 0%
# 151 144 0 7 1 0 0 0 0 0 0 0 1 0% 100% 95.36% 0% 4.64% 0.66% 0% 0% 0% 0% 0% 0% 0% 0.66% 0%
# 23 20 0 3 0 0 0 0 0 0 0 0 0 0% 100% 86.96% 0% 13.04% 0% 0% 0% 0% 0% 0% 0% 0% 0% 0%
# 4 4 0 0 0 0 0 0 0 0 0 0 0 0% 100% 100% 0% 0% 0% 0% 0% 0% 0% 0% 0% 0% 0% 0%
# 58 55 0 3 0 0 0 0 0 0 0 0 0 0% 100% 94.83% 0% 5.17% 0% 0% 0% 0% 0% 0% 0% 0% 0% 0%
# 8 7 0 1 0 0 0 0 0 0 0 0 0 0% 100% 87.50% 0% 12.50% 0% 0% 0% 0% 0% 0% 0% 0% 0% 0%
# 14 12 2 0 0 0 0 0 0 0 0 0 0 0% 100% 85.71% 14.29% 0% 0% 0% 0% 0% 0% 0% 0% 0% 0% 0%
# 401 368 8 25 7 3 1 0 0 1 0 0 2 0% 100% 91.77% 2.00% 6.23% 1.75% 0.75% 0.25% 0% 0% 0.25% 0% 0% 0.50% 0%
# 11 10 0 1 0 0 0 0 0 0 0 0 0 0% 100% 90.91% 0% 9.09% 0% 0% 0% 0% 0% 0% 0% 0% 0% 0%
# 34 29 1 4 0 0 0 0 0 0 0 0 0 0% 100% 85.29% 2.94% 11.76% 0% 0% 0% 0% 0% 0% 0% 0% 0% 0%
# 59 56 1 2 0 0 0 0 0 0 0 0 0 0% 100% 94.92% 1.69% 3.39% 0% 0% 0% 0% 0% 0% 0% 0% 0% 0%
# 18 11 2 5 0 0 0 0 0 0 0 0 0 0% 100% 61.11% 11.11% 27.78% 0% 0% 0% 0% 0% 0% 0% 0% 0% 0%
INFORMATION TECHNOLOGY CENTER
NATIONAL CARTOGRAPHY & GEOSPATIAL CENTER
NATIONAL EMPLOYEE DEVELOPMENT CENTER
EAST REMOTE SENSING LAB
CENTRAL REMOTE SENSING LAB
NHQ - DC
NATIONAL WATER MANAGEMENT CENTER
WYOMING STATE CONSERVATIONISTS OFFICE-CASPE
NATIONAL CENTERS SERVICING UNIT
NATIONAL GEOSPATIAL DEV CENTER
CARIBBEAN AREA DIR OFF SN JUAN
VA STATE CONSERVATIONIST OFF
WA STATE CONSVST OFFICE
WV STATE CONSERVATIONIST S OFF
WI STATE CONSERVATIONISTS OFF
TENNESSEE
TX STATE CONSERVATIONISTS OFF
UT STATE CONSERVATIONISTS OFF
VERMONT STATE CONSERVATIONISTS OFFICE-COLCH
SD STATE CONSERVATIONISTS OFF

TOTALWORKFORCE [05] No [01] Not [06-94] Targeted [16,17] [23,25] [28,32-38] [64-68] [71-78] [82] [90] Mental[91] Menta [92]
Disability IdentifiedDisability Disability Deafness Blindness Missing Partial Total Convulsive Retardation Illness Distortion of
Limbs Paralysis Paralysis Disorder Limb/Spine
ORGANIZATIONAL Total by Disability Status Total for Targeted DisabilitiesCOMPONENT
U. S. DEPARTMENT OF AGRICULTURE - NATURAL RESOURCES CONSV SERVCETable B2: Total Workforce By Component - Distribution by Disability [OPM Form 256 Self-Identification Codes]
Year = FY 2009
# 5 4 0 1 0 0 0 0 0 0 0 0 0 0% 100% 80.00% 0% 20.00% 0% 0% 0% 0% 0% 0% 0% 0% 0% 0%
# 4 4 0 0 0 0 0 0 0 0 0 0 0 0% 100% 100% 0% 0% 0% 0% 0% 0% 0% 0% 0% 0% 0% 0%
# 35 32 0 3 1 0 0 0 0 0 0 1 0 0% 100% 91.43% 0% 8.57% 2.86% 0% 0% 0% 0% 0% 0% 2.86% 0% 0%
# 62 55 0 7 2 1 1 0 0 0 0 0 0 0% 100% 88.71% 0% 11.29% 3.23% 1.61% 1.61% 0% 0% 0% 0% 0% 0% 0%
# 20 19 0 1 0 0 0 0 0 0 0 0 0 0% 100% 95.00% 0% 5.00% 0% 0% 0% 0% 0% 0% 0% 0% 0% 0%
# 7 5 1 1 0 0 0 0 0 0 0 0 0 0% 100% 71.43% 14.29% 14.29% 0% 0% 0% 0% 0% 0% 0% 0% 0% 0%
# 29 23 2 4 1 0 1 0 0 0 0 0 0 0% 100% 79.31% 6.90% 13.79% 3.45% 0% 3.45% 0% 0% 0% 0% 0% 0% 0%
# 37 33 1 3 0 0 0 0 0 0 0 0 0 0% 100% 89.19% 2.70% 8.11% 0% 0% 0% 0% 0% 0% 0% 0% 0% 0%
# 34 32 0 2 0 0 0 0 0 0 0 0 0 0% 100% 94.12% 0% 5.88% 0% 0% 0% 0% 0% 0% 0% 0% 0% 0%
WEST REMOTE SENSING LAB
EAST NATIONAL TECHNOLOGY SUPPORT CENTER
WEST NATIONAL TECHNOLOGY SUPPORT CENTER
CENTRAL NATIONAL TECHNOLOGY SUPPORT CENTER
NATIONAL PLANT DATA CENTER
NDCSM CENTER
NATIONAL SOIL SURVEY CENTER
NATIONAL WATER AND CLIMATE CENTER
AGRICULTURAL WILDLIFE CONSERVATION CENTER
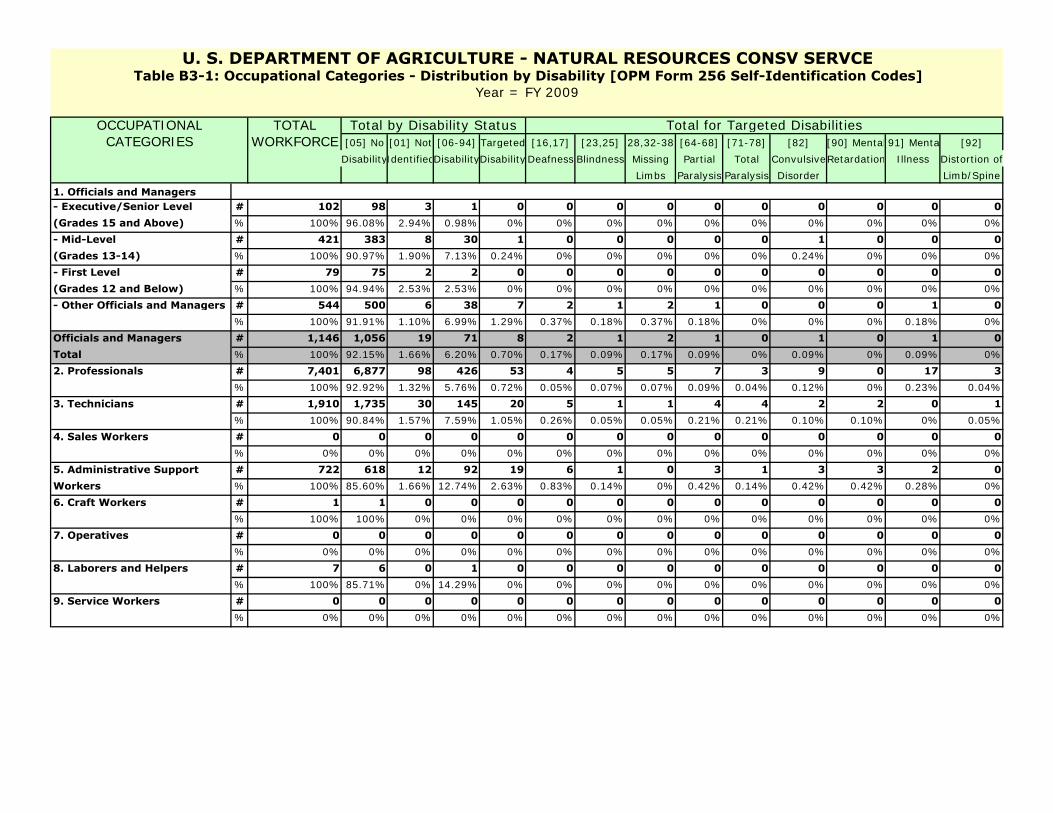
TOTALWORKFORCE [05] No [01] Not [06-94] Targeted [16,17] [23,25] [28,32-38 [64-68] [71-78] [82] [90] Mental[91] Menta [92]
DisabilityIdentifiedDisabilityDisabilityDeafness Blindness Missing Partial Total ConvulsiveRetardation Illness Distortion of
Limbs Paralysis Paralysis Disorder Limb/Spine
1. Officials and Managers- Executive/Senior Level # 102 98 3 1 0 0 0 0 0 0 0 0 0 0(Grades 15 and Above) % 100% 96.08% 2.94% 0.98% 0% 0% 0% 0% 0% 0% 0% 0% 0% 0%
- Mid-Level # 421 383 8 30 1 0 0 0 0 0 1 0 0 0(Grades 13-14) % 100% 90.97% 1.90% 7.13% 0.24% 0% 0% 0% 0% 0% 0.24% 0% 0% 0%
- First Level # 79 75 2 2 0 0 0 0 0 0 0 0 0 0(Grades 12 and Below) % 100% 94.94% 2.53% 2.53% 0% 0% 0% 0% 0% 0% 0% 0% 0% 0%
# 544 500 6 38 7 2 1 2 1 0 0 0 1 0% 100% 91.91% 1.10% 6.99% 1.29% 0.37% 0.18% 0.37% 0.18% 0% 0% 0% 0.18% 0%
Officials and Managers # 1,146 1,056 19 71 8 2 1 2 1 0 1 0 1 0Total % 100% 92.15% 1.66% 6.20% 0.70% 0.17% 0.09% 0.17% 0.09% 0% 0.09% 0% 0.09% 0%
# 7,401 6,877 98 426 53 4 5 5 7 3 9 0 17 3% 100% 92.92% 1.32% 5.76% 0.72% 0.05% 0.07% 0.07% 0.09% 0.04% 0.12% 0% 0.23% 0.04%
# 1,910 1,735 30 145 20 5 1 1 4 4 2 2 0 1% 100% 90.84% 1.57% 7.59% 1.05% 0.26% 0.05% 0.05% 0.21% 0.21% 0.10% 0.10% 0% 0.05%
# 0 0 0 0 0 0 0 0 0 0 0 0 0 0% 0% 0% 0% 0% 0% 0% 0% 0% 0% 0% 0% 0% 0% 0%
5. Administrative Support # 722 618 12 92 19 6 1 0 3 1 3 3 2 0Workers % 100% 85.60% 1.66% 12.74% 2.63% 0.83% 0.14% 0% 0.42% 0.14% 0.42% 0.42% 0.28% 0%
# 1 1 0 0 0 0 0 0 0 0 0 0 0 0% 100% 100% 0% 0% 0% 0% 0% 0% 0% 0% 0% 0% 0% 0%
# 0 0 0 0 0 0 0 0 0 0 0 0 0 0% 0% 0% 0% 0% 0% 0% 0% 0% 0% 0% 0% 0% 0% 0%
# 7 6 0 1 0 0 0 0 0 0 0 0 0 0% 100% 85.71% 0% 14.29% 0% 0% 0% 0% 0% 0% 0% 0% 0% 0%
# 0 0 0 0 0 0 0 0 0 0 0 0 0 0% 0% 0% 0% 0% 0% 0% 0% 0% 0% 0% 0% 0% 0% 0%
7. Operatives
8. Laborers and Helpers
9. Service Workers
2. Professionals
3. Technicians
4. Sales Workers
6. Craft Workers
- Other Officials and Managers
OCCUPATIONAL Total by Disability Status Total for Targeted DisabilitiesCATEGORIES
U. S. DEPARTMENT OF AGRICULTURE - NATURAL RESOURCES CONSV SERVCETable B3-1: Occupational Categories - Distribution by Disability [OPM Form 256 Self-Identification Codes]
Year = FY 2009

TOTALWORKFORCE [05] No [01] Not [06-94] Targeted [16,17] [23,25] [28,32-38 [64-68] [71-78] [82] [90] Mental[91] Menta [92]
DisabilityIdentifiedDisabilityDisabilityDeafness Blindness Missing Partial Total ConvulsiveRetardation Illness Distortion of
Limbs Paralysis Paralysis Disorder Limb/Spine
1. Officials and Managers- Executive/Senior Level # 102 98 3 1 0 0 0 0 0 0 0 0 0 0(Grades 15 and Above) % 0.91% 0.95% 1.89% 0.14% 0% 0% 0% 0% 0% 0% 0% 0% 0% 0%
- Mid-Level # 421 383 8 30 1 0 0 0 0 0 1 0 0 0(Grades 13-14) % 3.76% 3.72% 5.03% 4.08% 1.00% 0% 0% 0% 0% 0% 10.00% 0% 0% 0%
- First Level # 79 75 2 2 0 0 0 0 0 0 0 0 0 0(Grades 12 and Below) % 0.71% 0.73% 1.26% 0.27% 0% 0% 0% 0% 0% 0% 0% 0% 0% 0%
# 544 500 6 38 7 2 1 2 1 0 0 0 1 0% 4.86% 4.86% 3.77% 5.17% 7.00% 11.76% 12.50% 25.00% 6.67% 0% 0% 0% 5.00% 0%
Officials and Managers # 1,146 1,056 19 71 8 2 1 2 1 0 1 0 1 0Total % 10.24% 10.26% 11.95% 9.66% 8.00% 11.76% 12.50% 25.00% 6.67% 0% 10.00% 0% 5.00% 0%
# 7,401 6,877 98 426 53 4 5 5 7 3 9 0 17 3% 66.16% 66.81% 61.64% 57.96% 53.00% 23.53% 62.50% 62.50% 46.67% 23.08% 90.00% 0% 85.00% 75.00%
# 1,910 1,735 30 145 20 5 1 1 4 4 2 2 0 1% 17.07% 16.86% 18.87% 19.73% 20.00% 29.41% 12.50% 12.50% 26.67% 30.77% 20.00% 40.00% 0% 25.00%
# 0 0 0 0 0 0 0 0 0 0 0 0 0 0% 0% 0% 0% 0% 0% 0% 0% 0% 0% 0% 0% 0% 0% 0%
5. Administrative Support # 722 618 12 92 19 6 1 0 3 3 1 3 2 0Workers % 6.45% 6.00% 7.55% 12.52% 19.00% 35.29% 12.50% 0% 20.00% 23.08% 10.00% 60.00% 10.00% 0%
# 1 1 0 0 0 0 0 0 0 0 0 0 0 0% 0.01% 0.01% 0% 0% 0% 0% 0% 0% 0% 0% 0% 0% 0% 0%
# 0 0 0 0 0 0 0 0 0 0 0 0 0 0% 0% 0% 0% 0% 0% 0% 0% 0% 0% 0% 0% 0% 0% 0%
# 7 6 0 1 0 0 0 0 0 0 0 0 0 0% 0.06% 0.06% 0% 0.14% 0% 0% 0% 0% 0% 0% 0% 0% 0% 0%
# 0 0 0 0 0 0 0 0 0 0 0 0 0 0% 0.06% 0.06% 0% 0.14% 0% 0% 0% 0% 0% 0% 0% 0% 0% 0%
# 11,187 10,293 159 735 100 17 8 8 15 13 10 5 20 4% 100% 100% 100% 100% 100% 100% 100% 100% 100% 100% 100% 100% 100% 100%
NOTE: Percentages computed down columns and NOT across rows
7. Operatives
8. Laborers and Helpers
9. Service Workers
TOTAL
2. Professionals
3. Technicians
4. Sales Workers
6. Craft Workers
- Other Officials and Managers
OCCUPATIONAL Total by Disability Status Total for Targeted DisabilitiesCATEGORIES
U. S. DEPARTMENT OF AGRICULTURE - NATURAL RESOURCES CONSV SERVCETable B3-2: Occupational Categories - Distribution by Disability [OPM Form 256 Self-Identification Codes]
Year = FY 2009

TOTALWORKFORCE [05] No [01] Not [06-94] Targeted [16,17] [23,25] 28,32-38 [64-68] [71-78] [82] 90] Menta91] Menta [92]
DisabilityIdentifiedDisabilityDisabilityDeafnessBlindness Missing Partial Total ConvulsiveRetardatio Illness Distortion of
Limbs Paralysis Paralysis Disorder Limb/Spine# 2 2 0 0 0 0 0 0 0 0 0 0 0 0
% 100% 100% 0% 0% 0% 0% 0% 0% 0% 0% 0% 0% 0% 0%
# 13 12 0 1 1 0 0 0 0 0 0 1 0 0
% 100% 92.31% 0% 7.69% 7.69% 0% 0% 0% 0% 0% 0% 7.69% 0% 0%
# 54 44 1 9 3 0 0 0 1 0 0 2 0 0
% 100% 81.48% 1.85% 16.67% 5.56% 0% 0% 0% 1.85% 0% 0% 3.70% 0% 0%
# 175 156 3 16 1 0 0 0 0 1 0 0 0 0
% 100% 89.14% 1.71% 9.14% 0.57% 0% 0% 0% 0% 0.57% 0% 0% 0% 0%
# 302 256 10 36 9 5 0 0 1 1 0 2 0 0
% 100% 84.77% 3.31% 11.92% 2.98% 1.66% 0% 0% 0.33% 0.33% 0% 0.66% 0% 0%
# 380 340 2 38 3 0 0 1 0 2 0 0 0 0
% 100% 89.47% 0.53% 10.00% 0.79% 0% 0% 0.26% 0% 0.53% 0% 0% 0% 0%
# 1,454 1,328 17 109 16 3 2 0 4 2 1 0 3 1
% 100% 91.33% 1.17% 7.50% 1.10% 0.21% 0.14% 0% 0.28% 0.14% 0.07% 0% 0.21% 0.07%
# 484 437 4 43 4 2 0 0 1 0 1 0 0 0
% 100% 90.29% 0.83% 8.88% 0.83% 0.41% 0% 0% 0.21% 0% 0.21% 0% 0% 0%
# 1,587 1,473 20 94 17 2 0 3 4 2 2 0 4 0
% 100% 92.82% 1.26% 5.92% 1.07% 0.13% 0% 0.19% 0.25% 0.13% 0.13% 0% 0.25% 0%
# 32 28 0 4 1 0 0 0 0 0 1 0 0 0
% 100% 87.50% 0% 12.50% 3.13% 0% 0% 0% 0% 0% 3.13% 0% 0% 0%
# 2,462 2,289 27 146 21 3 2 2 1 2 4 0 6 1
% 100% 92.97% 1.10% 5.93% 0.85% 0.12% 0.08% 0.08% 0.04% 0.08% 0.16% 0% 0.24% 0.04%
# 3,171 2,945 53 173 19 1 2 2 3 0 3 0 6 2
% 100% 92.87% 1.67% 5.46% 0.60% 0.03% 0.06% 0.06% 0.09% 0% 0.09% 0% 0.19% 0.06%
# 580 531 12 37 3 1 0 0 0 0 1 0 1 0
% 100% 91.55% 2.07% 6.38% 0.52% 0.17% 0% 0% 0% 0% 0.17% 0% 0.17% 0%
# 309 279 4 26 2 0 2 0 0 0 0 0 0 0
% 100% 90.29% 1.29% 8.41% 0.65% 0% 0.65% 0% 0% 0% 0% 0% 0% 0%
# 153 146 5 2 0 0 0 0 0 0 0 0 0 0
% 100% 95.42% 3.27% 1.31% 0% 0% 0% 0% 0% 0% 0% 0% 0% 0%
# 0 0 0 0 0 0 0 0 0 0 0 0 0 0
% 0% 0% 0% 0% 0% 0% 0% 0% 0% 0% 0% 0% 0% 0%
# 20 19 1 0 0 0 0 0 0 0 0 0 0 0
% 100% 95.00% 5.00% 0% 0% 0% 0% 0% 0% 0% 0% 0% 0% 0%
# 11,178 10,285 159 734 100 17 8 8 15 13 10 5 20 4
% 100% 92.01% 1.42% 6.57% 0.89% 0.15% 0.07% 0.07% 0.13% 0.12% 0.09% 0.04% 0.18% 0.04%
GS-15
All Other
SES
TOTAL
GS-11
GS-12
GS-13
GS-14
GS-07
GS-08
GS-09
GS-10
GS-03
GS-04
GS-05
GS-06
GS-01
GS-02
GS/GM,SES,and Total by Disability Status Total for Targeted DisabilitiesRelated Grades
U. S. DEPARTMENT OF AGRICULTURE - NATURAL RESOURCES CONSV SERVCETable B4-1: Participation Rates for General Schedule(GS) Grades by Disability (Perm)
Year = FY 2009

TOTALWORKFORCE [05] No [01] Not [06-94] Targeted [16,17] [23,25] [28,32-38] [64-68] [71-78] [82] [90] Mental[91] Menta [92]
DisabilityIdentifiedDisabilityDisability Deafness Blindness Missing Partial Total Convulsive Retardation Illness Distortion of
Limbs Paralysis Paralysis Disorder Limb/Spine# 37 34 2 1 0 0 0 0 0 0 0 0 0 0
% 100% 91.89% 5.41% 2.70% 0% 0% 0% 0% 0% 0% 0% 0% 0% 0%
# 54 51 1 2 0 0 0 0 0 0 0 0 0 0
% 100% 94.44% 1.85% 3.70% 0% 0% 0% 0% 0% 0% 0% 0% 0% 0%
# 177 166 1 10 3 0 0 0 2 1 0 0 0 0
% 100% 93.79% 0.56% 5.65% 1.69% 0% 0% 0% 1.13% 0.56% 0% 0% 0% 0%
# 140 131 1 8 0 0 0 0 0 0 0 0 0 0
% 100% 93.57% 0.71% 5.71% 0% 0% 0% 0% 0% 0% 0% 0% 0% 0%
# 67 63 0 4 0 0 0 0 0 0 0 0 0 0
% 100% 94.03% 0% 5.97% 0% 0% 0% 0% 0% 0% 0% 0% 0% 0%
# 9 9 0 0 0 0 0 0 0 0 0 0 0 0
% 100% 100% 0% 0% 0% 0% 0% 0% 0% 0% 0% 0% 0% 0%
# 8 7 1 0 0 0 0 0 0 0 0 0 0 0
% 100% 87.50% 12.50% 0% 0% 0% 0% 0% 0% 0% 0% 0% 0% 0%
# 0 0 0 0 0 0 0 0 0 0 0 0 0 0
% 0% 0% 0% 0% 0% 0% 0% 0% 0% 0% 0% 0% 0% 0%
# 6 6 0 0 0 0 0 0 0 0 0 0 0 0
% 100% 100% 0% 0% 0% 0% 0% 0% 0% 0% 0% 0% 0% 0%
# 0 0 0 0 0 0 0 0 0 0 0 0 0 0
% 0% 0% 0% 0% 0% 0% 0% 0% 0% 0% 0% 0% 0% 0%
# 4 3 0 1 0 0 0 0 0 0 0 0 0 0
% 100% 75.00% 0% 25.00% 0% 0% 0% 0% 0% 0% 0% 0% 0% 0%
# 1 1 0 0 0 0 0 0 0 0 0 0 0 0
% 100% 100% 0% 0% 0% 0% 0% 0% 0% 0% 0% 0% 0% 0%
# 0 0 0 0 0 0 0 0 0 0 0 0 0 0
% 0% 0% 0% 0% 0% 0% 0% 0% 0% 0% 0% 0% 0% 0%
# 0 0 0 0 0 0 0 0 0 0 0 0 0 0
% 0% 0% 0% 0% 0% 0% 0% 0% 0% 0% 0% 0% 0% 0%
# 0 0 0 0 0 0 0 0 0 0 0 0 0 0
% 0% 0% 0% 0% 0% 0% 0% 0% 0% 0% 0% 0% 0% 0%
# 0 0 0 0 0 0 0 0 0 0 0 0 0 0
% 0% 0% 0% 0% 0% 0% 0% 0% 0% 0% 0% 0% 0% 0%
# 0 0 0 0 0 0 0 0 0 0 0 0 0 0
% 0% 0% 0% 0% 0% 0% 0% 0% 0% 0% 0% 0% 0% 0%
# 503 471 6 26 3 0 0 0 2 0 1 0 0 0
% 100% 93.64% 1.19% 5.17% 0.60% 0% 0% 0% 0.40% 0% 0.20% 0% 0% 0%
GS-15
All Other
SES
TOTAL
GS-11
GS-12
GS-13
GS-14
GS-07
GS-08
GS-09
GS-10
GS-03
GS-04
GS-05
GS-06
GS-01
GS-02
GS/GM,SES,and Total by Disability Status Total for Targeted DisabilitiesRelated Grades
U. S. DEPARTMENT OF AGRICULTURE - NATURAL RESOURCES CONSV SERVCETable B4-1: Participation Rates for General Schedule(GS) Grades by Disability (Temp)
Year = FY 2009
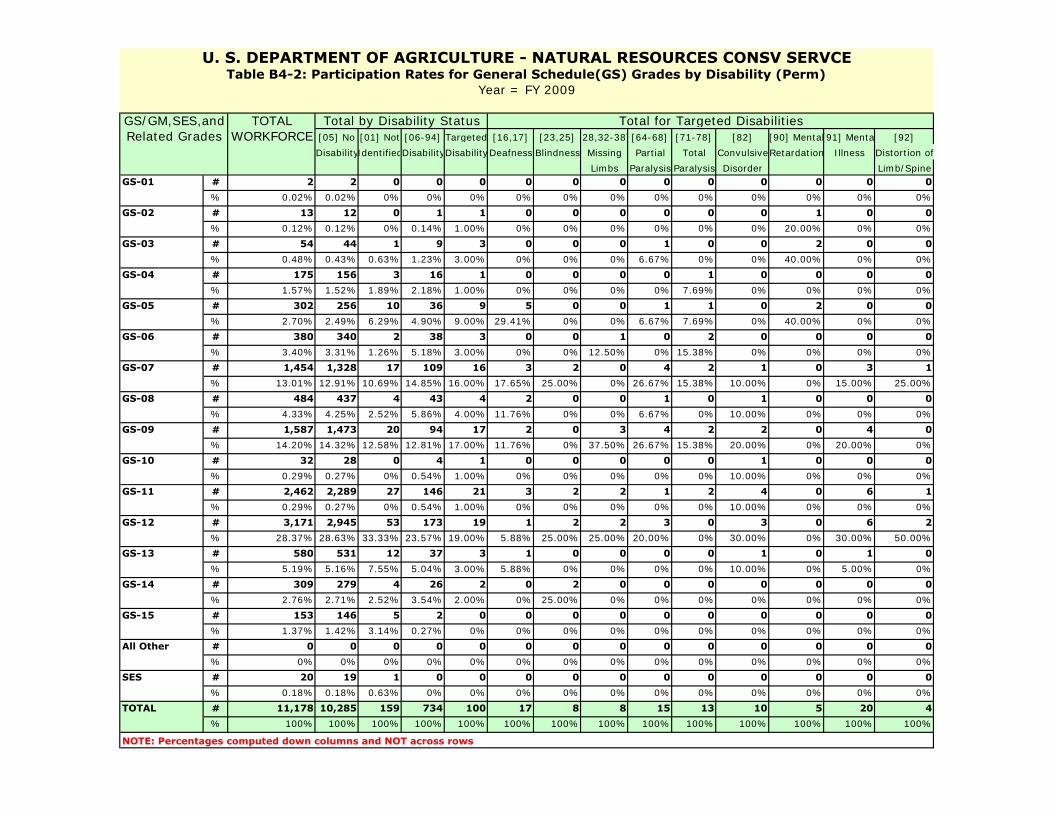
TOTALWORKFORCE [05] No [01] Not [06-94] Targeted [16,17] [23,25] [28,32-38][64-68] [71-78] [82] [90] Mental[91] Menta [92]
DisabilityIdentifiedDisabilityDisabilityDeafness Blindness Missing Partial Total ConvulsiveRetardation Illness Distortion of
Limbs Paralysis Paralysis Disorder Limb/Spine# 2 2 0 0 0 0 0 0 0 0 0 0 0 0% 0.02% 0.02% 0% 0% 0% 0% 0% 0% 0% 0% 0% 0% 0% 0%
# 13 12 0 1 1 0 0 0 0 0 0 1 0 0% 0.12% 0.12% 0% 0.14% 1.00% 0% 0% 0% 0% 0% 0% 20.00% 0% 0%
# 54 44 1 9 3 0 0 0 1 0 0 2 0 0% 0.48% 0.43% 0.63% 1.23% 3.00% 0% 0% 0% 6.67% 0% 0% 40.00% 0% 0%
# 175 156 3 16 1 0 0 0 0 1 0 0 0 0% 1.57% 1.52% 1.89% 2.18% 1.00% 0% 0% 0% 0% 7.69% 0% 0% 0% 0%
# 302 256 10 36 9 5 0 0 1 1 0 2 0 0% 2.70% 2.49% 6.29% 4.90% 9.00% 29.41% 0% 0% 6.67% 7.69% 0% 40.00% 0% 0%
# 380 340 2 38 3 0 0 1 0 2 0 0 0 0% 3.40% 3.31% 1.26% 5.18% 3.00% 0% 0% 12.50% 0% 15.38% 0% 0% 0% 0%
# 1,454 1,328 17 109 16 3 2 0 4 2 1 0 3 1% 13.01% 12.91% 10.69% 14.85% 16.00% 17.65% 25.00% 0% 26.67% 15.38% 10.00% 0% 15.00% 25.00%
# 484 437 4 43 4 2 0 0 1 0 1 0 0 0% 4.33% 4.25% 2.52% 5.86% 4.00% 11.76% 0% 0% 6.67% 0% 10.00% 0% 0% 0%
# 1,587 1,473 20 94 17 2 0 3 4 2 2 0 4 0% 14.20% 14.32% 12.58% 12.81% 17.00% 11.76% 0% 37.50% 26.67% 15.38% 20.00% 0% 20.00% 0%
# 32 28 0 4 1 0 0 0 0 0 1 0 0 0% 0.29% 0.27% 0% 0.54% 1.00% 0% 0% 0% 0% 0% 10.00% 0% 0% 0%
# 2,462 2,289 27 146 21 3 2 2 1 2 4 0 6 1% 0.29% 0.27% 0% 0.54% 1.00% 0% 0% 0% 0% 0% 10.00% 0% 0% 0%
# 3,171 2,945 53 173 19 1 2 2 3 0 3 0 6 2% 28.37% 28.63% 33.33% 23.57% 19.00% 5.88% 25.00% 25.00% 20.00% 0% 30.00% 0% 30.00% 50.00%
# 580 531 12 37 3 1 0 0 0 0 1 0 1 0% 5.19% 5.16% 7.55% 5.04% 3.00% 5.88% 0% 0% 0% 0% 10.00% 0% 5.00% 0%
# 309 279 4 26 2 0 2 0 0 0 0 0 0 0% 2.76% 2.71% 2.52% 3.54% 2.00% 0% 25.00% 0% 0% 0% 0% 0% 0% 0%
# 153 146 5 2 0 0 0 0 0 0 0 0 0 0% 1.37% 1.42% 3.14% 0.27% 0% 0% 0% 0% 0% 0% 0% 0% 0% 0%
# 0 0 0 0 0 0 0 0 0 0 0 0 0 0% 0% 0% 0% 0% 0% 0% 0% 0% 0% 0% 0% 0% 0% 0%
# 20 19 1 0 0 0 0 0 0 0 0 0 0 0% 0.18% 0.18% 0.63% 0% 0% 0% 0% 0% 0% 0% 0% 0% 0% 0%
# 11,178 10,285 159 734 100 17 8 8 15 13 10 5 20 4% 100% 100% 100% 100% 100% 100% 100% 100% 100% 100% 100% 100% 100% 100%
NOTE: Percentages computed down columns and NOT across rows
GS-15
All Other
SES
TOTAL
GS-11
GS-12
GS-13
GS-14
GS-07
GS-08
GS-09
GS-10
GS-03
GS-04
GS-05
GS-06
GS-01
GS-02
GS/GM,SES,and Total by Disability Status Total for Targeted DisabilitiesRelated Grades
U. S. DEPARTMENT OF AGRICULTURE - NATURAL RESOURCES CONSV SERVCETable B4-2: Participation Rates for General Schedule(GS) Grades by Disability (Perm)
Year = FY 2009

TOTALWORKFORCE [05] No [01] Not [06-94] Targeted [16,17] [23,25] [28,32-38] [64-68] [71-78] [82] [90] Mental[91] Menta [92]
DisabilityIdentifiedDisabilityDisability Deafness Blindness Missing Partial Total Convulsive Retardation Illness Distortion of
Limbs Paralysis Paralysis Disorder Limb/Spine# 37 34 2 1 0 0 0 0 0 0 0 0 0 0% 7.36% 7.22% 33.33% 3.85% 0% 0% 0% 0% 0% 0% 0% 0% 0% 0%
# 54 51 1 2 0 0 0 0 0 0 0 0 0 0% 10.74% 10.83% 16.67% 7.69% 0% 0% 0% 0% 0% 0% 0% 0% 0% 0%
# 177 166 1 10 3 0 0 0 2 1 0 0 0 0% 35.19% 35.24% 16.67% 38.46% 100% 0% 0% 0% 100% 0% 0% 0% 0% 0%
# 140 131 1 8 0 0 0 0 0 0 0 0 0 0% 27.83% 27.81% 16.67% 30.77% 0% 0% 0% 0% 0% 0% 0% 0% 0% 0%
# 67 63 0 4 0 0 0 0 0 0 0 0 0 0% 13.32% 13.38% 0% 15.38% 0% 0% 0% 0% 0% 0% 0% 0% 0% 0%
# 9 9 0 0 0 0 0 0 0 0 0 0 0 0% 1.79% 1.91% 0% 0% 0% 0% 0% 0% 0% 0% 0% 0% 0% 0%
# 8 7 1 0 0 0 0 0 0 0 0 0 0 0% 1.59% 1.49% 16.67% 0% 0% 0% 0% 0% 0% 0% 0% 0% 0% 0%
# 0 0 0 0 0 0 0 0 0 0 0 0 0 0% 0% 0% 0% 0% 0% 0% 0% 0% 0% 0% 0% 0% 0% 0%
# 6 6 0 0 0 0 0 0 0 0 0 0 0 0% 1.19% 1.27% 0% 0% 0% 0% 0% 0% 0% 0% 0% 0% 0% 0%
# 0 0 0 0 0 0 0 0 0 0 0 0 0 0% 0% 0% 0% 0% 0% 0% 0% 0% 0% 0% 0% 0% 0% 0%
# 4 3 0 1 0 0 0 0 0 0 0 0 0 0% 0% 0% 0% 0% 0% 0% 0% 0% 0% 0% 0% 0% 0% 0%
# 1 1 0 0 0 0 0 0 0 0 0 0 0 0% 0.20% 0.21% 0% 0% 0% 0% 0% 0% 0% 0% 0% 0% 0% 0%
# 0 0 0 0 0 0 0 0 0 0 0 0 0 0% 0% 0% 0% 0% 0% 0% 0% 0% 0% 0% 0% 0% 0% 0%
# 0 0 0 0 0 0 0 0 0 0 0 0 0 0% 0% 0% 0% 0% 0% 0% 0% 0% 0% 0% 0% 0% 0% 0%
# 0 0 0 0 0 0 0 0 0 0 0 0 0 0% 0% 0% 0% 0% 0% 0% 0% 0% 0% 0% 0% 0% 0% 0%
# 0 0 0 0 0 0 0 0 0 0 0 0 0 0% 0% 0% 0% 0% 0% 0% 0% 0% 0% 0% 0% 0% 0% 0%
# 0 0 0 0 0 0 0 0 0 0 0 0 0 0% 0% 0% 0% 0% 0% 0% 0% 0% 0% 0% 0% 0% 0% 0%
# 503 471 6 26 3 0 0 0 2 0 1 0 0 0% 100% 100% 100% 100% 100% 100% 100% 100% 100% 100% 100% 100% 100% 100%
NOTE: Percentages computed down columns and NOT across rows
GS-15
All Other
SES
TOTAL
GS-11
GS-12
GS-13
GS-14
GS-07
GS-08
GS-09
GS-10
GS-03
GS-04
GS-05
GS-06
GS-01
GS-02
GS/GM,SES,and Total by Disability Status Total for Targeted DisabilitiesRelated Grades
U. S. DEPARTMENT OF AGRICULTURE - NATURAL RESOURCES CONSV SERVCETable B4-2: Participation Rates for General Schedule(GS) Grades by Disability (Temp)
Year = FY 2009

TOTALWORKFORCE [05] No [01] Not [06-94] Targeted [16,17] [23,25] [28,32-38] [64-68] [71-78] [82] [90] Mental[91] Menta [92]
DisabilityIdentifiedDisabilityDisability Deafness Blindness Missing Partial Total Convulsive Retardation Illness Distortion of
Limbs Paralysis Paralysis Disorder Limb/Spine# 0 0 0 0 0 0 0 0 0 0 0 0 0 0
% 0% 0% 0% 0% 0% 0% 0% 0% 0% 0% 0% 0% 0% 0%
# 0 0 0 0 0 0 0 0 0 0 0 0 0 0
% 0% 0% 0% 0% 0% 0% 0% 0% 0% 0% 0% 0% 0% 0%
# 0 0 0 0 0 0 0 0 0 0 0 0 0 0
% 0% 0% 0% 0% 0% 0% 0% 0% 0% 0% 0% 0% 0% 0%
# 2 2 0 0 0 0 0 0 0 0 0 0 0 0
% 100% 100% 0% 0% 0% 0% 0% 0% 0% 0% 0% 0% 0% 0%
# 1 1 0 0 0 0 0 0 0 0 0 0 0 0
% 100% 100% 0% 0% 0% 0% 0% 0% 0% 0% 0% 0% 0% 0%
# 0 0 0 0 0 0 0 0 0 0 0 0 0 0
% 0% 0% 0% 0% 0% 0% 0% 0% 0% 0% 0% 0% 0% 0%
# 2 1 0 1 0 0 0 0 0 0 0 0 0 0
% 100% 50.00% 0% 50.00% 0% 0% 0% 0% 0% 0% 0% 0% 0% 0%
# 2 2 0 0 0 0 0 0 0 0 0 0 0 0
% 100% 100% 0% 0% 0% 0% 0% 0% 0% 0% 0% 0% 0% 0%
# 0 0 0 0 0 0 0 0 0 0 0 0 0 0
% 0% 0% 0% 0% 0% 0% 0% 0% 0% 0% 0% 0% 0% 0%
# 1 1 0 0 0 0 0 0 0 0 0 0 0 0
% 100% 100% 0% 0% 0% 0% 0% 0% 0% 0% 0% 0% 0% 0%
# 0 0 0 0 0 0 0 0 0 0 0 0 0 0
% 0% 0% 0% 0% 0% 0% 0% 0% 0% 0% 0% 0% 0% 0%
# 0 0 0 0 0 0 0 0 0 0 0 0 0 0
% 0% 0% 0% 0% 0% 0% 0% 0% 0% 0% 0% 0% 0% 0%
# 0 0 0 0 0 0 0 0 0 0 0 0 0 0
% 0% 0% 0% 0% 0% 0% 0% 0% 0% 0% 0% 0% 0% 0%
# 0 0 0 0 0 0 0 0 0 0 0 0 0 0
% 0% 0% 0% 0% 0% 0% 0% 0% 0% 0% 0% 0% 0% 0%
# 0 0 0 0 0 0 0 0 0 0 0 0 0 0
% 0% 0% 0% 0% 0% 0% 0% 0% 0% 0% 0% 0% 0% 0%
# 0 0 0 0 0 0 0 0 0 0 0 0 0 0
% 0% 0% 0% 0% 0% 0% 0% 0% 0% 0% 0% 0% 0% 0%
Grade - 15
All Other
Grade - 11
Grade - 12
Grade - 13
Grade - 14
Grade - 07
Grade - 08
Grade - 09
Grade - 10
Grade - 03
Grade - 04
Grade - 05
Grade - 06
Grade - 01
Grade - 02
WD/WG,WL/WS, and Total by Disability Status Total for Targeted DisabilitiesOther Wage Grades
U. S. DEPARTMENT OF AGRICULTURE - NATURAL RESOURCES CONSV SERVCETable B5-1: Participation Rates for Wage Grades Disability (Perm)
Year = FY 2009
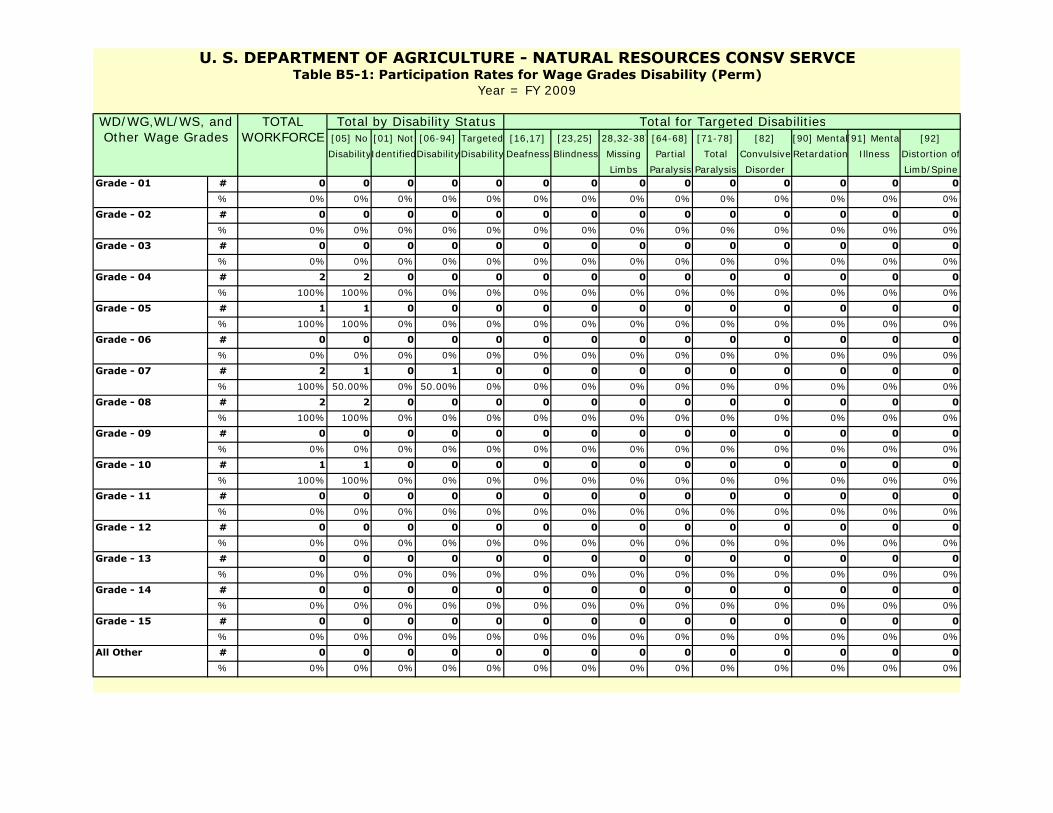
TOTALWORKFORCE [05] No [01] Not [06-94] Targeted [16,17] [23,25] [28,32-38] [64-68] [71-78] [82] [90] Mental[91] Menta [92]
DisabilityIdentifiedDisabilityDisability Deafness Blindness Missing Partial Total Convulsive Retardation Illness Distortion of
Limbs Paralysis Paralysis Disorder Limb/Spine# 0 0 0 0 0 0 0 0 0 0 0 0 0 0
% 0% 0% 0% 0% 0% 0% 0% 0% 0% 0% 0% 0% 0% 0%
# 0 0 0 0 0 0 0 0 0 0 0 0 0 0
% 0% 0% 0% 0% 0% 0% 0% 0% 0% 0% 0% 0% 0% 0%
# 0 0 0 0 0 0 0 0 0 0 0 0 0 0
% 0% 0% 0% 0% 0% 0% 0% 0% 0% 0% 0% 0% 0% 0%
# 2 2 0 0 0 0 0 0 0 0 0 0 0 0
% 100% 100% 0% 0% 0% 0% 0% 0% 0% 0% 0% 0% 0% 0%
# 1 1 0 0 0 0 0 0 0 0 0 0 0 0
% 100% 100% 0% 0% 0% 0% 0% 0% 0% 0% 0% 0% 0% 0%
# 0 0 0 0 0 0 0 0 0 0 0 0 0 0
% 0% 0% 0% 0% 0% 0% 0% 0% 0% 0% 0% 0% 0% 0%
# 2 1 0 1 0 0 0 0 0 0 0 0 0 0
% 100% 50.00% 0% 50.00% 0% 0% 0% 0% 0% 0% 0% 0% 0% 0%
# 2 2 0 0 0 0 0 0 0 0 0 0 0 0
% 100% 100% 0% 0% 0% 0% 0% 0% 0% 0% 0% 0% 0% 0%
# 0 0 0 0 0 0 0 0 0 0 0 0 0 0
% 0% 0% 0% 0% 0% 0% 0% 0% 0% 0% 0% 0% 0% 0%
# 1 1 0 0 0 0 0 0 0 0 0 0 0 0
% 100% 100% 0% 0% 0% 0% 0% 0% 0% 0% 0% 0% 0% 0%
# 0 0 0 0 0 0 0 0 0 0 0 0 0 0
% 0% 0% 0% 0% 0% 0% 0% 0% 0% 0% 0% 0% 0% 0%
# 0 0 0 0 0 0 0 0 0 0 0 0 0 0
% 0% 0% 0% 0% 0% 0% 0% 0% 0% 0% 0% 0% 0% 0%
# 0 0 0 0 0 0 0 0 0 0 0 0 0 0
% 0% 0% 0% 0% 0% 0% 0% 0% 0% 0% 0% 0% 0% 0%
# 0 0 0 0 0 0 0 0 0 0 0 0 0 0
% 0% 0% 0% 0% 0% 0% 0% 0% 0% 0% 0% 0% 0% 0%
# 0 0 0 0 0 0 0 0 0 0 0 0 0 0
% 0% 0% 0% 0% 0% 0% 0% 0% 0% 0% 0% 0% 0% 0%
# 0 0 0 0 0 0 0 0 0 0 0 0 0 0
% 0% 0% 0% 0% 0% 0% 0% 0% 0% 0% 0% 0% 0% 0%
Grade - 15
All Other
Grade - 11
Grade - 12
Grade - 13
Grade - 14
Grade - 07
Grade - 08
Grade - 09
Grade - 10
Grade - 03
Grade - 04
Grade - 05
Grade - 06
Grade - 01
Grade - 02
WD/WG,WL/WS, and Total by Disability Status Total for Targeted DisabilitiesOther Wage Grades
U. S. DEPARTMENT OF AGRICULTURE - NATURAL RESOURCES CONSV SERVCETable B5-1: Participation Rates for Wage Grades Disability (Perm)
Year = FY 2009

TOTALWORKFORCE [05] No [01] Not [06-94] Targeted [16,17] [23,25] [28,32-38] [64-68] [71-78] [82] [90] Mental[91] Menta [92]
DisabilityIdentifiedDisabilityDisability Deafness Blindness Missing Partial Total Convulsive Retardation Illness Distortion of
Limbs Paralysis Paralysis Disorder Limb/Spine# 0 0 0 0 0 0 0 0 0 0 0 0 0 0
% 0% 0% 0% 0% 0% 0% 0% 0% 0% 0% 0% 0% 0% 0%
# 0 0 0 0 0 0 0 0 0 0 0 0 0 0
% 0% 0% 0% 0% 0% 0% 0% 0% 0% 0% 0% 0% 0% 0%
# 0 0 0 0 0 0 0 0 0 0 0 0 0 0
% 0% 0% 0% 0% 0% 0% 0% 0% 0% 0% 0% 0% 0% 0%
# 0 0 0 0 0 0 0 0 0 0 0 0 0 0
% 0% 0% 0% 0% 0% 0% 0% 0% 0% 0% 0% 0% 0% 0%
# 0 0 0 0 0 0 0 0 0 0 0 0 0 0
% 0% 0% 0% 0% 0% 0% 0% 0% 0% 0% 0% 0% 0% 0%
# 0 0 0 0 0 0 0 0 0 0 0 0 0 0
% 0% 0% 0% 0% 0% 0% 0% 0% 0% 0% 0% 0% 0% 0%
# 0 0 0 0 0 0 0 0 0 0 0 0 0 0
% 0% 0% 0% 0% 0% 0% 0% 0% 0% 0% 0% 0% 0% 0%
# 0 0 0 0 0 0 0 0 0 0 0 0 0 0
% 0% 0% 0% 0% 0% 0% 0% 0% 0% 0% 0% 0% 0% 0%
# 0 0 0 0 0 0 0 0 0 0 0 0 0 0
% 0% 0% 0% 0% 0% 0% 0% 0% 0% 0% 0% 0% 0% 0%
# 0 0 0 0 0 0 0 0 0 0 0 0 0 0
% 0% 0% 0% 0% 0% 0% 0% 0% 0% 0% 0% 0% 0% 0%
# 0 0 0 0 0 0 0 0 0 0 0 0 0 0
% 0% 0% 0% 0% 0% 0% 0% 0% 0% 0% 0% 0% 0% 0%
# 0 0 0 0 0 0 0 0 0 0 0 0 0 0
% 0% 0% 0% 0% 0% 0% 0% 0% 0% 0% 0% 0% 0% 0%
# 0 0 0 0 0 0 0 0 0 0 0 0 0 0
% 0% 0% 0% 0% 0% 0% 0% 0% 0% 0% 0% 0% 0% 0%
# 0 0 0 0 0 0 0 0 0 0 0 0 0 0
% 0% 0% 0% 0% 0% 0% 0% 0% 0% 0% 0% 0% 0% 0%
# 0 0 0 0 0 0 0 0 0 0 0 0 0 0
% 0% 0% 0% 0% 0% 0% 0% 0% 0% 0% 0% 0% 0% 0%
# 0 0 0 0 0 0 0 0 0 0 0 0 0 0
% 0% 0% 0% 0% 0% 0% 0% 0% 0% 0% 0% 0% 0% 0%
Grade - 15
All Other
Grade - 11
Grade - 12
Grade - 13
Grade - 14
Grade - 07
Grade - 08
Grade - 09
Grade - 10
Grade - 03
Grade - 04
Grade - 05
Grade - 06
Grade - 01
Grade - 02
WD/WG,WL/WS, and Total by Disability Status Total for Targeted DisabilitiesOther Wage Grades
U. S. DEPARTMENT OF AGRICULTURE - NATURAL RESOURCES CONSV SERVCETable B5-1: Participation Rates for Wage Grades Disability (Temp)
Year = FY 2009

TOTALWORKFORCE [05] No [01] Not [06-94] Targeted [16,17] [23,25] [28,32-38] [64-68] [71-78] [82] [90] Mental[91] Menta [92]
DisabilityIdentifiedDisabilityDisability Deafness Blindness Missing Partial Total Convulsive Retardation Illness Distortion of
Limbs Paralysis Paralysis Disorder Limb/Spine# 0 0 0 0 0 0 0 0 0 0 0 0 0 0
% 0% 0% 0% 0% 0% 0% 0% 0% 0% 0% 0% 0% 0% 0%
# 0 0 0 0 0 0 0 0 0 0 0 0 0 0
% 0% 0% 0% 0% 0% 0% 0% 0% 0% 0% 0% 0% 0% 0%
# 0 0 0 0 0 0 0 0 0 0 0 0 0 0
% 0% 0% 0% 0% 0% 0% 0% 0% 0% 0% 0% 0% 0% 0%
# 2 2 0 0 0 0 0 0 0 0 0 0 0 0
% 25.00% 28.57% 0% 0% 0% 0% 0% 0% 0% 0% 0% 0% 0% 0%
# 1 1 0 0 0 0 0 0 0 0 0 0 0 0
% 12.50% 14.29% 0% 0% 0% 0% 0% 0% 0% 0% 0% 0% 0% 0%
# 0 0 0 0 0 0 0 0 0 0 0 0 0 0
% 0% 0% 0% 0% 0% 0% 0% 0% 0% 0% 0% 0% 0% 0%
# 2 1 0 1 0 0 0 0 0 0 0 0 0 0
% 25.00% 14.29% 0% 100% 0% 0% 0% 0% 0% 0% 0% 0% 0% 0%
# 2 2 0 0 0 0 0 0 0 0 0 0 0 0
% 25.00% 28.57% 0% 0% 0% 0% 0% 0% 0% 0% 0% 0% 0% 0%
# 0 0 0 0 0 0 0 0 0 0 0 0 0 0
% 0% 0% 0% 0% 0% 0% 0% 0% 0% 0% 0% 0% 0% 0%
# 1 1 0 0 0 0 0 0 0 0 0 0 0 0
% 12.50% 14.29% 0% 0% 0% 0% 0% 0% 0% 0% 0% 0% 0% 0%
# 0 0 0 0 0 0 0 0 0 0 0 0 0 0
% 12.50% 14.29% 0% 0% 0% 0% 0% 0% 0% 0% 0% 0% 0% 0%
# 0 0 0 0 0 0 0 0 0 0 0 0 0 0
% 0% 0% 0% 0% 0% 0% 0% 0% 0% 0% 0% 0% 0% 0%
# 0 0 0 0 0 0 0 0 0 0 0 0 0 0
% 0% 0% 0% 0% 0% 0% 0% 0% 0% 0% 0% 0% 0% 0%
# 0 0 0 0 0 0 0 0 0 0 0 0 0 0
% 0% 0% 0% 0% 0% 0% 0% 0% 0% 0% 0% 0% 0% 0%
# 0 0 0 0 0 0 0 0 0 0 0 0 0 0
% 0% 0% 0% 0% 0% 0% 0% 0% 0% 0% 0% 0% 0% 0%
# 0 0 0 0 0 0 0 0 0 0 0 0 0 0
% 0% 0% 0% 0% 0% 0% 0% 0% 0% 0% 0% 0% 0% 0%
# 8 7 0 1 0 0 0 0 0 0 0 0 0 0
% 100% 100% 100% 100% 100% 100% 100% 100% 100% 100% 100% 100% 100% 100%
Grade - 15
All Other
TOTAL
NOTE: Percentages computed down columns and NOT across rows
Grade - 11
Grade - 12
Grade - 13
Grade - 14
Grade - 07
Grade - 08
Grade - 09
Grade - 10
Grade - 03
Grade - 04
Grade - 05
Grade - 06
Grade - 01
Grade - 02
WD/WG,WL/WS, and Total by Disability Status Total for Targeted DisabilitiesOther Wage Grades
U. S. DEPARTMENT OF AGRICULTURE - NATURAL RESOURCES CONSV SERVCETable B5-2: Participation Rates for Wage Grades by Disability (Perm)
Year = FY 2009
TOTALWORKFORCE [05] No [01] Not [06-94] Targeted [16,17] [23,25] [28,32-38] [64-68] [71-78] [82] [90] Mental[91] Menta [92]
DisabilityIdentifiedDisabilityDisability Deafness Blindness Missing Partial Total Convulsive Retardation Illness Distortion of
Limbs Paralysis Paralysis Disorder Limb/Spine# 0 0 0 0 0 0 0 0 0 0 0 0 0 0
% 0% 0% 0% 0% 0% 0% 0% 0% 0% 0% 0% 0% 0% 0%
# 0 0 0 0 0 0 0 0 0 0 0 0 0 0
% 0% 0% 0% 0% 0% 0% 0% 0% 0% 0% 0% 0% 0% 0%
# 0 0 0 0 0 0 0 0 0 0 0 0 0 0
% 0% 0% 0% 0% 0% 0% 0% 0% 0% 0% 0% 0% 0% 0%
# 0 0 0 0 0 0 0 0 0 0 0 0 0 0
% 0% 0% 0% 0% 0% 0% 0% 0% 0% 0% 0% 0% 0% 0%
# 0 0 0 0 0 0 0 0 0 0 0 0 0 0
% 0% 0% 0% 0% 0% 0% 0% 0% 0% 0% 0% 0% 0% 0%
# 0 0 0 0 0 0 0 0 0 0 0 0 0 0
% 0% 0% 0% 0% 0% 0% 0% 0% 0% 0% 0% 0% 0% 0%
# 0 0 0 0 0 0 0 0 0 0 0 0 0 0
% 0% 0% 0% 0% 0% 0% 0% 0% 0% 0% 0% 0% 0% 0%
# 0 0 0 0 0 0 0 0 0 0 0 0 0 0
% 0% 0% 0% 0% 0% 0% 0% 0% 0% 0% 0% 0% 0% 0%
# 0 0 0 0 0 0 0 0 0 0 0 0 0 0
% 0% 0% 0% 0% 0% 0% 0% 0% 0% 0% 0% 0% 0% 0%
# 0 0 0 0 0 0 0 0 0 0 0 0 0 0
% 0% 0% 0% 0% 0% 0% 0% 0% 0% 0% 0% 0% 0% 0%
# 0 0 0 0 0 0 0 0 0 0 0 0 0 0
% 0% 0% 0% 0% 0% 0% 0% 0% 0% 0% 0% 0% 0% 0%
# 0 0 0 0 0 0 0 0 0 0 0 0 0 0
% 0% 0% 0% 0% 0% 0% 0% 0% 0% 0% 0% 0% 0% 0%
# 0 0 0 0 0 0 0 0 0 0 0 0 0 0
% 0% 0% 0% 0% 0% 0% 0% 0% 0% 0% 0% 0% 0% 0%
# 0 0 0 0 0 0 0 0 0 0 0 0 0 0
% 0% 0% 0% 0% 0% 0% 0% 0% 0% 0% 0% 0% 0% 0%
# 0 0 0 0 0 0 0 0 0 0 0 0 0 0
% 0% 0% 0% 0% 0% 0% 0% 0% 0% 0% 0% 0% 0% 0%
# 0 0 0 0 0 0 0 0 0 0 0 0 0 0
% 0% 0% 0% 0% 0% 0% 0% 0% 0% 0% 0% 0% 0% 0%
# 0 0 0 0 0 0 0 0 0 0 0 0 0 0
% 0% 0% 0% 0% 0% 0% 0% 0% 0% 0% 0% 0% 0% 0%
Grade - 15
All Other
TOTAL
NOTE: Percentages computed down columns and NOT across rows
Grade - 11
Grade - 12
Grade - 13
Grade - 14
Grade - 07
Grade - 08
Grade - 09
Grade - 10
Grade - 03
Grade - 04
Grade - 05
Grade - 06
Grade - 01
Grade - 02
WD/WG,WL/WS, and Total by Disability Status Total for Targeted DisabilitiesOther Wage Grades
U. S. DEPARTMENT OF AGRICULTURE - NATURAL RESOURCES CONSV SERVCETable B5-2: Participation Rates for Wage Grades by Disability (Temp)
Year = FY 2009

TOTALWORKFORCE [05] No [01] Not [06-94] Targeted [16,17] [23,25] [28,32-38 [64-68] [71-78] [82] [90] Mental[91] Menta [92]
DisabilityIdentifiedDisabilityDisability Deafness Blindness Missing Partial Total ConvulsiveRetardation Illness Distortion of
Limbs Paralysis Paralysis Disorder Limb/Spine# 6 5 0 1 0 0 0 0 0 0 0 0 0 0
% 100% 83.33% 0% 16.67% 0% 0% 0% 0% 0% 0% 0% 0% 0% 0%
# 2 1 0 1 0 0 0 0 0 0 0 0 0 0
% 100% 50.00% 0% 50.00% 0% 0% 0% 0% 0% 0% 0% 0% 0% 0%
# 1 1 0 0 0 0 0 0 0 0 0 0 0 0
% 100% 100% 0% 0% 0% 0% 0% 0% 0% 0% 0% 0% 0% 0%
# 40 38 1 1 0 0 0 0 0 0 0 0 0 0
% 100% 95.00% 2.50% 2.50% 0% 0% 0% 0% 0% 0% 0% 0% 0% 0%
# 16 16 0 0 0 0 0 0 0 0 0 0 0 0
% 100% 100% 0% 0% 0% 0% 0% 0% 0% 0% 0% 0% 0% 0%
# 1 1 0 0 0 0 0 0 0 0 0 0 0 0
% 100% 100% 0% 0% 0% 0% 0% 0% 0% 0% 0% 0% 0% 0%
# 4 3 0 1 1 0 1 0 0 0 0 0 0 0
% 100% 75.00% 0% 25.00% 25.00% 0% 25.00% 0% 0% 0% 0% 0% 0% 0%
# 38 34 0 4 1 1 0 0 0 0 0 0 0 0
% 100% 89.47% 0% 10.53% 2.63% 2.63% 0% 0% 0% 0% 0% 0% 0% 0%
# 2 1 0 1 0 0 0 0 0 0 0 0 0 0
% 100% 50.00% 0% 50.00% 0% 0% 0% 0% 0% 0% 0% 0% 0% 0%
# 116 102 0 14 0 0 0 0 0 0 0 0 0 0
% 100% 87.93% 0% 12.07% 0% 0% 0% 0% 0% 0% 0% 0% 0% 0%
# 46 39 1 6 3 1 1 0 1 0 0 0 0 0
% 100% 84.78% 2.17% 13.04% 6.52% 2.17% 2.17% 0% 2.17% 0% 0% 0% 0% 0%
# 16 13 0 3 1 1 0 0 0 0 0 0 0 0
% 100% 81.25% 0% 18.75% 6.25% 6.25% 0% 0% 0% 0% 0% 0% 0% 0%
# 89 82 1 6 0 0 0 0 0 0 0 0 0 0
% 100% 92.13% 1.12% 6.74% 0% 0% 0% 0% 0% 0% 0% 0% 0% 0%
# 289 250 7 32 3 1 0 0 0 0 0 0 2 0
% 100% 86.51% 2.42% 11.07% 1.04% 0.35% 0% 0% 0% 0% 0% 0% 0.69% 0%
# 11 2 1 8 4 2 0 0 0 1 0 1 0 0
% 100% 18.18% 9.09% 72.73% 36.36% 18.18% 0% 0% 0% 9.09% 0% 9.09% 0% 0%
# 1 1 0 0 0 0 0 0 0 0 0 0 0 0
% 100% 100% 0% 0% 0% 0% 0% 0% 0% 0% 0% 0% 0% 0%
# 179 157 1 21 2 0 0 0 1 1 0 0 0 0
% 100% 87.71% 0.56% 11.73% 1.12% 0% 0% 0% 0.56% 0.56% 0% 0% 0% 0%
# 3 3 0 0 0 0 0 0 0 0 0 0 0 0
% 100% 100% 0% 0% 0% 0% 0% 0% 0% 0% 0% 0% 0% 0%
# 58 49 0 9 3 1 0 0 1 1 0 0 0 0
% 100% 84.48% 0% 15.52% 5.17% 1.72% 0% 0% 1.72% 1.72% 0% 0% 0% 0%
0322 - CLERK-TYPIST
0326 - OFFICE AUTOMATION CLERICAL & ASSISTANC
0303 - MISCELLANEOUS CLERK & ASSISTANT
0305 - MAIL & FILE
0309 - CORRESPONDENCE CLERK
0318 - SECRETARY
0201 - HUMAN RESOURCES MANAGEMENT
0203 - HUMAN RESOURCES CLERICAL & ASSISTANC
0260 - EQUAL EMPLOYMENT OPPORTUNITY
0301 - MISCELLANEOUS ADMINISTRATION & PROGR
0170 - HISTORY
0184 - SOCIOLOGY
0193 - ARCHEOLOGY
0199 - SOCIAL SCIENCE STUDENT TRAINEE
0029 - ENVIRONMENTAL PROTECTION ASSISTANT
0080 - SECURITY ADMINISTRATION
0110 - ECONOMIST
0150 - GEOGRAPHY
SERIES/JOB TITLE
Total by Disability Status Total for Targeted Disabilities
0020 - COMMUNITY PLANNING
U. S. DEPARTMENT OF AGRICULTURE - NATURAL RESOURCES CONSV SERVCETable B6: Participation Rates for Major Occupations - Distribution by Disability [OPM Form 256 Self-Identification Codes] (Perm)
Year = FY 2009
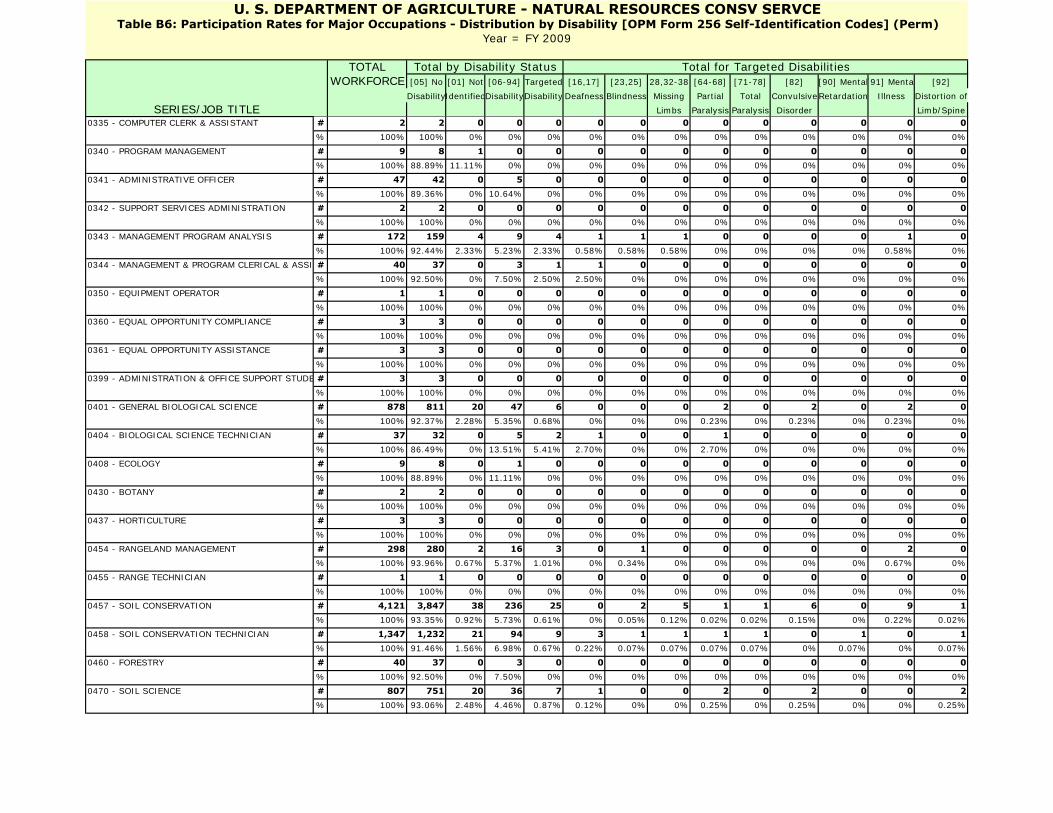
TOTALWORKFORCE [05] No [01] Not [06-94] Targeted [16,17] [23,25] [28,32-38 [64-68] [71-78] [82] [90] Mental[91] Menta [92]
DisabilityIdentifiedDisabilityDisability Deafness Blindness Missing Partial Total ConvulsiveRetardation Illness Distortion of
Limbs Paralysis Paralysis Disorder Limb/SpineSERIES/JOB TITLE
Total by Disability Status Total for Targeted Disabilities
U. S. DEPARTMENT OF AGRICULTURE - NATURAL RESOURCES CONSV SERVCETable B6: Participation Rates for Major Occupations - Distribution by Disability [OPM Form 256 Self-Identification Codes] (Perm)
Year = FY 2009
# 2 2 0 0 0 0 0 0 0 0 0 0 0 0
% 100% 100% 0% 0% 0% 0% 0% 0% 0% 0% 0% 0% 0% 0%
# 9 8 1 0 0 0 0 0 0 0 0 0 0 0
% 100% 88.89% 11.11% 0% 0% 0% 0% 0% 0% 0% 0% 0% 0% 0%
# 47 42 0 5 0 0 0 0 0 0 0 0 0 0
% 100% 89.36% 0% 10.64% 0% 0% 0% 0% 0% 0% 0% 0% 0% 0%
# 2 2 0 0 0 0 0 0 0 0 0 0 0 0
% 100% 100% 0% 0% 0% 0% 0% 0% 0% 0% 0% 0% 0% 0%
# 172 159 4 9 4 1 1 1 0 0 0 0 1 0
% 100% 92.44% 2.33% 5.23% 2.33% 0.58% 0.58% 0.58% 0% 0% 0% 0% 0.58% 0%
# 40 37 0 3 1 1 0 0 0 0 0 0 0 0
% 100% 92.50% 0% 7.50% 2.50% 2.50% 0% 0% 0% 0% 0% 0% 0% 0%
# 1 1 0 0 0 0 0 0 0 0 0 0 0 0
% 100% 100% 0% 0% 0% 0% 0% 0% 0% 0% 0% 0% 0% 0%
# 3 3 0 0 0 0 0 0 0 0 0 0 0 0
% 100% 100% 0% 0% 0% 0% 0% 0% 0% 0% 0% 0% 0% 0%
# 3 3 0 0 0 0 0 0 0 0 0 0 0 0
% 100% 100% 0% 0% 0% 0% 0% 0% 0% 0% 0% 0% 0% 0%
# 3 3 0 0 0 0 0 0 0 0 0 0 0 0
% 100% 100% 0% 0% 0% 0% 0% 0% 0% 0% 0% 0% 0% 0%
# 878 811 20 47 6 0 0 0 2 0 2 0 2 0
% 100% 92.37% 2.28% 5.35% 0.68% 0% 0% 0% 0.23% 0% 0.23% 0% 0.23% 0%
# 37 32 0 5 2 1 0 0 1 0 0 0 0 0
% 100% 86.49% 0% 13.51% 5.41% 2.70% 0% 0% 2.70% 0% 0% 0% 0% 0%
# 9 8 0 1 0 0 0 0 0 0 0 0 0 0
% 100% 88.89% 0% 11.11% 0% 0% 0% 0% 0% 0% 0% 0% 0% 0%
# 2 2 0 0 0 0 0 0 0 0 0 0 0 0
% 100% 100% 0% 0% 0% 0% 0% 0% 0% 0% 0% 0% 0% 0%
# 3 3 0 0 0 0 0 0 0 0 0 0 0 0
% 100% 100% 0% 0% 0% 0% 0% 0% 0% 0% 0% 0% 0% 0%
# 298 280 2 16 3 0 1 0 0 0 0 0 2 0
% 100% 93.96% 0.67% 5.37% 1.01% 0% 0.34% 0% 0% 0% 0% 0% 0.67% 0%
# 1 1 0 0 0 0 0 0 0 0 0 0 0 0
% 100% 100% 0% 0% 0% 0% 0% 0% 0% 0% 0% 0% 0% 0%
# 4,121 3,847 38 236 25 0 2 5 1 1 6 0 9 1
% 100% 93.35% 0.92% 5.73% 0.61% 0% 0.05% 0.12% 0.02% 0.02% 0.15% 0% 0.22% 0.02%
# 1,347 1,232 21 94 9 3 1 1 1 1 0 1 0 1
% 100% 91.46% 1.56% 6.98% 0.67% 0.22% 0.07% 0.07% 0.07% 0.07% 0% 0.07% 0% 0.07%
# 40 37 0 3 0 0 0 0 0 0 0 0 0 0
% 100% 92.50% 0% 7.50% 0% 0% 0% 0% 0% 0% 0% 0% 0% 0%
# 807 751 20 36 7 1 0 0 2 0 2 0 0 2
% 100% 93.06% 2.48% 4.46% 0.87% 0.12% 0% 0% 0.25% 0% 0.25% 0% 0% 0.25%
0458 - SOIL CONSERVATION TECHNICIAN
0460 - FORESTRY
0470 - SOIL SCIENCE
0437 - HORTICULTURE
0454 - RANGELAND MANAGEMENT
0455 - RANGE TECHNICIAN
0457 - SOIL CONSERVATION
0401 - GENERAL BIOLOGICAL SCIENCE
0404 - BIOLOGICAL SCIENCE TECHNICIAN
0408 - ECOLOGY
0430 - BOTANY
0350 - EQUIPMENT OPERATOR
0360 - EQUAL OPPORTUNITY COMPLIANCE
0361 - EQUAL OPPORTUNITY ASSISTANCE
0399 - ADMINISTRATION & OFFICE SUPPORT STUDE
0341 - ADMINISTRATIVE OFFICER
0342 - SUPPORT SERVICES ADMINISTRATION
0343 - MANAGEMENT PROGRAM ANALYSIS
0344 - MANAGEMENT & PROGRAM CLERICAL & ASSI
0335 - COMPUTER CLERK & ASSISTANT
0340 - PROGRAM MANAGEMENT

TOTALWORKFORCE [05] No [01] Not [06-94] Targeted [16,17] [23,25] [28,32-38 [64-68] [71-78] [82] [90] Mental[91] Menta [92]
DisabilityIdentifiedDisabilityDisability Deafness Blindness Missing Partial Total ConvulsiveRetardation Illness Distortion of
Limbs Paralysis Paralysis Disorder Limb/SpineSERIES/JOB TITLE
Total by Disability Status Total for Targeted Disabilities
U. S. DEPARTMENT OF AGRICULTURE - NATURAL RESOURCES CONSV SERVCETable B6: Participation Rates for Major Occupations - Distribution by Disability [OPM Form 256 Self-Identification Codes] (Perm)
Year = FY 2009
# 121 108 2 11 1 0 0 0 0 0 0 0 1 0
% 100% 89.26% 1.65% 9.09% 0.83% 0% 0% 0% 0% 0% 0% 0% 0.83% 0%
# 1 1 0 0 0 0 0 0 0 0 0 0 0 0
% 100% 100% 0% 0% 0% 0% 0% 0% 0% 0% 0% 0% 0% 0%
# 7 6 0 1 0 0 0 0 0 0 0 0 0 0
% 100% 85.71% 0% 14.29% 0% 0% 0% 0% 0% 0% 0% 0% 0% 0%
# 44 43 0 1 0 0 0 0 0 0 0 0 0 0
% 100% 97.73% 0% 2.27% 0% 0% 0% 0% 0% 0% 0% 0% 0% 0%
# 160 150 3 7 0 0 0 0 0 0 0 0 0 0
% 100% 93.75% 1.88% 4.38% 0% 0% 0% 0% 0% 0% 0% 0% 0% 0%
# 12 12 0 0 0 0 0 0 0 0 0 0 0 0
% 100% 100% 0% 0% 0% 0% 0% 0% 0% 0% 0% 0% 0% 0%
# 33 29 2 2 0 0 0 0 0 0 0 0 0 0
% 100% 87.88% 6.06% 6.06% 0% 0% 0% 0% 0% 0% 0% 0% 0% 0%
# 2 2 0 0 0 0 0 0 0 0 0 0 0 0
% 100% 100% 0% 0% 0% 0% 0% 0% 0% 0% 0% 0% 0% 0%
# 10 9 0 1 0 0 0 0 0 0 0 0 0 0
% 100% 90.00% 0% 10.00% 0% 0% 0% 0% 0% 0% 0% 0% 0% 0%
# 18 16 0 2 0 0 0 0 0 0 0 0 0 0
% 100% 88.89% 0% 11.11% 0% 0% 0% 0% 0% 0% 0% 0% 0% 0%
# 14 11 0 3 1 0 0 0 0 0 1 0 0 0
% 100% 78.57% 0% 21.43% 7.14% 0% 0% 0% 0% 0% 7.14% 0% 0% 0%
# 111 107 0 4 0 0 0 0 0 0 0 0 0 0
% 100% 96.40% 0% 3.60% 0% 0% 0% 0% 0% 0% 0% 0% 0% 0%
# 1 1 0 0 0 0 0 0 0 0 0 0 0 0
% 100% 100% 0% 0% 0% 0% 0% 0% 0% 0% 0% 0% 0% 0%
# 6 6 0 0 0 0 0 0 0 0 0 0 0 0
% 100% 100% 0% 0% 0% 0% 0% 0% 0% 0% 0% 0% 0% 0%
# 435 396 4 35 6 0 0 0 0 3 2 1 0 0
% 100% 91.03% 0.92% 8.05% 1.38% 0% 0% 0% 0% 0.69% 0.46% 0.23% 0% 0%
# 4 3 0 1 0 0 0 0 0 0 0 0 0 0
% 100% 75.00% 0% 25.00% 0% 0% 0% 0% 0% 0% 0% 0% 0% 0%
# 31 25 0 6 0 0 0 0 0 0 0 0 0 0
% 100% 80.65% 0% 19.35% 0% 0% 0% 0% 0% 0% 0% 0% 0% 0%
# 516 485 12 19 3 1 0 0 0 1 0 0 1 0
% 100% 93.99% 2.33% 3.68% 0.58% 0.19% 0% 0% 0% 0.19% 0% 0% 0.19% 0%
# 3 1 0 2 0 0 0 0 0 0 0 0 0 0
% 100% 33.33% 0% 66.67% 0% 0% 0% 0% 0% 0% 0% 0% 0% 0%
# 21 20 0 1 0 0 0 0 0 0 0 0 0 0
% 100% 95.24% 0% 4.76% 0% 0% 0% 0% 0% 0% 0% 0% 0% 0%
# 7 7 0 0 0 0 0 0 0 0 0 0 0 0
% 100% 100% 0% 0% 0% 0% 0% 0% 0% 0% 0% 0% 0% 0%
0810 - CIVIL ENGINEERING
0817 - SURVEYING TECHNICIAN
0819 - ENVIRONMENTAL ENGINEERING
0856 - ELECTRONICS TECHNICIAN
0801 - GENERAL ENGINEERING
0802 - ENGINEERING TECHNICIAN
0807 - LANDSCAPE ARCHITECTURE
0809 - CONSTRUCTION CONTROL
0525 - ACCOUNTING TECHNICIAN
0540 - VOUCHER EXAMINING
0560 - BUDGET ANALYSIS
0561 - BUDGET CLERICAL & ASSISTANCE
0501 - FINANCIAL ADMINISTRATION & PROGRAM
0503 - FINANCIAL CLERICAL & TECHNICIAN
0505 - FINANCIAL MANAGEMENT
0510 - ACCOUNTING
0480 - GENERAL FISH & WILDLIFE ADMINISTRATION
0482 - FISHERY BIOLOGY
0486 - WILDLIFE BIOLOGY
0499 - BIOLOGICAL SCIENCE STUDENT TRAINEE
0471 - AGRONOMY

TOTALWORKFORCE [05] No [01] Not [06-94] Targeted [16,17] [23,25] [28,32-38 [64-68] [71-78] [82] [90] Mental[91] Menta [92]
DisabilityIdentifiedDisabilityDisability Deafness Blindness Missing Partial Total ConvulsiveRetardation Illness Distortion of
Limbs Paralysis Paralysis Disorder Limb/SpineSERIES/JOB TITLE
Total by Disability Status Total for Targeted Disabilities
U. S. DEPARTMENT OF AGRICULTURE - NATURAL RESOURCES CONSV SERVCETable B6: Participation Rates for Major Occupations - Distribution by Disability [OPM Form 256 Self-Identification Codes] (Perm)
Year = FY 2009
# 255 236 5 14 0 0 0 0 0 0 0 0 0 0
% 100% 92.55% 1.96% 5.49% 0% 0% 0% 0% 0% 0% 0% 0% 0% 0%
# 42 40 0 2 0 0 0 0 0 0 0 0 0 0
% 100% 95.24% 0% 4.76% 0% 0% 0% 0% 0% 0% 0% 0% 0% 0%
# 1 1 0 0 0 0 0 0 0 0 0 0 0 0
% 100% 100% 0% 0% 0% 0% 0% 0% 0% 0% 0% 0% 0% 0%
# 3 3 0 0 0 0 0 0 0 0 0 0 0 0
% 100% 100% 0% 0% 0% 0% 0% 0% 0% 0% 0% 0% 0% 0%
# 1 1 0 0 0 0 0 0 0 0 0 0 0 0
% 100% 100% 0% 0% 0% 0% 0% 0% 0% 0% 0% 0% 0% 0%
# 84 76 2 6 1 0 0 0 0 0 0 0 1 0
% 100% 90.48% 2.38% 7.14% 1.19% 0% 0% 0% 0% 0% 0% 0% 1.19% 0%
# 1 1 0 0 0 0 0 0 0 0 0 0 0 0
% 100% 100% 0% 0% 0% 0% 0% 0% 0% 0% 0% 0% 0% 0%
# 2 2 0 0 0 0 0 0 0 0 0 0 0 0
% 100% 100% 0% 0% 0% 0% 0% 0% 0% 0% 0% 0% 0% 0%
# 18 16 0 2 0 0 0 0 0 0 0 0 0 0
% 100% 88.89% 0% 11.11% 0% 0% 0% 0% 0% 0% 0% 0% 0% 0%
# 1 1 0 0 0 0 0 0 0 0 0 0 0 0
% 100% 100% 0% 0% 0% 0% 0% 0% 0% 0% 0% 0% 0% 0%
# 17 11 0 6 2 0 0 0 1 1 0 0 0 0
% 100% 64.71% 0% 35.29% 11.76% 0% 0% 0% 5.88% 5.88% 0% 0% 0% 0%
# 2 2 0 0 0 0 0 0 0 0 0 0 0 0
% 100% 100% 0% 0% 0% 0% 0% 0% 0% 0% 0% 0% 0% 0%
# 4 4 0 0 0 0 0 0 0 0 0 0 0 0
% 100% 100% 0% 0% 0% 0% 0% 0% 0% 0% 0% 0% 0% 0%
# 23 22 0 1 0 0 0 0 0 0 0 0 0 0
% 100% 95.65% 0% 4.35% 0% 0% 0% 0% 0% 0% 0% 0% 0% 0%
# 84 74 1 9 2 0 0 1 1 0 0 0 0 0
% 100% 88.10% 1.19% 10.71% 2.38% 0% 0% 1.19% 1.19% 0% 0% 0% 0% 0%
# 28 26 0 2 0 0 0 0 0 0 0 0 0 0
% 100% 92.86% 0% 7.14% 0% 0% 0% 0% 0% 0% 0% 0% 0% 0%
# 4 3 0 1 0 0 0 0 0 0 0 0 0 0
% 100% 75.00% 0% 25.00% 0% 0% 0% 0% 0% 0% 0% 0% 0% 0%
# 3 3 0 0 0 0 0 0 0 0 0 0 0 0
% 100% 100% 0% 0% 0% 0% 0% 0% 0% 0% 0% 0% 0% 0%
# 1 0 0 1 0 0 0 0 0 0 0 0 0 0
% 100% 0% 0% 100% 0% 0% 0% 0% 0% 0% 0% 0% 0% 0%
# 8 8 0 0 0 0 0 0 0 0 0 0 0 0
% 100% 100% 0% 0% 0% 0% 0% 0% 0% 0% 0% 0% 0% 0%
# 20 17 0 3 1 1 0 0 0 0 0 0 0 0
% 100% 85.00% 0% 15.00% 5.00% 5.00% 0% 0% 0% 0% 0% 0% 0% 0%
1311 - PHYSICAL SCIENCE TECHNICIAN
1106 - PROCUREMENT CLERICAL & ASSISTANCE
1170 - REALTY
1171 - APPRAISING
1301 - GENERAL PHYSICAL SCIENCE
1099 - INFORMATION & ARTS STUDENT TRAINEE
1101 - GENERAL BUSINESS & INDUSTRY
1102 - CONTRACTING
1105 - PURCHASING
1082 - WRITING & EDITING
1083 - TECHNICAL WRITING & EDITING
1084 - VISUAL INFORMATION
1087 - EDITORIAL ASSISTANCE
1020 - ILLUSTRATING
1035 - PUBLIC AFFAIRS
1060 - PHOTOGRAPHY
1071 - AUDIOVISUAL PRODUCTION
0890 - AGRICULTURAL ENGINEERING
0899 - ENGINEERING & ARCHITECTURE STUDENT TR
0963 - LEGAL INSTRUMENTS EXAMINING
1001 - GENERAL ARTS & INFORMATION

TOTALWORKFORCE [05] No [01] Not [06-94] Targeted [16,17] [23,25] [28,32-38 [64-68] [71-78] [82] [90] Mental[91] Menta [92]
DisabilityIdentifiedDisabilityDisability Deafness Blindness Missing Partial Total ConvulsiveRetardation Illness Distortion of
Limbs Paralysis Paralysis Disorder Limb/SpineSERIES/JOB TITLE
Total by Disability Status Total for Targeted Disabilities
U. S. DEPARTMENT OF AGRICULTURE - NATURAL RESOURCES CONSV SERVCETable B6: Participation Rates for Major Occupations - Distribution by Disability [OPM Form 256 Self-Identification Codes] (Perm)
Year = FY 2009
# 35 33 1 1 0 0 0 0 0 0 0 0 0 0
% 100% 94.29% 2.86% 2.86% 0% 0% 0% 0% 0% 0% 0% 0% 0% 0%
# 9 7 2 0 0 0 0 0 0 0 0 0 0 0
% 100% 77.78% 22.22% 0% 0% 0% 0% 0% 0% 0% 0% 0% 0% 0%
# 1 1 0 0 0 0 0 0 0 0 0 0 0 0
% 100% 100% 0% 0% 0% 0% 0% 0% 0% 0% 0% 0% 0% 0%
# 1 1 0 0 0 0 0 0 0 0 0 0 0 0
% 100% 100% 0% 0% 0% 0% 0% 0% 0% 0% 0% 0% 0% 0%
# 33 30 1 2 1 0 0 0 0 0 0 0 1 0
% 100% 90.91% 3.03% 6.06% 3.03% 0% 0% 0% 0% 0% 0% 0% 3.03% 0%
# 71 65 1 5 2 1 0 0 1 0 0 0 0 0
% 100% 91.55% 1.41% 7.04% 2.82% 1.41% 0% 0% 1.41% 0% 0% 0% 0% 0%
# 51 43 3 5 2 0 0 0 2 0 0 0 0 0
% 100% 84.31% 5.88% 9.80% 3.92% 0% 0% 0% 3.92% 0% 0% 0% 0% 0%
# 1 1 0 0 0 0 0 0 0 0 0 0 0 0
% 100% 100% 0% 0% 0% 0% 0% 0% 0% 0% 0% 0% 0% 0%
# 5 4 0 1 0 0 0 0 0 0 0 0 0 0
% 100% 80.00% 0% 20.00% 0% 0% 0% 0% 0% 0% 0% 0% 0% 0%
# 2 2 0 0 0 0 0 0 0 0 0 0 0 0
% 100% 100% 0% 0% 0% 0% 0% 0% 0% 0% 0% 0% 0% 0%
# 3 3 0 0 0 0 0 0 0 0 0 0 0 0
% 100% 100% 0% 0% 0% 0% 0% 0% 0% 0% 0% 0% 0% 0%
# 1 1 0 0 0 0 0 0 0 0 0 0 0 0
% 100% 100% 0% 0% 0% 0% 0% 0% 0% 0% 0% 0% 0% 0%
# 2 2 0 0 0 0 0 0 0 0 0 0 0 0
% 100% 100% 0% 0% 0% 0% 0% 0% 0% 0% 0% 0% 0% 0%
# 3 2 0 1 0 0 0 0 0 0 0 0 0 0
% 100% 66.67% 0% 33.33% 0% 0% 0% 0% 0% 0% 0% 0% 0% 0%
# 5 3 1 1 0 0 0 0 0 0 0 0 0 0
% 100% 60.00% 20.00% 20.00% 0% 0% 0% 0% 0% 0% 0% 0% 0% 0%
# 4 3 0 1 0 0 0 0 0 0 0 0 0 0
% 100% 75.00% 0% 25.00% 0% 0% 0% 0% 0% 0% 0% 0% 0% 0%
# 1 1 0 0 0 0 0 0 0 0 0 0 0 0
% 100% 100% 0% 0% 0% 0% 0% 0% 0% 0% 0% 0% 0% 0%
# 7 3 0 4 2 0 0 0 0 0 0 2 0 0
% 100% 42.86% 0% 57.14% 28.57% 0% 0% 0% 0% 0% 0% 28.57% 0% 0%
# 42 34 1 7 1 0 1 0 0 0 0 0 0 0
% 100% 80.95% 2.38% 16.67% 2.38% 0% 2.38% 0% 0% 0% 0% 0% 0% 0%
# 1 1 0 0 0 0 0 0 0 0 0 0 0 0
% 100% 100% 0% 0% 0% 0% 0% 0% 0% 0% 0% 0% 0% 0%
# 6 5 0 1 0 0 0 0 0 0 0 0 0 0
% 100% 83.33% 0% 16.67% 0% 0% 0% 0% 0% 0% 0% 0% 0% 0%
# 1 1 0 0 0 0 0 0 0 0 0 0 0 0
% 100% 100% 0% 0% 0% 0% 0% 0% 0% 0% 0% 0% 0% 0%
5002 - FARMING
5003 - GARDENING
5729 - DRILL RIG OPERATING
1750 - INSTRUCTIONAL SYSTEMS
2001 - GENERAL SUPPLY
2005 - SUPPLY CLERICAL & TECHNICIAN
2210 - INFORMATION TECHNOLOGY MANAGEMENT
1550 - COMPUTER SCIENCE
1654 - PRINTING MANAGEMENT
1702 - EDUCATION & TRAINING TECHNICIAN
1712 - TRAINING INSTRUCTION
1399 - PHYSICAL SCIENCE STUDENT TRAINEE
1412 - TECHNICIAN INFORMATION SERVICES
1530 - STATISTICIAN
1531 - STATISTICAL ASSISTANT
1340 - METEOROLOGY
1350 - GEOLOGY
1370 - CARTOGRAPHY
1371 - CARTOGRAPHIC TECHNICIAN
1315 - HYDROLOGY
1316 - HYDROLOGIC TECHNICIAN
1320 - CHEMISTRY

TOTALWORKFORCE [05] No [01] Not [06-94] Targeted [16,17] [23,25] [28,32-38 [64-68] [71-78] [82] [90] Mental[91] Menta [92]
DisabilityIdentifiedDisabilityDisability Deafness Blindness Missing Partial Total ConvulsiveRetardation Illness Distortion of
Limbs Paralysis Paralysis Disorder Limb/Spine# 1 0 0 1 0 0 0 0 0 0 0 0 0 0
% 100% 0% 0% 100% 0% 0% 0% 0% 0% 0% 0% 0% 0% 0%
# 1 0 0 1 0 0 0 0 0 0 0 0 0 0
% 100% 0% 0% 100% 0% 0% 0% 0% 0% 0% 0% 0% 0% 0%
# 1 1 0 0 0 0 0 0 0 0 0 0 0 0
% 100% 100% 0% 0% 0% 0% 0% 0% 0% 0% 0% 0% 0% 0%
# 2 1 0 1 1 0 0 0 1 0 0 0 0 0
% 100% 50.00% 0% 50.00% 50.00% 0% 0% 0% 50.00% 0% 0% 0% 0% 0%
# 1 1 0 0 0 0 0 0 0 0 0 0 0 0
% 100% 100% 0% 0% 0% 0% 0% 0% 0% 0% 0% 0% 0% 0%
# 25 24 0 1 0 0 0 0 0 0 0 0 0 0
% 100% 96.00% 0% 4.00% 0% 0% 0% 0% 0% 0% 0% 0% 0% 0%
# 2 2 0 0 0 0 0 0 0 0 0 0 0 0
% 100% 100% 0% 0% 0% 0% 0% 0% 0% 0% 0% 0% 0% 0%
# 13 13 0 0 0 0 0 0 0 0 0 0 0 0
% 100% 100% 0% 0% 0% 0% 0% 0% 0% 0% 0% 0% 0% 0%
# 1 1 0 0 0 0 0 0 0 0 0 0 0 0
% 100% 100% 0% 0% 0% 0% 0% 0% 0% 0% 0% 0% 0% 0%
# 3 3 0 0 0 0 0 0 0 0 0 0 0 0
% 100% 100% 0% 0% 0% 0% 0% 0% 0% 0% 0% 0% 0% 0%
# 1 1 0 0 0 0 0 0 0 0 0 0 0 0
% 100% 100% 0% 0% 0% 0% 0% 0% 0% 0% 0% 0% 0% 0%
# 2 2 0 0 0 0 0 0 0 0 0 0 0 0
% 100% 100% 0% 0% 0% 0% 0% 0% 0% 0% 0% 0% 0% 0%
# 1 0 0 1 0 0 0 0 0 0 0 0 0 0
% 100% 0% 0% 100% 0% 0% 0% 0% 0% 0% 0% 0% 0% 0%
# 45 42 2 1 0 0 0 0 0 0 0 0 0 0
% 100% 93.33% 4.44% 2.22% 0% 0% 0% 0% 0% 0% 0% 0% 0% 0%
# 3 3 0 0 0 0 0 0 0 0 0 0 0 0
% 100% 100% 0% 0% 0% 0% 0% 0% 0% 0% 0% 0% 0% 0%
# 4 4 0 0 0 0 0 0 0 0 0 0 0 0
% 100% 100% 0% 0% 0% 0% 0% 0% 0% 0% 0% 0% 0% 0%
# 297 278 4 15 1 0 0 0 0 1 0 0 0 0
% 100% 93.60% 1.35% 5.05% 0.34% 0% 0% 0% 0% 0.34% 0% 0% 0% 0%
# 2 2 0 0 0 0 0 0 0 0 0 0 0 0
% 100% 100% 0% 0% 0% 0% 0% 0% 0% 0% 0% 0% 0% 0%
0462 - FORESTRY TECHNICIAN
0404 - BIOLOGICAL SCIENCE TECHNICIAN
0455 - RANGE TECHNICIAN
0457 - SOIL CONSERVATION
0458 - SOIL CONSERVATION TECHNICIAN
0344 - MANAGEMENT & PROGRAM CLERICAL & ASSI
0356 - DATA TRANSCRIBER
0399 - ADMINISTRATION & OFFICE SUPPORT STUDE
0401 - GENERAL BIOLOGICAL SCIENCE
0303 - MISCELLANEOUS CLERK & ASSISTANT
0318 - SECRETARY
0326 - OFFICE AUTOMATION CLERICAL & ASSISTANC
0343 - MANAGEMENT PROGRAM ANALYSIS
0102 - SOCIAL SCIENCE AID & TECHNICIAN
0193 - ARCHEOLOGY
0203 - HUMAN RESOURCES CLERICAL & ASSISTANC
0301 - MISCELLANEOUS ADMINISTRATION & PROGR
SERIES/JOB TITLE
Total by Disability Status Total for Targeted Disabilities
0099 - GENERAL STUDENT TRAINEE
U. S. DEPARTMENT OF AGRICULTURE - NATURAL RESOURCES CONSV SERVCETable B6: Participation Rates for Major Occupations - Distribution by Disability [OPM Form 256 Self-Identification Codes] (Temp)
Year = FY 2009

TOTALWORKFORCE [05] No [01] Not [06-94] Targeted [16,17] [23,25] [28,32-38 [64-68] [71-78] [82] [90] Mental[91] Menta [92]
DisabilityIdentifiedDisabilityDisability Deafness Blindness Missing Partial Total ConvulsiveRetardation Illness Distortion of
Limbs Paralysis Paralysis Disorder Limb/SpineSERIES/JOB TITLE
Total by Disability Status Total for Targeted Disabilities
U. S. DEPARTMENT OF AGRICULTURE - NATURAL RESOURCES CONSV SERVCETable B6: Participation Rates for Major Occupations - Distribution by Disability [OPM Form 256 Self-Identification Codes] (Temp)
Year = FY 2009
# 1 1 0 0 0 0 0 0 0 0 0 0 0 0
% 100% 100% 0% 0% 0% 0% 0% 0% 0% 0% 0% 0% 0% 0%
# 36 34 0 2 0 0 0 0 0 0 0 0 0 0
% 100% 94.44% 0% 5.56% 0% 0% 0% 0% 0% 0% 0% 0% 0% 0%
# 1 1 0 0 0 0 0 0 0 0 0 0 0 0
% 100% 100% 0% 0% 0% 0% 0% 0% 0% 0% 0% 0% 0% 0%
# 25 25 0 0 0 0 0 0 0 0 0 0 0 0
% 100% 100% 0% 0% 0% 0% 0% 0% 0% 0% 0% 0% 0% 0%
# 1 1 0 0 0 0 0 0 0 0 0 0 0 0
% 100% 100% 0% 0% 0% 0% 0% 0% 0% 0% 0% 0% 0% 0%
# 2 2 0 0 0 0 0 0 0 0 0 0 0 0
% 100% 100% 0% 0% 0% 0% 0% 0% 0% 0% 0% 0% 0% 0%
# 1 1 0 0 0 0 0 0 0 0 0 0 0 0
% 100% 100% 0% 0% 0% 0% 0% 0% 0% 0% 0% 0% 0% 0%
# 1 1 0 0 0 0 0 0 0 0 0 0 0 0
% 100% 100% 0% 0% 0% 0% 0% 0% 0% 0% 0% 0% 0% 0%
# 2 2 0 0 0 0 0 0 0 0 0 0 0 0
% 100% 100% 0% 0% 0% 0% 0% 0% 0% 0% 0% 0% 0% 0%
# 1 1 0 0 0 0 0 0 0 0 0 0 0 0
% 100% 100% 0% 0% 0% 0% 0% 0% 0% 0% 0% 0% 0% 0%
# 1 0 0 1 0 0 0 0 0 0 0 0 0 0
% 100% 0% 0% 100% 0% 0% 0% 0% 0% 0% 0% 0% 0% 0%
# 1 1 0 0 0 0 0 0 0 0 0 0 0 0
% 100% 100% 0% 0% 0% 0% 0% 0% 0% 0% 0% 0% 0% 0%
# 2 2 0 0 0 0 0 0 0 0 0 0 0 0
% 100% 100% 0% 0% 0% 0% 0% 0% 0% 0% 0% 0% 0% 0%
# 2 2 0 0 0 0 0 0 0 0 0 0 0 0
% 100% 100% 0% 0% 0% 0% 0% 0% 0% 0% 0% 0% 0% 0%
# 3 3 0 0 0 0 0 0 0 0 0 0 0 0
% 100% 100% 0% 0% 0% 0% 0% 0% 0% 0% 0% 0% 0% 0%
# 5 5 0 0 0 0 0 0 0 0 0 0 0 0
% 100% 100% 0% 0% 0% 0% 0% 0% 0% 0% 0% 0% 0% 0%
# 11 10 0 1 0 0 0 0 0 0 0 0 0 0
% 100% 90.91% 0% 9.09% 0% 0% 0% 0% 0% 0% 0% 0% 0% 0%
# 1 1 0 0 0 0 0 0 0 0 0 0 0 0
% 100% 100% 0% 0% 0% 0% 0% 0% 0% 0% 0% 0% 0% 0%
# 1 0 0 1 1 0 0 0 1 0 0 0 0 0
% 100% 0% 0% 100% 100% 0% 0% 0% 100% 0% 0% 0% 0% 0%
1316 - HYDROLOGIC TECHNICIAN
1371 - CARTOGRAPHIC TECHNICIAN
1399 - PHYSICAL SCIENCE STUDENT TRAINEE
2005 - SUPPLY CLERICAL & TECHNICIAN
1035 - PUBLIC AFFAIRS
1087 - EDITORIAL ASSISTANCE
1101 - GENERAL BUSINESS & INDUSTRY
1311 - PHYSICAL SCIENCE TECHNICIAN
0890 - AGRICULTURAL ENGINEERING
0899 - ENGINEERING & ARCHITECTURE STUDENT TR
0999 - LEGAL OCCUPATIONS STUDENT TRAINEE
1001 - GENERAL ARTS & INFORMATION
0802 - ENGINEERING TECHNICIAN
0807 - LANDSCAPE ARCHITECTURE
0810 - CIVIL ENGINEERING
0817 - SURVEYING TECHNICIAN
0470 - SOIL SCIENCE
0499 - BIOLOGICAL SCIENCE STUDENT TRAINEE
0503 - FINANCIAL CLERICAL & TECHNICIAN

TOTALWORKFORCE [05] No [01] Not [06-94] Targeted [16,17] [23,25] [28,32-38 [64-68] [71-78] [82] [90] Mental[91] Menta [92]
DisabilityIdentifiedDisabilityDisabilityDeafness Blindness Missing Partial Total ConvulsiveRetardation Illness Distortion of
Limbs Paralysis Paralysis Disorder Limb/Spine
#
%
#
%
#
%
#
%
U. S. DEPARTMENT OF AGRICULTURE - NATURAL RESOURCES CONSV SERVCETable B7: Applications and Hires - Distribution by Disability (Perm)
Year = FY 2009
Total by Disability Status Total for Targeted Disabilities
Schedule A
Hires
Applications
HiresVoluntarily Identified (Outside of Schedule A Applicants)
Applications
TOTALWORKFORCE [05] No [01] Not [06-94] Targeted [16,17] [23,25] [28,32-38 [64-68] [71-78] [82] [90] Mental[91] Menta [92]
DisabilityIdentifiedDisabilityDisabilityDeafness Blindness Missing Partial Total ConvulsiveRetardation Illness Distortion of
Limbs Paralysis Paralysis Disorder Limb/Spine
#
%
#
%
#
%
#
%
U. S. DEPARTMENT OF AGRICULTURE - NATURAL RESOURCES CONSV SERVCETable B7: Applications and Hires - Distribution by Disability (Temp)
Year = FY 2009
Total by Disability Status Total for Targeted Disabilities
Schedule A
Hires
Applications
HiresVoluntarily Identified (Outside of Schedule A Applicants)
Applications

TOTALWORKFORCE
[05] No [01] Not [06-94] Targeted [16,17] [23,25] [28,32-38 [64-68] [71-78] [82] [90] Mental[91] Menta [92]
DisabilityIdentifiedDisabilityDisabilityDeafness Blindness Missing Partial Total ConvulsiveRetardation Illness Distortion of
Limbs Paralysis Paralysis Disorder Limb/Spine# 562 523 5 34 0 0 0 0 0 0 0 0 0 0% 100% 93.06% 0.89% 6.05% 0% 0% 0% 0% 0% 0% 0% 0% 0% 0%
# 389 358 10 21 0 0 0 0 0 0 0 0 0 0% 100% 92.03% 2.57% 5.40% 0% 0% 0% 0% 0% 0% 0% 0% 0% 0%
# 47 40 0 7 0 0 0 0 0 0 0 0 0 0% 100% 85.11% 0% 14.89% 0% 0% 0% 0% 0% 0% 0% 0% 0% 0%
# 998 921 15 62 0 0 0 0 0 0 0 0 0 0% 100% 92.28% 1.50% 6.21% 0% 0% 0% 0% 0% 0% 0% 0% 0% 0%
# 699 654 6 39 4 0 2 0 1 1 0 0 0 0
% 100% 93.56% 0.86% 5.58% 0.57% 0% 0.29% 0% 0.14% 0.14% 0% 0% 0% 0%
U. S. DEPARTMENT OF AGRICULTURE - NATURAL RESOURCES CONSV SERVCETable B8: New Hires By Type of Appointment - Distribution by Disability [OPM Form 256 Self-Identification Codes]
Year = FY 2009
TYPETotal by Disability Status Total for Targeted DisabilitiesOF
APPOINTMENT
PERMANENT
TEMPORARY
NON-APPROPRIATED
TOTAL
PRIOR YEAR

TOTALWORKFORCE [05] No [01] Not [06-94] Targeted [16,17] [23,25] [28,32-38] [64-68] [71-78] [82] [90] Mental[91] Menta [92]
DisabilityIdentifiedDisabilityDisability Deafness Blindness Missing Partial Total Convulsive Retardation Illness Distortion of
Limbs Paralysis Paralysis Disorder Limb/Spine
Total Applications #
Received %
#
%
#
%
Relevant Applicant Pool #
Total Applications #
Received %
#
%
#
%
Relevant Applicant Pool #
Total Applications #
Received %
#
%
#
%
Relevant Applicant Pool #
Total Applications #
Received %
#
%
#
%
Relevant Applicant Pool #
U. S. DEPARTMENT OF AGRICULTURE - NATURAL RESOURCES CONSV SERVCETable B9: Selections for Internal Competitive Promotions for Major Occupations - Distribution by Disability
Year = FY 2009
Total by Disability Status Total for Targeted Disabilities
Job Series:
Qualified
Selected
Job Series:
Qualified
Selected
Job Series:
Qualified
Selected
Job Series:
Qualified
Selected
"Relevant Applicant Pool" = all employees in the next lower pay grade and in all series that qualify them for the position announced.

TOTALWORKFORCE [05] No [01] Not [06-94] Targeted [16,17] [23,25] [28,32-38 [64-68] [71-78] [82] [90] Mental[91] Menta [92]
DisabilityIdentifiedDisabilityDisabilityDeafness Blindness Missing Partial Total ConvulsiveRetardation Illness Distortion of
Limbs Paralysis Paralysis Disorder Limb/SpineTotal Employees
Eligible for CareerLadder Promotions % 100% 92.41% 0.77% 6.82% 1.29% 0.26% 0% 0.13% 0.26% 0.13% 0.13% 0.13% 0.26% 0%
# 118 108 1 9 2 0 0 0 0 0 0 0 2 0% 100% 91.53% 0.85% 7.63% 1.69% 0% 0% 0% 0% 0% 0% 0% 1.69% 0%
# 63 58 2 3 2 1 0 0 0 1 0 0 0 0% 100% 92.06% 3.17% 4.76% 3.17% 1.59% 0% 0% 0% 1.59% 0% 0% 0% 0%
# 241 221 1 19 4 1 0 0 2 0 0 1 0 0% 100% 91.70% 0.41% 7.88% 1.66% 0.41% 0% 0% 0.83% 0% 0% 0.41% 0% 0%
U. S. DEPARTMENT OF AGRICULTURE - NATURAL RESOURCES CONSV SERVCETable B10: Non-Competitive Promotions - Time in Grade - Distribution by Disability
Year = FY 2009
Total by Disability Status Total for Targeted Disabilities
# 777 718 6 53 10 2 0 1 2 1 1 1 2 0
1 - 12 months
13 - 24 months
25+ months

TOTALWORKFORCE [05] No [01] Not [06-94] Targeted [16,17] [23,25] [28,32-38] [64-68] [71-78] [82] [90] Mental[91] Menta [92]
DisabilityIdentifiedDisabilityDisability Deafness Blindness Missing Partial Total Convulsive Retardation Illness Distortion of
Limbs Paralysis Paralysis Disorder Limb/Spine
Relevant Applicant Pool #
Total Applications #
Received %
#
%
#
%
Relevant Applicant Pool #
Total Applications #
Received %
#
%
#
%
Relevant Applicant Pool #
Total Applications #
Received %
#
%
#
%
Relevant Applicant Pool #
Total Applications #
Received %
#
%
#
%
U. S. DEPARTMENT OF AGRICULTURE - NATURAL RESOURCES CONSV SERVCETable B11: Internal Selections for Senior Level Positions (GS 13/14, GS 15, and SES) - Distribution by Disability
Year = FY 2009
Total by Disability Status Total for Targeted Disabilities
Job Series/Grade(s) of Vacancy:
Qualified
Selected
Job Series/Grade(s) of Vacancy:
Qualified
Selected
Job Series/Grade(s) of Vacancy:
Qualified
Selected
Job Series/Grade(s) of Vacancy:
Qualified
Selected
"Relevant Applicant Pool" = all employees in the next lower pay grade and in all series that qualify them for the position announced.
TOTALWORKFORCE [05] No [01] Not [06-94] Targeted [16,17] [23,25] [28,32-38] [64-68] [71-78] [82] [90] Mental[91] Menta [92]
DisabilityIdentifiedDisabilityDisability Deafness Blindness Missing Partial Total Convulsive Retardation Illness Distortion of
Limbs Paralysis Paralysis Disorder Limb/Spine
Slots #
#
%
#
%
Slots #
%
#
%
Slots #
#
%
#
%
U. S. DEPARTMENT OF AGRICULTURE - NATURAL RESOURCES CONSV SERVCETable B12: Participation in Career Development - Distribution by Disability
Year = FY 2009
Total by Disability Status Total for Targeted Disabilities
Career Development Programs for GS 5-12:
Relevant Pool
Applied
Participants
Career Development Programs for GS 13 - 14:
Relevant Pool
Applied
Applied
Participants
"Relevant Applicant Pool" = all employees in the next lower pay grade and in all series that qualify them for the position announced.
Participants
Career Development Programs for GS 15 and SES:
Relevant Pool

[05] No [01] Not [06-94] Targeted [16,17] [23,25] [28,32-38] [64-68] [71-78] [82] [90] Mental[91] Menta [92]
Disability Identified Disability Disability Deafness Blindness Missing Partial Total Convulsive Retardation Illness Distortion of
Limbs Paralysis Paralysis Disorder Limb/Spine
Total Time-Off # 454 415 7 32 5 0 0 1 1 1 0 0 2 0
Awards Given % 100% 91.41% 1.54% 7.05% 1.10% 0% 0% 0.22% 0.22% 0.22% 0% 0% 0.44% 0%
3,206 2,946 52 208 30 0 0 8 4 2 0 0 16 0
7 7 7 7 6 0 0 8 4 2 0 0 8 0
Total Time-Off # 160 152 1 7 3 0 0 1 1 0 1 0 0 0
Awards Given % 100% 95.00% 0.63% 4.38% 1.88% 0% 0% 0.63% 0.63% 0% 0.63% 0% 0% 0%
3,374 3,162 16 196 75 0 0 40 19 0 16 0 0 0
21 21 16 28 25 0 0 40 19 0 16 0 0 0
Total Cash Awards # 2,194 2,002 33 159 15 6 2 0 3 0 1 1 2 0
Given % 100% 91.25% 1.50% 7.25% 0.68% 0.27% 0.09% 0% 0.14% 0% 0.05% 0.05% 0.09% 0%
802,950 733,180 13,402 56,368 5,250 2,335 306 0 1,377 0 250 100 882 0
366 366 406 355 350 389 153 0 459 0 250 100 441 0
Total Cash Awards # 5,396 4,962 82 352 28 3 5 0 3 1 4 0 12 0
Given % 100% 91.96% 1.52% 6.52% 0.52% 0.06% 0.09% 0% 0.06% 0.02% 0.07% 0% 0.22% 0%
6,259,950 5,754,030 99,591 406,329 30,809 4,647 6,265 0 4,942 700 2,994 0 11,261 0
1,160 1,160 1,215 1,154 1,100 1,549 1,253 0 1,647 700 749 0 938 0
# 304 284 3 17 0 0 0 0 0 0 0 0 0 0% 100% 93.42% 0.99% 5.59% 0% 0% 0% 0% 0% 0% 0% 0% 0% 0%
559,208 520,812 6,390 32,006 0 0 0 0 0 0 0 0 0 0
1,840 1,834 2,130 1,883 0 0 0 0 0 0 0 0 0 0
U. S. DEPARTMENT OF AGRICULTURE - NATURAL RESOURCES CONSV SERVCETable B13: Employee Recognition and Awards - Distribution by Disability
Year = FY 2009
RECOGNITION OR AWARD TOTAL
Total by Disability Status Total for Targeted Disabilities
TIME-OFF AWARDS - 1-9 HOURS
Total Hours
Average Hours
TIME-OFF AWARDS - 9+ HOURS
Total Hours
Average Hours
CASH AWARDS - $100 - $500
Total Amount
Average Amount
CASH AWARDS - $500+
Total Amount
Average Amount
QUALITY STEP INCREASES (QSI)
Total QSI's
Total Benefit
Average Benefit

[05] No [01] Not [06-94] Targeted [16,17] [23,25] [28,32-38] [64-68] [71-78] [82] [90] Mental[91] Menta [92]
DisabilityIdentifiedDisabilityDisability Deafness Blindness Missing Partial Total Convulsive Retardation Illness Distortion of
Limbs Paralysis Paralysis Disorder Limb/Spine# 552 487 10 55 5 0 1 0 3 0 0 0 1 0% 100% 88.22% 1.81% 9.96% 0.91% 0% 0.18% 0% 0.54% 0% 0% 0% 0.18% 0%
# 46 41 0 5 1 1 0 0 0 0 0 0 0 0% 100% 89.13% 0% 10.87% 2.17% 2.17% 0% 0% 0% 0% 0% 0% 0% 0%
# 598 528 10 60 6 1 1 0 3 0 0 0 1 0% 100% 88.29% 1.67% 10.03% 1.00% 0.17% 0.17% 0% 0.50% 0% 0% 0% 0.17% 0%
# 11,187 10,293 159 735 100 17 8 8 15 10 13 5 20 4% 100% 92.01% 1.42% 6.57% 0.89% 0.15% 0.07% 0.07% 0.13% 0.09% 0.12% 0.04% 0.18% 0.04%
U. S. DEPARTMENT OF AGRICULTURE - NATURAL RESOURCES CONSV SERVCETable B14: Separations by Type of Separation - Distribution by Disability [OPM Form 256 Self-Identification Codes]
Year = FY 2009
TYPE
TOTAL
Total by Disability Status Total for Targeted DisabilitiesOFSEPARATION
TOTAL SEPARATIONS
TOTAL WORKFORCE
VOLUNTARY
INVOLUNTARY