Natural hydrogen continuous emission from sedimentary ...
12
HAL Id: hal-02187461 https://hal-univ-pau.archives-ouvertes.fr/hal-02187461 Submitted on 17 Jul 2019 HAL is a multi-disciplinary open access archive for the deposit and dissemination of sci- entific research documents, whether they are pub- lished or not. The documents may come from teaching and research institutions in France or abroad, or from public or private research centers. L’archive ouverte pluridisciplinaire HAL, est destinée au dépôt et à la diffusion de documents scientifiques de niveau recherche, publiés ou non, émanant des établissements d’enseignement et de recherche français ou étrangers, des laboratoires publics ou privés. Natural hydrogen continuous emission from sedimentary basins: The example of a Brazilian H2-emitting structure Alain Prinzhofer, Isabelle Moretti, Joao Francolin, Cleuton Pacheco, Angélique d’Agostino, Julien Werly, Fabian Rupin To cite this version: Alain Prinzhofer, Isabelle Moretti, Joao Francolin, Cleuton Pacheco, Angélique d’Agostino, et al.. Natural hydrogen continuous emission from sedimentary basins: The example of a Brazilian H2- emitting structure. International Journal of Hydrogen Energy, Elsevier, 2019, 44 (12), pp.5676-5685. 10.1016/j.ijhydene.2019.01.119. hal-02187461
Transcript of Natural hydrogen continuous emission from sedimentary ...

HAL Id: hal-02187461https://hal-univ-pau.archives-ouvertes.fr/hal-02187461
Submitted on 17 Jul 2019
HAL is a multi-disciplinary open accessarchive for the deposit and dissemination of sci-entific research documents, whether they are pub-lished or not. The documents may come fromteaching and research institutions in France orabroad, or from public or private research centers.
L’archive ouverte pluridisciplinaire HAL, estdestinée au dépôt et à la diffusion de documentsscientifiques de niveau recherche, publiés ou non,émanant des établissements d’enseignement et derecherche français ou étrangers, des laboratoirespublics ou privés.
Natural hydrogen continuous emission from sedimentarybasins: The example of a Brazilian H2-emitting
structureAlain Prinzhofer, Isabelle Moretti, Joao Francolin, Cleuton Pacheco,
Angélique d’Agostino, Julien Werly, Fabian Rupin
To cite this version:Alain Prinzhofer, Isabelle Moretti, Joao Francolin, Cleuton Pacheco, Angélique d’Agostino, et al..Natural hydrogen continuous emission from sedimentary basins: The example of a Brazilian H2-emitting structure. International Journal of Hydrogen Energy, Elsevier, 2019, 44 (12), pp.5676-5685.�10.1016/j.ijhydene.2019.01.119�. �hal-02187461�
HAL Id: hal-02187461https://hal-univ-pau.archives-ouvertes.fr/hal-02187461
Submitted on 17 Jul 2019
HAL is a multi-disciplinary open accessarchive for the deposit and dissemination of sci-entific research documents, whether they are pub-lished or not. The documents may come fromteaching and research institutions in France orabroad, or from public or private research centers.
L’archive ouverte pluridisciplinaire HAL, estdestinée au dépôt et à la diffusion de documentsscientifiques de niveau recherche, publiés ou non,émanant des établissements d’enseignement et derecherche français ou étrangers, des laboratoirespublics ou privés.
Natural hydrogen continuous emission from sedimentarybasins: The example of a Brazilian H2-emitting
structureAlain Prinzhofer, Isabelle Moretti, Joao Francolin, Cleuton Pacheco, Ang
Elique Dapos;agostino, Julien Werly, Fabian Rupin, Angélique d’Agostino
To cite this version:Alain Prinzhofer, Isabelle Moretti, Joao Francolin, Cleuton Pacheco, Ang Elique D
apos;agostino, et al.. Natural hydrogen continuous emission from sedimentary basins: The example ofa Brazilian H2-emitting structure. International Journal of Hydrogen Energy, Elsevier, 2019, 44 (12),pp.5676-5685. �10.1016/j.ijhydene.2019.01.119�. �hal-02187461�

i n t e r n a t i o n a l j o u r n a l o f h y d r o g en en e r g y x x x ( x x x x ) x x x
Natural hydrogen continuous emission fromsedimentary basins: The example of aBrazilian H2-emitting structure
Alain Prinzhofer a,*, Isabelle Moretti b, Joao Francolin c, Cleuton Pacheco d,Ang�elique D'Agostino e, Julien Werly e, Fabian Rupin e
a Geo4U, Rio de Janeiro, RJ, Brazilb Engie SA, Paris, Francec GEORISK, Rio de Janeiro, RJ, Brazild Engie Brazil, Tubar~ao, SC, Brazile Engie Crigen SA, Courbevoie, France
a r t i c l e i n f o
Article history:
Received 18 October 2018
Received in revised form
31 December 2018
Accepted 10 January 2019
Available online xxx
Keywords:
Natural hydrogen
Soil micro-seeps
Hydrogen geochemical soil moni-
toring
S~ao Francisco basin
* Corresponding author.E-mail address: [email protected]
Please cite this article as: Prinzhofer A etBrazilian H2-emitting structure, Internation
a b s t r a c t
Hydrogen escaping from sedimentary basins has already been described in various parts
of the world. Some of these leakages have been identified by superficial circular de-
pressions, also called “fairy circles”. Gas detection measurements, randomly repeated
after a few months have shown that the amount of hydrogen present in soils is not
constant neither versus time nor versus position in a given structure. Permanent
monitoring gas analyzers were installed in the ground to estimate hydrogen flow out-
gassing from a topographical circular depression located in Brazil. Data show that a
hydrogen flux occurs during the hottest moment of the day, as shown with permanent
sensors set at a regular spacing. The process may look like a soil evaporation. In that
same structure, other detectors show much higher and irregular gas output which pre-
sent an unclear correlation as a function of ambient temperature and atmospheric
pressure. The relationship with temperature suggests a role of water saturation driving
the overall hydrogen fluxes. The reported geochemical data imply that (1) one mea-
surement taken at a given hour on a structure cannot be considered as quantitative, as it
varies too much with time and is also probably related to the soil perturbation induced by
the shallow drilling, (2) hydrogen released through the soils of the studied structure is
recharged daily, (3) hydrogen flux is high enough to reach the surface without being
buffered by water or bacterial activity within the soil and (4) soil cannot be solely
considered as a hydrogen sink but also, at least in some areas, as a hydrogen emitter.
This appears to highlight that the subsurface may be considered in this site as a source of
natural hydrogen, clearly differentiated from a biochemical system of atmospheric H2
consumed by bacteria.
om.br (A. Prinzhofer).
al., Natural hydrogen coal Journal of Hydrogen En
ntinuous emission from sedimentary basins: The example of aergy, https://doi.org/10.1016/j.ijhydene.2019.01.119
i n t e r n a t i o n a l j o u r n a l o f h y d r o g e n en e r g y x x x ( x x x x ) x x x2
Introduction
Hydrogen gas (H2) has long been recognized as an energy
vector. However, due to the abundance of oil and natural gas
(i.e. methane) discoveries in the 20th century, this has sub-
stantially reduced hydrogen as an energy vector, especially for
transports, although hydrogen engines were developed as
early as the 19th century.
Recent awareness to reduce the world's carbon de-
pendency has boosted the need for novel energy solutions,
such as promoting hydrogen, partly because of its sole by-
product of combustion, water. Indeed, hydrogen gas can be
oxidized without releasing any CO2 and transformed into
electricity through fuel cells, and stored in large quantity as
any gaseous component. Hydrogen which takes a large role in
the industry as chemical raw material, thus becomes a key
element in the energy mix, as an energy carrier and as fuel for
transport.
Today, hydrogen is manufactured for a larger part (greater
than 90%) from hydrocarbons (mainly methane) by steam
reforming and from water hydrolysis for most of the rest. The
former process is rather cost efficient, by an approximate
production cost of about 2$/kg [12]. Hydrolysis remains about
4 times more expensive, even if renewable electricity sources
result in a low or even negative price of electricity at some
hours of the day. Numerous companies, ENGIE for one and
others that strive on governmental favorable Energy policies
are elaborating original processes to decrease or even inverse
the tendency and pave the way to produce “green hydrogen”.
Technical incentives try to increase hydrogen's use in the
energy mix and by that alleviate the present carbon footprint
(see for instance the special issue “Pour la Science” of March
2018, [25]. Academic research has also been active to find
other sources of hydrogen, from Syngas based on the catalysis
of waste or using hydrogen producing bacteria or microalgae
[32].
In order to obtain cost-effective H2 without using methane
as the initial product, a different approach can be envisaged.
Geologists have recently investigated natural hydrogen sour-
ces and whether they could be naturally produced [36]. Un-
expectedly, the occurrence of hydrogen in continental shallow
wells has been noted, as in Mali while drilling for water [37], in
oil an gas exploration in Kansas, USA [13] or in basement rocks
mines [30,44]. Monitoring of H2-enriched natural gases leaking
from mines long existed in the Kola Peninsula in Russia to
prevent accidents from happening, as such gas mixture is
easily combustible and explosive [29,30]. Published studies
have reported a non-permanent H2 concentration, interpreted
in terms of free gas escaping associated to permeability
changes in relation to pressure variations (mining activity,
earthquake and possibly earth tide).
Hydrogen seepages have been described in themid oceanic
ridge [5,22,51] and in onshore ophiolitic contexts [1,2,10,28].
Hydrogen has also been detected in sedimentary basins, in
Russia [18] in the USA [52] and recently in Brazil [26]. Several
articles are available on hydrogen monitoring in the soils in
the vicinity of important geological fault zones, as evidenced
in Japan [42,45], in Russia [11,30] and near the San Andreas
Fault in California [43], to assess earthquake precursors. The
Please cite this article as: Prinzhofer A et al., Natural hydrogen coBrazilian H2-emitting structure, International Journal of Hydrogen En
monitoring of free gas and more generally fluid migrations in
those setting have been extensively evaluated.
Researchers demonstrated that the stress changes before,
during and after the ruptures, due to changes in themigration
pathway of the fluids (see for instance Ref. [6] for the fluid
changes and [9] for the pressure and overpressure changes in
active fault zone). The authors working in seismically active
areas evaluated the variability of the flow. They noticed H2
and fluid flow changes in relation with faults activity.
Gas seepage in continental areas has been observed in
circular topographical depressions, of sometimes elongated
shapes, in which hydrogen gas concentration can be detected
and quantified. The following paper presents a geochemical
monitoring of hydrogen in a topographical depression over
few months. The area is located in the Brazilian craton in an
area that is not seismically active. The geography, geology and
topography will be investigated and discussed, followed by
hydrogen flux estimations based on analytical data and
modeling. The disruption resulting from repeated, continuous
soil measurements will be discussed in a framework of un-
derstanding deep hydrogen generation and respective upward
migration in shallow soils.
Hydrogen seepage
The study of onshore hydrogen seeps and hydrocarbon seeps
is performed in a similar mode and with a same philosophy
that is to evidence a deeper hydrogen system dynamically
linked to H2 generation, migration, and possible accumulation
and loss into the atmosphere. As a reminder, from compara-
ble settings like a petroleum system, the overburden caprocks
are not fully impermeable and often let hydrocarbons leak
upward through sediments to the surface. The existence of
seeps allows explorationist nonetheless to assume that
mature source rock is or has been present. Despite this, hy-
drocarbon seeps are commonly located along faulted struc-
tures, whose damaged zones are easily understood as
preferential migration pathways [24]. Liquid bitumen accu-
mulating in tar ponds or in impregnate fault zones have been
known for centuries. Their occurrences were taken as
geochemical indicators for oil and gas exploration in the
Middle East and in South America. Very sensitive apparatus
today allows the detection of diffuse traces of volatile com-
pounds in soils or sea bottoms [35]. Surface geochemistry has
adequately shown its potential prior to oil and gas exploration
and benefits from much lower cost/investments in unex-
plored frontier areas. The efficiency of surface geochemistry
for hydrogen exploration is therefore investigated in this
study, for a new and not well-known natural source of energy.
A conventional hydrocarbon system includes source rocks,
permeable carrier bedrocks, structural trap/reservoir units
and the presence of impermeable caprocks. Furthermore, to
create petroleum accumulations, those different geological
steps should synchronize with a right geological timing. Many
rocks, including salts and shale for instance, are considered as
efficient seals enabling hydrocarbon to accumulate in reser-
voirs for millions of years.
Presently, the concept of a H2 system being neither fully
defined nor fully understood, the likelihood to trap H2 in the
ntinuous emission from sedimentary basins: The example of aergy, https://doi.org/10.1016/j.ijhydene.2019.01.119

i n t e r n a t i o n a l j o u r n a l o f h y d r o g en en e r g y x x x ( x x x x ) x x x 3
subsurface for long periods of time is not yet proven. The
presence of low permeable rock beds, such as evaporites
(halite for example) may capture H2 volumes in the subsur-
face. However, from the high diffusivity of hydrogen gas and
its high chemical reactivity makes its preservation in rocks
quite problematic in a geological time frame.
Concerning possible hydrogen sources, three main pro-
cesses are envisioned (1) degassing from an original material
[16] (2) water source rock interactions (i.e. REDOX chemical
processes [23], or water destruction through radiolysis e [19] -
or crystal cracking e [42] and (3) bacterial origin [31,32].
Migration, carrier beds and reservoirs include most rocks
containing a minimum of porosity and permeability. Due to
solubility increase of H2 in water with pressure and temper-
ature, another carrier phase can be evoked: water [20].
Although caprocks and seal efficiency have been debated, the
mere occurrence of underground H2 storages in subsurface
rock formations underlines a possible natural existence [33].
The only known areas of H2 production seem to be active
processes, indicating that the associated impermeable seals
only act as reducers of migration drive, allowing a gas steady-
state type accumulation; as proof, the flow of hydrogen ef-
fluents out of middle oceanic ridges and those found in Oman
“blue-pools” [49]. In another case, such as the continental Mali
zone (Africa), H2 production has been active for the past 4
years, and the wellhead pressure is not indicating any sub-
stantial decrease with time, suggesting a continuous influx to
the reservoir [37].
Known active H2 systems and continuous H2 seepage at the
Earth's surface are characterized by the occurrence of bright,
large scale “fairy circles”. Several circular depressions have
been described in Russia [17,18,46], in Mali [37] and in the
United States [52]. In all these geographical locations, evi-
dence of H2 in considerable concentrations in soils, from
shallow drillings, were interpreted as H2 seeps concentrated
in the circular depressions. Satellite images show that, at the
time scale of a couple of years, such topographical de-
pressions may appear or disappear [18].
Reported studies have shown that the Fe2þ oxidation state
of iron is a good candidate to generate hydrogen bywater/rock
interaction [23]. Cratons are also good candidates because
they contain unoxidized minerals. As a matter of fact, it has
been observed so far that all the known H2 rich topographical
depressions are located above or close to Proterozoic or older
basements.
A circular depression located in Brazil was selected for an
in-depth soil monitoring case study to investigate continuous
hydrogen seeping versus space and time. Commercial tools to
continuouslymonitor H2 fluxeswere not available at the onset
of the Brazilian survey. The ENGIE R&D laboratory facility
Crigen has developed an innovative detector to measure H2
concentrations in air, and in the soil porosity. Each sensor was
calibrated in the laboratory with a reference standard gas
containing 1000 ppm of H2. The sensors are automatized and
perform a measurement at a given frequency. Different pa-
rameters are sent real time to a database via a Gateway, that
stacks data and transmits them via satellites. The hydrogen
sensors are designed to work outdoors and endure varying
temperatures and weather conditions and function in very
Please cite this article as: Prinzhofer A et al., Natural hydrogen coBrazilian H2-emitting structure, International Journal of Hydrogen En
remote areas. The sensors are connected to high performance
batteries.
The Brazilian case study
The selection of a large circular structure located in the S~ao
Francisco Basin was made after a careful review of various
basins in Brazil. The S~ao Francisco basin is a Proterozoic aged
structure, whose more recent sedimentary section (neo-Pro-
terozoic Bambui Formation) has been extensively studied for
hydrocarbon exploration (review in Ref. [39]). However, the
deeper parts of the basin (older than Ediacaran, 635 million
years) is poorly known, as only a few known drillings have
been performed at these depths (over 1000m). Seismic profiles
allow to propose an interpretation based on the extensions of
geological formations outcropping eastward and westward at
the borders of the basin within two thrust belts [38,39]. The
geological formations have low porosity and have been
explored for both conventional and unconventional re-
sources. Some exploration wells in the area are listed as
having encountered natural hydrogen while drillings but due
to the lack of success to find hydrocarbons, these wells were
abandoned.
The site is located in a dry and hot climate zone. Average
temperatures go from 15 �C to a maximum of 35 �C in after-
noons. Daily sun light time is 12 h.
The studied structure presents an area of about 600 m by
500 m. Initial H2 concentrations detected by a GA5000© (from
Geotech Comp.) portable analyzer outside of the structure'sperimeter, and geochemical results presented consistent low
concentrations (<10 ppm). Seven ENGIE Lab Crigen hydrogen
analyzers were placed in the structure for several months
during 2018. Detectors recorded hydrogen concentrations
simultaneously in soils every hour. Soil measurements are
made at shallow depths (less than 1 m). Hydrogen sensors are
initially calibrated with reference gases in laboratory, to pro-
vide accurate concentrations up to 2000 ppm. The gas is
pumped through a 1 cm2 diameter probe, containing micro-
apertures in the lower section. The pumping rate is similar
to the GA5000© analyzer, enabling comparative sample runs.
During the on-going monitoring of gas content in the struc-
ture, it is important to note that H2 concentrations are
generally constant during the analyses time cycles (2min) and
have been shown to oscillate 10e20% range in average. This
point is analytically relevant, as it shifts from past H2 con-
centrations measured in soils studied by spot analyses [18,52].
This underlines the importance of a continuous monitoring
approach for investigating soils saturated, or not, with gases.
Observations from previous case studies showed that local H2
concentrations usually increased after positioning a probe in
1-m depth soils, up to a maximum given value, followed by a
gradual decrease to zero value in a short time (few minutes).
The position of hydrogen sensors and reception antenna is
shownon Fig. 1. The aerial photo shows very scarce vegetation
within the depression as compared to the overall surrounding
woodlands around the bare studied structure. As can be seen,
two smaller satellite irregular depressions are visible in the
upper part of the photographwhich are not part of this survey.
ntinuous emission from sedimentary basins: The example of aergy, https://doi.org/10.1016/j.ijhydene.2019.01.119

Fig. 1 e Photo of the location of H2 monitoring in a circular depression of the S~ao Francisco Basin (Brazil). H2 sensors
positions, and the data-transmitting antenna are shown.
i n t e r n a t i o n a l j o u r n a l o f h y d r o g e n en e r g y x x x ( x x x x ) x x x4
Geochemical measurements
Prior to the extensive monitoring period, punctual hydrogen
content was evaluated using a portable gas analyzer (GA5000©
from Geotech Comp.). The analyses were performed in a loose
grid, crisscrossing the depression, in soils sampled at a 1-m
depth using a copper tube inserted in the ground and pump-
ing air through the analyzer for 1-min cycles, as detailed in
published papers from studies done in other continental sites
[18,52]. The spot analyses, at the position of each permanent
sensors using the GA5000© detector, are presented Table 1 and
serve as comparative time-fixed hydrogen gas readings. The
respective data have all been obtained by following the same
analytical protocole, i.e. perforating close to a 1-m deep hole,
Table 1 e H2 concentrations analyzed by GA5000©
portable analyzer.
Sensor N� H2 initial (ppm) GA5000©
0 541
1 412
4 221
6 401
7 451
8 310
9 319
Please cite this article as: Prinzhofer A et al., Natural hydrogen coBrazilian H2-emitting structure, International Journal of Hydrogen En
inserting a probe and while pumping air, measuring hydrogen
concentration levels. The GA5000© analyzer measured
repeatedly low H2 content in the structure center and higher
readings at its border. This explains why initially, permanent
detectors were located around the structure in order to cap-
ture maximum H2 signals.
Following a short monitoring test period to check detectors
reading stability, a permanent gas monitoring was begun in
July 2018. Figs. 2e6 refer dates of this year.
The first comment from data, is that the permanent ana-
lyzers are consistent in gas readings, but however, also
somewhat complex to interpret: six out of seven sensors
present regular, Gaussian-shape-time distributions of emis-
sion with a daily periodicity (Fig. 2 presents a detail of the
monitoring during 7 days), centered at noon (local time). The
intensity of the hydrogen spikes occurs for nearly 5e6
continuous hours. Intensities return to baseline levels during
the night time, except for sensor #4, which presents at the end
of a 24hr period, a smaller and coalescent peak occurring
during night time (yellow line on Fig. 2). It is interesting to note
that a similar periodicity has been already reported in the San
Andreas and Calaveras faults zones in California [43],
although hydrogen concentrations in this work do not
decrease to the zero values at nights. Thismay be due (as seen
for sensor #4) to a memory effect. The generally good agree-
ment of hydrogen trends for 24 h periods in two very different
geological environments (large seismic faults, and aseismic
ntinuous emission from sedimentary basins: The example of aergy, https://doi.org/10.1016/j.ijhydene.2019.01.119

Fig. 2 e Week-long H2 monitoring in soils of the studied structure of sensors #0, 1, 4, 6, 7 and 8. Concentrations are in ppm.
The dashed vertical grey lines indicate midnight. The dashed vertical orange lines indicate midday. Sensors #2, 3 and 5
were not presented in this Figure. (For interpretation of the references to colour in this figure legend, the reader is referred to
the Web version of this article.)
i n t e r n a t i o n a l j o u r n a l o f h y d r o g en en e r g y x x x ( x x x x ) x x x 5
area with a circular depression, without any visible fault)
highlights some general geological process, however not fully
understood so far.
A temperature probe is included in the ENGIE analyzers.
Nonetheless, local meteorological station provided additional
key and relevant parameters that were used (temperature, air
pressure, wind velocities, precipitation, sun radiation). Figs. 3
and 4 plot these external data. Pressure, wind and rain pa-
rameters were not included since they remained relatively
constant during the monitoring period. The reader may have
access to full data from the internet site http://www.inmet.
Fig. 3 e Time variations evaluated during 23 days of monitoring
shown in green) combined with local atmospheric radiation sh
peaks of solar radiation versus time. (For interpretation of the ref
to the Web version of this article.)
Please cite this article as: Prinzhofer A et al., Natural hydrogen coBrazilian H2-emitting structure, International Journal of Hydrogen En
gov.br/sonabra/pg_dspDadosCodigo_sim.php?QTU0Nw ¼ ¼ .
Hydrogen content from soil emissions were generally well
correlated with observed solar radiation (Fig. 3).
Sensor #9 presented strikingly different behavior in
hydrogen gas concentrations versus time throughout the
entire monitoring survey. Sensor #9 showed no straightfor-
ward correlation with atmospheric radiation (nor tempera-
ture) whereas the respective gas concentrationswere variable,
from null initially to values as high as 1150 ppm (Fig. 4).
Amoving average of hydrogen concentrations (on 7 days) is
shown on Fig. 5, to smoothen curves. The hydrogen content,
of the H2 concentrations in sensor #7 (in parts per million,
own in red (in kJ/m2). The yellow bars correspond to the
erences to colour in this figure legend, the reader is referred
ntinuous emission from sedimentary basins: The example of aergy, https://doi.org/10.1016/j.ijhydene.2019.01.119

Fig. 4 e Irregular hydrogen gas concentrations (in blue) in parts per million (ppm) analyzed every hour at sensor #9 as a
function of time (36 days). In red, atmospheric radiation (in kJ/m2) for the same period. Yellow bands correspond to the
peaks of solar radiation versus time. (For interpretation of the references to colour in this figure legend, the reader is referred
to the Web version of this article.)
i n t e r n a t i o n a l j o u r n a l o f h y d r o g e n en e r g y x x x ( x x x x ) x x x6
measured by detector #9 presents a logic of emission which is
associated to different and unknown physical processes. Fig. 5
presents the comparison of the curve of concentrations versus
time for the raw data and for the moving average. The dif-
ference between raw data and calculated moving average is
small for the emissions recorded during the day (example of
the sensor #6). On the contrary, sensor #9 presents very
scattered raw H2 emission peaks.
Discussion
Daily cycle
TheH2 emission from this case study follows temperature and
irradiation curves in almost all permanent sensors. The solar
radiation is known to be responsible for the soil evaporation
[47,50]. This points out that hydrogen emissions likely follow
an evaporation mechanism, even if the relationship between
water evaporation in soils and hydrogen leakage is not clearly
understood. As amatter of fact, one could say that the amount
of daily evaporated soil moisture cannot fully explain the
hydrogen liberation observed, even if one assumes fully
hydrogen saturated water droplets. In this respect, the
amount of hydrogen would be less (Lopez-Lazaro et al., sub-
mitted). Moreover, the water saturation in soils down to the
piezometric level (upper level of the water table) is quite low
due to the dryness of the area, and reflected in the monitoring
months during the dry season, as the soils aremainly sandy. It
could be said that molecular hydrogen adsorption in clay
minerals in soils is decreased in sufficient amount to account
for analyzed hydrogen content [48], although no real quanti-
fication of this process is available to support the idea. The
important point to be made is that from current data,
Please cite this article as: Prinzhofer A et al., Natural hydrogen coBrazilian H2-emitting structure, International Journal of Hydrogen En
hydrogen in soils in the structure is recharged daily, implying
a source of hydrogen generation below the surface gas seeps.
The same observationwasmade in the SanAndreas Fault area
[43]. Because the observation was made from a highly seismic
area, it induced a tentative correlation between earthquakes
and H2 generation/migration. However, the Sao Francisco
Basin is aseismic [4] and therefore, the explanation of [43] for
an equivalent phenomenon is not convincing [30]. showed H2
concentration in the mines of Kola Peninsula in Russia with
different signal wavelengths including a diurnal periodicity;
the harmonic oscillation is not as regular as the onemeasured
in the Brazilian case study, and authors interpreted the former
in terms of the cyclic nature of the mining operations. An-
thropic activities cannot be proposed to explain the data
collected in Brazil and presented in this paper, since there is
no industry or mines in the area. Conversely, data from USA
and Russia and the presence of a diurnal periodicity should be
revised in the light of the new data set.
A different pattern is seen in sensor #9, located in the
southern border of the structure and exhibiting large and
scattered emissions. A possible interpretation is a hydrogen
discharge in concomitance with evaporation that creates a
buffering of the emission through a physical process involving
a different soil composition (affected by water and clay min-
eral content for instance). In that eventuality, the recording of
sensor #9 may correspond to a more direct emission of
hydrogen already in a vapor phase, without any soil buffering.
This would explain the higher concentrations as well as the
larger scattering of the concentrations.
At this point in time, it can be proposed that although
hydrogen is generally thought to be mainly consumed by soils
which act like a sink [8,14,34,40], this case study seems to
demonstrate that soils within the particular circular structure
act like a hydrogen emitter.
ntinuous emission from sedimentary basins: The example of aergy, https://doi.org/10.1016/j.ijhydene.2019.01.119

Fig. 5 e Difference between raw data and calculatedmoving averages (on 5 points) of measured hydrogen concentrations (in
ppm) monitored at sensors #6 (top) and #9 (bottom). The data represent 7 monitoring days between August 10th to August
17th.
i n t e r n a t i o n a l j o u r n a l o f h y d r o g en en e r g y x x x ( x x x x ) x x x 7
Quantity of H2 emitted
Industrial production of the natural H2 will be feasible if the
flow is permanent and large. It is possible to deduce some
daily volume from such measurements. Fig. 6 presents an
accumulated hydrogen amount for each of the detectors. A
volume of hydrogen passing through the devices was calcu-
lated, considering a 400 ml/min pump rate for each detector.
Taking into consideration a reduced pumping time of 2 min
per hour and the fact that almost no variation of the H2 con-
centration is seen is in agreement with the hypothesis made.
Although sensor #9 presents an initial delay in terms of
amount of emitted H2, after some days, it becomes the most
productive part of the studied area. For this sensor, the
cumulated value reaches about 3 L in 40 days. It is also
Please cite this article as: Prinzhofer A et al., Natural hydrogen coBrazilian H2-emitting structure, International Journal of Hydrogen En
apparent from Fig. 6 that rather quickly, all the sensors pre-
sent parallel trends of concentration versus time. Although
different, calculated trends are consistent among all the
sensors.
Considering a drainage area of 1 cm2 for sensor #9, this
induces a resulting large flux if extrapolated to the whole
structure: from a simple calculation, the local flux rate can be
estimated to be around 178,000 m3 of H2 per day. If a larger
cross-section is taken, which influences an area of 25 cm2, the
global flux is respectively reduced to about 7000 m3 of H2 per
day, with the same hypothesis of a homogenous deeper flux.
In literature, soils are always considered as hydrogen sinks
with atmospheric hydrogen concentration around 0.5 ppm,
mainly generated by photoproduction from H2O and CH4 [3],
and is being consumed by microbial life in soils [7,8,14,34,40].
ntinuous emission from sedimentary basins: The example of aergy, https://doi.org/10.1016/j.ijhydene.2019.01.119
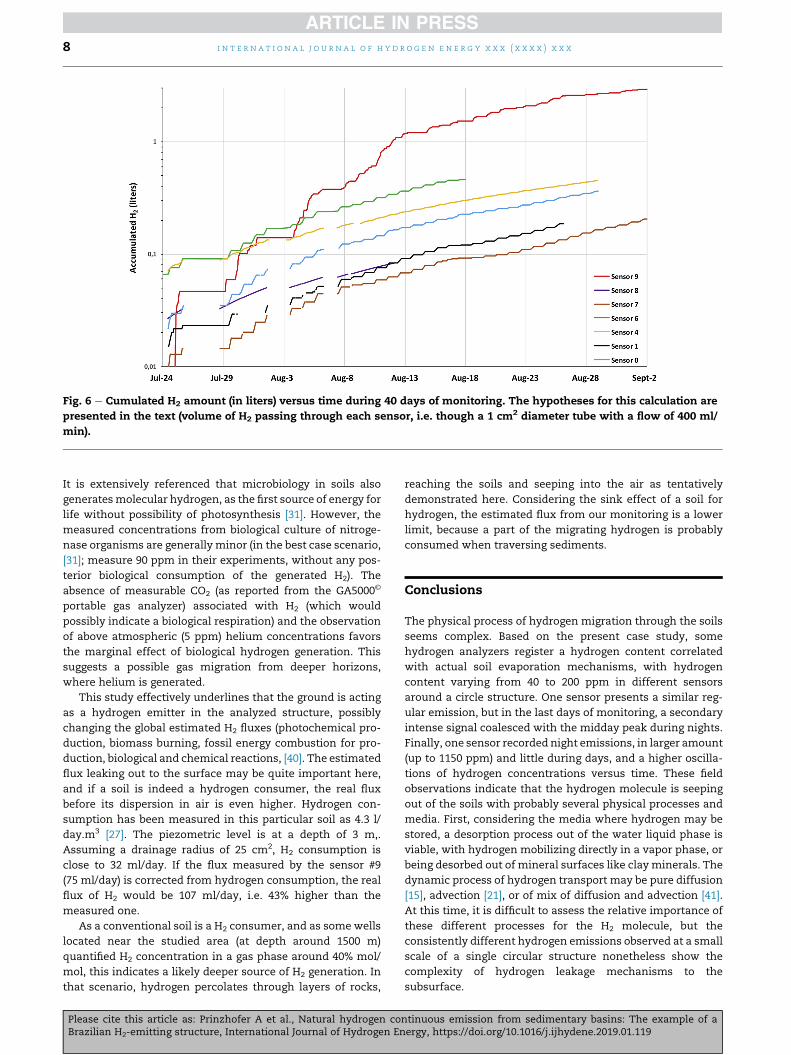
Fig. 6 e Cumulated H2 amount (in liters) versus time during 40 days of monitoring. The hypotheses for this calculation are
presented in the text (volume of H2 passing through each sensor, i.e. though a 1 cm2 diameter tube with a flow of 400 ml/
min).
i n t e r n a t i o n a l j o u r n a l o f h y d r o g e n en e r g y x x x ( x x x x ) x x x8
It is extensively referenced that microbiology in soils also
generatesmolecular hydrogen, as the first source of energy for
life without possibility of photosynthesis [31]. However, the
measured concentrations from biological culture of nitroge-
nase organisms are generally minor (in the best case scenario,
[31]; measure 90 ppm in their experiments, without any pos-
terior biological consumption of the generated H2). The
absence of measurable CO2 (as reported from the GA5000©
portable gas analyzer) associated with H2 (which would
possibly indicate a biological respiration) and the observation
of above atmospheric (5 ppm) helium concentrations favors
the marginal effect of biological hydrogen generation. This
suggests a possible gas migration from deeper horizons,
where helium is generated.
This study effectively underlines that the ground is acting
as a hydrogen emitter in the analyzed structure, possibly
changing the global estimated H2 fluxes (photochemical pro-
duction, biomass burning, fossil energy combustion for pro-
duction, biological and chemical reactions, [40]. The estimated
flux leaking out to the surface may be quite important here,
and if a soil is indeed a hydrogen consumer, the real flux
before its dispersion in air is even higher. Hydrogen con-
sumption has been measured in this particular soil as 4.3 l/
day.m3 [27]. The piezometric level is at a depth of 3 m,.
Assuming a drainage radius of 25 cm2, H2 consumption is
close to 32 ml/day. If the flux measured by the sensor #9
(75 ml/day) is corrected from hydrogen consumption, the real
flux of H2 would be 107 ml/day, i.e. 43% higher than the
measured one.
As a conventional soil is a H2 consumer, and as some wells
located near the studied area (at depth around 1500 m)
quantified H2 concentration in a gas phase around 40% mol/
mol, this indicates a likely deeper source of H2 generation. In
that scenario, hydrogen percolates through layers of rocks,
Please cite this article as: Prinzhofer A et al., Natural hydrogen coBrazilian H2-emitting structure, International Journal of Hydrogen En
reaching the soils and seeping into the air as tentatively
demonstrated here. Considering the sink effect of a soil for
hydrogen, the estimated flux from our monitoring is a lower
limit, because a part of the migrating hydrogen is probably
consumed when traversing sediments.
Conclusions
The physical process of hydrogen migration through the soils
seems complex. Based on the present case study, some
hydrogen analyzers register a hydrogen content correlated
with actual soil evaporation mechanisms, with hydrogen
content varying from 40 to 200 ppm in different sensors
around a circle structure. One sensor presents a similar reg-
ular emission, but in the last days of monitoring, a secondary
intense signal coalesced with the midday peak during nights.
Finally, one sensor recorded night emissions, in larger amount
(up to 1150 ppm) and little during days, and a higher oscilla-
tions of hydrogen concentrations versus time. These field
observations indicate that the hydrogen molecule is seeping
out of the soils with probably several physical processes and
media. First, considering the media where hydrogen may be
stored, a desorption process out of the water liquid phase is
viable, with hydrogen mobilizing directly in a vapor phase, or
being desorbed out of mineral surfaces like clay minerals. The
dynamic process of hydrogen transport may be pure diffusion
[15], advection [21], or of mix of diffusion and advection [41].
At this time, it is difficult to assess the relative importance of
these different processes for the H2 molecule, but the
consistently different hydrogen emissions observed at a small
scale of a single circular structure nonetheless show the
complexity of hydrogen leakage mechanisms to the
subsurface.
ntinuous emission from sedimentary basins: The example of aergy, https://doi.org/10.1016/j.ijhydene.2019.01.119

i n t e r n a t i o n a l j o u r n a l o f h y d r o g en en e r g y x x x ( x x x x ) x x x 9
Acknowledgement
This project is being developed under the Research and
Development Programof ENGIE Brasil Energia, regulated by the
National Electric Energy Agency (ANEEL). We thank especially
Carlos Ghost, Alexandre Zucarato, Emmanuel Delfosse from
Engie Brasil Energia. Diane Defrenne participated actively to its
launch. At Engie lab Crigen, the sensors have been developed
with the help of Louis Gorintin. We thank Fabrice Brunet and
Andrey Miagkiy (Isterre Grenoble) for very interesting discus-
sion and a flavor of the first results on the bacterial activity in
the soil. We are also grateful to Caroline Magnier and Jan
Mertens for a prereview of the paper. Three anonymous
reviewer improved substantially the initial manuscript.
r e f e r e n c e s
[1] Abrajano TA, Sturchio NC, Bohlke JK, Lyon GL, Poreda R,Stevens C. Methane-hydrogen gas seeps, ZambalesOphiolite, Philippines: deep or shallow origin? Chem Geol1988;71(1e3):211e22. https://doi.org/10.1016/0009-2541(88)90116-7.
[2] Abrajano TA, Sturchio NC, Kennedy BM, Lyon GL,Muehlenbachs K, Bohlke JK. Geochemistry of reduced gasrelated to serpentinization of the Zambales ophiolite,Philippines. Appl Geochem 1990;5(5e6):625e30. https://doi.org/10.1016/0883-2927(90)90060-I.
[3] Amouyal E. Photochemical production of hydrogen andoxygen from water: a review and state of the art. Sol EnergyMater Sol Cell 1995;38:249e76.
[4] Assumpcao M, Vieira Barros L, Franca GS, Menezes EAS,Pirchiner M, Dourado JC, Ferreira J, Bezerra FHR, Barbossa JR,Ribotta LC, Farias do Nascimento A. Intraplate seismicity inBrazil. In: Talwani P, editor. Intraplate earthquakes; 2014.p. 50e71. https://doi.org/10.1017/CBO9781139628921.004[Chapter 3].
[5] Charlou JL, Donval JP, Fouquet Y, Jean-Baptiste P, Holm N.Geochemistry of high H2 and CH4 vent fluids issuing fromultramafic rocks at the Rainbow hydrothermal field (36� 14’N,MAR). Chem Geol 2002;191:345e59.
[6] Ciotoli G, Guerra M, Lombardi S, Vittori E. Soil gas survey fortracing seismogenic faults: a case study in the Fucino Basin,Central Italy. J Geophys Res 1998;103:23781e94.
[7] Conrad R, Seiler W. Influence of temperature, moisture, andorganic carbon on the flux of H2 and CO between soil andatmosphere: field studies in subtropical regions. J GeophysRes 1985;90(D3):5699e709.
[8] Constant P, Chowdhury SP, Hesse L, Conrad R. Co-localization of atmospheric H2 oxidation activity and highaffinity H2-oxidizing bacteria in non-axenic soil and sterilesoil amended with Streptomyces sp. PCB7. Soil Biol Biochem2011;43. 1888-18.
[9] Cornet FH, Doan ML, Moretti I, Borm G. Drilling through theactive Aigion Fault: the AIG10 well observatory. CRAS StructGeol Deform Mech 2004;336:395e406.
[10] Deville E, Prinzhofer A. The origin of N2-H2-CH4-rich naturalgas seepages in ophiolitic context: a major and noble gasesstudy of fluid seepages in New Caledonia. Chem Geol2016;440:139e47.
[11] Firstov PP, Shirokov VA. Dynamics of molecular hydrogenand its relation to deformational processes at thePetropavlovsk-Kamchatskii geodynamic test site: evidencefrom observations in 1999-2003. Geochem Int
Please cite this article as: Prinzhofer A et al., Natural hydrogen coBrazilian H2-emitting structure, International Journal of Hydrogen En
2005;43:1056e64. N� 11 Translated from Geokhimiya N� 11,2005, P. 1151-1160.
[12] Grab-Rogalinski K, Szwaja S. Cost analysis of hydrogenenergy generation. Journal of KONES Powertrain andTransport 2014;21(3):121e6. N�.
[13] Gu�elard J, Beaumont V, Rouchon V, Guyot F, Pillot D,J�ez�equel D, Ader M, Newell KD, Deville E. Natural H2 inKansas: deep or shallow origin? AGU publications, frontiersin geosystems: deep earth e surface interactions. GeochemGeophys Geosyst 2017;18:1e25. https://doi.org/10.1002/2016GC006544.
[14] Khdhiri M, Hesse L, Popa ME, Quiza L, Lalode I, Meredith LK,R€ockmann T, Constant P. Soil carbon content and relativeabundance of high affinity H2-oxidizing bacteria predictatmospheric H2 soil uptake activity better than soil microbialcommunity composition. Soil Biol Biochem 2015;85:1e9.
[15] Kimball BA, Lemon ER. Air turbulence effects upon soil gasexchange. Soil Sci Soc Am Proc 1971;35. N� 1, January-february 1971.
[16] Larin N. Hydridic Earth. The new geology of our primordiallyhydrogen-rich planet. In: Warren Hunt C, editor. Translation.Calgary, Alberta, Canada: Published by Polar Publishing;1993. 247p.
[17] Larin NV, Larin VN, Gorbatikov AV. Circular structures,caused by the deep seeping 511 of hydrogen. In: Degassing ofthe Earth: geotectonics, geodynamics, Deep Fluids, oil andgas; 512 hydrocarbons and life. Russian conference withinternational participation dedicated to the 513 100thanniversary of academician P.N. Kropotkin; 2010. p. 282 [inRussian)].
[18] Larin N, Zgonnik V, Rodina S, Deville E�, Prinzhofer A,Larin VN. Natural molecular hydrogen seepages associatedwith surficial, rounded depression on the European craton inRussia. Nat Resour Res 2015;24(3):363e83. https://doi.org/10.1007/s11053-014-9257-5.
[19] Lin LH, Slater GF, Sherwood-Lollar B, Lacrampe-Couloume B,Onstott TC. The yield and isotopic composition of radiolyticH2, a potential energy source for the dep subsurfacebiosphere. Geochem Cosmochim Acta 2005;69:893e903.
[20] Lopez-Lazaro C, Bachaud P, Moretti I, Ferrando N. Hydrogensolubility in aqueous NaCl solutions: from molecularsimulation to equation of state. Submitted to Int J HydrogenEnergy 2018.
[21] Maier M, Schack-Kirchner H, Aubinet M, Goffin S,Longdoz B, Parent F. Turbulence effect on gas transport inthree contrasting forest soils. Soil SciSocAm J2011;76:1518e28.
[22] Marcaillou C, Mu~noz M, Vidal O, Parra T, Harfouche M.Mineralogical evidence for H2 degassing duringserpentinization at 300 �C/300 bar. Earth Planet Sci Lett2011;303(3e4):281e90. https://doi.org/10.1016/j.epsl.2011.01.006.
[23] Milesi V, Guyot F, Brunet F, Richard L, Recham N,Benedetti M, Dairou J, Prinzhofer A. Formation of CO2, H2 andcondensed carbon from siderite dissolution in the 200-300 �Crange and at 50 MPa. Geochem Cosmochim Acta2015;154:201e11.
[24] Moretti I, Labaume P, Sheppard S, Boul�egue J.Compartmentalization of the migration pathways in the sub-andean zone, Bolivia. Proceeding of Geofluid 2000, BarcelonaTectonophysics 2002;348:5e24.
[25] Moretti I, Pierre H. Pour la Science, special issue inpartnership with Engie, vol. 485; 2018. p. 28. N� march.
[26] Moretti I, D'Agostino A, Werly J, Ghost C, Defrenne D,Gorintin L. Pour la Science, special issue in partnership withEngie, march 2018. 2018. 24-25XXII_XXVI.
[27] Myagkiy A, Brunet F, Sissmann O, Popov C, Kruger R,Charlet L, Moretti I. Experimental study of H2 consumption
ntinuous emission from sedimentary basins: The example of aergy, https://doi.org/10.1016/j.ijhydene.2019.01.119

i n t e r n a t i o n a l j o u r n a l o f h y d r o g e n en e r g y x x x ( x x x x ) x x x10
by soils from the Sao Francisco Basin (Minas Gerais, Brazil):implications for continental H2 exploration. 2019 (in prep.).
[28] Neal C, Stanger G. Hydrogen generation from mantle sourcerocks in Oman. Earth Planet Sci Lett 1983;66:315e20. https://doi.org/10.1016/0012-821X(83)90144-9.
[29] Nivin VA. Free hydrogen-hydrocarbon gases from theLovozero loparite deposit (Kola Peninsula, NW Russia). ApplGeochem 2016;74:44e55.
[30] Nivin VA, Pukha VV, Lovchikov AV, Rakhimov RG. Changesin the molecular hydrogen concentration in an undergroundmine (Lovozero rare-metal deposit, Kola peninsula). DoklEarth Sci 2016;471(2):1261e4.
[31] Noar j, Loveless T, Navarro-Herrero JL, Olson JW, Bruno-Barcena JM. Aerobic hydrogen production via nitrogenase inAsotobacter vinelandii CA6. Appl Environ Microbiol2015;81:4507e16. N� 13.
[32] Oey M, Sawyer AL, Ross IL, Hankamer B. Challenges andopportunities for hydrogen production from microalgae.Plant Biotechnol J 2016;14:1487e99.
[33] Panfilov M. Underground and pipeline hydrogen storage.Compend Hydrogen Energy 2016:91e115. https://doi.org/10.1016/B978-1-78242-362-1.00004-3 Elsevier Ltd.
[34] Pich�e-Choquette S, Khdhiri M, Constant P. Dose-responserelationships between environmentally-relevant H2
concentrations and the biological sinks of H2, CH4 and CO insoil. Soil Biol Biochem 2018;123:190e9.
[35] Price LC. Research-derived insights into surface geochemicalhydrocarbon exploration. In: Schumacher D, Abrams MA,editors. Hydrocarbon migration and its near-surfaceexpression: AAPG Memoir 66; 1996. p. 285e307.
[36] Prinzhofer A, Deville E. Hydrog�ene naturel. La prochainer�evolution �energ�etique ? Edition Belin. 2015. p. 187p (13th ofMay 2015).
[37] Prinzhofer A, Ciss�e CST, Diallo AB. Discovery of a largeaccumulation of natural hydrogen in Bourakebougou (Mali).Int J Hydrogen Energy 18 October 2018;43(42):19315e26.
[38] Reis HLS. Neoproterozoic evolution of the S~ao Franciscobasin, SE Brazil: effect of tectonic inheritance on forelandsedimentation and deformation. PhD defended on July 2016.Brazil: University of Ouro Preto; 2016.
[39] Reis HLS, Alkmim FF, Fonseca RCS, Nascimento TC, Suss JF,Prevatti LD. The s~ao Francisco Basin. Chapter from book “S~aoFrancisco Craton, Eastern Brazil: tectonic genealogy of aminiature continent”. 2017. p. 117e43.
[40] Rhee TS, Brenninkmeijer CAM, R€ockmann T. Theoverwhelming role of soils in the global atmospherichydrogen cycle. Atmos Chem Phys Discuss 2005;5:11215e48.
[41] Rhino K, Loisy C, Cerepi A, Le Roux O, Garcia B, Rouchon V,Noirez S, Le Gallo C, Delaplace P, Willequet O, Bertrand C, ElKhamlichi A. The demo-CO2 project : monitoring and
Please cite this article as: Prinzhofer A et al., Natural hydrogen coBrazilian H2-emitting structure, International Journal of Hydrogen En
comparison of two shallow subsurface CO2 leakageexperiments with gas tracer associated in the carbonatevadose zone. Int J Greenhouse Gas Control 2016;53:207e21.
[42] Satake H, Ohashi M, Hayashi Y. Discharge of H2 from theAtotsugawa and Ushibi faults, Japan, and its relation toearthquakes. Pageoph 1985;122:185e93.
[43] Sato M, Sutton AJ, McGee KA, Russel-Robinson S. Monitoringof hydrogen along the san Andreas and Calaveras faults incentral California in 1980-1984. J Geophys Res1986;91:12315e26. N� B12.
[44] Sherwood Lollar B, Lacrampe-Couloume G, Voglesonger K,Onstott TC, Pratt LM, Slater GF. Isotopic signatures of CH4and higher hydrocarbon gases from Precambrian sheld sites:a model for abiogenic polymerization of hydrocarbons.Geochem Cosmochim Acta 2008;72:4778e95.
[45] Sugisaki R, Ido M, Takeda H, Isobe Y, Hayashi Y,Nakamura N, Satake H, Mizutani Y. Origin of hydrogen andcarbon dioxide in fault gases and its relation to fault activity.J Geol 1983;3:239e58. N�.
[46] Sukhanova NI, Trofimov SY, Polyanskaya LM, Larin NV,Larin VN. Changes 555 in the humus status and the structureof the microbial biomass in hydrogen exhalation 556 places.Eurasian Soil Sci 2013;46:135e44.
[47] Teixeira AH De C, Bastiaanssen WGM, Ahmad MD, Bos MG.Reviewing SEBAL input parameters for assessingevapotranspiration and water productivity for the Mow-Middle S~ao Francisco River basin, Brazil. Part A: calibrationand validation. Agric For Meteorol 2009;149:462e76.
[48] Truche L, Joubert G, Dargent M, Martz P, Cathelineau M,Rigaudier T, Quirt D. Clay minerals trap hydrogen in theEarth's crust: evidence from the Cigar Lake uranium deposit,Athabasca. Earth Planet Sci Lett 2018;493:186e97.
[49] Vacquand C, Deville E, Beaumont V, Guyot F, Sissmann O,Pillot D, Arcilla C, Prinzhofer A. Reduced gas seepages inophiolitic complexes: evidences for multiple origins of theH2-CH4-N2 gas mixtures. Geochem Cosmochim Acta2018;223:437e61.
[50] Vinukollu RK, Wood EF, Ferguson CR, Fisher JB. Globalestimates of evapotranspiration for climate studies usingmulti-sensor remote sensing data: evaluation of threeprocess-based approaches. Rem Sens Environ2011;115:801e23.
[51] Welhan JA, Craig H. Methane and hydrogen in East pacificrise hydrothermal fluids. Geophys Res Lett 1979;6:829e31.
[52] Zgonnik V, Beaumont V, Deville E, Larin N, Pillot D, Farrell K.Evidences for natural hydrogen seepages associated withrounded subsident structures: the Carolina bays (NorthernCarolina, USA). Prog Earth Planet Sci 2015;2:31. https://doi.org/10.1186/s40645-015-0062-5.
ntinuous emission from sedimentary basins: The example of aergy, https://doi.org/10.1016/j.ijhydene.2019.01.119