Natural Gas Market National Overvie · Federal Energy Regulatory Commission • Market Oversight @...
20
Federal Energy Regulatory Commission • Market Oversight @ FERC.gov Natural Gas Market National Overview Natural Gas Market Overview Page 1 of 20 January 2009
-
Upload
vuongquynh -
Category
Documents
-
view
213 -
download
0
Transcript of Natural Gas Market National Overvie · Federal Energy Regulatory Commission • Market Oversight @...
Federal Energy Regulatory Commission • Market Oversight @ FERC.gov
Natural Gas Market National Overview
Natural Gas Market OverviewPage 1 of 20
January 2009

Federal Energy Regulatory Commission • Market Oversight @ FERC.gov
Total U.S. Working Gas in Storage
Natural Gas Market Overview: National Storage
2003
2008-09
0
500
1,000
1,500
2,000
2,500
3,000
3,500
4,000
Apr May June July Aug Sept Oct Nov Dec Jan Feb Mar
Volu
me
(BC
F)
5-year range 2006 2007 2008
Stocks were 56 Bcf above the 5-year average of 2,821 Bcf on 12/26/2008.
Source: Derived from EIA data. Updated January 9, 2009
Page 2 of 20
January 2009

Federal Energy Regulatory Commission • Market Oversight @ FERC.gov
Regional Totals of Working Gas in Storage
Natural Gas Market Overview: Regional Storage
2004Source: Derived from EIA data.
2008-09
0
500
1,000
1,500
2,000
Apr MayJu
ne July
AugSep
tOct Nov Dec Ja
nFeb Mar
Volu
me
(BC
F)
5-year range 2006 2007 2008
2008-09
0100200300400500
AprMayJu
ne July
AugSep
tOct Nov Dec Ja
nFeb Mar
Stocks were 26 Bcf abovethe 5-year average of 374 Bcf on 12/26/2008.
2008-09
0
200
400
600
800
1,000
1,200
AprMayJu
ne July
AugSep
tOct NovDecJa
nFeb Mar
Stocks were 49 Bcf abovethe 5-year average of 839 Bcf on 12/26/2008.
Stocks were 19 Bcf belowthe 5-year average of 1,608 Bcf on 12/26/2008.
Producing Region
Western Consuming Region
Eastern Consuming Region
Updated January 9, 2009
Producing
EastWest
Page 3 of 20
January 2009
Federal Energy Regulatory Commission • Market Oversight @ FERC.gov
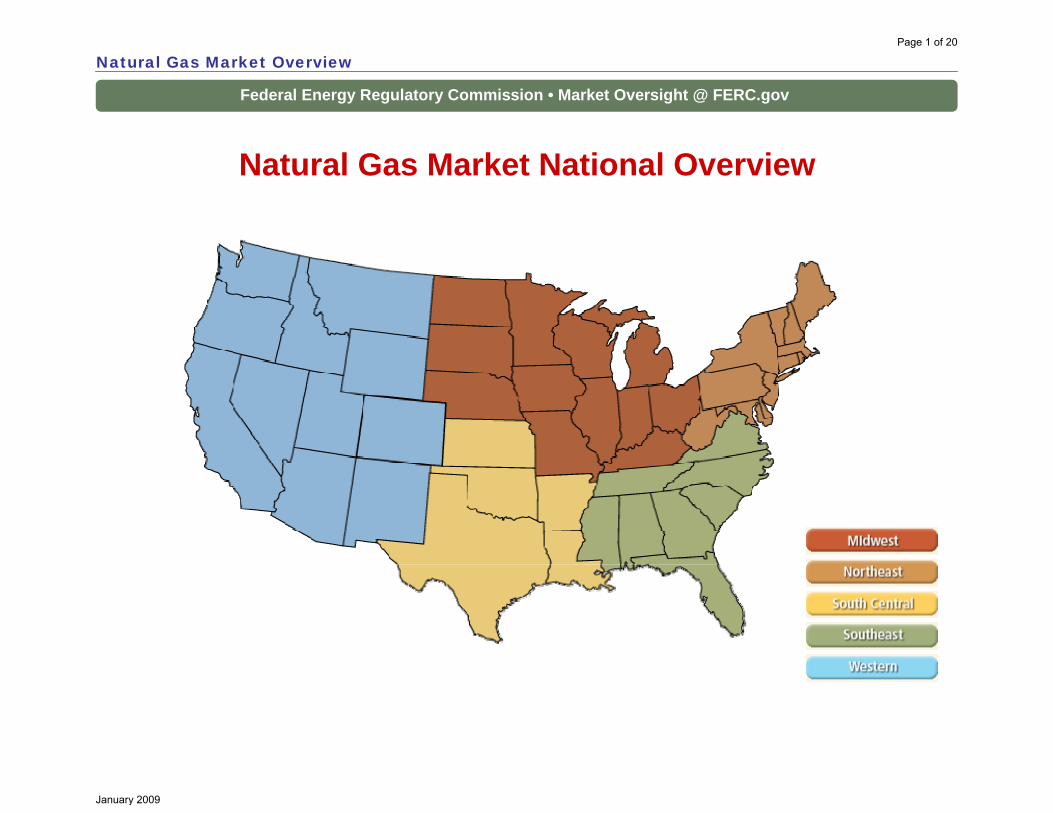
Henry Hub Natural Gas Daily Spot Prices 2001-2008
Natural Gas Market Overview: Henry Hub Spot Prices
2001Source: Derived from Platts data.
$0
$2
$4
$6
$8
$10
$12
$14
$16
$18
$20
Jan-0
1Ju
l-01
Jan-0
2Ju
l-02
Jan-0
3Ju
l-03
Jan-0
4Ju
l-04
Jan-0
5Ju
l-05
Jan-0
6Ju
l-06
Jan-0
7Ju
l-07
Jan-0
8Ju
l-08
Pric
e ($
/MM
Btu)
Updated January 9, 2009
Page 4 of 20
January 2009

Federal Energy Regulatory Commission • Market Oversight @ FERC.gov
Henry Hub Natural Gas Daily Spot Prices 2007, 2008 and 2003-2007 Year Range
Natural Gas Market Overview: 5 Year Range of Henry Hub Spot Prices
2085Source: Derived from Platts data.
$0
$2
$4
$6
$8
$10
$12
$14
$16
$18
$20
Jan Feb Mar Apr May Jun Jul Aug Sep Oct Nov Dec
2003 - 2007 Range 2005 Hurricanes2007 2008
30-Day Rolling Average Prices
$0$4$8
$12$16$20
Jan-0
3Ju
l-03
Jan-0
4Ju
l-04
Jan-0
5Ju
l-05
Jan-0
6Ju
l-06
Jan-0
7Ju
l-07
Jan-0
8Ju
l-08
Pric
e ($
/MM
Btu)
Updated January 9, 2009
Page 5 of 20
January 2009

Federal Energy Regulatory Commission • Market Oversight @ FERC.gov
Columbia
Waha Hub
AlgonquinCitygate
AECO Hub
Malin
Dawn
Tetco M-1
Pricing PointBlack – current priceGreen – increase/previous yearRed – decrease/previous yearBasis
ChicagoCitygate
TranscoZ6-NY
NorthernVentura
Katy Hub
Henry Hub
El PasoPermian
PanhandleTex-Okla
El PasoSan Juan
SoCal Border
PG&ECitygate
Kern RiverOpal
NW Sumas
Tennessee Zone 0
Niagara
$8.180.77
$8.461.09
0.291.15
1.26
$7.320.36
$7.200.23
$7.120.28
$6.490.48
$6.830.28
$6.200.31
$6.070.30
$5.700.22
$6.940.20
$6.610.25
$6.590.21
$6.620.31
$6.090.20
$6.890.42
$6.480.37
$4.07(1.32)
$6.410.32
$7.060.27
$6.340.36
0.111.53
1.130.78
2.42
2.34
0.21
0.41
0.35
0.21
0.74
0.07
0.26
0.22
0.13
0.19
0.29
0.01
0.02
0.48
Average Spot Gas Prices, 2007
Natural Gas Market Overview: Spot Gas Prices
Source: Platts. 2181Updated September 17, 2008
Page 6 of 20
January 2009

Federal Energy Regulatory Commission • Market Oversight @ FERC.gov
U.S. Natural Gas Demand Shares by Sector in 2007
Natural Gas Market Overview: Demand By Sector
2002Source: Derived from EIA data.
Residential22%
Commercial14%
Industrial31%
Vehicle Fuel0%
Power Generation33%
Updated December 5, 2008
Page 7 of 20
January 2009
Federal Energy Regulatory Commission • Market Oversight @ FERC.gov
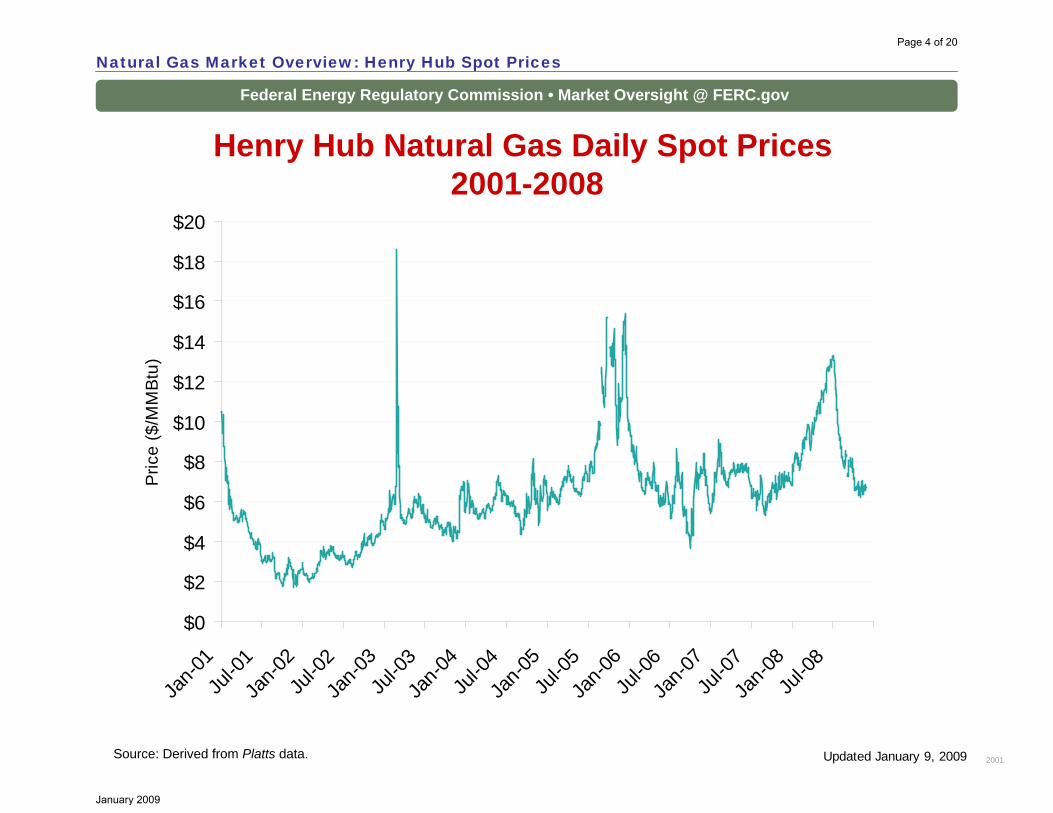
Regional Natural Gas Production for 2008
Natural Gas Market Overview: Production By Region
2182Source: Derived from Bentek data.
0
2
4
6
8
10
12
14Ja
n-08
Feb-
08M
ar-0
8Ap
r-08
May
-08
Jun-
08Ju
l-08
Aug-
08Se
p-08
Oct-
08No
v-08
Dec-
08
Vol
ume
(Bcf
)
Mid-ContinentGulfWestAppalachia
Updated January 9, 2009
Page 8 of 20
January 2009

Federal Energy Regulatory Commission • Market Oversight @ FERC.gov
OCS Daily Shut-in andCumulative Lost Natural Gas Production- Gustav/Ike
Natural Gas Market Overview: Hurricane Shut-Ins
2184Source: Derived from Minerals Management Service data.
OCS Daily Shut-in and Cumulative Lost Natural Gas Production- Gustav/Ike
0
1
2
3
4
5
6
7
8
28-A
ug
4-Se
p
11-S
ep
18-S
ep
25-S
ep
2-O
ct
9-O
ct
16-O
ct
23-O
ct
30-O
ct
6-No
v
13-N
ov
20-N
ov
27-N
ov
4-De
c
11-D
ec
Daily
shu
t-in
Bcf
0
50
100
150
200
250
300
350
400
Cum
ulat
ive
lost
pro
duct
ion
Bcf
Daily Federal Waters Offshore Production
Lost Production
Daily Shut-in Production
Updated January 9, 2009
Page 9 of 20
January 2009

Federal Energy Regulatory Commission • Market Oversight @ FERC.gov
U.S. and Canadian Natural Gas Drilling Rig Countand Daily Spot Prices
Natural Gas Market Overview: Drilling Rig Count
2007Source: Derived from Platts and Baker Hughes data.
$0
$2
$4
$6
$8
$10
$12
$14
$16
$18
2000
2001
2002
2003
2004
2005
2006
2007
2008
2009
Pric
e ($
/MM
Btu)
0
200
400
600
800
1,000
1,200
1,400
1,600
1,800
Num
ber of Rigs
Henry Hub Average Weekly PriceU.S. Rigs Drilling for Natural GasCanadian Rigs Drilling for Natural Gas
Updated January 9, 2009
Page 10 of 20
January 2009

Federal Energy Regulatory Commission • Market Oversight @ FERC.gov
Oil, Coal and Natural Gas Daily Spot Prices
Source: Derived from ICE and Bloomberg data.Note: Coal prices are quoted in $/ton. Conversion factors to $/MMBtu are based on contract specifications of 12,000 btus/pound for Central Appalachian coal and 8800 btus/pound for Powder River Basin coal.
Natural Gas Market Overview: Oil, Coal and Natural Gas Prices
2160
$0
$10
$20
$30
$40
Jan-
07Fe
b-07
Mar
-07
Apr-0
7M
ay-0
7Ju
n-07
Jul-0
7Au
g-07
Sep-
07O
ct-0
7No
v-07
Dec-
07Ja
n-08
Feb-
08M
ar-0
8Ap
r-08
May
-08
Jun-
08Ju
l-08
Aug-
08Se
p-08
Oct
-08
Nov-
08De
c-08
Transco Z6 NYNatural Gas
NY No. 2 Fuel Oil
NY No. 6 0.3% Fuel Oil
Pric
e ($
/MM
Btu
)
$0$3$6$9
$12$15$18$21$24$27 WTI Crude Oil
Henry Hub Natural Gas
Central App Coal
Powder River Coal
Pric
e ($
/MM
Btu
)
Belvieu Non-LDH Propane
Updated January 9, 2009
Page 11 of 20
January 2009

Federal Energy Regulatory Commission • Market Oversight @ FERC.gov
Monthly Gas Imports at Existing U.S. LNG Facilities
Source: Derived from DOE Office of Fossil Energy data.
Natural Gas Overview: Monthly LNG Imports
2168
0
20
40
60
80
100
120
Jan-
06M
ar-0
6M
ay-0
6Ju
l-06
Sep-
06No
v-06
Jan-
07M
ar-0
7M
ay-0
7Ju
l-07
Sep-
07No
v-07
Jan-
08M
ar-0
8M
ay-0
8Ju
l-08
Sep-
08No
v-08
Volu
me
(BC
F)
Northeast Gateway Energy BridgeFreeport, TXSabine Pass, LAGulf Gateway/ExcelerateLake Charles, LACove Point, MDElba Island, GAEverett, MA
Updated January 9, 2009
Page 12 of 20
January 2009

Federal Energy Regulatory Commission • Market Oversight @ FERC.gov
Daily Gas Sendout from Existing LNG Facilities
Source: Derived from Bentek data. Excludes Everett LNG delivered via truck and consumed by the Mystic plant as well as Freeport LNG which flows via intrastate pipelines.
Natural Gas Market Overview: Daily Gas Sendout
2161
-
500
1,000
1,500
2,000
2,500
3,000
3,500
4,000
4,500Ja
n-07
Feb-
07M
ar-0
7Ap
r-07
May
-07
Jun-
07Ju
l-07
Aug-
07Se
p-07
Oct
-07
Nov-
07De
c-07
Jan-
08Fe
b-08
Mar
-08
Apr-0
8M
ay-0
8Ju
n-08
Jul-0
8Au
g-08
Sep-
08O
ct-0
8No
v-08
Dec-
08
Northeast Gateway/Excelerate
Sabine Pass
Gulf Gateway/Excelerate
Lake Charles
Cove Point
Elba Island
Everett
Dai
ly L
NG
Sen
dout
(MM
cf/d
)
Updated January 9, 2009
Page 13 of 20
January 2009

Federal Energy Regulatory Commission • Market Oversight @ FERC.gov
Natural Gas Overview: World LNG Prices
2169
World LNG Estimated January 2009 Landed Prices
Source: Waterborne Energy, Inc. Data in $US/MMBtu.
Cove Point$6.12
India$9.00
UK$7.50
Spain$8.90
Belgium$7.40
Japan$9.00
Korea$9.00
Lake Charles$5.23
Altamira$6.02
The U.S. Waterborne LNG Report, Nov. 25, 2008
Updated January 9, 2009
Page 14 of 20
January 2009
Federal Energy Regulatory Commission • Market Oversight @ FERC.gov
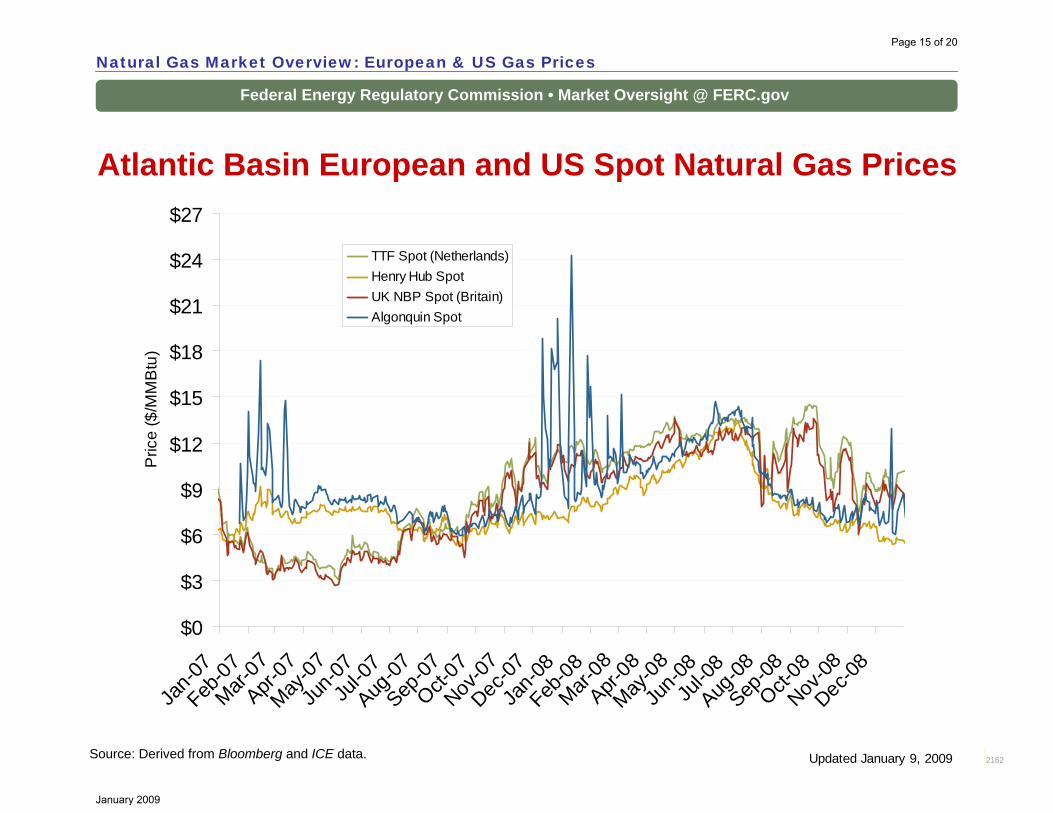
Atlantic Basin European and US Spot Natural Gas Prices
Source: Derived from Bloomberg and ICE data.
Natural Gas Market Overview: European & US Gas Prices
2162
$0
$3
$6
$9
$12
$15
$18
$21
$24
$27
Jan-0
7Feb
-07Mar-
07Apr-
07May
-07Ju
n-07
Jul-0
7Aug
-07Sep
-07Oct-
07Nov
-07Dec
-07Ja
n-08
Feb-08
Mar-08
Apr-08
May-08
Jun-0
8Ju
l-08
Aug-08
Sep-08
Oct-08
Nov-08
Dec-08
TTF Spot (Netherlands)Henry Hub Spot UK NBP Spot (Britain)Algonquin Spot
Pric
e ($
/MM
Btu
)
Updated January 9, 2009
Page 15 of 20
January 2009

Federal Energy Regulatory Commission • Market Oversight @ FERC.gov
Henry Hub and AECO Prompt-Month Futures Prices
Source: Derived from ICE data.
Natural Gas Market Overview: Henry Hub & AECO Futures Prices
2172
$0
$2
$4
$6
$8
$10
$12
$14
$16Ja
n-07
Feb-
07M
ar-0
7Ap
r-07
May
-07
Jun-
07Ju
l-07
Aug-
07Se
p-07
Oct-
07No
v-07
Dec-
07Ja
n-08
Feb-
08M
ar-0
8Ap
r-08
May
-08
Jun-
08Ju
l-08
Aug-
08Se
p-08
Oct-
08No
v-08
Dec-
08Ja
n-09
AECOHenry Hub
Pro
mpt
Mon
th P
rices
(US
D$/
MM
Btu
)
Updated January 9, 2009
Page 16 of 20
January 2009

Federal Energy Regulatory Commission • Market Oversight @ FERC.gov
U.S. Natural Gas Supply and ConsumptionJanuary-November 2008
Source: Derived from EIA/STEO data.
Natural Gas Market Overview: U.S. Supply and Consumption
2163Updated January 9, 2009
US Natural Gas Supply
0
10
20
30
40
50
60
70
2007 2008
Ave
rage
Dai
ly V
olum
e (B
cf/d
)
US Natural Gas Demand
0
10
20
30
40
50
60
70
2007 2008
Ave
rage
Dai
ly V
olum
e (B
cf/d
)
Electric Power
Other
Net Dry GasProduction
Net PipelineImports
Total Change in Demand 0.4%Total Change in Supply -0.1%
5.6%
-12.5%
-53.4%
-3.4%
4.0%
Commercial 2.8%
LNG Imports
Industrial 0.1%
Residential 3.2%
Page 17 of 20
January 2009
Federal Energy Regulatory Commission • Market Oversight @ FERC.gov
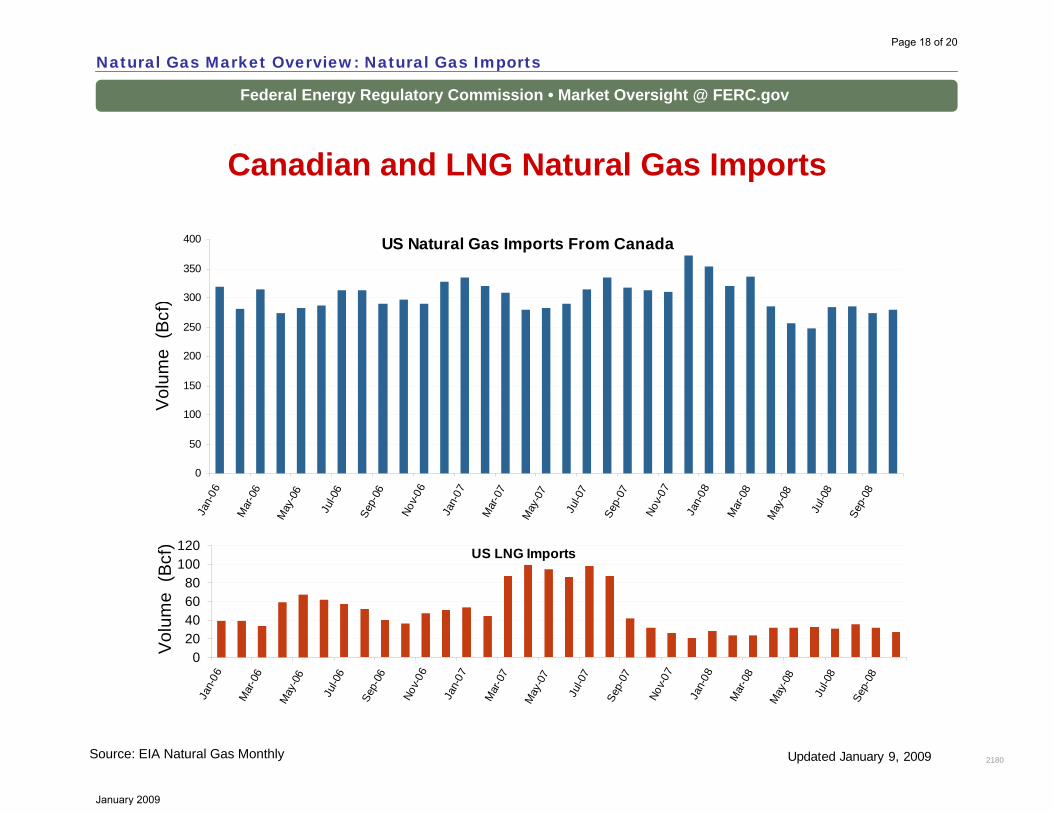
Canadian and LNG Natural Gas Imports
Source: EIA Natural Gas Monthly
Natural Gas Market Overview: Natural Gas Imports
2180
US LNG Imports
020406080
100120
Jan-
06
Mar
-06
May
-06
Jul-0
6
Sep-
06
Nov-
06
Jan-
07
Mar
-07
May
-07
Jul-0
7
Sep-
07
Nov-
07
Jan-
08
Mar
-08
May
-08
Jul-0
8
Sep-
08
Vol
ume
(Bcf
)
US Natural Gas Imports From Canada
0
50
100
150
200
250
300
350
400
Jan-
06
Mar
-06
May
-06
Jul-0
6
Sep-
06
Nov-
06
Jan-
07
Mar
-07
May
-07
Jul-0
7
Sep-
07
Nov-
07
Jan-
08
Mar
-08
May
-08
Jul-0
8
Sep-
08
Vol
ume
(Bcf
)
Updated January 9, 2009
Page 18 of 20
January 2009

Federal Energy Regulatory Commission • Market Oversight @ FERC.gov
Total U.S. Natural Gas Demand (All Sectors)
Natural Gas Market Overview: Total US Gas Demand
20009Source: Derived from Bentek Energy data.
35
45
55
65
75
85
95
105
115
Jan Feb Mar Apr May Jun Jul Aug Sep Oct Nov Dec
Volu
me
(Bcf
d)
3 Year Range 2008
Updated January 9, 2009
Page 19 of 20
January 2009

Federal Energy Regulatory Commission • Market Oversight @ FERC.gov
Estimated Recoverable NG For Select Shale Basins (TCF)
Natural Gas Market Overview: Estimated Recoverable US Shale Gas
20010Source: Derived From American Clean Skies Foundation
20082006
13 20Antrim
34 262Marcellus
34 251Haynesville
34 53
SouthwestWyoming
26 42Fayetteville
12 17Woodford
62 97Barnett
Legend742215
Total US
Updated November 18, 2008
Page 20 of 20
January 2009