Natural Gas and Oil roduction MDU Resources Group, Inc ...
186
Natural Gas and Oil Production Electric and Natural Gas Utilities Pipeline and Energy Services Construction Services Construction Materials and Contracting MDU Resources Group, Inc. Building a Strong America® 2009 Annual Report Form 10-K Proxy Statement
Transcript of Natural Gas and Oil roduction MDU Resources Group, Inc ...
Natural Gas and Oil Production
Electric and Natural Gas UtilitiesPipeline and Energy Services
Construction ServicesConstruction Materials and Contracting
MDU Resources Group, Inc.
Building a Strong America®
2009 Annual Report
Form 10-K
Proxy Statement
MDU Resources Group, Inc.
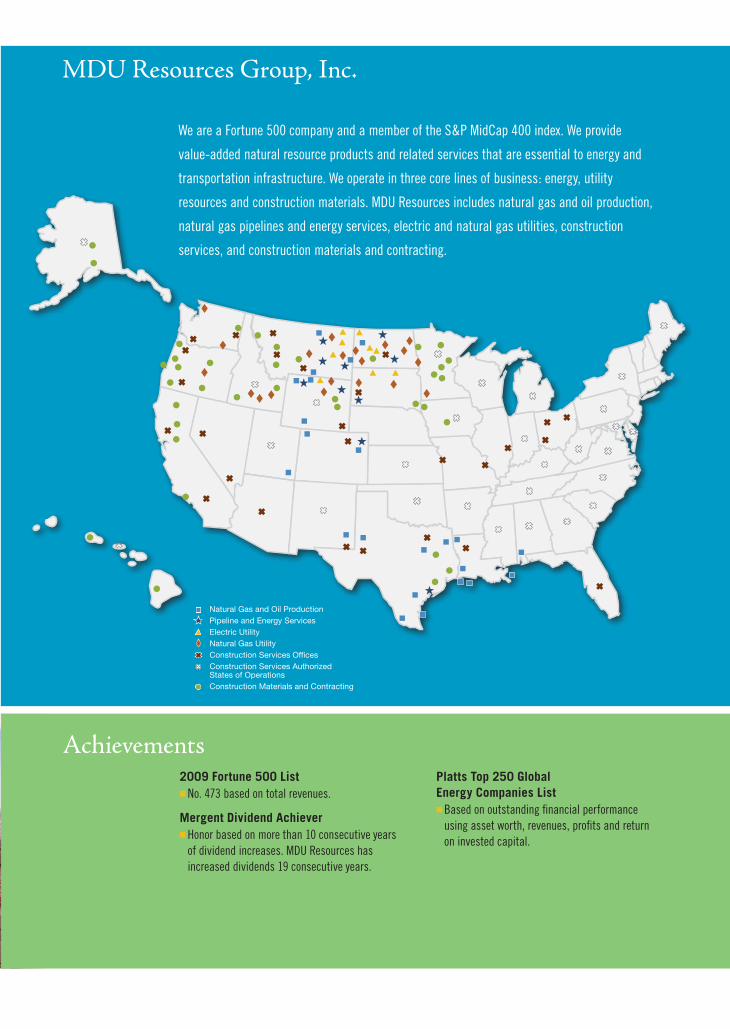
We are a Fortune 500 company and a member of the S&P MidCap 400 index. We provide
value-added natural resource products and related services that are essential to energy and
transportation infrastructure. We operate in three core lines of business: energy, utility
resources and construction materials. MDU Resources includes natural gas and oil production,
natural gas pipelines and energy services, electric and natural gas utilities, construction
services, and construction materials and contracting.
Natural Gas and Oil ProductionPipeline and Energy ServicesElectric UtilityNatural Gas UtilityConstruction Services OfficesConstruction Services Authorized States of OperationsConstruction Materials and Contracting
Natural Gas and Oil ProductionPipeline and Energy ServicesElectric UtilityNatural Gas UtilityConstruction Services OfficesConstruction Services Authorized States of OperationsConstruction Materials and Contracting
MDU Resources Group, Inc.
StReet AddReSS
1200 W. Century Ave.Bismarck, ND 58503
mAiling AddReSS
P.O. Box 5650Bismarck, ND 58506-5650
(701) 530-1000(866) 760-4852
Trading Symbol: MDUwww.mdu.com 00069614
Achievements2009 Fortune 500 Listn No. 473 based on total revenues.
Mergent Dividend Achievern Honor based on more than 10 consecutive years
of dividend increases. MDU Resources has increased dividends 19 consecutive years.
Platts Top 250 Global Energy Companies Listn Based on outstanding financial performance
using asset worth, revenues, profits and return on invested capital.
MD
U R
esources Group, Inc.
20
09 A
nnual Report
Natural Gas and Oil Production
Electric and Natural Gas UtilitiesPipeline and Energy Services
Construction ServicesConstruction Materials and Contracting
MDU Resources Group, Inc.
Building a Strong America®
2009 Annual Report
Form 10-K
Proxy Statement
MDU Resources Group, Inc.
We are a Fortune 500 company and a member of the S&P MidCap 400 index. We provide
value-added natural resource products and related services that are essential to energy and
transportation infrastructure. We operate in three core lines of business: energy, utility
resources and construction materials. MDU Resources includes natural gas and oil production,
natural gas pipelines and energy services, electric and natural gas utilities, construction
services, and construction materials and contracting.
Natural Gas and Oil ProductionPipeline and Energy ServicesElectric UtilityNatural Gas UtilityConstruction Services OfficesConstruction Services Authorized States of OperationsConstruction Materials and Contracting
Natural Gas and Oil ProductionPipeline and Energy ServicesElectric UtilityNatural Gas UtilityConstruction Services OfficesConstruction Services Authorized States of OperationsConstruction Materials and Contracting
MDU Resources Group, Inc.
StReet AddReSS
1200 W. Century Ave.Bismarck, ND 58503
mAiling AddReSS
P.O. Box 5650Bismarck, ND 58506-5650
(701) 530-1000(866) 760-4852
Trading Symbol: MDUwww.mdu.com 00069614
Achievements2009 Fortune 500 Listn No. 473 based on total revenues.
Mergent Dividend Achievern Honor based on more than 10 consecutive years
of dividend increases. MDU Resources has increased dividends 19 consecutive years.
Platts Top 250 Global Energy Companies Listn Based on outstanding financial performance
using asset worth, revenues, profits and return on invested capital.
MD
U R
esources Group, Inc.
20
09 A
nnual Report

Fidelity Exploration & Production Co. is engaged in natural gas and oil acquisition, exploration, development and production activities in the Rocky Mountain and Mid-Continent regions of the United States and in and around the Gulf of Mexico.
The pipeline and energy services segment provides natural gas transportation, underground storage and gathering services through regulated and nonregulated pipeline systems primarily in the Rocky Mountain and northern Great Plains regions of the United States. It also provides cathodic protection and other energy-related services.
Montana-Dakota Utilities Co. generates, transmits and distributes electricity and distributes natural gas in Montana, North Dakota, South Dakota and Wyoming. Cascade Natural Gas Corp. distributes natural gas in Oregon and Washington. Intermountain Gas Co. distributes natural gas in Idaho. Great Plains Natural Gas Co. distributes natural gas in western Minnesota and southeastern North Dakota. These operations also supply related value-added products and services.
The construction services segment specializes in constructing and maintaining electric and communication lines, gas pipelines, fire suppression systems, and external lighting and traffic signalization equipment. This segment also provides utility excavation services and inside electrical wiring, cabling and mechanical services, sells and distributes electrical materials, and manufactures and distributes specialty equipment.
Knife River Corp. mines aggregates and markets crushed stone, sand, gravel and related construction materials, including ready-mix concrete, cement, asphalt, liquid asphalt and other value-added products. It also performs integrated contracting services. Knife River operates in the central, southern and western United States and Alaska and Hawaii.
Natural Gas and Oil Production
Pipeline and Energy Services
Electric and Natural Gas Utilities
Construction Services
Construction Materials and Contracting
SD
MO
NE
TX
CO
WY
MT
IDOR
HI
WA
NV
AK
CA
MN
IA
ND
Construction materials locations
States of operations
NE
SD
MT
ID
AK
HI
WY
COUT
NV
CA
OR
WA
AZNM
NDMN
IA
MO
AR
LA
TN
MS
NC
VA MD
DE
WVKY
IN OHPA
NY
ME
AL GA
FL
SC
IL
MIWI
KS
OK
TX
Construction services offices
Authorized states of operations
SD
MTID
WY
OR
WA
ND MN
Electric and natural gas utility areas
Electric generating stations
States of operations
Areas of production and reserves
States of operations
Pipeline gathering systems
Company storage fields
States of operations
Pipeline systems
Interconnecting pipelines
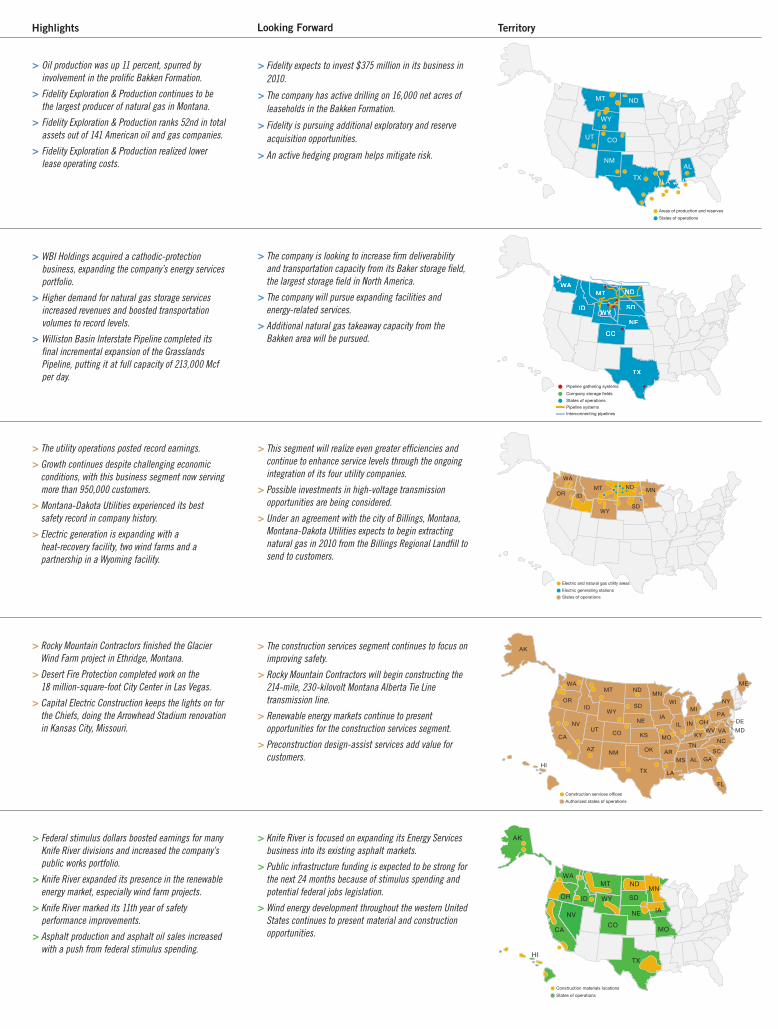
> Federal stimulus dollars boosted earnings for many Knife River divisions and increased the company’s public works portfolio.
> Knife River expanded its presence in the renewable energy market, especially wind farm projects.
> Knife River marked its 11th year of safety performance improvements.
> Asphalt production and asphalt oil sales increased with a push from federal stimulus spending.
> The utility operations posted record earnings.
> Growth continues despite challenging economic conditions, with this business segment now serving more than 950,000 customers.
> Montana-Dakota Utilities experienced its best safety record in company history.
> Electric generation is expanding with a heat-recovery facility, two wind farms and a partnership in a Wyoming facility.
> WBI Holdings acquired a cathodic-protection business, expanding the company’s energy services portfolio.
> Higher demand for natural gas storage services increased revenues and boosted transportation volumes to record levels.
> Williston Basin Interstate Pipeline completed its final incremental expansion of the Grasslands Pipeline, putting it at full capacity of 213,000 Mcf per day.
> Rocky Mountain Contractors finished the Glacier Wind Farm project in Ethridge, Montana.
> Desert Fire Protection completed work on the 18 million-square-foot City Center in Las Vegas.
> Capital Electric Construction keeps the lights on for the Chiefs, doing the Arrowhead Stadium renovation in Kansas City, Missouri.
> Oil production was up 11 percent, spurred by involvement in the prolific Bakken Formation.
> Fidelity Exploration & Production continues to be the largest producer of natural gas in Montana.
> Fidelity Exploration & Production ranks 52nd in total assets out of 141 American oil and gas companies.
> Fidelity Exploration & Production realized lower lease operating costs.
Revenues (millions) $439.7Earnings (millions)* $87.7Production Natural gas (Bcf) 56.6 Oil (million barrels) 3.1Proved reserves Natural gas (Bcf) 448.4 Oil (million barrels) 34.2Corporate earnings contribution 34%
* Excludes the effects of a $384.4 million after-tax noncash charge relating to the write-down of natural gas and oil properties.
Revenues (millions) $307.8Earnings (millions) $37.8Pipeline (MMdk) Transportation 163.3 Gathering 92.6Corporate earnings contribution 15%
Revenues (millions) $819.0Earnings (millions) $25.6Corporate earnings contribution 10%
Revenues (millions) $1,515.1Earnings (millions) $47.1Sales (millions) Aggregates (tons) 24.0 Asphalt (tons) 6.4 Ready-mix concrete (cubic yards) 3.0Aggregate reserves (billion tons) 1.1Corporate earnings contribution 18%
Revenues (millions) Electric $196.2 Natural gas $1,072.8Earnings (millions) Electric $24.1 Natural gas $30.8Electric sales (million kWh) Retail 2,663.5 Sales for resale 90.8Natural gas distribution (MMdk) Sales 102.7 Transportation 132.7Corporate earnings contribution Electric 9% Natural gas 12%
Company description
> Fidelity expects to invest $375 million in its business in 2010.
> The company has active drilling on 16,000 net acres of leaseholds in the Bakken Formation.
> Fidelity is pursuing additional exploratory and reserve acquisition opportunities.
> An active hedging program helps mitigate risk.
> The company is looking to increase firm deliverability and transportation capacity from its Baker storage field, the largest storage field in North America.
> The company will pursue expanding facilities and energy-related services.
> Additional natural gas takeaway capacity from the Bakken area will be pursued.
> This segment will realize even greater efficiencies and continue to enhance service levels through the ongoing integration of its four utility companies.
> Possible investments in high-voltage transmission opportunities are being considered.
> Under an agreement with the city of Billings, Montana, Montana-Dakota Utilities expects to begin extracting natural gas in 2010 from the Billings Regional Landfill to send to customers.
> The construction services segment continues to focus on improving safety.
> Rocky Mountain Contractors will begin constructing the 214-mile, 230-kilovolt Montana Alberta Tie Line transmission line.
> Renewable energy markets continue to present opportunities for the construction services segment.
> Preconstruction design-assist services add value for customers.
> Knife River is focused on expanding its Energy Services business into its existing asphalt markets.
> Public infrastructure funding is expected to be strong for the next 24 months because of stimulus spending and potential federal jobs legislation.
> Wind energy development throughout the western United States continues to present material and construction opportunities.
looking Forward Key Statistics Highlights territory
Notes:• Corporateearningscontributionpercentagesexcludetheeffectsofa$384.4millionafter-taxnoncashchargerelatingtothewrite-downofnaturalgasandoilproperties.• TheOthercategorycontributed2percentofcorporateearningswithrevenuesof$9.5millionandearningsof$7.3million.•Consolidatedrevenuesreflectintersegmenteliminationsof$183.6million.
Corporate HeadquartersMDU Resources Group, Inc. Street Address: 1200 W. Century Ave. Bismarck, ND 58503
Mailing Address: P.O. Box 5650 Bismarck, ND 58506-5650
Telephone: (701) 530-1000 Toll-Free Telephone: (866) 760-4852 www.mdu.com
The company has filed as exhibits to its Annual Report on Form 10-K the CEO and CFO certifications as required by Section 302 of the Sarbanes-Oxley Act.
The company also submitted the required annual CEO certification to the New York Stock Exchange.
Common StockMDU Resources’ common stock is listed on the NYSE under the symbol MDU. The stock began trading on the NYSE in 1948 and is included in the Standard & Poor’s MidCap 400 index. Average daily trading volume in 2009 was 909,899 shares.
Common Stock Prices High Low Close
2009 First Quarter $22.89 $12.79 $16.14Second Quarter 19.76 15.70 18.97Third Quarter 21.16 17.44 20.85Fourth Quarter 24.22 19.96 23.60
2008First Quarter $27.83 $23.08 $24.55Second Quarter 35.25 24.70 34.86Third Quarter 35.34 26.03 29.00Fourth Quarter 29.50 15.50 21.58
Dividend Reinvestment and Direct Stock Purchase PlanThe company’s plan provides interested investors the opportunity to purchase shares of the company’s common stock and to reinvest dividends without incurring brokerage commissions. For complete details, including an enrollment form, contact the stock transfer agent. Plan information also is available on the Wells Fargo Shareowner Services Web site: www.wellsfargo.com/shareownerservices.
2010 Key Dividend Dates Ex-Dividend Date Record Date Payment Date
First Quarter March 9 March 11 April 1Second Quarter June 8 June 10 July 1Third Quarter September 7 September 9 October 1Fourth Quarter December 7 December 9 January 1, 2011
Key dividend dates are subject to the discretion of the Board of Directors.
Annual MeetingTuesday, April 27, 2010 11 a.m. CDT Montana-Dakota Utilities Co. Service Center 909 Airport Road Bismarck, North Dakota
Shareholder Information and InquiriesRegistered shareholders have electronic access to their accounts by visiting www.shareowneronline.com. Shareowner Online allows shareholders to view their account balance, dividend information, reinvestment details and more. The stock transfer agent maintains stockholder account information.
Communications regarding stock transfer requirements, lost certificates, dividends or change of address should be directed to the stock transfer agent.
Company information, including financial reports, is available at www.mdu.com.
Shareholder ContactArlene Stillwell Telephone: (866) 866-8919 E-mail: [email protected]
Analyst ContactPhyllis A. Rittenbach Director of Investor Relations Telephone: (701) 530-1057 E-mail: [email protected]
Transfer Agent and Registrar for all Classes of Stock and Dividend Reinvestment PlanWells Fargo Bank, N.A. Stock Transfer Department P.O. Box 64856 St. Paul, MN 55164-0856 Telephone: (651) 450-4064 Toll-Free Telephone: (877) 536-3553 www.wellsfargo.com/shareownerservices
Transfer Agent and Registrar for Senior NotesThe Bank of New York Mellon Corporate Trust Department 101 Barclay St. — 12W New York, NY 10286
Independent AuditorsDeloitte & Touche LLP 50 S. Sixth St., Suite 2800 Minneapolis, MN 55402-1538
Note: This information is not given in connection with any sale or offer for sale or offer to buy any security.
Des
ign:
MD
U R
esou
rces
P
rintin
g: A
FPI
10%
Cert no. SCS-C0C-001834
The paper used in this annual report is certified by the Forest Stewardship Council and contains a minimum of 10 percent post-consumer recycled paper fibers.
Stockholder Information
Fidelity Exploration & Production Co. is engaged in natural gas and oil acquisition, exploration, development and production activities in the Rocky Mountain and Mid-Continent regions of the United States and in and around the Gulf of Mexico.
The pipeline and energy services segment provides natural gas transportation, underground storage and gathering services through regulated and nonregulated pipeline systems primarily in the Rocky Mountain and northern Great Plains regions of the United States. It also provides cathodic protection and other energy-related services.
Montana-Dakota Utilities Co. generates, transmits and distributes electricity and distributes natural gas in Montana, North Dakota, South Dakota and Wyoming. Cascade Natural Gas Corp. distributes natural gas in Oregon and Washington. Intermountain Gas Co. distributes natural gas in Idaho. Great Plains Natural Gas Co. distributes natural gas in western Minnesota and southeastern North Dakota. These operations also supply related value-added products and services.
The construction services segment specializes in constructing and maintaining electric and communication lines, gas pipelines, fire suppression systems, and external lighting and traffic signalization equipment. This segment also provides utility excavation services and inside electrical wiring, cabling and mechanical services, sells and distributes electrical materials, and manufactures and distributes specialty equipment.
Knife River Corp. mines aggregates and markets crushed stone, sand, gravel and related construction materials, including ready-mix concrete, cement, asphalt, liquid asphalt and other value-added products. It also performs integrated contracting services. Knife River operates in the central, southern and western United States and Alaska and Hawaii.
Natural Gas and Oil Production
Pipeline and Energy Services
Electric and Natural Gas Utilities
Construction Services
Construction Materials and Contracting
SD
MO
NE
TX
CO
WY
MT
IDOR
HI
WA
NV
AK
CA
MN
IA
ND
Construction materials locations
States of operations
NE
SD
MT
ID
AK
HI
WY
COUT
NV
CA
OR
WA
AZNM
NDMN
IA
MO
AR
LA
TN
MS
NC
VA MD
DE
WVKY
IN OHPA
NY
ME
AL GA
FL
SC
IL
MIWI
KS
OK
TX
Construction services offices
Authorized states of operations
SD
MTID
WY
OR
WA
ND MN
Electric and natural gas utility areas
Electric generating stations
States of operations
Areas of production and reserves
States of operations
Pipeline gathering systems
Company storage fields
States of operations
Pipeline systems
Interconnecting pipelines
> Federal stimulus dollars boosted earnings for many Knife River divisions and increased the company’s public works portfolio.
> Knife River expanded its presence in the renewable energy market, especially wind farm projects.
> Knife River marked its 11th year of safety performance improvements.
> Asphalt production and asphalt oil sales increased with a push from federal stimulus spending.
> The utility operations posted record earnings.
> Growth continues despite challenging economic conditions, with this business segment now serving more than 950,000 customers.
> Montana-Dakota Utilities experienced its best safety record in company history.
> Electric generation is expanding with a heat-recovery facility, two wind farms and a partnership in a Wyoming facility.
> WBI Holdings acquired a cathodic-protection business, expanding the company’s energy services portfolio.
> Higher demand for natural gas storage services increased revenues and boosted transportation volumes to record levels.
> Williston Basin Interstate Pipeline completed its final incremental expansion of the Grasslands Pipeline, putting it at full capacity of 213,000 Mcf per day.
> Rocky Mountain Contractors finished the Glacier Wind Farm project in Ethridge, Montana.
> Desert Fire Protection completed work on the 18 million-square-foot City Center in Las Vegas.
> Capital Electric Construction keeps the lights on for the Chiefs, doing the Arrowhead Stadium renovation in Kansas City, Missouri.
> Oil production was up 11 percent, spurred by involvement in the prolific Bakken Formation.
> Fidelity Exploration & Production continues to be the largest producer of natural gas in Montana.
> Fidelity Exploration & Production ranks 52nd in total assets out of 141 American oil and gas companies.
> Fidelity Exploration & Production realized lower lease operating costs.
Revenues (millions) $439.7Earnings (millions)* $87.7Production Natural gas (Bcf) 56.6 Oil (million barrels) 3.1Proved reserves Natural gas (Bcf) 448.4 Oil (million barrels) 34.2Corporate earnings contribution 34%
* Excludes the effects of a $384.4 million after-tax noncash charge relating to the write-down of natural gas and oil properties.
Revenues (millions) $307.8Earnings (millions) $37.8Pipeline (MMdk) Transportation 163.3 Gathering 92.6Corporate earnings contribution 15%
Revenues (millions) $819.0Earnings (millions) $25.6Corporate earnings contribution 10%
Revenues (millions) $1,515.1Earnings (millions) $47.1Sales (millions) Aggregates (tons) 24.0 Asphalt (tons) 6.4 Ready-mix concrete (cubic yards) 3.0Aggregate reserves (billion tons) 1.1Corporate earnings contribution 18%
Revenues (millions) Electric $196.2 Natural gas $1,072.8Earnings (millions) Electric $24.1 Natural gas $30.8Electric sales (million kWh) Retail 2,663.5 Sales for resale 90.8Natural gas distribution (MMdk) Sales 102.7 Transportation 132.7Corporate earnings contribution Electric 9% Natural gas 12%
Company description
> Fidelity expects to invest $375 million in its business in 2010.
> The company has active drilling on 16,000 net acres of leaseholds in the Bakken Formation.
> Fidelity is pursuing additional exploratory and reserve acquisition opportunities.
> An active hedging program helps mitigate risk.
> The company is looking to increase firm deliverability and transportation capacity from its Baker storage field, the largest storage field in North America.
> The company will pursue expanding facilities and energy-related services.
> Additional natural gas takeaway capacity from the Bakken area will be pursued.
> This segment will realize even greater efficiencies and continue to enhance service levels through the ongoing integration of its four utility companies.
> Possible investments in high-voltage transmission opportunities are being considered.
> Under an agreement with the city of Billings, Montana, Montana-Dakota Utilities expects to begin extracting natural gas in 2010 from the Billings Regional Landfill to send to customers.
> The construction services segment continues to focus on improving safety.
> Rocky Mountain Contractors will begin constructing the 214-mile, 230-kilovolt Montana Alberta Tie Line transmission line.
> Renewable energy markets continue to present opportunities for the construction services segment.
> Preconstruction design-assist services add value for customers.
> Knife River is focused on expanding its Energy Services business into its existing asphalt markets.
> Public infrastructure funding is expected to be strong for the next 24 months because of stimulus spending and potential federal jobs legislation.
> Wind energy development throughout the western United States continues to present material and construction opportunities.
looking Forward Key Statistics Highlights territory
Notes:• Corporateearningscontributionpercentagesexcludetheeffectsofa$384.4millionafter-taxnoncashchargerelatingtothewrite-downofnaturalgasandoilproperties.• TheOthercategorycontributed2percentofcorporateearningswithrevenuesof$9.5millionandearningsof$7.3million.•Consolidatedrevenuesreflectintersegmenteliminationsof$183.6million.
Corporate HeadquartersMDU Resources Group, Inc. Street Address: 1200 W. Century Ave. Bismarck, ND 58503
Mailing Address: P.O. Box 5650 Bismarck, ND 58506-5650
Telephone: (701) 530-1000 Toll-Free Telephone: (866) 760-4852 www.mdu.com
The company has filed as exhibits to its Annual Report on Form 10-K the CEO and CFO certifications as required by Section 302 of the Sarbanes-Oxley Act.
The company also submitted the required annual CEO certification to the New York Stock Exchange.
Common StockMDU Resources’ common stock is listed on the NYSE under the symbol MDU. The stock began trading on the NYSE in 1948 and is included in the Standard & Poor’s MidCap 400 index. Average daily trading volume in 2009 was 909,899 shares.
Common Stock Prices High Low Close
2009 First Quarter $22.89 $12.79 $16.14Second Quarter 19.76 15.70 18.97Third Quarter 21.16 17.44 20.85Fourth Quarter 24.22 19.96 23.60
2008First Quarter $27.83 $23.08 $24.55Second Quarter 35.25 24.70 34.86Third Quarter 35.34 26.03 29.00Fourth Quarter 29.50 15.50 21.58
Dividend Reinvestment and Direct Stock Purchase PlanThe company’s plan provides interested investors the opportunity to purchase shares of the company’s common stock and to reinvest dividends without incurring brokerage commissions. For complete details, including an enrollment form, contact the stock transfer agent. Plan information also is available on the Wells Fargo Shareowner Services Web site: www.wellsfargo.com/shareownerservices.
2010 Key Dividend Dates Ex-Dividend Date Record Date Payment Date
First Quarter March 9 March 11 April 1Second Quarter June 8 June 10 July 1Third Quarter September 7 September 9 October 1Fourth Quarter December 7 December 9 January 1, 2011
Key dividend dates are subject to the discretion of the Board of Directors.
Annual MeetingTuesday, April 27, 2010 11 a.m. CDT Montana-Dakota Utilities Co. Service Center 909 Airport Road Bismarck, North Dakota
Shareholder Information and InquiriesRegistered shareholders have electronic access to their accounts by visiting www.shareowneronline.com. Shareowner Online allows shareholders to view their account balance, dividend information, reinvestment details and more. The stock transfer agent maintains stockholder account information.
Communications regarding stock transfer requirements, lost certificates, dividends or change of address should be directed to the stock transfer agent.
Company information, including financial reports, is available at www.mdu.com.
Shareholder ContactArlene Stillwell Telephone: (866) 866-8919 E-mail: [email protected]
Analyst ContactPhyllis A. Rittenbach Director of Investor Relations Telephone: (701) 530-1057 E-mail: [email protected]
Transfer Agent and Registrar for all Classes of Stock and Dividend Reinvestment PlanWells Fargo Bank, N.A. Stock Transfer Department P.O. Box 64856 St. Paul, MN 55164-0856 Telephone: (651) 450-4064 Toll-Free Telephone: (877) 536-3553 www.wellsfargo.com/shareownerservices
Transfer Agent and Registrar for Senior NotesThe Bank of New York Mellon Corporate Trust Department 101 Barclay St. — 12W New York, NY 10286
Independent AuditorsDeloitte & Touche LLP 50 S. Sixth St., Suite 2800 Minneapolis, MN 55402-1538
Note: This information is not given in connection with any sale or offer for sale or offer to buy any security.
Des
ign:
MD
U R
esou
rces
P
rintin
g: A
FPI
10%
Cert no. SCS-C0C-001834
The paper used in this annual report is certified by the Forest Stewardship Council and contains a minimum of 10 percent post-consumer recycled paper fibers.
Stockholder Information
mdu resources group, inc. 1
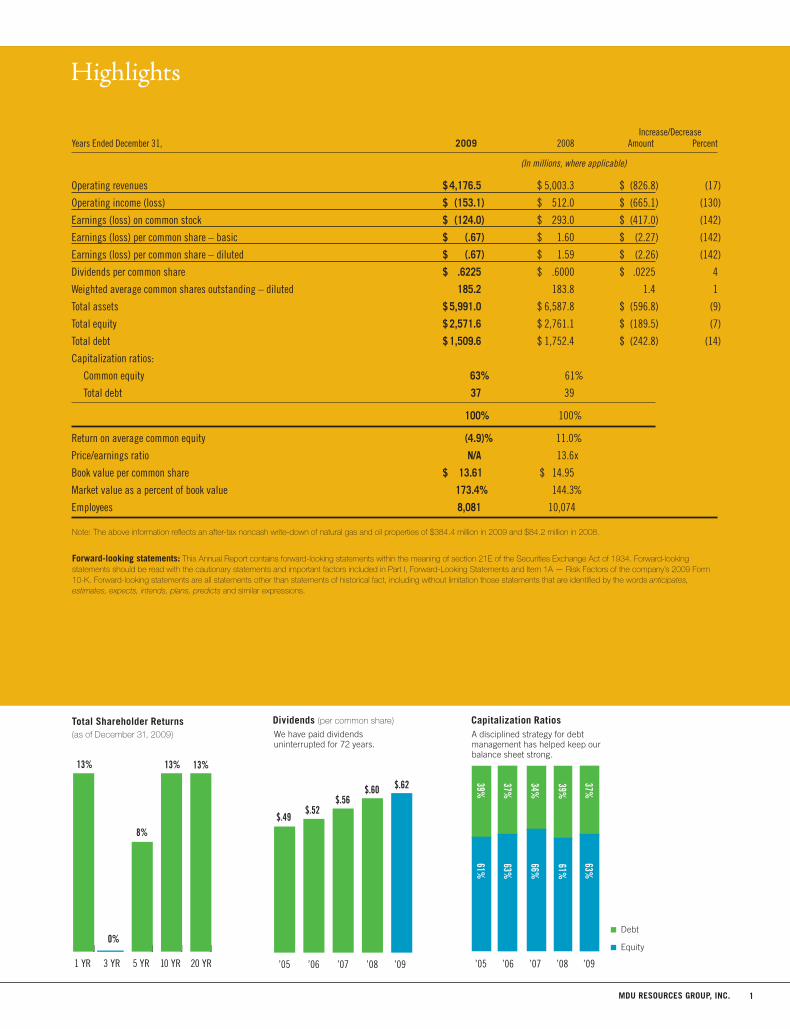
Increase/DecreaseYears Ended December 31, 2009 2008 Amount Percent
(In millions, where applicable)
Operating revenues $ 4,176.5 $ 5,003.3 $ (826.8) (17)
Operating income (loss) $ (153.1) $ 512.0 $ (665.1) (130)
Earnings (loss) on common stock $ (124.0) $ 293.0 $ (417.0) (142)
Earnings (loss) per common share – basic $ (.67) $ 1.60 $ (2.27) (142)
Earnings (loss) per common share – diluted $ (.67) $ 1.59 $ (2.26) (142)
Dividends per common share $ .6225 $ .6000 $ .0225 4
Weighted average common shares outstanding – diluted 185.2 183.8 1.4 1
Total assets $ 5,991.0 $ 6,587.8 $ (596.8) (9)
Total equity $ 2,571.6 $ 2,761.1 $ (189.5) (7)
Total debt $ 1,509.6 $ 1,752.4 $ (242.8) (14)
Capitalization ratios:
Common equity 63% 61%
Total debt 37 39
100% 100%
Return on average common equity (4.9)% 11.0%
Price/earnings ratio n/A 13.6x
Book value per common share $ 13.61 $ 14.95
Market value as a percent of book value 173.4% 144.3%
Employees 8,081 10,074
Note: The above information reflects an after-tax noncash write-down of natural gas and oil properties of $384.4 million in 2009 and $84.2 million in 2008.
Forward-looking statements: This Annual Report contains forward-looking statements within the meaning of section 21E of the Securities Exchange Act of 1934. Forward-looking statements should be read with the cautionary statements and important factors included in Part I, Forward-Looking Statements and Item 1A — Risk Factors of the company’s 2009 Form 10-K. Forward-looking statements are all statements other than statements of historical fact, including without limitation those statements that are identified by the words anticipates, estimates, expects, intends, plans, predicts and similar expressions.
Highlights
dividends (per common share)
We have paid dividends uninterrupted for 72 years.
’05 ’09’06 ’07 ’08
39%
37%
34%
39%
61%
37%63%
63%
66%
61%
’09’08’07’06’05
$.49$.52
$.56$.60 $.62
20 YR10 YR5 YR3 YR1 YR
13%
0%
8%
13% 13%
Total shareholder returns(as of December 31, 2009)
’05 ’09’06 ’07 ’08
39%
37%
34%
39%
61%
37%63%
63%
66%
61%
’09’08’07’06’05
$.49$.52
$.56$.60 $.62
20 YR10 YR5 YR3 YR1 YR
13%
0%
8%
13% 13%
capitalization ratiosA disciplined strategy for debt management has helped keep our balance sheet strong.
’05 ’09’06 ’07 ’08
39%
37%
34%
39%
61%
37%63%
63%
66%
61%
’09’08’07’06’05
$.49$.52
$.56$.60 $.62
20 YR10 YR5 YR3 YR1 YR
13%
0%
8%
13% 13%
Debt
Equity

mdu resources group, inc.2
Natural Gas and Oil Production
Electric and Natural Gas UtilitiesPipeline and Energy Services
Construction ServicesConstruction Materials and Contracting
We have just finished one of the most economically challenging years in our history. And yet, the response across our company to this adversity helped make 2009 one of our most rewarding years.
We certainly didn’t expect that this recession would turn out to be the longest and most severe in the post-World War II era. But we did recognize the signs of financial stress early, and made adjustments that have protected our balance sheet, preserved capital and kept the company strong in a very tough operating environment.
Our employees deserve much of the credit. They have responded to the challenge with an intense focus on cost savings, operating efficiencies and sacrifices, while preserving the product and service quality to which our customers are accustomed. Across the company, we have eliminated millions of dollars in capital and operating expenses.
Thanks to these efforts, we had a very good year that exceeded our initial expectations. Consolidated earnings were $260.4 million, or $1.40 per common share, excluding the effect of a $384.4 million after-tax noncash charge in the first quarter.
Including the noncash charge, we had a consolidated loss of $124 million, or 67 cents per share. The noncash charge resulted from low energy prices on March 31 at our natural gas and oil production business.
We had record operating cash flow of about $845 million, and we have a healthy balance sheet, good liquidity and good access to capital. This gives us the ability to take advantage of growth opportunities that may result from this recession, including the acquisition of businesses and natural gas, oil and aggregate reserves at attractive prices and with upside potential.
Our financial performance has been widely recognized over the years, and we added another milestone when the company earned a place (473 based on revenues) on the Fortune 500 list of America’s largest companies. More importantly, we were ranked much higher (48) for annual growth of earnings per share over the 10-year period of 1998-2008.
In November we increased the common stock dividend for the 19th consecutive year. We are very proud of this accomplishment – only a small number of publicly traded companies can match it – and of the fact that we have been paying dividends uninterrupted for 72 consecutive years. Including dividends, total shareholder return for the year was approximately 13 percent.
Longtime stockholders will notice that this document is different from past annual reports. We have reduced production costs considerably by shortening the annual report (most of the information in a traditional annual report also appears in the 10-K) and consolidating it, the 10-K and proxy into a single document. Although the space here is shortened this year, there are some events and accomplishments that we feel are important to highlight.
utility posts record earningsOur utility business had record earnings, which included a full year of earnings contribution from Intermountain Gas Company, acquired late in 2008. The acquisitions of Intermountain, and Cascade Natural Gas a year earlier, have built the business into a regional utility that serves 950,000 customers in eight states. The economic conditions in our utility service area generally remain solid, and all of the utility companies are experiencing customer growth.
For the present, one of the main priorities is integrating our four utilities to capture operating efficiencies that reduce costs and improve service to customers. This includes consolidating customer service centers into a single
Report to Stockholders

mdu resources group, inc. 3
operation, restructuring the field work force, and relocating Cascade’s headquarters to Washington’s Tri-Cities area, which is more central to its operations.
Montana-Dakota Utilities is evaluating options for long-term electricity supplies following cancellation of the Big Stone II generating project in November. The 500- to 600-megawatt plant was to have been built in South Dakota next to the existing Big Stone I plant. Construction was cancelled after Montana-Dakota and its three partners were unable to find a replacement for an additional participant that withdrew earlier in the year.
Current generating capacity and a purchased power agreement ensure an adequate electricity supply through 2015. In the meantime, the utility will install 30 megawatts of additional wind generation this year, adding to its Diamond Willow wind farm in eastern Montana and building a new wind farm in southwestern North Dakota. The utility also has installed 7.5 megawatts of renewable energy with a heat recovery unit that captures waste heat from a natural gas pipeline compressor station and converts it into electricity.
Montana-Dakota has purchased a 25 percent ownership interest in the Wygen III generating plant that is being built in northeastern Wyoming. This will replace power that currently is purchased, and will provide our Wyoming customers with reliable and competitively priced electricity well into the future.
In the third quarter we expect to complete a methane gas recovery project at the Billings, Montana, landfill that will benefit the utility’s natural gas customers as well as the environment and city.
We also continued to build on our reputation as a leader in safety. Montana-Dakota was one of two companies recognized by the American Gas Association as the industry’s safest medium-size combination utilities. Montana-Dakota and Great Plains Natural Gas finished 2009 with the best safety performance in their history.
production adjusts to commodity pricesOur production business, Fidelity Exploration & Production, implemented an aggressive cost-management strategy to counter low natural gas and oil prices. Its average realized price for natural gas declined 30 percent last year, and oil dropped 42 percent. The company cut its capital budget in half, reduced its drilling program, lowered lease operating expenses substantially, and benefitted from a strong hedging program.
As a result of the reduced activity, natural gas production declined 13 percent. Oil production increased 11 percent due to a continued focus on North Dakota’s rich Bakken region, which has become our largest oil-producing property. In just over two years, we have produced more than 1.2 million barrels of oil from our Bakken interests. The company operates 30 wells in the Bakken and has an interest in several non-operated wells.
We believe this business has excellent growth potential. In
the short term, we have designated part of our 2010 capital budget for potential reserve acquisitions that we expect may become available in this lower price environment. Over the longer term, natural gas will be a key part of the nation’s solution to energy issues such as carbon dioxide emissions. It is abundant, clean and cost-efficient, and demand for the fuel will increase. Fidelity is in a strong position to benefit, with significant natural gas reserves that are integrated with our pipeline and energy services business.
strong year for pipeline, energy services Strong demand for transportation and storage services contributed to record earnings for our pipeline and energy services group. Customers acquiring natural gas inexpensively and moving it into storage in anticipation of future price increases helped push storage volumes to a record level and contributed to record total throughput on our transportation system.
Williston Basin Interstate Pipeline owns three storage fields with a total working storage capacity of 193 billion cubic feet. The Baker field in Montana is the largest single natural gas storage reservoir in North America. The company is exploring an expansion of firm deliverability from the Baker field and related transportation capacity.
Last August, Williston Basin completed an expansion of its Grasslands Pipeline, which provides Rocky Mountain natural gas producers access to Mid-Continent markets. The pipeline is at its ultimate firm capacity of 213 million cubic feet per day.
The energy services group broadened its portfolio of services with the acquisition of Total Corrosion Solutions. This business provides solutions for detecting, preventing and controlling corrosion on metal structures for customers throughout the Pacific Northwest and Rocky Mountain regions.
economy impacts construction servicesOur construction services business was impacted by the economy, which has brought work to a standstill in the traditionally strong Las Vegas gaming market. However, the group’s equipment sales and rental business remained strong, as customers prepare for an anticipated effort to strengthen and expand the country’s aging electricity transmission infrastructure.
Our construction services business recently was awarded the engineering, procurement and construction contract to build a 214-mile high-voltage transmission line between Alberta, Canada, and Great Falls, Montana. We expect the infrastructure build-out, as well as government stimulus funding, to provide additional opportunities for our highly skilled work force.
construction materials improves earningsOur construction materials and contracting business, Knife River Corporation, increased earnings by more than 50 percent despite the continuing weakness of the national construction market. Revenue from asphalt paving and liquid

mdu resources group, inc.4
asphalt oil increased substantially, and we anticipate these product lines will provide additional opportunities in 2010 as the result of government stimulus funding for roads. The government has allocated $7.9 billion of transportation stimulus funding to states in which Knife River operates, and about 80 percent has yet to be spent.
Energy projects such as wind farms, transmission lines and refineries also present opportunities. In the meantime, the business will continue its aggressive cost management, which reduced costs by about $90 million during 2009. Knife River also will continue its successful employee safety initiative, which has resulted in safety improvements for 11 consecutive years.
new legislation is neededWe are working with industry coalitions on several pieces of federal legislation that have significant implications for our company.
One measure would renew authorization for highway funding, which expired last September. We hope this will include a spending increase, because years of underfunding have left a third of our country’s major roads in poor or mediocre condition, and more than a quarter of bridges are either structurally deficient or functionally obsolete. Transportation work represents a substantial portion of Knife River’s business.
We also support energy legislation that reduces the country’s greenhouse gas emissions. It is important to find an approach that balances the country’s environmental and economic priorities; the “cap-and-trade” legislation that has been proposed in Congress fails this test. Legislation also must allow existing forms of energy, including coal, to play a role alongside a growing supply of renewables. We are in a good position to benefit because of our experience as an operator or supplier to a wide range of energy projects, including coal, natural gas, wind, solar, geothermal and the transmission needed to carry electricity to customers.
Our utility service territory includes some of the best wind resources in the nation, but development is hindered by the lack of adequate transmission. We are investigating participation in some of these transmission projects, such as the proposed Green Power Express, a 3,000-mile
transmission line that would transport wind energy to major metropolitan markets.
We also are focusing on our commitment to use natural resources efficiently and to minimize the environmental impact of our activities. This year we will develop quantitative goals, based on available technologies, for reducing total greenhouse gas emissions from our products and operations. By year-end, we will provide a report to stockholders on our plans for achieving these goals.
Thanks to retiring directorsWe would like to express our appreciation to two longtime directors, John Olson and Sister Thomas Welder. John retired last August in accordance with the company’s bylaws, which require retirement at age 70. Sister Thomas is not seeking re-election this year because her mandatory retirement date would occur soon after the election.
During their 20-plus years on the board of directors, John and Sister Thomas have helped guide the development of our diversified business strategy. Just as important, their personal values have served as a model for the vision that guides our company: “With integrity, create superior shareholder value by expanding upon our expertise to be the supplier of choice in all of our markets while being a safe and great place to work.”
This core value of integrity also has guided us in establishing a tradition of good corporate governance throughout our history. Through the years, we have adopted governance practices that we believe are in the best interests of all our shareholders and maximize our accountability to them. Recent examples include majority voting for directors in uncontested elections, declassification of the board so that each director stands for election at each annual meeting, and separation of the chairman and chief executive positions for a more efficient leadership structure. This year, in response to a shareholder’s request, we are recommending the repeal of the supermajority vote requirements in our certificate of incorporation.
Finally, thank you for your investment in MDU Resources. Since 1992 we have completed 125 acquisitions, and have increased revenues more than tenfold. We believe the company is in a very strong financial position – balance sheet, cash flow, liquidity and access to capital – that will enable our employees to continue that extraordinary growth.
Harry J. PearceChairman of the Board
Terry D. HildestadPresident and Chief Executive Officer
February 17, 2010
Terry d. HildestadPresident and Chief Executive Officer
Harry J. pearce Chairman of the Board

mdu resources group, inc. 5
Board of Directors
Numbers indicate age and years of service ( ) on the MDU Resources Board of Directors as of December 31, 2009.
Audit committeeDennis W. Johnson, Chairman A. Bart Holaday Richard H. Lewis John K. Wilson
compensation committeeThomas Everist, Chairman Karen B. Fagg Thomas C. Knudson Patricia L. Moss
nominating and governance committeeKaren B. Fagg, Chairman Richard H. Lewis Sister Thomas Welder, O.S.B.
Harry J. Pearce67 (13)detroit, michigan
Chairman of MDU Resources Board of Directors
Retired, formerly chairman of Hughes Electronics Corp., a unit of General Motors Corp., and former vice chairman and director of GM; a director of several major corporations
expertise: Multinational business management, finance, engineering and law
Terry D. Hildestad60 (4)Bismarck, north dakota
President and Chief Executive Officer
Formerly chief operating officer of MDU Resources and formerly president and chief executive officer of Knife River Corp.
Thomas Everist60 (15)sioux Falls, south dakota
President and chairman of The Everist Co., a construction materials company; a director of several corporations
expertise: Business management, construction and sand, gravel and aggregate production
Karen B. Fagg56 (5)Billings, montana
Vice president of DOWL HKM, formerly president and majority owner of HKM Engineering Inc. and vice president of operations for Mountain States Energy Inc.; on the boards of several organizations
expertise: Engineering and business manage-ment
A. Bart Holaday67 (2)placitas, new mexico, and grand Forks, north dakota
Retired, formerly managing director of Private Markets Group of UBS Asset Management; on the boards of several organizations
expertise: Natural gas and oil industry, business development, finance and law
Dennis W. Johnson60 (9)dickinson, north dakota
Chairman and chief executive officer of TMI Systems Design Corp., a custom institutional furniture manufacturer; a former director of Federal Reserve Bank of Minneapolis
expertise: Business management, engineering and finance
Thomas C. Knudson63 (2)Houston, Texas
President of Tom Knudson Interests LLC, providing consulting services in energy, sustainable development and leadership; former senior vice president of human resources, information management and communications of ConocoPhillips
expertise: Natural gas and oil industry, sustainable development and engineering
Richard H. Lewis60 (5)denver, colorado
Founder and former chairman, president and chief executive officer of Prima Energy Corp., a natural gas and oil exploration and production company, and chairman of Entre Pure Industries Inc., a privately held purified water and ice business; a board member of Colorado Oil and Gas Association and a director of Colorado State Bank and Trust
expertise: Natural gas and oil industry
Patricia L. Moss56 (7)Bend, oregon
President, chief executive officer and a director of Cascade Bancorp and Bank of the Cascades; a director of several corporations
expertise: Finance and human resources
Sister Thomas Welder, O.S.B.69 (22)Bismarck, north dakota
President emeritus of University of Mary; a director of several organizations
expertise: Business development and management
John K. Wilson55 (7)omaha, nebraska
President of Durham Resources, LLC, a privately held financial management company, and president of Durham Foundation; a director of a mutual fund
expertise: Finance and natural gas industry

mdu resources group, inc.6
Corporate Management
Numbers indicate age and years of service ( ) as of December 31, 2009.
other corporate and senior company officersnicole A. Kivisto, 36 (14)Vice President, Controller and Chief Accounting Officer, MDU Resources
douglass A. mahowald, 60 (27)Treasurer, MDU Resources
John p. stumpf, 50 (17)Vice President of Strategic Planning, MDU Resources
William e. connors, 48 (5)Vice President of Renewable Resources, MDU Resources
management changesVernon A. raile, executive vice president, treasurer and chief financial officer of MDU Resources, retired effective February 16, 2010.
doran n. schwartz was named vice president and chief financial officer effective February 17, 2010.
nicole A. Kivisto was named vice president, controller and chief accounting officer effective February 17, 2010.
douglass A. mahowald was named treasurer effective February 17, 2010.
Terry D. Hildestad60 (35)President and Chief Executive Officer, MDU Resources
Serves on the company’s Board of Directors and as chairman of the board of all major subsidiary companies; formerly chief operating officer of MDU Resources and formerly president and chief executive officer of Knife River Corp.
Steven L. Bietz51 (29)President and Chief Executive Officer, WBI Holdings Inc.
Formerly held executive and management positions with WBI Holdings
Mark Del Vecchio50 (6)Vice President of Human Resources, MDU Resources
Formerly director of compensation and executive programs of MDU Resources
David L. Goodin48 (26)President and Chief Executive Officer, Montana-Dakota Utilities Co., Great Plains Natural Gas Co., Cascade Natural Gas Corp. and Intermountain Gas Co.
Formerly executive vice president of operations and acquisitions with Montana-Dakota
John G. Harp57 (34)President and Chief Executive Officer, MDU Construction Services Group Inc.
Formerly owned construction services companies that were acquired by MDU Resources
Cynthia J. Norland55 (25)Vice President of Administration, MDU Resources
Formerly associate general counsel of MDU Resources
Doran N. Schwartz40 (5) Vice President and Chief Financial Officer, MDU Resources
Serves as the senior financial officer and member of the boards of directors of all major subsidiary companies; formerly chief accounting officer of MDU Resources
Paul K. Sandness55 (29)General Counsel and Secretary, MDU Resources
Serves as general counsel and secretary of all major subsidiary companies; formerly senior attorney and held other positions of increasing responsibility with MDU Resources
William E. Schneider61 (16)President and Chief Executive Officer, Knife River Corp.
Serves as chief executive officer of all construction materials and contracting subsidiaries of Knife River; formerly senior vice president of construction materials of Knife River
mdu resources group, inc. 7
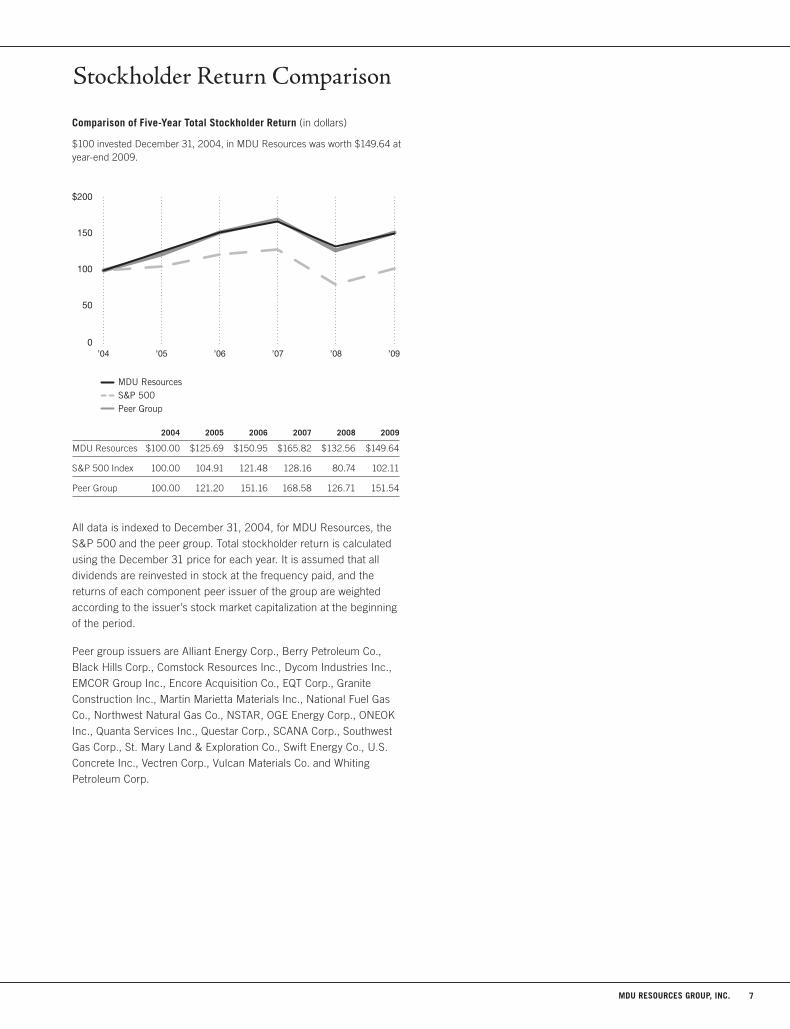
All data is indexed to December 31, 2004, for MDU Resources, the
S&P 500 and the peer group. Total stockholder return is calculated
using the December 31 price for each year. It is assumed that all
dividends are reinvested in stock at the frequency paid, and the
returns of each component peer issuer of the group are weighted
according to the issuer’s stock market capitalization at the beginning
of the period.
Peer group issuers are Alliant Energy Corp., Berry Petroleum Co.,
Black Hills Corp., Comstock Resources Inc., Dycom Industries Inc.,
EMCOR Group Inc., Encore Acquisition Co., EQT Corp., Granite
Construction Inc., Martin Marietta Materials Inc., National Fuel Gas
Co., Northwest Natural Gas Co., NSTAR, OGE Energy Corp., ONEOK
Inc., Quanta Services Inc., Questar Corp., SCANA Corp., Southwest
Gas Corp., St. Mary Land & Exploration Co., Swift Energy Co., U.S.
Concrete Inc., Vectren Corp., Vulcan Materials Co. and Whiting
Petroleum Corp.
2004 2005 2006 2007 2008 2009
MDU Resources $100.00 $125.69 $150.95 $165.82 $132.56 $149.64
S&P 500 Index 100.00 104.91 121.48 128.16 80.74 102.11
Peer Group 100.00 121.20 151.16 168.58 126.71 151.54
comparison of Five-Year Total stockholder return (in dollars)
$100 invested December 31, 2004, in MDU Resources was worth $149.64 at year-end 2009.
0
50
100
150
200Peer
S&P
MDU
200920082007200620052004
50
0
100
150
$200
50
0
100
150
$200
’09’08’07’06’05’04
’09’08’07’06’05’04
MDU ResourcesS&P 500Peer Group
MDU ResourcesS&P 500Peer Group
Stockholder Return Comparison

mdu resources group, inc.8

UNITED STATES SECURITIES AND EXCHANGE COMMISSIONWASHINGTON, D.C. 20549
FORM 10-K
� ANNUAL REPORT PURSUANT TO SECTION 13 OR 15(d) OF THE SECURITIES EXCHANGE ACT OF 1934 For the fiscal year ended December 31, 2009
OR
� TRANSITION REPORT PURSUANT TO SECTION 13 OR 15(d) OF THE SECURITIES EXCHANGE ACT OF 1934
For the transition period from _______________ to _______________
Commission file number 1-3480
MDU RESOURCES GROUP, INC.(Exact name of registrant as specified in its charter)
Delaware 41-0423660(State or other jurisdiction of (I.R.S. Employer Identification No.)incorporation or organization)
1200 West Century AvenueP.O. Box 5650
Bismarck, North Dakota 58506-5650(Address of principal executive offices)
(Zip Code)
(701) 530-1000(Registrant’s telephone number, including area code)
Securities registered pursuant to Section 12(b) of the Act:
Title of each class Name of each exchange on which registeredCommon Stock, par value $1.00 New York Stock Exchange
Securities registered pursuant to Section 12 (g) of the Act:
Preferred Stock, par value $100(Title of Class)
Indicate by check mark if the registrant is a well-known seasoned issuer, as defined in Rule 405 of the Securities Act. Yes � No �.
Indicate by check mark if the registrant is not required to file reports pursuant to Section 13 or Section 15(d) of the Exchange Act. Yes � No �.
Indicate by check mark whether the registrant (1) has filed all reports required to be filed by Section 13 or 15(d) of the Securities Exchange Act of1934 during the preceding 12 months (or for such shorter period that the registrant was required to file such reports), and (2) has been subject tosuch filing requirements for the past 90 days. Yes � No �.
Indicate by check mark whether the registrant has submitted electronically and posted on its corporate Web site, if any, every Interactive Data Filerequired to be submitted and posted pursuant to Rule 405 of Regulation S-T during the preceding 12 months (or for such shorter period that theregistrant was required to submit and post such files). Yes � No �.
Indicate by check mark if disclosure of delinquent filers pursuant to Item 405 of Regulation S-K is not contained herein, and will not be contained,to the best of the registrant’s knowledge, in definitive proxy or information statements incorporated by reference in Part III of this Form 10-K or anyamendment to this Form 10-K. �
Indicate by check mark whether the registrant is a large accelerated filer, an accelerated filer, a non-accelerated filer, or a smaller reportingcompany. See the definitions of “large accelerated filer,” “accelerated filer” and “smaller reporting company” in Rule 12b-2 of the Exchange Act(Check one):
Large accelerated filer � Accelerated filer � Non-accelerated filer � Smaller reporting company �
(Do not check if a smaller reporting company)
Indicate by check mark whether the registrant is a shell company (as defined in Rule 12b-2 of the Act). Yes � No �.
State the aggregate market value of the voting common stock held by nonaffiliates of the registrant as of June 30, 2009: $3,489,895,496.
Indicate the number of shares outstanding of each of the registrant’s classes of common stock, as of February 2, 2010: 187,863,394 shares.
DOCUMENTS INCORPORATED BY REFERENCEPortions of the registrant’s 2010 Proxy Statement are incorporated by reference in Part III, Items 10, 11, 12, 13 and 14 of this Report.
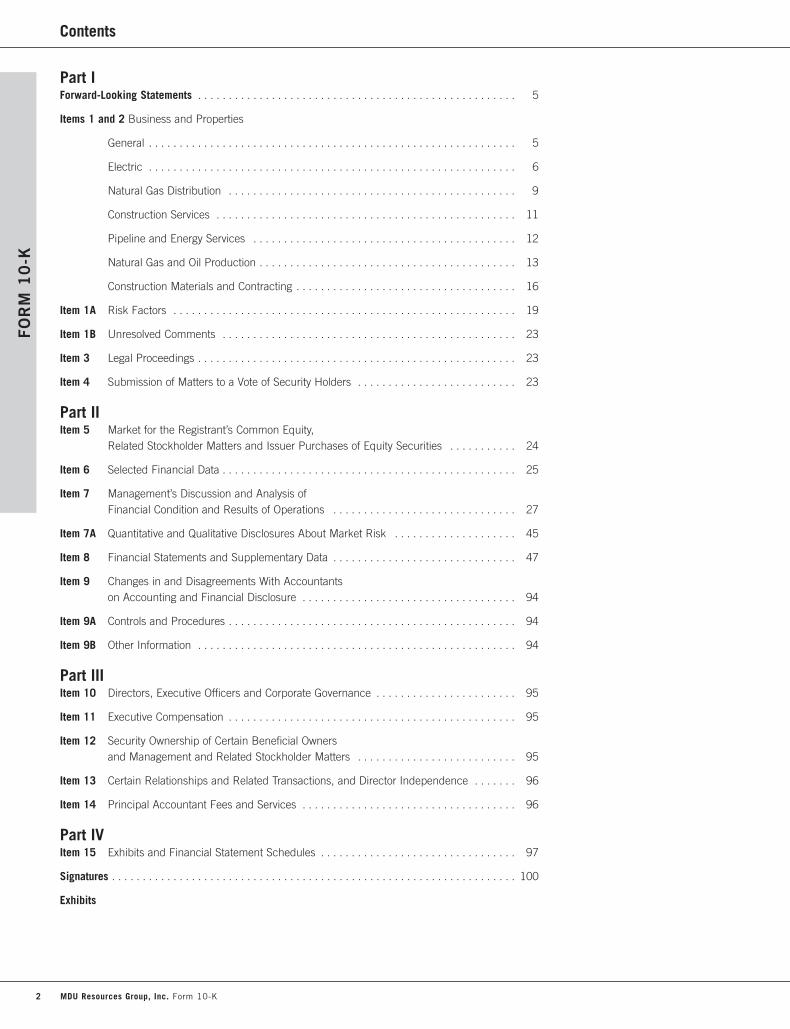
Contents
Part IForward-Looking Statements . . . . . . . . . . . . . . . . . . . . . . . . . . . . . . . . . . . . . . . . . . . . . . . . . . . . 5
Items 1 and 2 Business and Properties
General . . . . . . . . . . . . . . . . . . . . . . . . . . . . . . . . . . . . . . . . . . . . . . . . . . . . . . . . . . . . 5
Electric . . . . . . . . . . . . . . . . . . . . . . . . . . . . . . . . . . . . . . . . . . . . . . . . . . . . . . . . . . . . 6
Natural Gas Distribution . . . . . . . . . . . . . . . . . . . . . . . . . . . . . . . . . . . . . . . . . . . . . . . 9
Construction Services . . . . . . . . . . . . . . . . . . . . . . . . . . . . . . . . . . . . . . . . . . . . . . . . . 11
Pipeline and Energy Services . . . . . . . . . . . . . . . . . . . . . . . . . . . . . . . . . . . . . . . . . . . 12
Natural Gas and Oil Production . . . . . . . . . . . . . . . . . . . . . . . . . . . . . . . . . . . . . . . . . . 13
Construction Materials and Contracting . . . . . . . . . . . . . . . . . . . . . . . . . . . . . . . . . . . . 16
Item 1A Risk Factors . . . . . . . . . . . . . . . . . . . . . . . . . . . . . . . . . . . . . . . . . . . . . . . . . . . . . . . . 19
Item 1B Unresolved Comments . . . . . . . . . . . . . . . . . . . . . . . . . . . . . . . . . . . . . . . . . . . . . . . . 23
Item 3 Legal Proceedings . . . . . . . . . . . . . . . . . . . . . . . . . . . . . . . . . . . . . . . . . . . . . . . . . . . . 23
Item 4 Submission of Matters to a Vote of Security Holders . . . . . . . . . . . . . . . . . . . . . . . . . . 23
Part IIItem 5 Market for the Registrant’s Common Equity,
Related Stockholder Matters and Issuer Purchases of Equity Securities . . . . . . . . . . . 24
Item 6 Selected Financial Data . . . . . . . . . . . . . . . . . . . . . . . . . . . . . . . . . . . . . . . . . . . . . . . . 25
Item 7 Management’s Discussion and Analysis of Financial Condition and Results of Operations . . . . . . . . . . . . . . . . . . . . . . . . . . . . . . 27
Item 7A Quantitative and Qualitative Disclosures About Market Risk . . . . . . . . . . . . . . . . . . . . 45
Item 8 Financial Statements and Supplementary Data . . . . . . . . . . . . . . . . . . . . . . . . . . . . . . 47
Item 9 Changes in and Disagreements With Accountants on Accounting and Financial Disclosure . . . . . . . . . . . . . . . . . . . . . . . . . . . . . . . . . . . 94
Item 9A Controls and Procedures . . . . . . . . . . . . . . . . . . . . . . . . . . . . . . . . . . . . . . . . . . . . . . . 94
Item 9B Other Information . . . . . . . . . . . . . . . . . . . . . . . . . . . . . . . . . . . . . . . . . . . . . . . . . . . . 94
Part IIIItem 10 Directors, Executive Officers and Corporate Governance . . . . . . . . . . . . . . . . . . . . . . . 95
Item 11 Executive Compensation . . . . . . . . . . . . . . . . . . . . . . . . . . . . . . . . . . . . . . . . . . . . . . . 95
Item 12 Security Ownership of Certain Beneficial Owners and Management and Related Stockholder Matters . . . . . . . . . . . . . . . . . . . . . . . . . . 95
Item 13 Certain Relationships and Related Transactions, and Director Independence . . . . . . . 96
Item 14 Principal Accountant Fees and Services . . . . . . . . . . . . . . . . . . . . . . . . . . . . . . . . . . . 96
Part IVItem 15 Exhibits and Financial Statement Schedules . . . . . . . . . . . . . . . . . . . . . . . . . . . . . . . . 97
Signatures . . . . . . . . . . . . . . . . . . . . . . . . . . . . . . . . . . . . . . . . . . . . . . . . . . . . . . . . . . . . . . . . . . 100
Exhibits
2 MDU Resources Group, Inc. Form 10-K
FO
RM
10
-K

Definitions
The following abbreviations and acronyms used in this Form 10-Kare defined below:
Abbreviation or AcronymAFUDC Allowance for funds used during
construction
ALJ Administrative Law Judge
Alusa Tecnica de Engenharia Electrica – Alusa
Army Corps U.S. Army Corps of Engineers
ASC FASB Accounting Standards Codification
Bbl Barrel
Bcf Billion cubic feet
BER Montana Board of Environmental Review
Big Stone Station 450-MW coal-fired electric generatingfacility near Big Stone City, South Dakota(22.7 percent ownership)
Big Stone Station II Formerly proposed coal-fired electricgenerating facility near Big Stone City,South Dakota (the Company hadanticipated ownership of at least 116MW)
Bitter Creek Bitter Creek Pipelines, LLC, an indirectwholly owned subsidiary of WBIHoldings
Black Hills Power Black Hills Power and Light Company
Brazilian Transmission Lines Company’s equity method investmentin companies owning ECTE, ENTEand ERTE
Btu British thermal unit
Cascade Cascade Natural Gas Corporation, anindirect wholly owned subsidiary of MDUEnergy Capital
CBNG Coalbed natural gas
CELESC Centrais Elétricas de Santa Catarina S.A.
CEM Colorado Energy Management, LLC,a former direct wholly owned subsidiaryof Centennial Resources (sold in thethird quarter of 2007)
CEMIG Companhia Energética de Minas Gerais
Centennial Centennial Energy Holdings, Inc.,a direct wholly owned subsidiary ofthe Company
Centennial Capital Centennial Holdings Capital LLC,a direct wholly owned subsidiary ofCentennial
Centennial International Centennial Energy ResourcesInternational, Inc., a direct wholly ownedsubsidiary of Centennial Resources
Centennial Power Centennial Power, Inc., a former directwholly owned subsidiary of CentennialResources (sold in the third quarterof 2007)
Centennial Resources Centennial Energy Resources LLC,a direct wholly owned subsidiary ofCentennial
CERCLA Comprehensive EnvironmentalResponse, Compensation andLiability Act
Clean Air Act Federal Clean Air Act
Clean Water Act Federal Clean Water Act
Company MDU Resources Group, Inc.
D.C. Appeals Court U.S. Court of Appeals for the District ofColumbia Circuit
dk Decatherm
ECTE Empresa Catarinense de Transmissão deEnergia S.A.
EIS Environmental Impact Statement
ENTE Empresa Norte de Transmissão deEnergia S.A.
EPA U.S. Environmental Protection Agency
ERTE Empresa Regional de Transmissão deEnergia S.A.
ESA Endangered Species Act
Exchange Act Securities Exchange Act of 1934, asamended
FASB Financial Accounting Standards Board
FERC Federal Energy Regulatory Commission
Fidelity Fidelity Exploration & ProductionCompany, a direct wholly owned subsidiary of WBI Holdings
GAAP Accounting principles generallyaccepted in the United States ofAmerica
GHG Greenhouse gas
Great Plains Great Plains Natural Gas Co., a publicutility division of the Company
Hartwell Hartwell Energy Limited Partnership, aformer equity method investment of theCompany (sold in the third quarter of2007)
IBEW International Brotherhood of ElectricalWorkers
ICWU International Chemical Workers Union
Indenture Indenture dated as of December 15,2003, as supplemented, from theCompany to The Bank of New York asTrustee
Innovatum Innovatum, Inc., a former indirect whollyowned subsidiary of WBI Holdings (thestock and Innovatum’s assets have beensold)
Intermountain Intermountain Gas Company, an indirectwholly owned subsidiary of MDU EnergyCapital (acquired October 1, 2008)
IPUC Idaho Public Utilities Commission
Item 8 Financial Statements andSupplementary Data
Kennecott Kennecott Coal Sales Company
Knife River Knife River Corporation, a direct whollyowned subsidiary of Centennial
K-Plan Company’s 401(k) Retirement Plan
kW Kilowatts
kWh Kilowatt-hour
LTM LTM, Inc., an indirect wholly ownedsubsidiary of Knife River
LPP Lea Power Partners, LLC, a formerindirect wholly owned subsidiary ofCentennial Resources (member interestswere sold in October 2006)
MDU Resources Group, Inc. Form 10-K 3
FO
RM
10
-K

Definitions
LWG Lower Willamette Group
MAPP Mid-Continent Area Power Pool
MBbls Thousands of barrels
MBI Morse Bros., Inc., an indirect whollyowned subsidiary of Knife River
MBOGC Montana Board of Oil and GasConservation
Mcf Thousand cubic feet
MD&A Management’s Discussion and Analysisof Financial Condition and Results ofOperations
Mdk Thousand decatherms
MDU Brasil MDU Brasil Ltda., an indirect whollyowned subsidiary of CentennialInternational
MDU Construction Services MDU Construction Services Group, Inc.,a direct wholly owned subsidiary ofCentennial
MDU Energy Capital MDU Energy Capital, LLC, a directwholly owned subsidiary of the Company
MEIC Montana Environmental InformationCenter, Inc.
Midwest ISO Midwest Independent TransmissionSystem Operator, Inc.
MMBtu Million Btu
MMcf Million cubic feet
MMcfe Million cubic feet equivalent – naturalgas equivalents are determined usingthe ratio of six Mcf of natural gas to oneBbl of oil
MMdk Million decatherms
MNPUC Minnesota Public Utilities Commission
Montana-Dakota Montana-Dakota Utilities Co., a publicutility division of the Company
Montana DEQ Montana State Department ofEnvironmental Quality
Montana First Judicial Montana First Judicial District Court, District Court Lewis and Clark County
Montana Twenty-Second Montana Twenty-Second Judicial District Judicial District Court Court, Big Horn County
Mortgage Indenture of Mortgage dated May 1,1939, as supplemented, amended andrestated, from the Company to The Bankof New York and Douglas J. MacInnes,successor trustees
MPX MPX Termoceara Ltda. (49 percentownership, sold in June 2005)
MTPSC Montana Public Service Commission
MW Megawatt
NDPSC North Dakota Public ServiceCommission
NEPA National Environmental Policy Act
North Dakota District Court North Dakota South Central JudicialDistrict Court for Burleigh County
NPRC Northern Plains Resource Council
NSPS New Source Performance Standards
Oil Includes crude oil, condensate andnatural gas liquids
OPUC Oregon Public Utilities Commission
Order on Rehearing Order on Rehearing and Complianceand Remanding Certain Issues forHearing
Oregon DEQ Oregon State Department ofEnvironmental Quality
PCBs Polychlorinated biphenyls
Prairielands Prairielands Energy Marketing, Inc.,an indirect wholly owned subsidiary ofWBI Holdings
PRP Potentially Responsible Party
Proxy Statement Company’s 2010 Proxy Statement
PSD Prevention of Significant Deterioration
RCRA Resource Conservation andRecovery Act
ROD Record of Decision
SDPUC South Dakota Public UtilitiesCommission
SEC U.S. Securities and ExchangeCommission
SEC Defined Prices The average price of natural gas and oilduring the applicable 12-month period,determined as an unweighted arithmeticaverage of the first-day-of-the-monthprice for each month within such period,unless prices are defined by contractualarrangements, excluding escalationsbased upon future conditions
Securities Act Securities Act of 1933, as amended
Securities Act Industry Guide 7 Description of Property by IssuersEngaged or to be Engaged in SignificantMining Operations
Sheridan System A separate electric system owned byMontana-Dakota
SMCRA Surface Mining Control and ReclamationAct
South Dakota Federal U.S. District Court for the District of District Court South Dakota
South Dakota SIP South Dakota State Implementation Plan
Stock Purchase Plan Company’s Dividend Reinvestment andDirect Stock Purchase Plan
TRWUA Tongue River Water Users’ Association
UA United Association of Journeyman andApprentices of the Plumbing andPipefitting Industry of the United Statesand Canada
WBI Holdings WBI Holdings, Inc., a direct whollyowned subsidiary of Centennial
Westmoreland Westmoreland Coal Company
Williston Basin Williston Basin Interstate PipelineCompany, an indirect wholly ownedsubsidiary of WBI Holdings
WUTC Washington Utilities and TransportationCommission
WYPSC Wyoming Public Service Commission
4 MDU Resources Group, Inc. Form 10-K
FO
RM
10
-K
Part IFO
RM
10
-K
Forward-Looking Statements
This Form 10-K contains forward-looking statements within the meaning of Section 21E of the Exchange Act. Forward-lookingstatements are all statements other than statements of historical fact, including without limitation those statements that are identifiedby the words “anticipates,” “estimates,” “expects,” “intends,” “plans,” “predicts” and similar expressions, and include statementsconcerning plans, objectives, goals, strategies, future events or performance, and underlying assumptions (many of which are based,in turn, upon further assumptions) and other statements that are other than statements of historical facts. From time to time, theCompany may publish or otherwise make available forward-looking statements of this nature, including statements contained withinItem 7 – MD&A – Prospective Information.
Forward-looking statements involve risks and uncertainties, which could cause actual results or outcomes to differ materially from thoseexpressed. The Company’s expectations, beliefs and projections are expressed in good faith and are believed by the Company to have areasonable basis, including without limitation, management’s examination of historical operating trends, data contained in the Company’srecords and other data available from third parties. Nonetheless, the Company’s expectations, beliefs or projections may not be achievedor accomplished.
Any forward-looking statement contained in this document speaks only as of the date on which the statement is made, and the Companyundertakes no obligation to update any forward-looking statement or statements to reflect events or circumstances that occur after thedate on which the statement is made or to reflect the occurrence of unanticipated events. New factors emerge from time to time, and itis not possible for management to predict all of the factors, nor can it assess the effect of each factor on the Company’s business or theextent to which any factor, or combination of factors, may cause actual results to differ materially from those contained in any forward-looking statement. All forward-looking statements, whether written or oral and whether made by or on behalf of the Company, are expresslyqualified by the risk factors and cautionary statements in this Form 10-K, including statements contained within Item 1A – Risk Factors.
Items 1 and 2. Business and Properties
GeneralThe Company is a diversified natural resource company, which was incorporated under the laws of the state of Delaware in 1924.Its principal executive offices are at 1200 West Century Avenue, P.O. Box 5650, Bismarck, North Dakota 58506-5650, telephone(701) 530-1000.
Montana-Dakota, through the electric and natural gas distribution segments, generates, transmits and distributes electricity and distributesnatural gas in Montana, North Dakota, South Dakota and Wyoming. Cascade distributes natural gas in Oregon and Washington.Intermountain distributes natural gas in Idaho. Great Plains distributes natural gas in western Minnesota and southeastern North Dakota.These operations also supply related value-added products and services.
The Company, through its wholly owned subsidiary, Centennial, owns WBI Holdings (comprised of the pipeline and energy services andthe natural gas and oil production segments), Knife River (construction materials and contracting segment), MDU Construction Services(construction services segment), Centennial Resources and Centennial Capital (both reflected in the Other category).
The Company’s equity method investment in the Brazilian Transmission Lines, as discussed in Item 8 – Note 4, is reflected in theOther category.
As of December 31, 2009, the Company had 8,081 employees with 158 employed at MDU Resources Group, Inc., 874 at Montana-Dakota, 31 at Great Plains, 329 at Cascade, 264 at Intermountain, 603 at WBI Holdings, 2,879 at Knife River and 2,943 atMDU Construction Services. The number of employees at certain Company operations fluctuates during the year depending upon thenumber and size of construction projects. The Company considers its relations with employees to be satisfactory.
At Montana-Dakota and Williston Basin, 365 and 80 employees, respectively, are represented by the IBEW. Labor contracts with suchemployees are in effect through May 30, 2011, and March 31, 2011, for Montana-Dakota and Williston Basin, respectively.
At Cascade, 201 employees are represented by the ICWU. The labor contract with the field operations group, consisting of 169 employees,is effective through April 1, 2012. Cascade has an agreement with the bargaining unit consisting of 32 customer service representativesand credit and collections clerks in effect through March 19, 2011.
MDU Resources Group, Inc. Form 10-K 5

Part I
At Intermountain, 114 employees are represented by the UA. Labor contracts with such employees are in effect throughSeptember 30, 2010.
Knife River has 43 labor contracts that represent approximately 440 of its construction materials employees. Knife River is in negotiationson five of its labor contracts.
MDU Construction Services has 126 labor contracts representing the majority of its employees. The majority of the labor contracts containprovisions that prohibit work stoppages or strikes and provide for binding arbitration dispute resolution in the event of an extendeddisagreement.
The Company’s principal properties, which are of varying ages and are of different construction types, are generally in good condition,are well maintained and are generally suitable and adequate for the purposes for which they are used.
The financial results and data applicable to each of the Company’s business segments, as well as their financing requirements, are setforth in Item 7 – MD&A and Item 8 – Note 15 and Supplementary Financial Information.
The operations of the Company and certain of its subsidiaries are subject to federal, state and local laws and regulations providing for air,water and solid waste pollution control; state facility-siting regulations; zoning and planning regulations of certain state and local authorities;federal health and safety regulations and state hazard communication standards. The Company believes that it is in substantialcompliance with these regulations, except as to what may be ultimately determined with regard to items discussed in Environmentalmatters in Item 8 – Note 19. There are no pending CERCLA actions for any of the Company’s properties, other than the Portland, Oregon,Harbor Superfund Site.
The Company produces GHG emissions primarily from its fossil fuel electric generating facilities, as well as from natural gas pipelineand storage systems, operations of equipment and fleet vehicles, and oil and natural gas exploration and development activities. GHGemissions also result from customer use of natural gas for heating and other uses. As concern for reductions in GHG emissions andexpansion of renewable energy resources has increased, the Company has placed an increasing emphasis on developing renewablegeneration resources. Governmental legislative and regulatory initiatives regarding environmental and energy policy are continuouslyevolving and could negatively impact the Company’s operations and financial results. Until legislation and regulation are finalized, theimpact of these measures cannot be accurately predicted. The Company will continue to monitor legislative activity related toenvironmental and energy policy initiatives. Disclosure regarding specific environmental matters applicable to each of the Company’sbusinesses is set forth under each business description later.
This annual report on Form 10-K, the Company’s quarterly reports on Form 10-Q, the Company’s current reports on Form 8-K and anyamendments to those reports filed or furnished pursuant to Section 13(a) or 15(d) of the Exchange Act are available free of charge throughthe Company’s Web site as soon as reasonably practicable after the Company has electronically filed such reports with, or furnished suchreports to, the SEC. The Company’s Web site address is www.mdu.com. The information available on the Company’s Web site is not part ofthis annual report on Form 10-K.
ElectricGeneral Montana-Dakota provides electric service at retail, serving more than 122,000 residential, commercial, industrial and municipalcustomers in 177 communities and adjacent rural areas as of December 31, 2009. The principal properties owned by Montana-Dakota foruse in its electric operations include interests in nine electric generating facilities, as further described under System Supply, SystemDemand and Competition, and approximately 3,000 and 4,600 miles of transmission and distribution lines, respectively. Montana-Dakotahas obtained and holds, or is in the process of renewing, valid and existing franchises authorizing it to conduct its electric operations in allof the municipalities it serves where such franchises are required. Montana-Dakota intends to protect its service area and seek renewal ofall expiring franchises. As of December 31, 2009, Montana-Dakota’s net electric plant investment approximated $514.5 million.
The percentage of Montana-Dakota’s 2009 retail electric utility operating revenues by jurisdiction is as follows: North Dakota – 58 percent;Montana – 24 percent; Wyoming – 11 percent; and South Dakota – 7 percent. Retail electric rates, service, accounting and certainsecurity issuances are subject to regulation by the NDPSC, MTPSC, SDPUC and WYPSC. The interstate transmission and wholesaleelectric power operations of Montana-Dakota also are subject to regulation by the FERC under provisions of the Federal Power Act, as areinterconnections with other utilities and power generators, the issuance of securities, accounting and other matters. Montana-Dakotaparticipates in the Midwest ISO wholesale energy and ancillary services market. The Midwest ISO is a regional transmission organizationresponsible for operational control of the transmission systems of its members. The Midwest ISO provides security center operations, tariff
FO
RM
10
-K
6 MDU Resources Group, Inc. Form 10-K

Part IFO
RM
10
-K
administration and operates day-ahead and real-time energy markets and an ancillary services market. As a member of Midwest ISO,Montana-Dakota’s generation is sold into the Midwest ISO energy market and its energy needs are purchased from that market.
System Supply, System Demand and Competition Through an interconnected electric system, Montana-Dakota serves markets inportions of western North Dakota, including Bismarck, Dickinson and Williston; eastern Montana, including Glendive and Miles City; andnorthern South Dakota, including Mobridge. The interconnected system consists of nine electric generating facilities, which have anaggregate nameplate rating attributable to Montana-Dakota’s interest of 463,055 kW and a total summer net capability of 486,900 kW.Montana-Dakota’s four principal generating stations are steam-turbine generating units using coal for fuel. The nameplate rating forMontana-Dakota’s ownership interest in these four stations (including interests in the Big Stone Station and the Coyote Station,aggregating 22.7 percent and 25.0 percent, respectively) is 327,758 kW. Three combustion turbine peaking stations, a wind electricgenerating facility and a heat recovery electric generating facility supply the balance of Montana-Dakota’s interconnected system electricgenerating capability.
In September 2005, Montana-Dakota entered into a contract for seasonal capacity from a neighboring utility, starting at 85 MW in 2007,increasing to 105 MW in 2011, with an option for capacity in 2012. In April 2007, Montana-Dakota entered into a contract for seasonalcapacity of 10 MW in May through October of each year continuing through 2010. In August 2009, Montana-Dakota entered into acontract for capacity of 110 MW, 115 MW and 120 MW annually for the three-year period from June 1 to May 31, 2013, 2014 and 2015,respectively. Energy also will be purchased as needed from the Midwest ISO market. In 2009, Montana-Dakota purchased approximately17 percent of its net kWh needs for its interconnected system through the Midwest ISO market.
The following table sets forth details applicable to the Company’s electric generating stations:
2009 NetNameplate Summer Generation
Rating Capability (kWh inGenerating Station Type (kW) (kW) thousands)
North Dakota:Coyote* Steam 103,647 106,750 625,979Heskett Steam 86,000 102,730 556,757Williston Combustion Turbine 7,800 9,600 (81)**Glen Ullin Heat Recovery 7,500 *** 10,271
South Dakota:Big Stone* Steam 94,111 107,500 624,595
Montana:Lewis & Clark Steam 44,000 52,300 316,532Glendive Combustion Turbine 77,347 79,610 1,950Miles City Combustion Turbine 23,150 24,500 (28)**Diamond Willow Wind 19,500 3,910 67,690
463,055 486,900 2,203,665
* Reflects Montana-Dakota’s ownership interest.** Station use, to meet MAPP’s accreditation requirements, exceeded generation.
*** Pending accreditation.
Virtually all of the current fuel requirements of the Coyote, Heskett and Lewis & Clark stations are met with coal supplied by subsidiaries ofWestmoreland under contracts that expire in May 2016, April 2011 and December 2012, respectively. The Coyote coal supply agreementprovides for the purchase of coal necessary to supply the coal requirements of the Coyote Station or 30,000 tons per week, whichever maybe the greater quantity at contracted pricing. The maximum quantity of coal during the term of the agreement, and any extension, is75 million tons. The Heskett and Lewis & Clark coal supply agreements provide for the purchase of coal necessary to supply the coalrequirements of these stations at contracted pricing. Montana-Dakota estimates the Heskett and Lewis & Clark coal requirement to be inthe range of 500,000 to 600,000 tons, and 250,000 to 350,000 tons per contract year, respectively.
Montana-Dakota has a coal supply agreement, which meets the majority of the Big Stone Station’s fuel requirements, for the purchase of1.0 million tons of coal in 2010 with Kennecott at contracted pricing.
MDU Resources Group, Inc. Form 10-K 7

Part I
The average cost of coal purchased, including freight, at Montana-Dakota’s electric generating stations (including the Big Stone andCoyote stations) was as follows:
Years ended December 31, 2009 2008 2007
Average cost of coal per MMBtu $ 1.52 $ 1.49 $ 1.29Average cost of coal per ton $22.05 $21.45 $18.71
The maximum electric peak demand experienced to date attributable to sales to retail customers on the interconnected system was525,643 kW in July 2007. Montana-Dakota’s latest forecast for its interconnected system indicates that its annual peak will continue tooccur during the summer and the peak demand growth rate through 2015 will approximate two percent annually.
Montana-Dakota expects that it has secured adequate capacity available through existing baseload generating stations, renewablegeneration, turbine peaking stations, demand reduction programs and firm contracts to meet the peak customer demand requirements ofits customers through mid-2015. Future capacity that is needed to replace contracts and meet system growth requirements is expected tobe met by constructing new generation resources or acquiring additional capacity through power contracts. For additional informationregarding potential power generation projects, see Item 7 – MD&A – Prospective Information – Electric.
Montana-Dakota has major interconnections with its neighboring utilities and considers these interconnections adequate for coordinatedplanning, emergency assistance, exchange of capacity and energy and power supply reliability.
Through the Sheridan System, Montana-Dakota serves Sheridan, Wyoming, and neighboring communities. The maximum peakdemand experienced to date attributable to Montana-Dakota sales to retail customers on that system was approximately 60,600 kWin July 2007. Montana-Dakota has a power supply contract with Black Hills Power to purchase up to 74,000 kW of capacity annuallythrough December 31, 2016. On April 9, 2009, Montana-Dakota exercised an option to purchase a 25 percent interest in the Wygen IIIelectric generating facility under construction by Black Hills Power to serve a portion of the needs of its Sheridan-area customers. Theplant is expected to be commercial in the second quarter of 2010, and will replace 25 MW of capacity and energy purchased under thepower supply contract. Montana-Dakota received a Certificate of Public Convenience and Necessity from the WYPSC on July 29, 2008,for ownership of Wygen III.
Montana-Dakota is subject to competition in varying degrees, in certain areas, from rural electric cooperatives, on-site generators, co-generators and municipally owned systems. In addition, competition in varying degrees exists between electricity and alternative forms ofenergy such as natural gas.
Regulatory Matters and Revenues Subject to Refund Fuel adjustment clauses contained in North Dakota and South Dakota jurisdictionalelectric rate schedules allow Montana-Dakota to reflect monthly increases or decreases in fuel and purchased power costs (excludingdemand charges). In North Dakota, the Company is deferring electric fuel and purchased power costs (excluding demand charges) thatare greater or less than amounts presently being recovered through its existing rate schedules. In Montana, a monthly Fuel and PurchasedPower Tracking Adjustment mechanism allows Montana-Dakota to reflect 90 percent of the increases or decreases in fuel and purchasedpower costs (including demand charges) and Montana-Dakota is deferring 90 percent of costs that are greater or less than amountspresently being recovered through its existing rate schedules. In Wyoming, an annual Electric Power Supply Cost Adjustment mechanismallows Montana-Dakota to reflect increases or decreases in fuel and purchased power costs (including demand charges) related to powersupply and Montana-Dakota is deferring costs that are greater or less than amounts presently being recovered through its existing rateschedules. Such orders generally provide that these amounts are recoverable or refundable through rate adjustments within a periodranging from 14 to 25 months from the time such costs are paid. For additional information, see Item 8 – Note 6.
On August 14, 2009, Montana-Dakota filed an application with the WYPSC for an electric rate increase. For additional information, seeItem 8 – Note 18.
In November 2009, a decision was made by the Big Stone Station II participants not to proceed with the project. For additionalinformation, see Item 8 – Note 18.
Environmental Matters Montana-Dakota’s electric operations are subject to federal, state and local laws and regulations providing for air,water and solid waste pollution control; state facility-siting regulations; zoning and planning regulations of certain state and local authorities;federal health and safety regulations; and state hazard communication standards. Montana-Dakota believes it is in substantial compliancewith these regulations.
FO
RM
10
-K
8 MDU Resources Group, Inc. Form 10-K
Part IFO
RM
10
-K
Montana-Dakota’s electric generating facilities have Title V Operating Permits, under the Clean Air Act, issued by the states in which theyoperate. Each of these permits has a five-year life. Near the expiration of these permits, renewal applications are submitted. Permitscontinue in force beyond the expiration date, provided the application for renewal is submitted by the required date, usually six monthsprior to expiration. Title V Operating Permits for the Big Stone Station and the Lewis & Clark Station were renewed in 2009. In August 2009,an application for renewal of the Heskett Station Title V Operating Permit was submitted. On February 25, 2009, a Montana Air QualityPermit application was granted for the Lewis & Clark Station to obtain a mercury emissions limit and approve its proposed mercuryemissions control strategy.
State water discharge permits issued under the requirements of the Clean Water Act are maintained for power production facilities on theYellowstone and Missouri rivers. These permits also have five-year lives. Montana-Dakota renews these permits as necessary prior toexpiration. Other permits held by these facilities may include an initial siting permit, which is typically a one-time, preconstruction permitissued by the state; state permits to dispose of combustion by-products; state authorizations to withdraw water for operations; and ArmyCorps permits to construct water intake structures. Montana-Dakota’s Army Corps permits grant one-time permission to construct and donot require renewal. Other permit terms vary and the permits are renewed as necessary.
Montana-Dakota’s electric operations are conditionally exempt small-quantity hazardous waste generators and subject only to minimumregulation under the RCRA. Montana-Dakota routinely handles PCBs from its electric operations in accordance with federal requirements.PCB storage areas are registered with the EPA as required.
In June 2008, the Sierra Club filed a complaint in the South Dakota Federal District Court against Montana-Dakota and the two other co-owners of the Big Stone Station. For more information regarding this complaint, see Item 8 – Note 19.
Montana-Dakota incurred $5.9 million of environmental capital expenditures in 2009. Capital expenditures are estimated to be$1.7 million, $5.0 million and $6.5 million in 2010, 2011 and 2012, respectively, to maintain environmental compliance as new emissioncontrols are required. Projects will include sulfur-dioxide, nitrogen oxide and mercury control equipment installation at electric generatingstations. Montana-Dakota’s capital and operational expenditures could also be affected in a variety of ways by potential new GHGlegislation or regulation. In particular, such legislation or regulation would likely increase capital expenditures for renewable energyresources and operational costs associated with GHG emissions compliance until carbon capture technology becomes economical, atwhich time capital expenditures may be necessary to incorporate such technology into existing or new generating facilities. Montana-Dakota expects that it will recover the operational and capital expenditures for GHG regulatory compliance in its rates consistent with therecovery of other reasonable costs of complying with environmental laws and regulations.
Natural Gas DistributionGeneral The Company’s natural gas distribution operations consist of Montana-Dakota, Great Plains, Cascade and Intermountain which sellnatural gas at retail, serving over 829,000 residential, commercial and industrial customers in 333 communities and adjacent rural areasacross eight states as of December 31, 2009, and provide natural gas transportation services to certain customers on their systems. Theseservices are provided through distribution systems aggregating approximately 17,000 miles. The natural gas distribution operations haveobtained and hold, or are in the process of renewing, valid and existing franchises authorizing them to conduct their natural gas operationsin all of the municipalities they serve where such franchises are required. These operations intend to protect their service areas and seekrenewal of all expiring franchises. As of December 31, 2009, the natural gas distribution operations’ net natural gas distribution plantinvestment approximated $909.9 million.
The percentage of the natural gas distribution operations’ 2009 natural gas utility operating sales revenues by jurisdiction is as follows:Idaho – 32 percent; Washington – 30 percent; North Dakota – 11 percent; Oregon – 9 percent; Montana – 7 percent; South Dakota –6 percent; Minnesota – 3 percent; and Wyoming – 2 percent. The natural gas distribution operations are subject to regulation by the IPUC,MNPUC, MTPSC, NDPSC, OPUC, SDPUC, WUTC and WYPSC regarding retail rates, service, accounting and certain security issuances.
System Supply, System Demand and Competition The natural gas distribution operations serve retail natural gas markets, consistingprincipally of residential and firm commercial space and water heating users, in portions of Idaho, including Boise, Nampa, Twin Falls,Pocatello and Idaho Falls; western Minnesota, including Fergus Falls, Marshall and Crookston; eastern Montana, including Billings,Glendive and Miles City; North Dakota, including Bismarck, Dickinson, Wahpeton, Williston, Minot and Jamestown; central andeastern Oregon, including Bend and Pendleton; western and north-central South Dakota, including Rapid City, Pierre, Spearfish andMobridge; western, southeastern and south-central Washington, including Bellingham, Bremerton, Longview, Moses Lake, Mount Vernon,Tri-Cities, Walla Walla and Yakima; and northern Wyoming, including Sheridan. These markets are highly seasonal and sales volumesdepend largely on the weather, the effects of which are mitigated in certain jurisdictions by a weather normalization mechanism discussedin Regulatory Matters.
MDU Resources Group, Inc. Form 10-K 9
Part I
Competition in varying degrees exists between natural gas and other fuels and forms of energy. The natural gas distribution operationshave established various natural gas transportation service rates for their distribution businesses to retain interruptible commercial andindustrial loads. Certain of these services include transportation under flexible rate schedules whereby interruptible customers can availthemselves of the advantages of open access transportation on regional transmission pipelines, including the systems of Williston Basin,Northern Border Pipeline Company, Northern Natural Gas Company, South Dakota Intrastate Pipeline, Viking Gas Transmission Company,Northwest Pipeline GP and Gas Transmission Northwest Corporation. These services have enhanced the natural gas distributionoperations’ competitive posture with alternative fuels, although certain customers have bypassed the distribution systems by directlyaccessing transmission pipelines within close proximity. These bypasses did not have a material effect on results of operations.
The natural gas distribution operations obtain their system requirements directly from producers, processors and marketers. Such naturalgas is supplied by a portfolio of contracts specifying market-based pricing and is transported under transportation agreements by WillistonBasin, South Dakota Intrastate Pipeline Company, Northern Border Pipeline Company, Viking Gas Transmission Company, NorthernNatural Gas Company, Source Gas, TransCanada Foothills System, TransCanada NOVA System, Northwestern Energy, Northwest PipelineGP, TransCanada Gas Transmission Northwest Corporation and Spectra Energy Transmission West. The natural gas distribution operationshave contracts for storage services to provide gas supply during the winter heating season and to meet peak day demand with WillistonBasin, Northern Natural Gas Company, Questar Pipeline and Northwest Pipeline GP. In addition, certain of the operations have enteredinto natural gas supply management agreements with Sequent Energy Management, IGI Resources Inc. and Tenaska Gas Storage.Demand for natural gas, which is a widely traded commodity, has historically been sensitive to seasonal heating and industrial loadrequirements as well as changes in market price. The natural gas distribution operations believe that, based on current and projecteddomestic and regional supplies of natural gas and the pipeline transmission network currently available through their suppliers andpipeline service providers, supplies are adequate to meet their system natural gas requirements for the next decade.
Regulatory Matters The natural gas distribution operations’ retail natural gas rate schedules contain clauses permitting adjustments in ratesbased upon changes in natural gas commodity, transportation and storage costs. Current tariffs allow for recovery or refunds of under- orover-recovered gas costs within a period ranging from 12 to 28 months.
Montana-Dakota’s North Dakota and South Dakota natural gas tariffs contain weather normalization mechanisms applicable to firmcustomers that adjust the distribution delivery charge revenues to reflect weather fluctuations during the November 1 through May 1billing periods.
Cascade has received approval for decoupling its margins from weather and conservation in Oregon, and has also received approval of adecoupling mechanism in Washington that allows it to recover margin differences resulting from customer conservation. Cascade also hasan earnings sharing mechanism with respect to its Oregon jurisdictional operations as required by the OPUC.
Environmental Matters The natural gas distribution operations are subject to federal, state and local environmental, facility-siting, zoningand planning laws and regulations. The natural gas distribution operations believe they are in substantial compliance with thoseregulations.
Natural gas distribution operations are conditionally exempt small-quantity hazardous waste generators and subject only to minimumregulation under the RCRA. Certain of the natural gas distribution operations routinely handle PCBs from their natural gas operations inaccordance with federal requirements. PCB storage areas are registered with the EPA as required. Capital and operational expenditures fornatural gas distribution operations could be affected in a variety of ways by potential new GHG legislation or regulation. In particular, suchlegislation or regulation would likely increase capital expenditures for energy efficiency and conservation programs and operational costsassociated with GHG emissions compliance. The natural gas distribution operations expect they will recover the operational and capitalexpenditures for GHG regulatory compliance in its rates consistent with the recovery of other reasonable costs of complying withenvironmental laws and regulations.
The natural gas distribution operations did not incur any material environmental expenditures in 2009 and, except as to what may beultimately determined with regard to the issues described later, do not expect to incur any material capital expenditures related toenvironmental compliance with current laws and regulations in relation to the natural gas distribution operations through 2012.
Montana-Dakota has had an economic interest in five historic manufactured gas plants within its service territory, none of which arecurrently being actively investigated, and for which any remediation expenses are not expected to be material. Cascade has had aneconomic interest in nine former manufactured gas plants within its service territory. Cascade has been involved with other PRPs in theinvestigation of a manufactured gas plant site in Oregon, with remediation of this site pending additional investigation. See Item 8 –Note 19 for a further discussion of this site and for two additional sites for which Cascade has received claim notice. To the extent these
FO
RM
10
-K
10 MDU Resources Group, Inc. Form 10-K
Part IFO
RM
10
-K
claims are not covered by insurance, Cascade will seek recovery through the OPUC and WUTC of remediation costs in its natural gas ratescharged to customers.
Construction ServicesGeneral MDU Construction Services specializes in constructing and maintaining electric and communication lines, gas pipelines,fire suppression systems, and external lighting and traffic signalization equipment. This segment also provides utility excavationservices and inside electrical wiring, cabling and mechanical services, sells and distributes electrical materials, and manufactures anddistributes specialty equipment. These services are provided to utilities and large manufacturing, commercial, industrial, institutionaland government customers.
Construction and maintenance crews are active year round. However, activity in certain locations may be seasonal in nature due to theeffects of weather.
MDU Construction Services operates a fleet of owned and leased trucks and trailers, support vehicles and specialty constructionequipment, such as backhoes, excavators, trenchers, generators, boring machines and cranes. In addition, as of December 31, 2009,MDU Construction Services owned or leased facilities in 17 states. This space is used for offices, equipment yards, warehousing, storageand vehicle shops. At December 31, 2009, MDU Construction Services’ net plant investment was approximately $48.5 million.
MDU Construction Services’ backlog is comprised of the uncompleted portion of services to be performed under job-specific contracts.The backlog at December 31, 2009, was approximately $383 million compared to $604 million at December 31, 2008. MDU ConstructionServices expects to complete a significant amount of this backlog during the year ending December 31, 2010. Due to the nature of itscontractual arrangements, in many instances MDU Construction Services’ customers are not committed to the specific volumes of servicesto be purchased under a contract, but rather MDU Construction Services is committed to perform these services if and to the extentrequested by the customer. Therefore, there can be no assurance as to the customer’s requirements during a particular period or thatsuch estimates at any point in time are predictive of future revenues.
MDU Construction Services works with the National Electrical Contractors Association, the IBEW and other trade associations on hiring andrecruiting a qualified workforce.
Competition MDU Construction Services operates in a highly competitive business environment. Most of MDU Construction Services’ workis obtained on the basis of competitive bids or by negotiation of either cost-plus or fixed-price contracts. The workforce and equipmentare highly mobile, providing greater flexibility in the size and location of MDU Construction Services’ market area. Competition is basedprimarily on price and reputation for quality, safety and reliability. The size and location of the services provided, as well as the state of theeconomy, will be factors in the number of competitors that MDU Construction Services will encounter on any particular project. MDUConstruction Services believes that the diversification of the services it provides, the markets it serves throughout the United States andthe management of its workforce will enable it to effectively operate in this competitive environment.
Utilities and independent contractors represent the largest customer base for this segment. Accordingly, utility and subcontract workaccounts for a significant portion of the work performed by MDU Construction Services and the amount of construction contracts isdependent to a certain extent on the level and timing of maintenance and construction programs undertaken by customers. MDUConstruction Services relies on repeat customers and strives to maintain successful long-term relationships with these customers.
Environmental Matters MDU Construction Services’ operations are subject to regulation customary for the industry, including federal, stateand local environmental compliance. MDU Construction Services believes it is in substantial compliance with these regulations.
The nature of MDU Construction Services’ operations is such that few, if any, environmental permits are required. Operational conveniencesupports the use of petroleum storage tanks in several locations, which are permitted under state programs authorized by the EPA.MDU Construction Services has no ongoing remediation related to releases from petroleum storage tanks. MDU Construction Services’operations are conditionally exempt small-quantity waste generators, subject to minimal regulation under the RCRA. Federal permits forspecific construction and maintenance jobs that may require these permits are typically obtained by the hiring entity, and not by MDUConstruction Services.
MDU Construction Services did not incur any material environmental expenditures in 2009 and does not expect to incur any materialcapital expenditures related to environmental compliance with current laws and regulations through 2012.
MDU Resources Group, Inc. Form 10-K 11

Part I
Pipeline and Energy ServicesGeneral Williston Basin, the regulated business of WBI Holdings, owns and operates over 3,700 miles of transmission, gathering andstorage lines and owns or leases and operates 33 compressor stations in Montana, North Dakota, South Dakota and Wyoming. Threeunderground storage fields in Montana and Wyoming provide storage services to local distribution companies, producers, natural gasmarketers and others, and serve to enhance system deliverability. Williston Basin’s system is strategically located near five natural gasproducing basins, making natural gas supplies available to Williston Basin’s transportation and storage customers. The system has11 interconnecting points with other pipeline facilities allowing for the receipt and/or delivery of natural gas to and from other regions ofthe country and from Canada. At December 31, 2009, Williston Basin’s net plant investment was approximately $287.3 million. Underthe Natural Gas Act, as amended, Williston Basin is subject to the jurisdiction of the FERC regarding certificate, rate, service andaccounting matters.
Bitter Creek, the nonregulated pipeline business, owns and operates gathering facilities in Colorado, Kansas, Montana and Wyoming.Bitter Creek also owns a one-sixth interest in the assets of various offshore gathering pipelines, an associated onshore pipeline andrelated processing facilities in Texas. In total, these facilities include over 1,900 miles of field gathering lines and 88 owned or leasedcompression stations, some of which interconnect with Williston Basin’s system. In 2009, the Company acquired the assets of a cathodicprotection company. This acquisition was not material to the Company. Bitter Creek also provides a variety of energy-related servicessuch as water hauling, contract compression operations, measurement services and energy efficiency product sales and installationservices to large end-users.
WBI Holdings, through its energy services business, provides natural gas purchase and sales services to local distribution companies,producers, other marketers and a limited number of large end-users, primarily using natural gas produced by the Company’s natural gasand oil production segment. Certain of the services are provided based on contracts that call for a determinable quantity of natural gas.WBI Holdings currently estimates that it can adequately meet the requirements of these contracts. WBI Holdings transacts a majority of itspipeline and energy services business in the northern Great Plains and Rocky Mountain regions of the United States.
System Demand and Competition Williston Basin competes with several pipelines for its customers’ transportation, storage and gatheringbusiness and at times may discount rates in an effort to retain market share. However, the strategic location of Williston Basin’s systemnear five natural gas producing basins and the availability of underground storage and gathering services provided by Williston Basin andaffiliates along with interconnections with other pipelines serve to enhance Williston Basin’s competitive position.
Although certain of Williston Basin’s firm customers, including its largest firm customer Montana-Dakota, serve relatively secure residentialand commercial end-users, they generally all have some price-sensitive end-users that could switch to alternate fuels.
Williston Basin transports substantially all of Montana-Dakota’s natural gas, primarily utilizing firm transportation agreements, which for theyear ended December 31, 2009, represented 50 percent of Williston Basin’s subscribed firm transportation contract demand. Montana-Dakota has firm transportation agreements with Williston Basin expiring November 2010 through June 2012. In addition, Montana-Dakotahas a contract with Williston Basin to provide firm storage services to facilitate meeting Montana-Dakota’s winter peak requirementsexpiring in July 2015.
Bitter Creek competes with several pipelines for existing customers and for the expansion of its systems to gather natural gas in new areas.Bitter Creek’s strong position in the fields in which it operates, its focus on customer service and the variety of services it offers, along withits interconnection with various other pipelines, serve to enhance its competitive position.
System Supply Williston Basin’s underground natural gas storage facilities have a certificated storage capacity of approximately 353 Bcf,including 193 Bcf of working gas capacity, 85 Bcf of cushion gas and 75 Bcf of native gas. The native gas includes an estimated 29 Bcf ofrecoverable gas. Williston Basin’s storage facilities enable its customers to purchase natural gas at more uniform daily volumes throughoutthe year and meet winter peak requirements.
Natural gas supplies emanate from traditional and nontraditional production activities in the region and from off-system supply sources.While certain traditional regional supply sources are in various stages of decline, incremental supply from nontraditional sources have beendeveloped which have helped support Williston Basin’s supply needs. This includes new natural gas supply associated with the continueddevelopment of the Bakken area in Montana and North Dakota. The Powder River Basin, including the Company’s CBNG assets, alsoprovides a nontraditional natural gas supply to the Williston Basin system. For additional information regarding CBNG legal proceedings,see Item 1A – Risk Factors and Item 8 – Note 19. In addition, off-system supply sources are available through the Company’sinterconnections with other pipeline systems. Williston Basin expects to facilitate the movement of these supplies by making available its
FO
RM
10
-K
12 MDU Resources Group, Inc. Form 10-K

Part IFO
RM
10
-K
transportation and storage services. Williston Basin will continue to look for opportunities to increase transportation, gathering and storageservices through system expansion and/or other pipeline interconnections or enhancements that could provide substantial future benefits.
Regulatory Matters and Revenues Subject to Refund In December 1999, Williston Basin filed a general natural gas rate change applicationwith the FERC. For additional information, see Item 8 – Note 18.
Environmental Matters WBI Holdings’ pipeline and energy services operations are generally subject to federal, state and localenvironmental, facility-siting, zoning and planning laws and regulations. WBI Holdings believes it is in substantial compliance with thoseregulations.
Ongoing operations are subject to the Clean Air Act, the Clean Water Act, the NEPA and other state and federal regulations. Administrationof many provisions of these laws has been delegated to the states where Williston Basin and Bitter Creek operate. Permit terms vary and allpermits carry operational compliance conditions. Some permits require annual renewal, some have terms ranging from one to five yearsand others have no expiration date. Permits are renewed and modified, as necessary, based on defined permit expiration dates,operational demand and/or regulatory changes.
Detailed environmental assessments and/or environmental impact statements are included in the FERC’s permitting processes for both theconstruction and abandonment of Williston Basin’s natural gas transmission pipelines, compressor stations and storage facilities.
WBI Holdings’ pipeline and energy services operations did not incur any material environmental expenditures in 2009 and do not expect toincur any material capital expenditures related to environmental compliance with current laws and regulations through 2012.
Natural Gas and Oil ProductionGeneral Fidelity is involved in the acquisition, exploration, development and production of natural gas and oil resources. Fidelity’s activitiesinclude the acquisition of producing properties and leaseholds with potential development opportunities, exploratory drilling and theoperation and development of natural gas and oil production properties. Fidelity continues to seek additional reserve and productiongrowth opportunities through these activities. Future growth is dependent upon its success in these endeavors. Fidelity shares revenuesand expenses from the development of specified properties in proportion to its ownership interests.
Fidelity’s business is focused primarily in two core regions: Rocky Mountain and Mid-Continent/Gulf States.
Rocky MountainFidelity’s properties in this region are primarily in Colorado, Montana, North Dakota, Utah and Wyoming. Fidelity owns in fee or holdsnatural gas and oil leases for the properties it operates that are in the Bonny Field in eastern Colorado, the Baker Field in southeasternMontana and southwestern North Dakota, the Bowdoin area in north-central Montana, the Powder River Basin of Montana and Wyoming,the Bakken area in North Dakota, the Paradox Basin of Utah, and the Big Horn Basin of Wyoming. Fidelity also owns nonoperated naturalgas and oil interests and undeveloped acreage positions in this region.
Mid-Continent/Gulf StatesThis region includes properties in Alabama, Louisiana, New Mexico, Texas and the Offshore Gulf of Mexico. The Offshore Gulf of Mexicointerests are primarily located in the shallow waters off the coasts of Texas and Louisiana. Fidelity owns in fee or holds natural gas and oilleases for the properties it operates that are in the Tabasco and Texan Gardens fields of Texas and natural gas properties in Rusk County ineastern Texas. In addition, Fidelity owns several nonoperated interests and undeveloped acreage positions in this region.
Operating Information Annual net production by region for 2009 was as follows:
NaturalGas Oil Total Percent of
Region (MMcf)* (MBbls) (MMcfe) Total
Rocky Mountain 41,635 2,182 54,729 73%Mid-Continent/Gulf States 14,997 929 20,570 27
Total 56,632 3,111 75,299 100%
*Baker field and Bowdoin field represent 28 percent and 19 percent, respectively, of total annual net natural gas production.
MDU Resources Group, Inc. Form 10-K 13

Part I
Annual net production by region for 2008 was as follows:
NaturalGas Oil Total Percent of
Region (MMcf)* (MBbls) (MMcfe) Total
Rocky Mountain 47,504 1,698 57,691 70%Mid-Continent/Gulf States 17,953 1,110 24,612 30
Total 65,457 2,808 82,303 100%
* Baker field and Bowdoin field represent 28 percent and 18 percent, respectively, of total annual net natural gas production.
Annual net production by region for 2007 was as follows:
NaturalGas Oil Total Percent of
Region (MMcf)* (MBbls) (MMcfe) Total
Rocky Mountain 48,832 1,287 56,553 74%Mid-Continent/Gulf States 13,966 1,078 20,435 26
Total 62,798 2,365 76,988 100%
* Baker field and Bowdoin field represent 31 percent and 19 percent, respectively, of total annual net natural gas production.
Well and Acreage Information Gross and net productive well counts and gross and net developed and undeveloped acreage related toFidelity’s interests at December 31, 2009, were as follows:
Gross* Net**
Productive wells:Natural gas 3,869 3,121Oil 3,706 258
Total 7,575 3,379
Developed acreage (000’s) 720 400
Undeveloped acreage (000’s) 834 449
* Reflects well or acreage in which an interest is owned.** Reflects Fidelity’s percentage of ownership.
Exploratory and Development Wells The following table reflects activities related to Fidelity’s natural gas and oil wells drilled and/or testedduring 2009, 2008 and 2007:
Net Exploratory Net Development_______________________________________ _______________________________________Productive Dry Holes Total Productive Dry Holes Total Total
2009 1 2 3 104 – 104 107
2008 11 4 15 251 9 260 275
2007 4 5 9 317 16 333 342
At December 31, 2009, there were 74 gross (60 net) wells in the process of drilling or under evaluation, 70 of which were developmentwells and 4 of which were exploratory wells. These wells are not included in the previous table. Fidelity expects to complete the drilling andtesting of the majority of these wells within the next 12 months.
The information in the preceding table should not be considered indicative of future performance nor should it be assumed that there isnecessarily any correlation between the number of productive wells drilled and quantities of reserves found or economic value. Productivewells are those that produce commercial quantities of hydrocarbons whether or not they produce a reasonable rate of return.
Competition The natural gas and oil industry is highly competitive. Fidelity competes with a substantial number of major and independentnatural gas and oil companies in acquiring producing properties and new leases for future exploration and development, and in securingthe equipment, services and expertise necessary to explore, develop and operate its properties.
Environmental Matters Fidelity’s natural gas and oil production operations are generally subject to federal, state and local environmentaland operational laws and regulations. Fidelity believes it is in substantial compliance with these regulations.
FO
RM
10
-K
14 MDU Resources Group, Inc. Form 10-K
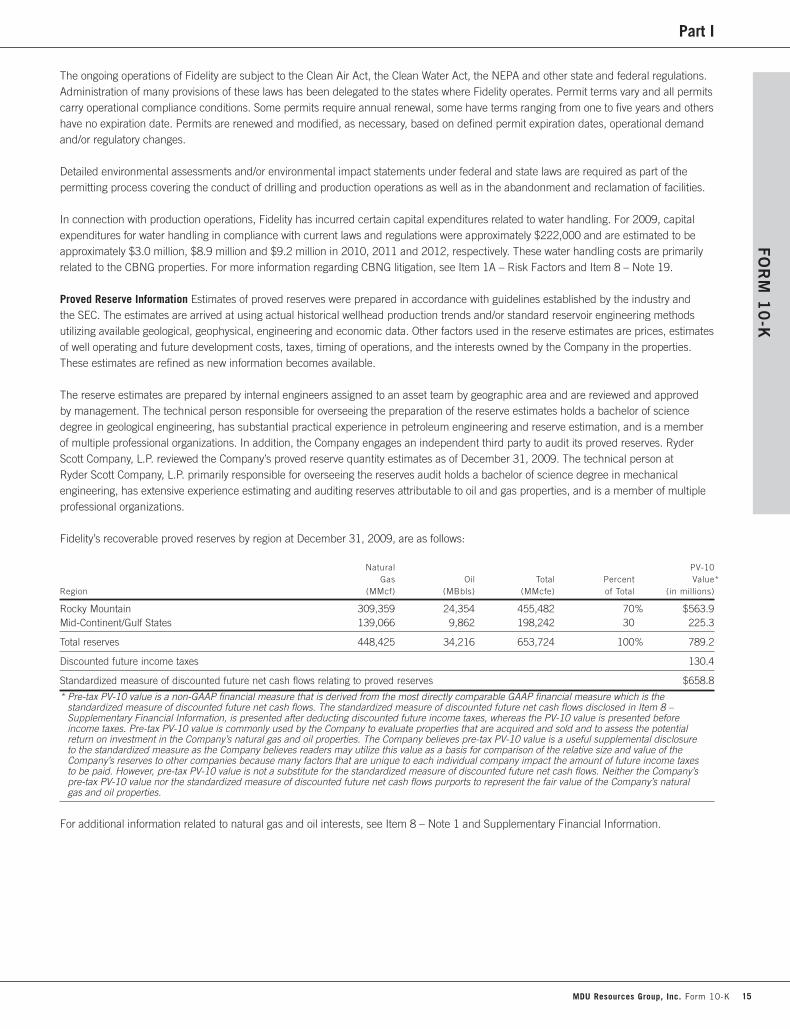
Part IFO
RM
10
-K
The ongoing operations of Fidelity are subject to the Clean Air Act, the Clean Water Act, the NEPA and other state and federal regulations.Administration of many provisions of these laws has been delegated to the states where Fidelity operates. Permit terms vary and all permitscarry operational compliance conditions. Some permits require annual renewal, some have terms ranging from one to five years and othershave no expiration date. Permits are renewed and modified, as necessary, based on defined permit expiration dates, operational demandand/or regulatory changes.
Detailed environmental assessments and/or environmental impact statements under federal and state laws are required as part of thepermitting process covering the conduct of drilling and production operations as well as in the abandonment and reclamation of facilities.
In connection with production operations, Fidelity has incurred certain capital expenditures related to water handling. For 2009, capitalexpenditures for water handling in compliance with current laws and regulations were approximately $222,000 and are estimated to beapproximately $3.0 million, $8.9 million and $9.2 million in 2010, 2011 and 2012, respectively. These water handling costs are primarilyrelated to the CBNG properties. For more information regarding CBNG litigation, see Item 1A – Risk Factors and Item 8 – Note 19.
Proved Reserve Information Estimates of proved reserves were prepared in accordance with guidelines established by the industry andthe SEC. The estimates are arrived at using actual historical wellhead production trends and/or standard reservoir engineering methodsutilizing available geological, geophysical, engineering and economic data. Other factors used in the reserve estimates are prices, estimatesof well operating and future development costs, taxes, timing of operations, and the interests owned by the Company in the properties.These estimates are refined as new information becomes available.
The reserve estimates are prepared by internal engineers assigned to an asset team by geographic area and are reviewed and approvedby management. The technical person responsible for overseeing the preparation of the reserve estimates holds a bachelor of sciencedegree in geological engineering, has substantial practical experience in petroleum engineering and reserve estimation, and is a memberof multiple professional organizations. In addition, the Company engages an independent third party to audit its proved reserves. RyderScott Company, L.P. reviewed the Company’s proved reserve quantity estimates as of December 31, 2009. The technical person atRyder Scott Company, L.P. primarily responsible for overseeing the reserves audit holds a bachelor of science degree in mechanicalengineering, has extensive experience estimating and auditing reserves attributable to oil and gas properties, and is a member of multipleprofessional organizations.
Fidelity’s recoverable proved reserves by region at December 31, 2009, are as follows:
Natural PV-10Gas Oil Total Percent Value*
Region (MMcf) (MBbls) (MMcfe) of Total (in millions)
Rocky Mountain 309,359 24,354 455,482 70% $563.9Mid-Continent/Gulf States 139,066 9,862 198,242 30 225.3
Total reserves 448,425 34,216 653,724 100% 789.2
Discounted future income taxes 130.4
Standardized measure of discounted future net cash flows relating to proved reserves $658.8
* Pre-tax PV-10 value is a non-GAAP financial measure that is derived from the most directly comparable GAAP financial measure which is thestandardized measure of discounted future net cash flows. The standardized measure of discounted future net cash flows disclosed in Item 8 –Supplementary Financial Information, is presented after deducting discounted future income taxes, whereas the PV-10 value is presented beforeincome taxes. Pre-tax PV-10 value is commonly used by the Company to evaluate properties that are acquired and sold and to assess the potentialreturn on investment in the Company’s natural gas and oil properties. The Company believes pre-tax PV-10 value is a useful supplemental disclosureto the standardized measure as the Company believes readers may utilize this value as a basis for comparison of the relative size and value of theCompany’s reserves to other companies because many factors that are unique to each individual company impact the amount of future income taxesto be paid. However, pre-tax PV-10 value is not a substitute for the standardized measure of discounted future net cash flows. Neither the Company’spre-tax PV-10 value nor the standardized measure of discounted future net cash flows purports to represent the fair value of the Company’s naturalgas and oil properties.
For additional information related to natural gas and oil interests, see Item 8 – Note 1 and Supplementary Financial Information.
MDU Resources Group, Inc. Form 10-K 15
Part I
Construction Materials and ContractingGeneral Knife River operates construction materials and contracting businesses headquartered in Alaska, California, Hawaii, Idaho, Iowa,Minnesota, Montana, North Dakota, Oregon, Texas, Washington and Wyoming. These operations mine, process and sell constructionaggregates (crushed stone, sand and gravel); produce and sell asphalt mix and supply liquid asphalt for various commercial and roadwayapplications; and supply ready-mixed concrete for use in most types of construction, including roads, freeways and bridges, as well ashomes, schools, shopping centers, office buildings and industrial parks. Although not common to all locations, other products include thesale of cement, various finished concrete products and other building materials and related contracting services.
For information regarding construction materials litigation, see Item 8 – Note 19.
The construction materials business had approximately $459 million in backlog at December 31, 2009, compared to $453 million atDecember 31, 2008. The Company anticipates that a significant amount of the current backlog will be completed during the year endingDecember 31, 2010.
Competition Knife River’s construction materials products are marketed under highly competitive conditions. Price is the principalcompetitive force to which these products are subject, with service, quality, delivery time and proximity to the customer also beingsignificant factors. The number and size of competitors varies in each of Knife River’s principal market areas and product lines.
The demand for construction materials products is significantly influenced by the cyclical nature of the construction industry in general.In addition, construction materials activity in certain locations may be seasonal in nature due to the effects of weather. The key economicfactors affecting product demand are changes in the level of local, state and federal governmental spending, general economic conditionswithin the market area that influence both the commercial and private sectors, and prevailing interest rates.
Knife River is not dependent on any single customer or group of customers for sales of its products and services, the loss of which wouldhave a material adverse effect on its construction materials businesses.
Reserve Information Reserve estimates are calculated based on the best available data. These data are collected from drill holes and othersubsurface investigations, as well as investigations of surface features such as mine highwalls and other exposures of the aggregatereserves. Mine plans, production history and geologic data also are utilized to estimate reserve quantities. Most acquisitions are madeof mature businesses with established reserves, as distinguished from exploratory-type properties.
Estimates are based on analyses of the data described above by experienced internal mining engineers, operating personnel andgeologists. Property setbacks and other regulatory restrictions and limitations are identified to determine the total area available for mining.Data described above are used to calculate the thickness of aggregate materials to be recovered. Topography associated with alluvial sandand gravel deposits is typically flat and volumes of these materials are calculated by applying the thickness of the resource over the areasavailable for mining. Volumes are then converted to tons by using an appropriate conversion factor. Typically, 1.5 tons per cubic yard in theground is used for sand and gravel deposits.
Topography associated with the hard rock reserves is typically much more diverse. Therefore, using available data, a final topography mapis created and computer software is utilized to compute the volumes between the existing and final topographies. Volumes are thenconverted to tons by using an appropriate conversion factor. Typically, 2 tons per cubic yard in the ground is used for hard rock quarries.
Estimated reserves are probable reserves as defined in Securities Act Industry Guide 7. Remaining reserves are based on estimates ofvolumes that can be economically extracted and sold to meet current market and product applications. The reserve estimates includeonly salable tonnage and thus exclude waste materials that are generated in the crushing and processing phases of the operation.Approximately 1.0 billion tons of the 1.1 billion tons of aggregate reserves are permitted reserves. The remaining reserves are on propertiesthat are expected to be permitted for mining under current regulatory requirements. The data used to calculate the remaining reservesmay require revisions in the future to account for changes in customer requirements and unknown geological occurrences. The yearsremaining were calculated by dividing remaining reserves by the three-year average sales from 2007 through 2009. Actual useful lives ofthese reserves will be subject to, among other things, fluctuations in customer demand, customer specifications, geological conditions andchanges in mining plans.
FO
RM
10
-K
16 MDU Resources Group, Inc. Form 10-K
Part IFO
RM
10
-K
The following table sets forth details applicable to the Company’s aggregate reserves under ownership or lease as of December 31, 2009,and sales for the years ended December 31, 2009, 2008 and 2007:
Number of Sites Number of Sites Estimated Reserve(Crushed Stone) (Sand & Gravel) Tons Sold (000’s) Reserves Lease Life__________________ __________________ ___________________________
Production Area owned leased owned leased 2009 2008 2007 (000’s tons) Expiration (years)
Anchorage, AK – – 1 – 891 1,267 1,118 17,554 N/A 16
Hawaii – 6 – – 1,940 2,467 3,081 63,622 2011-2064 25
Northern CA – – 9 1 1,215 2,054 2,534 49,393 2014 26
Southern CA – 2 – – 337 106 69 94,887 2035 Over 100
Portland, OR 1 3 6 3 2,718 4,074 5,372 248,243 2010-2055 61
Eugene, OR 3 4 4 1 1,097 1,633 2,007 172,258 2010-2046 Over 100
Central OR/WA/Idaho 1 2 4 3 1,436 1,686 2,652 107,632 2010-2021 56
Southwest OR 5 4 12 7 1,871 2,248 3,686 102,561 2011-2048 39
Central MT – – 3 2 1,220 2,086 2,424 27,136 2013-2027 14
Northwest MT – – 9 3 1,289 1,198 1,318 48,033 2010-2020 38
Wyoming – – 1 2 655 720 116 14,041 2013-2019 28
Central MN – 1 38 33 1,868 1,367 2,639 83,549 2010-2028 43
Northern MN 2 – 17 6 838 333 753 28,262 2010-2016 44
ND/SD – – 2 24 699 876 943 39,428 2010-2031 47
Iowa – 2 1 14 545 1,405 1,592 10,544 2010-2018 9
Texas 1 2 – 2 1,080 1,619 1,290 18,348 2010-2025 14
Sales from other sources 4,296 5,968 5,318
23,995 31,107 36,912 1,125,491
The 1.1 billion tons of estimated aggregate reserves at December 31, 2009, is comprised of 472 million tons that are owned and 653million tons that are leased. Approximately 51 percent of the tons under lease have lease expiration dates of 20 years or more. Theweighted average years remaining on all leases containing estimated probable aggregate reserves is approximately 22 years, includingoptions for renewal that are at Knife River’s discretion. Based on a three-year average of sales from 2007 through 2009 of leased reserves,the average time necessary to produce remaining aggregate reserves from such leases is approximately 53 years. Some sites have leasesthat expire prior to the exhaustion of the estimated reserves. The estimated reserve life assumes, based on Knife River’s experience, thatleases will be renewed to allow sufficient time to fully recover these reserves.
The following table summarizes Knife River’s aggregate reserves at December 31, 2009, 2008 and 2007, and reconciles the changesbetween these dates:
2009 2008 2007
(000’s of tons)
Aggregate reserves:Beginning of year 1,145,161 1,215,253 1,248,099Acquisitions 21,400 27,650 29,740Sales volumes* (19,699) (25,139) (31,594)Other** (21,371) (72,603) (30,992)
End of year 1,125,491 1,145,161 1,215,253
* Excludes sales from other sources.** Includes property sales and revisions of previous estimates.
Environmental Matters Knife River’s construction materials and contracting operations are subject to regulation customary for suchoperations, including federal, state and local environmental compliance and reclamation regulations. Except as to what may be ultimatelydetermined with regard to the Portland, Oregon, Harbor Superfund Site issue described later, Knife River believes it is in substantialcompliance with these regulations. Individual permits applicable to Knife River’s various operations are managed largely by localoperations, particularly as they relate to application, modification, renewal, compliance, and reporting procedures.
MDU Resources Group, Inc. Form 10-K 17
Part I
Knife River’s asphalt and ready-mixed concrete manufacturing plants and aggregate processing plants are subject to Clean Air Act andClean Water Act requirements for controlling air emissions and water discharges. Some mining and construction activities also aresubject to these laws. In most of the states where Knife River operates, these regulatory programs have been delegated to state andlocal regulatory authorities. Knife River’s facilities also are subject to RCRA as it applies to the management of hazardous wastesand underground storage tank systems. These programs also have generally been delegated to the state and local authorities in thestates where Knife River operates. Knife River’s facilities must comply with requirements for managing wastes and underground storagetank systems.
Some Knife River activities are directly regulated by federal agencies. For example, certain in-water mining operations are subject toprovisions of the Clean Water Act that are administered by the Army Corps. Knife River operates several such operations, including gravelbar skimming and dredging operations, and Knife River has the associated permits as required. The expiration dates of these permits vary,with five years generally being the longest term.
Knife River’s operations also are occasionally subject to the ESA. For example, land use regulations often require environmentalstudies, including wildlife studies, before a permit may be granted for a new or expanded mining facility or an asphalt or concrete plant.If endangered species or their habitats are identified, ESA requirements for protection, mitigation or avoidance apply. Endangered speciesprotection requirements are usually included as part of land use permit conditions. Typical conditions include avoidance, setbacks,restrictions on operations during certain times of the breeding or rearing season, and construction or purchase of mitigation habitat.Knife River’s operations also are subject to state and federal cultural resources protection laws when new areas are disturbed for miningoperations or processing plants. Land use permit applications generally require that areas proposed for mining or other surfacedisturbances be surveyed for cultural resources. If any are identified, they must be protected or managed in accordance with regulatoryagency requirements.
The most comprehensive environmental permit requirements are usually associated with new mining operations, although requirementsvary widely from state to state and even within states. In some areas, land use regulations and associated permitting requirements areminimal. However, some states and local jurisdictions have very demanding requirements for permitting new mines. Environmentalimpact reports are sometimes required before a mining permit application can even be considered for approval. These reports can takeup to several years to complete. The report can include projected impacts of the proposed project on air and water quality, wildlife, noiselevels, traffic, scenic vistas and other environmental factors. The reports generally include suggested actions to mitigate the projectedadverse impacts.
Provisions for public hearings and public comments are usually included in land use permit application review procedures in thecounties where Knife River operates. After taking into account environmental, mine plan and reclamation information provided by thepermittee as well as comments from the public and other regulatory agencies, the local authority approves or denies the permitapplication. Denial is rare, but land use permits often include conditions that must be addressed by the permittee. Conditions mayinclude property line setbacks, reclamation requirements, environmental monitoring and reporting, operating hour restrictions, financialguarantees for reclamation, and other requirements intended to protect the environment or address concerns submitted by the publicor other regulatory agencies.
Knife River has been successful in obtaining mining and other land use permit approvals so that sufficient permitted reserves are availableto support its operations. For mining operations, this often requires considerable advanced planning to ensure sufficient time is available tocomplete the permitting process before the newly permitted aggregate reserve is needed to support Knife River’s operations.
Knife River’s Gascoyne surface coal mine last produced coal in 1995 but continues to be subject to reclamation requirements of theSMCRA, as well as the North Dakota Surface Mining Act. Portions of the Gascoyne Mine remain under reclamation bond until the 10-yearrevegetation liability period has expired. A portion of the original permit has been released from bond and additional areas are currently inthe process of having the bond released. Knife River’s intention is to request bond release as soon as it is deemed possible with all finalbond release applications being filed by 2013.
Knife River did not incur any material environmental expenditures in 2009 and, except as to what may be ultimately determined withregard to the issue described below, Knife River does not expect to incur any material expenditures related to environmental compliancewith current laws and regulations through 2012.
In December 2000, MBI was named by the EPA as a PRP in connection with the cleanup of a commercial property site, acquired by MBIin 1999, and part of the Portland, Oregon, Harbor Superfund Site. For additional information, see Item 8 – Note 19.
FO
RM
10
-K
18 MDU Resources Group, Inc. Form 10-K

Part IFO
RM
10
-K
Item 1A. Risk Factors
The Company’s business and financial results are subject to a number of risks and uncertainties, including those set forth below and inother documents that it files with the SEC. The factors and the other matters discussed herein are important factors that could causeactual results or outcomes for the Company to differ materially from those discussed in the forward-looking statements included elsewherein this document.
Economic RisksThe Company’s natural gas and oil production and pipeline and energy services businesses are dependent on factors, including commodityprices and commodity price basis differentials, which are subject to various external influences that cannot be controlled.
These factors include: fluctuations in natural gas and oil prices; fluctuations in commodity price basis differentials; availability of economicsupplies of natural gas; drilling successes in natural gas and oil operations; the timely receipt of necessary permits and approvals; theability to contract for or to secure necessary drilling rig and service contracts and to retain employees to drill for and develop reserves; theability to acquire natural gas and oil properties; and other risks incidental to the operations of natural gas and oil wells. Volatility in naturalgas and oil prices could negatively affect the results of operations and cash flows of the Company’s natural gas and oil production andpipeline and energy services businesses.
The regulatory approval, permitting, construction, startup and operation of power generation facilities may involve unanticipated changesor delays that could negatively impact the Company’s business and its results of operations and cash flows.
The construction, startup and operation of power generation facilities involve many risks, including: delays; breakdown or failure ofequipment; competition; inability to obtain required governmental permits and approvals; inability to negotiate acceptable acquisition,construction, fuel supply, off-take, transmission or other material agreements; changes in market price for power; cost increases; as well asthe risk of performance below expected levels of output or efficiency. Such unanticipated events could negatively impact the Company’sbusiness, its results of operations and cash flows.
Economic volatility affects the Company’s operations, as well as the demand for its products and services and the value of its investmentsand investment returns and, as a result, may have a negative impact on the Company’s future revenues and cash flows.
The global demand for natural resources, interest rates, governmental budget constraints and the ongoing threat of terrorism can createvolatility in the financial markets. The current economic slowdown has negatively affected the level of public and private expenditures onprojects and the timing of these projects which, in turn, has negatively affected the demand for certain of the Company’s products andservices. Continued economic volatility could adversely impact the Company’s results of operations and cash flows. Changing marketconditions could negatively affect the market value of assets held in the Company’s pension and other postretirement benefit plans andmay increase the amount and accelerate the timing of required funding contributions.
The Company relies on financing sources and capital markets. Access to these markets may be adversely affected by factors beyond theCompany’s control. If the Company is unable to obtain economic financing in the future, the Company’s ability to execute its businessplans, make capital expenditures or pursue acquisitions that the Company may otherwise rely on for future growth could be impaired. As aresult, the market value of the Company’s common stock may be adversely affected. If the Company issues a substantial amount of commonstock it could have a dilutive effect on its existing shareholders.
The Company relies on access to both short-term borrowings, including the issuance of commercial paper, and long-term capital marketsas sources of liquidity for capital requirements not satisfied by its cash flow from operations. If the Company is not able to access capital atcompetitive rates, the ability to implement its business plans may be adversely affected. Market disruptions or a further downgrade of theCompany’s credit ratings may increase the cost of borrowing or adversely affect its ability to access one or more financial markets. Suchdisruptions could include:
• A severe prolonged economic downturn
• The bankruptcy of unrelated industry leaders in the same line of business
• Further deterioration in capital market conditions
• Turmoil in the financial services industry
• Volatility in commodity prices
• Terrorist attacks
MDU Resources Group, Inc. Form 10-K 19
Part I
Economic turmoil, market disruptions and volatility in the securities trading markets, as well as other factors including changes inthe Company’s financial condition, results of operations and prospects, may adversely affect the market price of the Company’scommon stock.
The Company currently has authorization to issue and sell up to $1.0 billion of securities pursuant to a registration statement on file withthe SEC. The issuance of a substantial amount of the Company’s common stock, whether sold pursuant to the registration statement,issued in connection with an acquisition or otherwise issued, or the perception that such an issuance could occur, may adversely affect themarket price of the Company’s common stock.
The Company is exposed to credit risk and the risk of loss resulting from the nonpayment and/or nonperformance by the Company’scustomers and counterparties.
If any of the Company’s customers or counterparties were to experience financial difficulties or file for bankruptcy, the Company couldexperience difficulty in collecting receivables. The nonpayment and/or nonperformance by the Company’s customers and counterpartiescould have a negative impact on the Company’s results of operations and cash flows.
The backlogs at the Company’s construction services and construction materials and contracting businesses are subject to delay orcancellation and may not be realized.
Backlog consists of the uncompleted portion of services to be performed under job-specific contracts. Contracts are subject to delay,default or cancellation and the contracts in the Company’s backlog are subject to changes in the scope of services to be provided as wellas adjustments to the costs relating to the applicable contracts. Backlog may also be affected by project delays or cancellations resultingfrom weather conditions, external market factors and economic factors beyond the Company’s control, including the current economicslowdown. Accordingly, there is no assurance that backlog will be realized.
Actual quantities of recoverable natural gas and oil reserves and discounted future net cash flows from those reserves may varysignificantly from estimated amounts.
The process of estimating natural gas and oil reserves is complex. Reserve estimates are based on assumptions relating to natural gas andoil pricing, drilling and operating expenses, capital expenditures, taxes, timing of operations, and the percentage of interest owned by theCompany in the well. The reserve estimates are prepared for each of the Company’s properties by internal engineers assigned to an assetteam by geographic area. The internal engineers analyze available geological, geophysical, engineering and economic data for eachgeographic area. The internal engineers make various assumptions regarding this data. The extent, quality and reliability of this data canvary. Although the Company has prepared its reserve estimates in accordance with guidelines established by the industry and the SEC,significant changes to the reserve estimates may occur based on actual results of production, drilling, costs and pricing.
The Company bases the estimated discounted future net cash flows from proved reserves on prices and current costs in accordance withSEC requirements. Actual future prices and costs may be significantly different. Sustained downward movements in natural gas and oilprices could result in future noncash write-downs of the Company’s natural gas and oil properties.
Environmental and Regulatory RisksSome of the Company’s operations are subject to extensive environmental laws and regulations that may increase costs of operations,impact or limit business plans, or expose the Company to environmental liabilities.
The Company is subject to extensive environmental laws and regulations affecting many aspects of its present and future operationsincluding air quality, water quality, waste management and other environmental considerations. These laws and regulations can result inincreased capital, operating and other costs, and delays as a result of ongoing litigation and administrative proceedings and compliance,remediation, containment and monitoring obligations, particularly with regard to laws relating to power plant emissions and CBNGdevelopment. These laws and regulations generally require the Company to obtain and comply with a wide variety of environmentallicenses, permits, inspections and other approvals. Public officials and entities, as well as private individuals and organizations, may seekinjunctive relief or other remedies to enforce applicable environmental laws and regulations. The Company cannot predict the outcome(financial or operational) of any related litigation or administrative proceedings that may arise.
Existing environmental laws and regulations may be revised and new laws and regulations seeking to protect the environment may beadopted or become applicable to the Company. These laws and regulations could require the Company to limit the use or output of certainfacilities, restrict the use of certain fuels, require the installation of pollution control equipment or the initiation of pollution controltechnologies, remediate environmental contamination, remove or reduce environmental hazards, or prevent or limit the development of
FO
RM
10
-K
20 MDU Resources Group, Inc. Form 10-K

Part IFO
RM
10
-K
resources. Revised or additional laws and regulations, which result in increased compliance costs or additional operating restrictions,particularly if those costs are not fully recoverable from customers, could have a material adverse effect on the Company’s results ofoperations and cash flows.
The Company’s electric generation operations could be adversely impacted by global climate change initiatives to reduce GHG emissions.
Concern that GHG emissions are contributing to global climate change has led to international, federal and state legislative and regulatoryproposals to reduce or mitigate the effects of GHG emissions including the EPA’s proposed endangerment finding for GHGs which couldlead to regulation of GHG under the Clean Air Act. The primary GHG emitted from the Company’s operations is carbon dioxide fromcombustion of fossil fuels at Montana-Dakota’s electric generating facilities, particularly its coal-fired electric generating facilities whichcomprise more than 70 percent of Montana-Dakota’s generating capacity. More than 90 percent of the electricity generated by Montana-Dakota is from coal-fired plants and Montana-Dakota has acquired a 25 MW ownership interest in the Wygen III coal-fired generationfacility which is under construction near Gillette, Wyoming. Montana-Dakota also owns approximately 100 MW of natural gas- and oil-firedpeaking plants. While there are many uncertainties regarding the future of GHG regulation, Montana-Dakota’s electric generating facilitiesmay be subject to regulation under climate change laws or regulations within the next few years. Implementation of treaties, legislation orregulations to reduce GHG emissions could affect Montana-Dakota’s electric utility operations by requiring the expansion of energyconservation efforts and/or the increased development of renewable energy sources, as well as instituting other mandates that couldsignificantly increase the capital expenditures and operating costs at its fossil fuel-fired generating facilities. The most prominent federallegislative proposals are based on “cap and trade” programs which place a limit on GHG emissions from major emission sources such asthe electric generating industry. The impact of a cap and trade program on Montana-Dakota would be determined by considerations suchas the overall GHG emissions cap level, the scope and timeframe by which the cap level is decreased, the extent to which GHG offsets areallowed, whether allowances are given to new and existing emission sources, and the indirect impact on natural gas, coal and other fuelprices. Montana-Dakota’s ability to recover costs incurred to comply with new regulations and programs will also be important indetermining the financial impact on the Company.
Due to the uncertainty of technologies available to control GHG emissions and the unknown nature of compliance obligations with potentialGHG emission legislation or regulations, the Company cannot determine the financial impact on its operations. If Montana-Dakota does notreceive timely and full recovery of the costs of complying with GHG emission legislation and regulations from its customers, then suchrequirements could have an adverse impact on the results of its operations.
One of the Company’s subsidiaries is subject to ongoing litigation and administrative proceedings in connection with its CBNG developmentactivities. These proceedings have caused delays in CBNG drilling activity, and the ultimate outcome of the actions could have a materialnegative effect on existing CBNG operations and/or the future development of its CBNG properties.
Fidelity’s operations are and have been the subject of numerous lawsuits filed in connection with its CBNG development in the Montanaand Wyoming Powder River Basin. If the plaintiffs are successful in the current lawsuits, the ultimate outcome of the actions could have amaterial negative effect on Fidelity’s existing CBNG operations and/or the future development of its CBNG properties.
The BER in March 2006 issued a decision in a rulemaking proceeding, initiated by the NPRC, that amends the non-degradation policyapplicable to water discharged in connection with CBNG operations. The amended policy includes additional limitations on factorsdeemed harmful, thereby restricting water discharges even further than under previous standards. Due in part to this amended policy, inMay 2006, the Northern Cheyenne Tribe commenced litigation in Montana state court challenging two five-year water discharge permitsthat the Montana DEQ granted to Fidelity in February 2006 and which are critical to Fidelity’s ability to manage water produced underpresent and future CBNG operations. Although the Montana state court decided the case in favor of Fidelity and the Montana DEQ inJanuary 2009, the case was appealed to the Montana Supreme Court in March 2009. In a separate proceeding in Montana state court,plaintiffs are challenging the ROD adopted by the MBOGC in 2003 and alleging that various water management tools, including Fidelity’swater discharge permits, allow for the “wasting” of water in violation of the Montana State Constitution. If these permits are set aside,Fidelity’s CBNG operations in Montana could be significantly and adversely affected.
The Company is subject to extensive government regulations that may delay and/or have a negative impact on its business and its results ofoperations and cash flows. Statutory and regulatory requirements also may limit another party’s ability to acquire the Company.
The Company is subject to regulation by federal, state and local regulatory agencies with respect to, among other things, allowed rates ofreturn, financing, industry rate structures, and recovery of purchased power and purchased gas costs. These governmental regulationssignificantly influence the Company’s operating environment and may affect its ability to recover costs from its customers. The Company isunable to predict the impact on operating results from the future regulatory activities of any of these agencies. Changes in regulations orthe imposition of additional regulations could have an adverse impact on the Company’s results of operations and cash flows. Approval
MDU Resources Group, Inc. Form 10-K 21

Part I
from a number of federal and state regulatory agencies would need to be obtained by any potential acquirer of the Company. The approvalprocess could be lengthy and the outcome uncertain.
Risks Relating to Foreign OperationsThe value of the Company’s investments in foreign operations may diminish due to political, regulatory and economic conditions andchanges in currency exchange rates in countries where the Company does business.
The Company is subject to political, regulatory and economic conditions and changes in currency exchange rates in foreign countrieswhere the Company does business. Significant changes in the political, regulatory or economic environment in these countries couldnegatively affect the value of the Company’s investments located in these countries. Also, since the Company is unable to predict thefluctuations in the foreign currency exchange rates, these fluctuations may have an adverse impact on the Company’s results of operationsand cash flows.
Other RisksWeather conditions can adversely affect the Company’s operations and revenues and cash flows.
The Company’s results of operations can be affected by changes in the weather. Weather conditions directly influence the demand forelectricity and natural gas, affect the price of energy commodities, affect the ability to perform services at the construction services andconstruction materials and contracting businesses and affect ongoing operation and maintenance and construction and drilling activitiesfor the pipeline and energy services and natural gas and oil production businesses. In addition, severe weather can be destructive, causingoutages, reduced natural gas and oil production, and/or property damage, which could require additional costs to be incurred. Physicalchanges to the planet could further change the intensity and frequency of severe weather conditions. As a result, adverse weatherconditions could negatively affect the Company’s results of operations, financial condition and cash flows.
Competition is increasing in all of the Company’s businesses.
All of the Company’s businesses are subject to increased competition. Construction services’ competition is based primarily on price andreputation for quality, safety and reliability. The construction materials products are marketed under highly competitive conditions and aresubject to such competitive forces as price, service, delivery time and proximity to the customer. The electric utility and natural gasindustries also are experiencing increased competitive pressures as a result of consumer demands, technological advances, volatility innatural gas prices and other factors. Pipeline and energy services competes with several pipelines for access to natural gas supplies andgathering, transportation and storage business. The natural gas and oil production business is subject to competition in the acquisition anddevelopment of natural gas and oil properties. The increase in competition could negatively affect the Company’s results of operations,financial condition and cash flows.
The Company could be subject to limitations on its ability to pay dividends.
The Company depends on earnings from its divisions and dividends from its subsidiaries to pay dividends on its common stock.Regulatory, contractual and legal limitations, as well as capital requirements and the Company’s financial performance or cash flows, couldlimit the earnings of the Company’s divisions and subsidiaries which, in turn, could restrict the Company’s ability to pay dividends on itscommon stock and adversely affect the Company’s stock price.
An increase in costs related to obligations under multi-employer pension plans could have a material negative effect on the Company’sresults of operations and cash flows.
The Company participates in various multi-employer pension plans for employees represented by certain unions. The Company is requiredto make contributions to these plans in amounts established under collective bargaining agreements. Pension expense for these plans isrecognized as contributions are made. The amount of any increase or decrease in the Company’s required contributions to these multi-employer pension plans will depend upon many factors including the outcome of collective bargaining, actions taken by trustees whomanage the plans, government regulations, the actual return on assets held in the plans and the potential payment of a withdrawal liabilityupon withdrawal from a plan, among other factors. Based on available information, the Company believes that many of the multi-employerplans to which it contributes are underfunded. The underfunded liabilities of these plans may result in increased future payments by theCompany and other participating employers. The Company’s risk of such increased payments may be greater if any of the participatingemployers in these underfunded plans withdraws from the plan due to insolvency and is not able to contribute an amount sufficient tofund the unfunded liabilities associated with its participants in the plan. The Company may experience increased operating expenses as aresult of required contributions to multi-employer pension plans, which may have a material adverse effect on the Company’s results ofoperations and cash flows.
FO
RM
10
-K
22 MDU Resources Group, Inc. Form 10-K

Part IFO
RM
10
-K
Other factors that could impact the Company’s businesses.
The following are other factors that should be considered for a better understanding of the financial condition of the Company. These otherfactors may impact the Company’s financial results in future periods.
• Acquisition, disposal and impairments of assets or facilities
• Changes in operation, performance and construction of plant facilities or other assets
• Changes in present or prospective generation
• The ability to obtain adequate and timely cost recovery for the Company’s regulated operations through regulatory proceedings
• The availability of economic expansion or development opportunities
• Population growth rates and demographic patterns
• Market demand for, and/or available supplies of, energy- and construction-related products and services
• The cyclical nature of large construction projects at certain operations
• Changes in tax rates or policies
• Unanticipated project delays or changes in project costs, including related energy costs
• Unanticipated changes in operating expenses or capital expenditures
• Labor negotiations or disputes
• Inability of the various contract counterparties to meet their contractual obligations
• Changes in accounting principles and/or the application of such principles to the Company
• Changes in technology
• Changes in legal or regulatory proceedings
• The ability to effectively integrate the operations and the internal controls of acquired companies
• The ability to attract and retain skilled labor and key personnel
• Increases in employee and retiree benefit costs and funding requirements
Item 1B. Unresolved Comments
The Company has no unresolved comments with the SEC.
Item 3. Legal Proceedings
For information regarding legal proceedings of the Company, see Item 8 – Note 19.
Item 4. Submission of Matters to a Vote of Security Holders
No matters were submitted to a vote of security holders during the fourth quarter of 2009.
MDU Resources Group, Inc. Form 10-K 23

Part II
Item 5. Market for the Registrant’s Common Equity, Related Stockholder Matters and IssuerPurchases of Equity Securities
The Company’s common stock is listed on the New York Stock Exchange under the symbol “MDU.” The price range of the Company’scommon stock as reported by The Wall Street Journal composite tape during 2009 and 2008 and dividends declared thereon wereas follows:
CommonCommon Common Stock
Stock Price Stock Price Dividends(High) (Low) Per Share
2009
First quarter $22.89 $12.79 $.1550Second quarter 19.76 15.70 .1550Third quarter 21.16 17.44 .1550Fourth quarter 24.22 19.96 .1575
$.6225
2008
First quarter $27.83 $23.08 $.1450Second quarter 35.25 24.70 .1450Third quarter 35.34 26.03 .1550Fourth quarter 29.50 15.50 .1550
$.6000
As of December 31, 2009, the Company’s common stock was held by approximately 15,500 stockholders of record.
FO
RM
10
-K
24 MDU Resources Group, Inc. Form 10-K

Part IIFO
RM
10
-K
Item 6. Selected Financial Data
2009* 2008** 2007 2006 2005 2004
Selected Financial DataOperating revenues (000’s):
Electric $ 196,171 $ 208,326 $ 193,367 $ 187,301 $ 181,238 $ 178,803Natural gas distribution 1,072,776 1,036,109 532,997 351,988 384,199 316,120Construction services 819,064 1,257,319 1,103,215 987,582 687,125 426,821Pipeline and energy services 307,827 532,153 447,063 443,720 477,311 354,164Natural gas and oil production 439,655 712,279 514,854 483,952 439,367 342,840Construction materials and contracting 1,515,122 1,640,683 1,761,473 1,877,021 1,604,610 1,322,161Other 9,487 10,501 10,061 8,117 6,038 4,423Intersegment eliminations (183,601) (394,092) (315,134) (335,142) (375,965) (272,199)
$4,176,501 $5,003,278 $4,247,896 $4,004,539 $3,403,923 $2,673,133
Operating income (loss) (000’s):Electric $ 36,709 $ 35,415 $ 31,652 $ 27,716 $ 29,038 $ 26,776Natural gas distribution 76,899 76,887 32,903 8,744 7,404 1,820Construction services 44,255 81,485 75,511 50,651 28,171 (5,757)Pipeline and energy services 69,388 49,560 58,026 57,133 43,507 29,570Natural gas and oil production (473,399) 202,954 227,728 231,802 230,383 178,897Construction materials and contracting 93,270 62,849 138,635 156,104 105,318 86,030Other (219) 2,887 (7,335) (9,075) (5,298) (3,954)
$ (153,097) $ 512,037 $ 557,120 $ 523,075 $ 438,523 $ 313,382
Earnings (loss) on common stock (000’s):Electric $ 24,099 $ 18,755 $ 17,700 $ 14,401 $ 13,940 $ 12,790Natural gas distribution 30,796 34,774 14,044 5,680 3,515 2,182Construction services 25,589 49,782 43,843 27,851 14,558 (5,650)Pipeline and energy services 37,845 26,367 31,408 32,126 22,867 13,806Natural gas and oil production (296,730) 122,326 142,485 145,657 141,625 110,779Construction materials and contracting 47,085 30,172 77,001 85,702 55,040 50,707Other 7,357 10,812 (4,380) (4,324) 13,061 15,967
Earnings (loss) on common stock beforeincome from discontinued operations (123,959) 292,988 322,101 307,093 264,606 200,581
Income from discontinuedoperations, net of tax – – 109,334 7,979 9,792 5,801
$ (123,959) $ 292,988 $ 431,435 $ 315,072 $ 274,398 $ 206,382
Earnings (loss) per common share before discontinued operations – diluted $ (.67) $ 1.59 $ 1.76 $ 1.69 $ 1.47 $ 1.14
Discontinued operations, net of tax – – .60 .05 .06 .03
$ (.67) $ 1.59 $ 2.36 $ 1.74 $ 1.53 $ 1.17
Common Stock StatisticsWeighted average common shares
outstanding – diluted (000’s) 185,175 183,807 182,902 181,392 179,490 176,117Dividends per common share $ .6225 $ .6000 $ .5600 $ .5234 $ .4934 $ .4667Book value per common share $ 13.61 $ 14.95 $ 13.80 $ 11.88 $ 10.43 $ 9.39Market price per common share (year end) $ 23.60 $ 21.58 $ 27.61 $ 25.64 $ 21.83 $ 17.79Market price ratios:
Dividend payout N/A 38% 24% 30% 32% 40%Yield 2.7% 2.9% 2.1% 2.1% 2.3% 2.7%Price/earnings ratio N/A 13.6x 11.7x 14.7x 14.3x 15.2xMarket value as a percent of book value 173.4% 144.3% 200.1% 215.8% 209.2% 189.4%
Profitability IndicatorsReturn on average common equity (4.9)% 11.0% 18.5% 15.6% 15.7% 13.2%Return on average invested capital (1.7)% 8.0% 13.1% 10.6% 10.8% 9.4%Fixed charges coverage, including
preferred dividends –*** 5.3x 6.4x 6.4x 6.6x 4.8x
GeneralTotal assets (000’s) $5,990,952 $6,587,845 $5,592,434 $4,903,474 $4,423,562 $3,733,521Total debt (000’s) $1,509,606 $1,752,402 $1,310,163 $1,254,582 $1,206,510 $ 945,487Capitalization ratios:
Common equity 63% 61% 66% 63% 61% 63%Preferred stocks – – – – – 1Total debt 37 39 34 37 39 36
100% 100% 100% 100% 100% 100%
* Reflects a $384.4 million after-tax noncash write-down of natural gas and oil properties.** Reflects an $84.2 million after-tax noncash write-down of natural gas and oil properties.
*** For more information on fixed charges coverage, including preferred dividends, see Item 7 – MD&A.
Notes:• Common stock share amounts reflect the Company’s three-for-two common stock split effected in July 2006.• Cascade and Intermountain, natural gas distribution businesses, were acquired on July 2, 2007, and October 1, 2008, respectively. For further information,
see Item 8 – Note 2.
MDU Resources Group, Inc. Form 10-K 25

Part II
Item 6. Selected Financial Data (continued)
2009 2008 2007 2006 2005 2004
ElectricRetail sales (thousand kWh) 2,663,560 2,663,452 2,601,649 2,483,248 2,413,704 2,303,460Sales for resale (thousand kWh) 90,789 223,778 165,639 483,944 615,220 821,516Electric system summer generating and firm purchase capability – kW (Interconnected system) 594,700 597,250 571,160 547,485 546,085 544,220
Demand peak – kW(Interconnected system) 525,643 525,643 525,643 485,456 470,470 470,470
Electricity produced (thousand kWh) 2,203,665 2,538,439 2,253,851 2,218,059 2,327,228 2,552,873Electricity purchased (thousand kWh) 682,152 516,654 576,613 833,647 892,113 794,829Average cost of fuel and purchasedpower per kWh $ .023 $ .025 $ .025 $ .022 $ .020 $ .019
Natural Gas Distribution* Sales (Mdk) 102,670 87,924 52,977 34,553 36,231 36,607Transportation (Mdk) 132,689 103,504 54,698 14,058 14,565 13,856Degree days (% of normal)
Montana-Dakota 104% 103% 93% 87% 91% 91%Cascade 105% 108% 102% – – –Intermountain 107% 90% – – – –
Pipeline and Energy ServicesTransportation (Mdk) 163,283 138,003 140,762 130,889 104,909 114,206Gathering (Mdk) 92,598 102,064 92,414 87,135 82,111 80,527
Natural Gas and Oil Production Production:
Natural gas (MMcf) 56,632 65,457 62,798 62,062 59,378 59,750Oil (MBbls) 3,111 2,808 2,365 2,041 1,707 1,747Total production (MMcfe) 75,299 82,303 76,988 74,307 69,622 70,234
Average realized prices (including hedges):Natural gas (per Mcf) $ 5.16 $ 7.38 $ 5.96 $ 6.03 $ 6.11 $ 4.69Oil (per barrel) $47.38 $81.68 $59.26 $50.64 $42.59 $34.16
Average realized prices (excluding hedges):Natural gas (per Mcf) $ 2.99 $ 7.29 $ 5.37 $ 5.62 $ 6.87 $ 4.90Oil (per barrel) $49.76 $82.28 $59.53 $51.73 $48.73 $37.75
Proved reserves:Natural gas (MMcf) 448,425 604,282 523,737 538,100 489,100 453,200Oil (MBbls) 34,216 34,348 30,612 27,100 21,200 17,100
Total reserves (MMcfe) 653,724 810,371 707,409 700,700 616,400 555,900
Construction Materials and ContractingSales (000’s):
Aggregates (tons) 23,995 31,107 36,912 45,600 47,204 43,444Asphalt (tons) 6,360 5,846 7,062 8,273 9,142 8,643Ready-mixed concrete (cubic yards) 3,042 3,729 4,085 4,588 4,448 4,292
Aggregate reserves (000’s tons) 1,125,491 1,145,161 1,215,253 1,248,099 1,273,696 1,257,498
* Cascade and Intermountain were acquired on July 2, 2007, and October 1, 2008, respectively. For further information, see Item 8 – Note 2.
FO
RM
10
-K
26 MDU Resources Group, Inc. Form 10-K

Part IIFO
RM
10
-K
Item 7. Management’s Discussion and Analysis of Financial Condition and Results of Operations
OverviewThe Company’s strategy is to apply its expertise in energy and transportation infrastructure industries to increase market share, increaseprofitability and enhance shareholder value through:
• Organic growth as well as a continued disciplined approach to the acquisition of well-managed companies and properties
• The elimination of system-wide cost redundancies through increased focus on integration of operations and standardization andconsolidation of various support services and functions across companies within the organization
• The development of projects that are accretive to earnings per share and return on invested capital
The Company has capabilities to fund its growth and operations through various sources, including internally generated funds, commercialpaper facilities and the issuance from time to time of debt and equity securities. Due to recent economic volatility, the Company in 2009increased its focus on the use of operating cash flows to substantially fund capital expenditures. In the event that access to the commercialpaper markets were to become unavailable, the Company may need to borrow under its credit agreements. For more information on theCompany’s net capital expenditures, see Liquidity and Capital Commitments.
The key strategies for each of the Company’s business segments and certain related business challenges are summarized below. For asummary of the Company’s business segments, see Item 8 – Note 15.
Key Strategies and ChallengesElectric and Natural Gas DistributionStrategy Provide competitively priced energy to customers while working with them to ensure efficient usage. Both the electric and naturalgas distribution segments continually seek opportunities for growth and expansion of their customer base through extensions of existingoperations, including electric generation and transmission build-out, and through selected acquisitions of companies and properties atprices that will provide stable cash flows and an opportunity for the Company to earn a competitive return on investment.
Challenges Both segments are subject to extensive regulation in the state jurisdictions where they conduct operations with respect to costsand permitted returns on investment as well as subject to certain operational regulations at the federal level. The ability of these segmentsto grow through acquisitions is subject to significant competition from other energy providers. In addition, the ability of both segments togrow service territory and customer base is affected by the economic environment of the markets served and competition from otherenergy providers and fuels. The construction of electric generating facilities and transmission lines may be subject to increasing cost andlead time, extensive permitting procedures, and federal and state legislative and regulatory initiatives, which may necessitate increases inelectric energy prices. Legislative and regulatory initiatives to increase renewable energy resources and reduce GHG emissions couldincrease the price and decrease the retail demand for electricity and natural gas.
Construction ServicesStrategy Provide a competitive return on investment while operating in a competitive industry by: building new and strengthening existingcustomer relationships; effectively controlling costs; retaining, developing and recruiting talented employees; focusing businessdevelopment efforts on project areas that will permit higher margins; and properly managing risk. This segment continuously seeksopportunities to expand through strategic acquisitions.
Challenges This segment operates in highly competitive markets with many jobs subject to competitive bidding. Maintenance of effectiveoperational and cost controls, retention of key personnel, managing through downturns in the economy and effective management ofworking capital are ongoing challenges.
Pipeline and Energy ServicesStrategy Utilize the segment’s existing expertise in energy infrastructure and related services to increase market share and profitabilitythrough optimization of existing operations, internal growth, and acquisitions of energy-related assets and companies. Incremental andnew growth opportunities include: access to new sources of natural gas for storage, gathering and transportation services; expansion ofexisting gathering, transmission and storage facilities; expansion of related energy services; and incremental expansion of pipeline capacityto allow customers access to more liquid and higher-priced markets.
Challenges Challenges for this segment include: energy price volatility; natural gas basis differentials; regulatory requirements; recruitmentand retention of a skilled workforce; and competition from other natural gas pipeline and gathering companies.
MDU Resources Group, Inc. Form 10-K 27
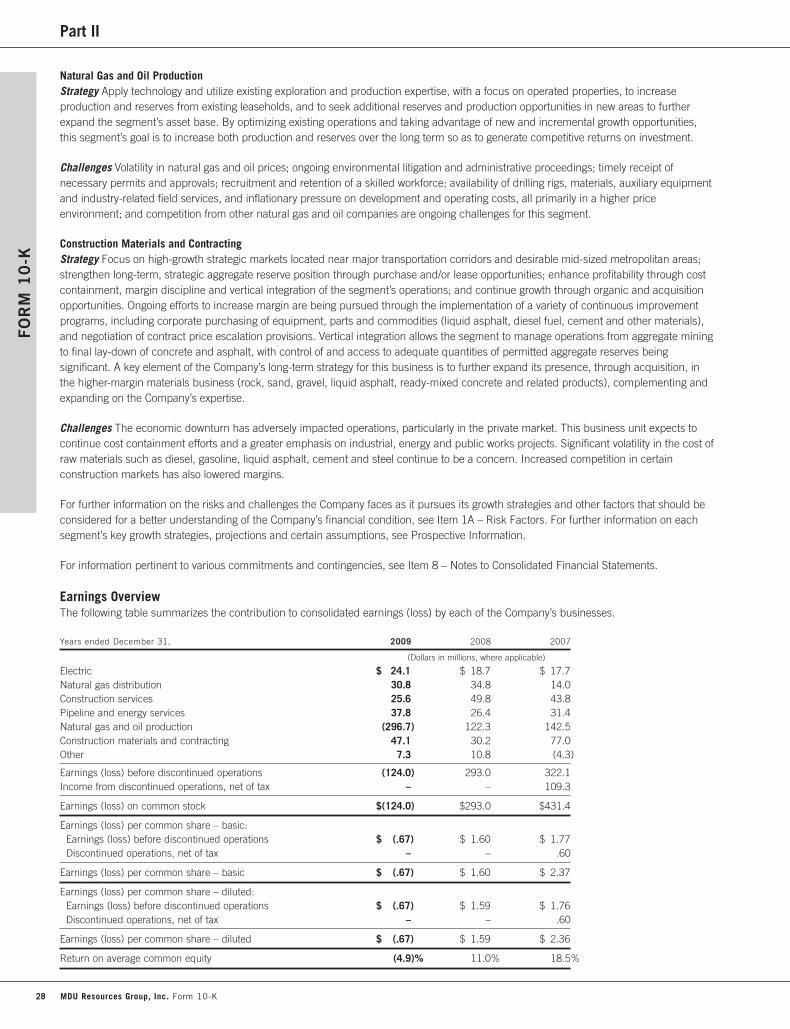
Part II
Natural Gas and Oil ProductionStrategy Apply technology and utilize existing exploration and production expertise, with a focus on operated properties, to increaseproduction and reserves from existing leaseholds, and to seek additional reserves and production opportunities in new areas to furtherexpand the segment’s asset base. By optimizing existing operations and taking advantage of new and incremental growth opportunities,this segment’s goal is to increase both production and reserves over the long term so as to generate competitive returns on investment.
Challenges Volatility in natural gas and oil prices; ongoing environmental litigation and administrative proceedings; timely receipt ofnecessary permits and approvals; recruitment and retention of a skilled workforce; availability of drilling rigs, materials, auxiliary equipmentand industry-related field services, and inflationary pressure on development and operating costs, all primarily in a higher priceenvironment; and competition from other natural gas and oil companies are ongoing challenges for this segment.
Construction Materials and ContractingStrategy Focus on high-growth strategic markets located near major transportation corridors and desirable mid-sized metropolitan areas;strengthen long-term, strategic aggregate reserve position through purchase and/or lease opportunities; enhance profitability through costcontainment, margin discipline and vertical integration of the segment’s operations; and continue growth through organic and acquisitionopportunities. Ongoing efforts to increase margin are being pursued through the implementation of a variety of continuous improvementprograms, including corporate purchasing of equipment, parts and commodities (liquid asphalt, diesel fuel, cement and other materials),and negotiation of contract price escalation provisions. Vertical integration allows the segment to manage operations from aggregate miningto final lay-down of concrete and asphalt, with control of and access to adequate quantities of permitted aggregate reserves beingsignificant. A key element of the Company’s long-term strategy for this business is to further expand its presence, through acquisition, inthe higher-margin materials business (rock, sand, gravel, liquid asphalt, ready-mixed concrete and related products), complementing andexpanding on the Company’s expertise.
Challenges The economic downturn has adversely impacted operations, particularly in the private market. This business unit expects tocontinue cost containment efforts and a greater emphasis on industrial, energy and public works projects. Significant volatility in the cost ofraw materials such as diesel, gasoline, liquid asphalt, cement and steel continue to be a concern. Increased competition in certainconstruction markets has also lowered margins.
For further information on the risks and challenges the Company faces as it pursues its growth strategies and other factors that should beconsidered for a better understanding of the Company’s financial condition, see Item 1A – Risk Factors. For further information on eachsegment’s key growth strategies, projections and certain assumptions, see Prospective Information.
For information pertinent to various commitments and contingencies, see Item 8 – Notes to Consolidated Financial Statements.
Earnings OverviewThe following table summarizes the contribution to consolidated earnings (loss) by each of the Company’s businesses.
Years ended December 31, 2009 2008 2007
(Dollars in millions, where applicable)
Electric $ 24.1 $ 18.7 $ 17.7Natural gas distribution 30.8 34.8 14.0Construction services 25.6 49.8 43.8Pipeline and energy services 37.8 26.4 31.4Natural gas and oil production (296.7) 122.3 142.5Construction materials and contracting 47.1 30.2 77.0Other 7.3 10.8 (4.3)
Earnings (loss) before discontinued operations (124.0) 293.0 322.1Income from discontinued operations, net of tax – – 109.3
Earnings (loss) on common stock $(124.0) $293.0 $431.4
Earnings (loss) per common share – basic:Earnings (loss) before discontinued operations $ (.67) $ 1.60 $ 1.77Discontinued operations, net of tax – – .60
Earnings (loss) per common share – basic $ (.67) $ 1.60 $ 2.37
Earnings (loss) per common share – diluted:Earnings (loss) before discontinued operations $ (.67) $ 1.59 $ 1.76Discontinued operations, net of tax – – .60
Earnings (loss) per common share – diluted $ (.67) $ 1.59 $ 2.36
Return on average common equity (4.9)% 11.0% 18.5%
FO
RM
10
-K
28 MDU Resources Group, Inc. Form 10-K
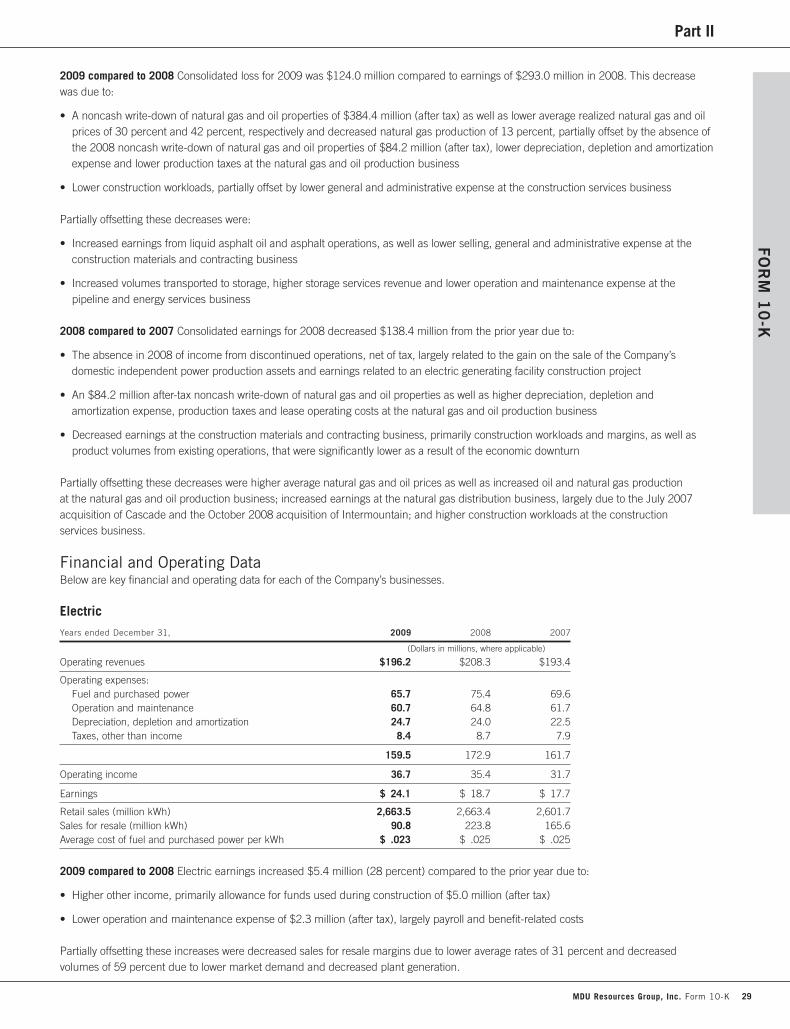
Part IIFO
RM
10
-K
2009 compared to 2008 Consolidated loss for 2009 was $124.0 million compared to earnings of $293.0 million in 2008. This decreasewas due to:
• A noncash write-down of natural gas and oil properties of $384.4 million (after tax) as well as lower average realized natural gas and oilprices of 30 percent and 42 percent, respectively and decreased natural gas production of 13 percent, partially offset by the absence ofthe 2008 noncash write-down of natural gas and oil properties of $84.2 million (after tax), lower depreciation, depletion and amortizationexpense and lower production taxes at the natural gas and oil production business
• Lower construction workloads, partially offset by lower general and administrative expense at the construction services business
Partially offsetting these decreases were:
• Increased earnings from liquid asphalt oil and asphalt operations, as well as lower selling, general and administrative expense at theconstruction materials and contracting business
• Increased volumes transported to storage, higher storage services revenue and lower operation and maintenance expense at thepipeline and energy services business
2008 compared to 2007 Consolidated earnings for 2008 decreased $138.4 million from the prior year due to:
• The absence in 2008 of income from discontinued operations, net of tax, largely related to the gain on the sale of the Company’sdomestic independent power production assets and earnings related to an electric generating facility construction project
• An $84.2 million after-tax noncash write-down of natural gas and oil properties as well as higher depreciation, depletion andamortization expense, production taxes and lease operating costs at the natural gas and oil production business
• Decreased earnings at the construction materials and contracting business, primarily construction workloads and margins, as well asproduct volumes from existing operations, that were significantly lower as a result of the economic downturn
Partially offsetting these decreases were higher average natural gas and oil prices as well as increased oil and natural gas productionat the natural gas and oil production business; increased earnings at the natural gas distribution business, largely due to the July 2007acquisition of Cascade and the October 2008 acquisition of Intermountain; and higher construction workloads at the constructionservices business.
Financial and Operating DataBelow are key financial and operating data for each of the Company’s businesses.
Electric
Years ended December 31, 2009 2008 2007
(Dollars in millions, where applicable)
Operating revenues $196.2 $208.3 $193.4
Operating expenses:Fuel and purchased power 65.7 75.4 69.6Operation and maintenance 60.7 64.8 61.7Depreciation, depletion and amortization 24.7 24.0 22.5Taxes, other than income 8.4 8.7 7.9
159.5 172.9 161.7
Operating income 36.7 35.4 31.7
Earnings $ 24.1 $ 18.7 $ 17.7
Retail sales (million kWh) 2,663.5 2,663.4 2,601.7Sales for resale (million kWh) 90.8 223.8 165.6Average cost of fuel and purchased power per kWh $ .023 $ .025 $ .025
2009 compared to 2008 Electric earnings increased $5.4 million (28 percent) compared to the prior year due to:
• Higher other income, primarily allowance for funds used during construction of $5.0 million (after tax)
• Lower operation and maintenance expense of $2.3 million (after tax), largely payroll and benefit-related costs
Partially offsetting these increases were decreased sales for resale margins due to lower average rates of 31 percent and decreasedvolumes of 59 percent due to lower market demand and decreased plant generation.
MDU Resources Group, Inc. Form 10-K 29

Part II
2008 compared to 2007 Electric earnings increased $1.0 million (6 percent) compared to the prior year due to:
• Higher retail sales margins, largely due to the implementation of higher rates in Montana, and increased retail sales volumes of2 percent
• Increased sales for resale volumes of 35 percent, primarily due to the addition of the wind-powered electric generating station nearBaker, Montana, and higher plant availability
Partially offsetting these increases were:
• Higher operation and maintenance expense of $1.7 million (after tax), primarily higher payroll and benefit-related costs, as well ashigher scheduled maintenance outage costs at electric generating facilities
• Increased interest expense of $1.2 million (after tax)
• Higher depreciation, depletion and amortization expense of $900,000 (after tax), largely due to higher property, plant andequipment balances
Natural Gas Distribution
Years ended December 31, 2009 2008 2007
(Dollars in millions, where applicable)
Operating revenues $1,072.8 $1,036.1 $533.0
Operating expenses:Purchased natural gas sold 757.6 757.6 372.2Operation and maintenance 140.5 123.6 88.5Depreciation, depletion and amortization 42.7 32.6 19.0Taxes, other than income 55.1 45.4 20.4
995.9 959.2 500.1
Operating income 76.9 76.9 32.9
Earnings $ 30.8 $ 34.8 $ 14.0
Volumes (MMdk):Sales 102.7 87.9 53.0Transportation 132.7 103.5 54.7
Total throughput 235.4 191.4 107.7
Degree days (% of normal)*Montana-Dakota 104.4% 102.7% 92.9%Cascade 105.1% 108.0% 101.7%Intermountain 107.3% 90.3% –
Average cost of natural gas,including transportation, per dk** $ 7.38 $ 8.14 $ 6.53
* Degree days are a measure of the daily temperature-related demand for energy for heating.** Regulated natural gas sales only.Note: Cascade and Intermountain were acquired on July 2, 2007, and October 1, 2008, respectively. For further
information, see Item 8 – Note 2.
2009 compared to 2008 The natural gas distribution business experienced a decrease in earnings of $4.0 million (11 percent) comparedto the prior year due to:
• Absence of a $4.4 million (after tax) gain on the sale of Cascade’s natural gas management service in June 2008
• Lower earnings from energy-related services of $2.0 million (after tax)
Partially offsetting these decreases was lower operation and maintenance expense at existing operations of $2.2 million (after tax),including lower payroll and benefit-related costs.
2008 compared to 2007 The natural gas distribution business experienced an increase in earnings of $20.8 million (148 percent)compared to the prior year due to:
• Earnings of $18.4 million at Cascade and Intermountain, including a $4.4 million (after tax) gain on the sale of Cascade’s natural gasmanagement service, which were acquired on July 2, 2007, and October 1, 2008, respectively
• Increased retail sales volumes from existing operations resulting from colder weather than last year
FO
RM
10
-K
30 MDU Resources Group, Inc. Form 10-K

Part IIFO
RM
10
-K
Construction Services
Years ended December 31, 2009 2008 2007
(In millions)
Operating revenues $819.0 $1,257.3 $1,103.2
Operating expenses:Operation and maintenance 736.3 1,122.7 979.7Depreciation, depletion and amortization 12.8 13.4 14.3Taxes, other than income 25.7 39.7 33.7
774.8 1,175.8 1,027.7
Operating income 44.2 81.5 75.5
Earnings $ 25.6 $ 49.8 $ 43.8
2009 compared to 2008 Construction services earnings decreased $24.2 million (49 percent) compared to the prior year, primarily due tolower construction workloads, largely in the Southwest region, partially offset by lower general and administrative expense of $6.7 million(after tax), largely payroll-related.
2008 compared to 2007 Construction services earnings increased $6.0 million (14 percent) compared to the prior year, primarily dueto higher construction workloads, largely in the Southwest region. Partially offsetting this increase were lower construction margins incertain regions.
Pipeline and Energy Services
Years ended December 31, 2009 2008 2007
(Dollars in millions)
Operating revenues $307.8 $532.2 $447.1
Operating expenses:Purchased natural gas sold 138.8 373.9 291.7Operation and maintenance 63.1 73.8 65.6Depreciation, depletion and amortization 25.5 23.6 21.7Taxes, other than income 11.0 11.3 10.1
238.4 482.6 389.1
Operating income 69.4 49.6 58.0
Income from continuing operations 37.8 26.4 31.4Income from discontinued operations, net of tax – – .1
Earnings $ 37.8 $ 26.4 $ 31.5
Transportation volumes (MMdk):Montana-Dakota 38.9 32.0 29.3Other 124.4 106.0 111.5
163.3 138.0 140.8
Gathering volumes (MMdk) 92.6 102.1 92.4
2009 compared to 2008 Pipeline and energy services earnings increased $11.4 million (44 percent) largely due to:
• Increased transportation volumes of $4.9 million (after tax), largely volumes transported to storage
• Lower operation and maintenance expense of $4.5 million (after tax), largely associated with the natural gas storage litigation, which wassettled in July 2009
• Higher storage services revenues of $3.1 million (after tax)
• Higher gathering rates of $2.2 million (after tax)
Partially offsetting the earnings improvement were decreased gathering volumes of 9 percent. Results also reflect lower operating revenuesand lower purchased natural gas sold, both related to lower natural gas prices. The above table also reflects lower operation andmaintenance expense and revenues related to energy-related service projects.
MDU Resources Group, Inc. Form 10-K 31

Part II
2008 compared to 2007 Pipeline and energy services earnings decreased $5.1 million (16 percent) largely due to:
• Lower storage services revenue of $3.1 million (after tax), largely related to lower storage balances and decreased volumes transportedto storage of 31 percent
• Higher operation and maintenance expense, largely related to natural gas storage litigation, as previously discussed, as well as highermaterials and payroll-related costs
• Higher depreciation, depletion and amortization expense of $1.3 million (after tax), largely due to higher property, plant andequipment balances
Partially offsetting these decreases were a 10 percent increase in off-system transportation volumes and demand fees, related to anexpansion of the Grasslands system, and $3.0 million (after tax) of higher gathering volumes and rates.
Natural Gas and Oil Production
Years ended December 31, 2009 2008 2007
(Dollars in millions, where applicable)
Operating revenues:Natural gas $ 292.3 $482.8 $374.1Oil 147.4 229.3 140.1Other – .2 .6
439.7 712.3 514.8
Operating expenses:Purchased natural gas sold – .1 .3Operation and maintenance:
Lease operating costs 70.1 82.0 66.9Gathering and transportation 24.0 24.8 20.4Other 39.2 41.0 34.6
Depreciation, depletion and amortization 129.9 170.2 127.4Taxes, other than income:
Production and property taxes 29.1 54.7 36.7Other .8 .8 .8
Write-down of natural gas and oil properties 620.0 135.8 –
913.1 509.4 287.1
Operating income (loss) (473.4) 202.9 227.7
Earnings (loss) $(296.7) $122.3 $142.5
Production:Natural gas (MMcf) 56,632 65,457 62,798Oil (MBbls) 3,111 2,808 2,365Total Production (MMcfe) 75,299 82,303 76,988
Average realized prices (including hedges):Natural gas (per Mcf) $ 5.16 $ 7.38 $ 5.96Oil (per Bbl) $ 47.38 $81.68 $59.26
Average realized prices (excluding hedges):Natural gas (per Mcf) $ 2.99 $ 7.29 $ 5.37Oil (per Bbl) $ 49.76 $82.28 $59.53
Average depreciation, depletion and amortization rate, per equivalent Mcf $ 1.64 $ 2.00 $ 1.59
Production costs, including taxes, perequivalent Mcf:
Lease operating costs $ .93 $ 1.00 $ .87Gathering and transportation .32 .30 .26Production and property taxes .39 .66 .48
$ 1.64 $ 1.96 $ 1.61
2009 compared to 2008 The natural gas and oil production business experienced a loss of $296.7 million in 2009 compared to earningsof $122.3 million in 2008 due to:
• A noncash write-down of natural gas and oil properties of $384.4 million (after tax) in 2009, partially offset by the absence of the 2008noncash write-down of natural gas and oil properties of $84.2 million (after tax), both discussed in Item 8 – Note 1
FO
RM
10
-K
32 MDU Resources Group, Inc. Form 10-K

Part IIFO
RM
10
-K
• Lower average realized natural gas and oil prices of 30 percent and 42 percent, respectively
• Decreased natural gas production of 13 percent, largely related to normal production declines at certain properties
Partially offsetting these decreases were:
• Lower depreciation, depletion and amortization expense of $25.0 million (after tax), due to lower depletion rates and decreasedcombined production. The lower depletion rates are largely the result of the write-downs of natural gas and oil properties in December2008 and March 2009.
• Lower production taxes of $15.8 million (after tax) associated largely with lower average prices
• Increased oil production of 11 percent, largely related to drilling activity in the Bakken area, partially offset by normal productiondeclines at certain properties
• Decreased lease operating expenses of $7.3 million (after tax)
2008 compared to 2007 The natural gas and oil production business experienced a decrease in earnings of $20.2 million (14 percent)due to:
• A noncash write-down of natural gas and oil properties of $84.2 million (after tax), as previously discussed
• Higher depreciation, depletion and amortization expense of $26.6 million (after tax), due to higher depletion rates andincreased production
• Higher production taxes of $11.1 million (after tax), primarily due to higher average prices and increased production
• Increased lease operating costs of $9.3 million (after tax), including the East Texas properties acquired in early 2008
Partially offsetting these decreases were:
• Higher average realized natural gas prices of 24 percent
• Higher average realized oil prices of 38 percent
• Increased oil production of 19 percent, largely related to drilling activity in the Bakken area and Paradox Basin as well as productionfrom the East Texas properties
• Increased natural gas production of 4 percent, primarily related to the acquisition of the East Texas properties, as previously discussed
Construction Materials and Contracting
Years ended December 31, 2009 2008 2007
(Dollars in millions)
Operating revenues $1,515.1 $1,640.7 $1,761.5
Operating expenses:Operation and maintenance 1,292.0 1,437.9 1,483.5Depreciation, depletion and amortization 93.6 100.9 95.8Taxes, other than income 36.2 39.1 43.6
1,421.8 1,577.9 1,622.9
Operating income 93.3 62.8 138.6
Earnings $ 47.1 $ 30.2 $ 77.0
Sales (000’s):Aggregates (tons) 23,995 31,107 36,912Asphalt (tons) 6,360 5,846 7,062Ready-mixed concrete (cubic yards) 3,042 3,729 4,085
2009 compared to 2008 Earnings at the construction materials and contracting business increased $16.9 million (56 percent) due to:
• Higher earnings of $17.2 million (after tax) resulting from higher liquid asphalt oil and asphalt volumes and margins
• Lower selling, general and administrative expense of $14.6 million (after tax), largely the result of cost reduction measures
• Higher aggregate margins of $8.3 million (after tax)
MDU Resources Group, Inc. Form 10-K 33

Part II
Partially offsetting the increases were:
• Lower aggregate and ready-mixed concrete sales volumes as a result of the continuing economic downturn
• Lower gains on the sale of property, plant and equipment of $5.5 million (after tax)
2008 compared to 2007 Earnings at the construction materials and contracting business decreased $46.8 million (61 percent) due todecreased construction workloads, margins and product volumes that were significantly lower as a result of the economic downturn,primarily as it relates to the residential market, as well as higher diesel fuel costs at existing operations, which had a combined negativeeffect on earnings of $53.0 million (after tax). Partially offsetting this decrease were earnings from companies acquired since thecomparable prior period, which contributed approximately 8 percent of earnings for 2008.
Other and Intersegment TransactionsAmounts presented in the preceding tables will not agree with the Consolidated Statements of Income due to the Company’s otheroperations and the elimination of intersegment transactions. The amounts relating to these items are as follows:
Years ended December 31, 2009 2008 2007
(In millions)
Other:Operating revenues $ 9.5 $ 10.5 $ 10.0Operation and maintenance 8.1 5.9 15.9Depreciation, depletion and amortization 1.3 1.3 1.2Taxes, other than income .3 .4 .2
Intersegment transactions:Operating revenues $183.6 $394.1 $315.1Purchased natural gas sold 156.7 365.7 286.8Operation and maintenance 26.9 28.4 28.3
For further information on intersegment eliminations, see Item 8 – Note 15.
Prospective InformationThe following information highlights the key growth strategies, projections and certain assumptions for the Company and its subsidiariesand other matters for certain of the Company’s businesses. Many of these highlighted points are “forward-looking statements.” There is noassurance that the Company’s projections, including estimates for growth and changes in earnings, will in fact be achieved. Please refer toassumptions contained in this section, as well as the various important factors listed in Item 1A – Risk Factors. Changes in suchassumptions and factors could cause actual future results to differ materially from the Company’s growth and earnings projections.
MDU Resources Group, Inc.
• Earnings per common share for 2010, diluted, are projected in the range of $1.10 to $1.35.
• The Company expects the percentage of 2010 earnings per common share by quarter to be in the following approximate ranges:
– First quarter – 15 percent to 20 percent
– Second quarter – 20 percent to 25 percent
– Third quarter – 30 percent to 35 percent
– Fourth quarter – 25 percent to 30 percent
• Long-term compound annual growth goals on earnings per share from operations are in the range of 7 percent to 10 percent.
• The Company continually seeks opportunities to expand through strategic acquisitions and organic growth opportunities.
Electric
• The Company continues to realize efficiencies and enhanced service levels through its efforts to standardize operations, share servicesand consolidate back-office functions among its four utility companies.
• The Company is pursuing expansion opportunities.
– In April 2009, the Company purchased a 25 MW ownership interest in the Wygen III power generation facility which is underconstruction near Gillette, Wyoming. This rate-based generation will replace a portion of the purchased power for the Wyoming system.
FO
RM
10
-K
34 MDU Resources Group, Inc. Form 10-K
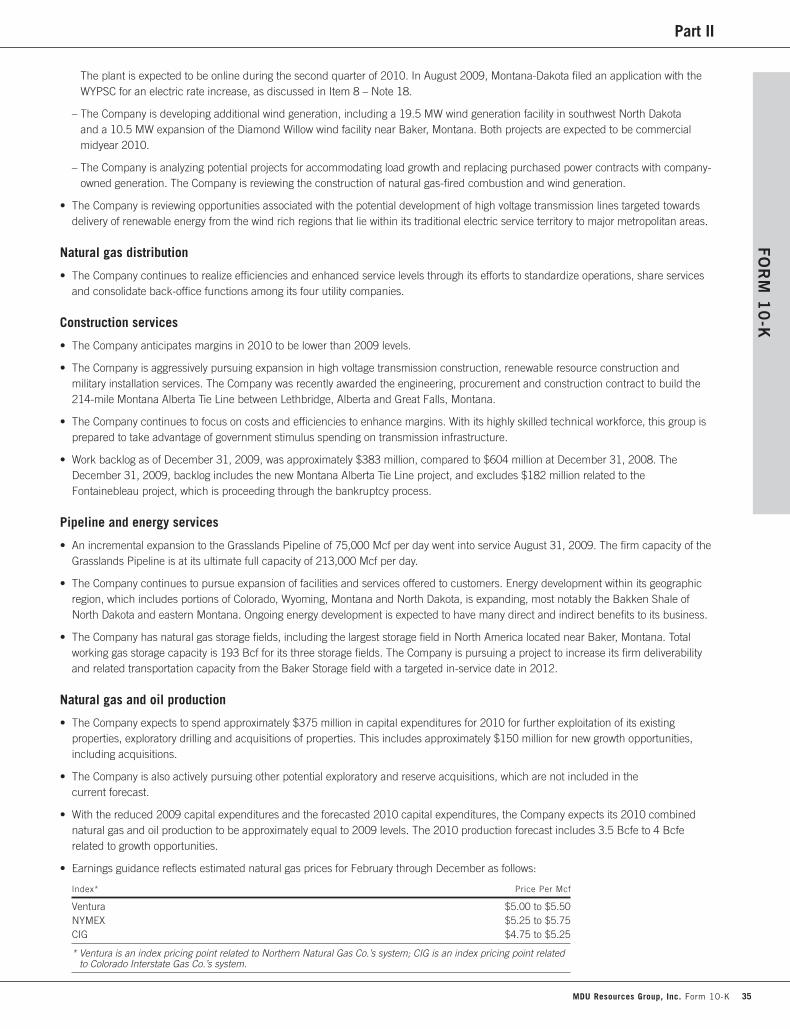
Part IIFO
RM
10
-K
The plant is expected to be online during the second quarter of 2010. In August 2009, Montana-Dakota filed an application with theWYPSC for an electric rate increase, as discussed in Item 8 – Note 18.
– The Company is developing additional wind generation, including a 19.5 MW wind generation facility in southwest North Dakotaand a 10.5 MW expansion of the Diamond Willow wind facility near Baker, Montana. Both projects are expected to be commercialmidyear 2010.
– The Company is analyzing potential projects for accommodating load growth and replacing purchased power contracts with company-owned generation. The Company is reviewing the construction of natural gas-fired combustion and wind generation.
• The Company is reviewing opportunities associated with the potential development of high voltage transmission lines targeted towardsdelivery of renewable energy from the wind rich regions that lie within its traditional electric service territory to major metropolitan areas.
Natural gas distribution
• The Company continues to realize efficiencies and enhanced service levels through its efforts to standardize operations, share servicesand consolidate back-office functions among its four utility companies.
Construction services
• The Company anticipates margins in 2010 to be lower than 2009 levels.
• The Company is aggressively pursuing expansion in high voltage transmission construction, renewable resource construction andmilitary installation services. The Company was recently awarded the engineering, procurement and construction contract to build the214-mile Montana Alberta Tie Line between Lethbridge, Alberta and Great Falls, Montana.
• The Company continues to focus on costs and efficiencies to enhance margins. With its highly skilled technical workforce, this group isprepared to take advantage of government stimulus spending on transmission infrastructure.
• Work backlog as of December 31, 2009, was approximately $383 million, compared to $604 million at December 31, 2008. TheDecember 31, 2009, backlog includes the new Montana Alberta Tie Line project, and excludes $182 million related to theFontainebleau project, which is proceeding through the bankruptcy process.
Pipeline and energy services
• An incremental expansion to the Grasslands Pipeline of 75,000 Mcf per day went into service August 31, 2009. The firm capacity of theGrasslands Pipeline is at its ultimate full capacity of 213,000 Mcf per day.
• The Company continues to pursue expansion of facilities and services offered to customers. Energy development within its geographicregion, which includes portions of Colorado, Wyoming, Montana and North Dakota, is expanding, most notably the Bakken Shale ofNorth Dakota and eastern Montana. Ongoing energy development is expected to have many direct and indirect benefits to its business.
• The Company has natural gas storage fields, including the largest storage field in North America located near Baker, Montana. Totalworking gas storage capacity is 193 Bcf for its three storage fields. The Company is pursuing a project to increase its firm deliverabilityand related transportation capacity from the Baker Storage field with a targeted in-service date in 2012.
Natural gas and oil production
• The Company expects to spend approximately $375 million in capital expenditures for 2010 for further exploitation of its existingproperties, exploratory drilling and acquisitions of properties. This includes approximately $150 million for new growth opportunities,including acquisitions.
• The Company is also actively pursuing other potential exploratory and reserve acquisitions, which are not included in thecurrent forecast.
• With the reduced 2009 capital expenditures and the forecasted 2010 capital expenditures, the Company expects its 2010 combinednatural gas and oil production to be approximately equal to 2009 levels. The 2010 production forecast includes 3.5 Bcfe to 4 Bcferelated to growth opportunities.
• Earnings guidance reflects estimated natural gas prices for February through December as follows:
Index* Price Per Mcf
Ventura $5.00 to $5.50NYMEX $5.25 to $5.75CIG $4.75 to $5.25
* Ventura is an index pricing point related to Northern Natural Gas Co.’s system; CIG is an index pricing point related to Colorado Interstate Gas Co.’s system.
MDU Resources Group, Inc. Form 10-K 35

Part II
• Earnings guidance reflects estimated NYMEX crude oil prices for February through December in the range of $70 to $75 per barrel.
• For 2010, the Company has hedged 45 percent to 50 percent of both its estimated natural gas and oil production. For 2011, theCompany has hedged 10 percent to 15 percent of both its estimated natural gas and oil production. For 2012, the Company hashedged 5 percent to 10 percent of its estimated natural gas production. The hedges that are in place as of January 29, 2010, aresummarized in the following chart:
ForwardNotional
Period Volume PriceCommodity Type Index* Outstanding (MMBtu/Bbl) (Per MMBtu/Bbl)
Natural Gas Swap HSC 1/10 - 12/10 1,606,000 $8.08Natural Gas Swap NYMEX 1/10 - 12/10 3,650,000 $6.18Natural Gas Swap NYMEX 1/10 - 12/10 1,825,000 $6.40Natural Gas Collar NYMEX 1/10 - 12/10 1,825,000 $5.63-$6.00Natural Gas Swap NYMEX 1/10 - 12/10 1,825,000 $5.855Natural Gas Swap NYMEX 1/10 - 12/10 1,825,000 $6.045Natural Gas Swap NYMEX 1/10 - 12/10 1,825,000 $6.045Natural Gas Swap CIG 1/10 - 12/10 3,650,000 $5.03Natural Gas Swap HSC 1/10 - 10/10 608,000 $5.57Natural Gas Swap NYMEX 1/10 - 10/10 2,432,000 $5.645Natural Gas Swap Ventura 1/10 - 12/10 1,825,000 $5.95Natural Gas Swap NYMEX 4/10 - 12/10 3,025,000 $5.54Natural Gas Collar NYMEX 1/10 - 3/11 2,275,000 $5.62-$6.50Natural Gas Swap HSC 1/11 - 12/11 1,350,500 $8.00Natural Gas Swap NYMEX 1/11 - 12/11 4,015,000 $6.1027Natural Gas Swap NYMEX 1/12 - 12/12 3,477,000 $6.27Crude Oil Collar NYMEX 1/10 - 12/10 365,000 $60.00-$75.00Crude Oil Swap NYMEX 1/10 - 12/10 365,000 $73.20Crude Oil Collar NYMEX 1/10 - 12/10 365,000 $70.00-$86.00Crude Oil Swap NYMEX 1/10 - 12/10 365,000 $83.05Crude Oil Collar NYMEX 1/11 - 12/11 547,500 $80.00-$94.00Natural Gas Basis NYMEX to Ventura 1/10 - 12/10 3,650,000 $0.25Natural Gas Basis NYMEX to Ventura 1/10 - 12/10 912,500 $0.245Natural Gas Basis NYMEX to Ventura 1/10 - 12/10 4,562,500 $0.25Natural Gas Basis NYMEX to Ventura 1/10 - 12/10 1,825,000 $0.225Natural Gas Basis NYMEX to Ventura 1/10 - 12/10 912,500 $0.23Natural Gas Basis NYMEX to Ventura 1/10 - 12/10 2,737,500 $0.23Natural Gas Basis NYMEX to Ventura 1/11 - 3/11 450,000 $0.135
* Ventura is an index pricing point related to Northern Natural Gas Co.’s system; CIG is an index pricing point related to Colorado Interstate Gas Co.’s system; HSC is the Houston Ship Channel hub in southeast Texas which connects to several pipelines.
Construction materials and contracting
• Most of the markets served by construction materials are seeing positive impacts related to the federal stimulus spending.
• The Company is well positioned to take advantage of government stimulus spending on transportation infrastructure particularly in theasphalt paving and liquid asphalt oil product lines. Federal transportation stimulus of $7.9 billion was directed to states where theCompany operates. Of that amount, 21 percent was spent in 2009, the remainder to be spent over the next two years, with 82 percentalready obligated to specific projects by the various states.
• The Company continues to pursue work related to energy projects, such as wind towers, transmission projects, geothermal andrefineries. It is also pursuing opportunities for expansion of its existing business lines including initiatives aimed at capturing additionalmarket share and expansion into new markets. The Company has planned green field expansions for its liquid asphalt oil business.
• The Company has a strong emphasis on operational efficiencies and cost reduction.
• Liquid asphalt margins are expected to be lower in 2010 than the record levels experienced in 2009.
• Work backlog as of December 31, 2009, was approximately $459 million, compared to $453 million at December 31, 2008. Althoughpublic project margins tend to be somewhat lower than private construction-related work, the Company anticipates significantcontributions to revenue from public works volume. Ninety-four percent of its year-end backlog is related to public works projectscompared to 80 percent at December 31, 2008.
• As the country’s 8th largest aggregate producer, the Company will continue to strategically manage its 1.1 billion tons of aggregatereserves in all its markets, as well as take further advantage of being vertically integrated.
FO
RM
10
-K
36 MDU Resources Group, Inc. Form 10-K

Part IIFO
RM
10
-K
New Accounting StandardsFor information regarding new accounting standards, see Item 8 – Note 1, which is incorporated by reference.
Critical Accounting Policies Involving Significant EstimatesThe Company has prepared its financial statements in conformity with GAAP. The preparation of these financial statements requiresmanagement to make estimates and assumptions that affect the reported amounts of assets and liabilities, and disclosure of contingentassets and liabilities, at the date of the financial statements as well as the reported amounts of revenues and expenses during the reportingperiod. The Company’s significant accounting policies are discussed in Item 8 – Note 1.
Estimates are used for items such as impairment testing of long-lived assets, goodwill and natural gas and oil properties; fair values ofacquired assets and liabilities under the purchase method of accounting; natural gas and oil reserves; aggregate reserves; propertydepreciable lives; tax provisions; uncollectible accounts; environmental and other loss contingencies; accumulated provision for revenuessubject to refund; costs on construction contracts; unbilled revenues; actuarially determined benefit costs; asset retirement obligations; thevaluation of stock-based compensation; and the fair value of derivative instruments. The Company’s critical accounting policies are subjectto judgments and uncertainties that affect the application of such policies. As discussed below, the Company’s financial position or resultsof operations may be materially different when reported under different conditions or when using different assumptions in the applicationof such policies.
As additional information becomes available, or actual amounts are determinable, the recorded estimates are revised. Consequently,operating results can be affected by revisions to prior accounting estimates. The following critical accounting policies involve significantjudgments and estimates.
Impairment of long-lived assets and intangiblesThe Company reviews the carrying values of its long-lived assets and intangibles, excluding natural gas and oil properties, whenever eventsor changes in circumstances indicate that such carrying values may not be recoverable and annually for goodwill. Unforeseen events andchanges in circumstances and market conditions and material differences in the value of long-lived assets and intangibles due to changesin estimates of future cash flows could negatively affect the fair value of the Company’s assets and result in an impairment charge. If animpairment indicator exists for tangible and intangible assets, excluding goodwill, the asset group held and used is tested for recoverabilityby comparing an estimate of undiscounted future cash flows attributable to the assets compared to the carrying value of the assets. Ifimpairment has occurred, the amount of the impairment recognized is determined by estimating the fair value of the assets and recordinga loss if the carrying value is greater than the fair value. In the case of goodwill, the first step, used to identify a potential impairment,compares the fair value of the reporting unit using discounted cash flows, with its carrying amount, including goodwill. The second step,used to measure the amount of the impairment loss if step one indicates a potential impairment, compares the implied fair value of thereporting unit goodwill with the carrying amount of goodwill.
Fair value is the amount at which the asset could be bought or sold in a current transaction between market participants. The Companyuses critical estimates and assumptions when testing assets for impairment, including present value techniques based on estimates ofcash flows, quoted market prices or valuations by third parties, or multiples of earnings or revenue performance measures. The fair valueof the asset could be different using different estimates and assumptions in these valuation techniques.
There is risk involved when determining the fair value of assets, tangible and intangible, as there may be unforeseen events and changesin circumstances and market conditions and changes in estimates of future cash flows.
The Company believes its estimates used in calculating the fair value of long-lived assets, including goodwill and identifiable intangibles,are reasonable based on the information that is known when the estimates are made.
Natural gas and oil propertiesThe Company uses the full-cost method of accounting for its natural gas and oil production activities. Capitalized costs are subject to a“ceiling test” that limits such costs to the aggregate of the present value of future net cash flows from proved reserves discounted at10 percent, as mandated under the rules of the SEC, plus the cost of unproved properties less applicable income taxes. Future netrevenue was estimated based on end-of-quarter spot market prices adjusted for contracted price changes prior to the fourth quarter of2009. Effective December 31, 2009, the Modernization of Oil and Gas Reporting rules issued by the SEC changed the pricing used toestimate reserves and associated future cash flows to SEC Defined Prices. The Company hedges a portion of its natural gas and oilproduction and the effects of the cash flow hedges are used in determining the full-cost ceiling. Judgments and assumptions are madewhen estimating and valuing reserves. There is risk that sustained downward movements in natural gas and oil prices, changes inestimates of reserve quantities and changes in operating and development costs could result in future noncash write-downs of theCompany’s natural gas and oil properties.
MDU Resources Group, Inc. Form 10-K 37
Part II
Estimates of proved reserves were prepared in accordance with guidelines established by the industry and the SEC. The estimates arearrived at using actual historical wellhead production trends and/or standard reservoir engineering methods utilizing available geological,geophysical, engineering and economic data. Other factors used in the reserve estimates are prices, estimates of well operating and futuredevelopment costs, taxes, timing of operations, and the interests owned by the Company in the properties. These estimates are refined asnew information becomes available.
Revenue recognitionRevenue is recognized when the earnings process is complete, as evidenced by an agreement between the customer and the Company,when delivery has occurred or services have been rendered, when the fee is fixed or determinable and when collection is reasonablyassured. The recognition of revenue in conformity with GAAP requires the Company to make estimates and assumptions that affect thereported amounts of revenue. Critical estimates related to the recognition of revenue include the accumulated provision for revenuessubject to refund and costs on construction contracts under the percentage-of-completion method.
Estimates for revenues subject to refund are established initially for each regulatory rate proceeding and are subject to change dependingon the applicable regulatory agency’s (Agency) approval of final rates. These estimates are based on the Company’s analysis of its as-filedapplication compared to previous Agency decisions in prior rate filings by the Company and other regulated companies. The Companyperiodically reviews the status of its outstanding regulatory proceedings and liability assumptions and may from time to time change itsliability estimates subject to known developments as the regulatory proceedings move through the regulatory review process. The accuracyof the estimates is ultimately determined when the Agency issues its final ruling on each regulatory proceeding for which revenues weresubject to refund. Estimates have changed from time to time as additional information has become available as to what the ultimateoutcome may be and will likely continue to change in the future as new information becomes available on each outstanding regulatoryproceeding that is subject to refund.
The Company recognizes construction contract revenue from fixed-price and modified fixed-price construction contracts at its constructionbusinesses using the percentage-of-completion method, measured by the percentage of costs incurred to date to estimated total costs foreach contract. This method depends largely on the ability to make reasonably dependable estimates related to the extent of progresstoward completion of the contract, contract revenues and contract costs. Inasmuch as contract prices are generally set before the work isperformed, the estimates pertaining to every project could contain significant unknown risks such as volatile labor, material and fuel costs,weather delays, adverse project site conditions, unforeseen actions by regulatory agencies, performance by subcontractors, jobmanagement and relations with project owners.
Several factors are evaluated in determining the bid price for contract work. These include, but are not limited to, the complexities of thejob, past history performing similar types of work, seasonal weather patterns, competition and market conditions, job site conditions, workforce safety, reputation of the project owner, availability of labor, materials and fuel, project location and project completion dates. As aproject commences, estimates are continually monitored and revised as information becomes available and actual costs and conditionssurrounding the job become known.
The Company believes its estimates surrounding percentage-of-completion accounting are reasonable based on the information that isknown when the estimates are made. The Company has contract administration, accounting and management control systems in placethat allow its estimates to be updated and monitored on a regular basis. Because of the many factors that are evaluated in determining bidprices, it is inherent that the Company’s estimates have changed in the past and will continually change in the future as new informationbecomes available for each job.
Purchase accountingThe Company accounts for its acquisitions under the purchase method of accounting and, accordingly, the acquired assets and liabilitiesassumed are recorded at their respective fair values. The excess of the purchase price over the fair value of the assets acquired andliabilities assumed is recorded as goodwill. The recorded values of assets and liabilities are based in part on third-party estimates andvaluations when available. The remaining values are based on management’s judgments and estimates, and, accordingly, the Company’sfinancial position or results of operations may be affected by changes in estimates and judgments.
Acquired assets and liabilities assumed by the Company that are subject to critical estimates include property, plant and equipmentand intangibles.
The fair value of owned aggregate reserves is determined using qualified internal personnel as well as geologists. Reserve estimates arecalculated based on the best available data. This data is collected from drill holes and other subsurface investigations as well asinvestigations of surface features such as mine highwalls and other exposures of the aggregate reserves. Mine plans, production history
FO
RM
10
-K
38 MDU Resources Group, Inc. Form 10-K

Part IIFO
RM
10
-K
and geologic data are also used to estimate reserve quantities. Value is assigned to the aggregate reserves based on a review of marketroyalty rates, expected cash flows and the number of years of aggregate reserves at owned aggregate sites.
The fair value of property, plant and equipment is based on a valuation performed either by qualified internal personnel and/or outsideappraisers. Fair values assigned to plant and equipment are based on several factors, including the age and condition of the equipment,maintenance records of the equipment and auction values for equipment with similar characteristics at the time of purchase.
The fair value of leasehold rights is based on estimates including royalty rates, lease terms and other discernible factors for acquiredleasehold rights, and estimated cash flows.
While the allocation of the purchase price of an acquisition is subject to a considerable degree of judgment and uncertainty, the Companydoes not expect the estimates to vary significantly once an acquisition has been completed. The Company believes its estimates have beenreasonable in the past as there have been no significant valuation adjustments subsequent to the final allocation of the purchase price tothe acquired assets and liabilities. In addition, goodwill impairment testing is performed annually.
Asset retirement obligationsEntities are required to record the fair value of a liability for an asset retirement obligation in the period in which it is incurred. TheCompany has recorded obligations related to the plugging and abandonment of natural gas and oil wells, decommissioning of certainelectric generating facilities, reclamation of certain aggregate properties, special handling and disposal of hazardous materials at certainelectric generating facilities, natural gas distribution and transmission facilities and buildings, and certain other obligations associated withleased properties.
The liability for future asset retirement obligations bears the risk of change as many factors go into the development of the estimate ofthese obligations and the likelihood that over time these factors can and will change. Factors used in the estimation of future assetretirement obligations include estimates of current retirement costs, future inflation factors, life of the asset and discount rates. Thesefactors determine both a present value of the retirement liability and the accretion to the retirement liability in subsequent years.
Long-lived assets are reviewed to determine if a legal retirement obligation exists. If a legal retirement obligation exists, a determination ofthe liability is made if a reasonable estimate of the present value of the obligation can be made. The present value of the retirementobligation is calculated by inflating current estimated retirement costs of the long-lived asset over its expected life to determine theexpected future cost and then discounting the expected future cost back to the present value using a discount rate equal to the credit-adjusted risk-free interest rate in effect when the liability was initially recognized.
These estimates and assumptions are subject to a number of variables and are expected to change in the future. Estimates andassumptions will change as the estimated useful lives of the assets change, the current estimated retirement costs change, new legalretirement obligations occur and/or as existing legal asset retirement obligations, for which a reasonable estimate of fair value could notinitially be made because of the range of time over which the Company may settle the obligation is unknown or cannot be estimated,become less uncertain and a reasonable estimate of the future liability can be made.
Pension and other postretirement benefitsThe Company has noncontributory defined benefit pension plans and other postretirement benefit plans for certain eligible employees.Various actuarial assumptions are used in calculating the benefit expense (income) and liability (asset) related to these plans. Costs ofproviding pension and other postretirement benefits bear the risk of change, as they are dependent upon numerous factors based onassumptions of future conditions.
The Company makes various assumptions when determining plan costs, including the current discount rates and the expected long-termreturn on plan assets, the rate of compensation increases and healthcare cost trend rates. In selecting the expected long-term return onplan assets, which is considered to be one of the key variables in determining benefit expense or income, the Company considershistorical returns, current market conditions and expected future market trends, including changes in interest rates and equity and bondmarket performance. Another key variable in determining benefit expense or income is the discount rate. In selecting the discount rate, theCompany matches forecasted future cash flows of the pension and postretirement plans to a yield curve which consists of a hypotheticalportfolio of high-quality corporate bonds with varying maturity dates, as well as other factors, as a basis. The Company’s pension and otherpostretirement benefit plan assets are primarily made up of equity and fixed-income investments. Fluctuations in actual equity and bondmarket returns as well as changes in general interest rates may result in increased or decreased pension and other postretirement benefitcosts in the future. Management estimates the rate of compensation increase based on long-term assumed wage increases and thehealthcare cost trend rates are determined by historical and future trends.
MDU Resources Group, Inc. Form 10-K 39
Part II
The Company believes the estimates made for its pension and other postretirement benefits are reasonable based on the information thatis known when the estimates are made. These estimates and assumptions are subject to a number of variables and are expected tochange in the future. Estimates and assumptions will be affected by changes in the discount rate, the expected long-term return on planassets, the rate of compensation increase and healthcare cost trend rates. The Company plans to continue to use its currentmethodologies to determine plan costs.
Income taxesIncome taxes require significant judgments and estimates including the determination of income tax expense, deferred tax assets andliabilities and, if necessary, any valuation allowances that may be required for deferred tax assets and accruals for uncertain tax positions.The effective income tax rate is subject to variability from period to period as a result of changes in federal and state income tax ratesand/or changes in tax laws. In addition, the effective tax rate may be affected by other changes including the allocation of property, payrolland revenues between states.
The Company provides deferred federal and state income taxes on all temporary differences between the book and tax basis of theCompany’s assets and liabilities. Excess deferred income tax balances associated with the Company’s rate-regulated activities have beenrecorded as a regulatory liability and are included in other liabilities. These regulatory liabilities are expected to be reflected as a reductionin future rates charged to customers in accordance with applicable regulatory procedures.
The Company uses the deferral method of accounting for investment tax credits and amortizes the credits on regulated electric andnatural gas distribution plant over various periods that conform to the ratemaking treatment prescribed by the applicable state publicservice commissions.
Tax positions taken or expected to be taken in an income tax return are evaluated for recognition using a more-likely-than-not threshold,and those tax positions requiring recognition are measured as the largest amount of tax benefit that is greater than 50 percent likely ofbeing realized upon ultimate settlement with a taxing authority. The Company recognizes interest and penalties accrued related tounrecognized tax benefits in income taxes.
The Company believes its estimates surrounding income taxes are reasonable based on the information that is known when the estimatesare made.
Liquidity and Capital CommitmentsCash flowsOperating activities The changes in cash flows from operating activities generally follow the results of operations as discussed in Financialand Operating Data and also are affected by changes in working capital.
Cash flows provided by operating activities in 2009 increased $60.5 million from the comparable prior period. Lower working capitalrequirements of $263.6 million were partially offset by lower income before depreciation, depletion and amortization and before the after-tax noncash write-down of natural gas and oil properties, largely the effects of lower commodity prices at the natural gas and oilproduction business. The lower working capital requirements were largely the result of lower receivables and lower net natural gas costsrecoverable through rate adjustments at the natural gas distribution business, as well as lower working capital requirements at the otherbusiness segments.
Cash flows provided by operating activities in 2008 increased $223.0 million from the comparable prior period, due to:
• Higher income from continuing operations before depreciation, depletion and amortization and before the after-tax noncash write-downof natural gas and oil properties
• Absence of cash flows used related to discontinued operations in 2007 of $71.4 million
Investing activities Cash flows used in investing activities in 2009 decreased $675.2 million from the comparable prior period due to:
• Lower cash used in connection with acquisitions, net of cash acquired, of $527.1 million, primarily due to the absence of the 2008acquisitions of Intermountain and natural gas and oil producing properties in East Texas
• Decreased ongoing capital expenditures of $297.8 million, primarily at the natural gas and oil production business
Partially offsetting the decrease in cash flows used in investing activities were lower proceeds from investments of $89.5 millionand decreased net proceeds from the sale or disposition of property of $60.2 million, largely at the construction materials andcontracting business.
FO
RM
10
-K
40 MDU Resources Group, Inc. Form 10-K

Part IIFO
RM
10
-K
Cash flows used in investing activities in 2008 increased $765.1 million from the comparable prior period due to:
• Absence of cash flows provided by discontinued operations in 2007 of $548.2 million, primarily the result of the sale of the domesticindependent power production assets in the third quarter of 2007
• Increased ongoing capital expenditures of $188.2 million, largely at the natural gas and oil production business
• Higher cash used in connection with acquisitions, net of cash acquired, of $185.1 million, largely due to the acquisition ofIntermountain and natural gas and oil producing properties in East Texas in 2008, partially offset by the absence of the 2007 acquisitionof Cascade
Partially offsetting the increase in cash flows used in investing activities were higher proceeds from investments of $85.8 million in 2008,as well as the absence of cash used for investments of $67.1 million in 2007.
Financing activities Cash flows provided by financing activities in 2009 decreased $559.6 million from the comparable prior period,primarily due to lower issuance of long-term debt and short-term borrowings, higher repayment of long-term debt, partially offset byincreased issuance of common stock. Lower cash flows provided by financing activities in 2009 reflects lower ongoing capital expendituresand acquisitions, as well as increased cash provided by operating activities.
Cash flows provided by financing activities in 2008 increased $456.2 million from the comparable prior period, primarily due to higherissuance of long-term debt of $333.7 million as well as higher net short-term borrowings of $101.7 million, largely related to higherongoing capital expenditures and acquisitions.
Defined benefit pension plansThe Company has qualified noncontributory defined benefit pension plans (Pension Plans) for certain employees. Plan assets consist ofinvestments in equity and fixed-income securities. Various actuarial assumptions are used in calculating the benefit expense (income) andliability (asset) related to the Pension Plans. Actuarial assumptions include assumptions about the discount rate, expected return on planassets and rate of future compensation increases as determined by the Company within certain guidelines. At December 31, 2009, thePension Plans’ accumulated benefit obligations exceeded these plans’ assets by approximately $85.0 million. Pretax pension expensereflected in the years ended December 31, 2009, 2008 and 2007, was $8.2 million, $4.6 million and $6.5 million, respectively. TheCompany’s pension expense is currently projected to be approximately $3.5 million to $4.5 million in 2010. Funding for the Pension Plansis actuarially determined. The minimum required contributions for 2009, 2008 and 2007 were approximately $7.3 million, $6.8 millionand $1.8 million, respectively. For further information on the Company’s Pension Plans, see Item 8 – Note 16.
Capital expendituresThe Company’s capital expenditures for 2007 through 2009 and as anticipated for 2010 through 2012 are summarized in the followingtable, which also includes the Company’s capital needs for the retirement of maturing long-term debt.
Actual Estimated*________________________________________ ________________________________________________2007 2008 2009 2010 2011 2012
(In millions)
Capital expenditures:Electric $ 91 $ 73 $115 $105 $ 72 $100Natural gas distribution 500 398 44 76 60 59Construction services 18 24 13 13 11 11Pipeline and energy services 39 43 70 15 28 149Natural gas and oil production 284 711 183 375** 359 321Construction materials and contracting 190 128 27 37 52 62Other 2 1 3 1 1 1Net proceeds from sale or disposition of property (25) (87) (27) (4) (7) (1)
Net capital expenditures before discontinued operations 1,099 1,291 428 618 576 702
Discontinued operations (548) – – – – –
Net capital expenditures 551 1,291 428 618 576 702Retirement of long-term debt 232 201 293 13 72 136
$ 783 $1,492 $721 $631 $648 $838
* The Company continues to evaluate potential future acquisitions and other growth opportunities which are dependent upon the availability of economicopportunities and, as a result, capital expenditures may vary significantly from the above estimates.
** Includes approximately $150 million for new growth opportunities, including potential acquisitions.
MDU Resources Group, Inc. Form 10-K 41
Part II
Capital expenditures for 2009, 2008 and 2007 in the preceding table include noncash transactions, including the issuance of theCompany’s equity securities, in connection with acquisitions and the outstanding indebtedness related to the 2008 Intermountainacquisition and the 2007 Cascade acquisition. The net noncash transactions were immaterial in 2009, $97.6 million in 2008 and$217.3 million in 2007.
In 2009, the Company acquired a pipeline and energy services business in Montana. The total purchase consideration for this businessand purchase price adjustments with respect to certain other acquisitions made prior to 2009, consisting of the Company’s common stockand cash, was $22.0 million.
The 2009 capital expenditures, including those for the previously mentioned acquisitions and retirements of long-term debt, were met frominternal sources and the issuance of long-term debt and the Company’s equity securities. Estimated capital expenditures for the years2010 through 2012 include those for:
• System upgrades
• Routine replacements
• Service extensions
• Routine equipment maintenance and replacements
• Buildings, land and building improvements
• Pipeline and gathering projects
• Further development of existing properties, exploratory drilling and acquisitions at the natural gas and oil production segment
• Power generation opportunities, including certain costs for additional electric generating capacity
• Other growth opportunities
The Company continues to evaluate potential future acquisitions and other growth opportunities; however, they are dependent upon theavailability of economic opportunities and, as a result, capital expenditures may vary significantly from the estimates in the preceding table.It is anticipated that all of the funds required for capital expenditures and retirement of long-term debt for the years 2010 through 2012 willbe met from various sources, including internally generated funds; the Company’s credit facilities, as described below; and through theissuance of long-term debt and the Company’s equity securities.
Capital resourcesCertain debt instruments of the Company and its subsidiaries, including those discussed below, contain restrictive covenants and cross-default provisions. In order to borrow under the respective credit agreements, the Company and its subsidiaries must be in compliancewith the applicable covenants and certain other conditions, all of which the Company and its subsidiaries, as applicable, were incompliance with at December 31, 2009. In the event the Company and its subsidiaries do not comply with the applicable covenants andother conditions, alternative sources of funding may need to be pursued. For additional information on the covenants, certain otherconditions and cross-default provisions, see Item 8 – Note 9.
FO
RM
10
-K
42 MDU Resources Group, Inc. Form 10-K
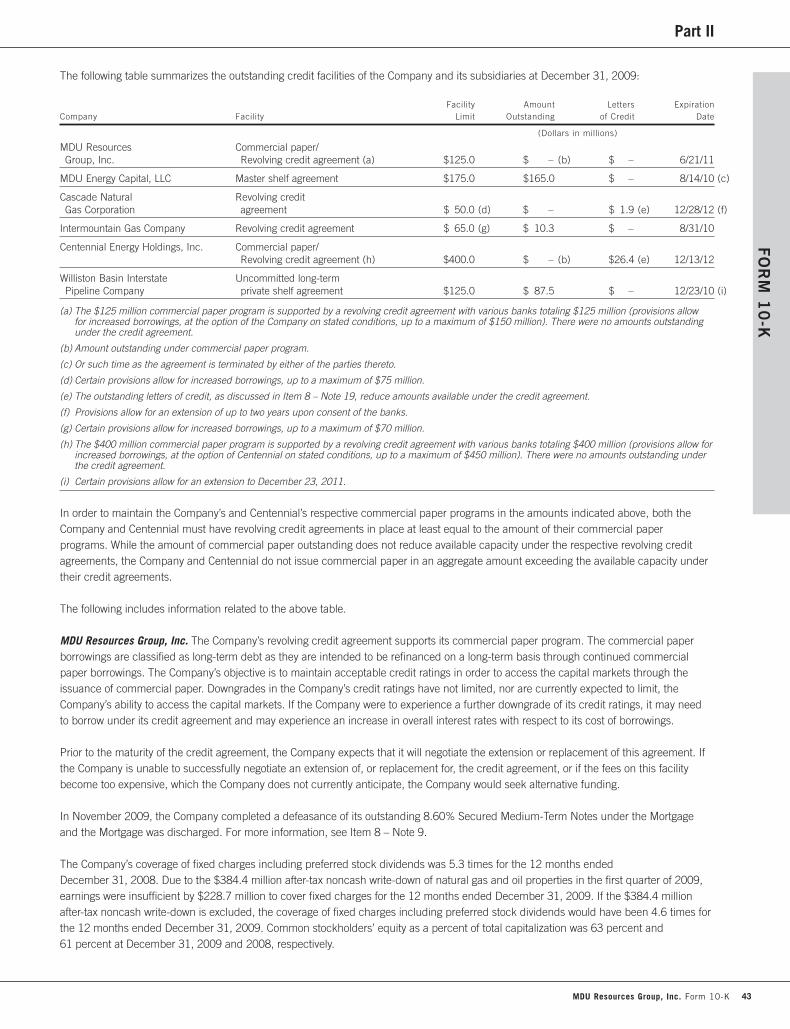
Part IIFO
RM
10
-K
The following table summarizes the outstanding credit facilities of the Company and its subsidiaries at December 31, 2009:
Facility Amount Letters ExpirationCompany Facility Limit Outstanding of Credit Date
(Dollars in millions)
MDU Resources Commercial paper/Group, Inc. Revolving credit agreement (a) $125.0 $ – (b) $ – 6/21/11
MDU Energy Capital, LLC Master shelf agreement $175.0 $165.0 $ – 8/14/10 (c)
Cascade Natural Revolving credit Gas Corporation agreement $ 50.0 (d) $ – $ 1.9 (e) 12/28/12 (f)
Intermountain Gas Company Revolving credit agreement $ 65.0 (g) $ 10.3 $ – 8/31/10
Centennial Energy Holdings, Inc. Commercial paper/Revolving credit agreement (h) $400.0 $ – (b) $26.4 (e) 12/13/12
Williston Basin Interstate Uncommitted long-term Pipeline Company private shelf agreement $125.0 $ 87.5 $ – 12/23/10 (i)
(a) The $125 million commercial paper program is supported by a revolving credit agreement with various banks totaling $125 million (provisions allow for increased borrowings, at the option of the Company on stated conditions, up to a maximum of $150 million). There were no amounts outstanding under the credit agreement.
(b) Amount outstanding under commercial paper program.
(c) Or such time as the agreement is terminated by either of the parties thereto.
(d) Certain provisions allow for increased borrowings, up to a maximum of $75 million.
(e) T he outstanding letters of credit, as discussed in Item 8 – Note 19, reduce amounts available under the credit agreement.
(f) Provisions allow for an extension of up to two years upon consent of the banks.
(g) Certain provisions allow for increased borrowings, up to a maximum of $70 million.
(h) The $400 million commercial paper program is supported by a revolving credit agreement with various banks totaling $400 million (provisions allow forincreased borrowings, at the option of Centennial on stated conditions, up to a maximum of $450 million). There were no amounts outstanding underthe credit agreement.
(i) Certain provisions allow for an extension to December 23, 2011.
In order to maintain the Company’s and Centennial’s respective commercial paper programs in the amounts indicated above, both theCompany and Centennial must have revolving credit agreements in place at least equal to the amount of their commercial paperprograms. While the amount of commercial paper outstanding does not reduce available capacity under the respective revolving creditagreements, the Company and Centennial do not issue commercial paper in an aggregate amount exceeding the available capacity undertheir credit agreements.
The following includes information related to the above table.
MDU Resources Group, Inc. The Company’s revolving credit agreement supports its commercial paper program. The commercial paperborrowings are classified as long-term debt as they are intended to be refinanced on a long-term basis through continued commercialpaper borrowings. The Company’s objective is to maintain acceptable credit ratings in order to access the capital markets through theissuance of commercial paper. Downgrades in the Company’s credit ratings have not limited, nor are currently expected to limit, theCompany’s ability to access the capital markets. If the Company were to experience a further downgrade of its credit ratings, it may needto borrow under its credit agreement and may experience an increase in overall interest rates with respect to its cost of borrowings.
Prior to the maturity of the credit agreement, the Company expects that it will negotiate the extension or replacement of this agreement. Ifthe Company is unable to successfully negotiate an extension of, or replacement for, the credit agreement, or if the fees on this facilitybecome too expensive, which the Company does not currently anticipate, the Company would seek alternative funding.
In November 2009, the Company completed a defeasance of its outstanding 8.60% Secured Medium-Term Notes under the Mortgageand the Mortgage was discharged. For more information, see Item 8 – Note 9.
The Company’s coverage of fixed charges including preferred stock dividends was 5.3 times for the 12 months endedDecember 31, 2008. Due to the $384.4 million after-tax noncash write-down of natural gas and oil properties in the first quarter of 2009,earnings were insufficient by $228.7 million to cover fixed charges for the 12 months ended December 31, 2009. If the $384.4 millionafter-tax noncash write-down is excluded, the coverage of fixed charges including preferred stock dividends would have been 4.6 times forthe 12 months ended December 31, 2009. Common stockholders’ equity as a percent of total capitalization was 63 percent and61 percent at December 31, 2009 and 2008, respectively.
MDU Resources Group, Inc. Form 10-K 43
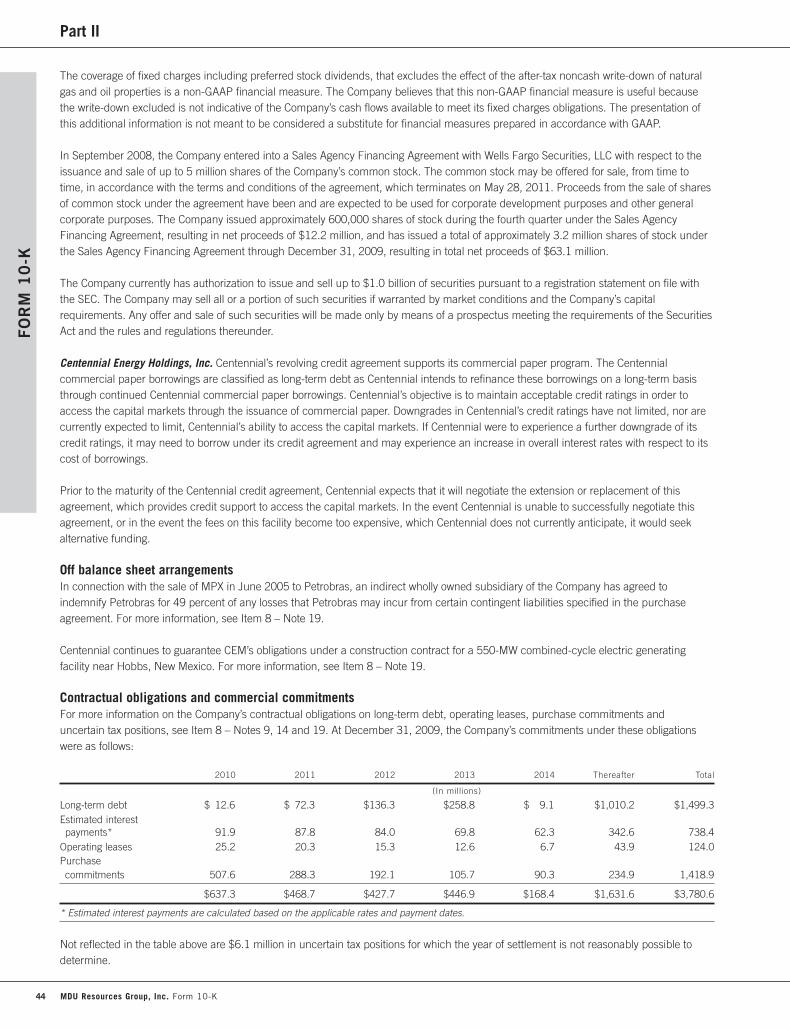
Part II
The coverage of fixed charges including preferred stock dividends, that excludes the effect of the after-tax noncash write-down of naturalgas and oil properties is a non-GAAP financial measure. The Company believes that this non-GAAP financial measure is useful becausethe write-down excluded is not indicative of the Company’s cash flows available to meet its fixed charges obligations. The presentation ofthis additional information is not meant to be considered a substitute for financial measures prepared in accordance with GAAP.
In September 2008, the Company entered into a Sales Agency Financing Agreement with Wells Fargo Securities, LLC with respect to theissuance and sale of up to 5 million shares of the Company’s common stock. The common stock may be offered for sale, from time totime, in accordance with the terms and conditions of the agreement, which terminates on May 28, 2011. Proceeds from the sale of sharesof common stock under the agreement have been and are expected to be used for corporate development purposes and other generalcorporate purposes. The Company issued approximately 600,000 shares of stock during the fourth quarter under the Sales AgencyFinancing Agreement, resulting in net proceeds of $12.2 million, and has issued a total of approximately 3.2 million shares of stock underthe Sales Agency Financing Agreement through December 31, 2009, resulting in total net proceeds of $63.1 million.
The Company currently has authorization to issue and sell up to $1.0 billion of securities pursuant to a registration statement on file withthe SEC. The Company may sell all or a portion of such securities if warranted by market conditions and the Company’s capitalrequirements. Any offer and sale of such securities will be made only by means of a prospectus meeting the requirements of the SecuritiesAct and the rules and regulations thereunder.
Centennial Energy Holdings, Inc. Centennial’s revolving credit agreement supports its commercial paper program. The Centennialcommercial paper borrowings are classified as long-term debt as Centennial intends to refinance these borrowings on a long-term basisthrough continued Centennial commercial paper borrowings. Centennial’s objective is to maintain acceptable credit ratings in order toaccess the capital markets through the issuance of commercial paper. Downgrades in Centennial’s credit ratings have not limited, nor arecurrently expected to limit, Centennial’s ability to access the capital markets. If Centennial were to experience a further downgrade of itscredit ratings, it may need to borrow under its credit agreement and may experience an increase in overall interest rates with respect to itscost of borrowings.
Prior to the maturity of the Centennial credit agreement, Centennial expects that it will negotiate the extension or replacement of thisagreement, which provides credit support to access the capital markets. In the event Centennial is unable to successfully negotiate thisagreement, or in the event the fees on this facility become too expensive, which Centennial does not currently anticipate, it would seekalternative funding.
Off balance sheet arrangementsIn connection with the sale of MPX in June 2005 to Petrobras, an indirect wholly owned subsidiary of the Company has agreed toindemnify Petrobras for 49 percent of any losses that Petrobras may incur from certain contingent liabilities specified in the purchaseagreement. For more information, see Item 8 – Note 19.
Centennial continues to guarantee CEM’s obligations under a construction contract for a 550-MW combined-cycle electric generatingfacility near Hobbs, New Mexico. For more information, see Item 8 – Note 19.
Contractual obligations and commercial commitmentsFor more information on the Company’s contractual obligations on long-term debt, operating leases, purchase commitments anduncertain tax positions, see Item 8 – Notes 9, 14 and 19. At December 31, 2009, the Company’s commitments under these obligationswere as follows:
2010 2011 2012 2013 2014 Thereafter Total
(In millions)
Long-term debt $ 12.6 $ 72.3 $136.3 $258.8 $ 9.1 $1,010.2 $1,499.3Estimated interestpayments* 91.9 87.8 84.0 69.8 62.3 342.6 738.4
Operating leases 25.2 20.3 15.3 12.6 6.7 43.9 124.0Purchasecommitments 507.6 288.3 192.1 105.7 90.3 234.9 1,418.9
$637.3 $468.7 $427.7 $446.9 $168.4 $1,631.6 $3,780.6
* Estimated interest payments are calculated based on the applicable rates and payment dates.
Not reflected in the table above are $6.1 million in uncertain tax positions for which the year of settlement is not reasonably possible todetermine.
FO
RM
10
-K
44 MDU Resources Group, Inc. Form 10-K
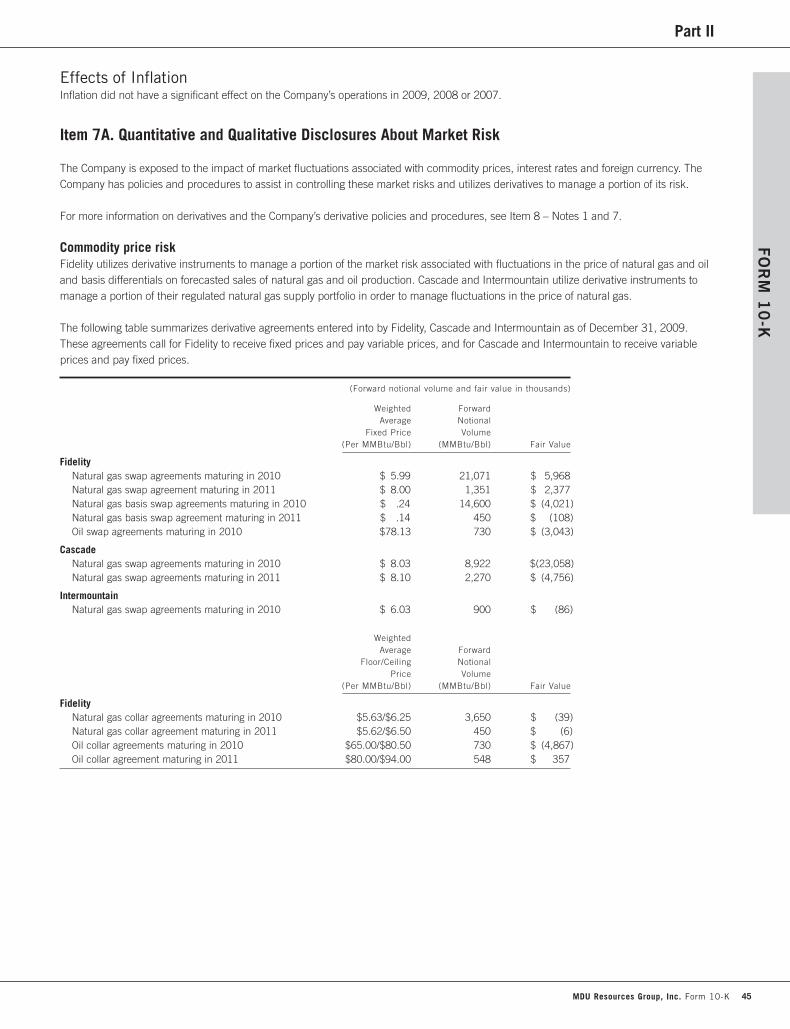
Part IIFO
RM
10
-K
Effects of InflationInflation did not have a significant effect on the Company’s operations in 2009, 2008 or 2007.
Item 7A. Quantitative and Qualitative Disclosures About Market Risk
The Company is exposed to the impact of market fluctuations associated with commodity prices, interest rates and foreign currency. TheCompany has policies and procedures to assist in controlling these market risks and utilizes derivatives to manage a portion of its risk.
For more information on derivatives and the Company’s derivative policies and procedures, see Item 8 – Notes 1 and 7.
Commodity price riskFidelity utilizes derivative instruments to manage a portion of the market risk associated with fluctuations in the price of natural gas and oiland basis differentials on forecasted sales of natural gas and oil production. Cascade and Intermountain utilize derivative instruments tomanage a portion of their regulated natural gas supply portfolio in order to manage fluctuations in the price of natural gas.
The following table summarizes derivative agreements entered into by Fidelity, Cascade and Intermountain as of December 31, 2009.These agreements call for Fidelity to receive fixed prices and pay variable prices, and for Cascade and Intermountain to receive variableprices and pay fixed prices.
(Forward notional volume and fair value in thousands)
Weighted ForwardAverage Notional
Fixed Price Volume(Per MMBtu/Bbl) (MMBtu/Bbl) Fair Value
FidelityNatural gas swap agreements maturing in 2010 $ 5.99 21,071 $ 5,968Natural gas swap agreement maturing in 2011 $ 8.00 1,351 $ 2,377Natural gas basis swap agreements maturing in 2010 $ .24 14,600 $ (4,021)Natural gas basis swap agreement maturing in 2011 $ .14 450 $ (108)Oil swap agreements maturing in 2010 $78.13 730 $ (3,043)
CascadeNatural gas swap agreements maturing in 2010 $ 8.03 8,922 $(23,058)Natural gas swap agreements maturing in 2011 $ 8.10 2,270 $ (4,756)
IntermountainNatural gas swap agreements maturing in 2010 $ 6.03 900 $ (86)
WeightedAverage Forward
Floor/Ceiling NotionalPrice Volume
(Per MMBtu/Bbl) (MMBtu/Bbl) Fair Value
FidelityNatural gas collar agreements maturing in 2010 $5.63/$6.25 3,650 $ (39)Natural gas collar agreement maturing in 2011 $5.62/$6.50 450 $ (6)Oil collar agreements maturing in 2010 $65.00/$80.50 730 $ (4,867)Oil collar agreement maturing in 2011 $80.00/$94.00 548 $ 357
MDU Resources Group, Inc. Form 10-K 45

Part II
The following table summarizes derivative agreements entered into by Fidelity, Cascade and Intermountain as of December 31, 2008.These agreements call for Fidelity to receive fixed prices and pay variable prices, and for Cascade and Intermountain to receive variableprices and pay fixed prices.
(Forward notional volume and fair value in thousands)
Weighted ForwardAverage Notional
Fixed Price Volume(Per MMBtu) (MMBtu) Fair Value
FidelityNatural gas swap agreements maturing in 2009 $8.73 10,920 $ 33,059Natural gas swap agreements maturing in 2010 $8.08 1,606 $ 2,011Natural gas swap agreements maturing in 2011 $8.00 1,351 $ 1,211Natural gas basis swap agreement maturing in 2009 $ .61 3,650 $ (1,349)
CascadeNatural gas swap agreements maturing in 2009 $8.26 19,350 $(49,883)Natural gas swap agreements maturing in 2010 $8.03 8,922 $(18,947)Natural gas swap agreements maturing in 2011 $8.10 2,270 $ (4,587)
IntermountainNatural gas swap agreements maturing in 2009 $5.54 7,905 $ (5,297)
WeightedAverage Forward
Floor/Ceiling NotionalPrice Volume
(Per MMBtu) (MMBtu) Fair Value
FidelityNatural gas collar agreements maturing in 2009 $8.52/$9.56 14,965 $45,105
Note: The fair value of Cascade’s natural gas swap agreements is presented net of the collateral provided to the counterparty of $11.1 million.
Interest rate riskThe Company uses fixed rate long-term debt and from time to time variable rate long-term debt to partially finance capital expendituresand mandatory debt retirements. These debt agreements expose the Company to market risk related to changes in interest rates. TheCompany manages this risk by taking advantage of market conditions when timing the placement of long-term or permanent financing.The Company also has historically used interest rate swap agreements to manage a portion of the Company’s interest rate risk and maytake advantage of such agreements in the future to minimize such risk. At December 31, 2009 and 2008, the Company had nooutstanding interest rate hedges.
The following table shows the amount of debt, including current portion, and related weighted average interest rates, both by expectedmaturity dates, as of December 31, 2009.
Fair2010 2011 2012 2013 2014 Thereafter Total Value
(Dollars in millions)
Long-term debt:Fixed rate $12.6 $72.3 $136.3 $258.8 $9.1 $1,010.2 $1,499.3 $1,566.3Weighted averageinterest rate 6.9% 7.1% 5.9% 6.0% 6.9% 6.1% 6.1% –
Foreign currency riskMDU Brasil’s equity method investments in the Brazilian Transmission Lines are exposed to market risks from changes in foreign currencyexchange rates between the U.S. dollar and the Brazilian Real. For further information, see Item 8 – Note 4. At December 31, 2009 and2008, the Company had no outstanding foreign currency hedges.
FO
RM
10
-K
46 MDU Resources Group, Inc. Form 10-K
Part IIFO
RM
10
-K
Item 8. Financial Statements and Supplementary Data
Management’s Report on Internal Control Over Financial Reporting
The management of MDU Resources Group, Inc. is responsible for establishing and maintaining adequate internal control over financialreporting as defined in Rules 13a-15(f) under the Securities Exchange Act of 1934. The Company’s internal control system is designedto provide reasonable assurance regarding the reliability of financial reporting and the preparation of financial statements for externalpurposes in accordance with generally accepted accounting principles.
All internal control systems, no matter how well designed, have inherent limitations. Therefore, even those systems determined to beeffective can provide only reasonable assurance with respect to financial statement preparation and presentation. Because of its inherentlimitations, internal control over financial reporting may not prevent or detect misstatements. Also, projections of any evaluation ofeffectiveness to future periods are subject to the risk that controls may become inadequate because of changes in conditions, or thatthe degree of compliance with the policies or procedures may deteriorate.
Management assessed the effectiveness of the Company’s internal control over financial reporting as of December 31, 2009. In makingthis assessment, management used the criteria set forth by the Committee of Sponsoring Organizations of the Treadway Commission(COSO) in Internal Control-Integrated Framework.
Based on our evaluation under the framework in Internal Control-Integrated Framework, management concluded that the Company’sinternal control over financial reporting was effective as of December 31, 2009.
The effectiveness of the Company’s internal control over financial reporting as of December 31, 2009, has been audited byDeloitte & Touche LLP, an independent registered public accounting firm, as stated in their report.
Terry D. Hildestad Doran N. SchwartzPresident and Chief Executive Officer Vice President and Chief Financial Officer
MDU Resources Group, Inc. Form 10-K 47

Part II
Report of Independent Registered Public Accounting Firm
To the Board of Directors and Stockholders of MDU Resources Group, Inc.:
We have audited the accompanying consolidated balance sheets of MDU Resources Group, Inc. and subsidiaries (the “Company”) as ofDecember 31, 2009 and 2008, and the related consolidated statements of income, common stockholders’ equity, and cash flows for eachof the three years in the period ended December 31, 2009. Our audits also included the financial statement schedule for each of thethree years in the period ended December 31, 2009, listed in the Index at Item 15. These consolidated financial statements and financialstatement schedule are the responsibility of the Company’s management. Our responsibility is to express an opinion on these consolidatedfinancial statements and financial statement schedule based on our audits.
We conducted our audits in accordance with the standards of the Public Company Accounting Oversight Board (United States). Thosestandards require that we plan and perform the audit to obtain reasonable assurance about whether the consolidated financial statementsare free of material misstatement. An audit includes examining, on a test basis, evidence supporting the amounts and disclosures in theconsolidated financial statements. An audit also includes assessing the accounting principles used and significant estimates made bymanagement, as well as evaluating the overall consolidated financial statement presentation. We believe that our audits provide areasonable basis for our opinion.
In our opinion, such consolidated financial statements present fairly, in all material respects, the financial position of MDU ResourcesGroup, Inc. and subsidiaries as of December 31, 2009 and 2008, and the results of their operations and their cash flows for each of thethree years in the period ended December 31, 2009, in conformity with accounting principles generally accepted in the United States ofAmerica. Also, in our opinion, the financial statement schedule, when considered in relation to the basic consolidated financial statementstaken as a whole, present fairly, in all material respects, the information set forth therein.
As discussed in Note 1 to the consolidated financial statements, the Company adopted the definitions and required pricing assumptionsoutlined in the Modernization of Oil and Gas Reporting rules issued by the Securities and Exchange Commission effective as ofDecember 31, 2009.
We have also audited, in accordance with the standards of the Public Company Accounting Oversight Board (United States), theCompany’s internal control over financial reporting as of December 31, 2009, based on the criteria established in Internal Control-Integrated Framework issued by the Committee of Sponsoring Organizations of the Treadway Commission and our report datedFebruary 17, 2010, expressed an unqualified opinion on the Company’s internal control over financial reporting.
Minneapolis, MinnesotaFebruary 17, 2010
FO
RM
10
-K
48 MDU Resources Group, Inc. Form 10-K

Part IIFO
RM
10
-K
Report of Independent Registered Public Accounting Firm
To the Board of Directors and Stockholders of MDU Resources Group, Inc.:
We have audited the internal control over financial reporting of MDU Resources Group, Inc. and subsidiaries (the “Company”) as ofDecember 31, 2009, based on criteria established in Internal Control-Integrated Framework issued by the Committee of SponsoringOrganizations of the Treadway Commission. The Company’s management is responsible for maintaining effective internal control overfinancial reporting and for its assessment of the effectiveness of internal control over financial reporting, included in the accompanyingManagement’s Report on Internal Control Over Financial Reporting. Our responsibility is to express an opinion on the Company’s internalcontrol over financial reporting based on our audit.
We conducted our audit in accordance with the standards of the Public Company Accounting Oversight Board (United States). Thosestandards require that we plan and perform the audit to obtain reasonable assurance about whether effective internal control over financialreporting was maintained in all material respects. Our audit included obtaining an understanding of internal control over financialreporting, assessing the risk that a material weakness exists, testing and evaluating the design and operating effectiveness of internalcontrol based on the assessed risk, and performing such other procedures as we considered necessary in the circumstances. We believethat our audit provides a reasonable basis for our opinion.
A company’s internal control over financial reporting is a process designed by, or under the supervision of, the company’s principalexecutive and principal financial officers, or persons performing similar functions, and effected by the company’s board of directors,management, and other personnel to provide reasonable assurance regarding the reliability of financial reporting and the preparation offinancial statements for external purposes in accordance with generally accepted accounting principles. A company’s internal controlover financial reporting includes those policies and procedures that (1) pertain to the maintenance of records that, in reasonable detail,accurately and fairly reflect the transactions and dispositions of the assets of the company; (2) provide reasonable assurance thattransactions are recorded as necessary to permit preparation of financial statements in accordance with generally accepted accountingprinciples, and that receipts and expenditures of the company are being made only in accordance with authorizations of management anddirectors of the company; and (3) provide reasonable assurance regarding prevention or timely detection of unauthorized acquisition, use,or disposition of the company’s assets that could have a material effect on the financial statements.
Because of the inherent limitations of internal control over financial reporting, including the possibility of collusion or impropermanagement override of controls, material misstatements due to error or fraud may not be prevented or detected on a timely basis. Also,projections of any evaluation of the effectiveness of the internal control over financial reporting to future periods are subject to the risk thatthe controls may become inadequate because of changes in conditions, or that the degree of compliance with the policies or proceduresmay deteriorate.
In our opinion, the Company maintained, in all material respects, effective internal control over financial reporting as of December 31,2009, based on the criteria established in Internal Control-Integrated Framework issued by the Committee of Sponsoring Organizations ofthe Treadway Commission.
We have also audited, in accordance with the standards of the Public Company Accounting Oversight Board (United States),the consolidated financial statements and financial statement schedule as of and for the year ended December 31, 2009 of theCompany and our report February 17, 2010 expressed an unqualified opinion on those consolidated financial statements and financialstatement schedule and included an explanatory paragraph regarding the Company’s adoption of the definitions and required pricingassumptions outlined in the Modernization of Oil and Gas Reporting rules issued by the Securities and Exchange Commission effectiveas of December 31, 2009.
Minneapolis, MinnesotaFebruary 17, 2010
MDU Resources Group, Inc. Form 10-K 49

Part II
Consolidated Statements of Income
Years ended December 31, 2009 2008 2007
(In thousands, except per share amounts)
Operating revenues: Electric, natural gas distribution and pipeline and energy services $1,504,269 $1,685,199 $1,095,709Construction services, natural gas and oil production, construction materials and contracting, and other 2,672,232 3,318,079 3,152,187
Total operating revenues 4,176,501 5,003,278 4,247,896
Operating expenses:Fuel and purchased power 65,717 75,333 69,616Purchased natural gas sold 739,678 765,900 377,404Operation and maintenance:
Electric, natural gas distribution and pipeline and energy services 263,869 262,053 215,587Construction services, natural gas and oil production, construction materials and contracting, and other 2,143,195 2,686,055 2,572,864
Depreciation, depletion and amortization 330,542 366,020 301,932Taxes, other than income 166,597 200,080 153,373Write-down of natural gas and oil properties (Note 1) 620,000 135,800 –
Total operating expenses 4,329,598 4,491,241 3,690,776
Operating income (loss) (153,097) 512,037 557,120
Earnings from equity method investments 8,499 6,627 19,609
Other income 9,331 4,012 8,318
Interest expense 84,099 81,527 72,237
Income (loss) before income taxes (219,366) 441,149 512,810
Income taxes (96,092) 147,476 190,024
Income (loss) from continuing operations (123,274) 293,673 322,786
Income from discontinued operations, net of tax (Note 3) – – 109,334
Net income (loss) (123,274) 293,673 432,120
Dividends on preferred stocks 685 685 685
Earnings (loss) on common stock $ (123,959) $ 292,988 $ 431,435
Earnings (loss) per common share – basic:Earnings (loss) before discontinued operations $ (.67) $ 1.60 $ 1.77Discontinued operations, net of tax – – .60
Earnings (loss) per common share – basic $ (.67) $ 1.60 $ 2.37
Earnings (loss) per common share – diluted:Earnings (loss) before discontinued operations $ (.67) $ 1.59 $ 1.76Discontinued operations, net of tax – – .60
Earnings (loss) per common share – diluted $ (.67) $ 1.59 $ 2.36
Dividends per common share $ .6225 $ .6000 $ .5600
Weighted average common shares outstanding – basic 185,175 183,100 181,946
Weighted average common shares outstanding – diluted 185,175 183,807 182,902
The accompanying notes are an integral part of these consolidated financial statements.
FO
RM
10
-K
50 MDU Resources Group, Inc. Form 10-K
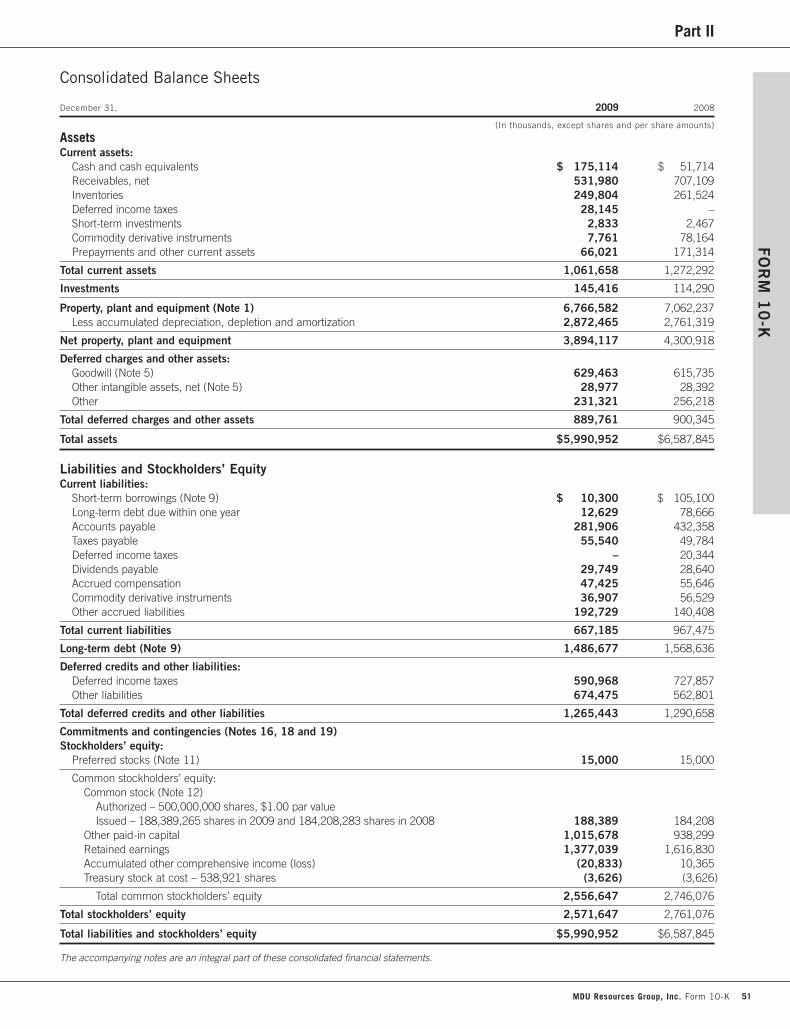
Part IIFO
RM
10
-K
Consolidated Balance Sheets
December 31, 2009 2008
(In thousands, except shares and per share amounts)
AssetsCurrent assets:
Cash and cash equivalents $ 175,114 $ 51,714Receivables, net 531,980 707,109Inventories 249,804 261,524Deferred income taxes 28,145 –Short-term investments 2,833 2,467Commodity derivative instruments 7,761 78,164Prepayments and other current assets 66,021 171,314
Total current assets 1,061,658 1,272,292
Investments 145,416 114,290
Property, plant and equipment (Note 1) 6,766,582 7,062,237Less accumulated depreciation, depletion and amortization 2,872,465 2,761,319
Net property, plant and equipment 3,894,117 4,300,918
Deferred charges and other assets:Goodwill (Note 5) 629,463 615,735Other intangible assets, net (Note 5) 28,977 28,392Other 231,321 256,218
Total deferred charges and other assets 889,761 900,345
Total assets $5,990,952 $6,587,845
Liabilities and Stockholders’ EquityCurrent liabilities:
Short-term borrowings (Note 9) $ 10,300 $ 105,100Long-term debt due within one year 12,629 78,666Accounts payable 281,906 432,358Taxes payable 55,540 49,784Deferred income taxes – 20,344Dividends payable 29,749 28,640Accrued compensation 47,425 55,646Commodity derivative instruments 36,907 56,529Other accrued liabilities 192,729 140,408
Total current liabilities 667,185 967,475
Long-term debt (Note 9) 1,486,677 1,568,636
Deferred credits and other liabilities:Deferred income taxes 590,968 727,857Other liabilities 674,475 562,801
Total deferred credits and other liabilities 1,265,443 1,290,658
Commitments and contingencies (Notes 16, 18 and 19)Stockholders’ equity:
Preferred stocks (Note 11) 15,000 15,000
Common stockholders’ equity:Common stock (Note 12)
Authorized – 500,000,000 shares, $1.00 par value Issued – 188,389,265 shares in 2009 and 184,208,283 shares in 2008 188,389 184,208
Other paid-in capital 1,015,678 938,299Retained earnings 1,377,039 1,616,830Accumulated other comprehensive income (loss) (20,833) 10,365Treasury stock at cost – 538,921 shares (3,626) (3,626)
Total common stockholders’ equity 2,556,647 2,746,076
Total stockholders’ equity 2,571,647 2,761,076
Total liabilities and stockholders’ equity $5,990,952 $6,587,845
The accompanying notes are an integral part of these consolidated financial statements.
MDU Resources Group, Inc. Form 10-K 51

Part II
Consolidated Statements of Common Stockholders’ EquityYears ended December 31, 2009, 2008 and 2007
AccumulatedOther
Other Comprehen-Common Stock Paid-in Retained sive Income Treasury Stock_____________________ _____________________
Shares Amount Capital Earnings (Loss) Shares Amount Total
(In thousands, except shares)
Balance at December 31, 2006 181,557,543 $181,558 $874,253 $1,104,210 $ (6,482) (538,921) $(3,626) $2,149,913Comprehensive income:
Net income – – – 432,120 – – – 432,120Other comprehensive income (loss), net of tax –
Net unrealized loss on derivative instruments qualifying as hedges – – – – (13,505) – – (13,505)
Postretirement liabilityadjustment – – – – 3,012 – – 3,012
Foreign currency translation adjustment – – – – 7,177 – – 7,177
Net unrealized gain on available-for-saleinvestments – – – – 405 – – 405
Total comprehensive income – – – – – – – 429,209Uncertain tax positions transition adjustment – – – 31 – – – 31
Dividends on preferred stocks – – – (685) – – – (685)Dividends on common stock – – – (102,091) – – – (102,091)Tax benefit on stock-basedcompensation – – 5,398 – – – – 5,398
Issuance of common stock 1,388,985 1,389 33,155 – – – – 34,544
Balance at December 31, 2007 182,946,528 182,947 912,806 1,433,585 (9,393) (538,921) (3,626) 2,516,319Comprehensive income:
Net income – – – 293,673 – – – 293,673Other comprehensive income (loss), net of tax –
Net unrealized gain on derivative instruments qualifying as hedges – – – – 43,448 – – 43,448
Postretirement liabilityadjustment – – – – (13,751) – – (13,751)
Foreign currency translation adjustment – – – – (9,534) – – (9,534)
Total comprehensive income – – – – – – – 313,836Fair value option transition adjustment – – – 405 (405) – – –
Dividends on preferred stocks – – – (685) – – – (685)Dividends on common stock – – – (110,148) – – – (110,148)Tax benefit on stock-basedcompensation – – 4,441 – – – – 4,441
Issuance of common stock 1,261,755 1,261 21,052 – – – – 22,313
Balance at December 31, 2008 184,208,283 184,208 938,299 1,616,830 10,365 (538,921) (3,626) 2,746,076Comprehensive loss:
Net loss – – – (123,274) – – – (123,274)Other comprehensive income (loss), net of tax –
Net unrealized loss on derivative instruments qualifying as hedges – – – – (51,684) – – (51,684)
Postretirement liabilityadjustment – – – – 9,918 – – 9,918
Foreign currency translation adjustment – – – – 10,568 – – 10,568
Total comprehensive loss – – – – – – – (154,472)Dividends on preferred stocks – – – (685) – – – (685)Dividends on common stock – – – (115,832) – – – (115,832)Tax benefit on stock-basedcompensation – – (117) – – – – (117)
Issuance of common stock 4,180,982 4,181 77,496 – – – – 81,677
Balance at December 31, 2009 188,389,265 $188,389 $1,015,678 $1,377,039 $(20,833) (538,921) $(3,626) $2,556,647
The accompanying notes are an integral part of these consolidated financial statements.
FO
RM
10
-K
52 MDU Resources Group, Inc. Form 10-K

Part IIFO
RM
10
-K
Consolidated Statements of Cash Flows
Years ended December 31, 2009 2008 2007
(In thousands)
Operating activities:Net income (loss) $(123,274) $ 293,673 $ 432,120Income from discontinued operations, net of tax – – 109,334
Income (loss) from continuing operations (123,274) 293,673 322,786Adjustments to reconcile net income (loss) to net cash provided by operating activities:
Depreciation, depletion and amortization 330,542 366,020 301,932Earnings, net of distributions, from equity method investments (3,018) 365 (14,031)Deferred income taxes (169,764) 64,890 67,272Write-down of natural gas and oil properties (Note 1) 620,000 135,800 –Changes in current assets and liabilities, net of acquisitions:
Receivables 132,939 27,165 (40,256)Inventories 13,969 (18,574) (7,130)Other current assets 67,803 (64,771) (7,356)Accounts payable (61,867) 28,205 24,702Other current liabilities 44,039 (38,738) (22,932)
Other noncurrent changes (4,683) (7,848) 9,594
Net cash provided by continuing operations 846,686 786,187 634,581Net cash used in discontinued operations – – (71,389)
Net cash provided by operating activities 846,686 786,187 563,192
Investing activities: Capital expenditures (448,675) (746,478) (558,283)Acquisitions, net of cash acquired (6,410) (533,543) (348,490)Net proceeds from sale or disposition of property 26,679 86,927 24,983Investments (3,740) 85,773 (67,140)Proceeds from sale of equity method investments – – 58,450
Net cash used in continuing operations (432,146) (1,107,321) (890,480)Net cash provided by discontinued operations – – 548,216
Net cash used in investing activities (432,146) (1,107,321) (342,264)
Financing activities:Issuance of short-term borrowings 10,300 216,400 311,700Repayment of short-term borrowings (105,100) (113,000) (310,000)Issuance of long-term debt 145,000 453,929 120,250Repayment of long-term debt (292,907) (200,527) (232,464)Proceeds from issuance of common stock 65,207 15,011 17,263Dividends paid (115,023) (108,591) (100,641)Tax benefit on stock-based compensation 601 4,441 5,398
Net cash provided by (used in) continuing operations (291,922) 267,663 (188,494)Net cash provided by discontinued operations – – –
Net cash provided by (used in) financing activities (291,922) 267,663 (188,494)
Effect of exchange rate changes on cash and cash equivalents 782 (635) 308
Increase (decrease) in cash and cash equivalents 123,400 (54,106) 32,742Cash and cash equivalents – beginning of year 51,714 105,820 73,078
Cash and cash equivalents – end of year $ 175,114 $ 51,714 $ 105,820
The accompanying notes are an integral part of these consolidated financial statements.
MDU Resources Group, Inc. Form 10-K 53

Part II
Notes to Consolidated Financial Statements
Note 1 – Summary of Significant Accounting PoliciesBasis of presentationThe consolidated financial statements of the Company include the accounts of the following businesses: electric, natural gas distribution,construction services, pipeline and energy services, natural gas and oil production, construction materials and contracting, and other. Theelectric, natural gas distribution, and pipeline and energy services businesses are substantially all regulated. Construction services, naturalgas and oil production, construction materials and contracting, and other are nonregulated. For further descriptions of the Company’sbusinesses, see Note 15. The statements also include the ownership interests in the assets, liabilities and expenses of jointly ownedelectric generating facilities.
The Company’s regulated businesses are subject to various state and federal agency regulations. The accounting policies followed by thesebusinesses are generally subject to the Uniform System of Accounts of the FERC. These accounting policies differ in some respects fromthose used by the Company’s nonregulated businesses.
The Company’s regulated businesses account for certain income and expense items under the provisions of regulatory accounting, whichrequires these businesses to defer as regulatory assets or liabilities certain items that would have otherwise been reflected as expense orincome, respectively, based on the expected regulatory treatment in future rates. The expected recovery or flowback of these deferreditems generally is based on specific ratemaking decisions or precedent for each item. Regulatory assets and liabilities are being amortizedconsistently with the regulatory treatment established by the FERC and the applicable state public service commissions. See Note 6 formore information regarding the nature and amounts of these regulatory deferrals.
Depreciation, depletion and amortization expense is reported separately on the Consolidated Statements of Income and therefore isexcluded from the other line items within operating expenses.
Cash and cash equivalentsThe Company considers all highly liquid investments purchased with an original maturity of three months or less to be cash equivalents.
Allowance for doubtful accountsThe Company’s allowance for doubtful accounts as of December 31, 2009 and 2008, was $16.6 million and $13.7 million, respectively.
Natural gas in storageNatural gas in storage for the Company’s regulated operations is generally carried at average cost, or cost using the last-in, first-outmethod. The portion of the cost of natural gas in storage expected to be used within one year was included in inventories and was$35.6 million and $27.6 million at December 31, 2009 and 2008, respectively. The remainder of natural gas in storage, which largelyrepresents the cost of the gas required to maintain pressure levels for normal operating purposes, was included in other assets and was$59.6 million and $43.4 million at December 31, 2009 and 2008, respectively.
InventoriesInventories, other than natural gas in storage for the Company’s regulated operations, consisted primarily of aggregates held for resale of$80.1 million and $89.1 million, materials and supplies of $58.1 million and $70.3 million, asphalt oil of $23.0 million and $22.1 million,and other inventories of $53.0 million and $52.4 million, as of December 31, 2009 and 2008, respectively. These inventories were statedat the lower of average cost or market value.
InvestmentsThe Company’s investments include its equity method investments as discussed in Note 4, the cash surrender value of life insurancepolicies, investments in fixed-income and equity securities and auction rate securities. Under the equity method, investments are initiallyrecorded at cost and adjusted for dividends and undistributed earnings and losses. On January 1, 2008, the Company elected to measureits investments in certain fixed-income and equity securities at fair value with any unrealized gains and losses recorded on theConsolidated Statements of Income. These investments had previously been accounted for as available-for-sale investments and wererecorded at fair value with any unrealized gains and losses, net of income taxes, recorded in accumulated other comprehensive income(loss) on the Consolidated Balance Sheets until realized. The Company accounts for auction rate securities as available-for-sale. For moreinformation, see Notes 8 and 16 and comprehensive income (loss) in this note.
FO
RM
10
-K
54 MDU Resources Group, Inc. Form 10-K
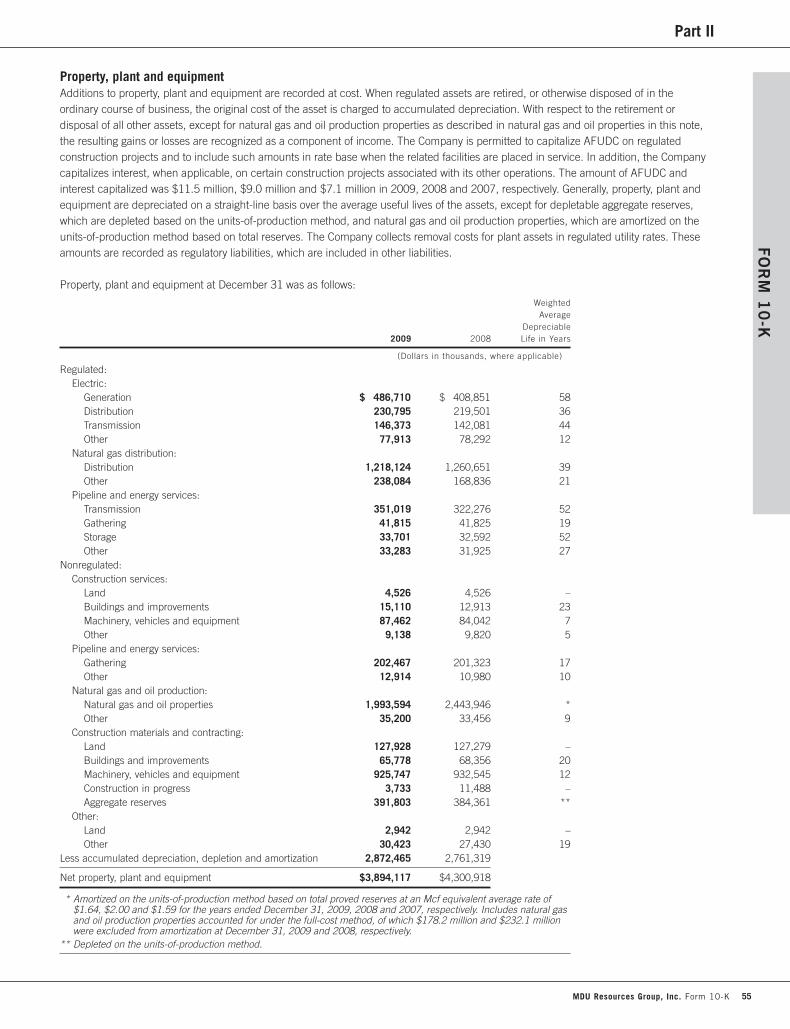
Part IIFO
RM
10
-K
Property, plant and equipmentAdditions to property, plant and equipment are recorded at cost. When regulated assets are retired, or otherwise disposed of in theordinary course of business, the original cost of the asset is charged to accumulated depreciation. With respect to the retirement ordisposal of all other assets, except for natural gas and oil production properties as described in natural gas and oil properties in this note,the resulting gains or losses are recognized as a component of income. The Company is permitted to capitalize AFUDC on regulatedconstruction projects and to include such amounts in rate base when the related facilities are placed in service. In addition, the Companycapitalizes interest, when applicable, on certain construction projects associated with its other operations. The amount of AFUDC andinterest capitalized was $11.5 million, $9.0 million and $7.1 million in 2009, 2008 and 2007, respectively. Generally, property, plant andequipment are depreciated on a straight-line basis over the average useful lives of the assets, except for depletable aggregate reserves,which are depleted based on the units-of-production method, and natural gas and oil production properties, which are amortized on theunits-of-production method based on total reserves. The Company collects removal costs for plant assets in regulated utility rates. Theseamounts are recorded as regulatory liabilities, which are included in other liabilities.
Property, plant and equipment at December 31 was as follows:
WeightedAverage
Depreciable2009 2008 Life in Years
(Dollars in thousands, where applicable)
Regulated:Electric:
Generation $ 486,710 $ 408,851 58Distribution 230,795 219,501 36Transmission 146,373 142,081 44Other 77,913 78,292 12
Natural gas distribution:Distribution 1,218,124 1,260,651 39Other 238,084 168,836 21
Pipeline and energy services:Transmission 351,019 322,276 52Gathering 41,815 41,825 19Storage 33,701 32,592 52Other 33,283 31,925 27
Nonregulated:Construction services:
Land 4,526 4,526 –Buildings and improvements 15,110 12,913 23Machinery, vehicles and equipment 87,462 84,042 7Other 9,138 9,820 5
Pipeline and energy services:Gathering 202,467 201,323 17Other 12,914 10,980 10
Natural gas and oil production:Natural gas and oil properties 1,993,594 2,443,946 *Other 35,200 33,456 9
Construction materials and contracting:Land 127,928 127,279 –Buildings and improvements 65,778 68,356 20Machinery, vehicles and equipment 925,747 932,545 12Construction in progress 3,733 11,488 –Aggregate reserves 391,803 384,361 **
Other:Land 2,942 2,942 –Other 30,423 27,430 19
Less accumulated depreciation, depletion and amortization 2,872,465 2,761,319
Net property, plant and equipment $3,894,117 $4,300,918
* Amortized on the units-of-production method based on total proved reserves at an Mcf equivalent average rate of $1.64, $2.00 and $1.59 for the years ended December 31, 2009, 2008 and 2007, respectively. Includes natural gas and oil production properties accounted for under the full-cost method, of which $178.2 million and $232.1 million were excluded from amortization at December 31, 2009 and 2008, respectively.
** Depleted on the units-of-production method.
MDU Resources Group, Inc. Form 10-K 55
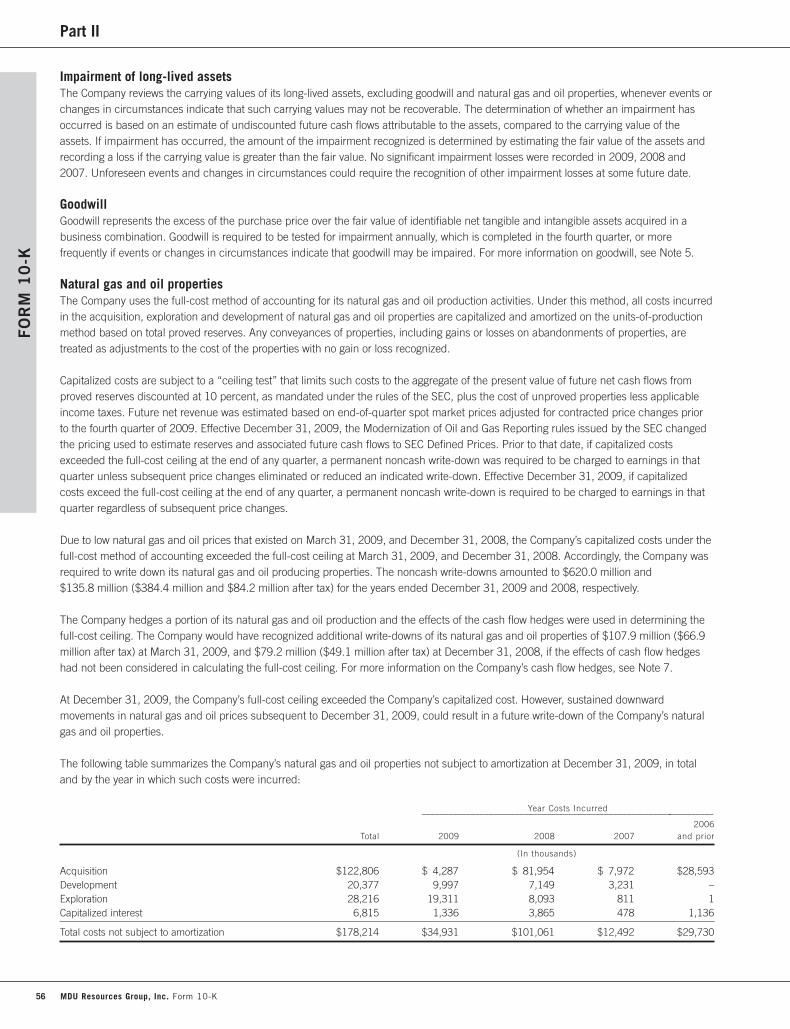
Part II
Impairment of long-lived assetsThe Company reviews the carrying values of its long-lived assets, excluding goodwill and natural gas and oil properties, whenever events orchanges in circumstances indicate that such carrying values may not be recoverable. The determination of whether an impairment hasoccurred is based on an estimate of undiscounted future cash flows attributable to the assets, compared to the carrying value of theassets. If impairment has occurred, the amount of the impairment recognized is determined by estimating the fair value of the assets andrecording a loss if the carrying value is greater than the fair value. No significant impairment losses were recorded in 2009, 2008 and2007. Unforeseen events and changes in circumstances could require the recognition of other impairment losses at some future date.
GoodwillGoodwill represents the excess of the purchase price over the fair value of identifiable net tangible and intangible assets acquired in abusiness combination. Goodwill is required to be tested for impairment annually, which is completed in the fourth quarter, or morefrequently if events or changes in circumstances indicate that goodwill may be impaired. For more information on goodwill, see Note 5.
Natural gas and oil propertiesThe Company uses the full-cost method of accounting for its natural gas and oil production activities. Under this method, all costs incurredin the acquisition, exploration and development of natural gas and oil properties are capitalized and amortized on the units-of-productionmethod based on total proved reserves. Any conveyances of properties, including gains or losses on abandonments of properties, aretreated as adjustments to the cost of the properties with no gain or loss recognized.
Capitalized costs are subject to a “ceiling test” that limits such costs to the aggregate of the present value of future net cash flows fromproved reserves discounted at 10 percent, as mandated under the rules of the SEC, plus the cost of unproved properties less applicableincome taxes. Future net revenue was estimated based on end-of-quarter spot market prices adjusted for contracted price changes priorto the fourth quarter of 2009. Effective December 31, 2009, the Modernization of Oil and Gas Reporting rules issued by the SEC changedthe pricing used to estimate reserves and associated future cash flows to SEC Defined Prices. Prior to that date, if capitalized costsexceeded the full-cost ceiling at the end of any quarter, a permanent noncash write-down was required to be charged to earnings in thatquarter unless subsequent price changes eliminated or reduced an indicated write-down. Effective December 31, 2009, if capitalizedcosts exceed the full-cost ceiling at the end of any quarter, a permanent noncash write-down is required to be charged to earnings in thatquarter regardless of subsequent price changes.
Due to low natural gas and oil prices that existed on March 31, 2009, and December 31, 2008, the Company’s capitalized costs under thefull-cost method of accounting exceeded the full-cost ceiling at March 31, 2009, and December 31, 2008. Accordingly, the Company wasrequired to write down its natural gas and oil producing properties. The noncash write-downs amounted to $620.0 million and$135.8 million ($384.4 million and $84.2 million after tax) for the years ended December 31, 2009 and 2008, respectively.
The Company hedges a portion of its natural gas and oil production and the effects of the cash flow hedges were used in determining thefull-cost ceiling. The Company would have recognized additional write-downs of its natural gas and oil properties of $107.9 million ($66.9million after tax) at March 31, 2009, and $79.2 million ($49.1 million after tax) at December 31, 2008, if the effects of cash flow hedgeshad not been considered in calculating the full-cost ceiling. For more information on the Company’s cash flow hedges, see Note 7.
At December 31, 2009, the Company’s full-cost ceiling exceeded the Company’s capitalized cost. However, sustained downwardmovements in natural gas and oil prices subsequent to December 31, 2009, could result in a future write-down of the Company’s naturalgas and oil properties.
The following table summarizes the Company’s natural gas and oil properties not subject to amortization at December 31, 2009, in totaland by the year in which such costs were incurred:
Year Costs Incurred__________________________________________________________________
2006Total 2009 2008 2007 and prior
(In thousands)
Acquisition $122,806 $ 4,287 $ 81,954 $ 7,972 $28,593Development 20,377 9,997 7,149 3,231 –Exploration 28,216 19,311 8,093 811 1Capitalized interest 6,815 1,336 3,865 478 1,136
Total costs not subject to amortization $178,214 $34,931 $101,061 $12,492 $29,730
FO
RM
10
-K
56 MDU Resources Group, Inc. Form 10-K

Part IIFO
RM
10
-K
Costs not subject to amortization as of December 31, 2009, consisted primarily of unevaluated leaseholds, drilling costs, seismic costs andcapitalized interest associated primarily with natural gas and oil development in the Paradox Basin in Utah; Big Horn Basin in Wyoming;east Texas properties; and CBNG in the Powder River Basin of Wyoming and Montana. The Company expects that the majority of thesecosts will be evaluated within the next five years and included in the amortization base as the properties are evaluated and/or developed.
Revenue recognitionRevenue is recognized when the earnings process is complete, as evidenced by an agreement between the customer and the Company,when delivery has occurred or services have been rendered, when the fee is fixed or determinable and when collection is reasonablyassured. The Company recognizes utility revenue each month based on the services provided to all utility customers during the month.Accrued unbilled revenue which is included in receivables, net, represents revenues recognized in excess of amounts billed. Accruedunbilled revenue at Montana-Dakota, Cascade and Intermountain was $92.6 million and $123.2 million at December 31, 2009 and 2008,respectively. The Company recognizes construction contract revenue at its construction businesses using the percentage-of-completionmethod as discussed later. The Company recognizes revenue from natural gas and oil production properties only on that portion ofproduction sold and allocable to the Company’s ownership interest in the related well. The Company recognizes all other revenues whenservices are rendered or goods are delivered. The Company presents revenues net of taxes collected from customers at the time of sale tobe remitted to governmental authorities, including sales and use taxes.
Percentage-of-completion methodThe Company recognizes construction contract revenue from fixed-price and modified fixed-price construction contracts at its constructionbusinesses using the percentage-of-completion method, measured by the percentage of costs incurred to date to estimated total costsfor each contract. If a loss is anticipated on a contract, the loss is immediately recognized. Costs and estimated earnings in excess ofbillings on uncompleted contracts of $28.8 million and $40.1 million at December 31, 2009 and 2008, respectively, represent revenuesrecognized in excess of amounts billed and were included in receivables, net. Billings in excess of costs and estimated earnings onuncompleted contracts of $49.3 million and $106.9 million at December 31, 2009 and 2008, respectively, represent billings in excessof revenues recognized and were included in accounts payable. Amounts representing balances billed but not paid by customersunder retainage provisions in contracts amounted to $45.4 million and $86.9 million at December 31, 2009 and 2008, respectively.The amounts expected to be paid within one year or less are included in receivables, net, and amounted to $44.0 million and$67.7 million at December 31, 2009 and 2008, respectively. The long-term retainage which was included in deferred charges andother assets – other was $1.4 million and $19.2 million at December 31, 2009 and 2008, respectively.
Derivative instrumentsThe Company’s policy allows the use of derivative instruments as part of an overall energy price, foreign currency and interest rate riskmanagement program to efficiently manage and minimize commodity price, foreign currency and interest rate risk. The Company’s policyprohibits the use of derivative instruments for speculating to take advantage of market trends and conditions, and the Company hasprocedures in place to monitor compliance with its policies. The Company is exposed to credit-related losses in relation to derivativeinstruments in the event of nonperformance by counterparties.
The Company’s policy generally allows the hedging of monthly forecasted natural gas and oil production at Fidelity for a period up to36 months from the time the Company enters into the hedge. The Company’s policy requires that interest rate derivative instruments notexceed a period of 24 months and foreign currency derivative instruments not exceed a 12-month period. The Company’s policy allows thehedging of monthly forecasted purchases of natural gas at Cascade and Intermountain for a period up to three years.
The Company’s policy requires that each month as physical natural gas and oil production at Fidelity occurs and the commodity is sold,the related portion of the derivative agreement for that month’s production must settle with its counterparties. Settlements represent theexchange of cash between the Company and its counterparties based on the notional quantities and prices for each month’s physicaldelivery as specified within the agreements. The fair value of the remaining notional amounts on the derivative agreements is recordedon the balance sheet as an asset or liability measured at fair value, with the unrealized gains or losses recognized as a component ofaccumulated other comprehensive income (loss). The Company’s policy also requires settlement of natural gas derivative instruments atCascade and Intermountain monthly and all interest rate derivative transactions must be settled over a period that will not exceed 90 days,and any foreign currency derivative transaction settlement periods may not exceed a 12-month period. The Company has policies andprocedures that management believes minimize credit-risk exposure. Accordingly, the Company does not anticipate any material effect onits financial position or results of operations as a result of nonperformance by counterparties. For more information on derivativeinstruments, see Note 7.
The Company’s swap and collar agreements are reflected at fair value, based upon futures prices, volatility and time to maturity, amongother things.
MDU Resources Group, Inc. Form 10-K 57

Part II
Asset retirement obligationsThe Company records the fair value of a liability for an asset retirement obligation in the period in which it is incurred. When the liability isinitially recorded, the Company capitalizes a cost by increasing the carrying amount of the related long-lived asset. Over time, the liability isaccreted to its present value each period, and the capitalized cost is depreciated over the useful life of the related asset. Upon settlementof the liability, the Company either settles the obligation for the recorded amount or incurs a gain or loss at its nonregulated operations orincurs a regulatory asset or liability at its regulated operations. For more information on asset retirement obligations, see Note 10.
Natural gas costs recoverable or refundable through rate adjustmentsUnder the terms of certain orders of the applicable state public service commissions, the Company is deferring natural gas commodity,transportation and storage costs that are greater or less than amounts presently being recovered through its existing rate schedules. Suchorders generally provide that these amounts are recoverable or refundable through rate adjustments within a period ranging from 12 to 28months from the time such costs are paid. Natural gas costs refundable through rate adjustments were $37.4 million and $64,000 atDecember 31, 2009 and 2008, respectively, which is included in other accrued liabilities. Natural gas costs recoverable through rateadjustments were $982,000 and $51.7 million at December 31, 2009 and 2008, respectively, which is included in prepayments and othercurrent assets.
InsuranceCertain subsidiaries of the Company are insured for workers’ compensation losses, subject to deductibles ranging up to $1 million peroccurrence. Automobile liability and general liability losses are insured, subject to deductibles ranging up to $1 million per accident oroccurrence. These subsidiaries have excess coverage above the primary automobile and general liability policies on a claims first-madeand reported basis beyond the deductible levels. The subsidiaries of the Company are retaining losses up to the deductible amountsaccrued on the basis of estimates of liability for claims incurred and for claims incurred but not reported.
Income taxesThe Company provides deferred federal and state income taxes on all temporary differences between the book and tax basis of theCompany’s assets and liabilities. Excess deferred income tax balances associated with the Company’s rate-regulated activities have beenrecorded as a regulatory liability and are included in other liabilities. These regulatory liabilities are expected to be reflected as a reductionin future rates charged to customers in accordance with applicable regulatory procedures.
The Company uses the deferral method of accounting for investment tax credits and amortizes the credits on regulated electric and naturalgas distribution plant over various periods that conform to the ratemaking treatment prescribed by the applicable state public servicecommissions.
Tax positions taken or expected to be taken in an income tax return are evaluated for recognition using a more-likely-than-not threshold,and those tax positions requiring recognition are measured as the largest amount of tax benefit that is greater than 50 percent likely ofbeing realized upon ultimate settlement with a taxing authority. The Company recognizes interest and penalties accrued related tounrecognized tax benefits in income taxes.
Foreign currency translation adjustmentThe functional currency of the Company’s investment in the Brazilian Transmission Lines, as further discussed in Note 4, is the BrazilianReal. Translation from the Brazilian Real to the U.S. dollar for assets and liabilities is performed using the exchange rate in effect at thebalance sheet date. Revenues and expenses are translated on a year-to-date basis using weighted average daily exchange rates.Adjustments resulting from such translations are reported as a separate component of other comprehensive income (loss) in commonstockholders’ equity.
Transaction gains and losses resulting from the effect of exchange rate changes on transactions denominated in a currency other than thefunctional currency of the reporting entity would be recorded in income.
Earnings (loss) per common shareBasic earnings (loss) per common share were computed by dividing earnings (loss) on common stock by the weighted average number ofshares of common stock outstanding during the year. Diluted earnings per common share were computed by dividing earnings oncommon stock by the total of the weighted average number of shares of common stock outstanding during the year, plus the effect ofoutstanding stock options, restricted stock grants and performance share awards. In 2008 and 2007, there were no shares excluded fromthe calculation of diluted earnings per share. Diluted loss per common share for 2009 was computed by dividing the loss on commonstock by the weighted average number of shares of common stock outstanding during the year. Due to the loss on common stock for2009, the effect of outstanding stock options, restricted stock grants and performance share awards was excluded from the computation of
FO
RM
10
-K
58 MDU Resources Group, Inc. Form 10-K
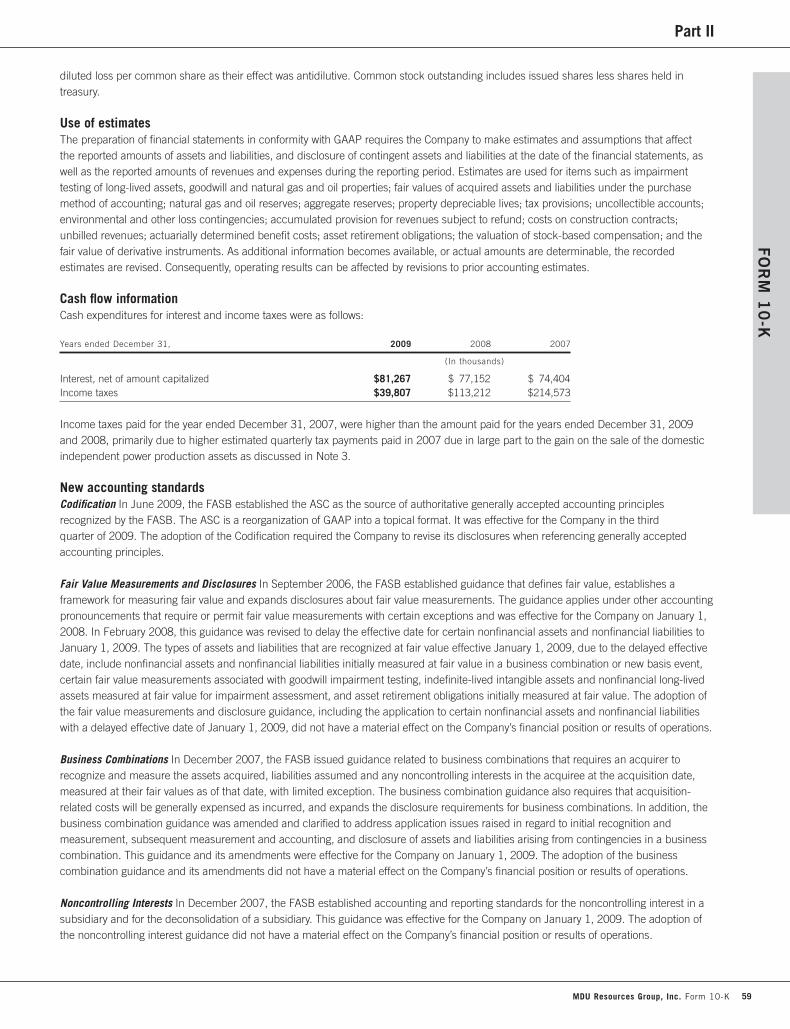
Part IIFO
RM
10
-K
diluted loss per common share as their effect was antidilutive. Common stock outstanding includes issued shares less shares held intreasury.
Use of estimatesThe preparation of financial statements in conformity with GAAP requires the Company to make estimates and assumptions that affectthe reported amounts of assets and liabilities, and disclosure of contingent assets and liabilities at the date of the financial statements, aswell as the reported amounts of revenues and expenses during the reporting period. Estimates are used for items such as impairmenttesting of long-lived assets, goodwill and natural gas and oil properties; fair values of acquired assets and liabilities under the purchasemethod of accounting; natural gas and oil reserves; aggregate reserves; property depreciable lives; tax provisions; uncollectible accounts;environmental and other loss contingencies; accumulated provision for revenues subject to refund; costs on construction contracts;unbilled revenues; actuarially determined benefit costs; asset retirement obligations; the valuation of stock-based compensation; and thefair value of derivative instruments. As additional information becomes available, or actual amounts are determinable, the recordedestimates are revised. Consequently, operating results can be affected by revisions to prior accounting estimates.
Cash flow informationCash expenditures for interest and income taxes were as follows:
Years ended December 31, 2009 2008 2007
(In thousands)
Interest, net of amount capitalized $81,267 $ 77,152 $ 74,404Income taxes $39,807 $113,212 $214,573
Income taxes paid for the year ended December 31, 2007, were higher than the amount paid for the years ended December 31, 2009and 2008, primarily due to higher estimated quarterly tax payments paid in 2007 due in large part to the gain on the sale of the domesticindependent power production assets as discussed in Note 3.
New accounting standardsCodification In June 2009, the FASB established the ASC as the source of authoritative generally accepted accounting principlesrecognized by the FASB. The ASC is a reorganization of GAAP into a topical format. It was effective for the Company in the thirdquarter of 2009. The adoption of the Codification required the Company to revise its disclosures when referencing generally acceptedaccounting principles.
Fair Value Measurements and Disclosures In September 2006, the FASB established guidance that defines fair value, establishes aframework for measuring fair value and expands disclosures about fair value measurements. The guidance applies under other accountingpronouncements that require or permit fair value measurements with certain exceptions and was effective for the Company on January 1,2008. In February 2008, this guidance was revised to delay the effective date for certain nonfinancial assets and nonfinancial liabilities toJanuary 1, 2009. The types of assets and liabilities that are recognized at fair value effective January 1, 2009, due to the delayed effectivedate, include nonfinancial assets and nonfinancial liabilities initially measured at fair value in a business combination or new basis event,certain fair value measurements associated with goodwill impairment testing, indefinite-lived intangible assets and nonfinancial long-livedassets measured at fair value for impairment assessment, and asset retirement obligations initially measured at fair value. The adoption ofthe fair value measurements and disclosure guidance, including the application to certain nonfinancial assets and nonfinancial liabilitieswith a delayed effective date of January 1, 2009, did not have a material effect on the Company’s financial position or results of operations.
Business Combinations In December 2007, the FASB issued guidance related to business combinations that requires an acquirer torecognize and measure the assets acquired, liabilities assumed and any noncontrolling interests in the acquiree at the acquisition date,measured at their fair values as of that date, with limited exception. The business combination guidance also requires that acquisition-related costs will be generally expensed as incurred, and expands the disclosure requirements for business combinations. In addition, thebusiness combination guidance was amended and clarified to address application issues raised in regard to initial recognition andmeasurement, subsequent measurement and accounting, and disclosure of assets and liabilities arising from contingencies in a businesscombination. This guidance and its amendments were effective for the Company on January 1, 2009. The adoption of the businesscombination guidance and its amendments did not have a material effect on the Company’s financial position or results of operations.
Noncontrolling Interests In December 2007, the FASB established accounting and reporting standards for the noncontrolling interest in asubsidiary and for the deconsolidation of a subsidiary. This guidance was effective for the Company on January 1, 2009. The adoption ofthe noncontrolling interest guidance did not have a material effect on the Company’s financial position or results of operations.
MDU Resources Group, Inc. Form 10-K 59

Part II
Derivative Instruments and Hedging Activities In March 2008, the FASB released guidance related to derivative instruments and hedgingactivities that requires enhanced disclosures about an entity’s derivative and hedging activities including how and why an entity usesderivative instruments, how derivative instruments and related hedged items are accounted for, and how derivative instruments and relatedhedged items affect an entity’s financial position, financial performance and cash flows. This guidance was effective for the Company onJanuary 1, 2009. The adoption of the derivative instruments and hedging activities guidance requires additional disclosures regarding theCompany’s derivative instruments; however, it did not impact the Company’s financial position or results of operations.
Pensions and Other Postretirement Benefits In December 2008, the FASB issued guidance on an employer’s disclosures about planassets of a defined benefit pension or other postretirement plan to provide users of financial statements with an understanding of howinvestment allocation decisions are made, the major categories of plan assets, the inputs and valuation techniques used to measure thefair value of plan assets, the effect of fair value measurements using significant unobservable inputs on changes in plan assets for theperiod and significant concentrations of risk within plan assets. This guidance was effective for the Company on January 1, 2009. Theadoption of the pension and other postretirement benefits guidance required additional disclosures regarding the Company’s definedbenefit pension and other postretirement plans in the annual financial statements; however, it did not impact the Company’s financialposition or results of operations.
Modernization of Oil and Gas Reporting In January 2009, the SEC adopted final rules amending its oil and gas reporting requirements. Thenew rules include changes to the pricing used to estimate reserves, the ability to include nontraditional resources in reserves, the use ofnew technology for determining reserves and permitting disclosure of probable and possible reserves. The final rules were effective onDecember 31, 2009. For information on the impacts of adopting the SEC’s final rules for oil and gas reporting, see SupplementaryFinancial Information.
Financial Instruments In April 2009, the FASB issued guidance that requires disclosures about the fair value of financial instruments forinterim reporting periods of publicly traded companies as well as in annual financial statements, which was effective for the Company inthe second quarter of 2009. The adoption of the financial instruments guidance required additional disclosures regarding the Company’sfair value of financial instruments; however, it did not impact the Company’s financial position or results of operations.
Subsequent Events In May 2009, the FASB issued subsequent events guidance which establishes standards of accounting for anddisclosure of events that occur after the balance sheet date but before financial statements are issued or are available to be issued. Inaddition it requires disclosure of the date through which the Company has evaluated subsequent events and whether it represents the datethe financial statements were issued or were available to be issued. This guidance was effective for the Company on June 30, 2009. Theadoption of the subsequent events guidance did not have a material effect on the Company’s financial position or results of operations.
Variable Interest Entities In June 2009, the FASB issued guidance related to variable interest entities which changes how a reporting entitydetermines when an entity that is insufficiently capitalized or is not controlled through voting rights should be consolidated and modifiesthe approach for determining the primary beneficiary of a variable interest entity. This guidance will require a reporting entity to provideadditional disclosures about its involvement with variable interest entities and any significant changes in risk exposure due to thatinvolvement. The guidance related to variable interest entities was effective for the Company on January 1, 2010. The adoption of thisguidance did not have a material effect on the Company’s financial position or results of operations.
Oil and Gas Reserve Estimation and Disclosure In January 2010, the FASB issued guidance related to oil and gas reserve estimation anddisclosure requirements, which aligned the current oil and gas reserve estimation and disclosures with those of the SEC’s final rule,Modernization of Oil and Gas Reporting, and requires disclosure in the first annual period of the estimated effect of the initial application ofthe guidance. The guidance related to oil and gas reserve estimation and disclosure was effective for the Company on December 31,2009. For more information on the effects of adopting the oil and gas reserve estimation and disclosure guidance, see SupplementaryFinancial Information.
Improving Disclosure About Fair Value Measurements In January 2010, the FASB issued guidance related to improving disclosures aboutfair value measurements. The guidance requires separate disclosures of the amounts of transfers in and out of Level 1 and Level 2 fairvalue measurements and a description of the reason for such transfers. In the reconciliation for Level 3 fair value measurements usingsignificant unobservable inputs, information about purchases, sales, issuances and settlements shall be presented separately. Thesedisclosures are required for interim and annual reporting periods and were effective for the Company on January 1, 2010, except for thedisclosures related to the purchases, sales, issuances and settlements in the roll forward activity of Level 3 fair value measurements, whichare effective on January 1, 2011. The guidance will require additional disclosures but will not impact the Company’s financial position orresults of operations.
FO
RM
10
-K
60 MDU Resources Group, Inc. Form 10-K
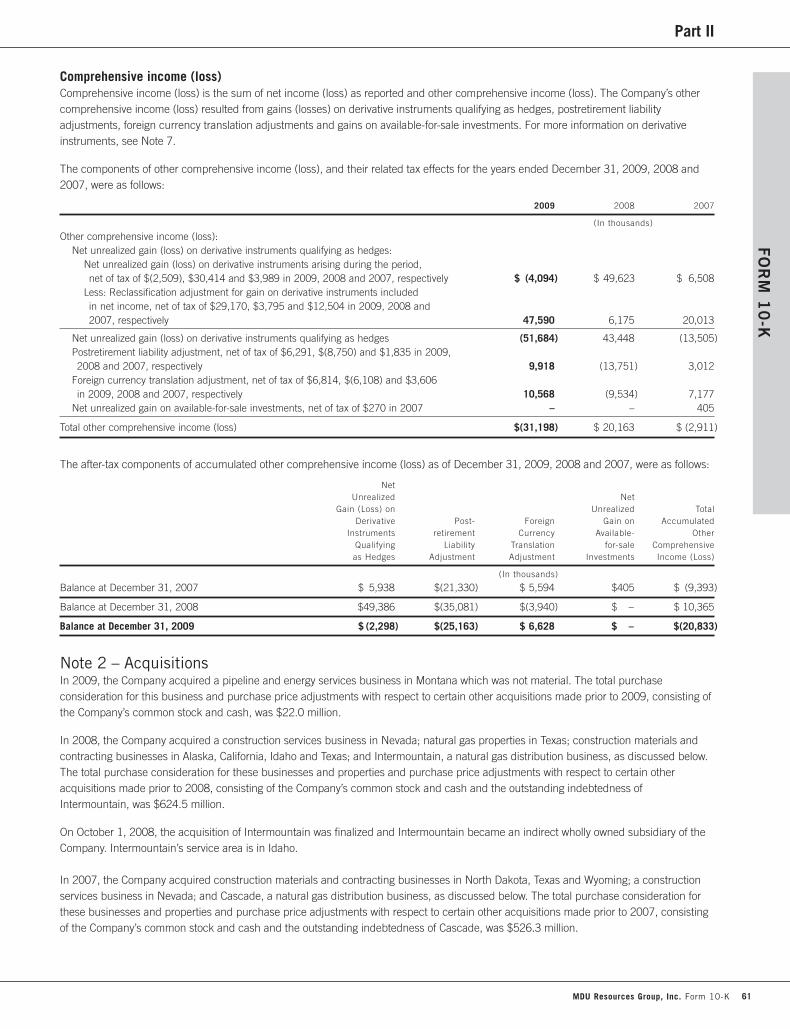
Part IIFO
RM
10
-K
Comprehensive income (loss)Comprehensive income (loss) is the sum of net income (loss) as reported and other comprehensive income (loss). The Company’s othercomprehensive income (loss) resulted from gains (losses) on derivative instruments qualifying as hedges, postretirement liabilityadjustments, foreign currency translation adjustments and gains on available-for-sale investments. For more information on derivativeinstruments, see Note 7.
The components of other comprehensive income (loss), and their related tax effects for the years ended December 31, 2009, 2008 and2007, were as follows:
2009 2008 2007
(In thousands)
Other comprehensive income (loss):Net unrealized gain (loss) on derivative instruments qualifying as hedges:
Net unrealized gain (loss) on derivative instruments arising during the period, net of tax of $(2,509), $30,414 and $3,989 in 2009, 2008 and 2007, respectively $ (4,094) $ 49,623 $ 6,508
Less: Reclassification adjustment for gain on derivative instruments included in net income, net of tax of $29,170, $3,795 and $12,504 in 2009, 2008 and 2007, respectively 47,590 6,175 20,013
Net unrealized gain (loss) on derivative instruments qualifying as hedges (51,684) 43,448 (13,505)Postretirement liability adjustment, net of tax of $6,291, $(8,750) and $1,835 in 2009,2008 and 2007, respectively 9,918 (13,751) 3,012
Foreign currency translation adjustment, net of tax of $6,814, $(6,108) and $3,606 in 2009, 2008 and 2007, respectively 10,568 (9,534) 7,177
Net unrealized gain on available-for-sale investments, net of tax of $270 in 2007 – – 405
Total other comprehensive income (loss) $(31,198) $ 20,163 $ (2,911)
The after-tax components of accumulated other comprehensive income (loss) as of December 31, 2009, 2008 and 2007, were as follows:
NetUnrealized Net
Gain (Loss) on Unrealized TotalDerivative Post- Foreign Gain on Accumulated
Instruments retirement Currency Available- OtherQualifying Liability Translation for-sale Comprehensiveas Hedges Adjustment Adjustment Investments Income (Loss)
(In thousands)
Balance at December 31, 2007 $ 5,938 $(21,330) $ 5,594 $405 $ (9,393)
Balance at December 31, 2008 $49,386 $(35,081) $(3,940) $ – $ 10,365
Balance at December 31, 2009 $ (2,298) $(25,163) $ 6,628 $ – $(20,833)
Note 2 – AcquisitionsIn 2009, the Company acquired a pipeline and energy services business in Montana which was not material. The total purchaseconsideration for this business and purchase price adjustments with respect to certain other acquisitions made prior to 2009, consisting ofthe Company’s common stock and cash, was $22.0 million.
In 2008, the Company acquired a construction services business in Nevada; natural gas properties in Texas; construction materials andcontracting businesses in Alaska, California, Idaho and Texas; and Intermountain, a natural gas distribution business, as discussed below.The total purchase consideration for these businesses and properties and purchase price adjustments with respect to certain otheracquisitions made prior to 2008, consisting of the Company’s common stock and cash and the outstanding indebtedness ofIntermountain, was $624.5 million.
On October 1, 2008, the acquisition of Intermountain was finalized and Intermountain became an indirect wholly owned subsidiary of theCompany. Intermountain’s service area is in Idaho.
In 2007, the Company acquired construction materials and contracting businesses in North Dakota, Texas and Wyoming; a constructionservices business in Nevada; and Cascade, a natural gas distribution business, as discussed below. The total purchase consideration forthese businesses and properties and purchase price adjustments with respect to certain other acquisitions made prior to 2007, consistingof the Company’s common stock and cash and the outstanding indebtedness of Cascade, was $526.3 million.
MDU Resources Group, Inc. Form 10-K 61

Part II
On July 2, 2007, the acquisition of Cascade was finalized and Cascade became an indirect wholly owned subsidiary of the Company.Cascade’s natural gas service areas are in Washington and Oregon.
The above acquisitions were accounted for under the purchase method of accounting and, accordingly, the acquired assets and liabilitiesassumed have been preliminarily recorded at their respective fair values as of the date of acquisition. On the above acquisition made in2009, a final fair market value is pending the completion of the review of the relevant assets and liabilities as of the acquisition date. Theresults of operations of the acquired businesses and properties are included in the financial statements since the date of each acquisition.Pro forma financial amounts reflecting the effects of the above acquisitions are not presented, as such acquisitions were not material to theCompany’s financial position or results of operations.
Note 3 – Discontinued OperationsInnovatum, a component of the pipeline and energy services segment, specialized in cable and pipeline magnetization and location.During the third quarter of 2006, the Company initiated a plan to sell Innovatum because the Company determined that Innovatum is anon-strategic asset. During the fourth quarter of 2006, the stock and a portion of the assets of Innovatum were sold and the Company soldthe remaining assets of Innovatum in January 2008. The loss on disposal of Innovatum was not material.
During the fourth quarter of 2006, the Company initiated a plan to sell certain of the domestic assets of Centennial Resources. The plan tosell was based on the increased market demand for independent power production assets, combined with the Company’s desire toefficiently fund future capital needs. The Company subsequently committed to a plan to sell CEM due to strong interest in the operations ofCEM during the bidding process for the domestic independent power production assets in the first quarter of 2007.
In July 2007, Centennial Resources sold its domestic independent power production business consisting of Centennial Power and CEM toBicent Power LLC (formerly known as Montana Acquisition Company LLC). The transaction was valued at $636 million, which included theassumption of approximately $36 million of project-related debt. The gain on the sale of the assets, excluding the gain on the sale ofHartwell as discussed in Note 4, was approximately $85.4 million (after tax).
The Company’s consolidated financial statements and accompanying notes for prior periods present the results of operations of Innovatumand the domestic independent power production assets as discontinued operations. In addition, the assets and liabilities of theseoperations were treated as held for sale, and as a result, no depreciation, depletion and amortization expense was recorded from the timeeach of the assets was classified as held for sale.
Operating results related to Innovatum for the year ended December 31, 2007, were as follows:
2007
(In thousands)
Operating revenues $1,748
Loss from discontinued operations before income tax benefit (210)Income tax benefit (316)
Income from discontinued operations, net of tax $ 106
Operating results related to the domestic independent power production assets for the year ended December 31, 2007, were as follows:
2007
(In thousands)
Operating revenues $125,867
Income from discontinued operations (including gain on disposal in 2007 of $142.4 million) before income tax expense 177,666
Income tax expense 68,438
Income from discontinued operations, net of tax $109,228
Revenues at the former independent power production operations were recognized based on electricity delivered and capacity provided,pursuant to contractual commitments and, where applicable, revenues were recognized ratably over the terms of the related contract.Arrangements with multiple revenue-generating activities were recognized with the multiple deliverables divided into separate units ofaccounting based on specific criteria and revenues of the arrangements allocated to the separate units based on their relative fair values.
FO
RM
10
-K
62 MDU Resources Group, Inc. Form 10-K

Part IIFO
RM
10
-K
Note 4 – Equity Method InvestmentsInvestments in companies in which the Company has the ability to exercise significant influence over operating and financial policies areaccounted for using the equity method. The Company’s equity method investments at December 31, 2009 and 2008, include the BrazilianTransmission Lines.
In August 2006, MDU Brasil acquired ownership interests in companies owning the Brazilian Transmission Lines. The interests involve theENTE (13.3-percent ownership interest), ERTE (13.3-percent ownership interest) and ECTE (25-percent ownership interest) electrictransmission lines, which are primarily in northeastern and southern Brazil. The transmission contracts provide for revenues denominatedin the Brazilian Real, annual inflation adjustments and change in tax law adjustments and have between 21 and 23 years remaining underthe contracts. Alusa and CEMIG hold the remaining ownership interests, with CELESC also having an ownership interest in ECTE. Thefunctional currency for the Brazilian Transmission Lines is the Brazilian Real.
In the fourth quarter of 2009, multiple sales agreements were signed with three separate parties for the Company to sell its ownershipinterests in the Brazilian Transmission Lines. This sale is pending regulatory approvals. One of the parties will purchase 15.6 percent of theCompany’s ownership interests over a four-year period. The other parties will purchase 84.4 percent of the Company’s ownership interestsat the financial close of the transaction.
In September 2004, Centennial Resources, through indirect wholly owned subsidiaries, acquired a 50 percent ownership interest inHartwell, which owns a 310-MW natural gas-fired electric generating facility near Hartwell, Georgia. In July 2007, the Company sold itsownership interest in Hartwell, and realized a gain of $10.1 million ($6.1 million after tax) from the sale which is recorded in earnings fromequity method investments on the Consolidated Statements of Income.
At December 31, 2009 and 2008, the investments in which the Company held an equity method interest had total assets of $387.0 millionand $294.7 million, respectively, and long-term debt of $176.7 million and $158.0 million, respectively. The Company’s investment in itsequity method investments was approximately $62.4 million and $44.4 million, including undistributed earnings of $9.3 million and$6.8 million, at December 31, 2009 and 2008, respectively.
Note 5 – Goodwill and Other Intangible AssetsThe changes in the carrying amount of goodwill for the year ended December 31, 2009, were as follows:
Balance Goodwill Balanceas of Acquired as of
January 1, During December 31,2009 the Year* 2009
(In thousands)
Electric $ – $ – $ –Natural gas distribution 344,952 784 345,736Construction services 95,619 4,508 100,127Pipeline and energy services 1,159 6,698 7,857Natural gas and oil production – – –Construction materials and contracting 174,005 1,738 175,743Other – – –
Total $615,735 $13,728 $629,463
* Includes purchase price adjustments that were not material related to acquisitions in a prior period.
MDU Resources Group, Inc. Form 10-K 63
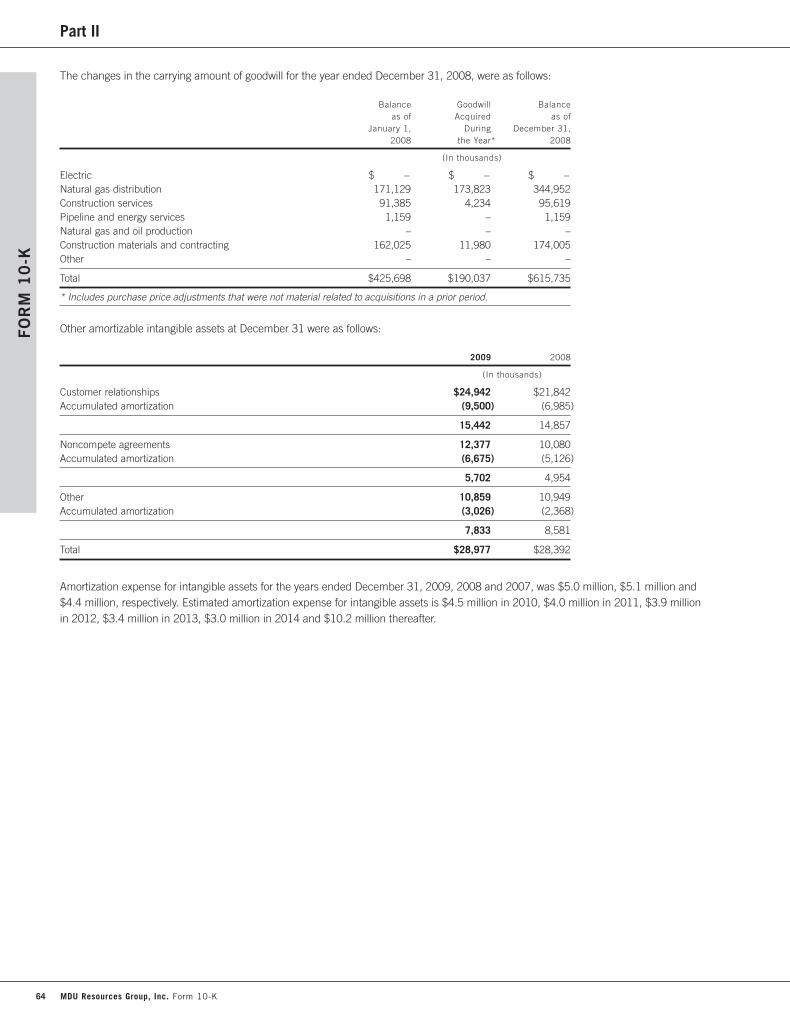
Part II
The changes in the carrying amount of goodwill for the year ended December 31, 2008, were as follows:
Balance Goodwill Balanceas of Acquired as of
January 1, During December 31,2008 the Year* 2008
(In thousands)
Electric $ – $ – $ –Natural gas distribution 171,129 173,823 344,952Construction services 91,385 4,234 95,619Pipeline and energy services 1,159 – 1,159Natural gas and oil production – – –Construction materials and contracting 162,025 11,980 174,005Other – – –
Total $425,698 $190,037 $615,735
* Includes purchase price adjustments that were not material related to acquisitions in a prior period.
Other amortizable intangible assets at December 31 were as follows:
2009 2008
(In thousands)
Customer relationships $24,942 $21,842Accumulated amortization (9,500) (6,985)
15,442 14,857
Noncompete agreements 12,377 10,080Accumulated amortization (6,675) (5,126)
5,702 4,954
Other 10,859 10,949Accumulated amortization (3,026) (2,368)
7,833 8,581
Total $28,977 $28,392
Amortization expense for intangible assets for the years ended December 31, 2009, 2008 and 2007, was $5.0 million, $5.1 million and$4.4 million, respectively. Estimated amortization expense for intangible assets is $4.5 million in 2010, $4.0 million in 2011, $3.9 millionin 2012, $3.4 million in 2013, $3.0 million in 2014 and $10.2 million thereafter.
FO
RM
10
-K
64 MDU Resources Group, Inc. Form 10-K
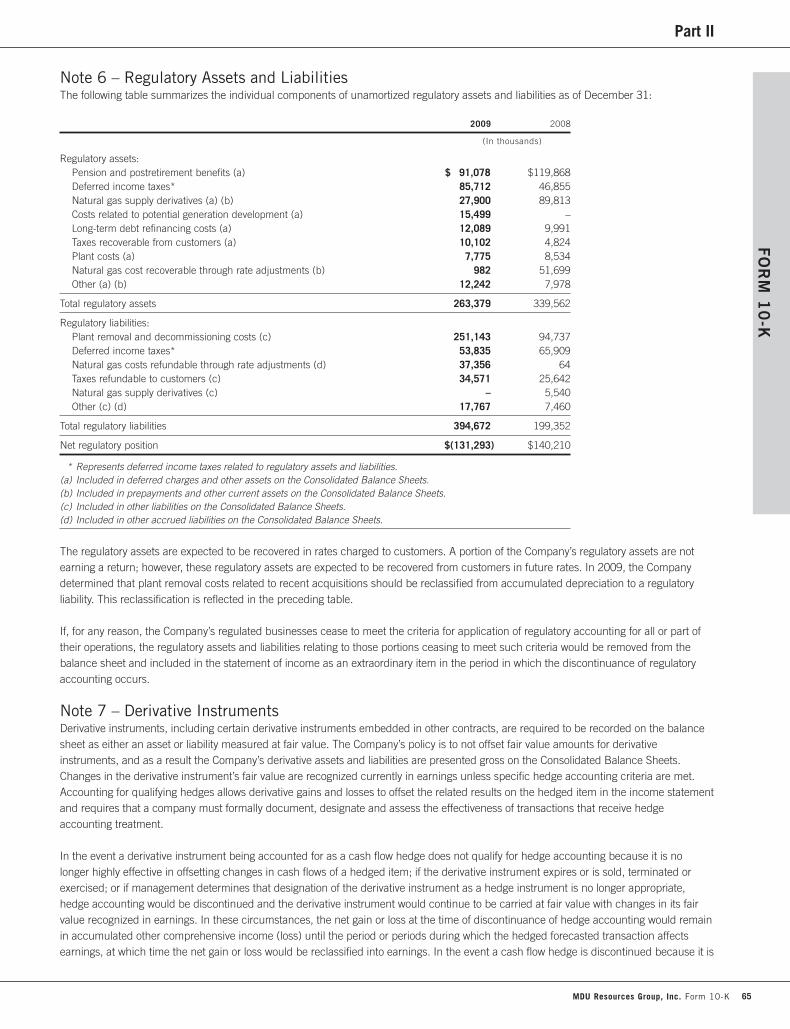
Part IIFO
RM
10
-K
Note 6 – Regulatory Assets and LiabilitiesThe following table summarizes the individual components of unamortized regulatory assets and liabilities as of December 31:
2009 2008
(In thousands)
Regulatory assets:Pension and postretirement benefits (a) $ 91,078 $119,868Deferred income taxes* 85,712 46,855Natural gas supply derivatives (a) (b) 27,900 89,813Costs related to potential generation development (a) 15,499 –Long-term debt refinancing costs (a) 12,089 9,991Taxes recoverable from customers (a) 10,102 4,824Plant costs (a) 7,775 8,534Natural gas cost recoverable through rate adjustments (b) 982 51,699Other (a) (b) 12,242 7,978
Total regulatory assets 263,379 339,562
Regulatory liabilities:Plant removal and decommissioning costs (c) 251,143 94,737Deferred income taxes* 53,835 65,909Natural gas costs refundable through rate adjustments (d) 37,356 64Taxes refundable to customers (c) 34,571 25,642Natural gas supply derivatives (c) – 5,540Other (c) (d) 17,767 7,460
Total regulatory liabilities 394,672 199,352
Net regulatory position $(131,293) $140,210
* Represents deferred income taxes related to regulatory assets and liabilities.(a) Included in deferred charges and other assets on the Consolidated Balance Sheets.(b) Included in prepayments and other current assets on the Consolidated Balance Sheets.(c) Included in other liabilities on the Consolidated Balance Sheets.(d) Included in other accrued liabilities on the Consolidated Balance Sheets.
The regulatory assets are expected to be recovered in rates charged to customers. A portion of the Company’s regulatory assets are notearning a return; however, these regulatory assets are expected to be recovered from customers in future rates. In 2009, the Companydetermined that plant removal costs related to recent acquisitions should be reclassified from accumulated depreciation to a regulatoryliability. This reclassification is reflected in the preceding table.
If, for any reason, the Company’s regulated businesses cease to meet the criteria for application of regulatory accounting for all or part oftheir operations, the regulatory assets and liabilities relating to those portions ceasing to meet such criteria would be removed from thebalance sheet and included in the statement of income as an extraordinary item in the period in which the discontinuance of regulatoryaccounting occurs.
Note 7 – Derivative InstrumentsDerivative instruments, including certain derivative instruments embedded in other contracts, are required to be recorded on the balancesheet as either an asset or liability measured at fair value. The Company’s policy is to not offset fair value amounts for derivativeinstruments, and as a result the Company’s derivative assets and liabilities are presented gross on the Consolidated Balance Sheets.Changes in the derivative instrument’s fair value are recognized currently in earnings unless specific hedge accounting criteria are met.Accounting for qualifying hedges allows derivative gains and losses to offset the related results on the hedged item in the income statementand requires that a company must formally document, designate and assess the effectiveness of transactions that receive hedgeaccounting treatment.
In the event a derivative instrument being accounted for as a cash flow hedge does not qualify for hedge accounting because it is nolonger highly effective in offsetting changes in cash flows of a hedged item; if the derivative instrument expires or is sold, terminated orexercised; or if management determines that designation of the derivative instrument as a hedge instrument is no longer appropriate,hedge accounting would be discontinued and the derivative instrument would continue to be carried at fair value with changes in its fairvalue recognized in earnings. In these circumstances, the net gain or loss at the time of discontinuance of hedge accounting would remainin accumulated other comprehensive income (loss) until the period or periods during which the hedged forecasted transaction affectsearnings, at which time the net gain or loss would be reclassified into earnings. In the event a cash flow hedge is discontinued because it is
MDU Resources Group, Inc. Form 10-K 65
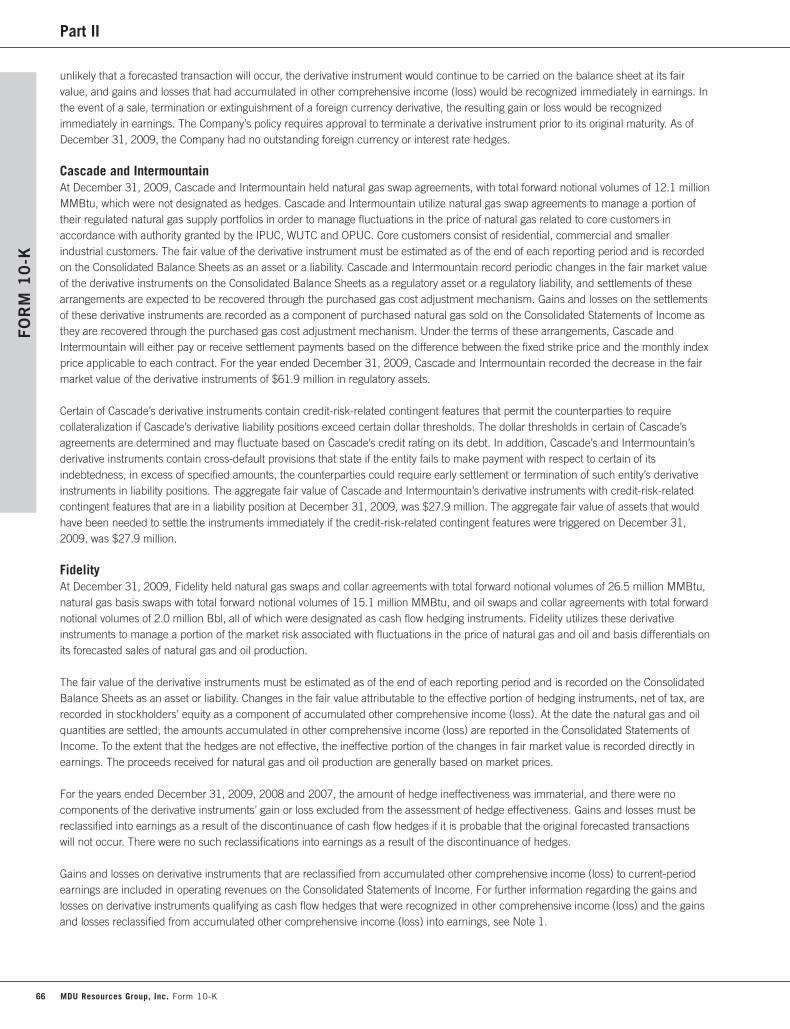
Part II
unlikely that a forecasted transaction will occur, the derivative instrument would continue to be carried on the balance sheet at its fairvalue, and gains and losses that had accumulated in other comprehensive income (loss) would be recognized immediately in earnings. Inthe event of a sale, termination or extinguishment of a foreign currency derivative, the resulting gain or loss would be recognizedimmediately in earnings. The Company’s policy requires approval to terminate a derivative instrument prior to its original maturity. As ofDecember 31, 2009, the Company had no outstanding foreign currency or interest rate hedges.
Cascade and IntermountainAt December 31, 2009, Cascade and Intermountain held natural gas swap agreements, with total forward notional volumes of 12.1 millionMMBtu, which were not designated as hedges. Cascade and Intermountain utilize natural gas swap agreements to manage a portion oftheir regulated natural gas supply portfolios in order to manage fluctuations in the price of natural gas related to core customers inaccordance with authority granted by the IPUC, WUTC and OPUC. Core customers consist of residential, commercial and smallerindustrial customers. The fair value of the derivative instrument must be estimated as of the end of each reporting period and is recordedon the Consolidated Balance Sheets as an asset or a liability. Cascade and Intermountain record periodic changes in the fair market valueof the derivative instruments on the Consolidated Balance Sheets as a regulatory asset or a regulatory liability, and settlements of thesearrangements are expected to be recovered through the purchased gas cost adjustment mechanism. Gains and losses on the settlementsof these derivative instruments are recorded as a component of purchased natural gas sold on the Consolidated Statements of Income asthey are recovered through the purchased gas cost adjustment mechanism. Under the terms of these arrangements, Cascade andIntermountain will either pay or receive settlement payments based on the difference between the fixed strike price and the monthly indexprice applicable to each contract. For the year ended December 31, 2009, Cascade and Intermountain recorded the decrease in the fairmarket value of the derivative instruments of $61.9 million in regulatory assets.
Certain of Cascade’s derivative instruments contain credit-risk-related contingent features that permit the counterparties to requirecollateralization if Cascade’s derivative liability positions exceed certain dollar thresholds. The dollar thresholds in certain of Cascade’sagreements are determined and may fluctuate based on Cascade’s credit rating on its debt. In addition, Cascade’s and Intermountain’sderivative instruments contain cross-default provisions that state if the entity fails to make payment with respect to certain of itsindebtedness, in excess of specified amounts, the counterparties could require early settlement or termination of such entity’s derivativeinstruments in liability positions. The aggregate fair value of Cascade and Intermountain’s derivative instruments with credit-risk-relatedcontingent features that are in a liability position at December 31, 2009, was $27.9 million. The aggregate fair value of assets that wouldhave been needed to settle the instruments immediately if the credit-risk-related contingent features were triggered on December 31,2009, was $27.9 million.
FidelityAt December 31, 2009, Fidelity held natural gas swaps and collar agreements with total forward notional volumes of 26.5 million MMBtu,natural gas basis swaps with total forward notional volumes of 15.1 million MMBtu, and oil swaps and collar agreements with total forwardnotional volumes of 2.0 million Bbl, all of which were designated as cash flow hedging instruments. Fidelity utilizes these derivativeinstruments to manage a portion of the market risk associated with fluctuations in the price of natural gas and oil and basis differentials onits forecasted sales of natural gas and oil production.
The fair value of the derivative instruments must be estimated as of the end of each reporting period and is recorded on the ConsolidatedBalance Sheets as an asset or liability. Changes in the fair value attributable to the effective portion of hedging instruments, net of tax, arerecorded in stockholders’ equity as a component of accumulated other comprehensive income (loss). At the date the natural gas and oilquantities are settled, the amounts accumulated in other comprehensive income (loss) are reported in the Consolidated Statements ofIncome. To the extent that the hedges are not effective, the ineffective portion of the changes in fair market value is recorded directly inearnings. The proceeds received for natural gas and oil production are generally based on market prices.
For the years ended December 31, 2009, 2008 and 2007, the amount of hedge ineffectiveness was immaterial, and there were nocomponents of the derivative instruments’ gain or loss excluded from the assessment of hedge effectiveness. Gains and losses must bereclassified into earnings as a result of the discontinuance of cash flow hedges if it is probable that the original forecasted transactionswill not occur. There were no such reclassifications into earnings as a result of the discontinuance of hedges.
Gains and losses on derivative instruments that are reclassified from accumulated other comprehensive income (loss) to current-periodearnings are included in operating revenues on the Consolidated Statements of Income. For further information regarding the gains andlosses on derivative instruments qualifying as cash flow hedges that were recognized in other comprehensive income (loss) and the gainsand losses reclassified from accumulated other comprehensive income (loss) into earnings, see Note 1.
FO
RM
10
-K
66 MDU Resources Group, Inc. Form 10-K
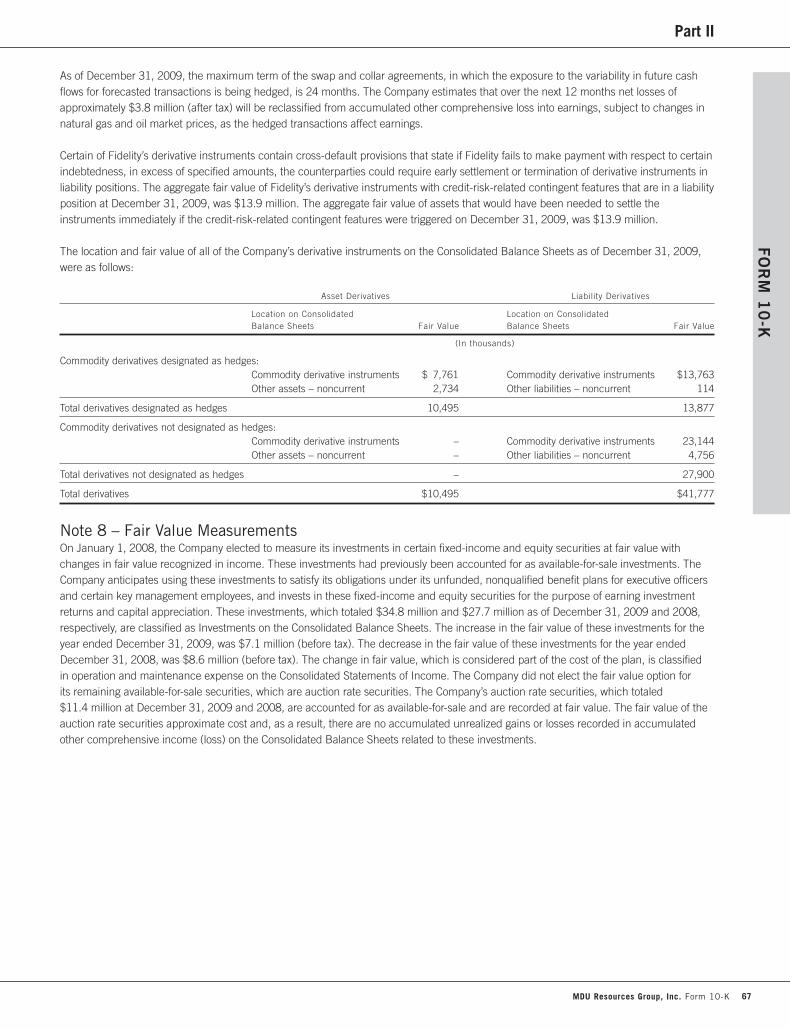
Part IIFO
RM
10
-K
As of December 31, 2009, the maximum term of the swap and collar agreements, in which the exposure to the variability in future cashflows for forecasted transactions is being hedged, is 24 months. The Company estimates that over the next 12 months net losses ofapproximately $3.8 million (after tax) will be reclassified from accumulated other comprehensive loss into earnings, subject to changes innatural gas and oil market prices, as the hedged transactions affect earnings.
Certain of Fidelity’s derivative instruments contain cross-default provisions that state if Fidelity fails to make payment with respect to certainindebtedness, in excess of specified amounts, the counterparties could require early settlement or termination of derivative instruments inliability positions. The aggregate fair value of Fidelity’s derivative instruments with credit-risk-related contingent features that are in a liabilityposition at December 31, 2009, was $13.9 million. The aggregate fair value of assets that would have been needed to settle theinstruments immediately if the credit-risk-related contingent features were triggered on December 31, 2009, was $13.9 million.
The location and fair value of all of the Company’s derivative instruments on the Consolidated Balance Sheets as of December 31, 2009,were as follows:
Asset Derivatives Liability Derivatives
Location on Consolidated Location on ConsolidatedBalance Sheets Fair Value Balance Sheets Fair Value
(In thousands)
Commodity derivatives designated as hedges:Commodity derivative instruments $ 7,761 Commodity derivative instruments $13,763Other assets – noncurrent 2,734 Other liabilities – noncurrent 114
Total derivatives designated as hedges 10,495 13,877
Commodity derivatives not designated as hedges:Commodity derivative instruments – Commodity derivative instruments 23,144Other assets – noncurrent – Other liabilities – noncurrent 4,756
Total derivatives not designated as hedges – 27,900
Total derivatives $10,495 $41,777
Note 8 – Fair Value MeasurementsOn January 1, 2008, the Company elected to measure its investments in certain fixed-income and equity securities at fair value withchanges in fair value recognized in income. These investments had previously been accounted for as available-for-sale investments. TheCompany anticipates using these investments to satisfy its obligations under its unfunded, nonqualified benefit plans for executive officersand certain key management employees, and invests in these fixed-income and equity securities for the purpose of earning investmentreturns and capital appreciation. These investments, which totaled $34.8 million and $27.7 million as of December 31, 2009 and 2008,respectively, are classified as Investments on the Consolidated Balance Sheets. The increase in the fair value of these investments for theyear ended December 31, 2009, was $7.1 million (before tax). The decrease in the fair value of these investments for the year endedDecember 31, 2008, was $8.6 million (before tax). The change in fair value, which is considered part of the cost of the plan, is classifiedin operation and maintenance expense on the Consolidated Statements of Income. The Company did not elect the fair value option forits remaining available-for-sale securities, which are auction rate securities. The Company’s auction rate securities, which totaled$11.4 million at December 31, 2009 and 2008, are accounted for as available-for-sale and are recorded at fair value. The fair value of theauction rate securities approximate cost and, as a result, there are no accumulated unrealized gains or losses recorded in accumulatedother comprehensive income (loss) on the Consolidated Balance Sheets related to these investments.
MDU Resources Group, Inc. Form 10-K 67

Part II
Fair value is defined as the price that would be received to sell an asset or paid to transfer a liability (an exit price) in an orderly transactionbetween market participants at the measurement date. The statement establishes a hierarchy for grouping assets and liabilities, based onthe significance of inputs. The Company’s assets and liabilities measured at fair value on a recurring basis are as follows:
Fair Value Measurements atDecember 31, 2009, Using_________________________________________________
Quoted Pricesin Active Significant
Markets for Other SignificantIdentical Observable Unobservable Collateral Balance at
Assets Inputs Inputs Provided to December 31,(Level 1) (Level 2) (Level 3) Counterparties 2009
(In thousands)
Assets:Money market funds $ 9,124 $151,000 $ – $ – $160,124Available-for-sale securities 9,078 37,141 – – 46,219Commodity derivative instruments – current – 7,761 – – 7,761Commodity derivative instruments – noncurrent – 2,734 – – 2,734
Total assets measured at fair value $18,202 $198,636 $ – $ – $216,838
Liabilities:Commodity derivative instruments – current $ – $ 36,907 $ – $ – $ 36,907Commodity derivative instruments – noncurrent – 4,870 – – 4,870
Total liabilities measured at fair value $ – $ 41,777 $ – $ – $ 41,777
Fair Value Measurements atDecember 31, 2008, Using_________________________________________________
Quoted Pricesin Active Significant
Markets for Other SignificantIdentical Observable Unobservable Collateral Balance at
Assets Inputs Inputs Provided to December 31,(Level 1) (Level 2) (Level 3) Counterparties 2008
(In thousands)
Assets:Available-for-sale securities $27,725 $11,400 $ – $ – $ 39,125Commodity derivative instruments – current – 78,164 – – 78,164Commodity derivative instruments – noncurrent – 3,222 – – 3,222
Total assets measured at fair value $27,725 $92,786 $ – $ – $120,511
Liabilities:Commodity derivative instruments – current $ – $67,629 $ – $11,100 $ 56,529Commodity derivative instruments – noncurrent – 23,534 – – 23,534
Total liabilities measured at fair value $ – $91,163 $ – $11,100 $ 80,063
The estimated fair value of the Company’s Level 1 money market funds is valued at the net asset value of shares held by the Company,based on published market quotations in active markets. The estimated fair value of the Company’s Level 1 available-for-sale securitiesis based on quoted market prices in active markets for identical equity and fixed-income securities. The estimated fair value of theCompany’s Level 2 money market funds and available-for-sale securities is based on comparable market transactions or underlyinginvestments. The estimated fair value of the Company’s Level 2 commodity derivative instruments is based upon futures prices, volatilityand time to maturity, among other things.
FO
RM
10
-K
68 MDU Resources Group, Inc. Form 10-K
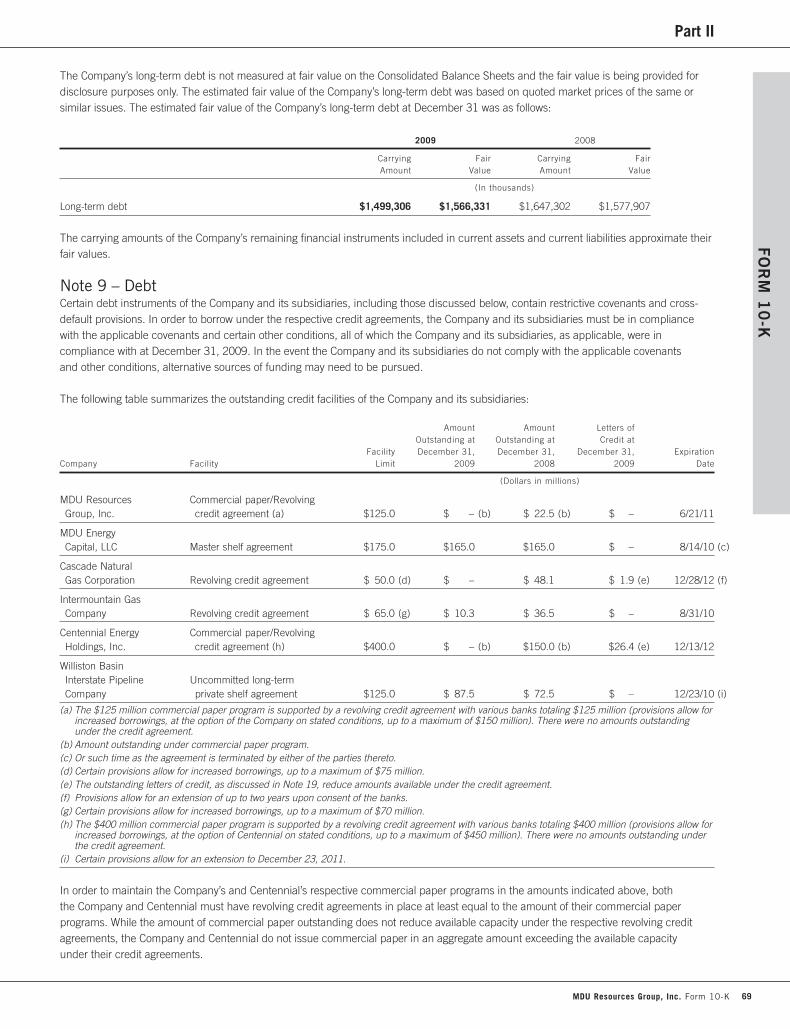
Part IIFO
RM
10
-K
The Company’s long-term debt is not measured at fair value on the Consolidated Balance Sheets and the fair value is being provided fordisclosure purposes only. The estimated fair value of the Company’s long-term debt was based on quoted market prices of the same orsimilar issues. The estimated fair value of the Company’s long-term debt at December 31 was as follows:
2009 2008
Carrying Fair Carrying FairAmount Value Amount Value
(In thousands)
Long-term debt $1,499,306 $1,566,331 $1,647,302 $1,577,907
The carrying amounts of the Company’s remaining financial instruments included in current assets and current liabilities approximate theirfair values.
Note 9 – DebtCertain debt instruments of the Company and its subsidiaries, including those discussed below, contain restrictive covenants and cross-default provisions. In order to borrow under the respective credit agreements, the Company and its subsidiaries must be in compliancewith the applicable covenants and certain other conditions, all of which the Company and its subsidiaries, as applicable, were incompliance with at December 31, 2009. In the event the Company and its subsidiaries do not comply with the applicable covenantsand other conditions, alternative sources of funding may need to be pursued.
The following table summarizes the outstanding credit facilities of the Company and its subsidiaries:
Amount Amount Letters ofOutstanding at Outstanding at Credit at
Facility December 31, December 31, December 31, ExpirationCompany Facility Limit 2009 2008 2009 Date
(Dollars in millions)
MDU Resources Commercial paper/RevolvingGroup, Inc. credit agreement (a) $125.0 $ – (b) $ 22.5 (b) $ – 6/21/11
MDU Energy Capital, LLC Master shelf agreement $175.0 $165.0 $165.0 $ – 8/14/10 (c)
Cascade Natural Gas Corporation Revolving credit agreement $ 50.0 (d) $ – $ 48.1 $ 1.9 (e) 12/28/12 (f)
Intermountain Gas Company Revolving credit agreement $ 65.0 (g) $ 10.3 $ 36.5 $ – 8/31/10
Centennial Energy Commercial paper/RevolvingHoldings, Inc. credit agreement (h) $400.0 $ – (b) $150.0 (b) $26.4 (e) 12/13/12
Williston Basin Interstate Pipeline Uncommitted long-termCompany private shelf agreement $125.0 $ 87.5 $ 72.5 $ – 12/23/10 (i)
(a) The $125 million commercial paper program is supported by a revolving credit agreement with various banks totaling $125 million (provisions allow forincreased borrowings, at the option of the Company on stated conditions, up to a maximum of $150 million). There were no amounts outstandingunder the credit agreement.
(b) Amount outstanding under commercial paper program.(c) Or such time as the agreement is terminated by either of the parties thereto.(d) Certain provisions allow for increased borrowings, up to a maximum of $75 million.(e) The outstanding letters of credit, as discussed in Note 19, reduce amounts available under the credit agreement.(f) Provisions allow for an extension of up to two years upon consent of the banks.(g) Certain provisions allow for increased borrowings, up to a maximum of $70 million.(h) The $400 million commercial paper program is supported by a revolving credit agreement with various banks totaling $400 million (provisions allow for
increased borrowings, at the option of Centennial on stated conditions, up to a maximum of $450 million). There were no amounts outstanding underthe credit agreement.
(i) Certain provisions allow for an extension to December 23, 2011.
In order to maintain the Company’s and Centennial’s respective commercial paper programs in the amounts indicated above, boththe Company and Centennial must have revolving credit agreements in place at least equal to the amount of their commercial paperprograms. While the amount of commercial paper outstanding does not reduce available capacity under the respective revolving creditagreements, the Company and Centennial do not issue commercial paper in an aggregate amount exceeding the available capacityunder their credit agreements.
MDU Resources Group, Inc. Form 10-K 69
Part II
The following includes information related to the preceding table.
Short-term borrowingsMDU Resources Group, Inc. The Company had $57.0 million outstanding under a $175 million term loan agreement at December 31,2008. This agreement expired on March 24, 2009.
Cascade Natural Gas Corporation Any borrowings under the $50 million revolving credit agreement would be classified as short-termborrowings as Cascade intends to repay the borrowings within one year.
Cascade’s credit agreement contains customary covenants and provisions, including a covenant of Cascade not to permit, at any time, theratio of total debt to total capitalization to be greater than 65 percent. Cascade’s credit agreement also contains cross-default provisions.These provisions state that if Cascade fails to make any payment with respect to any indebtedness or contingent obligation, in excess of aspecified amount, under any agreement that causes such indebtedness to be due prior to its stated maturity or the contingent obligation tobecome payable, Cascade will be in default under the credit agreement. Certain of Cascade’s financing agreements and Cascade’spractices limit the amount of subsidiary indebtedness.
Intermountain Gas Company The weighted average interest rate for borrowings outstanding under the credit agreement at December 31,2009, was 3.25 percent. The credit agreement contains customary covenants and provisions, including covenants of Intermountain not topermit, as of the end of any fiscal quarter, (A) the ratio of funded debt to total capitalization (determined on a consolidated basis) to begreater than 65 percent, or (B) the ratio of Intermountain’s earnings before interest, taxes, depreciation and amortization to interestexpense (determined on a consolidated basis), for the 12-month period ended each fiscal quarter, to be less than 2 to 1. Other covenantsinclude limitations on the sale of certain assets and on the making of certain loans and investments.
Intermountain’s credit agreement contains cross-default provisions. These provisions state that if (i) Intermountain fails to make anypayment with respect to any indebtedness or guarantee in excess of $5 million, (ii) any other event occurs that would permit the holders ofindebtedness or the beneficiaries of guarantees to become payable, or (iii) certain conditions result in an early termination date under anyswap contract, then Intermountain shall be in default under the revolving credit agreement.
Long-term debtMDU Resources Group, Inc. The Company’s revolving credit agreement supports its commercial paper program. The commercial paperborrowings are classified as long-term debt as they are intended to be refinanced on a long-term basis through continued commercialpaper borrowings.
The Company’s credit agreement contains customary covenants and provisions, including covenants of the Company not to permit, as ofthe end of any fiscal quarter, (A) the ratio of funded debt to total capitalization (determined on a consolidated basis) to be greater than65 percent or (B) the ratio of funded debt to capitalization (determined with respect to the Company alone, excluding its subsidiaries) to begreater than 65 percent. Also included is a covenant that does not permit the ratio of the Company’s earnings before interest, taxes,depreciation and amortization to interest expense (determined with respect to the Company alone, excluding its subsidiaries), for the 12-month period ended each fiscal quarter, to be less than 2.5 to 1. Other covenants include restrictions on the sale of certain assets and onthe making of certain investments.
There are no credit facilities that contain cross-default provisions between the Company and any of its subsidiaries.
In November 2009, the Company completed a defeasance of its outstanding 8.60% Secured Medium-Term Notes, Series A, due April 1,2012 (8.60% Notes), by depositing approximately $5.5 million with the Mortgage trustee. The $5.5 million deposit will be used solely tosatisfy the principal and remaining interest obligations on the 8.60% Notes. These securities are the only remaining first mortgage bondsoutstanding under the Mortgage, other than $30.0 million of first mortgage bonds which were held by the Indenture trustee for the benefitof the senior note holders. In connection with the defeasance of the 8.60% Notes, the Mortgage was discharged and the lien of theIndenture was discharged so that the Company’s 5.98% Senior Notes due 2033 are now unsecured.
MDU Energy Capital, LLC The master shelf agreement contains customary covenants and provisions, including covenants of MDU EnergyCapital not to permit (A) the ratio of its total debt (on a consolidated basis) to adjusted total capitalization to be greater than 70 percent, or(B) the ratio of subsidiary debt to subsidiary capitalization to be greater than 65 percent, or (C) the ratio of Intermountain’s total debt(determined on a consolidated basis) to total capitalization to be greater than 65 percent. The agreement also includes a covenantrequiring the ratio of MDU Energy Capital earnings before interest and taxes to interest expense (on a consolidated basis), for the 12-month period ended each fiscal quarter, to be greater than 1.5 to 1. In addition, payment obligations under the master shelf agreementmay be accelerated upon the occurrence of an event of default (as described in the agreement).
FO
RM
10
-K
70 MDU Resources Group, Inc. Form 10-K

Part IIFO
RM
10
-K
Centennial Energy Holdings, Inc. Centennial’s revolving credit agreement supports its commercial paper program. The Centennialcommercial paper borrowings are classified as long-term debt as Centennial intends to refinance these borrowings on a long-term basisthrough continued Centennial commercial paper borrowings.
Centennial’s credit agreement and the Centennial uncommitted long-term master shelf agreement contain customary covenants andprovisions, including a covenant of Centennial and certain of its subsidiaries, not to permit, as of the end of any fiscal quarter, the ratio oftotal debt to total capitalization to be greater than 65 percent (for the $400 million credit agreement) and 60 percent (for the master shelfagreement). The master shelf agreement also includes a covenant that does not permit the ratio of Centennial’s earnings before interest,taxes, depreciation and amortization to interest expense, for the 12-month period ended each fiscal quarter, to be less than 1.75 to 1.Other covenants include minimum consolidated net worth, limitation on priority debt and restrictions on the sale of certain assets and onthe making of certain loans and investments.
Pursuant to a covenant under the credit agreement, Centennial may only make distributions to the Company in an amount up to100 percent of Centennial’s consolidated net income after taxes for the immediately preceding fiscal year. The write-down of thenatural gas and oil properties in 2009 would have negatively affected Centennial’s ability to make distributions to the Company in 2010,however, in November 2009, the lenders under the credit agreement consented to permit Centennial to make distributions during2010 in an aggregate amount up to 100 percent of its consolidated net income after taxes during fiscal year 2009 without giving effectto the write-down.
Certain of Centennial’s financing agreements contain cross-default provisions. These provisions state that if Centennial or any subsidiary ofCentennial fails to make any payment with respect to any indebtedness or contingent obligation, in excess of a specified amount, underany agreement that causes such indebtedness to be due prior to its stated maturity or the contingent obligation to become payable, theapplicable agreements will be in default. Certain of Centennial’s financing agreements and Centennial’s practices limit the amount ofsubsidiary indebtedness.
Williston Basin Interstate Pipeline Company The uncommitted long-term private shelf agreement contains customary covenants andprovisions, including a covenant of Williston Basin not to permit, as of the end of any fiscal quarter, the ratio of total debt to totalcapitalization to be greater than 55 percent. Other covenants include limitation on priority debt and some restrictions on the sale ofcertain assets and the making of certain investments.
Long-term Debt Outstanding Long-term debt outstanding at December 31 was as follows:
2009 2008
(In thousands)
First mortgage bonds and notes:Secured Medium-Term Notes, Series A, 8.60% $ – $ 5,500Senior Notes, 5.98%, due December 15, 2033 – 30,000 (a)
Total first mortgage bonds and notes – 35,500Senior Notes at a weighted average rate of 6.07%, due on dates ranging from October 30, 2010 to March 8, 2037 1,370,455 1,271,227
Commercial paper supported by revolving credit agreements – 172,500Medium-Term Notes at a weighted average rate of 7.72%, due on dates ranging from September 4, 2012 to March 16, 2029 81,000 81,000
Other notes at a weighted average rate of 5.24%, due on dates ranging from September 1, 2020 to February 1, 2035 42,070 42,971
Credit agreements at a weighted average rate of 5.67%, due on dates ranging from April 1, 2010 to November 30, 2038 5,781 44,205
Discount – (101)
Total long-term debt 1,499,306 1,647,302Less current maturities 12,629 78,666
Net long-term debt $1,486,677 $1,568,636
(a) The $30.0 million of 5.98% Senior Notes became unsecured upon the defeasance of the outstanding 8.60% Notes, as previously discussed.
The amounts of scheduled long-term debt maturities for the five years and thereafter following December 31, 2009, aggregate$12.6 million in 2010; $72.3 million in 2011; $136.3 million in 2012; $258.8 million in 2013; $9.1 million in 2014 and$1,010.2 million thereafter.
MDU Resources Group, Inc. Form 10-K 71
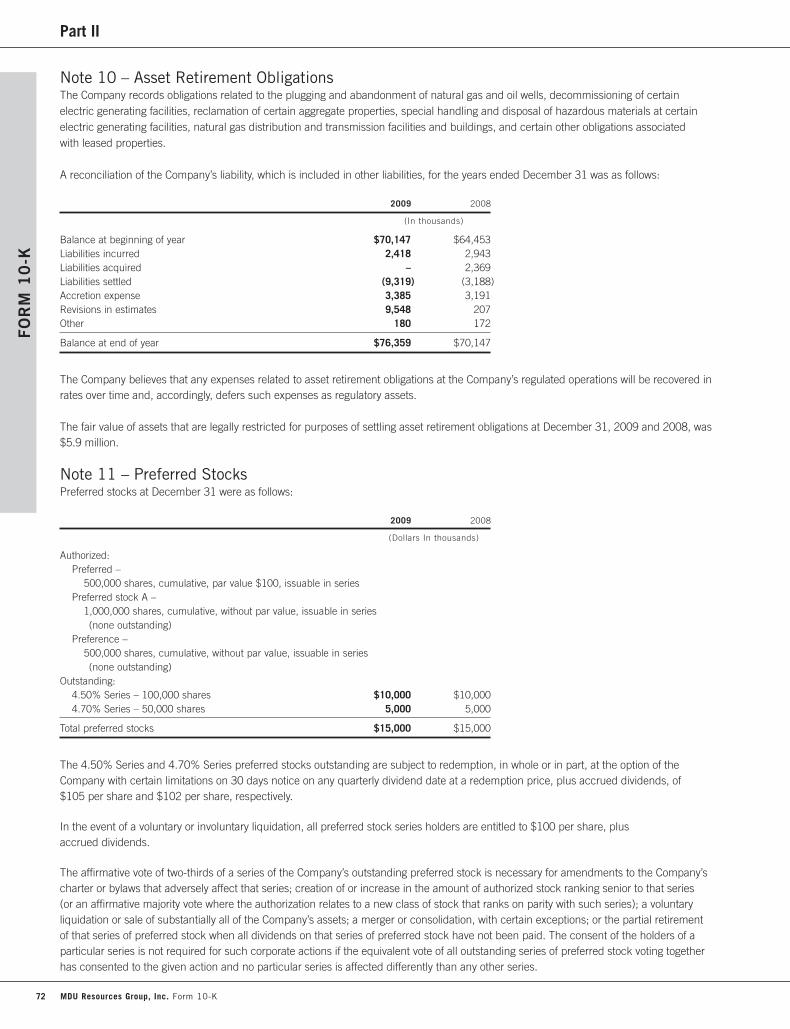
Part II
Note 10 – Asset Retirement ObligationsThe Company records obligations related to the plugging and abandonment of natural gas and oil wells, decommissioning of certainelectric generating facilities, reclamation of certain aggregate properties, special handling and disposal of hazardous materials at certainelectric generating facilities, natural gas distribution and transmission facilities and buildings, and certain other obligations associatedwith leased properties.
A reconciliation of the Company’s liability, which is included in other liabilities, for the years ended December 31 was as follows:
2009 2008
(In thousands)
Balance at beginning of year $70,147 $64,453Liabilities incurred 2,418 2,943Liabilities acquired – 2,369Liabilities settled (9,319) (3,188)Accretion expense 3,385 3,191Revisions in estimates 9,548 207Other 180 172
Balance at end of year $76,359 $70,147
The Company believes that any expenses related to asset retirement obligations at the Company’s regulated operations will be recovered inrates over time and, accordingly, defers such expenses as regulatory assets.
The fair value of assets that are legally restricted for purposes of settling asset retirement obligations at December 31, 2009 and 2008, was$5.9 million.
Note 11 – Preferred StocksPreferred stocks at December 31 were as follows:
2009 2008
(Dollars In thousands)
Authorized:Preferred –
500,000 shares, cumulative, par value $100, issuable in seriesPreferred stock A –
1,000,000 shares, cumulative, without par value, issuable in series(none outstanding)
Preference –500,000 shares, cumulative, without par value, issuable in series (none outstanding)
Outstanding:4.50% Series – 100,000 shares $10,000 $10,0004.70% Series – 50,000 shares 5,000 5,000
Total preferred stocks $15,000 $15,000
The 4.50% Series and 4.70% Series preferred stocks outstanding are subject to redemption, in whole or in part, at the option of theCompany with certain limitations on 30 days notice on any quarterly dividend date at a redemption price, plus accrued dividends, of$105 per share and $102 per share, respectively.
In the event of a voluntary or involuntary liquidation, all preferred stock series holders are entitled to $100 per share, plusaccrued dividends.
The affirmative vote of two-thirds of a series of the Company’s outstanding preferred stock is necessary for amendments to the Company’scharter or bylaws that adversely affect that series; creation of or increase in the amount of authorized stock ranking senior to that series(or an affirmative majority vote where the authorization relates to a new class of stock that ranks on parity with such series); a voluntaryliquidation or sale of substantially all of the Company’s assets; a merger or consolidation, with certain exceptions; or the partial retirementof that series of preferred stock when all dividends on that series of preferred stock have not been paid. The consent of the holders of aparticular series is not required for such corporate actions if the equivalent vote of all outstanding series of preferred stock voting togetherhas consented to the given action and no particular series is affected differently than any other series.
FO
RM
10
-K
72 MDU Resources Group, Inc. Form 10-K

Part IIFO
RM
10
-K
Subject to the foregoing, the holders of common stock exclusively possess all voting power. However, if cumulative dividends on preferredstock are in arrears, in whole or in part, for one year, the holders of preferred stock would obtain the right to one vote per share until alldividends in arrears have been paid and current dividends have been declared and set aside.
Note 12 – Common StockThe Stock Purchase Plan provides interested investors the opportunity to make optional cash investments and to reinvest all ora percentage of their cash dividends in shares of the Company’s common stock. The K-Plan is partially funded with the Company’scommon stock. From January 2007 through March 2007 and October 1, 2008 through October 21, 2008, the Stock Purchase Plan andK-Plan, with respect to Company stock, were funded with shares of authorized but unissued common stock. From April 2007 throughSeptember 30, 2008, and October 22, 2008 through December 2009, purchases of shares of common stock on the open market wereused to fund the Stock Purchase Plan and K-Plan. At December 31, 2009, there were 23.2 million shares of common stock reserved fororiginal issuance under the Stock Purchase Plan and K-Plan.
The Company depends on earnings from its divisions and dividends from its subsidiaries to pay dividends on common stock. Thedeclaration and payment of dividends is at the sole discretion of the board of directors, subject to limitations imposed by state laws,applicable regulatory limitations, and compliance with the requirements of the Company’s credit agreements. These requirements are notexpected to affect the Company’s ability to pay dividends in the near term.
Note 13 – Stock-Based CompensationThe Company has several stock-based compensation plans and is authorized to grant options, restricted stock and stock for up to16.9 million shares of common stock and has granted options, restricted stock and stock of 7.3 million shares through December 31,2009. The Company generally issues new shares of common stock to satisfy stock option exercises, restricted stock, stock andperformance share awards.
Total stock-based compensation expense was $3.4 million, net of income taxes of $2.2 million in 2009; $3.7 million, net of income taxes of$2.3 million in 2008; and $4.7 million, net of income taxes of $3.1 million in 2007.
As of December 31, 2009, total remaining unrecognized compensation expense related to stock-based compensation was approximately$5.6 million (before income taxes) which will be amortized over a weighted average period of 1.5 years.
Stock optionsThe Company has stock option plans for directors, key employees and employees. The Company has not granted stock options since2003. Options granted to key employees automatically vest after nine years, but the plan provides for accelerated vesting based on theattainment of certain performance goals or upon a change in control of the Company, and expire 10 years after the date of grant. Optionsgranted to directors and employees vest at the date of grant and three years after the date of grant, respectively, and expire 10 years afterthe date of grant.
The fair value of each option outstanding was estimated on the date of grant using the Black-Scholes option-pricing model.
A summary of the status of the stock option plans at December 31, 2009, and changes during the year then ended was as follows:
WeightedAverage
Number Exerciseof Shares Price
Balance at beginning of year 1,003,824 $13.39Forfeited (24,188) 13.22Exercised (154,765) 13.23Balance at end of year 824,871 13.42
Exercisable at end of year 799,703 $13.41
MDU Resources Group, Inc. Form 10-K 73

Part II
Summarized information about stock options outstanding and exercisable as of December 31, 2009, was as follows:
Options Outstanding Options Exercisable
Remaining Weighted Aggregate Weighted AggregateContractual Average Intrinsic Average Intrinsic
Range of Number Life Exercise Value Number Exercise ValueExercisable Prices Outstanding in Years Price (000’s) Exercisable Price (000’s)
$ 9.61 – 12.00 12,131 .5 $ 9.93 $ 166 12,131 $ 9.93 $ 16612.01 – 14.50 745,970 1.2 13.21 7,751 726,235 13.21 7,54514.51 – 17.13 66,770 1.2 16.48 475 61,337 16.51 435
Balance at end of year 824,871 1.2 $13.42 $8,392 799,703 $13.41 $8,146
The aggregate intrinsic value in the preceding table represents the total intrinsic value (before income taxes), based on the Company’sstock price on December 31, 2009, which would have been received by the option holders had all option holders exercised their optionsas of that date.
The weighted average remaining contractual life of options exercisable was 1.2 years at December 31, 2009.
The Company received cash of $2.1 million, $5.9 million and $10.2 million from the exercise of stock options for the years endedDecember 31, 2009, 2008 and 2007, respectively. The aggregate intrinsic value of options exercised during the years endedDecember 31, 2009, 2008 and 2007, was $1.3 million, $8.1 million and $11.2 million, respectively.
Restricted stock awardsPrior to 2002, the Company granted restricted stock awards under a long-term incentive plan. The restricted stock awards granted vest atvarious times ranging from one year to nine years from the date of issuance, but certain grants may vest early based upon the attainmentof certain performance goals or upon a change in control of the Company. The grant-date fair value is the market price of the Company’sstock on the grant date.
A summary of the status of the restricted stock awards for the year ended December 31, 2009, was as follows:
WeightedAverage
Number Grant-Dateof Shares Fair Value
Nonvested at beginning of period 20,606 $13.22Vested – –Forfeited (2,970) 13.22Nonvested at end of period 17,636 $13.22
Stock awardsNonemployee directors may receive shares of common stock instead of cash in payment for directors’ fees under the nonemployeedirector stock compensation plan. There were 49,649 shares with a fair value of $879,000, 45,675 shares with a fair value of$1.2 million and 48,228 shares with a fair value of $1.5 million issued under this plan during the years ended December 31, 2009,2008 and 2007, respectively.
Performance share awardsSince 2003, key employees of the Company have been awarded performance share awards each year. Entitlement to performance sharesis based on the Company’s total shareholder return over designated performance periods as measured against a selected peer group.
Target grants of performance shares outstanding at December 31, 2009, were as follows:
Performance Target GrantGrant Date Period of Shares
February 2007 2007-2009 175,596February 2008 2008-2010 183,102February 2009 2009-2011 275,807
FO
RM
10
-K
74 MDU Resources Group, Inc. Form 10-K
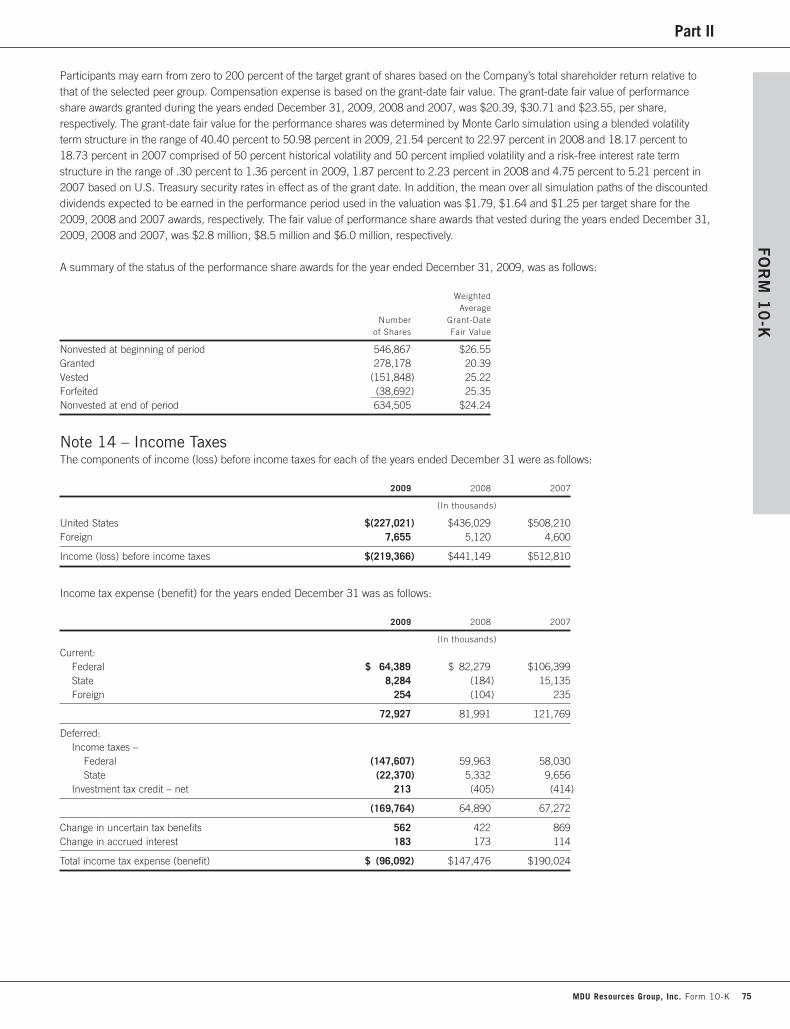
Part IIFO
RM
10
-K
Participants may earn from zero to 200 percent of the target grant of shares based on the Company’s total shareholder return relative tothat of the selected peer group. Compensation expense is based on the grant-date fair value. The grant-date fair value of performanceshare awards granted during the years ended December 31, 2009, 2008 and 2007, was $20.39, $30.71 and $23.55, per share,respectively. The grant-date fair value for the performance shares was determined by Monte Carlo simulation using a blended volatilityterm structure in the range of 40.40 percent to 50.98 percent in 2009, 21.54 percent to 22.97 percent in 2008 and 18.17 percent to18.73 percent in 2007 comprised of 50 percent historical volatility and 50 percent implied volatility and a risk-free interest rate termstructure in the range of .30 percent to 1.36 percent in 2009, 1.87 percent to 2.23 percent in 2008 and 4.75 percent to 5.21 percent in2007 based on U.S. Treasury security rates in effect as of the grant date. In addition, the mean over all simulation paths of the discounteddividends expected to be earned in the performance period used in the valuation was $1.79, $1.64 and $1.25 per target share for the2009, 2008 and 2007 awards, respectively. The fair value of performance share awards that vested during the years ended December 31,2009, 2008 and 2007, was $2.8 million, $8.5 million and $6.0 million, respectively.
A summary of the status of the performance share awards for the year ended December 31, 2009, was as follows:
WeightedAverage
Number Grant-Dateof Shares Fair Value
Nonvested at beginning of period 546,867 $26.55Granted 278,178 20.39Vested (151,848) 25.22Forfeited (38,692) 25.35Nonvested at end of period 634,505 $24.24
Note 14 – Income TaxesThe components of income (loss) before income taxes for each of the years ended December 31 were as follows:
2009 2008 2007
(In thousands)
United States $(227,021) $436,029 $508,210Foreign 7,655 5,120 4,600
Income (loss) before income taxes $(219,366) $441,149 $512,810
Income tax expense (benefit) for the years ended December 31 was as follows:
2009 2008 2007
(In thousands)
Current: Federal $ 64,389 $ 82,279 $106,399State 8,284 (184) 15,135Foreign 254 (104) 235
72,927 81,991 121,769
Deferred: Income taxes –
Federal (147,607) 59,963 58,030State (22,370) 5,332 9,656
Investment tax credit – net 213 (405) (414)
(169,764) 64,890 67,272
Change in uncertain tax benefits 562 422 869Change in accrued interest 183 173 114
Total income tax expense (benefit) $ (96,092) $147,476 $190,024
MDU Resources Group, Inc. Form 10-K 75

Part II
Components of deferred tax assets and deferred tax liabilities recognized at December 31 were as follows:
2009 2008
(In thousands)
Deferred tax assets:Regulatory matters $ 85,712 $ 46,855Accrued pension costs 79,052 93,371Asset retirement obligations 24,091 22,707Deferred compensation 11,411 12,015Other 59,763 62,456
Total deferred tax assets 260,029 237,404
Deferred tax liabilities:Depreciation and basis differences on property,plant and equipment 601,426 562,326
Basis differences on natural gas and oil producingproperties 116,521 284,231
Regulatory matters 53,835 65,909Natural gas and oil price swap and collar agreements – 30,414Other 51,070 42,725
Total deferred tax liabilities 822,852 985,605
Net deferred income tax liability $(562,823) $(748,201)
As of December 31, 2009 and 2008, no valuation allowance has been recorded associated with the above deferred tax assets.
The following table reconciles the change in the net deferred income tax liability from December 31, 2008, to December 31, 2009, todeferred income tax benefit:
2009
(In thousands)
Change in net deferred income tax liability from the preceding table $(185,378)Deferred taxes associated with other comprehensive loss 18,574Deferred taxes associated with acquisitions 762Other (3,722)
Deferred income tax benefit for the period $(169,764)
Total income tax expense (benefit) differs from the amount computed by applying the statutory federal income tax rate to income (loss)before taxes. The reasons for this difference were as follows:
Years ended December 31, 2009 2008 2007
Amount % Amount % Amount %
(Dollars in thousands)
Computed tax at federal statutory rate $(76,778) 35.0 $154,402 35.0 $179,484 35.0Increases (reductions) resulting from:
State income taxes, net of federal income tax benefit (expense) (7,280) 3.3 10,709 2.4 17,121 3.3
Deductible K-Plan dividends (2,369) 1.1 (2,144) (.5) (2,134) (.4)Depletion allowance (2,320) 1.0 (2,932) (.7) (4,073) (.8)Federal renewable energycredit (1,452) .7 (1,235) (.3) – –
Foreign operations (1,148) .5 423 .1 9,603 1.8Domestic production activities deduction (856) .4 (3,031) (.7) (4,787) (.9)
Resolution of tax matters and uncertain tax positions 881 (.4) 595 .1 208 –
Other (4,770) 2.2 (9,311) (2.0) (5,398) (.9)
Total income tax expense (benefit) $(96,092) 43.8 $147,476 33.4 $190,024 37.1
The income tax benefit in 2009 resulted largely from the Company’s write-down of natural gas and oil properties, as discussed in Note 1.
FO
RM
10
-K
76 MDU Resources Group, Inc. Form 10-K

Part IIFO
RM
10
-K
Prior to the sale of the domestic independent power production assets on July 10, 2007, as discussed in Note 3, the Company consideredearnings (including the gain from the sale of its foreign equity method investment in a natural gas-fired electric generating facility in Brazilin 2005) to be reinvested indefinitely outside of the United States and, accordingly, no U.S. deferred income taxes were recorded withrespect to such earnings. Following the sale of these assets, the Company reconsidered its long-term plans for future development andexpansion of its foreign investment and has determined that it has no immediate plans to explore or invest in additional foreign investmentsat this time. Therefore in the third quarter of 2007, deferred income taxes were accrued with respect to the temporary differences whichhad not been previously recorded. The amount of cumulative undistributed earnings for which there are temporary differences isapproximately $36.8 million at December 31, 2009. The amount of deferred tax liability, net of allowable foreign tax credits, associatedwith the undistributed earnings at December 31, 2009, was approximately $10.5 million, which was largely recognized in 2007. Futureearnings will also be subject to additional U.S. taxes, net of allowable foreign tax credits.
The Company and its subsidiaries file income tax returns in the U.S. federal jurisdiction, and various state, local and foreign jurisdictions.With few exceptions, the Company is no longer subject to U.S. federal, state and local, or non-U.S. income tax examinations by taxauthorities for years ending prior to 2004.
On January 1, 2007, upon the adoption of accounting guidance related to uncertain tax positions, the Company recognized a decrease inthe liability for unrecognized tax benefits, which was not material and was accounted for as an increase to the January 1, 2007, balance ofretained earnings. At the date of adoption, the amount of unrecognized tax benefits was $4.5 million, including interest.
A reconciliation of the unrecognized tax benefits (excluding interest) for the years ended December 31, was as follows:
2009 2008 2007
(In thousands)
Balance at beginning of year $5,586 $ 3,735 $ 4,241Additions based on tax positions related to the current year – 1,102 373Additions for tax positions of prior years 562 1,811 588Reductions for tax positions of prior years – (1,062) –Lapse of statute of limitations – – (1,467)
Balance at end of year $6,148 $ 5,586 $ 3,735
Included in the balance of unrecognized tax benefits at December 31, 2009, were $540,000 of tax positions for which the ultimatedeductibility is highly certain but for which there is uncertainty about the timing of such deductibility. Because of the impact of deferred taxaccounting, other than interest and penalties, the disallowance of the shorter deductibility period would not affect the annual effective taxrate but would accelerate the payment of cash to the taxing authority to an earlier period. The amount of unrecognized tax benefits that, ifrecognized, would affect the effective tax rate at December 31, 2009, was $6.4 million, including approximately $804,000 for the paymentof interest and penalties.
The Company does not anticipate the amount of unrecognized tax benefits to significantly increase or decrease within the next 12 months.
For the years ended December 31, 2009, 2008 and 2007, the Company recognized approximately $190,000, $819,000 and $680,000,respectively, in interest expense. Penalties were not material in 2009, 2008 and 2007. The Company recognized interest income ofapproximately $165,000, $223,000 and $480,000 for the years ended December 31, 2009, 2008 and 2007, respectively. The Companyhad accrued liabilities of approximately $1.6 million, $1.4 million and $718,000 at December 31, 2009, 2008 and 2007, respectively, forthe payment of interest.
Note 15 – Business Segment DataThe Company’s reportable segments are those that are based on the Company’s method of internal reporting, which generally segregatesthe strategic business units due to differences in products, services and regulation. The vast majority of the Company’s operations arelocated within the United States. The Company also has investments in foreign countries, which largely consist of Centennial Resources’equity method investment in the Brazilian Transmission Lines.
The electric segment generates, transmits and distributes electricity in Montana, North Dakota, South Dakota and Wyoming. The naturalgas distribution segment distributes natural gas in those states as well as in Idaho, Minnesota, Oregon and Washington. These operationsalso supply related value-added products and services.
MDU Resources Group, Inc. Form 10-K 77
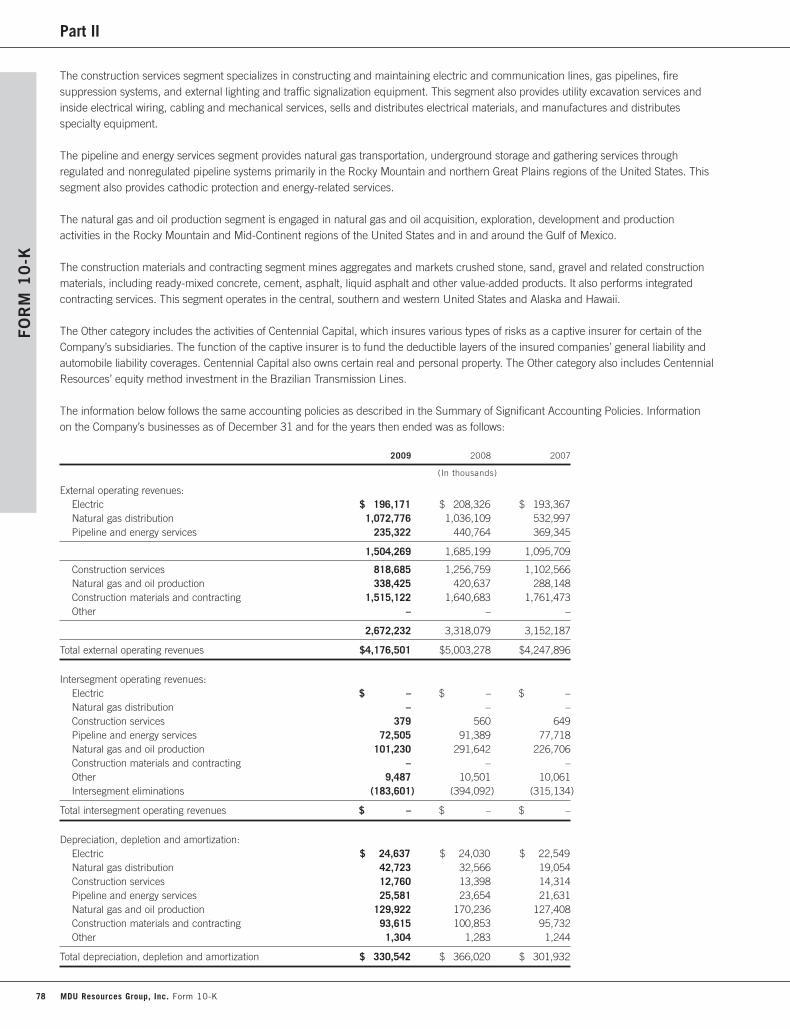
Part II
The construction services segment specializes in constructing and maintaining electric and communication lines, gas pipelines, firesuppression systems, and external lighting and traffic signalization equipment. This segment also provides utility excavation services andinside electrical wiring, cabling and mechanical services, sells and distributes electrical materials, and manufactures and distributesspecialty equipment.
The pipeline and energy services segment provides natural gas transportation, underground storage and gathering services throughregulated and nonregulated pipeline systems primarily in the Rocky Mountain and northern Great Plains regions of the United States. Thissegment also provides cathodic protection and energy-related services.
The natural gas and oil production segment is engaged in natural gas and oil acquisition, exploration, development and productionactivities in the Rocky Mountain and Mid-Continent regions of the United States and in and around the Gulf of Mexico.
The construction materials and contracting segment mines aggregates and markets crushed stone, sand, gravel and related constructionmaterials, including ready-mixed concrete, cement, asphalt, liquid asphalt and other value-added products. It also performs integratedcontracting services. This segment operates in the central, southern and western United States and Alaska and Hawaii.
The Other category includes the activities of Centennial Capital, which insures various types of risks as a captive insurer for certain of theCompany’s subsidiaries. The function of the captive insurer is to fund the deductible layers of the insured companies’ general liability andautomobile liability coverages. Centennial Capital also owns certain real and personal property. The Other category also includes CentennialResources’ equity method investment in the Brazilian Transmission Lines.
The information below follows the same accounting policies as described in the Summary of Significant Accounting Policies. Informationon the Company’s businesses as of December 31 and for the years then ended was as follows:
2009 2008 2007
(In thousands)
External operating revenues: Electric $ 196,171 $ 208,326 $ 193,367Natural gas distribution 1,072,776 1,036,109 532,997Pipeline and energy services 235,322 440,764 369,345
1,504,269 1,685,199 1,095,709
Construction services 818,685 1,256,759 1,102,566Natural gas and oil production 338,425 420,637 288,148Construction materials and contracting 1,515,122 1,640,683 1,761,473Other – – –
2,672,232 3,318,079 3,152,187
Total external operating revenues $4,176,501 $5,003,278 $4,247,896
Intersegment operating revenues:Electric $ – $ – $ –Natural gas distribution – – –Construction services 379 560 649Pipeline and energy services 72,505 91,389 77,718Natural gas and oil production 101,230 291,642 226,706Construction materials and contracting – – –Other 9,487 10,501 10,061Intersegment eliminations (183,601) (394,092) (315,134)
Total intersegment operating revenues $ – $ – $ –
Depreciation, depletion and amortization:Electric $ 24,637 $ 24,030 $ 22,549Natural gas distribution 42,723 32,566 19,054Construction services 12,760 13,398 14,314Pipeline and energy services 25,581 23,654 21,631Natural gas and oil production 129,922 170,236 127,408Construction materials and contracting 93,615 100,853 95,732Other 1,304 1,283 1,244
Total depreciation, depletion and amortization $ 330,542 $ 366,020 $ 301,932
FO
RM
10
-K
78 MDU Resources Group, Inc. Form 10-K
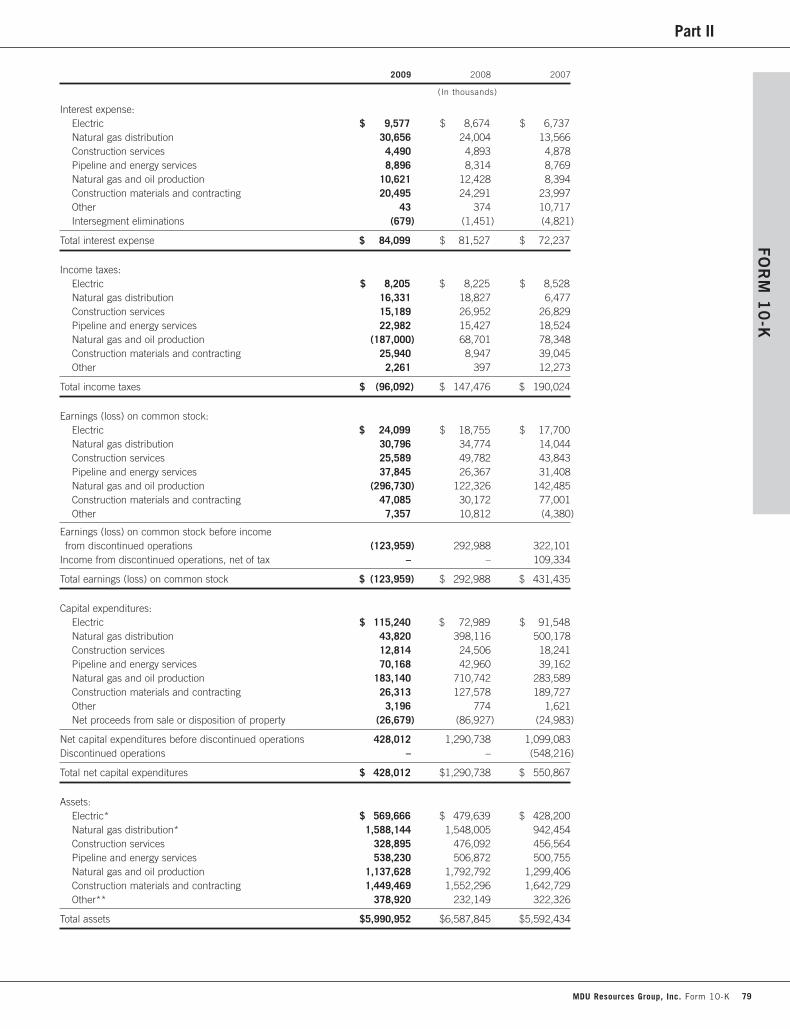
Part IIFO
RM
10
-K
2009 2008 2007
(In thousands)
Interest expense:Electric $ 9,577 $ 8,674 $ 6,737Natural gas distribution 30,656 24,004 13,566Construction services 4,490 4,893 4,878Pipeline and energy services 8,896 8,314 8,769Natural gas and oil production 10,621 12,428 8,394Construction materials and contracting 20,495 24,291 23,997Other 43 374 10,717Intersegment eliminations (679) (1,451) (4,821)
Total interest expense $ 84,099 $ 81,527 $ 72,237
Income taxes:Electric $ 8,205 $ 8,225 $ 8,528Natural gas distribution 16,331 18,827 6,477Construction services 15,189 26,952 26,829Pipeline and energy services 22,982 15,427 18,524Natural gas and oil production (187,000) 68,701 78,348Construction materials and contracting 25,940 8,947 39,045Other 2,261 397 12,273
Total income taxes $ (96,092) $ 147,476 $ 190,024
Earnings (loss) on common stock:Electric $ 24,099 $ 18,755 $ 17,700Natural gas distribution 30,796 34,774 14,044Construction services 25,589 49,782 43,843Pipeline and energy services 37,845 26,367 31,408Natural gas and oil production (296,730) 122,326 142,485Construction materials and contracting 47,085 30,172 77,001Other 7,357 10,812 (4,380)
Earnings (loss) on common stock before income from discontinued operations (123,959) 292,988 322,101
Income from discontinued operations, net of tax – – 109,334
Total earnings (loss) on common stock $ (123,959) $ 292,988 $ 431,435
Capital expenditures:Electric $ 115,240 $ 72,989 $ 91,548Natural gas distribution 43,820 398,116 500,178Construction services 12,814 24,506 18,241Pipeline and energy services 70,168 42,960 39,162Natural gas and oil production 183,140 710,742 283,589Construction materials and contracting 26,313 127,578 189,727Other 3,196 774 1,621Net proceeds from sale or disposition of property (26,679) (86,927) (24,983)
Net capital expenditures before discontinued operations 428,012 1,290,738 1,099,083Discontinued operations – – (548,216)
Total net capital expenditures $ 428,012 $1,290,738 $ 550,867
Assets: Electric* $ 569,666 $ 479,639 $ 428,200Natural gas distribution* 1,588,144 1,548,005 942,454Construction services 328,895 476,092 456,564Pipeline and energy services 538,230 506,872 500,755Natural gas and oil production 1,137,628 1,792,792 1,299,406Construction materials and contracting 1,449,469 1,552,296 1,642,729Other** 378,920 232,149 322,326
Total assets $5,990,952 $6,587,845 $5,592,434
MDU Resources Group, Inc. Form 10-K 79
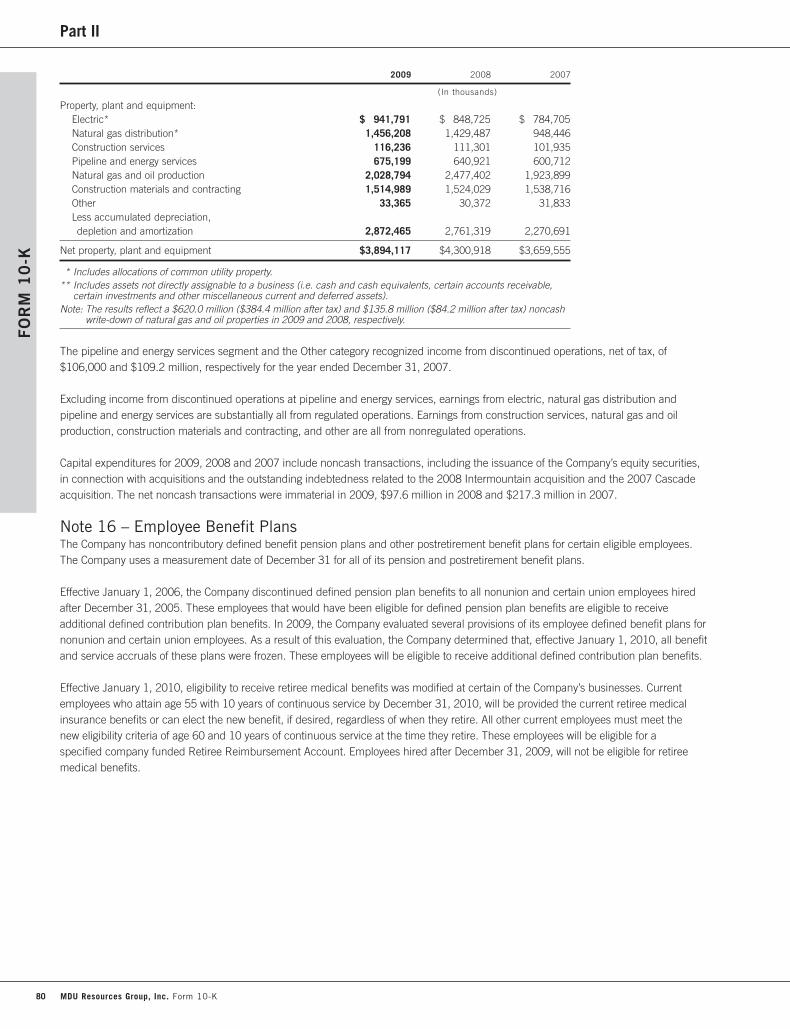
Part II
2009 2008 2007
(In thousands)
Property, plant and equipment:Electric* $ 941,791 $ 848,725 $ 784,705Natural gas distribution* 1,456,208 1,429,487 948,446Construction services 116,236 111,301 101,935Pipeline and energy services 675,199 640,921 600,712Natural gas and oil production 2,028,794 2,477,402 1,923,899Construction materials and contracting 1,514,989 1,524,029 1,538,716Other 33,365 30,372 31,833Less accumulated depreciation, depletion and amortization 2,872,465 2,761,319 2,270,691
Net property, plant and equipment $3,894,117 $4,300,918 $3,659,555
* Includes allocations of common utility property.** Includes assets not directly assignable to a business (i.e. cash and cash equivalents, certain accounts receivable,
certain investments and other miscellaneous current and deferred assets).Note: The results reflect a $620.0 million ($384.4 million after tax) and $135.8 million ($84.2 million after tax) noncash
write-down of natural gas and oil properties in 2009 and 2008, respectively.
The pipeline and energy services segment and the Other category recognized income from discontinued operations, net of tax, of$106,000 and $109.2 million, respectively for the year ended December 31, 2007.
Excluding income from discontinued operations at pipeline and energy services, earnings from electric, natural gas distribution andpipeline and energy services are substantially all from regulated operations. Earnings from construction services, natural gas and oilproduction, construction materials and contracting, and other are all from nonregulated operations.
Capital expenditures for 2009, 2008 and 2007 include noncash transactions, including the issuance of the Company’s equity securities,in connection with acquisitions and the outstanding indebtedness related to the 2008 Intermountain acquisition and the 2007 Cascadeacquisition. The net noncash transactions were immaterial in 2009, $97.6 million in 2008 and $217.3 million in 2007.
Note 16 – Employee Benefit PlansThe Company has noncontributory defined benefit pension plans and other postretirement benefit plans for certain eligible employees.The Company uses a measurement date of December 31 for all of its pension and postretirement benefit plans.
Effective January 1, 2006, the Company discontinued defined pension plan benefits to all nonunion and certain union employees hiredafter December 31, 2005. These employees that would have been eligible for defined pension plan benefits are eligible to receiveadditional defined contribution plan benefits. In 2009, the Company evaluated several provisions of its employee defined benefit plans fornonunion and certain union employees. As a result of this evaluation, the Company determined that, effective January 1, 2010, all benefitand service accruals of these plans were frozen. These employees will be eligible to receive additional defined contribution plan benefits.
Effective January 1, 2010, eligibility to receive retiree medical benefits was modified at certain of the Company’s businesses. Currentemployees who attain age 55 with 10 years of continuous service by December 31, 2010, will be provided the current retiree medicalinsurance benefits or can elect the new benefit, if desired, regardless of when they retire. All other current employees must meet thenew eligibility criteria of age 60 and 10 years of continuous service at the time they retire. These employees will be eligible for aspecified company funded Retiree Reimbursement Account. Employees hired after December 31, 2009, will not be eligible for retireemedical benefits.
FO
RM
10
-K
80 MDU Resources Group, Inc. Form 10-K
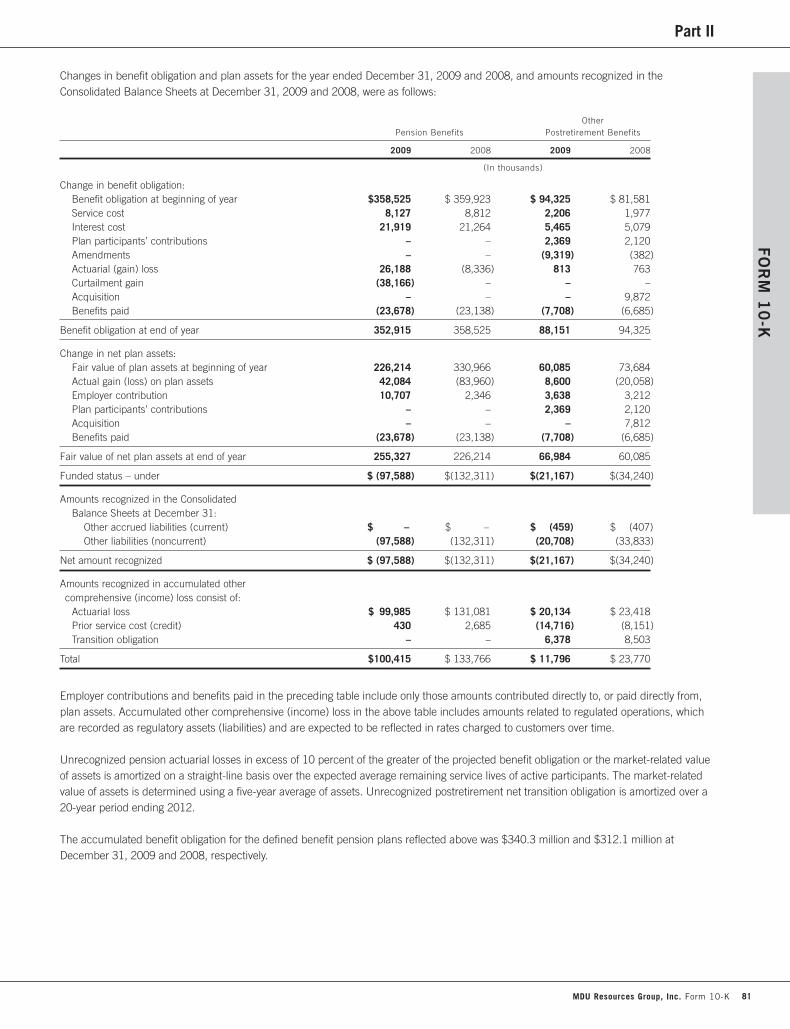
Part IIFO
RM
10
-K
Changes in benefit obligation and plan assets for the year ended December 31, 2009 and 2008, and amounts recognized in theConsolidated Balance Sheets at December 31, 2009 and 2008, were as follows:
Other Pension Benefits Postretirement Benefits
2009 2008 2009 2008
(In thousands)
Change in benefit obligation:Benefit obligation at beginning of year $358,525 $ 359,923 $ 94,325 $ 81,581Service cost 8,127 8,812 2,206 1,977Interest cost 21,919 21,264 5,465 5,079Plan participants’ contributions – – 2,369 2,120Amendments – – (9,319) (382)Actuarial (gain) loss 26,188 (8,336) 813 763Curtailment gain (38,166) – – –Acquisition – – – 9,872Benefits paid (23,678) (23,138) (7,708) (6,685)
Benefit obligation at end of year 352,915 358,525 88,151 94,325
Change in net plan assets:Fair value of plan assets at beginning of year 226,214 330,966 60,085 73,684Actual gain (loss) on plan assets 42,084 (83,960) 8,600 (20,058)Employer contribution 10,707 2,346 3,638 3,212Plan participants’ contributions – – 2,369 2,120Acquisition – – – 7,812Benefits paid (23,678) (23,138) (7,708) (6,685)
Fair value of net plan assets at end of year 255,327 226,214 66,984 60,085
Funded status – under $ (97,588) $(132,311) $(21,167) $(34,240)
Amounts recognized in the Consolidated Balance Sheets at December 31:
Other accrued liabilities (current) $ – $ – $ (459) $ (407)Other liabilities (noncurrent) (97,588) (132,311) (20,708) (33,833)
Net amount recognized $ (97,588) $(132,311) $(21,167) $(34,240)
Amounts recognized in accumulated other comprehensive (income) loss consist of:
Actuarial loss $ 99,985 $ 131,081 $ 20,134 $ 23,418Prior service cost (credit) 430 2,685 (14,716) (8,151)Transition obligation – – 6,378 8,503
Total $100,415 $ 133,766 $ 11,796 $ 23,770
Employer contributions and benefits paid in the preceding table include only those amounts contributed directly to, or paid directly from,plan assets. Accumulated other comprehensive (income) loss in the above table includes amounts related to regulated operations, whichare recorded as regulatory assets (liabilities) and are expected to be reflected in rates charged to customers over time.
Unrecognized pension actuarial losses in excess of 10 percent of the greater of the projected benefit obligation or the market-related valueof assets is amortized on a straight-line basis over the expected average remaining service lives of active participants. The market-relatedvalue of assets is determined using a five-year average of assets. Unrecognized postretirement net transition obligation is amortized over a20-year period ending 2012.
The accumulated benefit obligation for the defined benefit pension plans reflected above was $340.3 million and $312.1 million atDecember 31, 2009 and 2008, respectively.
MDU Resources Group, Inc. Form 10-K 81
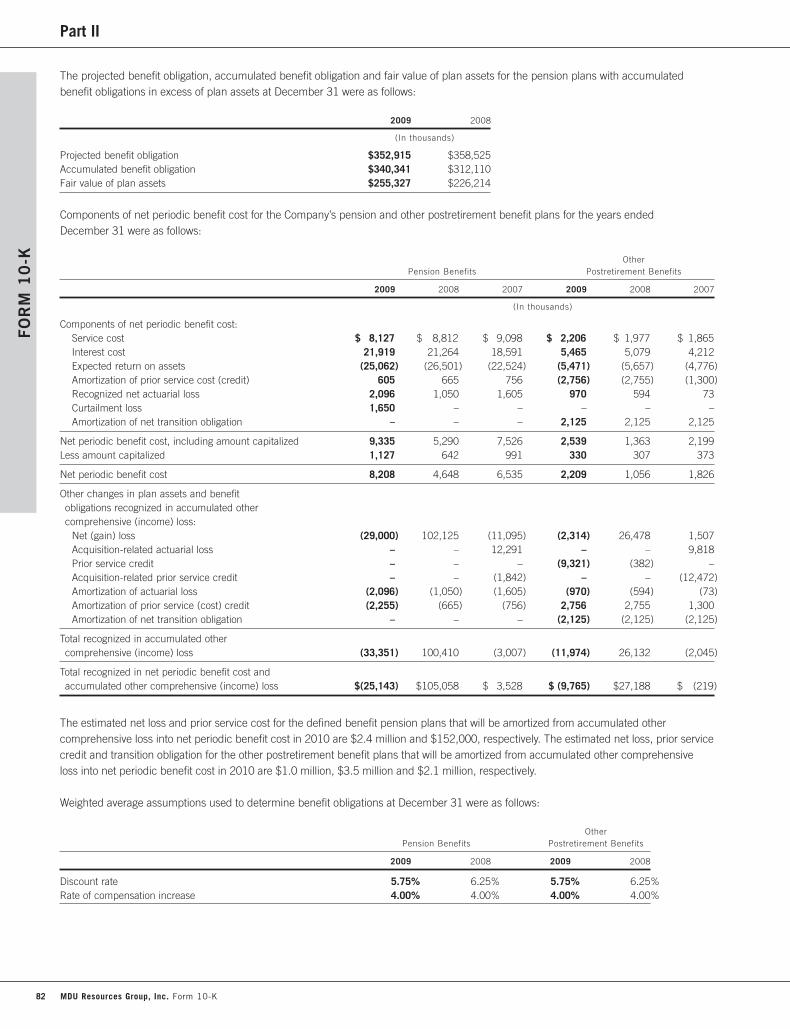
Part II
The projected benefit obligation, accumulated benefit obligation and fair value of plan assets for the pension plans with accumulatedbenefit obligations in excess of plan assets at December 31 were as follows:
2009 2008
(In thousands)
Projected benefit obligation $352,915 $358,525Accumulated benefit obligation $340,341 $312,110Fair value of plan assets $255,327 $226,214
Components of net periodic benefit cost for the Company’s pension and other postretirement benefit plans for the years endedDecember 31 were as follows:
Other Pension Benefits Postretirement Benefits
2009 2008 2007 2009 2008 2007
(In thousands)
Components of net periodic benefit cost:Service cost $ 8,127 $ 8,812 $ 9,098 $ 2,206 $ 1,977 $ 1,865Interest cost 21,919 21,264 18,591 5,465 5,079 4,212Expected return on assets (25,062) (26,501) (22,524) (5,471) (5,657) (4,776)Amortization of prior service cost (credit) 605 665 756 (2,756) (2,755) (1,300)Recognized net actuarial loss 2,096 1,050 1,605 970 594 73Curtailment loss 1,650 – – – – –Amortization of net transition obligation – – – 2,125 2,125 2,125
Net periodic benefit cost, including amount capitalized 9,335 5,290 7,526 2,539 1,363 2,199Less amount capitalized 1,127 642 991 330 307 373
Net periodic benefit cost 8,208 4,648 6,535 2,209 1,056 1,826
Other changes in plan assets and benefit obligations recognized in accumulated other comprehensive (income) loss:
Net (gain) loss (29,000) 102,125 (11,095) (2,314) 26,478 1,507Acquisition-related actuarial loss – – 12,291 – – 9,818Prior service credit – – – (9,321) (382) –Acquisition-related prior service credit – – (1,842) – – (12,472)Amortization of actuarial loss (2,096) (1,050) (1,605) (970) (594) (73)Amortization of prior service (cost) credit (2,255) (665) (756) 2,756 2,755 1,300Amortization of net transition obligation – – – (2,125) (2,125) (2,125)
Total recognized in accumulated other comprehensive (income) loss (33,351) 100,410 (3,007) (11,974) 26,132 (2,045)
Total recognized in net periodic benefit cost and accumulated other comprehensive (income) loss $(25,143) $105,058 $ 3,528 $ (9,765) $27,188 $ (219)
The estimated net loss and prior service cost for the defined benefit pension plans that will be amortized from accumulated othercomprehensive loss into net periodic benefit cost in 2010 are $2.4 million and $152,000, respectively. The estimated net loss, prior servicecredit and transition obligation for the other postretirement benefit plans that will be amortized from accumulated other comprehensiveloss into net periodic benefit cost in 2010 are $1.0 million, $3.5 million and $2.1 million, respectively.
Weighted average assumptions used to determine benefit obligations at December 31 were as follows:
OtherPension Benefits Postretirement Benefits
2009 2008 2009 2008
Discount rate 5.75% 6.25% 5.75% 6.25%Rate of compensation increase 4.00% 4.00% 4.00% 4.00%
FO
RM
10
-K
82 MDU Resources Group, Inc. Form 10-K

Part IIFO
RM
10
-K
Weighted average assumptions used to determine net periodic benefit cost for the years ended December 31 were as follows:
OtherPension Benefits Postretirement Benefits
2009 2008 2009 2008
Discount rate 6.25% 6.00% 6.25% 6.00%Expected return on plan assets 8.50% 8.50% 7.50% 7.50%Rate of compensation increase 4.00% 4.20% 4.00% 4.50%
The expected rate of return on plan assets is based on the targeted asset allocation of 70 percent equity securities and 30 percent fixed-income securities and the expected rate of return from these asset categories. The expected return on plan assets for otherpostretirement benefits reflects insurance-related investment costs.
Health care rate assumptions for the Company’s other postretirement benefit plans as of December 31 were as follows:
2009 2008
Health care trend rate assumed for next year 6.0%-9.0% 6.0%-9.0%Health care cost trend rate – ultimate 5.0%-6.0% 5.0%-6.0%Year in which ultimate trend rate achieved 1999-2017 1999-2017
The Company’s other postretirement benefit plans include health care and life insurance benefits for certain employees. The plansunderlying these benefits may require contributions by the employee depending on such employee’s age and years of service at retirementor the date of retirement. The accounting for the health care plans anticipates future cost-sharing changes that are consistent with theCompany’s expressed intent to generally increase retiree contributions each year by the excess of the expected health care cost trend rateover 6 percent.
Assumed health care cost trend rates may have a significant effect on the amounts reported for the health care plans. A one percentagepoint change in the assumed health care cost trend rates would have had the following effects at December 31, 2009:
1 Percentage 1 PercentagePoint Increase Point Decrease
(In thousands)
Effect on total of service and interest cost components $ 91 $ (922)Effect on postretirement benefit obligation $2,435 $(9,679)
The Company’s pension assets are managed by 12 outside investment managers. The Company’s other postretirement assets aremanaged by one outside investment manager. The Company’s investment policy with respect to pension and other postretirement assetsis to make investments solely in the interest of the participants and beneficiaries of the plans and for the exclusive purpose of providingbenefits accrued and defraying the reasonable expenses of administration. The Company strives to maintain investment diversification toassist in minimizing the risk of large losses. The Company’s policy guidelines allow for investment of funds in cash equivalents, fixed-income securities and equity securities. The guidelines prohibit investment in commodities and future contracts, equity private placement,employer securities, leveraged or derivative securities, options, direct real estate investments, precious metals, venture capital and limitedpartnerships. The guidelines also prohibit short selling and margin transactions. The Company’s practice is to periodically review andrebalance asset categories based on its targeted asset allocation percentage policy.
MDU Resources Group, Inc. Form 10-K 83

Part II
The fair value of the Company’s pension net plan assets by category is as follows:
Fair Value Measurements at December 31, 2009, Using_______________________________________________________
Quoted Pricesin Active Significant
Markets for Other SignificantIdentical Observable Unobservable Balance at
Assets Inputs Inputs December 31,(Level 1) (Level 2) (Level 3) 2009
(In thousands)
Assets:Common stocks (a) $133,989 $ – $ – $133,989Collective and mutual funds (b) 39,234 10,379 – 49,613U.S. government and U.S. government-sponsored securities (c) – 28,091 – 28,091Corporate and municipal bonds (d) – 27,968 – 27,968Collateral held on loaned securities (e) – 21,597 937 22,534Cash and cash equivalents 17,958 – – 17,958
Total assets measured at fair value 191,181 88,035 937 280,153
Liabilities:Obligation for collateral received 24,826 – – 24,826
Net assets measured at fair value $166,355 $88,035 $937 $255,327
(a) This category includes approximately 75 percent U.S. common stocks and 25 percent non-U.S. common stocks.
(b) Collective and mutual funds invest approximately 43 percent in common stock of large-cap U.S. companies, 21 percent in asset-backed securities,17 percent in cash and cash equivalents, 8 percent in small-cap U.S. companies and 11 percent in other investments.
(c) This category includes approximately 69 percent U.S. government-sponsored securities (asset-backed securities) and 31 percent U.S. governmentsecurities.
(d) This category includes approximately 78 percent corporate bonds and 22 percent municipal bonds.(e) This category includes collateral held at December 31, 2009, as a result of participation in a securities lending program. Cash collateral is invested
by the trustee primarily in repurchase agreements, money market funds, corporate bonds, commercial paper, asset-backed securities and certificatesof deposit.
The following table sets forth a summary of changes in the fair value of the pension plan’s Level 3 assets for the year endedDecember 31, 2009:
Fair Value Measurements Using SignificantUnobservable Inputs (Level 3)___________________________________________
Collateral Held on Loaned Securities
(In thousands)
Balance at beginning of year $573Total realized/unrealized losses 80Purchases, issuances and settlements (net) 284
Balance at end of year $937
The fair value of the Company’s other postretirement benefit plan assets by asset category is as follows:
Fair Value Measurements at December 31, 2009, Using_______________________________________________________
Quoted Pricesin Active Significant
Markets for Other SignificantIdentical Observable Unobservable Balance at
Assets Inputs Inputs December 31,(Level 1) (Level 2) (Level 3) 2009
(In thousands)
Assets:Money market funds $1,469 $ – $ – $ 1,469Common stock 2,897 – – 2,897Insurance investment contract* – 62,618 – 62,618
Total assets measured at fair value $4,366 $62,618 $ – $66,984
* Invested in mutual funds.
FO
RM
10
-K
84 MDU Resources Group, Inc. Form 10-K

Part IIFO
RM
10
-K
The Company expects to contribute approximately $10.2 million to its defined benefit pension plans and approximately $4.1 million to itspostretirement benefit plans in 2010.
The following benefit payments, which reflect future service, as appropriate, are expected to be paid:
OtherPension Postretirement
Years Benefits Benefits
(In thousands)
2010 $ 20,431 $ 6,0272011 20,744 6,2442012 21,496 6,4312013 22,151 6,6862014 22,640 6,9052015 - 2019 122,347 37,504
The following Medicare Part D subsidies are expected: $637,000 in 2010; $675,000 in 2011; $725,000 in 2012; $765,000 in 2013;$807,000 in 2014; and $4.7 million during the years 2015 through 2019.
In addition to company-sponsored plans, certain employees are covered under multi-employer pension plans administered by a union.Amounts contributed in 2009 to defined benefit and defined contribution multi-employer plans were $32.5 million and $16.4 million,respectively. Amounts contributed to the multi-employer plans were $73.1 million and $51.5 million in 2008 and 2007, respectively.
In addition to the qualified plan defined pension benefits reflected in the table at the beginning of this note, the Company also hasunfunded, nonqualified benefit plans for executive officers and certain key management employees that generally provide for definedbenefit payments at age 65 following the employee’s retirement or to their beneficiaries upon death for a 15-year period. The Companyhad investments of $67.9 million at December 31, 2009, consisting of equity securities of $32.1 million, life insurance carried on planparticipants (payable upon the employee’s death) of $29.8 million, fixed-income securities of $2.7 million and other investments of$3.3 million, which the Company anticipates using to satisfy obligations under these plans. The Company’s net periodic benefit cost forthese plans was $8.8 million, $9.0 million and $7.6 million in 2009, 2008 and 2007, respectively. The total projected benefit obligation forthese plans was $93.0 million and $87.2 million at December 31, 2009 and 2008, respectively. The accumulated benefit obligation forthese plans was $84.8 million and $77.3 million at December 31, 2009 and 2008, respectively. A discount rate of 5.75 percent and6.25 percent at December 31, 2009 and 2008, respectively, and a rate of compensation increase of 4.00 percent at December 31, 2009and 2008, were used to determine benefit obligations. A discount rate of 6.25 percent and 6.00 percent at December 31, 2009 and 2008,respectively, and a rate of compensation increase of 4.00 percent and 4.25 percent at December 31, 2009 and 2008, respectively, wereused to determine net periodic benefit cost.
The amount of benefit payments for the unfunded, nonqualified benefit plans, as appropriate, are expected to aggregate $4.6 millionin 2010; $5.0 million in 2011; $5.3 million in 2012; $5.9 million in 2013; $5.9 million in 2014; and $36.3 million for the years 2015through 2019.
The Company sponsors various defined contribution plans for eligible employees. Costs incurred by the Company under these plans were$20.5 million in 2009, $23.8 million in 2008 and $21.1 million in 2007.
Note 17 – Jointly Owned FacilitiesThe consolidated financial statements include the Company’s 22.7 percent and 25.0 percent ownership interests in the assets, liabilitiesand expenses of the Big Stone Station and the Coyote Station, respectively. Each owner of the Big Stone and Coyote stations is responsiblefor financing its investment in the jointly owned facilities.
The Company’s share of the Big Stone Station and Coyote Station operating expenses was reflected in the appropriate categories ofoperating expenses in the Consolidated Statements of Income.
MDU Resources Group, Inc. Form 10-K 85
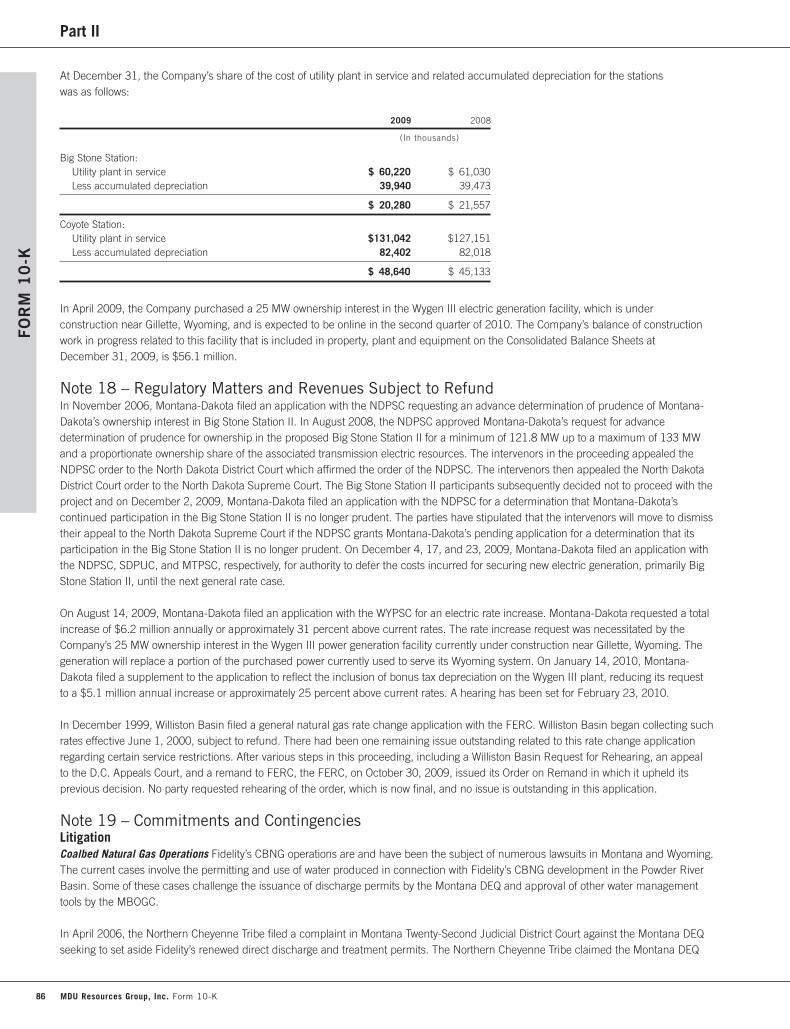
Part II
At December 31, the Company’s share of the cost of utility plant in service and related accumulated depreciation for the stationswas as follows:
2009 2008
(In thousands)
Big Stone Station:Utility plant in service $ 60,220 $ 61,030Less accumulated depreciation 39,940 39,473
$ 20,280 $ 21,557
Coyote Station:Utility plant in service $131,042 $127,151Less accumulated depreciation 82,402 82,018
$ 48,640 $ 45,133
In April 2009, the Company purchased a 25 MW ownership interest in the Wygen III electric generation facility, which is underconstruction near Gillette, Wyoming, and is expected to be online in the second quarter of 2010. The Company’s balance of constructionwork in progress related to this facility that is included in property, plant and equipment on the Consolidated Balance Sheets atDecember 31, 2009, is $56.1 million.
Note 18 – Regulatory Matters and Revenues Subject to RefundIn November 2006, Montana-Dakota filed an application with the NDPSC requesting an advance determination of prudence of Montana-Dakota’s ownership interest in Big Stone Station II. In August 2008, the NDPSC approved Montana-Dakota’s request for advancedetermination of prudence for ownership in the proposed Big Stone Station II for a minimum of 121.8 MW up to a maximum of 133 MWand a proportionate ownership share of the associated transmission electric resources. The intervenors in the proceeding appealed theNDPSC order to the North Dakota District Court which affirmed the order of the NDPSC. The intervenors then appealed the North DakotaDistrict Court order to the North Dakota Supreme Court. The Big Stone Station II participants subsequently decided not to proceed with theproject and on December 2, 2009, Montana-Dakota filed an application with the NDPSC for a determination that Montana-Dakota’scontinued participation in the Big Stone Station II is no longer prudent. The parties have stipulated that the intervenors will move to dismisstheir appeal to the North Dakota Supreme Court if the NDPSC grants Montana-Dakota’s pending application for a determination that itsparticipation in the Big Stone Station II is no longer prudent. On December 4, 17, and 23, 2009, Montana-Dakota filed an application withthe NDPSC, SDPUC, and MTPSC, respectively, for authority to defer the costs incurred for securing new electric generation, primarily BigStone Station II, until the next general rate case.
On August 14, 2009, Montana-Dakota filed an application with the WYPSC for an electric rate increase. Montana-Dakota requested a totalincrease of $6.2 million annually or approximately 31 percent above current rates. The rate increase request was necessitated by theCompany’s 25 MW ownership interest in the Wygen III power generation facility currently under construction near Gillette, Wyoming. Thegeneration will replace a portion of the purchased power currently used to serve its Wyoming system. On January 14, 2010, Montana-Dakota filed a supplement to the application to reflect the inclusion of bonus tax depreciation on the Wygen III plant, reducing its requestto a $5.1 million annual increase or approximately 25 percent above current rates. A hearing has been set for February 23, 2010.
In December 1999, Williston Basin filed a general natural gas rate change application with the FERC. Williston Basin began collecting suchrates effective June 1, 2000, subject to refund. There had been one remaining issue outstanding related to this rate change applicationregarding certain service restrictions. After various steps in this proceeding, including a Williston Basin Request for Rehearing, an appealto the D.C. Appeals Court, and a remand to FERC, the FERC, on October 30, 2009, issued its Order on Remand in which it upheld itsprevious decision. No party requested rehearing of the order, which is now final, and no issue is outstanding in this application.
Note 19 – Commitments and ContingenciesLitigationCoalbed Natural Gas Operations Fidelity’s CBNG operations are and have been the subject of numerous lawsuits in Montana and Wyoming.The current cases involve the permitting and use of water produced in connection with Fidelity’s CBNG development in the Powder RiverBasin. Some of these cases challenge the issuance of discharge permits by the Montana DEQ and approval of other water managementtools by the MBOGC.
In April 2006, the Northern Cheyenne Tribe filed a complaint in Montana Twenty-Second Judicial District Court against the Montana DEQseeking to set aside Fidelity’s renewed direct discharge and treatment permits. The Northern Cheyenne Tribe claimed the Montana DEQ
FO
RM
10
-K
86 MDU Resources Group, Inc. Form 10-K

Part IIFO
RM
10
-K
violated the Clean Water Act and the Montana Water Quality Act by failing to include in the permits conditions requiring application of thebest practicable control technology currently available and by failing to impose a nondegradation policy like the one the BER adopted soonafter the permit was issued. In addition, the Northern Cheyenne Tribe claimed that the actions of the Montana DEQ violated the MontanaState Constitution’s guarantee of a clean and healthful environment, that the Montana DEQ’s related environmental assessment wasinvalid, that the Montana DEQ was required, but failed, to prepare an EIS and that the Montana DEQ failed to consider other alternatives tothe issuance of the permits. Fidelity, the NPRC, and the TRWUA were granted leave to intervene in this proceeding. On January 12, 2009,the Montana Twenty-Second Judicial District Court decided the case in favor of Fidelity and the Montana DEQ in all respects, denying themotions of the Northern Cheyenne Tribe, TRWUA, and NPRC, and granting the cross-motions of the Montana DEQ and Fidelity in theirentirety. As a result, Fidelity may continue to utilize its direct discharge and treatment permits. The NPRC, the TRWUA and the NorthernCheyenne Tribe appealed the decision to the Montana Supreme Court on March 9, 11, and 13, 2009, respectively.
Fidelity’s discharge of water pursuant to its two permits is its primary means for managing CBNG-produced water. Fidelity believes thatits discharge permits should, assuming normal operating conditions, allow Fidelity to continue its existing CBNG operations through theexpiration of the permits in March 2011. If its permits are set aside, Fidelity’s CBNG operations in Montana could be significantly andadversely affected.
In October 2003, Tongue & Yellowstone Irrigation District, NPRC and MEIC filed a lawsuit in Montana First Judicial District Courtchallenging the MBOGC’s ROD adopting the 2003 Final EIS which analyzed CBNG development in the State of Montana. Through theamendment of the plaintiffs’ pleadings and as a result of discovery, the defendants have now determined that the primary legal issuebefore the Court is whether the ROD authorizes the “wasting” of ground water in violation of the Montana State Constitution and the publictrust doctrine. Specifically, the plaintiffs contend that various water management tools, including Fidelity’s direct discharge permits, allowfor the waste of water. Should the Montana First Judicial District Court determine that Fidelity’s direct discharge permits violate theMontana State Constitution, Fidelity’s Montana CBNG operations could be significantly and adversely affected.
Fidelity will continue to vigorously defend its interests in all CBNG-related litigation in which it is involved. If the plaintiffs are successful inthese lawsuits, the ultimate outcome of the actions could adversely impact Fidelity’s existing CBNG operations and/or the futuredevelopment of this resource in the affected regions.
Electric Operations In June 2008, the Sierra Club filed a complaint in the South Dakota Federal District Court against Montana-Dakota andthe two other co-owners of the Big Stone Station. The complaint alleged certain violations of the PSD and NSPS provisions of the Clean AirAct and certain violation of the South Dakota SIP. The action further alleged that the Big Stone Station was modified and operated withoutobtaining the appropriate permits, without meeting certain emissions limits and NSPS requirements and without installing appropriateemission control technology, all allegedly in violation of the Clean Air Act and the South Dakota SIP. The Sierra Club alleged that theseactions contributed to air pollution and visibility impairment and have increased the risk of adverse health effects and environmentaldamage. The Sierra Club sought declaratory and injunctive relief to bring the co-owners of the Big Stone Station into compliance with theClean Air Act and the South Dakota SIP and to require them to remedy the alleged violations. The Sierra Club also sought unspecified civilpenalties, including a beneficial mitigation project. The Company believes the claims are without merit and that Big Stone Station has beenand is being operated in compliance with the Clean Air Act and the South Dakota SIP. On March 31, 2009, the District Court granted themotion of the co-owners to dismiss the complaint. The Sierra Club filed a motion requesting the District Court to reconsider its ruling on aportion of the order dismissing the complaint which was denied on July 22, 2009. On July 30, 2009, the Sierra Club appealed from theorders dismissing the case and denying the motion for reconsideration to the United States Court of Appeals for the Eighth Circuit. TheUnited States has filed a brief as amicus curiae supporting the Sierra Club’s position in the appeal and the State of South Dakota filed abrief as amicus curiae supporting the Big Stone Station owners’ position in the appeal.
Construction Materials LTM is a third-party defendant in litigation pending in Oregon Circuit Court regarding the concrete floors in anindustrial food processing facility located in Jackson County, Oregon. The complaint against the facility construction contractor alleges theconcrete floors of the facility are defective and must be removed and replaced for suitable repair. Damages, including disruption of thefood processing operations, have been estimated by the plaintiff to be in excess of $32 million. The construction contractor’s answer andthird-party complaint alleges the owner and third-party defendants, including LTM which supplied the concrete, are primarily responsiblefor any defects in the concrete surfaces. Discovery is currently being conducted by the parties. A trial date has not been set.
The Company also is involved in other legal actions in the ordinary course of its business. Although the outcomes of any such legal actionscannot be predicted, management believes that the outcomes with respect to these other legal proceedings will not have a materialadverse effect upon the Company’s financial position or results of operations.
MDU Resources Group, Inc. Form 10-K 87
Part II
Environmental mattersPortland Harbor Site In December 2000, MBI was named by the EPA as a PRP in connection with the cleanup of a riverbed site adjacentto a commercial property site acquired by MBI from Georgia-Pacific West, Inc. in 1999. The riverbed site is part of the Portland, Oregon,Harbor Superfund Site. The EPA wants responsible parties to share in the cleanup of sediment contamination in the Willamette River. Todate, costs of the overall remedial investigation and feasibility study of the harbor site are being recorded, and initially paid, through anadministrative consent order by the LWG, a group of several entities, which does not include MBI or Georgia-Pacific West, Inc. Investigativecosts are indicated to be in excess of $70 million. It is not possible to estimate the cost of a corrective action plan until the remedialinvestigation and feasibility study have been completed, the EPA has decided on a strategy and a ROD has been published. Correctiveaction will be taken after the development of a proposed plan and ROD on the harbor site is issued. MBI also received notice in January2008 that the Portland Harbor Natural Resource Trustee Council intends to perform an injury assessment to natural resources resultingfrom the release of hazardous substances at the Harbor Superfund Site. The Trustee Council indicates the injury determination isappropriate to facilitate early settlement of damages and restoration for natural resource injuries. It is not possible to estimate the costs ofnatural resource damages until an assessment is completed and allocations are undertaken.
Based upon a review of the Portland Harbor sediment contamination evaluation by the Oregon DEQ and other information available,MBI does not believe it is a Responsible Party. In addition, MBI has notified Georgia-Pacific West, Inc., that it intends to seek indemnityfor liabilities incurred in relation to the above matters pursuant to the terms of their sale agreement. MBI has entered into an agreementtolling the statute of limitations in connection with the LWG’s potential claim for contribution to the costs of the remedial investigationand feasibility study. By letter of March 2, 2009, LWG stated its intent to file suit against MBI and others to recover LWG’s investigationcosts to the extent MBI cannot demonstrate its non-liability for the contamination or is unwilling to participate in an alternative disputeresolution process that has been established to address the matter. At this time, MBI has agreed to participate in the alternative disputeresolution process.
The Company believes it is not probable that it will incur any material environmental remediation costs or damages in relation to the abovereferenced administrative action.
Manufactured Gas Plant Sites There are three claims against Cascade for cleanup of environmental contamination at manufactured gasplant sites operated by Cascade’s predecessors.
The first claim is for soil and groundwater contamination at a site in Oregon and was received in 1995. There are PRPs in addition toCascade that may be liable for cleanup of the contamination. Some of these PRPs have shared in the investigation costs. It is expectedthat these and other PRPs will share in the cleanup costs. Several alternatives for cleanup have been identified, with preliminary costestimates ranging from approximately $500,000 to $11.0 million. An ecological risk assessment draft report was submitted to the OregonDEQ in June 2009. The assessment showed no unacceptable risk to the aquatic ecological receptors present in the shoreline along the siteand concluded that no further ecological investigation is necessary. The report is being reviewed by the Oregon DEQ. It is anticipated theOregon DEQ will recommend a cleanup alternative for the site after it completes its review of the report. It is not known at this time whatshare of the cleanup costs will actually be borne by Cascade.
The second claim is for contamination at a site in Washington and was received in 1997. A preliminary investigation has found soil andgroundwater at the site contain contaminants requiring further investigation and cleanup. EPA conducted a Targeted BrownfieldsAssessment of the site and released a report summarizing the results of that assessment in August 2009. The assessment confirms thatcontaminants have affected soil and groundwater at the site, as well as sediments in the adjacent Port Washington Narrows. Alternativeremediation options have been identified with preliminary cost estimates ranging from $340,000 to $6.4 million. Data developed throughthe assessment and previous investigations indicates the contamination likely derived from multiple, different sources and multiple currentand former owners of properties and businesses in the vicinity of the site may be responsible for the contamination. There is currently notenough information to estimate the potential liability to Cascade associated with this claim.
The third claim is also for contamination at a site in Washington. Cascade received notice from a party in May 2008 that Cascade may be aPRP, along with other parties, for contamination from a manufactured gas plant owned by Cascade’s predecessor from about 1946 to1962. The notice indicates that current estimates to complete investigation and cleanup of the site exceed $8.0 million. There is currentlynot enough information available to estimate the potential liability to Cascade associated with this claim.
To the extent these claims are not covered by insurance, Cascade will seek recovery through the OPUC and WUTC of remediation costs inits natural gas rates charged to customers.
FO
RM
10
-K
88 MDU Resources Group, Inc. Form 10-K

Part IIFO
RM
10
-K
Operating leasesThe Company leases certain equipment, facilities and land under operating lease agreements. The amounts of annual minimum leasepayments due under these leases as of December 31, 2009, were $25.2 million in 2010, $20.3 million in 2011, $15.3 million in 2012,$12.6 million in 2013, $6.7 million in 2014 and $43.9 million thereafter. Rent expense was $43.4 million, $35.3 million and $35.6 millionfor the years ended December 31, 2009, 2008 and 2007, respectively.
Purchase commitmentsThe Company has entered into various commitments, largely natural gas and coal supply, purchased power, natural gas transportationand storage and construction materials supply contracts. These commitments range from 1 to 51 years. The commitments under thesecontracts as of December 31, 2009, were $507.6 million in 2010, $288.3 million in 2011, $192.1 million in 2012, $105.7 million in2013, $90.3 million in 2014 and $234.9 million thereafter. These commitments were not reflected in the Company’s consolidatedfinancial statements. Amounts purchased under various commitments for the years ended December 31, 2009, 2008 and 2007, were$723.1 million, approximately $1.0 billion (including the acquisition of Intermountain as discussed in Note 2) and $857.0 million(including the acquisition of Cascade as discussed in Note 2), respectively.
GuaranteesIn connection with the sale of MPX in June 2005 to Petrobras, an indirect wholly owned subsidiary of the Company has agreed toindemnify Petrobras for 49 percent of any losses that Petrobras may incur from certain contingent liabilities specified in the purchaseagreement. Centennial has agreed to unconditionally guarantee payment of the indemnity obligations to Petrobras for periods ranging upto five and a half years from the date of sale. The guarantee was required by Petrobras as a condition to closing the sale of MPX.
Centennial guaranteed CEM’s obligations under a construction contract with LPP for a 550-MW combined-cycle electric generating facilitynear Hobbs, New Mexico. Centennial Resources sold CEM in July 2007 to Bicent Power LLC, which provided a $10 million bank letter ofcredit to Centennial in support of the guarantee obligation. On February 27, 2009, Centennial received a Notice and Demand from LPPunder the guaranty agreement alleging that CEM did not meet certain of its obligations under the construction contract and demandingthat Centennial indemnify LPP against all losses, damages, claims, costs, charges and expenses arising from CEM’s alleged failures. OnDecember 4, 2009, LPP submitted a demand for arbitration of its dispute with CEM to the American Arbitration Association. The demandseeks compensatory damages of $146 million plus damages for increased operating, capital and construction costs related to a watertreatment facility for the generating facility. LPP’s notice of demand for arbitration also demanded performance of the guarantee byCentennial. The Company believes the indemnification claims against Centennial are without merit and intends to vigorously defendagainst such claims.
In connection with the pending sale of the Brazilian Transmission Lines, as discussed in Note 4, Centennial has agreed to guarantee theperformance of certain of the Company’s indirect wholly owned subsidiaries in three purchase and sale agreements. Centennial hasagreed to unconditionally guarantee payment of the indemnity obligations of the wholly owned subsidiary sellers for periods ranging up to10 years from the date of sale. The guarantees were required by the buyers as a condition to the sale of the Brazilian Transmission Lines.
In addition, WBI Holdings has guaranteed certain of Fidelity’s natural gas swap and collar agreement obligations. There is no fixedmaximum amount guaranteed in relation to the natural gas swap and collar agreements as the amount of the obligation is dependentupon natural gas commodity prices. The amount of hedging activity entered into by the subsidiary is limited by corporate policy. Theguarantees of the natural gas swap and collar agreements at December 31, 2009, expire in 2010 and 2011; however, Fidelity continues toenter into additional hedging activities and, as a result, WBI Holdings from time to time may issue additional guarantees on these hedgingobligations. There were no amounts outstanding by Fidelity at December 31, 2009. In the event Fidelity defaults under its obligations,WBI Holdings would be required to make payments under its guarantees.
Certain subsidiaries of the Company have outstanding guarantees to third parties that guarantee the performance of other subsidiariesof the Company. These guarantees are related to construction contracts, natural gas transportation and sales agreements, gatheringcontracts, a conditional purchase agreement and certain other guarantees. At December 31, 2009, the fixed maximum amountsguaranteed under these agreements aggregated $234.4 million. The amounts of scheduled expiration of the maximum amountsguaranteed under these agreements aggregate $65.3 million in 2010; $141.8 million in 2011; $16.7 million in 2012; $1.8 million in 2013;$200,000 in 2014; $1.0 million in 2018; $300,000 in 2019; $3.3 million, which is subject to expiration on a specified number of daysafter the receipt of written notice; and $4.0 million, which has no scheduled maturity date. The amount outstanding by subsidiaries of theCompany under the above guarantees was $570,000 and was reflected on the Consolidated Balance Sheet at December 31, 2009. In theevent of default under these guarantee obligations, the subsidiary issuing the guarantee for that particular obligation would be required tomake payments under its guarantee.
MDU Resources Group, Inc. Form 10-K 89
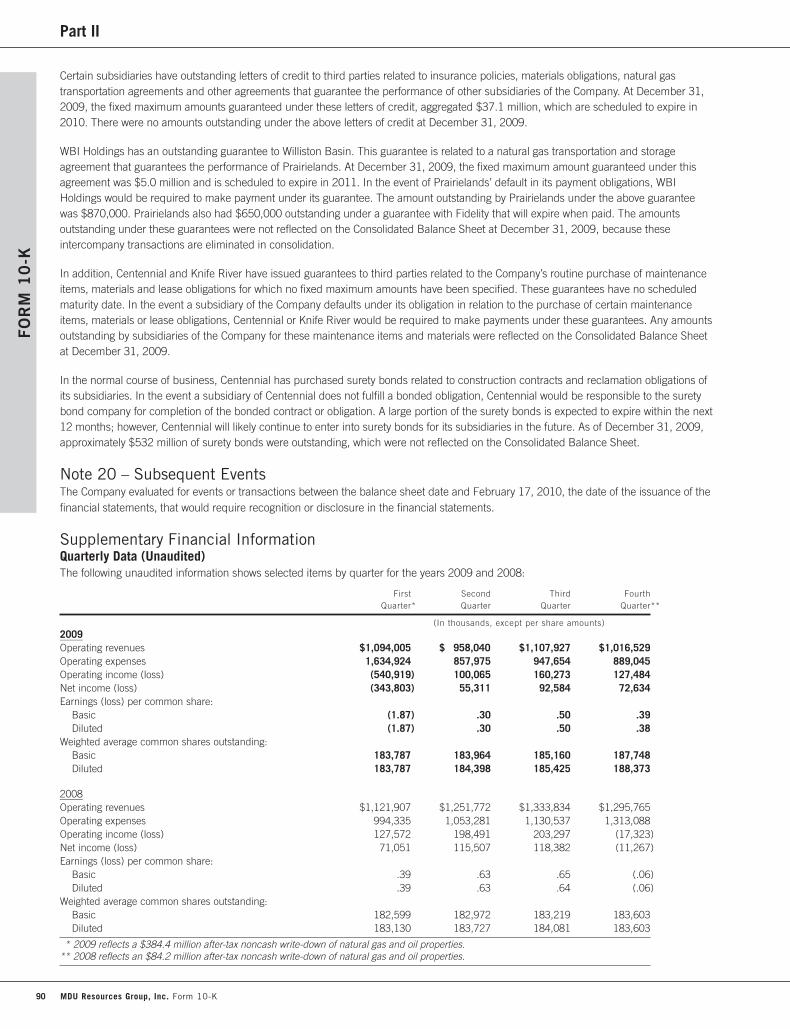
Part II
Certain subsidiaries have outstanding letters of credit to third parties related to insurance policies, materials obligations, natural gastransportation agreements and other agreements that guarantee the performance of other subsidiaries of the Company. At December 31,2009, the fixed maximum amounts guaranteed under these letters of credit, aggregated $37.1 million, which are scheduled to expire in2010. There were no amounts outstanding under the above letters of credit at December 31, 2009.
WBI Holdings has an outstanding guarantee to Williston Basin. This guarantee is related to a natural gas transportation and storageagreement that guarantees the performance of Prairielands. At December 31, 2009, the fixed maximum amount guaranteed under thisagreement was $5.0 million and is scheduled to expire in 2011. In the event of Prairielands’ default in its payment obligations, WBIHoldings would be required to make payment under its guarantee. The amount outstanding by Prairielands under the above guaranteewas $870,000. Prairielands also had $650,000 outstanding under a guarantee with Fidelity that will expire when paid. The amountsoutstanding under these guarantees were not reflected on the Consolidated Balance Sheet at December 31, 2009, because theseintercompany transactions are eliminated in consolidation.
In addition, Centennial and Knife River have issued guarantees to third parties related to the Company’s routine purchase of maintenanceitems, materials and lease obligations for which no fixed maximum amounts have been specified. These guarantees have no scheduledmaturity date. In the event a subsidiary of the Company defaults under its obligation in relation to the purchase of certain maintenanceitems, materials or lease obligations, Centennial or Knife River would be required to make payments under these guarantees. Any amountsoutstanding by subsidiaries of the Company for these maintenance items and materials were reflected on the Consolidated Balance Sheetat December 31, 2009.
In the normal course of business, Centennial has purchased surety bonds related to construction contracts and reclamation obligations ofits subsidiaries. In the event a subsidiary of Centennial does not fulfill a bonded obligation, Centennial would be responsible to the suretybond company for completion of the bonded contract or obligation. A large portion of the surety bonds is expected to expire within the next12 months; however, Centennial will likely continue to enter into surety bonds for its subsidiaries in the future. As of December 31, 2009,approximately $532 million of surety bonds were outstanding, which were not reflected on the Consolidated Balance Sheet.
Note 20 – Subsequent EventsThe Company evaluated for events or transactions between the balance sheet date and February 17, 2010, the date of the issuance of thefinancial statements, that would require recognition or disclosure in the financial statements.
Supplementary Financial InformationQuarterly Data (Unaudited)The following unaudited information shows selected items by quarter for the years 2009 and 2008:
First Second Third FourthQuarter* Quarter Quarter Quarter**
(In thousands, except per share amounts)2009Operating revenues $1,094,005 $ 958,040 $1,107,927 $1,016,529Operating expenses 1,634,924 857,975 947,654 889,045Operating income (loss) (540,919) 100,065 160,273 127,484Net income (loss) (343,803) 55,311 92,584 72,634Earnings (loss) per common share:
Basic (1.87) .30 .50 .39Diluted (1.87) .30 .50 .38
Weighted average common shares outstanding:Basic 183,787 183,964 185,160 187,748Diluted 183,787 184,398 185,425 188,373
2008Operating revenues $1,121,907 $1,251,772 $1,333,834 $1,295,765Operating expenses 994,335 1,053,281 1,130,537 1,313,088Operating income (loss) 127,572 198,491 203,297 (17,323)Net income (loss) 71,051 115,507 118,382 (11,267)Earnings (loss) per common share:
Basic .39 .63 .65 (.06)Diluted .39 .63 .64 (.06)
Weighted average common shares outstanding:Basic 182,599 182,972 183,219 183,603Diluted 183,130 183,727 184,081 183,603
* 2009 reflects a $384.4 million after-tax noncash write-down of natural gas and oil properties.** 2008 reflects an $84.2 million after-tax noncash write-down of natural gas and oil properties.
FO
RM
10
-K
90 MDU Resources Group, Inc. Form 10-K

Part IIFO
RM
10
-K
Certain Company operations are highly seasonal and revenues from and certain expenses for such operations may fluctuate significantlyamong quarterly periods. Accordingly, quarterly financial information may not be indicative of results for a full year.
Natural Gas and Oil Activities (Unaudited)Fidelity is involved in the acquisition, exploration, development and production of natural gas and oil resources. Fidelity’s activities includethe acquisition of producing properties with potential development opportunities, exploratory drilling and the operation and development ofproduction properties. Fidelity shares revenues and expenses from the development of specified properties in the Rocky Mountain andMid-Continent regions of the United States and in and around the Gulf of Mexico in proportion to its ownership interests.
Fidelity owns in fee or holds natural gas leases for the properties it operates in Colorado, Montana, North Dakota, Texas, Utah andWyoming. These rights are in the Bonny Field in eastern Colorado, the Baker Field in southeastern Montana and southwestern NorthDakota, the Bowdoin area in north-central Montana, the Powder River Basin of Montana and Wyoming, the Bakken area in North Dakota,the Paradox Basin of Utah, the Tabasco and Texan Gardens fields of Texas and the Big Horn Basin in Wyoming. In 2008, Fidelity acquiredand became the operator of natural gas properties in Rusk County in eastern Texas.
The information that follows includes Fidelity’s proportionate share of all its natural gas and oil interests.
The following table sets forth capitalized costs and accumulated depreciation, depletion and amortization related to natural gas and oilproducing activities at December 31:
2009 2008 2007
(In thousands)
Subject to amortization $1,815,380 $2,211,865 $1,750,233Not subject to amortization 178,214 232,081 142,524
Total capitalized costs 1,993,594 2,443,946 1,892,757Less accumulated depreciation, depletion and amortization 969,630 846,074 681,101
Net capitalized costs $1,023,964 $1,597,872 $1,211,656
Note: Net capitalized costs as of December 31, 2009 and 2008, reflect noncash write-downs of the Company’s natural gas and oil properties, as discussed in Note 1.
Capital expenditures, including those not subject to amortization, related to natural gas and oil producing activities were as follows:
Years ended December 31, 2009* 2008* 2007*
(In thousands)
Acquisitions:Proved properties $ 3,879 $225,610 $ 426Unproved properties 8,771 107,419 17,731
Exploration 33,123 109,828 48,744Development** 135,202 260,098 214,433
Total capital expenditures $180,975 $702,955 $281,334
* Excludes net additions to property, plant and equipment related to the recognition of future liabilities for asset retirement obligations associated with the plugging and abandonment of natural gas and oil wells, as discussed in Note 10, of $2.0 million, $3.0 million and $5.4 million for the years ended December 31, 2009, 2008 and 2007, respectively.
** Includes expenditures for proved undeveloped reserves of $32.5 million, $46.7 million and $74.6 million for the years ended December 31, 2009, 2008 and 2007, respectively.
MDU Resources Group, Inc. Form 10-K 91

Part II
The following summary reflects income resulting from the Company’s operations of natural gas and oil producing activities, excludingcorporate overhead and financing costs:
Years ended December 31, 2009 2008 2007
(In thousands)
Revenues:Sales to affiliates $ 101,230 $291,642 $226,706Sales to external customers 338,425 420,488 287,557
Production costs 123,148 161,401 123,924Depreciation, depletion and amortization* 126,278 167,427 124,599Write-down of natural gas and oil properties 620,000 135,800 –
Pretax income (429,771) 247,502 265,740Income tax expense (164,216) 91,593 98,729
Results of operations for producing activities $(265,555) $155,909 $167,011
* Includes accretion of discount for asset retirement obligations of $2.7 million, $2.5 million and $2.5 million for the years ended December 31, 2009, 2008 and 2007, respectively, as discussed in Note 10.
The following table summarizes the Company’s estimated quantities of proved natural gas and oil reserves at December 31, 2009, 2008and 2007, and reconciles the changes between these dates. Estimates of proved reserves were prepared in accordance with guidelinesestablished by the industry and the SEC. The estimates are arrived at using actual historical wellhead production trends and/or standardreservoir engineering methods utilizing available geological, geophysical, engineering and economic data. Other factors used in the reserveestimates are natural gas and oil prices, current estimates of well operating and future development costs, taxes, timing of operations, andthe interests owned by the Company in the properties. These estimates are refined as new information becomes available.
The reserve estimates as of December 31, 2009, were calculated using SEC Defined Prices and prior to that time, reserve estimates werecalculated using spot market prices that existed at the end of the applicable period. SEC Defined Prices used for the December 31, 2009,reserve estimates for natural gas were significantly lower than December 31, 2008, spot market prices. As a result, the Company hadsignificant negative revisions of previous estimates to its reserves. Because SEC rules require proved reserves to be economicallyproducible, the price used is inherent in that determination. If the rules regarding the prices used to calculate reserves had not beenchanged, the Company believes it would not have had significant negative revisions to its reserves due to pricing, as spot market prices onDecember 31, 2009, were higher than December 31, 2008, spot market prices.
The reserve estimates are prepared by internal engineers assigned to an asset team by geographic area and are reviewed and approvedby management. In addition, the Company engages an independent third party to audit its proved reserves. Ryder Scott Company, L.P.reviewed the Company’s proved reserve quantity estimates as of December 31, 2009.
Estimates of economically recoverable natural gas and oil reserves and future net revenues therefrom are based upon a number ofvariable factors and assumptions. For these reasons, estimates of economically recoverable reserves and future net revenues may varyfrom actual results.
2009 2008 2007
Natural Natural NaturalGas Oil Gas Oil Gas Oil
(MMcf/MBbls)
Proved developed andundeveloped reserves:
Balance at beginning of year 604,282 34,348 523,737 30,612 538,100 27,100Production (56,632) (3,111) (65,457) (2,808) (62,798) (2,365)Extensions and discoveries 26,882 2,569 78,338 4,941 77,701 3,772Improved recovery – – – – 444 1,614Purchases of proved reserves – – 92,564 834 2 6Sales of reserves in place (22) (248) – – (6) (42)Revisions of previous estimates (126,085) 658 (24,900) 769 (29,706) 527
Balance at end of year 448,425 34,216 604,282 34,348 523,737 30,612
Proved reserves:Developed 321,561 26,794 431,180 26,862 420,137 25,658Undeveloped 126,864 7,422 173,102 7,486 103,600 4,954
Balance at end of year 448,425 34,216 604,282 34,348 523,737 30,612
FO
RM
10
-K
92 MDU Resources Group, Inc. Form 10-K

Part IIFO
RM
10
-K
The level of proved undeveloped reserves converted to developed in 2009 was less than anticipated as the Company’s drilling plans weremodified due to the lower price environment experienced in 2009 and the Company’s focus to preserve capital. The Company did not haveany material proved undeveloped locations that remained undeveloped for five years or more as of December 31, 2009.
The Company’s interests in natural gas and oil reserves are located in the United States and in and around the Gulf of Mexico.
The standardized measure of the Company’s estimated discounted future net cash flows of total proved reserves associated with its variousnatural gas and oil interests at December 31 was as follows:
2009 2008 2007
(In thousands)
Future cash inflows $2,991,200 $3,970,000 $5,302,300Future production costs 1,095,600 1,325,600 1,415,700Future development costs 315,000 377,300 237,600
Future net cash flows before income taxes 1,580,600 2,267,100 3,649,000Future income tax expense 291,000 501,200 1,179,900
Future net cash flows 1,289,600 1,765,900 2,469,10010% annual discount for estimated timing of cash flows 630,800 796,100 1,107,200
Discounted future net cash flows relating to proved natural gas and oil reserves $ 658,800 $ 969,800 $1,361,900
The following are the sources of change in the standardized measure of discounted future net cash flows by year:
2009 2008 2007
(In thousands)
Beginning of year $ 969,800 $1,361,900 $1,003,500
Net revenues from production (200,900) (547,000) (354,100)Change in net realization (364,800) (687,100) 527,900Extensions and discoveries, net of future production-related costs 70,500 209,600 310,300Improved recovery, net of future production-related costs – – 38,100Purchases of proved reserves, net of future production-related costs – 138,100 200Sales of reserves in place (1,100) – (1,300)Changes in estimated future development costs 43,600 11,000 (22,600)Development costs incurred during the current year 46,400 66,300 103,000Accretion of discount 115,900 183,800 133,700Net change in income taxes 142,800 372,300 (212,500)Revisions of previous estimates (155,500) (132,200) (163,700)Other (7,900) (6,900) (600)
Net change (311,000) (392,100) 358,400
End of year $ 658,800 $ 969,800 $1,361,900
The estimated discounted future cash inflows from estimated future production of proved reserves were computed using prices aspreviously discussed. Future development and production costs attributable to proved reserves were computed by applying year-end coststo be incurred in producing and further developing the proved reserves. Future development costs estimated to be spent in each of thenext three years to develop proved undeveloped reserves as of December 31, 2009, are $88.9 million in 2010, $69.1 million in 2011 and$41.8 million in 2012. Future income tax expenses were computed by applying statutory tax rates, adjusted for permanent differences andtax credits, to estimated net future pretax cash flows.
The standardized measure of discounted future net cash flows does not purport to represent the fair market value of natural gas and oilproperties. There are significant uncertainties inherent in estimating quantities of proved reserves and in projecting rates of production andthe timing and amount of future costs. In addition, future realization of natural gas and oil prices over the remaining reserve lives may varysignificantly from SEC Defined Prices.
MDU Resources Group, Inc. Form 10-K 93
Part II
Item 9. Changes in and Disagreements With Accountants on Accounting and Financial Disclosure
None.
Item 9A. Controls and Procedures
The following information includes the evaluation of disclosure controls and procedures by the Company’s chief executive officer and thechief financial officer, along with any significant changes in internal controls of the Company.
Evaluation of Disclosure Controls and ProceduresThe term “disclosure controls and procedures” is defined in Rules 13a-15(e) and 15d-15(e) of the Exchange Act. The Company’s controlsand other procedures are designed to provide reasonable assurance that information required to be disclosed in the reports that theCompany files or submits under the Exchange Act is recorded, processed, summarized and reported within the time periods specified inthe SEC’s rules and forms. The Company’s disclosure controls and procedures include controls and procedures designed to providereasonable assurance that information required to be disclosed is accumulated and communicated to management, including theCompany’s chief executive officer and chief financial officer, to allow timely decisions regarding required disclosure. The Company’s chiefexecutive officer and chief financial officer have evaluated the effectiveness of the Company’s disclosure controls and procedures and theyhave concluded that, as of the end of the period covered by this report, such controls and procedures were effective at a reasonableassurance level.
Changes in Internal ControlsThe Company maintains a system of internal accounting controls that is designed to provide reasonable assurance that the Company’stransactions are properly authorized, the Company’s assets are safeguarded against unauthorized or improper use, and the Company’stransactions are properly recorded and reported to permit preparation of the Company’s financial statements in conformity with generallyaccepted accounting principles in the United States of America. There were no changes in the Company’s internal control over financialreporting that occurred during the quarter ended December 31, 2009, that have materially affected, or are reasonably likely to materiallyaffect, the Company’s internal control over financial reporting.
Management’s Annual Report on Internal Control Over Financial ReportingThe information required by this item is included in this Form 10-K at Item 8 – Management’s Report on Internal Control Over FinancialReporting.
Attestation Report of the Registered Public Accounting FirmThe information required by this item is included in this Form 10-K at Item 8 – Report of Independent Registered Public Accounting Firm.
Item 9B. Other Information
None.
FO
RM
10
-K
94 MDU Resources Group, Inc. Form 10-K
Part IIIFO
RM
10
-K
Item 10. Directors, Executive Officers and Corporate Governance
The information required by this item is included in the last sentence of the third paragraph under the caption “Item 1. Election ofDirectors” and under the captions “Item 1. Election of Directors – Director Nominees,” “Information Concerning Executive Officers,” thefirst paragraph and the second, third and fourth sentences of the second paragraph under “Corporate Governance – Audit Committee,”“Corporate Governance – Code of Conduct,” the second sentence of the last paragraph under “Corporate Governance – Board Meetingsand Committees” and “Section 16(a) Beneficial Ownership Reporting Compliance” in the Proxy Statement, which information isincorporated herein by reference.
Item 11. Executive Compensation
The information required by this item is included under the caption “Executive Compensation” in the Proxy Statement, which informationis incorporated herein by reference.
Item 12. Security Ownership of Certain Beneficial Owners and Management and RelatedStockholder Matters
Equity Compensation Plan InformationThe following table includes information as of December 31, 2009, with respect to the Company’s equity compensation plans:
(c)(a) Number of securities
Number of securities (b) remaining available forto be issued upon Weighted average future issuance under
exercise of exercise price of equity compensation plansoutstanding options, outstanding options, (excluding securities
Plan Category warrants and rights warrants and rights reflected in column (a))
Equity compensation plans approved by stockholders (1) 1,087,973 (2) $19.80 7,262,380 (3)(4)Equity compensation plans not approved by stockholders (5) 371,403 13.22 2,361,073 (6)__________ __________Total 1,459,376 $18.13 9,623,453
(1) Consists of the 1992 Key Employee Stock Option Plan, the Non-Employee Director Long-Term Incentive Compensation Plan, the Long-TermPerformance-Based Incentive Plan and the Non-Employee Director Stock Compensation Plan.
(2) Includes 634,505 performance shares.(3) In addition to being available for future issuance upon exercise of options, 357,757 shares under the Non-Employee Director Long-Term Incentive
Compensation Plan may instead be issued in connection with stock appreciation rights, restricted stock, performance units, performance sharesor other equity-based awards, and 5,861,739 shares under the Long-Term Performance-Based Incentive Plan may instead be issued inconnection with stock appreciation rights, restricted stock, performance units, performance shares or other equity-based awards.
(4) This amount also includes 364,628 shares available for issuance under the Non-Employee Director Stock Compensation Plan. Under this plan, inaddition to a cash retainer, nonemployee Directors are awarded 4,050 shares following the Company’s annual meeting of stockholders. Prior toJanuary 1, 2009, the Company’s Chairman of the Board of Directors received an additional $50,000 in stock under the plan each December aspart of his retainer. A non-employee Director may acquire additional shares under the plan in lieu of receiving the cash portion of the Director’sretainer or fees.
(5) Consists of the 1998 Option Award Program and the Group Genius Innovation Plan.(6) In addition to being available for future issuance upon exercise of options, 219,050 shares under the Group Genius Innovation Plan may instead
be issued in connection with stock appreciation rights, restricted stock, restricted stock units, performance units, performance stock or other equity-based awards.
The following equity compensation plans have not been approved by the Company’s stockholders.
The 1998 Option Award ProgramThe 1998 Option Award Program is a broad-based plan adopted by the Board of Directors, effective February 12, 1998. The plan permitsthe grant of nonqualified stock options to employees of the Company and its subsidiaries. The maximum number of shares that may beissued under the plan is 3,795,330. Shares granted may be authorized but unissued shares, treasury shares, or shares purchased on theopen market. Option exercise prices are equal to the market value of the Company’s shares on the date of the option grant. Optioneesreceive dividend equivalents on their options, with any credited dividends paid in cash to the optionee if the option vests, or forfeited if theoption is forfeited. Vested options remain exercisable for one year following termination of employment due to death or disability and forthree months following termination of employment for any other reason.
Unvested options are forfeited upon termination of employment. Subject to the terms and conditions of the plan, the plan’sadministrative committee determines the number of shares subject to options granted to each participant and the other terms andconditions pertaining to such options, including vesting provisions. All options become immediately exercisable in the event of achange in control of the Company.
MDU Resources Group, Inc. Form 10-K 95

Part III
In 2001, 450 options (adjusted for the three-for-two stock splits in October 2003 and July 2006) were granted to each of approximately5,900 employees. No officers received grants. These options vested on February 13, 2004. As of December 31, 2009, options covering371,403 shares of common stock were outstanding under the plan and 2,142,023 shares remained available for future grant. Optionscovering 1,281,904 shares had been exercised.
The Group Genius Innovation PlanThe Group Genius Innovation Plan was adopted by the Board of Directors, effective May 17, 2001, to encourage employees to share ideasfor new business directions for the Company and to reward them when the idea becomes profitable. Employees of the Company and itssubsidiaries who are selected by the plan’s administrative committee are eligible to participate in the plan. Officers and Directors are noteligible to participate. The plan permits the granting of nonqualified stock options, stock appreciation rights, restricted stock, restrictedstock units, performance units, performance stock and other awards. The maximum number of shares that may be issued under the planis 223,150. Shares granted under the plan may be authorized but unissued shares, treasury shares or shares purchased on the openmarket. Restricted stockholders have voting rights and, unless determined otherwise by the plan’s administrative committee, receivedividends paid on the restricted stock. Dividend equivalents payable in cash may be granted with respect to options and performanceshares. The plan’s administrative committee determines the number of shares or units subject to awards, and the other terms andconditions of the awards, including vesting provisions and the effect of employment termination. Upon a change in control of the Company,all options and stock appreciation rights become immediately vested and exercisable, all restricted stock becomes immediately vested, allrestricted stock units become immediately vested and are paid out in cash, and target payout opportunities under all performance units,performance stock, and other awards are deemed to be fully earned, with awards denominated in stock paid out in shares and awardsdenominated in units paid out in cash. As of December 31, 2009, 4,100 shares of stock had been granted to 73 employees.
The remaining information required by this item is included under the caption “Security Ownership” in the Proxy Statement, whichinformation is incorporated herein by reference.
Item 13. Certain Relationships and Related Transactions, and Director Independence
The information required by this item is included under the captions “Related Person Transaction Disclosure,” “Corporate Governance –Director Independence” and the second sentence of the third paragraph under “Corporate Governance – Board Meetings andCommittees” in the Proxy Statement, which information is incorporated herein by reference.
Item 14. Principal Accountant Fees and Services
The information required by this item is included under the caption “Accounting and Auditing Matters” in the Proxy Statement, whichinformation is incorporated herein by reference.
FO
RM
10
-K
96 MDU Resources Group, Inc. Form 10-K

Part IVFO
RM
10
-K
Item 15. Exhibits and Financial Statement Schedules
(a) Financial Statements, Financial Statement Schedules and Exhibits
Index to Financial Statements and Financial Statement Schedules
1. Financial StatementsThe following consolidated financial statements required under this item are included under Item 8 – Financial Statements and Supplementary Data. Page
Consolidated Statements of Income for each of the three years in the period ended December 31, 2009 . . . . . . . . . . . . . . . . . . . . . . . . . . . . . . . . . . . . . . . . . . . . . . . . . . . . . . . . . 50
Consolidated Balance Sheets at December 31, 2009 and 2008 . . . . . . . . . . . . . . . . . . . . . . . . . 51
Consolidated Statements of Common Stockholders’ Equity for each of the three years in the period ended December 31, 2009 . . . . . . . . . . . . . . . . . . . . . . . . . . . . . . . . . . . . . . . . . 52
Consolidated Statements of Cash Flows for each of the three years in the period ended December 31, 2009 . . . . . . . . . . . . . . . . . . . . . . . . . . . . . . . . . . . . . . . . . . . . . . . . . . . . . . . . . 53
Notes to Consolidated Financial Statements . . . . . . . . . . . . . . . . . . . . . . . . . . . . . . . . . . . . . . . . 54
2. Financial Statement Schedules
MDU Resources Group, Inc.Schedule II - Consolidated Valuation and Qualifying Accounts
Years Ended December 31, 2009, 2008 and 2007
Additions______________________________
Balance at Charged to BalanceBeginning Costs and at End
Description of Year Expenses Other* Deductions** of Year
(In thousands)
Allowance for doubtful accounts:2009 $13,691 $12,152 $1,412 $10,606 $16,6492008 14,635 12,191 2,115 15,250 13,6912007 7,725 8,799 5,533 7,422 14,635
* Allowance for doubtful accounts for companies acquired and recoveries.** Uncollectible accounts written off.
All other schedules are omitted because of the absence of the conditions under which they are required, or because the informationrequired is included in the Company’s Consolidated Financial Statements and Notes thereto.
3. Exhibits
3(a) Restated Certificate of Incorporation of the Company, as amended, dated May 17, 2007, filed as Exhibit 3.1 to Form 8-A/A, filedon June 27, 2007, in File No. 1-3480*
3(b) Company Bylaws, as amended and restated, on November 12, 2009**
4(a) Indenture of Mortgage, dated as of May 1, 1939, as restated in the Forty-Fifth Supplemental Indenture, dated as of April 21,1992, and the Forty-Sixth through Fiftieth Supplements thereto between the Company and the New York Trust Company(The Bank of New York, successor Corporate Trustee) and A. C. Downing (Douglas J. MacInnes, successor Co-Trustee),filed as Exhibit 4(a) to Form S-3, in Registration No. 33-66682; and Exhibits 4(e), 4(f) and 4(g) to Form S-8, in Registration No. 33-53896; and Exhibit 4(c)(i) to Form S-3, in Registration No. 333-49472; and Exhibit 4(e) to Form S-8, in RegistrationNo. 333-112035*
4(b) Indenture, dated as of December 15, 2003, between the Company and The Bank of New York, as trustee, filed as Exhibit 4(f) toForm S-8 on January 21, 2004, in Registration No. 333-112035*
4(c) First Supplemental Indenture, dated as of November 17, 2009, between the Company and The Bank of New York Mellon, astrustee**
MDU Resources Group, Inc. Form 10-K 97
Part IV
4(d) Centennial Energy Holdings, Inc. Master Shelf Agreement, dated April 29, 2005, among Centennial Energy Holdings, Inc. andthe Prudential Insurance Company of America, filed as Exhibit 4(a) to Form 10-Q for the quarter ended June 30, 2005, filed onAugust 3, 2005, in File No. 1-3480*
4(e) Letter Amendment No. 1 to Amended and Restated Master Shelf Agreement, dated May 17, 2006, among Centennial EnergyHoldings, Inc., The Prudential Insurance Company of America, and certain investors described in the Letter Amendment filed asExhibit 4(a) to Form 10-Q for the quarter ended June 30, 2006, filed on August 4, 2006, in File No. 1-3480*
4(f) MDU Resources Group, Inc. Credit Agreement, dated June 21, 2005, among MDU Resources Group, Inc., Wells Fargo Bank,National Association, as Administrative Agent, and The Other Financial Institutions Party thereto, filed as Exhibit 4(b) to Form 10-Q for the quarter ended June 30, 2005, filed on August 3, 2005, in File No. 1-3480*
4(g) First Amendment, dated June 30, 2006, to Credit Agreement, dated June 21, 2005, among MDU Resources Group, Inc., WellsFargo Bank, National Association, as administrative agent, and certain lenders described in the credit agreement, filed asExhibit 4(b) to Form 10-Q for the quarter ended June 30, 2006, filed on August 4, 2006, in File No. 1-3480*
4(h) Centennial Energy Holdings, Inc. Credit Agreement, dated December 13, 2007, among Centennial Energy Holdings, Inc., U.S.Bank National Association, as Administrative Agent, and The Other Financial Institutions party thereto, filed as Exhibit 4(j) toForm 10-K for the year ended December 31, 2007, filed on February 20, 2008, in File No. 1-3480*
4(i) Consent dated November 9, 2009, under Centennial Energy Holdings, Inc. Credit Agreement, among Centennial EnergyHoldings, Inc., U.S. Bank National Association, as Administrative Agent, and The Other Financial Institutions party thereto**
4(j) MDU Energy Capital, LLC Master Shelf Agreement, dated as of August 9, 2007, among MDU Energy Capital, LLC and thePrudential Insurance Company of America, filed as Exhibit 4 to Form 8-K dated August 16, 2007, filed on August 16, 2007, in File No. 1-3480*
4(k) Indenture dated as of August 1, 1992, between Cascade Natural Gas Corporation and The Bank of New York relating to Medium-Term Notes, filed by Cascade Natural Gas Corporation as Exhibit 4 to Form 8-K dated August 12, 1992, in File No. 1-7196*
4(l) First Supplemental Indenture dated as of October 25, 1993, between Cascade Natural Gas Corporation and The Bank of NewYork relating to Medium-Term Notes and the 7.5% Notes due November 15, 2031, filed by Cascade Natural Gas Corporation asExhibit 4 to Form 10-Q for the quarter ended June 30, 1993, in File No. 1-7196*
4(m) Second Supplemental Indenture, dated January 25, 2005, between Cascade Natural Gas Corporation and The Bank of NewYork, as trustee, filed by Cascade Natural Gas Corporation as Exhibit 4.1 to Form 8-K dated January 25, 2005, filed onJanuary 26, 2005, in File No. 1-7196*
4(n) Third Supplemental Indenture dated as of March 8, 2007, between Cascade Natural Gas Corporation and The Bank of New YorkTrust Company, N.A., as Successor Trustee, filed by Cascade Natural Gas Corporation as Exhibit 4.1 to Form 8-K dated March 8,2007, filed on March 8, 2007, in File No. 1-7196*
4(o) Amendment No. 1 to Master Shelf Agreement, dated October 1, 2008, among MDU Energy Capital, LLC, Prudential InvestmentManagement, Inc., The Prudential Insurance Company of America, and the holders of the notes thereunder, filed as Exhibit 4(b)to Form 10-Q for the quarter ended September 30, 2008, filed on November 5, 2008, in File No. 1-3480*
+10(a) 1992 Key Employee Stock Option Plan, as revised, filed as Exhibit 10(a) to Form 10-K for the year ended December 31, 2006,filed on February 21, 2007, in File No. 1-3480*
+10(b) Supplemental Income Security Plan, as amended and restated November 12, 2009**
+10(c) Directors’ Compensation Policy, as amended May 14, 2009, filed as Exhibit 10(a) to Form 10-Q for the quarter ended June 30,2009, filed on August 7, 2009, in File No. 1-3480*
+10(d) Deferred Compensation Plan for Directors, as amended May 15, 2008, filed as Exhibit 10(a) to Form 10-Q for the quarter endedJune 30, 2008, filed on August 7, 2008, in File No. 1-3480*
+10(e) Non-Employee Director Stock Compensation Plan, as amended May 15, 2008, filed as Exhibit 10(d) to Form 10-Q for the quarterended June 30, 2008, filed on August 7, 2008, in File No. 1-3480*
+10(f) Non-Employee Director Long-Term Incentive Compensation Plan, as amended November 12, 2009**
+10(g) 1998 Option Award Program, as amended November 12, 2009**
+10(h) Group Genius Innovation Plan, as amended November 12, 2009**
+10(i) WBI Holdings, Inc. Executive Incentive Compensation Plan, as amended January 31, 2008, and Rules and Regulations, asamended November 11, 2009**
+10(j) Knife River Corporation Executive Incentive Compensation Plan, as amended January 31, 2008, and Rules and Regulations, asamended November 16, 2009**
+10(k) Long-Term Performance-Based Incentive Plan, as amended November 12, 2009**
FO
RM
10
-K
98 MDU Resources Group, Inc. Form 10-K

Part IVFO
RM
10
-K
+10(l) MDU Resources Group, Inc. Executive Incentive Compensation Plan, as amended November 15, 2007, and Rules andRegulations, as amended November 11, 2009**
+10(m) Montana-Dakota Utilities Co. Executive Incentive Compensation Plan, as amended November 15, 2007, and Rules andRegulations, as amended November 11, 2009**
+10(n) Form of Change of Control Employment Agreement, as amended May 15, 2008, filed as Exhibit 10.1 to Form 8-K dated May 15,2008, filed on May 20, 2008, in File No. 1-3480*
+10(o) MDU Resources Group, Inc. Executive Officers with Change of Control Employment Agreements Chart, as of December 31,2008, filed as Exhibit 10(p) to Form 10-K for the year ended December 31, 2008, filed on February 13, 2009, in File No. 1-3480*
+10(p) Supplemental Executive Retirement Plan for John G. Harp, dated December 4, 2006, filed as Exhibit 10(ag) to Form 10-K for theyear ended December 31, 2006, filed on February 21, 2007, in File No. 1-3480*
+10(q) Employment Letter for John G. Harp, dated July 20, 2005, filed as Exhibit 10(ah) to Form 10-K for the year ended December 31,2006, filed on February 21, 2007, in File No. 1-3480*
+10(r) Form of Performance Share Award Agreement under the Long-Term Performance-Based Incentive Plan, as amended August 13,2008, filed as Exhibit 10.1 to Form 8-K dated August 13, 2008, filed on August 19, 2008, in File No. 1-3480*
+10(s) MDU Construction Services Group, Inc. Executive Incentive Compensation Plan, as amended January 31, 2008, and Rules andRegulations, as amended February 16, 2009, filed as Exhibit 10(c) to Form 10-Q for the quarter ended March 31, 2009, filed onMay 6, 2009, in File No. 1-3480*
+10(t) John G. Harp 2009 additional incentive opportunity, filed as Exhibit 10(f) to Form 10-Q for the quarter ended March 31, 2009,filed on May 6, 2009, in File No. 1-3480*
+10(u) Form of 2009 Annual Incentive Award Agreement under the Long-Term Performance-Based Incentive Plan, filed as Exhibit 10(g)to Form 10-Q for the quarter ended March 31, 2009, filed on May 6, 2009, in File No. 1-3480*
+10(v) MDU Resources Group, Inc. 401(k) Retirement Plan, as restated June 1, 2009, filed as Exhibit 10(b) to Form 10-Q for thequarter ended June 30, 2009, filed on August 7, 2009, in File No. 1-3480*
+10(w) Instrument of Amendment to the MDU Resources Group, Inc. 401(k) Retirement Plan, dated December 2, 2009**
+10(x) Instrument of Amendment to the MDU Resources Group, Inc. 401(k) Retirement Plan, dated December 30, 2009**
12 Computation of Ratio of Earnings to Fixed Charges and Combined Fixed Charges and Preferred Stock Dividends**
21 Subsidiaries of MDU Resources Group, Inc.**
23(a) Consent of Independent Registered Public Accounting Firm**
23(b) Consent of Ryder Scott Company, L.P.**
31(a) Certification of Chief Executive Officer filed pursuant to Section 302 of the Sarbanes-Oxley Act of 2002**
31(b) Certification of Chief Financial Officer filed pursuant to Section 302 of the Sarbanes-Oxley Act of 2002**
32 Certification of Chief Executive Officer and Chief Financial Officer furnished pursuant to 18 U.S.C. Section 1350, as adoptedpursuant to Section 906 of the Sarbanes-Oxley Act of 2002**
99(a) Sales Agency Financing Agreement entered into between MDU Resources Group, Inc. and Wells Fargo Securities, LLC, filed asExhibit 1 to Form 8-K dated September 5, 2008, filed on September 5, 2008, in File No. 1-3480*
99(b) Ryder Scott Company, L.P. report dated January 22, 2010**
101 The following materials from MDU Resources Group, Inc.’s Annual Report on Form 10-K for the year ended December 31, 2009,formatted in XBRL (eXtensible Business Reporting Language): (i) the Consolidated Statements of Income, (ii) the ConsolidatedBalance Sheets, (iii) the Consolidated Statements of Common Stockholders’ Equity, (iv) the Consolidated Statements of CashFlows, (v) the Notes to Consolidated Financial Statements, tagged as blocks of text and (vi) Schedule II – Consolidated Valuationand Qualifying Accounts, tagged as a block of text
* Incorporated herein by reference as indicated.** Filed herewith.+ Management contract, compensatory plan or arrangement.
MDU Resources Group, Inc. agrees to furnish to the SEC upon request any instrument with respect to long-term debt that MDU Resources Group, Inc. has not filed as an exhibit pursuant to the exemption provided by Item 601(b)(4)(iii)(A) of Regulation S-K.
MDU Resources Group, Inc. Form 10-K 99

Part IV
SignaturesPursuant to the requirements of Section 13 or 15(d) of the Securities Exchange Act of 1934, the registrant has duly caused this report tobe signed on its behalf by the undersigned, thereunto duly authorized.
MDU Resources Group, Inc.
Date: February 17, 2010 By: /s/ Terry D. HildestadTerry D. Hildestad(President and Chief Executive Officer)
Pursuant to the requirements of the Securities Exchange Act of 1934, this report has been signed below by the following persons on behalfof the registrant in the capacities and on the date indicated.
Signature Title Date
/s/ Terry D. Hildestad Chief Executive Officer and Director February 17, 2010Terry D. Hildestad
(President and Chief Executive Officer)
/s/ Doran N. Schwartz Chief Financial Officer February 17, 2010Doran N. Schwartz
(Vice President and Chief Financial Officer)
/s/ Nicole A. Kivisto Chief Accounting Officer February 17, 2010Nicole A. Kivisto
(Vice President, Controller and Chief Accounting Officer)
/s/ Harry J. Pearce Director February 17, 2010Harry J. Pearce
(Chairman of the Board)
/s/ Thomas Everist Director February 17, 2010Thomas Everist
/s/ Karen B. Fagg Director February 17, 2010Karen B. Fagg
/s/ A. Bart Holaday Director February 17, 2010A. Bart Holaday
/s/ Dennis W. Johnson Director February 17, 2010Dennis W. Johnson
/s/ Thomas C. Knudson Director February 17, 2010Thomas C. Knudson
/s/ Richard H. Lewis Director February 17, 2010Richard H. Lewis
/s/ Patricia L. Moss Director February 17, 2010Patricia L. Moss
/s/ Sister Thomas Welder Director February 17, 2010Sister Thomas Welder
/s/ John K. Wilson Director February 17, 2010John K. Wilson
FO
RM
10
-K
100 MDU Resources Group, Inc. Form 10-K

PR
OXY
1200 West Century Avenue Terry D. HildestadPresident and
Chief Executive OfficerMailing Address: P.O. Box 5650Bismarck, ND 58506-5650(701) 530-1000
March 12, 2010
To Our Stockholders:
Please join us for the 2010 Annual Meeting of Stockholders. The meeting will be held on Tuesday, April 27, 2010, at11:00 a.m., Central Daylight Saving Time, at 909 Airport Road, Bismarck, North Dakota.
The formal matters are described in the accompanying Notice of Annual Meeting of Stockholders and Proxy Statement.We also will have a brief report on current matters of interest. Lunch will be served following the meeting.
We were pleased with the stockholder response for the 2009 Annual Meeting at which 88.77 percent of the common stockwas represented in person or by proxy. We hope for an even greater representation at the 2010 meeting.
You may vote your shares by telephone, by the Internet, or by returning the enclosed proxy card. Representation of yourshares at the meeting is very important. We urge you to submit your proxy promptly.
Please note that the New York Stock Exchange rules have changed. Brokers may not vote your shares on the election ofdirectors if you have not given your broker specific instructions as to how to vote. Please be sure to give specific votinginstructions to your broker so that your vote can be counted.
All stockholders who find it convenient to do so are cordially invited and urged to attend the meeting in person. Registeredstockholders will receive a request for admission ticket(s) with their proxy card that can be completed and returned to uspostage-free. Stockholders whose shares are held in the name of a bank or broker will not receive a request for admissionticket(s). They should, instead, (1) call (701) 530-1000 to request an admission ticket(s), (2) bring a statement from theirbank or broker showing proof of stock ownership as of February 26, 2010 to the annual meeting, and (3) present theiradmission ticket(s) and photo identification, such as a driver’s license. Directions to the meeting will be included with youradmission ticket.
I hope you will find it possible to attend the meeting.
Sincerely yours,
Terry D. Hildestad
MDU Resources Group, Inc. Proxy Statement


Proxy StatementP
RO
XY
MDU RESOURCES GROUP, INC.1200 West Century Avenue
Mailing Address:P.O. Box 5650
Bismarck, North Dakota 58506-5650(701) 530-1000
NOTICE OF ANNUAL MEETING OF STOCKHOLDERSTO BE HELD APRIL 27, 2010
Important Notice Regarding the Availability of Proxy Materials for theStockholder Meeting to Be Held on April 27, 2010
The 2010 Notice of Annual Meeting and Proxy Statement and 2009 Annual Reportto Stockholders are available at www.mdu.com/proxymaterials.
March 12, 2010
NOTICE IS HEREBY GIVEN that the Annual Meeting of Stockholders of MDU Resources Group, Inc. will be held at 909 Airport Road,Bismarck, North Dakota, on Tuesday, April 27, 2010, at 11:00 a.m., Central Daylight Saving Time, for the following purposes:
(1) To elect ten directors nominated by the board of directors to one-year terms;
(2) To repeal Article TWELFTH of our Restated Certificate of Incorporation, which contains provisions relating to businesscombinations with interested stockholders, and make related amendments to Articles THIRTEENTH and FOURTEENTH;
(3) To repeal Article FIFTEENTH of our Restated Certificate of Incorporation, which contains supermajority vote requirements foramendments to certain articles of our Restated Certificate of Incorporation;
(4) To repeal section (c) of Article THIRTEENTH of our Restated Certificate of Incorporation, which provides that directors may beremoved by stockholders only for cause, and make technical amendments to section (a) of Article THIRTEENTH;
(5) To ratify the appointment of Deloitte & Touche LLP as our independent auditors for 2010;
(6) To act upon a stockholder proposal requesting a report on coal combustion waste; and
(7) To transact any other business that may properly come before the meeting or any adjournment or adjournments thereof.
The board of directors has set the close of business on February 26, 2010 as the record date for the determination of commonstockholders who will be entitled to notice of, and to vote at, the meeting.
All stockholders who find it convenient to do so are cordially invited and urged to attend the meeting in person. Registered stockholderswill receive a request for admission ticket(s) with their proxy card that can be completed and returned to us postage-free. Stockholderswhose shares are held in the name of a bank or broker will not receive a request for admission ticket(s). They should, instead, (1) call(701) 530-1000 to request an admission ticket(s), (2) bring a statement from their bank or broker showing proof of stock ownership as ofFebruary 26, 2010 to the annual meeting, and (3) present their admission ticket(s) and photo identification, such as a driver’s license.Directions to the meeting will be included with your admission ticket. We look forward to seeing you.
By order of the Board of Directors,
Paul K. SandnessSecretary
MDU Resources Group, Inc. Proxy Statement

Proxy Statement
Page
Notice of Annual Meeting of Stockholders
Proxy Statement . . . . . . . . . . . . . . . . . . . . . . . . . . . . . . . . . . . . . . . . . . . . . . . . . . . . . . . . . . . . . . . . . . . . . . . . . . . . . . . . . . . . . . . . . 1
Voting Information . . . . . . . . . . . . . . . . . . . . . . . . . . . . . . . . . . . . . . . . . . . . . . . . . . . . . . . . . . . . . . . . . . . . . . . . . . . . . . . . . . . . 1
Item 1. Election of Directors . . . . . . . . . . . . . . . . . . . . . . . . . . . . . . . . . . . . . . . . . . . . . . . . . . . . . . . . . . . . . . . . . . . . . . . . . . . . . 3
Director Nominees . . . . . . . . . . . . . . . . . . . . . . . . . . . . . . . . . . . . . . . . . . . . . . . . . . . . . . . . . . . . . . . . . . . . . . . . . . . . . . . . 3
Item 2. Repeal of Article TWELFTH of our Restated Certificate of Incorporation, whichContains Provisions Relating to Business Combinations with Interested Stockholders, andRelated Amendments to Articles THIRTEENTH and FOURTEENTH . . . . . . . . . . . . . . . . . . . . . . . . . . . . . . . . . . . . . . . . . . . 10
Item 3. Repeal of Article FIFTEENTH of our Restated Certificate of Incorporation, which ContainsSupermajority Vote Requirements for Amendments to Certain Articles of our Restated Certificateof Incorporation. . . . . . . . . . . . . . . . . . . . . . . . . . . . . . . . . . . . . . . . . . . . . . . . . . . . . . . . . . . . . . . . . . . . . . . . . . . . . . . . . . . 11
Item 4. Repeal of Section (c) of Article THIRTEENTH of our Restated Certificate of Incorporation,which Provides that Directors may be Removed by Stockholders Only for Cause, and TechnicalAmendments to Section (a) of Article THIRTEENTH . . . . . . . . . . . . . . . . . . . . . . . . . . . . . . . . . . . . . . . . . . . . . . . . . . . . . . . 12
Item 5. Ratification of Independent Auditors. . . . . . . . . . . . . . . . . . . . . . . . . . . . . . . . . . . . . . . . . . . . . . . . . . . . . . . . . . . . . . . . . 13
Accounting and Auditing Matters . . . . . . . . . . . . . . . . . . . . . . . . . . . . . . . . . . . . . . . . . . . . . . . . . . . . . . . . . . . . . . . . . . . . . . . . . 14
Item 6. Stockholder Proposal Requesting a Report on Coal Combustion Waste. . . . . . . . . . . . . . . . . . . . . . . . . . . . . . . . . . . . . . . 14
Executive Compensation . . . . . . . . . . . . . . . . . . . . . . . . . . . . . . . . . . . . . . . . . . . . . . . . . . . . . . . . . . . . . . . . . . . . . . . . . . . . . . . 17
Compensation Discussion and Analysis. . . . . . . . . . . . . . . . . . . . . . . . . . . . . . . . . . . . . . . . . . . . . . . . . . . . . . . . . . . . . . . . . 17
Compensation Committee Report . . . . . . . . . . . . . . . . . . . . . . . . . . . . . . . . . . . . . . . . . . . . . . . . . . . . . . . . . . . . . . . . . . . . . 32
Summary Compensation Table for 2009 . . . . . . . . . . . . . . . . . . . . . . . . . . . . . . . . . . . . . . . . . . . . . . . . . . . . . . . . . . . . . . . . 32
Grants of Plan-Based Awards in 2009. . . . . . . . . . . . . . . . . . . . . . . . . . . . . . . . . . . . . . . . . . . . . . . . . . . . . . . . . . . . . . . . . . 33
Outstanding Equity Awards at Fiscal Year-End 2009 . . . . . . . . . . . . . . . . . . . . . . . . . . . . . . . . . . . . . . . . . . . . . . . . . . . . . . . 36
Option Exercises and Stock Vested during 2009 . . . . . . . . . . . . . . . . . . . . . . . . . . . . . . . . . . . . . . . . . . . . . . . . . . . . . . . . . . 37
Pension Benefits for 2009. . . . . . . . . . . . . . . . . . . . . . . . . . . . . . . . . . . . . . . . . . . . . . . . . . . . . . . . . . . . . . . . . . . . . . . . . . . 37
Nonqualified Deferred Compensation for 2009 . . . . . . . . . . . . . . . . . . . . . . . . . . . . . . . . . . . . . . . . . . . . . . . . . . . . . . . . . . . 41
Potential Payments upon Termination or Change of Control . . . . . . . . . . . . . . . . . . . . . . . . . . . . . . . . . . . . . . . . . . . . . . . . . . 41
Director Compensation for 2009 . . . . . . . . . . . . . . . . . . . . . . . . . . . . . . . . . . . . . . . . . . . . . . . . . . . . . . . . . . . . . . . . . . . . . . 49
Information Concerning Executive Officers . . . . . . . . . . . . . . . . . . . . . . . . . . . . . . . . . . . . . . . . . . . . . . . . . . . . . . . . . . . . . . . . . . 51
Security Ownership . . . . . . . . . . . . . . . . . . . . . . . . . . . . . . . . . . . . . . . . . . . . . . . . . . . . . . . . . . . . . . . . . . . . . . . . . . . . . . . . . . . 52
Related Person Transaction Disclosure. . . . . . . . . . . . . . . . . . . . . . . . . . . . . . . . . . . . . . . . . . . . . . . . . . . . . . . . . . . . . . . . . . . . . 53
Corporate Governance . . . . . . . . . . . . . . . . . . . . . . . . . . . . . . . . . . . . . . . . . . . . . . . . . . . . . . . . . . . . . . . . . . . . . . . . . . . . . . . . . 53
Section 16(a) Beneficial Ownership Reporting Compliance. . . . . . . . . . . . . . . . . . . . . . . . . . . . . . . . . . . . . . . . . . . . . . . . . . . . . . 59
Other Business . . . . . . . . . . . . . . . . . . . . . . . . . . . . . . . . . . . . . . . . . . . . . . . . . . . . . . . . . . . . . . . . . . . . . . . . . . . . . . . . . . . . . . 59
Shared Address Stockholders. . . . . . . . . . . . . . . . . . . . . . . . . . . . . . . . . . . . . . . . . . . . . . . . . . . . . . . . . . . . . . . . . . . . . . . . . . . . 59
2011 Annual Meeting of Stockholders . . . . . . . . . . . . . . . . . . . . . . . . . . . . . . . . . . . . . . . . . . . . . . . . . . . . . . . . . . . . . . . . . . . . . 59
Exhibit A – MDU Resources Group, Inc.’s Proposed Amendments to its RestatedCertificate of Incorporation . . . . . . . . . . . . . . . . . . . . . . . . . . . . . . . . . . . . . . . . . . . . . . . . . . . . . . . . . . . . . . . . . . . . . . . . . . . . . . A-1
PR
OXY
MDU Resources Group, Inc. Proxy Statement
Proxy StatementP
RO
XY
PROXY STATEMENT
The board of directors of MDU Resources Group, Inc. is furnishing this proxy statement beginning March 12, 2010 to solicit your proxy foruse at our annual meeting of stockholders on April 27, 2010.
We will pay the cost of soliciting your proxy and reimburse brokers and others for forwarding proxy material to you. Georgeson Inc.additionally will solicit proxies for approximately $8,000 plus out-of-pocket expenses.
The Securities and Exchange Commission’s e-proxy rules allow companies to post their proxy materials on the Internet and provide onlya Notice of Internet Availability of Proxy Materials to stockholders as an alternative to mailing full sets of proxy materials except uponrequest. For 2010, we have elected to use the Securities and Exchange Commission’s full set delivery option, which means that whilewe are posting our proxy materials online, we are also mailing a full set of our proxy materials to our stockholders. We believe that mailing afull set of proxy materials will help ensure that a majority of outstanding shares of our common stock are present in person or representedby proxy at our meeting. We also hope to help maximize stockholder participation. Therefore, even if you previously consented to receivingyour proxy materials electronically, you will receive a full set of proxy materials in the mail for this year’s annual meeting. However, wewill continue to evaluate the option of providing only a Notice of Internet Availability of Proxy Materials to some or all of our stockholdersin the future.
VOTING INFORMATION
Who may vote? You may vote if you owned shares of our common stock at the close of business on February 26, 2010. You may vote eachshare that you owned on that date on each matter presented at the meeting. As of February 26, 2010, we had 188,053,936 shares ofcommon stock outstanding entitled to one vote per share.
What am I voting on? You are voting on:
• the election of ten directors nominated by the board of directors for one-year terms
• the repeal of article TWELFTH of our restated certificate of incorporation, which contains provisions relating to business combinationswith interested stockholders, and related amendments to articles THIRTEENTH and FOURTEENTH
• the repeal of article FIFTEENTH of our restated certificate of incorporation, which contains supermajority vote requirements foramendments to certain articles of our restated certificate of incorporation
• the repeal of section (c) of article THIRTEENTH of our restated certificate of incorporation, which provides that directors may beremoved by stockholders only for cause, and technical amendments to section (a) of article THIRTEENTH
• the ratification of the appointment of Deloitte & Touche LLP as our independent auditors for 2010
• a stockholder proposal requesting a report on coal combustion waste and
• any other business that is properly brought before the meeting.
What vote is required to pass an item of business? A majority of our outstanding shares of common stock entitled to vote must be present inperson or represented by proxy to hold the meeting.
If you hold shares through an account with a bank or broker, the bank or broker may vote your shares on some matters even if you do notprovide voting instructions. Brokerage firms have the authority under the New York Stock Exchange rules to vote shares on certain matterswhen their customers do not provide voting instructions. However, on other matters, when the brokerage firm has not received votinginstructions from its customers, the brokerage firm cannot vote the shares on that matter and a “broker non-vote” occurs. Please note thatthe New York Stock Exchange rules have changed and an uncontested election of directors is no longer considered a routine matter. Thismeans that brokers may not vote your shares on the election of directors if you have not given your broker specific instructions as to how tovote. Please be sure to give specific voting instructions to your broker so that your vote can be counted.
MDU Resources Group, Inc. Proxy Statement 1

Proxy Statement
Item 1 – Election of DirectorsA majority of votes cast is required to elect a director in an uncontested election. A majority of votes cast means the number of votes cast“for” a director’s election must exceed the number of votes cast “against” the director’s election. “Abstentions” and “broker non-votes”do not count as votes cast “for” or “against” the director’s election. In a contested election, which is an election in which the number ofnominees for director exceeds the number of directors to be elected, directors will be elected by a plurality of the votes cast. If a nomineebecomes unavailable for any reason or if a vacancy should occur before the election, which we do not anticipate, the proxies will vote yourshares in their discretion for another person nominated by the board.
Our policy on majority voting for directors and our corporate governance guidelines require any nominee for re-election as a director totender to the board, prior to nomination, his or her irrevocable resignation from the board that will be effective, in an uncontested electionof directors only, upon
• receipt of a greater number of votes “against” than votes “for” election at our annual meeting of stockholders and
• acceptance of such resignation by the board of directors.
Following certification of the stockholder vote, the nominating and governance committee will promptly recommend to the board whetheror not to accept the tendered resignation. The board will act on the nominating and governance committee’s recommendation no laterthan 90 days following the date of the annual meeting.
Item 2 – Repeal of Article TWELFTH of our Restated Certificate of Incorporation, which Contains ProvisionsRelating to Business Combinations with Interested Stockholders, and Related Amendments to Articles THIRTEENTHand FOURTEENTHApproval of Item 2 requires the affirmative vote of a majority of the outstanding shares of common stock. Abstentions will count as votes“against” the proposal.
Item 3 – Repeal of Article FIFTEENTH of our Restated Certificate of Incorporation, which Contains SupermajorityVote Requirements for Amendments to Certain Articles of our Restated Certificate of IncorporationApproval of Item 3 requires the affirmative vote of a majority of the outstanding shares of common stock. Abstentions will count as votes“against” the proposal.
Item 4 – Repeal of Section (c) of Article THIRTEENTH of our Restated Certificate of Incorporation, which ProvidesThat Directors May Be Removed by Stockholders Only for Cause, and Technical Amendments to Section (a) ofArticle THIRTEENTHApproval of Item 4 requires the affirmative vote of a majority of the outstanding shares of common stock. Abstentions will count as votes“against” the proposal.
Item 5 – Ratification of the Appointment of Deloitte & Touche LLP as our Independent Auditors for 2010Approval of Item 5 requires the affirmative vote of a majority of our common stock present in person or represented by proxy at themeeting and entitled to vote on the proposal. Abstentions will count as votes “against” the proposal.
Item 6 – Stockholder Proposal Requesting a Report on Coal Combustion WasteApproval of Item 6 requires the affirmative vote of a majority of our common stock present in person or represented by proxy at themeeting and entitled to vote on the proposal. Abstentions will count as votes “against” the proposal. Broker non-votes are not counted asvoting power present and, therefore, are not counted in the vote.
Unless you specify otherwise when you submit your proxy, the proxies will vote your shares of common stock “for” all directors nominatedby the board of directors, “for” proposals 2, 3, 4 and 5 and “against” proposal 6.
How do I vote? There are three ways to vote by proxy:
• by calling the toll free telephone number on the enclosed proxy card
• by using the Internet as described on the enclosed proxy card or
• by returning the enclosed proxy card in the envelope provided.
You may be able to vote by telephone or the Internet if your shares are held in the name of a bank or broker. Follow their instructions.
PR
OXY
2 MDU Resources Group, Inc. Proxy Statement

Proxy StatementP
RO
XY
Can I revoke my proxy? Yes. You can revoke your proxy by:
• filing written revocation with the corporate secretary before the meeting
• filing a proxy bearing a later date with the corporate secretary before the meeting or
• revoking your proxy at the meeting and voting in person.
ITEM 1. ELECTION OF DIRECTORS
At our 2007 annual meeting of stockholders, our board of directors proposed and our stockholders approved the declassification of ourboard of directors. The declassification was phased in over a three-year period from 2008 - 2010. Directors elected at our 2007 annualmeeting comprise the last class elected to serve a three-year term, and their terms will expire at this year’s annual meeting. As a result,commencing with this year’s annual meeting, our board will be completely declassified. All nominees for director are nominated to serveone-year terms, until the annual meeting of stockholders in 2011 and until their respective successors are elected and qualified, or untiltheir earlier resignation, removal from office, or death. Effective as of the date of this year’s annual meeting, the board of directors has setthe number of directors at ten.
The board of directors expresses its thanks to John L. Olson and Sister Thomas Welder, O.S.B. Mr. Olson retired from the board effectiveAugust 13, 2009 after reaching the mandatory retirement age of 70 for outside directors. Mr. Olson served on the board for 24 years andon the audit committee for 23 years. He also served on the compensation and nominating and governance committees during his tenure.Sister Welder chose not to seek re-election at this annual meeting because, pursuant to our bylaws’ mandatory retirement policy, shewould be required to retire on May 13, 2010, which is the first regular meeting of the board after she attains the mandatory retirementage. Sister Welder served on the board for 22 years and on the nominating and governance committee for 21 years. She also served onthe finance and audit committees during her tenure. Their dedicated service and expertise will be missed.
We have provided information below about our nominees, all of whom are incumbent directors, including their ages, years of serviceas directors, business experience, and service on other boards of directors, including any other directorships held during the past fiveyears. We have also included information about each nominee’s specific experience, qualifications, attributes, or skills that led the boardto conclude that he or she should serve as a director of MDU Resources Group, Inc. at the time we file our proxy statement, in light ofour business and structure. Unless we specifically note below, no corporation or organization referred to below is a subsidiary or otheraffiliate of ours.
Director Nominees
Thomas Everist Director Since 1995Age 60 Compensation Committee
Mr. Everist has served as president and chairman of The Everist Company, Sioux Falls, South Dakota, anaggregate, concrete, and asphalt production company, since April 15, 2002. He was previously presidentand chairman of L.G. Everist, Inc., Sioux Falls, South Dakota, an aggregate production company, from1987 to April 15, 2002. He held a number of positions in the aggregate and construction industries priorto assuming his current position with The Everist Company. He is a director of Showplace Wood Products,Sioux Falls, South Dakota, a custom cabinets manufacturer, and has been a director of Raven Industries,Inc., Sioux Falls, South Dakota, a general manufacturer of electronics, flow controls, and engineered filmssince 1996, and its chairman of the board since April 1, 2009.
Mr. Everist attended Stanford University where he received a bachelor’s degree in mechanical engineering and a master’s degree inconstruction management. He is active in the Sioux Falls community and currently serves as a director on the Sanford Health Foundation,a non-profit charitable health services organization. From July 2001 to June 2006, he served on the South Dakota Investment Council, thestate agency responsible for prudently investing state funds.
For the following reasons, the board concluded that Mr. Everist should serve as a director of MDU Resources Group, Inc., in light of ourbusiness and structure, at the time we file our proxy statement. A significant portion of MDU Resources Group, Inc.’s earnings is derivedfrom its construction services and aggregate mining businesses. Mr. Everist has considerable business experience in this area, with morethan 36 years in the aggregate and construction materials industry. He has also demonstrated success in his business and leadershipskills, serving as president and chairman of his companies for over 22 years. We value other public company board service. Mr. Everist has
MDU Resources Group, Inc. Proxy Statement 3
Proxy Statement
experience serving as a director and now chairman of another public company, which enhances his contributions to our board. Hisleadership skills and experience with his own companies and on other boards enable him to be an effective board member andcompensation committee chairman. With the retirement of John L. Olson and Sister Thomas Welder, Mr. Everist becomes our longestserving board member, providing 15 years of board experience as well as extensive knowledge of our business.
Karen B. Fagg Director Since 2005Age 56 Nominating and Governance Committee
Compensation Committee
Ms. Fagg has served as vice president of DOWL LLC, d/b/a DOWL HKM, an engineering and design firm,since April 2008. Ms. Fagg was president from April 1, 1995 through March 2008, and chairman andmajority owner from June 2000 through March 2008 of HKM Engineering, Inc., Billings, Montana, anengineering and physical science services firm. HKM Engineering, Inc. merged with DOWL LLC on April 1,2008. Ms. Fagg was employed with MSE, Inc., Butte, Montana, an energy research and developmentcompany, from 1976 through 1988 and served as vice president of operations and corporate developmentdirector. Ms. Fagg served a four-year term as director of the Montana Department of Natural Resources
and Conservation, Helena, Montana, the state agency charged with promoting stewardship of Montana’s water, soil, energy, and rangelandresources; regulating oil and gas exploration and production; and administering several grant and loan programs from 1989 through 1992.
Ms. Fagg has a bachelor’s degree in mathematics from Carroll College in Helena, Montana. She served on the board for St. Vincent’sHealthcare from October 2003 until October 2009, including a term as board chair and on the board of Deaconess Billings Clinic HealthSystem from 1994 to 2003. She is a member of the Board of Trustees of Carroll College, the Board of Advisors of the Charles M. BairFamily Trust, and a member of the Board of Directors of the Billings Chamber of Commerce. She is also a member of the Montana StateUniversity Engineering Advisory Council, whose responsibilities include evaluating the mission and goals of the College of Engineering andassisting in the development and implementation of the college’s strategic plan. From 2002 through 2006, she served on the MontanaBoard of Investments, the state agency responsible for prudently investing state funds. From 2001 to 2005, she served on the board ofMontana State University’s Advanced Technology Park. From 2000 to 2007, she served on the ZooMontana Board and as vice chair from2006 to 2007.
For the following reasons, the board concluded that Ms. Fagg should serve as a director of MDU Resources Group, Inc., in light of ourbusiness and structure, at the time we file our proxy statement. Construction and engineering, energy, and the responsible developmentof natural resources are all important aspects of our business. Ms. Fagg has business experience in all these areas, including 15 yearsof construction and engineering experience at DOWL HKM and its predecessor, HKM Engineering, Inc., where she has served as vicepresident, president, and chairman. Ms. Fagg has also had 12 years of experience in energy research and development at MSE, Inc.,where she served as vice president of operations and corporate development director, and four years focusing on stewardship of naturalresources as director of the Montana Department of Natural Resources and Conservation. In addition to her industry experience, Ms. Faggbrings to our board 12 years of business leadership and management experience as president and chairman of her own company, as wellas knowledge and experience acquired through her service on a number of Montana state and community boards.
Terry D. Hildestad Director Since 2006Age 60 President and Chief Executive Officer
Mr. Hildestad was elected president and chief executive officer and a director of the company effectiveAugust 17, 2006. He had served as president and chief operating officer from May 1, 2005 untilAugust 17, 2006. Prior to that, he served as president and chief executive officer of our subsidiary, KnifeRiver Corporation, from 1993 until May 1, 2005. He began his career with the company in 1974 at KnifeRiver Corporation, where he served in several operating positions before becoming its president. Headditionally serves as an executive officer and as chairman of the company’s principal subsidiaries and ofthe managing committees of Montana-Dakota Utilities Co. and Great Plains Natural Gas Co.
Mr. Hildestad has a bachelor’s degree from Dickinson State University and has completed the Advanced Management Program at HarvardSchool of Business. Mr. Hildestad is a member of the U.S. Bancorp Western North Dakota Advisory Board of Directors.
For the following reasons, the board concluded that Mr. Hildestad should serve as a director of MDU Resources Group, Inc., in light of ourbusiness and structure, at the time we file our proxy statement. As chief executive officer of MDU Resources Group, Inc., Mr. Hildestad is
PR
OXY
4 MDU Resources Group, Inc. Proxy Statement
Proxy StatementP
RO
XY
the only officer of the company to sit on our board, consistent with our past practice. With over 35 years of experience at our company,Mr. Hildestad has a deep knowledge and understanding of MDU Resources Group, Inc., its operating companies and its lines of business.Mr. Hildestad has demonstrated his leadership abilities and his commitment to our company since he was elected president and chiefexecutive officer and a director in 2006 and prior to that time through his long service as chief operating officer of the company and aspresident and chief executive officer at Knife River Corporation, our construction materials and contracting subsidiary. The board alsobelieves that Mr. Hildestad’s integrity, values, and good judgment make him well-suited to serve on our board.
A. Bart Holaday Director Since 2008Age 67 Audit Committee
Nominating and Governance Committee
Mr. Holaday headed the Private Markets Group of UBS Asset Management and its predecessor entitiesfor 15 years prior to his retirement in 2001, during which time he managed more than $19 billion ininvestments. Prior to that he was vice president and principal of the InnoVen Venture Capital Group.He was founder and president of Tenax Oil and Gas Corporation, an onshore Gulf Coast exploration andproduction company, from 1980 through 1982. He has four years of senior management experience withGulf Oil Corporation, a global energy and petrochemical company, and eight years of senior managementwith the federal government, including the Department of Defense, Department of the Interior, and the
Federal Energy Administration. He is currently the president and owner of Dakota Renewable Energy Fund, LLC, which invests in smallcompanies in North Dakota. He is a member of the investment advisory board of Commons Capital LLC, a venture capital firm; a memberof the board of directors of Adams Street Partners, LLC, a private equity investment firm; Alerus Financial, a financial services company;Jamestown College; the United States Air Force Academy Endowment (chairman); the Falcon Foundation (vice president), which providesscholarships to Air Force Academy applicants; the Center for Innovation Foundation at the University of North Dakota (chairman andtrustee) and the University of North Dakota Foundation; and is chairman and CEO of the Dakota Foundation. He is a past member of theboard of directors of the National Venture Capital Association, Walden University, and the U.S. Securities and Exchange Commissionadvisory committee on the regulation of capital markets.
Mr. Holaday has a bachelor’s degree in engineering sciences from the U.S. Air Force Academy. He was a Rhodes Scholar, earning abachelor’s degree and a master’s degree in politics, philosophy, and economics from Oxford University. He also earned a law degree fromGeorge Washington Law School and is a Chartered Financial Analyst. In 2005, he was awarded an honorary Doctor of Letters from theUniversity of North Dakota.
For the following reasons, the board concluded that Mr. Holaday should serve as a director of MDU Resources Group, Inc., in light ofour business and structure, at the time we file our proxy statement. MDU Resources Group, Inc. has significant operations in the naturalgas and oil industry. Mr. Holaday has knowledge and experience in this industry. He founded and served as president of Tenax Oil andGas Corporation. He has four years experience in senior management with Gulf Oil Corporation and 15 years of experience managingprivate equity investments, including investments in oil and gas, as the head of the Private Markets Group of UBS Asset Managementand its predecessor organizations. This business experience demonstrates his leadership skills and success in the oil and gas industry.Mr. Holaday brings to the board his extensive finance and investment experience as well as his business development skills acquiredthrough his work at UBS Asset Management, Tenax Oil and Gas Corporation, Gulf Oil Corporation, and several private equity investmentfirms. This will enhance the knowledge of the board and provide useful insights to management in connection not only with our naturalgas and oil business, but with all of our businesses.
Dennis W. Johnson Director Since 2001Age 60 Audit Committee
Mr. Johnson is chairman, chief executive officer and president of TMI Corporation, and chairman andchief executive officer of TMI Systems Design Corporation, TMI Transport Corporation and TMI StorageSystems Corporation, all of Dickinson, North Dakota, manufacturers of casework and architecturalwoodwork. He has been employed at TMI since 1974 serving as president or chief executive officersince 1982 and has been the majority stockholder since 1985. Mr. Johnson is serving his ninth year aspresident of the Dickinson City Commission. He previously was a director of the Federal Reserve Bankof Minneapolis. He is a past member and chairman of the Theodore Roosevelt Medora Foundation.
MDU Resources Group, Inc. Proxy Statement 5

Proxy Statement
Mr. Johnson has a bachelor of science degree in electrical and electronics engineering as well as a master of science degree in industrialengineering from North Dakota State University. He has served on numerous industry, state, and community boards, including the NorthDakota Workforce Development Council (chairperson), the Decorative Laminate Products Association, the North Dakota TechnologyCorporation, St. Joseph Hospital Life Care Foundation, St. John Evangelical Lutheran Church, Dickinson State University, the executiveoperations committee of the University of Mary Harold Shafer Leadership Center, and the Dickinson United Way. He also served on NorthDakota Governor Sinner’s Education Action Commission, the North Dakota Job Service Advisory Council, the North Dakota State UniversityPresident’s Advisory Council, North Dakota Governor Schafer’s Transition Team, and chaired North Dakota Governor Hoeven’s TransitionTeam. He has received numerous awards including the 1991 Regional Small Business Person of the Year Award and the Greater NorthDakotan Award.
For the following reasons, the board concluded that Mr. Johnson should serve as a director of MDU Resources Group, Inc., in light of ourbusiness and structure, at the time we file our proxy statement. Mr. Johnson has over 27 years of experience in business management,manufacturing, and finance, and has demonstrated his success in these areas, through his positions as chairman, president, and CEO ofTMI, as well as through his prior service as a director of the Federal Reserve Bank of Minneapolis. His finance experience and leadershipskills enable him to make valuable contributions to our audit committee, which he has chaired for six years. As a result of his service on anumber of state and local organizations in North Dakota, Mr. Johnson has significant knowledge of local, state, and regional issuesinvolving North Dakota, a state where we have significant operations and assets.
Thomas C. Knudson Director Since 2008Age 63 Compensation Committee
Mr. Knudson has been president of Tom Knudson Interests, LLC, since its formation on January 14, 2004.Tom Knudson Interests, LLC, provides consulting services in energy, sustainable development, andleadership. Mr. Knudson began employment with Conoco Oil Company (Conoco) in May 1975 andretired in 2004 from Conoco’s successor, ConocoPhillips, as senior vice president of human resources,government affairs and communications, and information technology. Mr. Knudson served as a memberof ConocoPhillips’ management committee. His diverse career at Conoco and ConocoPhillips includedengineering, operations, business development, and commercial assignments. He was the foundingchairman of the Business Council for Sustainable Development in both the United States and the United
Kingdom. He has been a director of Bristow Group Inc. since June 2004 and its chairman of the board of directors since August 2006,and was a director of Natco Group Inc. from April 2005 to November 2009 and Williams Partners LP from November 2005 to September2007. Bristow Group Inc. is a leading provider of helicopter services to the offshore oil industry. Natco Group Inc. is a leading manufacturerof oil and gas processing equipment. Williams Partners LP owns natural gas gathering, transportation, processing, and treating assets, andalso has natural gas liquids fractionating and storage assets.
Mr. Knudson has a bachelor’s degree in aerospace engineering from the U.S. Naval Academy and a master’s degree in aerospaceengineering from the U.S. Naval Postgraduate School. He served as a naval aviator, flying combat missions in Vietnam, and was alieutenant commander in 1974 when he was honorably discharged. Mr. Knudson has served on the boards of a number of petroleumindustry associations, Covenant House Texas, The Houston Museum of Natural Science, and Alpha USA/Houston. He has served as anadjunct professor at the Jones Graduate School of Management at Rice University.
For the following reasons, the board concluded that Mr. Knudson should serve as a director of MDU Resources Group, Inc., in light of ourbusiness and structure, at the time we file our proxy statement. A significant portion of our earnings is derived from natural gas and oilproduction and the transportation, storage, and gathering of natural gas. Mr. Knudson has extensive knowledge and experience in thisindustry as a result of his prior employment with Conoco and ConocoPhillips, as well as through his service on the boards of Natco Group,Inc. and Williams Partners LP. Mr. Knudson has a broad background in engineering, operations, and business development, as well asservice on the management committee at Conoco and ConocoPhillips, which bring additional experience and perspective to our board. Hisservice as senior vice president of human resources at ConocoPhillips makes him an excellent fit for our compensation committee.Sustainable business development is also an important aspect of our business, and Mr. Knudson, as the founding chairman of theBusiness Council for Sustainable Development, brings to our board significant experience and knowledge in this area. Mr. Knudson alsohas significant knowledge of local, state, and regional issues involving Texas, a state where we have important operations and assets.
PR
OXY
6 MDU Resources Group, Inc. Proxy Statement

Proxy StatementP
RO
XY
Richard H. Lewis Director Since 2005Age 60 Audit Committee
Nominating and Governance Committee
Mr. Lewis has been the managing general partner of Brakemaka LLLP, a private investment partnership formanaging family investments, and president of the Lewis Family Foundation since August 2004. Mr. Lewisserves as chairman of the board of Entre Pure Industries, Inc., a privately held company involved in thepurified water and ice business. He serves as a director of Colorado State Bank and Trust and on thesenior advisory board of TPH Partners, L.P., a private equity fund with an energy-only focus. Mr. Lewisfounded Prima Energy Corporation, a natural gas and oil exploration and production company in 1980,and served as chairman and chief executive officer of the company until its sale in July 2004. During his
tenure, Prima Energy was named to Forbes Magazine’s 200 Best Small Companies in America list seven times and was ranked the No. 1Colorado public company for the decade of the 1990’s in terms of market return. Mr. Lewis represented natural gas producers on a panelthat studied electric restructuring in Colorado and has testified before Congressional committees on industry matters. He worked in privatepractice as a certified public accountant for eight years prior to founding Prima Energy.
Mr. Lewis has a bachelor’s degree in finance and accounting from the University of Colorado. He served as a board member on theColorado Oil and Gas Association from November 1999 to November 2009, including a term as its president. In 2000, Mr. Lewis wasinducted into the Ernst & Young Entrepreneur of the Year Hall of Fame and in 2004 was inducted into the Rocky Mountain Oil and GasHall of Fame. Mr. Lewis serves as the chairman of the Development Board of Colorado Uplift, a non-profit organization whose mission is tobuild long-term, life-changing relationships with urban youth. He also serves on the Board of Trustees of Alliance for Choice in Education,which provides scholarships to inner city youth. He has also served on the Board of Trustees of the Metro Denver YMCA, the AdvisoryCouncil to the Leeds School of Business at the University of Colorado, and as a director for the Partnership for the West.
For the following reasons, the board concluded that Mr. Lewis should serve as a director of MDU Resources Group, Inc., in light of ourbusiness and structure, at the time we file our proxy statement. MDU Resources Group, Inc. derives a significant portion of its earningsfrom natural gas and oil production, one of our business segments. Mr. Lewis has extensive business experience, recognized excellence,and demonstrated success in this industry through almost 25 years at his company, Prima Energy Corporation, and ten years on the boardof the Colorado Oil and Gas Association. In addition to his industry experience, he brings investment experience to our board through hisservice on the senior advisory board of TPH Partners, L.P., an energy-only private equity fund. As a certified public accountant and adirector of Colorado State Bank and Trust, Mr. Lewis also contributes significant finance and accounting knowledge to our board and auditcommittee. Mr. Lewis also brings to the board his knowledge of local, state, and regional issues involving Colorado and the Rocky Mountainregion, where we have important operations.
Patricia L. Moss Director Since 2003Age 56 Compensation Committee
Ms. Moss has served as the president and chief executive officer of Cascade Bancorp, a financial holdingcompany in Bend, Oregon, since 1998, chief executive officer of Cascade Bancorp’s principal subsidiary,Bank of the Cascades, since 1993, serving also as president from 1993 to 2003, and a director ofCascade Bancorp since 1993. She also serves as a director of the Oregon Investment Fund AdvisoryCouncil, a state-sponsored program to encourage the growth of small businesses within Oregon, and adirector of Clear Choice Health Plans Inc., a multi-state insurance company.
Ms. Moss graduated magna cum laude with a bachelor of science degree in business administration fromLinfield College in Oregon and did master’s studies at Portland State University. She received commercial banking school certification atthe ABA Commercial Banking School at the University of Oklahoma. She served as a director of the Oregon Business Council, whosemission is to mobilize business leaders to contribute to Oregon’s quality of life and economic prosperity; the Cascades Campus AdvisoryBoard of the Oregon State University; the North Pacific Group, Inc., a wholesale distributor of building materials, industrial and hardwoodproducts, and other specialty products; the Aquila Tax Free Trust of Oregon, a mutual fund created especially for the benefit of Oregonresidents; and as a director and chair of the St. Charles Medical Center.
In August 2009, the Federal Deposit Insurance Corporation and the Oregon Division of Finance and Corporate Securities entered into aconsent agreement with Bank of the Cascades that requires the bank to develop and adopt a plan to maintain the capital necessary for itto be “well-capitalized,” to improve its lending policies and its allowance for loan losses, to increase its liquidity, to retain qualified
MDU Resources Group, Inc. Proxy Statement 7
Proxy Statement
management, and to increase the participation of its board of directors in the affairs of the bank. In October 2009, the bank’s parent,Cascade Bancorp, entered into a written agreement with the Federal Reserve Bank of San Francisco and the Oregon Division relatinglargely to improving the financial condition of Cascade Bancorp and the Bank of the Cascades.
For the following reasons, the board concluded that Ms. Moss should serve as a director of MDU Resources Group, Inc., in light of ourbusiness and structure, at the time we file our proxy statement. A significant portion of MDU Resources Group, Inc.’s utility, constructionservices, and contracting operations are located in the Pacific Northwest. Ms. Moss has first-hand business experience and knowledgeof the Pacific Northwest economy and local, state, and regional issues through her position as president, chief executive officer, and adirector at Cascade Bancorp and Bank of the Cascades, where she has over 28 years of experience. Ms. Moss provides to our board herexperience in finance and banking as well as her experience in business development through her work at Cascade Bancorp and on theOregon Investment Advisory Council and the Oregon Business Council. Ms. Moss is also certified as a Senior Professional in HumanResources, which makes her well-suited for our compensation committee. In deciding that Ms. Moss should be renominated as a director,the board was mindful of the consent agreement with Bank of the Cascades, but concluded that Ms. Moss brought the many skills andexperiences discussed above to our board and had proved herself to be a dedicated and hard-working director.
Harry J. Pearce Director Since 1997Age 67 Chairman of the Board
Mr. Pearce was elected chairman of the board of the company on August 17, 2006. Prior to that, he servedas lead director effective February 15, 2001 and was vice chairman of the board from November 16, 2000until February 15, 2001. Mr. Pearce has been a director of Marriott International, Inc., a major hotel chain,since 1995. He was a director of Nortel Networks Corporation, a global telecommunications company,from January 11, 2005 to August 10, 2009, serving as chairman of the board from June 29, 2005. Heretired on December 19, 2003, as chairman of Hughes Electronics Corporation, a General MotorsCorporation subsidiary and provider of digital television entertainment, broadband satellite network, andglobal video and data broadcasting. He had served as chairman since June 1, 2001. Mr. Pearce was vice
chairman and a director of General Motors Corporation, one of the world’s largest automakers, from January 1, 1996 to May 31, 2001. Heserved on the President’s Council on Sustainable Development and co-chaired the President’s Commission on the United States PostalService. Prior to joining General Motors, he was a senior partner in the Pearce & Durick law firm in Bismarck, North Dakota. Mr. Pearceis a director of the United States Air Force Academy Endowment, and a member of the Advisory Board of the University of MichiganCancer Center. He is a Fellow of the American College of Trial Lawyers and a member of the International Society of Barristers. He alsoserves on the Board of Trustees of Northwestern University. He has served as a chairman or director on the boards of numerous nonprofitorganizations, including as chairman of the board of Visitors of the U.S. Air Force Academy, chairman of the National Defense UniversityFoundation, and chairman of the Marrow Foundation. He currently serves as a director of the National Bone Marrow Transplant Link andNew York Marrow Foundation. Mr. Pearce received a bachelor’s degree in engineering sciences from the U.S. Air Force Academy and hislaw degree from Northwestern University’s School of Law.
For the following reasons, the board concluded that Mr. Pearce should serve as a director of MDU Resources Group, Inc., in light of ourbusiness and structure, at the time we file our proxy statement. MDU Resources Group, Inc. values public company leadership andthe experience directors gain through such leadership. Mr. Pearce is recognized nationally as well as in the State of North Dakota as abusiness leader and for his business acumen. He has multinational business management experience and proven leadership skillsthrough his position as vice chairman at General Motors Corporation, as well as through his extensive service on the boards of large publiccompanies, including Marriott International Inc.; Hughes Electronics Corporation, where he was chairman; and Nortel NetworksCorporation, where he also was chairman. He also brings to our board his long experience as a practicing attorney. In addition, Mr. Pearceis focused on corporate governance issues and is the founding chair of the Chairmen’s Forum, an organization comprised of non-executivechairmen of publicly-traded companies. Participants in the Chairmen’s Forum discuss ways to enhance the accountability of corporationsto owners and promote a deeper understanding of independent board leadership and effective practices of board chairmanship. Theboard also believes that Mr. Pearce’s values and commitment to excellence make him well-suited to serve as chairman of our board.
PR
OXY
8 MDU Resources Group, Inc. Proxy Statement

Proxy StatementP
RO
XY
John K. Wilson Director Since 2003Age 55 Audit Committee
Mr. Wilson was president of Durham Resources, LLC, a privately held financial management company, inOmaha, Nebraska, from 1994 to December 31, 2008. He previously was president of Great Plains EnergyCorp., a public utility holding company and an affiliate of Durham Resources, LLC, from 1994 to July 1,2000. He was vice president of Great Plains Natural Gas Co., an affiliate company of Durham Resources,LLC, until July 1, 2000. The company bought Great Plains Energy Corp. and Great Plains Natural Gas Co.on July 1, 2000. Mr. Wilson also served as president of the Durham Foundation and was a director ofBridges Investment Fund, a mutual fund, and the Greater Omaha Chamber of Commerce. He is presentlya director of HDR, Inc., an international architecture and engineering firm based in Omaha, and serves on
the advisory boards of US Bank NA Omaha and Duncan Aviation, an aircraft service provider, headquartered in Lincoln, Nebraska. He alsoserves as deputy director of the Robert B. Daugherty Charitable Foundation.
Mr. Wilson is a certified public accountant. He received his bachelor’s degree in business administration, cum laude, from the University ofNebraska – Omaha. During his career, he was a member of the audit staff and an audit manager at Peat, Marwick, Mitchell (now known asKPMG), controller for Great Plains Natural Gas Co., and chief financial officer and treasurer for all Durham Resources entities.
For the following reasons, the board concluded that Mr. Wilson should serve as a director of MDU Resources Group, Inc., in light of ourbusiness and structure, at the time we file our proxy statement. Mr. Wilson has an extensive background in finance and accounting aswell as extensive experience with mergers and acquisitions through his education and work experience at a major accounting firm andhis later positions as controller and vice president of Great Plains Natural Gas Co.; president of Great Plains Energy Corp.; and president,chief financial officer, and treasurer for Durham Resources, LLC and all Durham Resources entities. The electric and natural gas utilitybusiness was our core business when our company was founded in 1924. That business now operates through four utilities: Montana-Dakota Utilities Co., Great Plains Natural Gas Co., Cascade Natural Gas Corporation, and Intermountain Gas Company. Mr. Wilson is ouronly non-employee director with direct experience in this area through his prior positions at Great Plains Natural Gas Co. and Great PlainsEnergy Corp. In addition, Mr. Wilson’s extensive finance and accounting experience make him well-suited for our audit committee.
The board of directors recommends a vote “for” each nominee.
A majority of votes cast is required to elect a director in an uncontested election. A majority of votes cast means the number of votes cast“for” a director’s election must exceed the number of votes cast “against” the director’s election. “Abstentions” and “broker non-votes”do not count as votes cast “for” or “against” the director’s election. In a contested election, which is an election in which the number ofnominees for director exceeds the number of directors to be elected and which we do not anticipate, directors will be elected by a pluralityof the votes cast.
Unless you specify otherwise when you submit your proxy, the proxies will vote your shares of common stock “for” all directors nominatedby the board of directors. If a nominee becomes unavailable for any reason or if a vacancy should occur before the election, which we donot anticipate, the proxies will vote your shares in their discretion for another person nominated by the board.
Our policy on majority voting for directors and our corporate governance guidelines require any nominee for re-election as a director totender to the board, prior to nomination, his or her irrevocable resignation from the board that will be effective, in an uncontested electionof directors only, upon:
• receipt of a greater number of votes “against” than votes “for” election at our annual meeting of stockholders and
• acceptance of such resignation by the board of directors.
Following certification of the stockholder vote, the nominating and governance committee will promptly recommend to the board whetheror not to accept the tendered resignation. The board will act on the nominating and governance committee’s recommendation no laterthan 90 days following the date of the annual meeting.
Please note that the New York Stock Exchange rules have changed. Brokers may not vote your shares on the election of directors if you havenot given your broker specific instructions as to how to vote. Please be sure to give specific voting instructions to your broker so that yourvote can be counted.
MDU Resources Group, Inc. Proxy Statement 9

Proxy Statement
ITEM 2. REPEAL OF ARTICLE TWELFTH OF OUR RESTATED CERTIFICATE OF INCORPORATION,WHICH CONTAINS PROVISIONS RELATING TO BUSINESS COMBINATIONS WITH INTERESTEDSTOCKHOLDERS, AND RELATED AMENDMENTS TO ARTICLES THIRTEENTH AND FOURTEENTH
In November 2009, we received a stockholder proposal requesting that the board of directors take the steps necessary to change thestockholder vote requirements that call for a greater than simple majority vote in our restated certificate of incorporation, as amended, andbylaws to a majority of votes cast for or against any proposal.
Article TWELFTH of our restated certificate of incorporation, which has “fair price” provisions relating to business combinations withinterested stockholders, contains a supermajority vote requirement. Article TWELFTH provides that, unless the transaction is approvedby two-thirds of the continuing directors, the fair price and procedural requirements of article TWELFTH will apply to the businesscombination, and the business combination must be approved by at least 80% of the voting power of the outstanding voting stock.In this proxy statement, we sometimes refer to the provisions of article TWELFTH as the “fair price” provisions.
Article TWELFTH requires the affirmative vote of at least 80% of the voting power of our outstanding voting stock to approve certaintransactions involving an “interested stockholder,” which is a person or group that beneficially owns more than 10% of our outstandingvoting stock.
The supermajority vote requirement applies to the following transactions:
• a merger or consolidation with an interested stockholder
• a sale, lease, exchange or other disposition of assets of the company with an aggregate fair market value of $5 million or more to aninterested stockholder
• the issuance of securities by the company with an aggregate fair market value of $5 million or more to an interested stockholder
• a voluntary plan of liquidation or dissolution proposed by an interested stockholder and
• a reclassification, recapitalization, merger or any other transaction that increases the proportionate share of outstanding shares of thecompany owned by an interested stockholder.
The supermajority vote requirement does not apply to transactions that have been approved by two-thirds of the continuing directors.Continuing directors are members of the board who are unaffiliated with, and not nominees of, an interested stockholder and who weremembers of the board prior to the time the interested stockholder became an interested stockholder. Continuing directors also includedirectors designated to succeed continuing directors.
We added article TWELFTH to our restated certificate of incorporation in 1985. As we discussed in our proxy statement at that time, therehad been a number of instances in which an unsolicited bidder had acquired control of a company over the objections of managementand, after acquiring control, had compelled a merger, consolidation or sale of assets without an arm’s length negotiation of the terms.While tender offers or other takeover attempts could be made at a price substantially above the market price of a company’s commonstock, they frequently were made for less than all of the outstanding shares of a target company. Such partial offers could presentstockholders with the alternative of either partially liquidating their investment at a time when that may be disadvantageous or retainingan investment in an enterprise under new management whose objectives may differ from those of the remaining stockholders. ArticleTWELFTH was designed to deal with then recently-developed takeover strategies such as two-tiered transactions that often resulted ininequitable treatment of long-term stockholders. Article TWELFTH was designed to encourage a person making an unsolicited bid for thecompany to negotiate with our board of directors to reach terms that were fair and in the best interests of the stockholders.
In more recent years, however, some investors have viewed fair price provisions as inconsistent with principles of good corporategovernance and believe that these provisions make it more difficult for stockholders to effect change and participate in important decisionsaffecting the company. These investors believe that the supermajority vote requirement that is part of the fair price provisions limits theability of a majority of stockholders to effect change by providing a veto right to a large minority stockholder or group of stockholders. Theyalso assert that supermajority vote provisions cause boards and management to be less responsive or accountable to stockholders. Othershave argued that supermajority vote requirements not only offer little, if any, protection to minority stockholders, but also have the effect ofdiscouraging legitimate offers for a company by making them more expensive.
After receiving the stockholder proposal, the board of directors reviewed the advantages and disadvantages of the provisions contained inarticle TWELFTH and after this review decided to propose the repeal of article TWELFTH to further our goal of ensuring that our corporategovernance policies maximize our accountability to stockholders.
PR
OXY
10 MDU Resources Group, Inc. Proxy Statement
Proxy StatementP
RO
XY
The company will continue to be subject to Section 203 of the Delaware General Corporation Law, whether or not the proposedamendments are approved. With some exceptions, Section 203 provides that a business combination, as defined in Section 203, withan interested stockholder, which is a person owning 15% or more of a company’s outstanding voting stock, cannot be completed for athree-year period after the date the person became an interested stockholder, unless
• prior to the time the person became an interested stockholder, the board of directors approved either the business combination or thetransaction that resulted in the person becoming an interested stockholder
• upon consummation of the transaction that resulted in the person becoming an interested stockholder, that person owned at least 85%of the outstanding voting stock, excluding certain shares or
• the business combination was approved by the board of directors and by at least two-thirds of the outstanding voting stock not owned bythe interested stockholder.
In addition to the deletion of article TWELFTH, the board of directors has proposed related amendments to articles THIRTEENTH andFOURTEENTH of our restated certificate of incorporation. These amendments add to article THIRTEENTH some definitions of termscurrently included in article TWELFTH that are relevant to other articles of our restated certificate of incorporation. These definitions ofterms have been modified to reflect the repeal of article TWELFTH. In addition, in article FOURTEENTH, the amendments substitute theterm “business combination” that was previously defined in article TWELFTH with a description of the term’s meaning, which is no longerlimited to transactions with “interested stockholders.”
The board of directors has approved the proposed amendments to our restated certificate of incorporation described above. The boardresolution setting forth the proposed amendments to our restated certificate of incorporation is included in Exhibit A to this proxy statementand shows the changes that would result from the amendments. If approved by our stockholders, the amendments will become effectiveupon filing with the Secretary of State of the State of Delaware, which filing we would make promptly after the annual meeting.
The board of directors recommends a vote “for” the proposal to repeal article TWELFTH of our restated certificate of incorporation, which contains provisions relating to business combinations with interested stockholders,
and related amendments to articles THIRTEENTH and FOURTEENTH.
Approval requires the affirmative vote of a majority of the outstanding shares of common stock. Abstentions will count as votes againstthis proposal.
ITEM 3. REPEAL OF ARTICLE FIFTEENTH OF OUR RESTATED CERTIFICATE OF INCORPORATION,WHICH CONTAINS SUPERMAJORITY VOTE REQUIREMENTS FOR AMENDMENTS TO CERTAIN ARTICLESOF OUR RESTATED CERTIFICATE OF INCORPORATION
As discussed above under Item 2, in November 2009, we received a stockholder proposal requesting that the board of directors take thesteps necessary to change the stockholder vote requirements that call for a greater than simple majority vote in our restated certificate ofincorporation and bylaws to a majority of votes cast for or against any proposal.
Article FIFTEENTH of our restated certificate of incorporation, as amended, requires the affirmative vote of at least 80% of the voting powerof the outstanding voting stock to amend, alter, change or repeal, or to adopt any provision inconsistent with, the following provisions of ourrestated certificate of incorporation:
• article TWELFTH, which contains provisions relating to business combinations with interested stockholders and includes a supermajorityvote requirement. As described under Item 2 above, article TWELFTH is proposed to be deleted.
• article THIRTEENTH, which contains provisions relating to the board of directors and establishes the range for the number of directorson the board, the authority of the board to fix the exact number of directors within the range, the provisions for annual election ofdirectors, and the authority of the board to fill vacancies or newly created directorships
• article FOURTEENTH, which sets forth a list of factors for the board of directors to consider in evaluating a proposal by another party tomake a tender or exchange offer for securities of the company or to effect a merger, consolidation or other business combination withthe company
• article FIFTEENTH itself and
• article SIXTEENTH, which contains provisions setting forth how stockholder action must be effected and who is entitled to call specialmeetings of stockholders.
MDU Resources Group, Inc. Proxy Statement 11
Proxy Statement
The supermajority vote requirement does not apply to amendments that are recommended to stockholders by two-thirds of thecontinuing directors.
We added article FIFTEENTH to our restated certificate of incorporation in 1985. The supermajority vote requirement was intended toprevent one or more stockholders controlling a simple majority of our voting stock from repealing the fair price and other provisionsreferred to in article FIFTEENTH and to give minority stockholders holding in the aggregate in excess of 20% of the voting power the abilityto prevent amendments to the fair price and other provisions referred to in article FIFTEENTH.
However, as with fair price provisions, in more recent years, some investors have viewed supermajority vote requirements as inconsistentwith principles of good corporate governance and argue that such provisions make it more difficult for stockholders to effect change andparticipate in important decisions affecting the company. These investors believe that supermajority vote requirements limit the ability ofa majority of stockholders to effect change by providing a veto right to a large minority stockholder or group of stockholders. They alsoassert that supermajority vote provisions cause boards and management to be less responsive or accountable to stockholders. Othershave argued that supermajority vote requirements not only offer little, if any, protection to minority stockholders, but also have the effectof discouraging legitimate offers for the company by making them more expensive. A number of major corporations have determinedthat, regardless of the merits of supermajority vote provisions, principles of good corporate governance dictate that such requirementsbe eliminated.
After receiving the stockholder proposal, the board of directors reviewed the advantages and disadvantages of supermajority voterequirements contained in article FIFTEENTH and, after this review, decided to propose the repeal of article FIFTEENTH to further ourgoal of ensuring that our corporate governance policies maximize our accountability to stockholders.
If article FIFTEENTH is repealed, the stockholder vote required to approve amendments to the provisions of our restated articles ofincorporation identified in article FIFTEENTH that are not recommended to stockholders by two-thirds of our continuing directors would bereduced from an 80% supermajority vote to a majority of our outstanding voting stock. Section 242(b) of the Delaware General CorporationLaw would apply to all amendments to our restated certificate of incorporation and require that charter amendments be approved by amajority of the outstanding stock entitled to vote thereon and by a majority of the outstanding stock of each class entitled to vote thereonas a class, unless the Delaware General Corporation Law or our restated certificate of incorporation specifically provides for a greaterthan majority vote.
The board of directors has approved the proposed amendment as described above. The board resolution setting forth the proposedamendment to our restated certificate of incorporation is included in Exhibit A to this proxy statement and shows the changes that wouldresult from the amendment. If approved by our stockholders, the amendment will become effective upon filing with the Secretary of Stateof the State of Delaware, which filing we would make promptly after the annual meeting.
The board of directors recommends a vote “for” the proposal to repeal article FIFTEENTH of our restatedcertificate of incorporation, which contains supermajority vote requirements for amendments to certain
articles of our restated certificate of incorporation.
Approval requires the affirmative vote of a majority of the outstanding shares of common stock. Abstentions will count as votes againstthis proposal.
ITEM 4. REPEAL OF SECTION (c) OF ARTICLE THIRTEENTH OF OUR RESTATED CERTIFICATE OFINCORPORATION, WHICH PROVIDES THAT DIRECTORS MAY BE REMOVED BY STOCKHOLDERS ONLYFOR CAUSE, AND TECHNICAL AMENDMENTS TO SECTION (a) OF ARTICLE THIRTEENTH
Section (c) of article THIRTEENTH of our restated certificate of incorporation, as amended, provides that any director or the entire board ofdirectors may be removed by stockholders only for cause and sets forth the requirements for such removal.
In 2007, our board of directors proposed and our stockholders approved the declassification of our board. The declassification hasbeen phased in over a three-year period from 2008 to 2010. Directors elected at our 2007 annual meeting comprise the last class ofdirectors elected to serve a three-year term, and their terms will expire with this year’s annual meeting. As a result, commencing with thisyear’s annual meeting, our board will be completely declassified, and all directors at this year’s annual meeting will be elected to serve one-year terms.
PR
OXY
12 MDU Resources Group, Inc. Proxy Statement

Proxy StatementP
RO
XY
With the completion of the declassification of our board, section (c) of article THIRTEENTH will not be consistent with Section 141(k) ofthe Delaware General Corporation Law, which provides that the right of stockholders to remove directors may not be limited to removal forcause unless the board is classified.
The board of directors has therefore proposed to repeal section (c) of article THIRTEENTH and to make technical amendments to section(a) of article THIRTEENTH.
The board of directors has approved the proposed amendments to our restated certificate of incorporation described above. The boardresolution setting forth the proposed amendments to our restated certificate of incorporation is included in Exhibit A to this proxy statementand shows the changes that would result from the amendments. If approved by our stockholders, the amendments will become effectiveupon filing with the Secretary of State of the State of Delaware, which filing we would make promptly after the annual meeting. However,even if our stockholders do not approve the repeal of section (c), it will no longer have any effect because its provisions will be inconsistentwith the Delaware General Corporation Law.
The board of directors recommends a vote “for” the proposal to repeal section (c) of article THIRTEENTH of our restated certificate of incorporation, which provides that directors may be removed by stockholders
only for cause, and technical amendments to section (a) of article THIRTEENTH.
Approval requires the affirmative vote of a majority of the outstanding shares of common stock. Abstentions will count as votes againstthis proposal.
ITEM 5. RATIFICATION OF INDEPENDENT AUDITORS
The audit committee at its February 2010 meeting appointed Deloitte & Touche LLP as our independent auditors for fiscal year 2010.The board of directors concurred with the audit committee’s decision. Deloitte & Touche LLP has served as our independent auditors sincefiscal year 2002.
Although your ratification vote will not affect the appointment or retention of Deloitte & Touche LLP for 2010, the audit committee willconsider your vote in determining its appointment of our independent auditors for the next fiscal year. The audit committee, in appointingour independent auditors, reserves the right, in its sole discretion, to change an appointment at any time during a fiscal year if itdetermines that such a change would be in our best interests.
A representative of Deloitte & Touche LLP will be present at the annual meeting and will be available to respond to appropriate questions.We do not anticipate that the representative will make a prepared statement at the meeting; however, he or she will be free to do so if he orshe chooses.
The board of directors recommends a vote “for” the ratification ofDeloitte & Touche LLP as our independent auditors for 2010.
Ratification of the appointment of Deloitte & Touche LLP as our independent auditors for 2010 requires the affirmative vote of a majority ofour common stock present in person or represented by proxy at the meeting and entitled to vote on the proposal. Abstentions will count asvotes against this proposal.
In connection with the audit of our financial statements for 2010, the parties have drafted an agreement for audit committee approval thatcontains provisions for alternative dispute resolution and for the exclusion of punitive damages. The agreement provides that disputesarising out of our engagement of Deloitte & Touche LLP are resolved through mediation or arbitration, commonly referred to as alternativedispute resolution procedures, and that the company’s and Deloitte & Touche LLP’s rights to pursue punitive damages or other forms ofrelief not based upon actual damages are waived. The alternative dispute resolution provisions do not apply to claims by third parties, suchas our stockholders or creditors.
MDU Resources Group, Inc. Proxy Statement 13
Proxy Statement
ACCOUNTING AND AUDITING MATTERS
FeesThe following table summarizes the aggregate fees that our independent auditors, Deloitte & Touche LLP, billed or are expected to bill usfor professional services rendered for 2009 and 2008:
2009 2008*
Audit Fees(a) $2,393,800 $2,535,253Audit-Related Fees(b) 52,292 78,511Tax Fees(c) 17,600 33,653All Other Fees(d) 130,016 0
Total Fees(e) $2,593,708 $2,647,417
Ratio of Tax and All Other Fees to Audit and Audit-Related Fees 6.03% 1.29%
* The 2008 amounts were adjusted from amounts shown in the 2009 proxy statement to reflect actual amounts.(a) Audit fees for both 2009 and 2008 consisted of services rendered for the audit of our annual financial statements;
reviews of our quarterly financial statements; comfort letters; statutory and regulatory audits and consents and otherservices related to Securities and Exchange Commission matters.
(b) Audit-related fees for 2009 are associated with the audit of the Intermountain Gas Company’s benefit plans andaccounting research assistance. Audit-related fees for 2008 are associated with accounting research assistance;consultation on accounting process improvements, including recommended practices and opportunities for controlimprovement; and assistance in the transition of benefit plan audits to another accounting firm.
(c) Tax fees for 2009 include support services associated with the Cascade Natural Gas Corporation IRS audit. Tax fees for2008 are associated with tax planning, compliance, and support services.
(d) All other fees for 2009 are for services provided by Deloitte FAS, LLP in connection with the review of accountingpractices and procedures at one of the company’s operating locations. No fees under the category of all other fees wereincurred during 2008.
(e) Total fees reported above include out-of-pocket expenses related to the services provided of $267,708 for 2009 and $269,618 for 2008.
Pre-Approval PolicyThe audit committee pre-approved all services Deloitte & Touche LLP performed in 2009 in accordance with the pre-approval policy andprocedures the audit committee adopted at its August 12, 2003 meeting. This policy is designed to achieve the continued independenceof Deloitte & Touche LLP and to assist in our compliance with Sections 201 and 202 of the Sarbanes-Oxley Act of 2002 and related rulesof the Securities and Exchange Commission.
The policy defines the permitted services in each of the audit, audit-related, tax and all other services categories as well as prohibitedservices. The pre-approval policy requires management to submit annually for approval to the audit committee a service plan describingthe scope of work and anticipated cost associated with each category of service. At each regular audit committee meeting, managementreports on services performed by Deloitte & Touche LLP and the fees paid or accrued through the end of the quarter preceding themeeting. Management may submit requests for additional permitted services before the next scheduled audit committee meeting to thedesignated member of the audit committee, Dennis W. Johnson, for approval. The designated member updates the audit committee atthe next regularly scheduled meeting regarding any services that he approved during the interim period. At each regular audit committeemeeting, management may submit to the audit committee for approval a supplement to the service plan containing any request foradditional permitted services.
In addition, prior to approving any request for audit-related, tax or all other services of more than $50,000, Deloitte & Touche LLP willprovide a statement setting forth the reasons why rendering of the proposed services does not compromise Deloitte & Touche LLP’sindependence. This description and statement by Deloitte & Touche LLP may be incorporated into the service plan or as an exhibit theretoor may be delivered in a separate written statement.
ITEM 6. STOCKHOLDER PROPOSAL REQUESTING A REPORT ON COAL COMBUSTION WASTE
A stockholder has notified us that it intends to present a resolution for action by the stockholders at the annual meeting. We will providethe name, address and stock ownership of the proponent to stockholders promptly after receiving an oral or written request. The text of theresolution and the supporting statement submitted by the proponent are as follows.
PR
OXY
14 MDU Resources Group, Inc. Proxy Statement

Proxy StatementP
RO
XY
Stockholder Proposal
Report On Risks Associated With Coal Combustion Waste
WHEREAS: Coal combustion waste (CCW) is a by-product of burning coal that contains high concentrations of arsenic, mercury,heavy metals and other toxins that pollution control equipment filters out of smokestacks. Across the country, over 130 milliontons of CCW are being stored in surface waste ponds, impoundments and abandoned mines.
Our company’s electricity generation mix is 54% coal, 17% Gas, 4% Renewables, and 26% Purchasedpower/capacity agreements.
According to the company, our company operates CCW impoundment sites. CCW is therefore a significant issue forour company.
In 2007, the U.S. Environmental Protection Agency (EPA) published a draft risk assessment that found extremely highrisks to human health from the disposal of CCW in waste ponds and landfills. EPA’s analyses of the behavior of CCW inunlined disposal sites predict that some metals will migrate and contaminate nearby groundwater to levels extremelydangerous to people.
The EPA has found ample evidence at over 60 sites in the U.S. that CCW has polluted ground and surface waters.
EPA has identified over 580 CCW impoundment facilities around the country. At least 49 of these have been labeled“high hazard potential” sites where a dam breach and subsequent spill of CCW material would likely result in a loss ofhuman life and significant environmental consequences.
Recent reports by the New York Times and others have drawn attention to the impactful presence of CCW in thenation’s air and waterways, through leakage from CCW impoundments and through direct discharge to surroundingrivers and streams.
The Tennessee Valley Authority’s (TVA) 1.1 billion gallon CCW spill in December 2008 that covered over 300 acres ineastern Tennessee with toxic sludge highlights the serious environmental risks associated with storing CCW. TVAestimates a total cleanup cost of $1.2 billion. This figure does not contain the extensive litigation costs that ensued,including the large class action lawsuit filed against TVA in February 2009.
EPA officials have indicated that the agency will determine by the end of 2009 whether certain power plant by-products such as coal ash should be treated as hazardous waste, which would subject CCW to stricter regulations.
RESOLVED: Shareholders request that the board prepare a report, at reasonable cost and omitting proprietaryinformation, on the company’s efforts, above and beyond legal compliance, to reduce environmental and healthhazards associated with coal combustion waste ponds, impoundments and mines, and how those efforts reduce risksto the company’s finance and operations. This report should be available to shareholders by August 2010.
Company Response
The board of directors recommends a vote “against” this proposal.
Our company and Montana-Dakota Utilities Co., a division of our company (“Montana-Dakota”), are committed to environmentalstewardship and compliance with all applicable environmental laws and regulations.
Our company has three primary environmental goals:
• minimize waste and maximize resources
• support environmental laws and regulations that are based on sound science and cost-effective technology and
• comply with or exceed all applicable environmental laws, regulations and permit requirements.
Montana-Dakota’s electric operations are subject to federal, state and local laws and regulations providing for air, water and solid wastepollution control; federal health and safety regulations; and state hazard communication standards.
MDU Resources Group, Inc. Proxy Statement 15
Proxy Statement
The Environmental Protection Agency (“EPA”) has previously determined that fossil fuel combustion wastes, including coal combustionwaste (“CCW”), did not warrant regulation as a hazardous waste and exempted them from regulation under Subtitle C (hazardous waste)of the Resource Conservation and Recovery Act (“RCRA”). However, CCW disposed of in landfills and surface impoundments isregulated under Subtitle D (solid waste regulations) of the RCRA, and CCW used as minefill is regulated under Subtitle D and/or underthe Surface Mining Control and Reclamation Act. The EPA announced its intention to propose new regulations in December 2009governing management and storage of CCW in landfills and surface impoundments and to determine whether to continue to regulateCCW as a non-hazardous solid waste under Subtitle D or to designate it as hazardous and regulate it under Subtitle C of the RCRA. InDecember 2009, however, the EPA announced that it was deferring taking action on this for a short period of time due to the complexityof the analysis. The EPA has also announced its intention to revise existing standards under the Clean Water Act, which would includedischarge from CCW ponds.
Four of Montana-Dakota’s nine existing electric generating stations have steam turbines using coal for fuel. Montana-Dakota will also obtainelectricity from Wygen III, a coal-fired electric generating station, when it becomes operational in spring 2010. Two stations, Coyote andHeskett, are located in North Dakota; Big Stone is located in South Dakota; Lewis & Clark is located in Montana; and Wygen III is locatedin Wyoming. Montana-Dakota is the owner and operator of Heskett and Lewis & Clark and has a 25 percent interest in Coyote, a 22.7percent ownership interest in Big Stone and a 25 percent interest in Wygen III. CCW at these facilities is managed either in a wet state inponds with dry disposal, or entirely in a dry state.
The states of North Dakota, South Dakota, and Wyoming have regulations relating to CCW that far exceed any current federal regulations.North Dakota, South Dakota, and Wyoming require facilities located within each state - Coyote and Heskett in North Dakota, Big Stone inSouth Dakota, and Wygen III in Wyoming - to obtain permits for managing CCW impoundments and for long-term CCW disposal. Thepermits for each facility require that impoundments for CCW be appropriately designed and that ground water be monitored. Site staff andstate environmental agency staff routinely inspect each site. Annual reports for these facilities, summarizing ground water results andactivities conducted at these sites, are submitted to each respective regulatory agency: North Dakota Department of Health, South DakotaDepartment of Environment and Natural Resources, and Wyoming Department of Environmental Quality.
While the state of Montana has no requirements at this time for managing CCW, Montana-Dakota has adopted what it considers to be“best practices” at the Lewis & Clark Station, where it manages CCW in ponds and dewaters the waste prior to ultimate dry disposal at anaturally clay lined disposal area adjacent to the mine from which the plant receives its coal.
The ponds were designed and constructed under the supervision of a consulting professional engineer, requiring liners (clay or highdensity polyethylene), and appropriate stability and erosion prevention measures. There are ground water monitoring wells, which aresampled semiannually.
There are also weekly visual inspections of the ponds by plant technicians and a biennial visual inspection by the Montana Department ofEnvironmental Quality Water Protection Bureau. The yard crews inspect the ash handling system daily, and in winter, the inspections areconducted twice daily.
The board of directors respects our stockholders’ interest in environmental and health matters. However, the board believes that Montana-Dakota has already taken appropriate actions to manage its CCW and that the investment of human and financial resources that would berequired to produce such a report would not be a necessary or prudent use of stockholder assets.
Therefore, the board of directors recommends a vote “against” this proposal.
Approval requires the affirmative vote of a majority of our common stock present in person or represented by proxy at the meeting andentitled to vote on the proposal. Abstentions will count as votes against this proposal. Broker non-votes are not counted as voting powerpresent and, therefore, are not counted in the vote.
PR
OXY
16 MDU Resources Group, Inc. Proxy Statement
Proxy StatementP
RO
XY
EXECUTIVE COMPENSATION
Compensation Discussion and Analysis
The following compensation discussion and analysis may contain statements regarding corporate performance targets and goals. Thesetargets and goals are disclosed in the limited context of our compensation programs and should not be understood to be statements ofmanagement’s expectations or estimates of results or other guidance. We specifically caution investors not to apply these statements toother contexts.
IntroductionIn this compensation discussion and analysis, we discuss our compensation objectives, our decisions, and the reasons for our decisionsrelating to 2009 compensation for our named executive officers.
For 2009, our named executive officers were Terry D. Hildestad, Vernon A. Raile, John G. Harp, William E. Schneider, and Steven L. Bietz.Mr. Bietz, president and chief executive officer of WBI Holdings, Inc., is a named executive officer for the first time.
Each year we conduct a strategic analysis to identify opportunities and challenges associated with the operating environments in which wedo business. Our strategy is to apply our expertise in three core lines of business – energy, construction materials, and utility resources – toincrease market share, increase profitability, and enhance stockholder value through:
• organic growth as well as a continued disciplined approach to the acquisition of well-managed companies and properties
• the elimination of system-wide cost redundancies through increased focus on integration of operations and standardization andconsolidation of various support services and functions across companies within the organization and
• the development of projects that are accretive to earnings per share and return on invested capital.
Objectives of our Compensation ProgramWe structure our compensation program to help retain and reward the executive officers who we believe are critical to our long-termsuccess. We have a written executive compensation policy for our Section 16 officers, including all our named executive officers. Ourpolicy has the following stated objectives:
• recruit, motivate, reward, and retain the high performing executive talent required to create superior long-term total stockholder return incomparison to our peer group
• reward executives for short-term performance as well as the growth in enterprise value over the long-term
• provide a competitive package relative to industry-specific and general industry comparisons and internal equity, as appropriate, and
• ensure effective utilization and development of talent by working in concert with other management processes – for example,performance appraisal, succession planning, and management development.
We pay/grant:
• base salaries in order to provide executive officers with sufficient, regularly-paid income and attract, recruit, and retain executives withthe knowledge, skills, and abilities necessary to successfully execute their job duties and responsibilities
• annual incentives in order to be competitive from a total remuneration standpoint and ensure focus on annual financial and operatingresults and
• long-term incentives in order to be competitive from a total remuneration standpoint and ensure focus on stockholder return.
If earned, incentive compensation, which consists of annual cash incentive awards and three-year performance share awards under ourLong-Term Performance-Based Incentive Plan, makes up the greatest portion of our named executive officers’ total compensation. Thecompensation committee believes incentive compensation that comprised approximately 61% to 71% of total target compensation for thenamed executive officers for 2009 is appropriate because:
• our named executive officers are in positions to drive, and therefore bear high levels of responsibility for, our corporate performance
• incentive compensation is more variable than base salary and dependent upon our performance
MDU Resources Group, Inc. Proxy Statement 17

Proxy Statement
• variable compensation helps ensure focus on the goals that are aligned with our overall strategy and
• the interests of our named executive officers will be aligned with those of our stockholders by making a majority of the named executiveofficers’ target compensation contingent upon results that are beneficial to stockholders.
The following table shows the allocation of total target compensation for 2009 among the individual components of base salary, annualincentive, and long-term incentive:
% of Total % of Total Target CompensationTarget Allocated to Incentives
CompensationAllocated to Annual +
Name Base Salary (%) Annual (%) Long-Term (%) Long-Term (%)
Terry D. Hildestad 28.6 28.6 42.8 71.4Vernon A. Raile 39.2 25.5 35.3 60.8John G. Harp * 39.2 25.5 35.3 60.8William E. Schneider 39.2 25.5 35.3 60.8Steven L. Bietz 39.2 25.5 35.3 60.8
* The percentages listed for Mr. Harp exclude the additional incentive opportunity of $200,000 in 2009, which is discussed in greaterdetail under the heading “John G. Harp’s Additional 2009 Incentive.” Including the additional incentive opportunity would yield thefollowing percentages: Base Salary, 33.4%; Annual Incentive, 36.5%; Long-Term Incentive, 30.1%; and Annual + Long-Term, 66.6%.
In order to reward long-term growth as well as short-term results, the compensation committee establishes incentive targets thatemphasize long-term compensation as much as or more than short-term compensation for all Section 16 officers. The annual incentivetargets for 2009 range from 30% to 100% of base salary and the long-term incentive targets range from 30% to 150% of base salary,depending on the executive’s salary grade. Generally, our approach is to allocate a higher percentage of total target compensation to thelong-term incentive than to the short-term incentive for our higher level executives, since they are in a better position to influence our long-term performance.
Additionally, the long-term incentive, if earned, is paid in company common stock. These awards, combined with our stockownership guidelines, promote ownership of our stock by the named executive officers. The compensation committee believes that,as stockholders, the named executive officers will be motivated to consistently deliver financial results that build wealth for all stockholdersover the long-term.
We also offer our Section 16 officers, including all of our named executive officers, benefits under our pension plans and our nonqualifieddefined benefit retirement plan, which we refer to as the Supplemental Income Security Plan or SISP. Historically, we have provided theseprograms because they have been instrumental in retaining executive talent; both have vesting requirements which call for minimumlengths of service to earn the full benefits. However, legislative changes relating to pension plans and cost reduction initiatives led tochanges in both the pension plans and the SISP. The SISP was also changed to ensure the reductions in defined benefit retirement planswere consistent between executive and non-executive employees. Specifically, benefit accruals under our pension plans ceased afterDecember 31, 2009. We discuss the modifications to both the pension plans and the SISP in the narrative following the “Pension Benefitsfor 2009” table.
All of our named executive officers have change of control employment agreements. The change of control employment agreements define“change of control” to include consummation of a merger or similar transaction rather than merely stockholder approval of the merger.
We believe it is important to encourage our executive officers to continue working for us during any change of control transaction periodsand to provide severance payments and benefits if employment is terminated for no fault of the officer following a change of control. Theseagreements provide a measure of job and financial security so that potentially disruptive transactions do not affect the officers’ judgmentwhen working on behalf of the company and its stockholders prior to and after a change of control. We do not view the change of controlagreements as additional compensation and do not take them into account when determining the amount of compensation providedbecause the events required to trigger these payments and benefits may never occur.
In addition to these agreements, the Long-Term Performance-Based Incentive Plan provides for accelerated vesting and payment ofperformance awards at the time of a change of control. In 2009, we amended the plan’s “change of control” definition so that vesting andpayment of awards are not triggered prematurely. The compensation committee believes that these protections are necessary to reassurethe officers that they will not lose prior incentive awards or otherwise be adversely affected by a change of control. We discuss theamendments to the plan’s change of control definition in “Potential Payments upon Termination or Change of Control.”
PR
OXY
18 MDU Resources Group, Inc. Proxy Statement
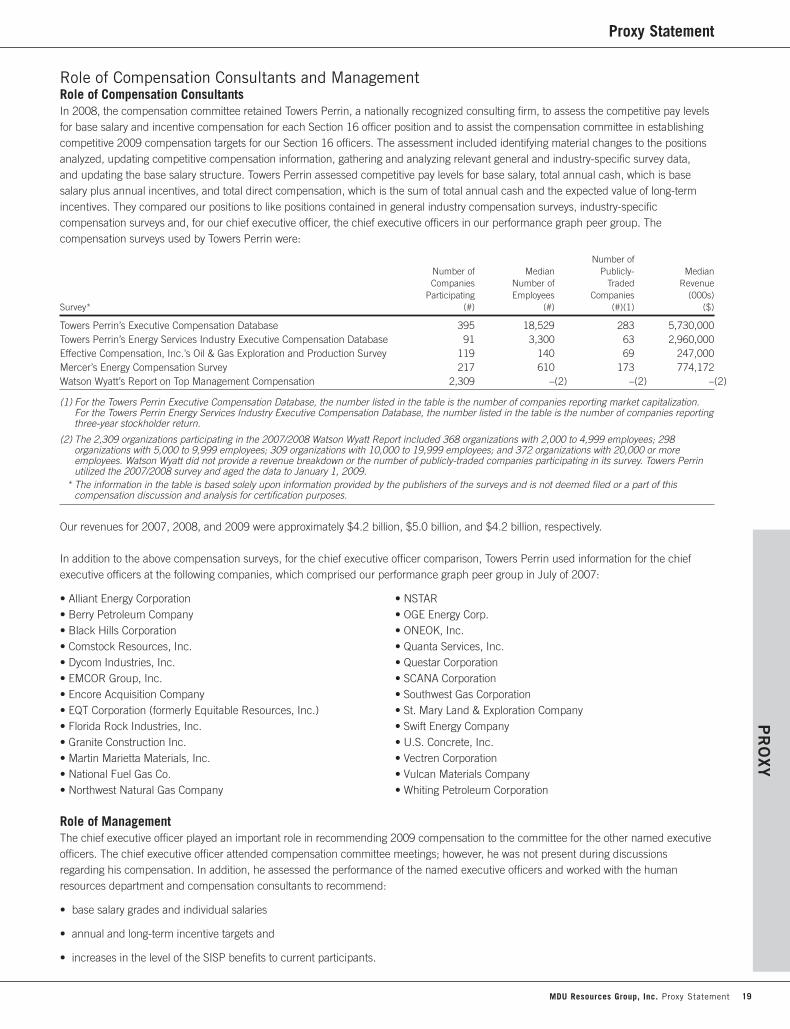
Proxy StatementP
RO
XY
Role of Compensation Consultants and ManagementRole of Compensation ConsultantsIn 2008, the compensation committee retained Towers Perrin, a nationally recognized consulting firm, to assess the competitive pay levelsfor base salary and incentive compensation for each Section 16 officer position and to assist the compensation committee in establishingcompetitive 2009 compensation targets for our Section 16 officers. The assessment included identifying material changes to the positionsanalyzed, updating competitive compensation information, gathering and analyzing relevant general and industry-specific survey data,and updating the base salary structure. Towers Perrin assessed competitive pay levels for base salary, total annual cash, which is basesalary plus annual incentives, and total direct compensation, which is the sum of total annual cash and the expected value of long-termincentives. They compared our positions to like positions contained in general industry compensation surveys, industry-specificcompensation surveys and, for our chief executive officer, the chief executive officers in our performance graph peer group. Thecompensation surveys used by Towers Perrin were:
Number ofNumber of Median Publicly- MedianCompanies Number of Traded Revenue
Participating Employees Companies (000s)Survey* (#) (#) (#)(1) ($)
Towers Perrin’s Executive Compensation Database 395 18,529 283 5,730,000Towers Perrin’s Energy Services Industry Executive Compensation Database 91 3,300 63 2,960,000Effective Compensation, Inc.’s Oil & Gas Exploration and Production Survey 119 140 69 247,000Mercer’s Energy Compensation Survey 217 610 173 774,172Watson Wyatt’s Report on Top Management Compensation 2,309 –(2) –(2) –(2)
(1) For the Towers Perrin Executive Compensation Database, the number listed in the table is the number of companies reporting market capitalization.For the Towers Perrin Energy Services Industry Executive Compensation Database, the number listed in the table is the number of companies reportingthree-year stockholder return.
(2) The 2,309 organizations participating in the 2007/2008 Watson Wyatt Report included 368 organizations with 2,000 to 4,999 employees; 298organizations with 5,000 to 9,999 employees; 309 organizations with 10,000 to 19,999 employees; and 372 organizations with 20,000 or moreemployees. Watson Wyatt did not provide a revenue breakdown or the number of publicly-traded companies participating in its survey. Towers Perrinutilized the 2007/2008 survey and aged the data to January 1, 2009.
* The information in the table is based solely upon information provided by the publishers of the surveys and is not deemed filed or a part of thiscompensation discussion and analysis for certification purposes.
Our revenues for 2007, 2008, and 2009 were approximately $4.2 billion, $5.0 billion, and $4.2 billion, respectively.
In addition to the above compensation surveys, for the chief executive officer comparison, Towers Perrin used information for the chiefexecutive officers at the following companies, which comprised our performance graph peer group in July of 2007:
• Alliant Energy Corporation • NSTAR• Berry Petroleum Company • OGE Energy Corp.• Black Hills Corporation • ONEOK, Inc.• Comstock Resources, Inc. • Quanta Services, Inc.• Dycom Industries, Inc. • Questar Corporation• EMCOR Group, Inc. • SCANA Corporation• Encore Acquisition Company • Southwest Gas Corporation• EQT Corporation (formerly Equitable Resources, Inc.) • St. Mary Land & Exploration Company• Florida Rock Industries, Inc. • Swift Energy Company• Granite Construction Inc. • U.S. Concrete, Inc.• Martin Marietta Materials, Inc. • Vectren Corporation• National Fuel Gas Co. • Vulcan Materials Company• Northwest Natural Gas Company • Whiting Petroleum Corporation
Role of ManagementThe chief executive officer played an important role in recommending 2009 compensation to the committee for the other named executiveofficers. The chief executive officer attended compensation committee meetings; however, he was not present during discussionsregarding his compensation. In addition, he assessed the performance of the named executive officers and worked with the humanresources department and compensation consultants to recommend:
• base salary grades and individual salaries
• annual and long-term incentive targets and
• increases in the level of the SISP benefits to current participants.
MDU Resources Group, Inc. Proxy Statement 19
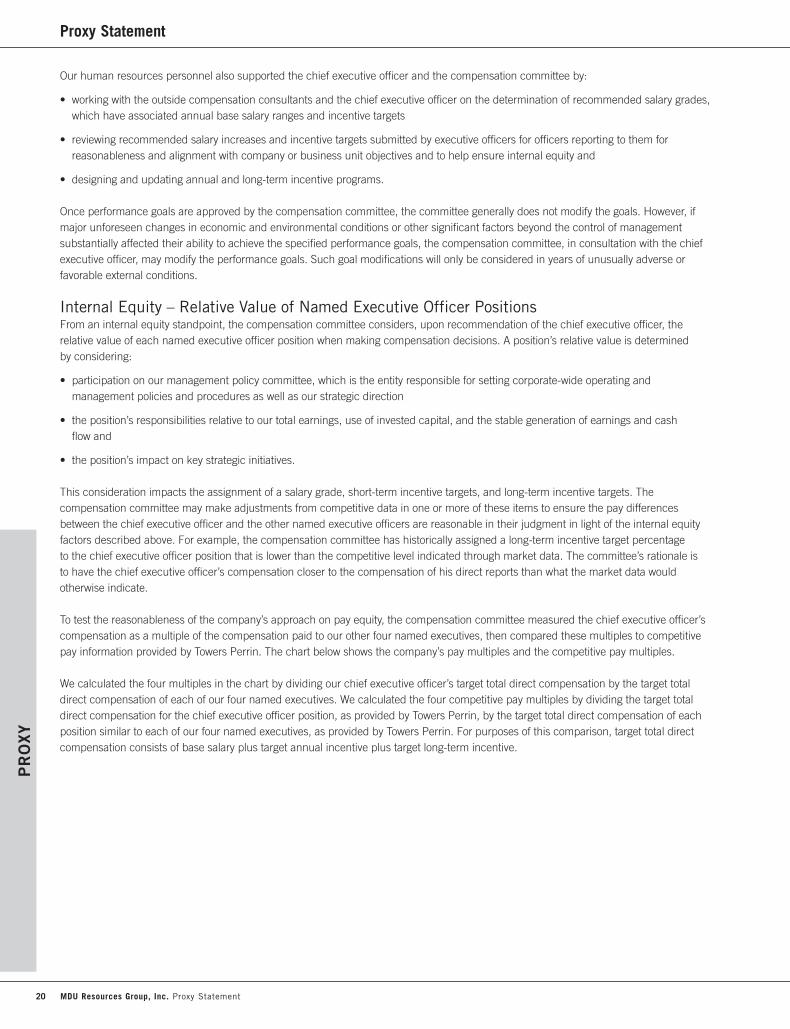
Proxy Statement
Our human resources personnel also supported the chief executive officer and the compensation committee by:
• working with the outside compensation consultants and the chief executive officer on the determination of recommended salary grades,which have associated annual base salary ranges and incentive targets
• reviewing recommended salary increases and incentive targets submitted by executive officers for officers reporting to them forreasonableness and alignment with company or business unit objectives and to help ensure internal equity and
• designing and updating annual and long-term incentive programs.
Once performance goals are approved by the compensation committee, the committee generally does not modify the goals. However, ifmajor unforeseen changes in economic and environmental conditions or other significant factors beyond the control of managementsubstantially affected their ability to achieve the specified performance goals, the compensation committee, in consultation with the chiefexecutive officer, may modify the performance goals. Such goal modifications will only be considered in years of unusually adverse orfavorable external conditions.
Internal Equity – Relative Value of Named Executive Officer PositionsFrom an internal equity standpoint, the compensation committee considers, upon recommendation of the chief executive officer, therelative value of each named executive officer position when making compensation decisions. A position’s relative value is determinedby considering:
• participation on our management policy committee, which is the entity responsible for setting corporate-wide operating andmanagement policies and procedures as well as our strategic direction
• the position’s responsibilities relative to our total earnings, use of invested capital, and the stable generation of earnings and cashflow and
• the position’s impact on key strategic initiatives.
This consideration impacts the assignment of a salary grade, short-term incentive targets, and long-term incentive targets. Thecompensation committee may make adjustments from competitive data in one or more of these items to ensure the pay differencesbetween the chief executive officer and the other named executive officers are reasonable in their judgment in light of the internal equityfactors described above. For example, the compensation committee has historically assigned a long-term incentive target percentageto the chief executive officer position that is lower than the competitive level indicated through market data. The committee’s rationale isto have the chief executive officer’s compensation closer to the compensation of his direct reports than what the market data wouldotherwise indicate.
To test the reasonableness of the company’s approach on pay equity, the compensation committee measured the chief executive officer’scompensation as a multiple of the compensation paid to our other four named executives, then compared these multiples to competitivepay information provided by Towers Perrin. The chart below shows the company’s pay multiples and the competitive pay multiples.
We calculated the four multiples in the chart by dividing our chief executive officer’s target total direct compensation by the target totaldirect compensation of each of our four named executives. We calculated the four competitive pay multiples by dividing the target totaldirect compensation for the chief executive officer position, as provided by Towers Perrin, by the target total direct compensation of eachposition similar to each of our four named executives, as provided by Towers Perrin. For purposes of this comparison, target total directcompensation consists of base salary plus target annual incentive plus target long-term incentive.
PR
OXY
20 MDU Resources Group, Inc. Proxy Statement
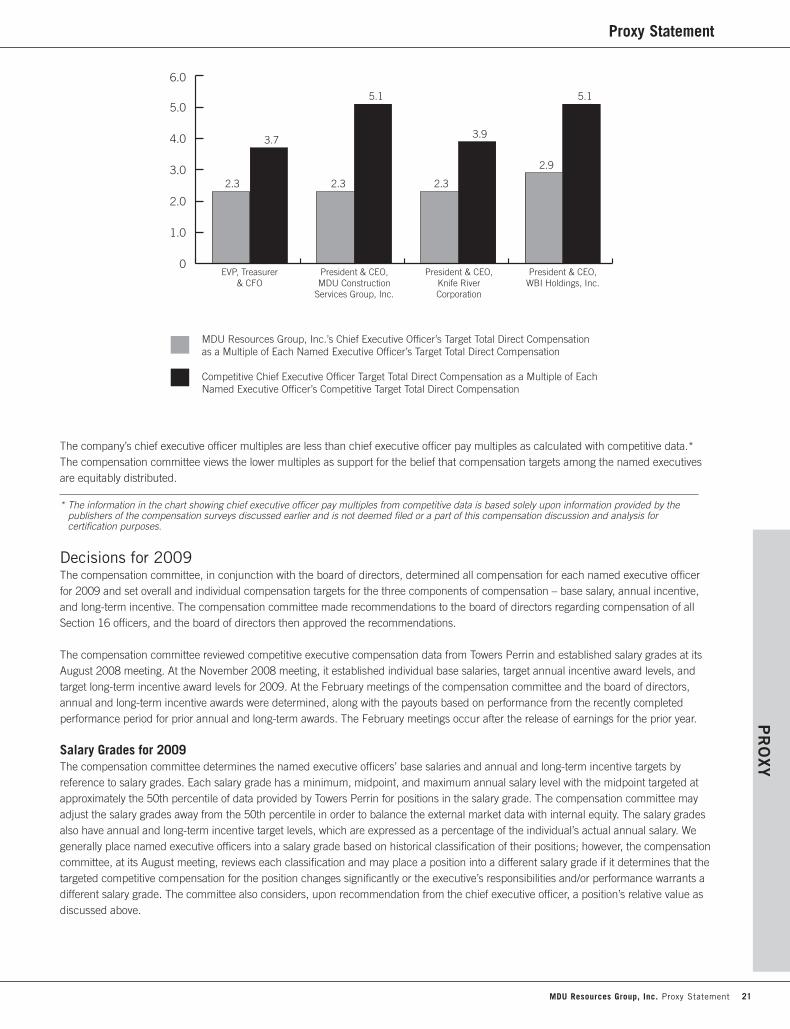
Proxy StatementP
RO
XY
The company’s chief executive officer multiples are less than chief executive officer pay multiples as calculated with competitive data.*The compensation committee views the lower multiples as support for the belief that compensation targets among the named executivesare equitably distributed.
* The information in the chart showing chief executive officer pay multiples from competitive data is based solely upon information provided by thepublishers of the compensation surveys discussed earlier and is not deemed filed or a part of this compensation discussion and analysis forcertification purposes.
Decisions for 2009The compensation committee, in conjunction with the board of directors, determined all compensation for each named executive officerfor 2009 and set overall and individual compensation targets for the three components of compensation – base salary, annual incentive,and long-term incentive. The compensation committee made recommendations to the board of directors regarding compensation of allSection 16 officers, and the board of directors then approved the recommendations.
The compensation committee reviewed competitive executive compensation data from Towers Perrin and established salary grades at itsAugust 2008 meeting. At the November 2008 meeting, it established individual base salaries, target annual incentive award levels, andtarget long-term incentive award levels for 2009. At the February meetings of the compensation committee and the board of directors,annual and long-term incentive awards were determined, along with the payouts based on performance from the recently completedperformance period for prior annual and long-term awards. The February meetings occur after the release of earnings for the prior year.
Salary Grades for 2009The compensation committee determines the named executive officers’ base salaries and annual and long-term incentive targets byreference to salary grades. Each salary grade has a minimum, midpoint, and maximum annual salary level with the midpoint targeted atapproximately the 50th percentile of data provided by Towers Perrin for positions in the salary grade. The compensation committee mayadjust the salary grades away from the 50th percentile in order to balance the external market data with internal equity. The salary gradesalso have annual and long-term incentive target levels, which are expressed as a percentage of the individual’s actual annual salary. Wegenerally place named executive officers into a salary grade based on historical classification of their positions; however, the compensationcommittee, at its August meeting, reviews each classification and may place a position into a different salary grade if it determines that thetargeted competitive compensation for the position changes significantly or the executive’s responsibilities and/or performance warrants adifferent salary grade. The committee also considers, upon recommendation from the chief executive officer, a position’s relative value asdiscussed above.
MDU Resources Group, Inc. Proxy Statement 21
0
1.0
2.0
3.0
4.0
5.0
6.0
2.3
3.7
5.1
3.9
5.1
2.3 2.3
2.9
MDU Resources Group, Inc.’s Chief Executive Officer’s Target Total Direct Compensation as a Multiple of Each Named Executive Officer’s Target Total Direct Compensation
Competitive Chief Executive Officer Target Total Direct Compensation as a Multiple of Each Named Executive Officer’s Competitive Target Total Direct Compensation
EVP, Treasurer& CFO
President & CEO,MDU Construction
Services Group, Inc.
President & CEO,Knife RiverCorporation
President & CEO,WBI Holdings, Inc.
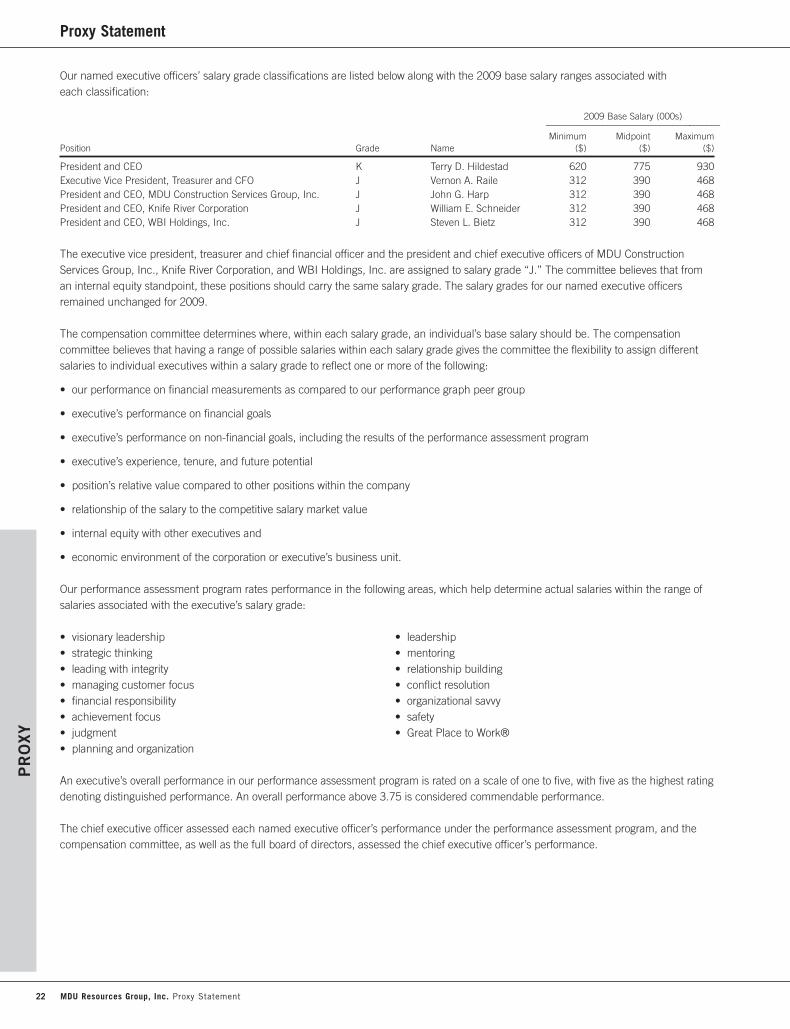
Proxy Statement
Our named executive officers’ salary grade classifications are listed below along with the 2009 base salary ranges associated witheach classification:
2009 Base Salary (000s)________________________________________
Minimum Midpoint MaximumPosition Grade Name ($) ($) ($)
President and CEO K Terry D. Hildestad 620 775 930Executive Vice President, Treasurer and CFO J Vernon A. Raile 312 390 468President and CEO, MDU Construction Services Group, Inc. J John G. Harp 312 390 468President and CEO, Knife River Corporation J William E. Schneider 312 390 468President and CEO, WBI Holdings, Inc. J Steven L. Bietz 312 390 468
The executive vice president, treasurer and chief financial officer and the president and chief executive officers of MDU ConstructionServices Group, Inc., Knife River Corporation, and WBI Holdings, Inc. are assigned to salary grade “J.” The committee believes that froman internal equity standpoint, these positions should carry the same salary grade. The salary grades for our named executive officersremained unchanged for 2009.
The compensation committee determines where, within each salary grade, an individual’s base salary should be. The compensationcommittee believes that having a range of possible salaries within each salary grade gives the committee the flexibility to assign differentsalaries to individual executives within a salary grade to reflect one or more of the following:
• our performance on financial measurements as compared to our performance graph peer group
• executive’s performance on financial goals
• executive’s performance on non-financial goals, including the results of the performance assessment program
• executive’s experience, tenure, and future potential
• position’s relative value compared to other positions within the company
• relationship of the salary to the competitive salary market value
• internal equity with other executives and
• economic environment of the corporation or executive’s business unit.
Our performance assessment program rates performance in the following areas, which help determine actual salaries within the range ofsalaries associated with the executive’s salary grade:
• visionary leadership • leadership• strategic thinking • mentoring• leading with integrity • relationship building• managing customer focus • conflict resolution• financial responsibility • organizational savvy• achievement focus • safety• judgment • Great Place to Work®• planning and organization
An executive’s overall performance in our performance assessment program is rated on a scale of one to five, with five as the highest ratingdenoting distinguished performance. An overall performance above 3.75 is considered commendable performance.
The chief executive officer assessed each named executive officer’s performance under the performance assessment program, and thecompensation committee, as well as the full board of directors, assessed the chief executive officer’s performance.
PR
OXY
22 MDU Resources Group, Inc. Proxy Statement

Proxy StatementP
RO
XY
Base Salaries of the Named Executive Officers for 2009
Terry D. HildestadMr. Hildestad has served as chief executive officer since August 2006. For 2009, the committee increased his salary by 7.1%, from$700,000 to $750,000. The reasons for Mr. Hildestad’s 2009 increase were:
• the company’s 2008 forecasted financial results (based on 9 months’ actual plus 3 months’ estimate) on earnings per share (EPS) andreturn on invested capital (ROIC) were higher than 2008 targets by 12.4% and 6.6%, respectively
• the company’s ROIC for the twelve months ended June 30, 2008 was 19.1% higher than the median ROIC for the performance graphpeer companies over the same time period on a continuing operations basis
• the board recognized Mr. Hildestad’s strong leadership during difficult economic times, as well as fostering a culture of integritythroughout the organization, and
• moving Mr. Hildestad’s salary closer to the 2009 salary grade midpoint of $775,000.
Vernon A. RaileMr. Raile has served as executive vice president, treasurer and chief financial officer since January 2006. Mr. Raile’s 2009 base salary wasset at $450,000, representing an increase of 12.5% over his 2008 base salary of $400,000. The committee set his 2009 base salary at$450,000, above the midpoint of his salary grade, due to his commendable performance assessment rating, his years of service, and theresults associated with these key achievements:
• the company’s 2008 forecasted financial results (based on 9 months’ actual plus 3 months’ estimate) on EPS and ROIC were higherthan 2008 targets by 12.4% and 6.6%, respectively
• the company’s ROIC for the twelve months ended June 30, 2008 was 19.1% higher than the median ROIC for the performance graphpeer companies over the same time period on a continuing operations basis, and
• key financing initiatives that were undertaken utilizing Mr. Raile’s experience and skill.
John G. HarpMr. Harp has served as president and chief executive officer of MDU Construction Services Group, Inc. since September 2004. For 2009,his base salary was set at $450,000, representing an increase of 12.5% over his 2008 base salary of $400,000. The committee set his2009 base salary at $450,000, above the midpoint of his salary grade, due to his commendable performance assessment rating and dueto results associated with these key achievements:
• MDU Construction Services Group, Inc.’s 2008 forecasted financial results (based on 9 months’ actual plus 3 months’ estimate) on EPSand ROIC were higher than 2008 targets by 74.0% and 59.1%, respectively
• MDU Construction Services Group, Inc.’s ROIC for the twelve months ended June 30, 2008 was 115.9% higher than the median ROICof construction services companies in our performance graph peer group, and
• Mr. Harp’s strong grasp of all aspects of MDU Construction Services Group, Inc.’s business, including operations, collections, bidding,and personnel.
William E. SchneiderMr. Schneider has served as president and chief executive officer of Knife River Corporation since May 2005. Mr. Schneider’s 2009 basesalary was maintained at $447,400, representing no increase from 2008. The committee did not grant Mr. Schneider a base salaryincrease because Knife River Corporation’s 2008 nine-month financial results were less than target and because the committee wished tobe consistent with the overall wage freeze imposed across Knife River Corporation.
Steven L. BietzMr. Bietz has served as president and chief executive officer of WBI Holdings, Inc. since March 2006. For 2009, his base salary was setat $350,000, representing an increase of 11.8% over his 2008 base salary of $313,100. The committee set his 2009 base salary at$350,000, below the midpoint of his salary grade, due to his commendable performance assessment rating and due to results associatedwith these key achievements:
• WBI Holdings, Inc.’s 2008 forecasted financial results (based on 9 months’ actual plus 3 months’ estimate) on EPS and ROIC werehigher than 2008 targets by 37.1% and 30.9%, respectively
MDU Resources Group, Inc. Proxy Statement 23

Proxy Statement
• The ROIC associated with the oil and natural gas exploration and production unit of WBI Holdings, Inc. for the twelve month periodended June 30, 2008 was 58.4% higher than the median ROIC of oil and natural gas exploration and production companies in ourperformance graph peer group, and
• Mr. Bietz’s leadership in the large-scale development of the Bakken Field.
The following table shows each named executive officer’s base salary for 2008 and 2009 and the percentage change.
Base Salary Base Salaryfor 2008 for 2009
(000s) (000s) % ChangeName ($) ($) (%)
Terry D. Hildestad 700.0 750.0 7.1Vernon A. Raile 400.0 450.0 12.5John G. Harp 400.0 450.0 12.5William E. Schneider 447.4 447.4 0.0Steven L. Bietz 313.1 350.0 11.8
2009 Annual Incentives
What the Performance Measures Are and Why We Chose ThemThe compensation committee develops and reviews financial and other corporate performance measures to help ensure thatcompensation to the executives reflects the success of their respective business unit and/or the corporation, as well as the value providedto our stockholders. For Messrs. Hildestad and Raile, the performance measures for annual incentive awards are our annual return oninvested capital results compared to target and our annual earnings per share results compared to target. For Messrs. Schneider, Harp,and Bietz, the performance measures for annual incentive awards are their respective business unit’s annual return on invested capitalresults compared to target and their respective business unit’s allocated earnings per share results compared to target. The 2009 safetyresults of WBI Holdings, Inc. was also a measure for Mr. Bietz’s 2009 annual incentive.
The compensation committee believes earnings per share and return on invested capital are very good measurements in assessingcompany performance from a financial standpoint. Earnings per share is a generally accepted accounting principle measurement and isa key driver of stockholder return over the long-term. Return on invested capital measures how efficiently and effectively managementdeploys its capital. Sustained returns on invested capital in excess of our cost of capital create wealth for our stockholders.
Allocated earnings per share for a business unit is calculated by dividing that business unit’s earnings by the business unit’s portion of thetotal company weighted average shares outstanding. Return on invested capital for the company is calculated by dividing our earnings,without regard to after tax interest expense and preferred stock dividends, by our average capitalization for the calendar year. Return oninvested capital for a business unit is calculated by dividing the business unit’s earnings, without regard to after tax interest expense andpreferred stock dividends, by the business unit’s average capitalization for the calendar year.
The compensation committee determines the weighting of the performance measures each year based upon recommendations from thechief executive officer. The compensation committee weighted the 2009 performance measures for return on invested capital compared totargeted results and allocated earnings per share compared to targeted results each at 50%. The compensation committee believes bothmeasures are equally important in driving stockholder value in the short term and over time.
We limit the after-tax annual incentive compensation we will pay above the target amount to 20% of earnings in excess of plannedearnings. We calculate the earnings in excess of planned earnings without regard to the after-tax annual incentive amounts above target.We measure the 20% limitation at the major business unit level for business unit executives, which include Messrs. Harp, Schneider andBietz, and at the corporate level for corporate executives, which include Messrs. Hildestad and Raile. In 2009, the 20% limitation wascalculated without regard to the noncash ceiling test impairment charge that we discuss later and an associated depletion, depreciationand amortization benefit.
We establish our incentive plan performance targets in connection with our annual financial planning process, where we assess theeconomic environment, competitive outlook, industry trends, and company specific conditions to set projections of results. The committeeevaluates the projected results and uses this evaluation to establish the incentive plan performance targets. The committee also considersannual improvement in the return on invested capital measure for incentive purposes to help ensure that return on invested capital willequal or exceed the weighted average cost of capital. Historically, this consideration took the form of a minimum annual increase in abusiness unit’s and/or the company’s return on invested capital incentive plan performance target(s). For 2009, the committee chose to
PR
OXY
24 MDU Resources Group, Inc. Proxy Statement
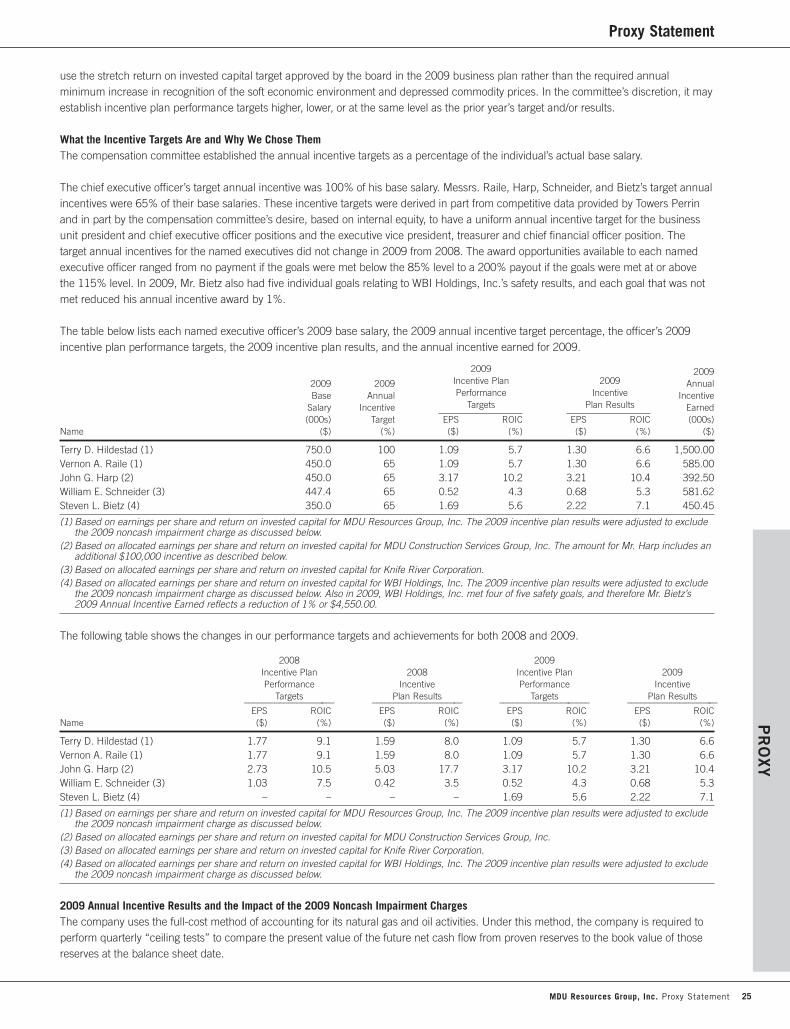
Proxy StatementP
RO
XY
use the stretch return on invested capital target approved by the board in the 2009 business plan rather than the required annualminimum increase in recognition of the soft economic environment and depressed commodity prices. In the committee’s discretion, it mayestablish incentive plan performance targets higher, lower, or at the same level as the prior year’s target and/or results.
What the Incentive Targets Are and Why We Chose ThemThe compensation committee established the annual incentive targets as a percentage of the individual’s actual base salary.
The chief executive officer’s target annual incentive was 100% of his base salary. Messrs. Raile, Harp, Schneider, and Bietz’s target annualincentives were 65% of their base salaries. These incentive targets were derived in part from competitive data provided by Towers Perrinand in part by the compensation committee’s desire, based on internal equity, to have a uniform annual incentive target for the businessunit president and chief executive officer positions and the executive vice president, treasurer and chief financial officer position. Thetarget annual incentives for the named executives did not change in 2009 from 2008. The award opportunities available to each namedexecutive officer ranged from no payment if the goals were met below the 85% level to a 200% payout if the goals were met at or abovethe 115% level. In 2009, Mr. Bietz also had five individual goals relating to WBI Holdings, Inc.’s safety results, and each goal that was notmet reduced his annual incentive award by 1%.
The table below lists each named executive officer’s 2009 base salary, the 2009 annual incentive target percentage, the officer’s 2009incentive plan performance targets, the 2009 incentive plan results, and the annual incentive earned for 2009.
2009 20092009 2009 Incentive Plan 2009 AnnualBase Annual Performance Incentive Incentive
Salary Incentive Targets Plan Results Earned(000s) Target EPS ROIC EPS ROIC (000s)
Name ($) (%) ($) (%) ($) (%) ($)
Terry D. Hildestad (1) 750.0 100 1.09 5.7 1.30 6.6 1,500.00Vernon A. Raile (1) 450.0 65 1.09 5.7 1.30 6.6 585.00John G. Harp (2) 450.0 65 3.17 10.2 3.21 10.4 392.50William E. Schneider (3) 447.4 65 0.52 4.3 0.68 5.3 581.62Steven L. Bietz (4) 350.0 65 1.69 5.6 2.22 7.1 450.45
(1) Based on earnings per share and return on invested capital for MDU Resources Group, Inc. The 2009 incentive plan results were adjusted to excludethe 2009 noncash impairment charge as discussed below.
(2) Based on allocated earnings per share and return on invested capital for MDU Construction Services Group, Inc. The amount for Mr. Harp includes anadditional $100,000 incentive as described below.
(3) Based on allocated earnings per share and return on invested capital for Knife River Corporation.(4) Based on allocated earnings per share and return on invested capital for WBI Holdings, Inc. The 2009 incentive plan results were adjusted to exclude
the 2009 noncash impairment charge as discussed below. Also in 2009, WBI Holdings, Inc. met four of five safety goals, and therefore Mr. Bietz’s2009 Annual Incentive Earned reflects a reduction of 1% or $4,550.00.
The following table shows the changes in our performance targets and achievements for both 2008 and 2009.
2008 2009Incentive Plan 2008 Incentive Plan 2009Performance Incentive Performance Incentive
Targets Plan Results Targets Plan Results_____________________ _____________________ _____________________ _____________________EPS ROIC EPS ROIC EPS ROIC EPS ROIC
Name ($) (%) ($) (%) ($) (%) ($) (%)
Terry D. Hildestad (1) 1.77 9.1 1.59 8.0 1.09 5.7 1.30 6.6Vernon A. Raile (1) 1.77 9.1 1.59 8.0 1.09 5.7 1.30 6.6John G. Harp (2) 2.73 10.5 5.03 17.7 3.17 10.2 3.21 10.4William E. Schneider (3) 1.03 7.5 0.42 3.5 0.52 4.3 0.68 5.3Steven L. Bietz (4) – – – – 1.69 5.6 2.22 7.1
(1) Based on earnings per share and return on invested capital for MDU Resources Group, Inc. The 2009 incentive plan results were adjusted to excludethe 2009 noncash impairment charge as discussed below.
(2) Based on allocated earnings per share and return on invested capital for MDU Construction Services Group, Inc.(3) Based on allocated earnings per share and return on invested capital for Knife River Corporation.(4) Based on allocated earnings per share and return on invested capital for WBI Holdings, Inc. The 2009 incentive plan results were adjusted to exclude
the 2009 noncash impairment charge as discussed below.
2009 Annual Incentive Results and the Impact of the 2009 Noncash Impairment ChargesThe company uses the full-cost method of accounting for its natural gas and oil activities. Under this method, the company is required toperform quarterly “ceiling tests” to compare the present value of the future net cash flow from proven reserves to the book value of thosereserves at the balance sheet date.
MDU Resources Group, Inc. Proxy Statement 25
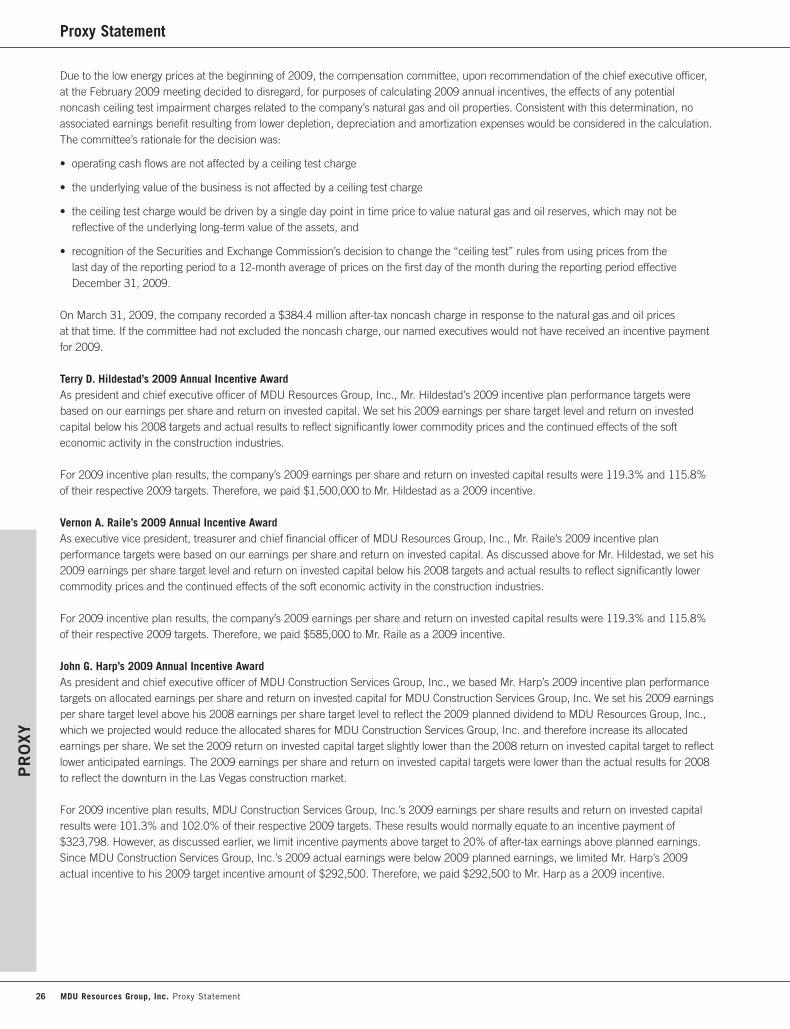
Proxy Statement
Due to the low energy prices at the beginning of 2009, the compensation committee, upon recommendation of the chief executive officer,at the February 2009 meeting decided to disregard, for purposes of calculating 2009 annual incentives, the effects of any potentialnoncash ceiling test impairment charges related to the company’s natural gas and oil properties. Consistent with this determination, noassociated earnings benefit resulting from lower depletion, depreciation and amortization expenses would be considered in the calculation.The committee’s rationale for the decision was:
• operating cash flows are not affected by a ceiling test charge
• the underlying value of the business is not affected by a ceiling test charge
• the ceiling test charge would be driven by a single day point in time price to value natural gas and oil reserves, which may not bereflective of the underlying long-term value of the assets, and
• recognition of the Securities and Exchange Commission’s decision to change the “ceiling test” rules from using prices from thelast day of the reporting period to a 12-month average of prices on the first day of the month during the reporting period effectiveDecember 31, 2009.
On March 31, 2009, the company recorded a $384.4 million after-tax noncash charge in response to the natural gas and oil pricesat that time. If the committee had not excluded the noncash charge, our named executives would not have received an incentive paymentfor 2009.
Terry D. Hildestad’s 2009 Annual Incentive AwardAs president and chief executive officer of MDU Resources Group, Inc., Mr. Hildestad’s 2009 incentive plan performance targets werebased on our earnings per share and return on invested capital. We set his 2009 earnings per share target level and return on investedcapital below his 2008 targets and actual results to reflect significantly lower commodity prices and the continued effects of the softeconomic activity in the construction industries.
For 2009 incentive plan results, the company’s 2009 earnings per share and return on invested capital results were 119.3% and 115.8%of their respective 2009 targets. Therefore, we paid $1,500,000 to Mr. Hildestad as a 2009 incentive.
Vernon A. Raile’s 2009 Annual Incentive AwardAs executive vice president, treasurer and chief financial officer of MDU Resources Group, Inc., Mr. Raile’s 2009 incentive planperformance targets were based on our earnings per share and return on invested capital. As discussed above for Mr. Hildestad, we set his2009 earnings per share target level and return on invested capital below his 2008 targets and actual results to reflect significantly lowercommodity prices and the continued effects of the soft economic activity in the construction industries.
For 2009 incentive plan results, the company’s 2009 earnings per share and return on invested capital results were 119.3% and 115.8%of their respective 2009 targets. Therefore, we paid $585,000 to Mr. Raile as a 2009 incentive.
John G. Harp’s 2009 Annual Incentive AwardAs president and chief executive officer of MDU Construction Services Group, Inc., we based Mr. Harp’s 2009 incentive plan performancetargets on allocated earnings per share and return on invested capital for MDU Construction Services Group, Inc. We set his 2009 earningsper share target level above his 2008 earnings per share target level to reflect the 2009 planned dividend to MDU Resources Group, Inc.,which we projected would reduce the allocated shares for MDU Construction Services Group, Inc. and therefore increase its allocatedearnings per share. We set the 2009 return on invested capital target slightly lower than the 2008 return on invested capital target to reflectlower anticipated earnings. The 2009 earnings per share and return on invested capital targets were lower than the actual results for 2008to reflect the downturn in the Las Vegas construction market.
For 2009 incentive plan results, MDU Construction Services Group, Inc.’s 2009 earnings per share results and return on invested capitalresults were 101.3% and 102.0% of their respective 2009 targets. These results would normally equate to an incentive payment of$323,798. However, as discussed earlier, we limit incentive payments above target to 20% of after-tax earnings above planned earnings.Since MDU Construction Services Group, Inc.’s 2009 actual earnings were below 2009 planned earnings, we limited Mr. Harp’s 2009actual incentive to his 2009 target incentive amount of $292,500. Therefore, we paid $292,500 to Mr. Harp as a 2009 incentive.
PR
OXY
26 MDU Resources Group, Inc. Proxy Statement

Proxy StatementP
RO
XY
John G. Harp’s Additional 2009 IncentiveIn addition to the 2009 annual incentive award, Mr. Harp had the opportunity to earn an additional incentive, which the compensationcommittee structured as follows:
MDU Construction Services Group, Inc.’s 2009 Return on Invested Capital (ROIC) as compared to MDU Construction Services Group, Inc.’s 2009 Weighted Average Cost of Capital (WACC) Additional Incentive Amount
2009 ROIC is less than 100 basis points above 2009 WACC $0
2009 ROIC is 100 to 199 basis points above 2009 WACC $100,000
2009 ROIC is 200 basis points or more above 2009 WACC $200,000
Throughout 2009, MDU Construction Services Group, Inc. accumulated significant amounts of cash through effective working capitalmanagement. These amounts exceeded the amounts anticipated at the beginning of 2009, resulting in the reduction of all of itscommercial paper and more dividends to MDU Resources Group, Inc. than originally projected. In addition, MDU Construction ServicesGroup, Inc. was able to lend the remaining excess cash to other MDU Resources Group, Inc.’s subsidiaries, reducing debt at the MDUResources Group, Inc. level. Although the remaining excess cash did not lower the invested capital at MDU Construction Services Group,Inc. on a standalone basis, it did lower the overall invested capital of MDU Resources Group, Inc. Therefore, the compensation committee,upon recommendation from the chief executive officer, approved calculating MDU Construction Services Group, Inc.’s 2009 return oninvested capital to reflect the excess cash accumulated. The compensation committee’s rationale for this decision was:
• recognition of, and rewarding for, effectively managing accounts receivable through timely collections, and
• MDU Resources Group, Inc. benefited from the excess cash through lower average commercial paper balances in 2009.
MDU Construction Services Group, Inc.’s 2009 return on invested capital, as adjusted for the excess cash, was 12.5% compared to its2009 weighted average cost of capital of 11.1%. Because the 2009 return on invested capital of 12.5% was higher than the reported 2009weighted average cost of capital of 11.1%, Mr. Harp received $100,000 in additional incentive for 2009.
William E. Schneider’s 2009 Annual Incentive AwardAs president and chief executive officer of Knife River Corporation, Mr. Schneider’s 2009 incentive plan performance targets were basedon allocated earnings per share and return on invested capital for Knife River Corporation. We set his 2009 targets for allocated earningsper share and return on invested capital lower than his 2008 targets and higher than 2008 actual results. The compensation committeearrived at these targets based on the current economic softness in the construction markets, partially offset by a significant reduction inKnife River Corporation’s cost structure.
For 2009, Knife River Corporation’s 2009 earnings per share and return on invested capital results were 130.8% and 123.3% of theirrespective 2009 targets. Therefore, we paid $581,620 to Mr. Schneider as a 2009 incentive.
Steven L. Bietz’s 2009 Annual Incentive AwardAs president and chief executive officer of WBI Holdings, Inc., Mr. Bietz’s 2009 incentive plan performance targets were based onallocated earnings per share and return on invested capital for WBI Holdings, Inc. We set his 2009 earnings per share and return oninvested capital target levels below his 2008 target and 2008 actual results largely to reflect lower commodity prices and lower anticipatedproduction due to reduced capital expenditures.
For 2009 incentive plan results, the company’s 2009 earnings per share and return on invested capital results were 131.4% and 126.8%of their respective 2009 targets. These results equated to an incentive of $455,000, which was reduced by $4,550 or 1% due to notachieving one of the five 2009 safety goals. Therefore, we paid $450,450 to Mr. Bietz as a 2009 incentive.
Deferral of Annual Incentive CompensationWe provide executives the opportunity to defer receipt of earned annual incentives. If an executive chooses to defer his or her annualincentive, we will credit the deferral with interest at a rate determined by the compensation committee. For 2009, the committeediscontinued using the prime rate in favor of using Moody’s U.S. Long-Term Corporate Bond Yield Average for “A” rated companies.The committee’s reasons for using this approach recognized:
• incentive deferrals are a low-cost source of capital for the company, and
• incentive deferrals are unsecured obligations and therefore carry a higher risk to the executives.
MDU Resources Group, Inc. Proxy Statement 27
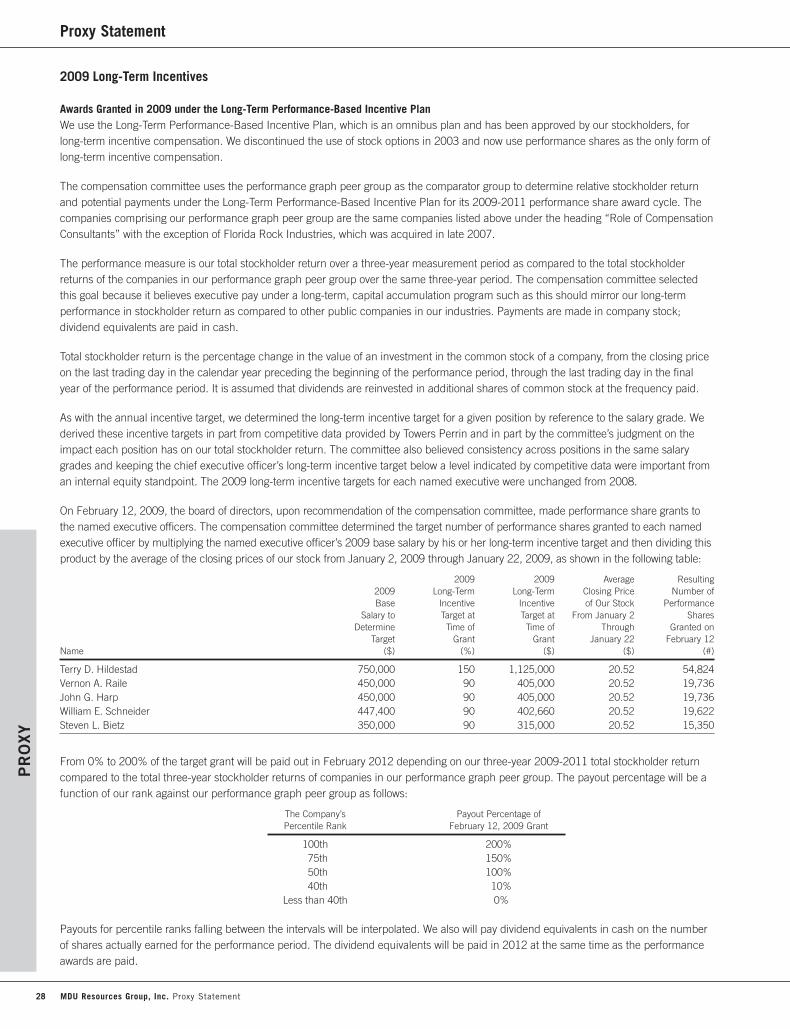
Proxy Statement
2009 Long-Term Incentives
Awards Granted in 2009 under the Long-Term Performance-Based Incentive PlanWe use the Long-Term Performance-Based Incentive Plan, which is an omnibus plan and has been approved by our stockholders, forlong-term incentive compensation. We discontinued the use of stock options in 2003 and now use performance shares as the only form oflong-term incentive compensation.
The compensation committee uses the performance graph peer group as the comparator group to determine relative stockholder returnand potential payments under the Long-Term Performance-Based Incentive Plan for its 2009-2011 performance share award cycle. Thecompanies comprising our performance graph peer group are the same companies listed above under the heading “Role of CompensationConsultants” with the exception of Florida Rock Industries, which was acquired in late 2007.
The performance measure is our total stockholder return over a three-year measurement period as compared to the total stockholderreturns of the companies in our performance graph peer group over the same three-year period. The compensation committee selectedthis goal because it believes executive pay under a long-term, capital accumulation program such as this should mirror our long-termperformance in stockholder return as compared to other public companies in our industries. Payments are made in company stock;dividend equivalents are paid in cash.
Total stockholder return is the percentage change in the value of an investment in the common stock of a company, from the closing priceon the last trading day in the calendar year preceding the beginning of the performance period, through the last trading day in the finalyear of the performance period. It is assumed that dividends are reinvested in additional shares of common stock at the frequency paid.
As with the annual incentive target, we determined the long-term incentive target for a given position by reference to the salary grade. Wederived these incentive targets in part from competitive data provided by Towers Perrin and in part by the committee’s judgment on theimpact each position has on our total stockholder return. The committee also believed consistency across positions in the same salarygrades and keeping the chief executive officer’s long-term incentive target below a level indicated by competitive data were important froman internal equity standpoint. The 2009 long-term incentive targets for each named executive were unchanged from 2008.
On February 12, 2009, the board of directors, upon recommendation of the compensation committee, made performance share grants tothe named executive officers. The compensation committee determined the target number of performance shares granted to each namedexecutive officer by multiplying the named executive officer’s 2009 base salary by his or her long-term incentive target and then dividing thisproduct by the average of the closing prices of our stock from January 2, 2009 through January 22, 2009, as shown in the following table:
2009 2009 Average Resulting2009 Long-Term Long-Term Closing Price Number ofBase Incentive Incentive of Our Stock Performance
Salary to Target at Target at From January 2 SharesDetermine Time of Time of Through Granted on
Target Grant Grant January 22 February 12Name ($) (%) ($) ($) (#)
Terry D. Hildestad 750,000 150 1,125,000 20.52 54,824Vernon A. Raile 450,000 90 405,000 20.52 19,736John G. Harp 450,000 90 405,000 20.52 19,736William E. Schneider 447,400 90 402,660 20.52 19,622Steven L. Bietz 350,000 90 315,000 20.52 15,350
From 0% to 200% of the target grant will be paid out in February 2012 depending on our three-year 2009-2011 total stockholder returncompared to the total three-year stockholder returns of companies in our performance graph peer group. The payout percentage will be afunction of our rank against our performance graph peer group as follows:
The Company’s Payout Percentage ofPercentile Rank February 12, 2009 Grant
100th 200%75th 150%50th 100%40th 10%
Less than 40th 0%
Payouts for percentile ranks falling between the intervals will be interpolated. We also will pay dividend equivalents in cash on the numberof shares actually earned for the performance period. The dividend equivalents will be paid in 2012 at the same time as the performanceawards are paid.
PR
OXY
28 MDU Resources Group, Inc. Proxy Statement
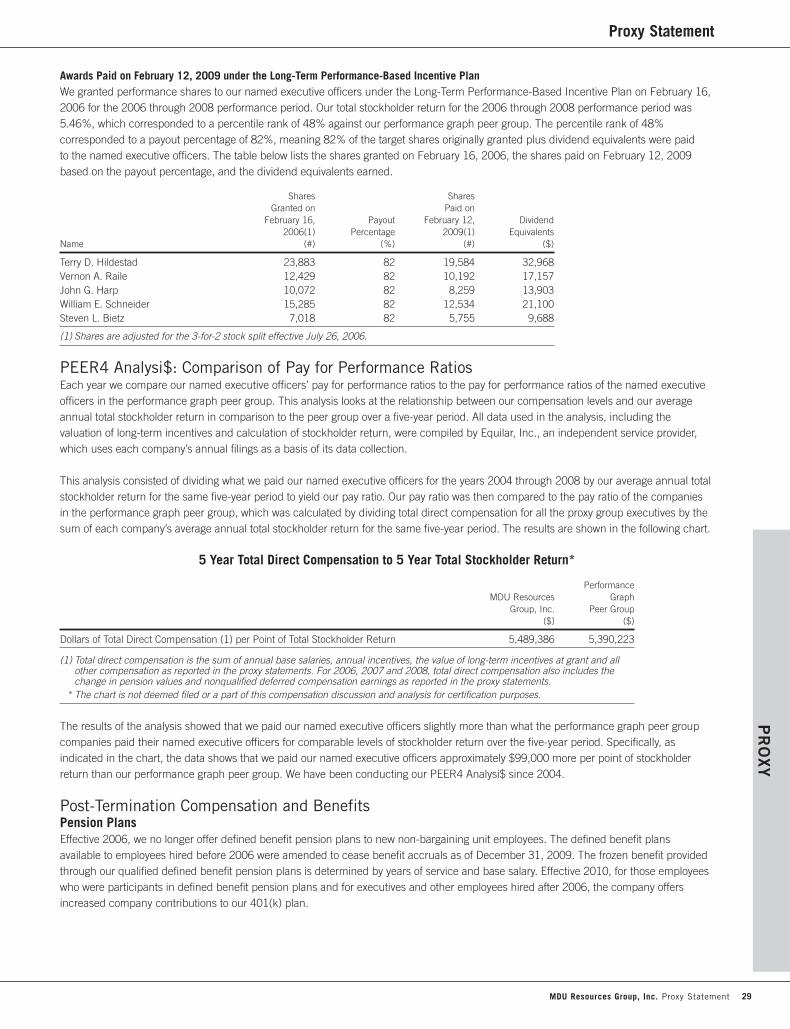
Proxy StatementP
RO
XY
Awards Paid on February 12, 2009 under the Long-Term Performance-Based Incentive PlanWe granted performance shares to our named executive officers under the Long-Term Performance-Based Incentive Plan on February 16,2006 for the 2006 through 2008 performance period. Our total stockholder return for the 2006 through 2008 performance period was5.46%, which corresponded to a percentile rank of 48% against our performance graph peer group. The percentile rank of 48%corresponded to a payout percentage of 82%, meaning 82% of the target shares originally granted plus dividend equivalents were paidto the named executive officers. The table below lists the shares granted on February 16, 2006, the shares paid on February 12, 2009based on the payout percentage, and the dividend equivalents earned.
Shares SharesGranted on Paid on
February 16, Payout February 12, Dividend2006(1) Percentage 2009(1) Equivalents
Name (#) (%) (#) ($)
Terry D. Hildestad 23,883 82 19,584 32,968Vernon A. Raile 12,429 82 10,192 17,157John G. Harp 10,072 82 8,259 13,903William E. Schneider 15,285 82 12,534 21,100Steven L. Bietz 7,018 82 5,755 9,688
(1) Shares are adjusted for the 3-for-2 stock split effective July 26, 2006.
PEER4 Analysi$: Comparison of Pay for Performance RatiosEach year we compare our named executive officers’ pay for performance ratios to the pay for performance ratios of the named executiveofficers in the performance graph peer group. This analysis looks at the relationship between our compensation levels and our averageannual total stockholder return in comparison to the peer group over a five-year period. All data used in the analysis, including thevaluation of long-term incentives and calculation of stockholder return, were compiled by Equilar, Inc., an independent service provider,which uses each company’s annual filings as a basis of its data collection.
This analysis consisted of dividing what we paid our named executive officers for the years 2004 through 2008 by our average annual totalstockholder return for the same five-year period to yield our pay ratio. Our pay ratio was then compared to the pay ratio of the companiesin the performance graph peer group, which was calculated by dividing total direct compensation for all the proxy group executives by thesum of each company’s average annual total stockholder return for the same five-year period. The results are shown in the following chart.
5 Year Total Direct Compensation to 5 Year Total Stockholder Return*
Performance MDU Resources Graph
Group, Inc. Peer Group($) ($)
Dollars of Total Direct Compensation (1) per Point of Total Stockholder Return 5,489,386 5,390,223
(1) Total direct compensation is the sum of annual base salaries, annual incentives, the value of long-term incentives at grant and allother compensation as reported in the proxy statements. For 2006, 2007 and 2008, total direct compensation also includes thechange in pension values and nonqualified deferred compensation earnings as reported in the proxy statements.
* The chart is not deemed filed or a part of this compensation discussion and analysis for certification purposes.
The results of the analysis showed that we paid our named executive officers slightly more than what the performance graph peer groupcompanies paid their named executive officers for comparable levels of stockholder return over the five-year period. Specifically, asindicated in the chart, the data shows that we paid our named executive officers approximately $99,000 more per point of stockholderreturn than our performance graph peer group. We have been conducting our PEER4 Analysi$ since 2004.
Post-Termination Compensation and BenefitsPension PlansEffective 2006, we no longer offer defined benefit pension plans to new non-bargaining unit employees. The defined benefit plansavailable to employees hired before 2006 were amended to cease benefit accruals as of December 31, 2009. The frozen benefit providedthrough our qualified defined benefit pension plans is determined by years of service and base salary. Effective 2010, for those employeeswho were participants in defined benefit pension plans and for executives and other employees hired after 2006, the company offersincreased company contributions to our 401(k) plan.
MDU Resources Group, Inc. Proxy Statement 29

Proxy Statement
Supplemental Income Security Plan
Benefits OfferedWe offer certain key managers and executives, including all of our named executive officers, benefits under our nonqualified retirementplan, which we refer to as the Supplemental Income Security Plan or SISP. The SISP has a ten-year vesting schedule and was amended toadd an additional vesting requirement for benefit level increases occurring on or after January 1, 2010. The SISP provides participants withadditional retirement income and death benefits. The additional retirement income may take two forms:
• a supplemental retirement benefit payable for fifteen years beginning at the later of age 65 or after employment ends. The companyamended this portion of the benefit to reflect a 20% reduction in future benefit levels for employees who join the plan on or afterJanuary 1, 2010 and for current participants who receive benefit level increases on or after January 1, 2010.
• an additional retirement benefit to offset the Internal Revenue Code limitations placed on benefits payable under our qualified definedbenefit pension plans. The company amended the additional retirement benefit to no longer allow new participants and to cease benefitaccruals for existing participants as of December 31, 2009. If eligible, the participants receive this retirement benefit after they separatefrom the company and until they reach age 65. In order to be eligible to receive the additional retirement benefit, participants must vestin their pension benefit, which requires five years of service, and their pension must be limited by the Internal Revenue Code. Mr. Harphas an additional qualification in that he must remain employed until age 60 in order to receive this additional retirement benefit.
A death benefit is provided if SISP participants die before their supplemental retirement benefits commence or if they elect to receivedeath benefits in lieu of all or a part of their supplemental retirement benefits. The death benefit is payable for 15 years.
We believe the SISP is critical in retaining the talent necessary to drive long-term stockholder value. In addition, we believe that theten-year vesting provision of the SISP, augmented by an additional three years of vesting for benefit level increases occurring on or afterJanuary 1, 2010, helps promote retention of key executive officers.
Benefit Level IncreasesThe chief executive officer recommends benefit level increases to the compensation committee for participants except himself. The chiefexecutive officer considers, among other things, the participant’s salary in relation to the salary ranges that correspond with the SISPbenefit levels, the participant’s performance, the performance of the applicable business unit or the company, and the cost associated withthe benefit level increase.
Each November, the compensation committee considers SISP benefit level increases for the upcoming year as recommended by thechief executive officer and also considers benefit level increases for the chief executive officer. In November 2008, Messrs. Raile, Harp,and Bietz each received an increase in their SISP benefit levels, which were effective on January 1, 2009. The benefit level increasesrecognized each named executive’s contribution to the success of the company and individual business unit, where applicable. Thecommittee, however, approved the chief executive officer’s recommendation to limit the benefit increases for Messrs. Harp and Bietzto a level below the levels that corresponded to each named executive’s base salary. The chief executive officer’s rationale was tolimit additional costs associated with the benefit level increases in light of the uncertain economic times. The committee believedMr. Hildestad’s benefit level was appropriate and therefore did not grant him an increase.
In November 2009, Messrs. Harp, Schneider, and Bietz each received an increase in their SISP benefit levels which was effective onDecember 1, 2009. The committee’s rationale for Messrs. Harp and Bietz’s benefit level increases was recognition of their continuedcontribution to the financial success of the company and to bring their SISP benefit levels in line with their current salary. Mr. Schneiderwas awarded a benefit level increase to one level above the level corresponding to his current base salary in recognition of his leadership inthe financial turnaround of Knife River Corporation. The following table reflects our named executive officers’ SISP levels, including thechanges effective December 1, 2009:
January 1, 2009 December 31, 2009Annual SISP Benefits Annual SISP Benefits_______________________________ _______________________________
Survivors Retirement Survivors RetirementName ($) ($) ($) ($)
Terry D. Hildestad 1,025,040 512,520 1,025,040 512,520Vernon A. Raile 548,400 274,200 548,400 274,200John G. Harp 468,600 234,300 548,400 274,200William E. Schneider 468,600 234,300 548,400 274,200Steven L. Bietz 328,080 164,040 386,640 193,320
PR
OXY
30 MDU Resources Group, Inc. Proxy Statement
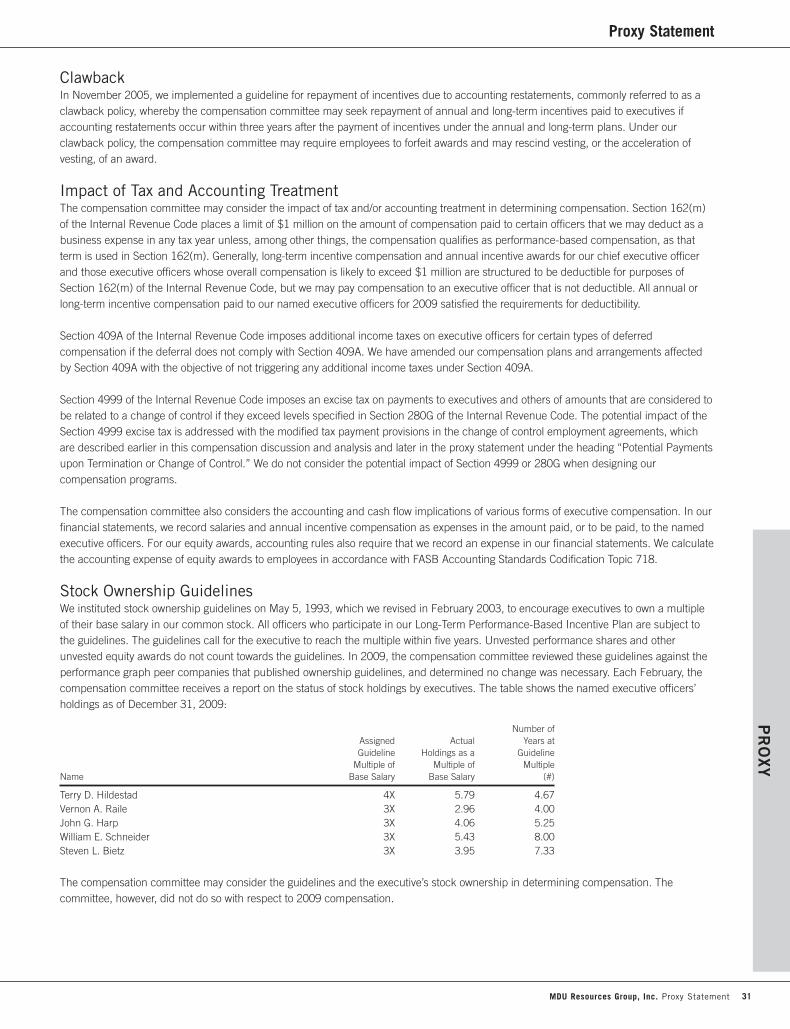
Proxy StatementP
RO
XY
ClawbackIn November 2005, we implemented a guideline for repayment of incentives due to accounting restatements, commonly referred to as aclawback policy, whereby the compensation committee may seek repayment of annual and long-term incentives paid to executives ifaccounting restatements occur within three years after the payment of incentives under the annual and long-term plans. Under ourclawback policy, the compensation committee may require employees to forfeit awards and may rescind vesting, or the acceleration ofvesting, of an award.
Impact of Tax and Accounting TreatmentThe compensation committee may consider the impact of tax and/or accounting treatment in determining compensation. Section 162(m)of the Internal Revenue Code places a limit of $1 million on the amount of compensation paid to certain officers that we may deduct as abusiness expense in any tax year unless, among other things, the compensation qualifies as performance-based compensation, as thatterm is used in Section 162(m). Generally, long-term incentive compensation and annual incentive awards for our chief executive officerand those executive officers whose overall compensation is likely to exceed $1 million are structured to be deductible for purposes ofSection 162(m) of the Internal Revenue Code, but we may pay compensation to an executive officer that is not deductible. All annual orlong-term incentive compensation paid to our named executive officers for 2009 satisfied the requirements for deductibility.
Section 409A of the Internal Revenue Code imposes additional income taxes on executive officers for certain types of deferredcompensation if the deferral does not comply with Section 409A. We have amended our compensation plans and arrangements affectedby Section 409A with the objective of not triggering any additional income taxes under Section 409A.
Section 4999 of the Internal Revenue Code imposes an excise tax on payments to executives and others of amounts that are considered tobe related to a change of control if they exceed levels specified in Section 280G of the Internal Revenue Code. The potential impact of theSection 4999 excise tax is addressed with the modified tax payment provisions in the change of control employment agreements, whichare described earlier in this compensation discussion and analysis and later in the proxy statement under the heading “Potential Paymentsupon Termination or Change of Control.” We do not consider the potential impact of Section 4999 or 280G when designing ourcompensation programs.
The compensation committee also considers the accounting and cash flow implications of various forms of executive compensation. In ourfinancial statements, we record salaries and annual incentive compensation as expenses in the amount paid, or to be paid, to the namedexecutive officers. For our equity awards, accounting rules also require that we record an expense in our financial statements. We calculatethe accounting expense of equity awards to employees in accordance with FASB Accounting Standards Codification Topic 718.
Stock Ownership GuidelinesWe instituted stock ownership guidelines on May 5, 1993, which we revised in February 2003, to encourage executives to own a multipleof their base salary in our common stock. All officers who participate in our Long-Term Performance-Based Incentive Plan are subject tothe guidelines. The guidelines call for the executive to reach the multiple within five years. Unvested performance shares and otherunvested equity awards do not count towards the guidelines. In 2009, the compensation committee reviewed these guidelines against theperformance graph peer companies that published ownership guidelines, and determined no change was necessary. Each February, thecompensation committee receives a report on the status of stock holdings by executives. The table shows the named executive officers’holdings as of December 31, 2009:
Number ofAssigned Actual Years atGuideline Holdings as a Guideline
Multiple of Multiple of MultipleName Base Salary Base Salary (#)
Terry D. Hildestad 4X 5.79 4.67Vernon A. Raile 3X 2.96 4.00John G. Harp 3X 4.06 5.25William E. Schneider 3X 5.43 8.00Steven L. Bietz 3X 3.95 7.33
The compensation committee may consider the guidelines and the executive’s stock ownership in determining compensation. Thecommittee, however, did not do so with respect to 2009 compensation.
MDU Resources Group, Inc. Proxy Statement 31
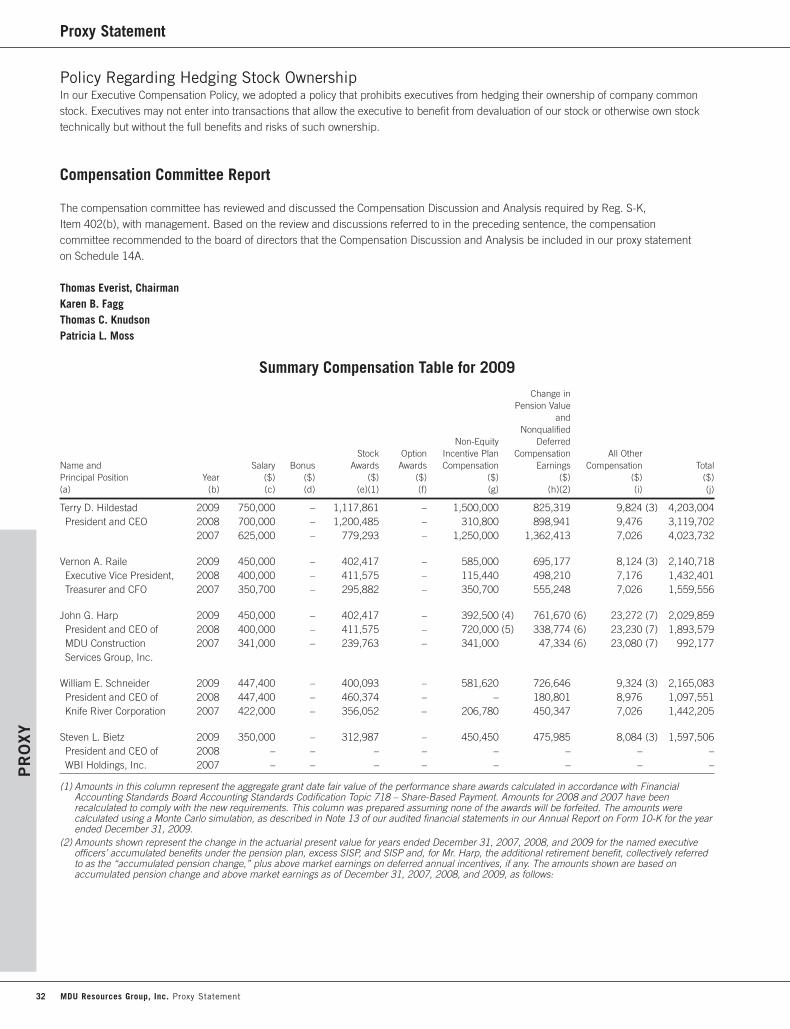
Proxy Statement
Policy Regarding Hedging Stock OwnershipIn our Executive Compensation Policy, we adopted a policy that prohibits executives from hedging their ownership of company commonstock. Executives may not enter into transactions that allow the executive to benefit from devaluation of our stock or otherwise own stocktechnically but without the full benefits and risks of such ownership.
Compensation Committee Report
The compensation committee has reviewed and discussed the Compensation Discussion and Analysis required by Reg. S-K,Item 402(b), with management. Based on the review and discussions referred to in the preceding sentence, the compensationcommittee recommended to the board of directors that the Compensation Discussion and Analysis be included in our proxy statementon Schedule 14A.
Thomas Everist, ChairmanKaren B. FaggThomas C. KnudsonPatricia L. Moss
Summary Compensation Table for 2009
Change inPension Value
andNonqualified
Non-Equity DeferredStock Option Incentive Plan Compensation All Other
Name and Salary Bonus Awards Awards Compensation Earnings Compensation TotalPrincipal Position Year ($) ($) ($) ($) ($) ($) ($) ($)(a) (b) (c) (d) (e)(1) (f) (g) (h)(2) (i) (j)
Terry D. Hildestad 2009 750,000 – 1,117,861 – 1,500,000 825,319 9,824 (3) 4,203,004President and CEO 2008 700,000 – 1,200,485 – 310,800 898,941 9,476 3,119,702
2007 625,000 – 779,293 – 1,250,000 1,362,413 7,026 4,023,732
Vernon A. Raile 2009 450,000 – 402,417 – 585,000 695,177 8,124 (3) 2,140,718Executive Vice President, 2008 400,000 – 411,575 – 115,440 498,210 7,176 1,432,401Treasurer and CFO 2007 350,700 – 295,882 – 350,700 555,248 7,026 1,559,556
John G. Harp 2009 450,000 – 402,417 – 392,500 (4) 761,670 (6) 23,272 (7) 2,029,859President and CEO of 2008 400,000 – 411,575 – 720,000 (5) 338,774 (6) 23,230 (7) 1,893,579MDU Construction 2007 341,000 – 239,763 – 341,000 47,334 (6) 23,080 (7) 992,177Services Group, Inc.
William E. Schneider 2009 447,400 – 400,093 – 581,620 726,646 9,324 (3) 2,165,083President and CEO of 2008 447,400 – 460,374 – – 180,801 8,976 1,097,551Knife River Corporation 2007 422,000 – 356,052 – 206,780 450,347 7,026 1,442,205
Steven L. Bietz 2009 350,000 – 312,987 – 450,450 475,985 8,084 (3) 1,597,506President and CEO of 2008 – – – – – – – –WBI Holdings, Inc. 2007 – – – – – – – –
(1) Amounts in this column represent the aggregate grant date fair value of the performance share awards calculated in accordance with FinancialAccounting Standards Board Accounting Standards Codification Topic 718 – Share-Based Payment. Amounts for 2008 and 2007 have beenrecalculated to comply with the new requirements. This column was prepared assuming none of the awards will be forfeited. The amounts werecalculated using a Monte Carlo simulation, as described in Note 13 of our audited financial statements in our Annual Report on Form 10-K for the yearended December 31, 2009.
(2) Amounts shown represent the change in the actuarial present value for years ended December 31, 2007, 2008, and 2009 for the named executiveofficers’ accumulated benefits under the pension plan, excess SISP, and SISP and, for Mr. Harp, the additional retirement benefit, collectively referredto as the “accumulated pension change,” plus above market earnings on deferred annual incentives, if any. The amounts shown are based onaccumulated pension change and above market earnings as of December 31, 2007, 2008, and 2009, as follows:
PR
OXY
32 MDU Resources Group, Inc. Proxy Statement
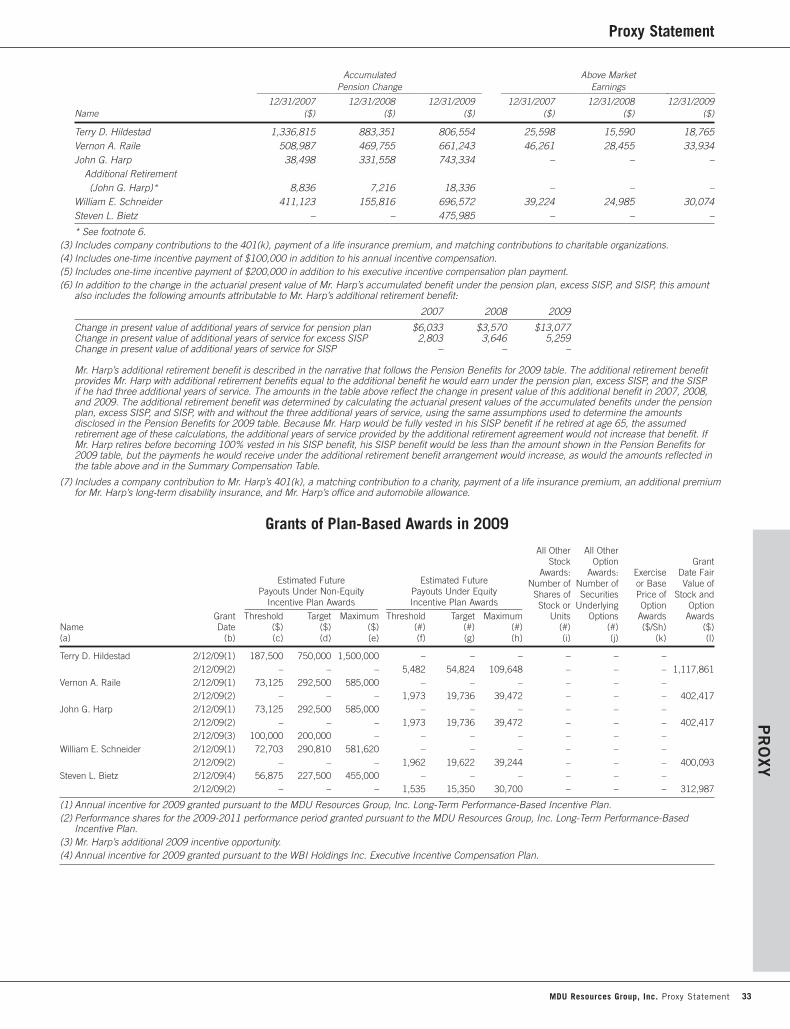
Proxy StatementP
RO
XY
Accumulated Above MarketPension Change Earnings___________________________________________________ _________________________________________________
12/31/2007 12/31/2008 12/31/2009 12/31/2007 12/31/2008 12/31/2009Name ($) ($) ($) ($) ($) ($)
Terry D. Hildestad 1,336,815 883,351 806,554 25,598 15,590 18,765Vernon A. Raile 508,987 469,755 661,243 46,261 28,455 33,934John G. Harp 38,498 331,558 743,334 – – –
Additional Retirement(John G. Harp)* 8,836 7,216 18,336 – – –
William E. Schneider 411,123 155,816 696,572 39,224 24,985 30,074Steven L. Bietz – – 475,985 – – –
* See footnote 6.(3) Includes company contributions to the 401(k), payment of a life insurance premium, and matching contributions to charitable organizations.(4) Includes one-time incentive payment of $100,000 in addition to his annual incentive compensation.(5) Includes one-time incentive payment of $200,000 in addition to his executive incentive compensation plan payment.(6) In addition to the change in the actuarial present value of Mr. Harp’s accumulated benefit under the pension plan, excess SISP, and SISP, this amount
also includes the following amounts attributable to Mr. Harp’s additional retirement benefit:
2007 2008 2009
Change in present value of additional years of service for pension plan $6,033 $3,570 $13,077Change in present value of additional years of service for excess SISP 2,803 3,646 5,259Change in present value of additional years of service for SISP – – –
Mr. Harp’s additional retirement benefit is described in the narrative that follows the Pension Benefits for 2009 table. The additional retirement benefitprovides Mr. Harp with additional retirement benefits equal to the additional benefit he would earn under the pension plan, excess SISP, and the SISPif he had three additional years of service. The amounts in the table above reflect the change in present value of this additional benefit in 2007, 2008,and 2009. The additional retirement benefit was determined by calculating the actuarial present values of the accumulated benefits under the pensionplan, excess SISP, and SISP, with and without the three additional years of service, using the same assumptions used to determine the amountsdisclosed in the Pension Benefits for 2009 table. Because Mr. Harp would be fully vested in his SISP benefit if he retired at age 65, the assumedretirement age of these calculations, the additional years of service provided by the additional retirement agreement would not increase that benefit. IfMr. Harp retires before becoming 100% vested in his SISP benefit, his SISP benefit would be less than the amount shown in the Pension Benefits for2009 table, but the payments he would receive under the additional retirement benefit arrangement would increase, as would the amounts reflected inthe table above and in the Summary Compensation Table.
(7) Includes a company contribution to Mr. Harp’s 401(k), a matching contribution to a charity, payment of a life insurance premium, an additional premiumfor Mr. Harp’s long-term disability insurance, and Mr. Harp’s office and automobile allowance.
Grants of Plan-Based Awards in 2009
All Other All OtherStock Option Grant
Awards: Awards: Exercise Date FairEstimated Future Estimated Future Number of Number of or Base Value of
Payouts Under Non-Equity Payouts Under Equity Shares of Securities Price of Stock andIncentive Plan Awards Incentive Plan Awards Stock or Underlying Option Option_______________________________ ________________________________
Grant Threshold Target Maximum Threshold Target Maximum Units Options Awards AwardsName Date ($) ($) ($) (#) (#) (#) (#) (#) ($/Sh) ($)(a) (b) (c) (d) (e) (f) (g) (h) (i) (j) (k) (l)
Terry D. Hildestad 2/12/09(1) 187,500 750,000 1,500,000 – – – – – –2/12/09(2) – – – 5,482 54,824 109,648 – – – 1,117,861
Vernon A. Raile 2/12/09(1) 73,125 292,500 585,000 – – – – – –2/12/09(2) – – – 1,973 19,736 39,472 – – – 402,417
John G. Harp 2/12/09(1) 73,125 292,500 585,000 – – – – – –2/12/09(2) – – – 1,973 19,736 39,472 – – – 402,4172/12/09(3) 100,000 200,000 – – – – – – –
William E. Schneider 2/12/09(1) 72,703 290,810 581,620 – – – – – –2/12/09(2) – – – 1,962 19,622 39,244 – – – 400,093
Steven L. Bietz 2/12/09(4) 56,875 227,500 455,000 – – – – – –2/12/09(2) – – – 1,535 15,350 30,700 – – – 312,987
(1) Annual incentive for 2009 granted pursuant to the MDU Resources Group, Inc. Long-Term Performance-Based Incentive Plan.(2) Performance shares for the 2009-2011 performance period granted pursuant to the MDU Resources Group, Inc. Long-Term Performance-Based
Incentive Plan.(3) Mr. Harp’s additional 2009 incentive opportunity.(4) Annual incentive for 2009 granted pursuant to the WBI Holdings Inc. Executive Incentive Compensation Plan.
MDU Resources Group, Inc. Proxy Statement 33
Proxy Statement
Narrative Discussion Relating to the Summary Compensation Tableand Grants of Plan-Based Awards Table
Incentive Awards
Annual IncentiveOn February 11, 2009, the compensation committee recommended the 2009 annual incentive award opportunities for our namedexecutive officers, and the board approved these opportunities at its meeting on February 12, 2009. These award opportunities arereflected in the Grants of Plan-Based Awards table at grant on February 12, 2009 in columns (c), (d), and (e) and in the SummaryCompensation Table as earned with respect to 2009 in column (g).
Executive officers may receive annual cash incentive awards based upon achievement of annual performance measures with a threshold,target, and maximum level. A target incentive award is established based on a percent of the executive’s base salary. Actual payment mayrange from zero to 200% of the target based upon achievement of corporate goals.
In order to be eligible to receive an annual incentive award under the Long-Term Performance-Based Incentive Plan, Messrs. Hildestad,Raile, Schneider, and Harp must have remained employed by the company through December 31, 2009, unless the compensationcommittee determines otherwise. The committee has full discretion to determine the extent to which goals have been achieved, thepayment level, whether any final payment will be made, and whether to adjust awards downward based upon individual performance.Unless the committee determines otherwise, performance measure targets shall be adjusted to take into account unusual or nonrecurringevents affecting the company, a subsidiary or a division or business unit, or any of their financial statements, or changes in applicable laws,regulations or accounting principles to the extent such unusual or nonrecurring events or changes in applicable laws, regulations oraccounting principles otherwise would result in dilution or enlargement of the annual incentive award intended to be provided. Suchadjustments are made in a manner that will not cause the award to fail to qualify as performance-based compensation for purposes ofSection 162(m) of the Internal Revenue Code.
With respect to annual incentive awards granted pursuant to the WBI Holdings, Inc. Executive Incentive Compensation Plan, whichincludes Mr. Bietz, participants who retire at age 65 during the year remain eligible to receive an award. Subject to the compensationcommittee’s discretion, executives who terminate employment for other reasons are not eligible for an award.
The committee has full discretion to determine the extent to which goals have been achieved, the payment level, and whether any finalpayment will be made. Once performance goals are approved by the committee for executive incentive compensation plan awards, thecommittee generally does not modify the goals. However, if major unforeseen changes in economic and environmental conditions or othersignificant factors beyond the control of management substantially affected management’s ability to achieve the specified performancegoals, the committee, in consultation with the chief executive officer, may modify the performance goals. Such goal modifications will onlybe considered in years of unusually adverse or favorable external conditions.
For Messrs. Hildestad and Raile, the performance measures for annual incentive awards are our annual return on invested capitalachieved compared to target and our annual earnings per share achieved compared to target. For Messrs. Schneider, Harp, and Bietz,the performance measures for annual incentive awards are their respective business unit’s annual return on invested capital achievedcompared to target and their respective business unit’s allocated earnings per share achieved compared to target. In 2009, Mr. Bietzhad five individual goals relating to WBI Holdings Inc.’s safety results, and each goal that was not met reduced his annual incentiveaward by 1%.
For 2009, the compensation committee weighted the goals for annual return on invested capital compared to target and allocated earningsper share compared to target each at 50%.
We limit the after-tax annual incentive compensation we will pay above the target amount to 20% of earnings in excess of plannedearnings. We calculate the earnings in excess of planned earnings without regard to the after-tax annual incentive amounts above target.We measure the 20% limitation at the major business unit level for business unit and operating company executives, which includeMessrs. Harp, Schneider, and Bietz, and at the corporate level for corporate executives, which include Messrs. Hildestad and Raile. In2009, the 20% limitation was calculated without regard to the noncash ceiling test impairment charge and an associated depletion,depreciation and amortization benefit as discussed in the Compensation Discussion and Analysis.
PR
OXY
34 MDU Resources Group, Inc. Proxy Statement

Proxy StatementP
RO
XY
The award opportunities available to each named executive officer were:
Corresponding payment of2009 earnings per share annual incentive target based on
results as a % of 2009 target earnings per share
Less than 85% 0%85% 25%90% 50%95% 75%
100% 100%103% 120%106% 140%109% 160%112% 180%115% 200%
Corresponding payment of2009 return on invested capital annual incentive target based onresults as a % of 2009 target return on invested capital
Less than 85% 0%85% 25%90% 50%95% 75%
100% 100%103% 120%106% 140%109% 160%112% 180%115% 200%
For discussion of the specific incentive plan performance targets and results, please see the Compensation Discussion and Analysis.
In addition to his 2009 annual incentive award opportunity under our Long-Term Performance-Based Incentive Plan, Mr. Harp had anopportunity to earn an additional incentive, which was structured as follows:
MDU Construction Services Group, Inc.’s 2009 Return on Invested Capital (ROIC) as compared to MDU Construction Services Group, Inc.’s 2009 Weighted Average Cost of Capital (WACC) Additional Incentive Amount
2009 ROIC is less than 100 basis points above 2009 WACC $02009 ROIC is 100 to 199 basis points above 2009 WACC $100,0002009 ROIC is 200 basis points or more above 2009 WACC $200,000
For a specific discussion of this additional incentive opportunity and the compensation committee’s determination with respect to payment,please refer to the Compensation Discussion and Analysis.
Long-Term IncentiveOn February 11, 2009, the compensation committee recommended long-term incentive grants to the named executive officers in the formof performance shares, and the board approved these grants at its meeting on February 12, 2009. These grants are reflected in columns(f), (g), (h), and (l) of the Grants of Plan-Based Awards table and in column (e) of the Summary Compensation Table.
From 0% to 200% of the target grant will be paid out in February 2012, depending on our 2009-2011 total stockholder return comparedto the total three-year stockholder returns of companies in our performance graph peer group. The payout percentage is determinedas follows:
Payout Percentage ofThe Company’s Percentile Rank February 12, 2009 Grant
100th 200%75th 150%50th 100%40th 10%
Less than 40th 0%
Payouts for percentile ranks falling between the intervals will be interpolated. We also will pay dividend equivalents in cash on the numberof shares actually earned for the performance period. The dividend equivalents will be paid in 2012 at the same time as the performanceawards are paid.
MDU Resources Group, Inc. Proxy Statement 35
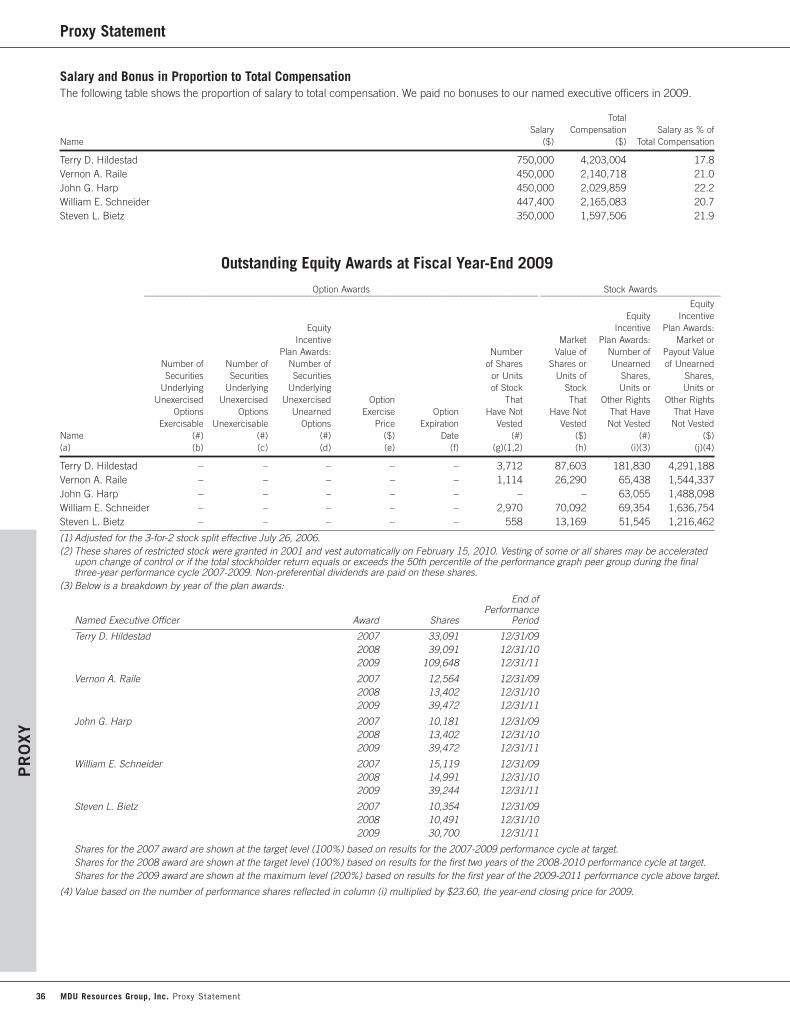
Proxy Statement
Salary and Bonus in Proportion to Total CompensationThe following table shows the proportion of salary to total compensation. We paid no bonuses to our named executive officers in 2009.
TotalSalary Compensation Salary as % of
Name ($) ($) Total Compensation
Terry D. Hildestad 750,000 4,203,004 17.8Vernon A. Raile 450,000 2,140,718 21.0John G. Harp 450,000 2,029,859 22.2William E. Schneider 447,400 2,165,083 20.7Steven L. Bietz 350,000 1,597,506 21.9
Outstanding Equity Awards at Fiscal Year-End 2009
Option Awards Stock Awards____________________________________________________________________________________________ __________________________________________Equity
Equity IncentiveEquity Incentive Plan Awards:
Incentive Market Plan Awards: Market orPlan Awards: Number Value of Number of Payout Value
Number of Number of Number of of Shares Shares or Unearned of UnearnedSecurities Securities Securities or Units Units of Shares, Shares,
Underlying Underlying Underlying of Stock Stock Units or Units orUnexercised Unexercised Unexercised Option That That Other Rights Other Rights
Options Options Unearned Exercise Option Have Not Have Not That Have That HaveExercisable Unexercisable Options Price Expiration Vested Vested Not Vested Not Vested
Name (#) (#) (#) ($) Date (#) ($) (#) ($)(a) (b) (c) (d) (e) (f) (g)(1,2) (h) (i)(3) (j)(4)
Terry D. Hildestad – – – – – 3,712 87,603 181,830 4,291,188Vernon A. Raile – – – – – 1,114 26,290 65,438 1,544,337John G. Harp – – – – – – – 63,055 1,488,098William E. Schneider – – – – – 2,970 70,092 69,354 1,636,754Steven L. Bietz – – – – – 558 13,169 51,545 1,216,462
(1) Adjusted for the 3-for-2 stock split effective July 26, 2006.(2) These shares of restricted stock were granted in 2001 and vest automatically on February 15, 2010. Vesting of some or all shares may be accelerated
upon change of control or if the total stockholder return equals or exceeds the 50th percentile of the performance graph peer group during the final three-year performance cycle 2007-2009. Non-preferential dividends are paid on these shares.
(3) Below is a breakdown by year of the plan awards:End of
PerformanceNamed Executive Officer Award Shares Period
Terry D. Hildestad 2007 33,091 12/31/092008 39,091 12/31/102009 109,648 12/31/11
Vernon A. Raile 2007 12,564 12/31/092008 13,402 12/31/102009 39,472 12/31/11
John G. Harp 2007 10,181 12/31/092008 13,402 12/31/102009 39,472 12/31/11
William E. Schneider 2007 15,119 12/31/092008 14,991 12/31/102009 39,244 12/31/11
Steven L. Bietz 2007 10,354 12/31/092008 10,491 12/31/102009 30,700 12/31/11
Shares for the 2007 award are shown at the target level (100%) based on results for the 2007-2009 performance cycle at target.Shares for the 2008 award are shown at the target level (100%) based on results for the first two years of the 2008-2010 performance cycle at target.Shares for the 2009 award are shown at the maximum level (200%) based on results for the first year of the 2009-2011 performance cycle above target.
(4) Value based on the number of performance shares reflected in column (i) multiplied by $23.60, the year-end closing price for 2009.
PR
OXY
36 MDU Resources Group, Inc. Proxy Statement

Proxy StatementP
RO
XY
Option Exercises and Stock Vested during 2009
Option Awards Stock Awards___________________________________ ___________________________________Number of Number of
Shares Acquired Value Realized Shares Acquired Value Realizedon Exercise on Exercise on Vesting on Vesting
Name (#) ($) (#) ($)(a) (b) (c) (d)(1,2) (e)(3)
Terry D. Hildestad – – 19,584 397,426Vernon A. Raile – – 10,192 206,830John G. Harp – – 8,259 167,603William E. Schneider – – 12,534 254,358Steven L. Bietz – – 5,755 116,789
(1) Adjusted for the 3-for-2 stock split effective July 26, 2006.(2) Reflects performance shares for the 2006-2008 performance period that vested on February 12, 2009.(3) Reflects the value of performance shares based on our stock price of $18.61 on February 12, 2009, and the dividend equivalents
that were paid on the vested shares.
Pension Benefits for 2009
Number of Present Value PaymentsYears Credited of Accumulated During Last
Service Benefit Fiscal YearName Plan Name (#) ($) ($)(a) (b) (c) (d) (e)
Terry D. Hildestad Pension Plan 35 1,369,893 –SISP I(1) 27 1,487,740 –SISP II(2) 27 2,456,479 –SISP Excess 27 842,854 –
Vernon A. Raile Pension Plan 30 1,033,470 –SISP I(1) 27 891,572 –SISP II(2) 27 1,899,169 –SISP Excess 27 – –
John G. Harp Pension Plan 5 172,100 –SISP I(1) 4 – –SISP II(2) 4 1,784,336 –SISP Excess 4 33,837 –Harp Additional Retirement Benefit 4 120,136 –
William E. Schneider Pension Plan 16 667,138 –SISP I(1) 15 1,081,798 –SISP II(2) 15 1,278,020 –SISP Excess 15 128,798 –
Steven L. Bietz Pension Plan 28 675,382 –SISP I(1) 15 458,686 –SISP II(2) 15 440,819 –SISP Excess 15 72,082 –
(1) Grandfathered under Section 409A.(2) Not grandfathered under Section 409A.
The amounts shown for the pension plan and excess SISP represent the actuarial present values of the executives’ accumulated benefitsaccrued as of December 31, 2009, calculated using a 5.75% discount rate, the 1994 Group Annuity Mortality Table for post-retirementmortality, and no recognition of future salary increases or pre-retirement mortality. The assumed retirement ages for these benefits was age60 for Messrs. Harp and Bietz and age 62 for Mr. Schneider. These are the earliest ages at which the executives could begin receivingunreduced benefits. Retirement on December 31, 2009, was assumed for Messrs. Hildestad and Raile, who were age 60 and 64,respectively, on that date. The amounts shown for the SISP I and SISP II were determined using a 5.75% discount rate and assumebenefits commenced at age 65. The assumptions used to calculate Mr. Harp’s additional retirement benefit are described below.
Pension PlansMessrs. Hildestad, Raile, and Harp participate in the MDU Resources Group, Inc. Pension Plan for Non-Bargaining Unit Employees, whichwe refer to as our pension plan. Mr. Schneider participates in the Knife River Corporation Salaried Employees’ Pension Plan, which werefer to as the KR pension plan. Mr. Bietz participates in the Williston Basin Interstate Pipeline Company Pension Plan, which we refer to
MDU Resources Group, Inc. Proxy Statement 37
Proxy Statement
as the WBI pension plan. Pension benefits under our pension plan and the WBI pension plan are based on the participant’s averageannual salary over the 60 consecutive month period in which the participant received the highest annual salary during the participant’sfinal 10 years of service. For this purpose, only a participant’s salary is considered; incentives and other forms of compensation are notincluded. Benefits are determined by multiplying (1) the participant’s years of credited service by (2) the sum of (a) the average annualsalary up to the social security integration level times 1.1% and (b) the average annual salary over the social security integration level times1.45%. The KR pension plan uses the same formula except that 1.2% and 1.6% are used instead of 1.1% and 1.45%. The maximumyears of service recognized when determining benefits under each of the pension plans is 35. Pension plan benefits are not reduced forsocial security benefits.
Each of the pension plans was amended to cease benefit accruals as of December 31, 2009, meaning the normal retirement benefit willnot change.
To receive unreduced retirement benefits under our pension plan and the WBI pension plan, participants must either remain employeduntil age 60 or elect to defer commencement of benefits until age 60. Under the KR pension plan, participants must remain employeduntil age 62 or elect to defer commencement of benefits until age 62 to receive unreduced benefits. Messrs. Hildestad and Raile wereeligible for unreduced retirement benefits under our pension plan on December 31, 2009. Participants whose employment terminatesbetween the ages of 55 and 60, with 5 years of service, in our pension plan or the WBI pension plan and between the ages of 55 and 62,with 5 years of service, in the KR pension plan are eligible for early retirement benefits. Early retirement benefits are determined byreducing the normal retirement benefit by 0.25% per month for each month before age 60 in our pension plan and the WBI pension planand age 62 in the KR pension plan. If a participant’s employment terminates before age 55, the same reduction applies for each monththe termination occurs before age 62, with the reduction capped at 21%. Messrs. Harp and Schneider are currently eligible for earlyretirement benefits.
Benefits for single participants under the pension plans are paid as straight life amounts and benefits for married participants are paid asactuarially reduced pensions with a survivor benefit for spouses, unless participants choose otherwise. Participants who terminateemployment before age 55 may elect to receive their benefits in a lump sum. Mr. Bietz is currently eligible for a lump sum.
The Internal Revenue Code places limitations on benefit amounts that may be paid under the pension plans and on the amount ofcompensation that may be recognized when determining benefits. In 2009, the maximum annual benefit payable under the pension planswas $195,000 and the maximum amount of compensation that could be recognized when determining benefits was $245,000.
Supplemental Income Security PlanWe also offer key managers and executives, including all of our named executive officers, benefits under our nonqualified retirement plan,which we refer to as the Supplemental Income Security Plan or SISP. Benefits under the SISP consist of:
• a supplemental retirement benefit intended to augment the retirement income provided under our qualified pension plans – we refer tothis benefit as the regular SISP benefit
• an excess retirement benefit relating to Internal Revenue Code limitations on retirement benefits provided under our qualified pensionplans - we refer to this benefit as the excess SISP benefit, and
• death benefits – we refer to these benefits as the SISP death benefit.
Effective January 1, 2010, we amended the SISP to:
• reduce by 20% the regular SISP and death benefit levels in the benefit schedule used to determine regular SISP and death benefits fornew participants and participants whose benefit levels increase on or after January 1, 2010
• impose an additional vesting period applicable to any increased regular SISP benefit and SISP death benefit occurring on or afterJanuary 1, 2010
• eliminate the excess SISP benefit for new participants and current participants who were not already eligible for the excess SISPbenefit, and
• freeze excess SISP benefit accruals.
SISP benefits are forfeited if the participant’s employment is terminated for cause.
PR
OXY
38 MDU Resources Group, Inc. Proxy Statement

Proxy StatementP
RO
XY
Regular SISP Benefits and Death BenefitsRegular SISP benefits and death benefits are determined by reference to one of two schedules attached to the SISP - the original scheduleor the amended schedule. Our compensation committee, after receiving recommendations from our chief executive officer, determines thelevel at which participants are placed in the schedules. A participant’s placement is generally, but not always, determined by reference tothe participant’s annual base salary. Benefit levels in the amended schedule which became effective on January 1, 2010, are 20% lowerthan the benefit levels in the original schedule. The amended schedule applies to new participants and participants who receive a benefitlevel increase on or after January 1, 2010.
Participants can elect to receive (1) the regular SISP benefit only, (2) the SISP death benefit only, or (3) a combination of both.Regardless of the participant’s election, if the participant dies before the regular SISP benefit would commence, only the SISP deathbenefit is provided. If the participant elects to receive both a regular SISP benefit and a SISP death benefit, each of the benefits isreduced proportionately.
The regular SISP benefits reflected in the table above are based on the assumption that the participant elects to receive only the regularSISP benefit. The present values of the SISP death benefits that would be provided if the named executive officers were to die prior to thecommencement of regular SISP benefits are reflected in the table that appears in the section entitled “Potential Payments uponTermination or Change of Control.”
The SISP was amended to address changes in applicable tax laws resulting from the enactment of section 409A of the Internal RevenueCode. Regular SISP benefits that were vested as of December 31, 2004 and were thereby grandfathered under section 409A remainsubject to SISP provisions then in effect, which we refer to as SISP I benefits. Regular SISP benefits that are subject to section 409A,which we refer to as SISP II benefits, are governed by amended provisions intended to comply with section 409A. Participants generallyhave more discretion with respect to the distributions of their SISP I benefits.
The time and manner in which the regular SISP benefits are paid depend on a variety of factors, including the time and form of benefitelected by the participant and whether the benefits are SISP I or SISP II benefits. Unless the participant elects otherwise, the SISP Ibenefits are paid over 180 months, with benefits commencing when the participant attains age 65 or, if later, when the participant retires.The SISP II benefits commence when the participant attains age 65 or, if later, when the participant retires, subject to a six-month delay ifthe participant is subject to the provisions of section 409A of the Internal Revenue Code that require delayed commencement of thesetypes of retirement benefits. The SISP II benefits are paid over 180 months or, if commencement of payments is delayed for six months,173 months. If the commencement of benefits is delayed for six months, the first payment includes the payments that would have beenpaid during the six-month period. If the participant dies after the regular SISP benefits have begun but before receipt of all of the regularSISP benefits, the remaining payments are made to the participant’s designated beneficiary.
Rather than receiving their regular SISP I benefits in equal monthly installments over 15 years commencing at age 65, participants canelect a different form and time of commencement of their SISP I benefits. Participants can elect to defer commencement of the regularSISP I benefits. If this is elected, the participant retains the right to receive a monthly SISP death benefit if death occurs prior to thecommencement of the regular SISP I benefit.
Participants also can elect to receive their SISP I benefits in one of three actuarially equivalent forms – a life annuity, 100% joint andsurvivor annuity, or a joint and two-thirds joint and survivor annuity, provided that the cost of providing these actuarial equivalent formsof benefits does not exceed the cost of providing the normal form of benefit. Neither the election to receive an actuarial equivalent benefitnor the administrator’s right to pay the regular SISP benefit in the form of an actuarially equivalent lump sum are available with respect toSISP II benefits.
To promote retention, the regular SISP benefits are subject to the following ten-year vesting schedule:
• 0% vesting for less than 3 years of participation
• 20% vesting for 3 years of participation
• 40% vesting for 4 years of participation, and
• an additional 10% vesting for each additional year of participation up to 100% vesting for 10 years of participation.
In 2009, the plan was amended to impose an additional vesting requirement on benefit level increases for the regular SISP benefit grantedon or after January 1, 2010. The requirement applies only to the increased benefit level. The increased benefit vests after the later of threeadditional years of participation in the SISP or the end of the regular vesting schedule described above. The additional three-year vesting
MDU Resources Group, Inc. Proxy Statement 39

Proxy Statement
requirement for benefit level increases is pro-rated for participants who are officers, attain age 65, and are required to retire, pursuant tothe company’s bylaws, prior to the end of the additional vesting period as follows:
• 33% of the increase vests for participants required to retire at least one year but less than two years after the increase is granted, and
• 66% of the increase vests for participants required to retire at least two years but less than three years after the increase is granted.
The benefit level increases of participants who attain age 65 and are required to retire pursuant to the company’s bylaws will be furtherreduced to the extent the participants are not fully vested in their regular SISP benefit under the 10-year vesting schedule describedabove. The additional vesting period associated with a benefit level increase may be waived by the compensation committee.
SISP death benefits become fully vested if the participant dies while actively employed. Otherwise, the SISP death benefits are subject tothe same vesting schedules as the regular SISP benefits.
Excess SISP BenefitsExcess SISP benefits are equal to the difference between (1) the monthly retirement benefits that would have been payable to theparticipant under the qualified pension plans absent the limitations under the Internal Revenue Code and (2) the actual benefits payableto the participant under the qualified pension plan. Participants are only eligible for the excess SISP benefits if (1) the participant is fullyvested under the qualified pension plan, (2) the participant’s employment terminates prior to age 65, and (3) benefits under the qualifiedpension plan are reduced due to limitations under the Internal Revenue Code on plan compensation. Effective January 1, 2005,participants who were not then vested in the excess SISP benefits were also required to remain actively employed by the company untilage 60. In 2009, the plan was amended to limit eligibility of the excess SISP benefit to current SISP participants (1) who are already vestedin the excess SISP benefit or (2) who will become vested in the excess SISP benefits if they remain employed with the company until age60. The plan was further amended to freeze the excess SISP benefits to a maximum of the benefit level payable based on the participant’syears of service and compensation level as of December 31, 2009. With the exception of Mr. Harp, each of the named executive officerswould be entitled to the excess SISP benefit if they were to terminate employment prior to age 65. Mr. Harp must remain employed untilage 60 to become entitled to his excess SISP benefit.
Benefits generally commence six months after the participant’s employment terminates and continue to age 65 or until the death of theparticipant, if prior to age 65. If a participant who dies prior to age 65 elected a joint and survivor benefit, the survivor’s excess SISP benefitis paid until the date the participant would have attained age 65.
Mr. Harp’s Additional Retirement BenefitTo encourage Mr. Harp to remain with the company, on November 16, 2006, upon recommendation of our chief executive officer andthe compensation committee, our board of directors approved an additional retirement benefit for Mr. Harp. The benefit provides forMr. Harp to receive payments that represent the equivalent of an additional three years of service under our pension plan, the excessSISP, and the SISP. The additional three years of service recognize Mr. Harp’s previous employment with a subsidiary of the company.To calculate payments Mr. Harp could receive due to his additional retirement benefit, we applied the additional years of service to eachof the retirement arrangements and assumed he remained employed until age 60, for purposes of calculating the additional benefit underthe pension plan and excess SISP, and age 65, for purposes of calculating the additional benefit under the SISP II. Because Mr. Harpwould be fully vested in the SISP II benefit if he retired at age 65, the additional years of service provided by the agreement would notincrease his SISP II benefit. Consequently, the amount shown in the table does not include any additional benefit attributable to the SISPII. If Mr. Harp were to retire before achieving 10 years of service and becoming fully vested in his SISP II benefit, the additional years ofservice provided by the additional retirement benefit would increase his vesting percentage under the SISP II and therefore would resultin an additional payment. For a description of the payments that could be provided under the additional retirement benefit if Mr. Harp’semployment were to be terminated on December 31, 2009, refer to the table and related notes in “Potential Payment upon Terminationor Change of Control” below.
The SISP also provides that if a participant becomes totally disabled, the participant will continue to receive credit for up to two additionalyears under the SISP as long as the participant is totally disabled during such time. Since the named executive officers other thanMr. Harp are fully vested in their SISP benefits, this would not result in any incremental benefit for the named executive officers otherthan Mr. Harp. The present value of these two additional years of service for Mr. Harp is reflected in the table that appears in the sectionentitled “Potential Payments upon Termination or Change of Control.”
PR
OXY
40 MDU Resources Group, Inc. Proxy Statement
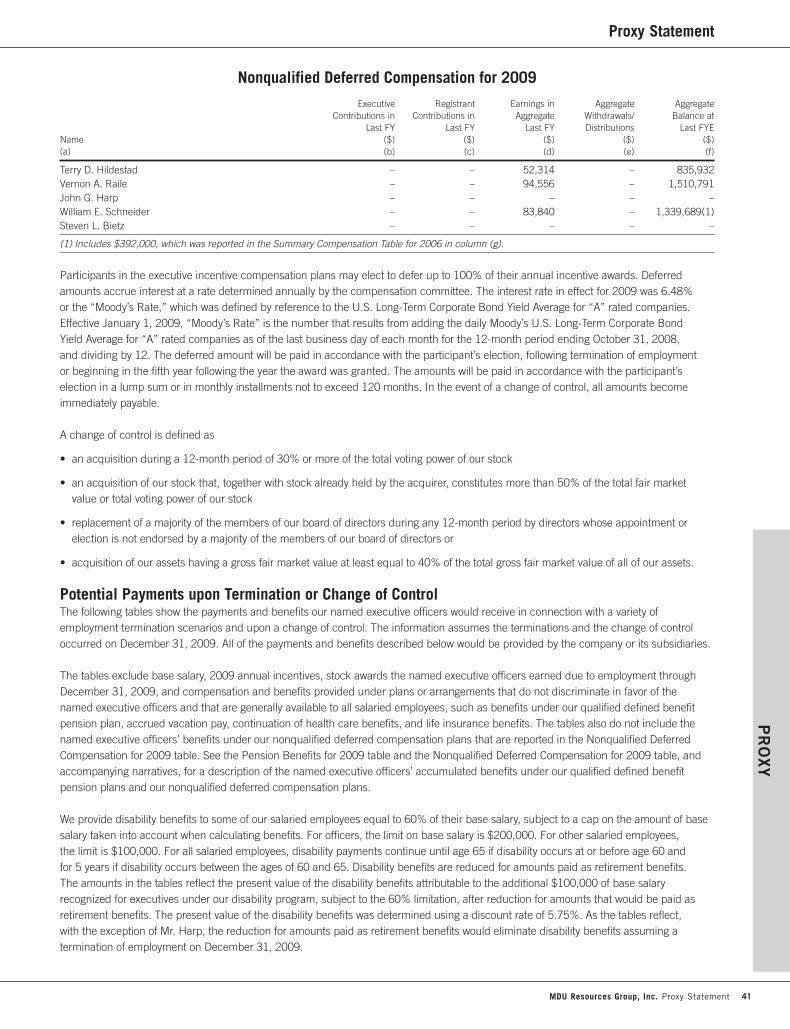
Proxy StatementP
RO
XY
Nonqualified Deferred Compensation for 2009
Executive Registrant Earnings in Aggregate AggregateContributions in Contributions in Aggregate Withdrawals/ Balance at
Last FY Last FY Last FY Distributions Last FYEName ($) ($) ($) ($) ($)(a) (b) (c) (d) (e) (f)
Terry D. Hildestad – – 52,314 – 835,932Vernon A. Raile – – 94,556 – 1,510,791John G. Harp – – – – –William E. Schneider – – 83,840 – 1,339,689(1)Steven L. Bietz – – – – –
(1) Includes $392,000, which was reported in the Summary Compensation Table for 2006 in column (g).
Participants in the executive incentive compensation plans may elect to defer up to 100% of their annual incentive awards. Deferredamounts accrue interest at a rate determined annually by the compensation committee. The interest rate in effect for 2009 was 6.48%or the “Moody’s Rate,” which was defined by reference to the U.S. Long-Term Corporate Bond Yield Average for “A” rated companies.Effective January 1, 2009, “Moody’s Rate” is the number that results from adding the daily Moody’s U.S. Long-Term Corporate BondYield Average for “A” rated companies as of the last business day of each month for the 12-month period ending October 31, 2008,and dividing by 12. The deferred amount will be paid in accordance with the participant’s election, following termination of employmentor beginning in the fifth year following the year the award was granted. The amounts will be paid in accordance with the participant’selection in a lump sum or in monthly installments not to exceed 120 months. In the event of a change of control, all amounts becomeimmediately payable.
A change of control is defined as
• an acquisition during a 12-month period of 30% or more of the total voting power of our stock
• an acquisition of our stock that, together with stock already held by the acquirer, constitutes more than 50% of the total fair marketvalue or total voting power of our stock
• replacement of a majority of the members of our board of directors during any 12-month period by directors whose appointment orelection is not endorsed by a majority of the members of our board of directors or
• acquisition of our assets having a gross fair market value at least equal to 40% of the total gross fair market value of all of our assets.
Potential Payments upon Termination or Change of ControlThe following tables show the payments and benefits our named executive officers would receive in connection with a variety ofemployment termination scenarios and upon a change of control. The information assumes the terminations and the change of controloccurred on December 31, 2009. All of the payments and benefits described below would be provided by the company or its subsidiaries.
The tables exclude base salary, 2009 annual incentives, stock awards the named executive officers earned due to employment throughDecember 31, 2009, and compensation and benefits provided under plans or arrangements that do not discriminate in favor of thenamed executive officers and that are generally available to all salaried employees, such as benefits under our qualified defined benefitpension plan, accrued vacation pay, continuation of health care benefits, and life insurance benefits. The tables also do not include thenamed executive officers’ benefits under our nonqualified deferred compensation plans that are reported in the Nonqualified DeferredCompensation for 2009 table. See the Pension Benefits for 2009 table and the Nonqualified Deferred Compensation for 2009 table, andaccompanying narratives, for a description of the named executive officers’ accumulated benefits under our qualified defined benefitpension plans and our nonqualified deferred compensation plans.
We provide disability benefits to some of our salaried employees equal to 60% of their base salary, subject to a cap on the amount of basesalary taken into account when calculating benefits. For officers, the limit on base salary is $200,000. For other salaried employees,the limit is $100,000. For all salaried employees, disability payments continue until age 65 if disability occurs at or before age 60 andfor 5 years if disability occurs between the ages of 60 and 65. Disability benefits are reduced for amounts paid as retirement benefits.The amounts in the tables reflect the present value of the disability benefits attributable to the additional $100,000 of base salaryrecognized for executives under our disability program, subject to the 60% limitation, after reduction for amounts that would be paid asretirement benefits. The present value of the disability benefits was determined using a discount rate of 5.75%. As the tables reflect,with the exception of Mr. Harp, the reduction for amounts paid as retirement benefits would eliminate disability benefits assuming atermination of employment on December 31, 2009.
MDU Resources Group, Inc. Proxy Statement 41

Proxy Statement
Upon a change of control, share-based awards granted under our Long-Term Performance-Based Incentive Plan vest and non-share-based awards are paid in cash. All shares of restricted stock would vest in full upon a change of control. All performance share awardswould vest at their target levels. For this purpose, the term change of control is defined as:
• the acquisition by an individual, entity, or group of 20% or more of our outstanding voting securities
• a turnover in a majority of our board of directors without the approval of a majority of the members of the board who were members ofthe board as of the plan’s effective date or whose election was approved by such board members
• consummation of a merger or consolidation or sale or other disposition of all or substantially all of the company’s assets, unless thecompany’s stockholders immediately prior to the transaction beneficially own more than 60% of the outstanding shares and votingpower of the resulting corporation after the merger or the corporation that acquires the company’s assets, as the case may be or
• stockholder approval of the company’s liquidation or dissolution.
Shares of restricted stock and associated dividends are forfeited upon termination of employment. Performance shares are forfeited iftermination of employment occurs during the first year of the performance period. If a termination of employment occurs for a reason otherthan cause, performance share awards granted prior to 2009 are prorated as follows:
• if the termination of employment occurs during the second year of the performance period, the executive receives a prorated portion ofany performance shares earned based on the number of months employed during the performance period and
• if the termination of employment occurs during the third year of the performance period, the executive receives the full amount of anyperformance shares earned.
Beginning with performance share awards granted in 2009, these awards will be forfeited if the participant’s employment terminates forany reason before the participant has reached age 55 and completed 10 years of service. Performance shares and related dividendequivalents for those participants whose employment is terminated after the participant has reached age 55 and completed 10 years ofservice will be prorated as described above.
Accordingly, if a December 31, 2009 termination is assumed, the named executive officers’ 2009-2011 performance share awards wouldbe forfeited, any amounts earned under the 2008-2010 performance share awards would be reduced by one-third, and any amountsearned under the 2007-2009 performance share awards would not be reduced. The number of performance shares earned depends onactual performance through the full performance period. As actual performance for the 2007-2009 performance share awards has beendetermined, the amounts for these awards in the event of a non-change of control termination were based on actual performance, whichresulted in vesting of 100% of the target award. Amounts for the 2008-2010 performance share awards are also shown at target, basedupon assumed target performance. No amounts are shown for the 2009-2011 performance share awards because such awards wouldbe forfeited. Although vesting would only occur after completion of the performance period, the amounts shown in the tables were notreduced to reflect the present value of the performance shares that could vest. Dividend equivalents attributable to earned performanceshares would also be paid. Dividend equivalents accrued through December 31, 2009 are included in the amounts shown.
The value of the vesting of shares of restricted stock and performance shares shown in the tables was determined by multiplying thenumber of shares of restricted stock or performance shares that would vest upon termination or a change of control by the closing price ofour stock on December 31, 2009.
We also have change of control employment agreements with our named executive officers and other executives, which provide certainprotections to the executives in the event there is a change of control of the company.
For these purposes, we define “change of control” as:
• the acquisition by an individual, entity, or group of 20% or more of our voting securities
• a turnover in a majority of our board of directors without the approval of a majority of the members of the board who were members ofthe board as of the agreement date or whose election was approved by such board members
• consummation of a merger or consolidation, unless our stockholders immediately prior to the merger beneficially own more than 60% ofthe outstanding shares and voting power of the resulting corporation after the merger or
• stockholder approval of our liquidation or dissolution.
PR
OXY
42 MDU Resources Group, Inc. Proxy Statement

Proxy StatementP
RO
XY
If a change of control occurs, the agreements provide for a three-year employment period from the date of the change of control, duringwhich the named executive officer is entitled to receive:
• a base salary of not less than twelve times the highest monthly salary paid within the preceding twelve months
• annual incentive opportunity of not less than the highest annual incentive paid in any of the three years before the change of control
• participation in our incentive, savings, retirement, and welfare benefit plans
• reasonable vehicle allowance, home office allowance, and subsidized annual physical examinations and
• office and support staff, vacation, and expense reimbursement consistent with such benefits as they were provided before the changeof control.
Assuming a change of control occurred on December 31, 2009, the guaranteed minimum level of base salary provided over the three-yearemployment period would not result in an increase in any of the named executive officers’ base salaries. The minimum annual incentiveamounts Messrs. Hildestad, Raile, Harp, Schneider, and Bietz would be entitled to over the three-year employment period would be$1,500,000, $585,000, $720,000, $581,620, and $450,450, respectively. The agreements also provide that severance payments andbenefits will be provided:
• if we terminate the named executive officer’s employment during the employment period, other than for cause or disability, or
• the named executive officer resigns for good reason.
“Cause” means the named executive officer’s willful and continued failure to substantially perform his duties or willfully engaging in illegalconduct or gross misconduct materially injurious to the company. “Good reason” includes:
• a material diminution of the named executive officer’s authority, duties, or responsibilities
• a material change in the named executive officer’s work location and
• our material breach of the agreement.
In such event, the named executive officer would receive:
• accrued but unpaid base salary and accrued but unused vacation
• a lump sum payment equal to three times his (a) annual salary using the higher of the then current annual salary or twelve times thehighest monthly salary paid within the twelve months before the change of control and (b) annual incentive using the highest annualincentive paid in any of the three years before the change of control or, if higher, the annual incentive for the most recently completedfiscal year
• a pro-rated annual incentive for the year of termination
• an amount equal to the actuarial equivalent of the additional benefit the named executive officer would receive under the SISP and anyother supplemental or excess retirement plan if employment continued for an additional three years
• outplacement benefits and
• a payment equal to any federal excise tax on excess parachute payments if the total parachute payments exceed 110% of the safeharbor amount for that tax. If this 110% threshold is not exceeded, the named executive officer’s payments and benefits would bereduced to avoid the tax. The named executive officers are not reimbursed for any taxes imposed on this tax reimbursement payment.
This description of severance payments and benefits reflects the terms of the agreements as in effect on December 31, 2009.
The compensation committee may also consider providing severance benefits on a case-by-case basis for employment terminations notrelated to a change of control. The compensation committee adopted a checklist of factors in February 2005 to consider when determiningwhether any such severance benefits should be paid. The tables do not reflect any such severance benefits, as these benefits are made inthe discretion of the committee on a case-by-case basis and it is not possible to estimate the severance benefits, if any, that would be paid.
MDU Resources Group, Inc. Proxy Statement 43

Proxy Statement
Terry D. HildestadNot forCause
or GoodReason
Termination Change ofExecutive Benefits and Not for Following ControlPayments Upon Voluntary Cause For Cause Change of (WithoutTermination or Termination Termination Termination Death Disability Control Termination)Change of Control ($) ($) ($) ($) ($) ($) ($)
Compensation:Base Salary 2,250,000Short-term Incentive(1) 6,000,0002007-2009 Performance Shares 836,653 836,653 836,653 836,653 836,653 836,6532008-2010 Performance Shares 645,270 645,270 645,270 645,270 967,893 967,8932009-2011 Performance Shares 1,326,741 1,326,741Restricted Stock 87,603 87,603
Benefits and Perquisites:Regular SISP(2) 3,944,219 3,944,219 3,944,219 3,944,219Excess SISP(3) 842,838 842,838 842,838 842,838SISP Death Benefits(4) 10,335,773Disability BenefitsOutplacement Services 50,000280G Tax(5) 1,940,878
Total 6,268,980 6,268,980 11,817,696 6,268,980 18,246,825 3,218,890
(1) Includes the prorated annual incentive for the year of termination, which is the full annual incentive since we assume termination occurred onDecember 31, 2009, and the additional severance payment of three times the annual incentive. For each of these, we used the higher of (1) theannual incentive earned in 2009 or (2) the highest annual incentive paid in 2007, 2008, and 2009.
(2) Represents the present value of Mr. Hildestad’s vested regular SISP benefit as of December 31, 2009, which was $42,710 per month for 15 years,commencing at age 65. Present value was determined using a 5.75% discount rate. The terms of the regular SISP benefit are described following thePension Benefits for 2009 table. The three additional years of vesting credit assumed for purposes of calculating the additional SISP benefit underMr. Hildestad’s change of control agreement would not increase the actuarial present value of his SISP amount.
(3) Represents the present value of all excess SISP benefits Mr. Hildestad would be entitled to upon termination of employment under the SISP. Presentvalue was determined using a 5.75% discount rate. The terms of the excess SISP benefit are described following the Pension Benefits for 2009 table.The three additional years of employment assumed for purposes of calculating the additional retirement plan payment under Mr. Hildestad’s change ofcontrol agreement would not increase the actuarial present value of his excess SISP benefits.
(4) Represents the present value of 180 monthly payments of $85,420 per month, which would be paid as a SISP death benefit under the SISP. Presentvalue was determined using a 5.75% discount rate. The terms of the SISP death benefit are described following the Pension Benefits for 2009 table.
(5) Determined applying the Internal Revenue Code section 4999 excise tax of 20% only if 110% threshold is exceeded.
PR
OXY
44 MDU Resources Group, Inc. Proxy Statement

Proxy StatementP
RO
XY
Vernon A. RaileNot forCause
or GoodReason
Termination Change ofExecutive Benefits and Not for Following ControlPayments Upon Voluntary Cause For Cause Change of (WithoutTermination or Termination Termination Termination Death Disability Control Termination)Change of Control ($) ($) ($) ($) ($) ($) ($)
Compensation:Base Salary 1,350,000Short-term Incentive(1) 2,340,0002007-2009 Performance Shares 317,661 317,661 317,661 317,661 317,661 317,6612008-2010 Performance Shares 221,231 221,231 221,231 221,231 331,834 331,8342009-2011 Performance Shares 477,611 477,611Restricted Stock 26,290 26,290
Benefits and Perquisites:Regular SISP(2) 2,790,741 2,790,741 2,790,741 2,790,741SISP Death Benefits(3) 5,529,675Disability BenefitsOutplacement Services 50,000280G Tax(4) 856,992
Total 3,329,633 3,329,633 6,068,567 3,329,633 8,541,129 1,153,396
(1) Includes the prorated annual incentive for the year of termination, which is the full annual incentive since we assume termination occurred onDecember 31, 2009, and the additional severance payment of three times the annual incentive. For each of these, we used the higher of (1) theannual incentive earned in 2009 or (2) the highest annual incentive paid in 2007, 2008, and 2009.
(2) Represents the present value of Mr. Raile’s vested regular SISP benefit as of December 31, 2009, which was $22,850 per month for 15 years,commencing at age 65. Present value was determined using a 5.75% discount rate. The terms of the regular SISP benefit are described following thePension Benefits for 2009 table. The three additional years of vesting credit assumed for purposes of calculating the additional SISP benefit underMr. Raile’s change of control agreement would not increase the actuarial present value of his SISP amount.
(3) Represents the present value of 180 monthly payments of $45,700 per month, which would be paid as a SISP death benefit under the SISP. Presentvalue was determined using a 5.75% discount rate. The terms of the SISP death benefit are described following the Pension Benefits for 2009 table.
(4) Determined applying the Internal Revenue Code section 4999 excise tax of 20% only if 110% threshold is exceeded.
MDU Resources Group, Inc. Proxy Statement 45

Proxy Statement
John G. HarpNot forCause
or GoodReason
Termination Change ofExecutive Benefits and Not for Following ControlPayments Upon Voluntary Cause For Cause Change of (WithoutTermination or Termination Termination Termination Death Disability Control Termination)Change of Control ($) ($) ($) ($) ($) ($) ($)
Compensation:Base Salary 1,350,000Short-term Incentive(1) 2,880,0002007-2009 Performance Shares 257,410 257,410 257,410 257,410 257,410 257,4102008-2010 Performance Shares 221,231 221,231 221,231 221,231 331,834 331,8342009-2011 Performance Shares 477,611 477,611Restricted Stock
Benefits and Perquisites:Incremental Pension(2) 107,307 107,307 107,307 107,307Regular SISP 1,249,035(3) 1,249,035(3) 1,603,546(4) 1,784,336(5)Excess SISP(6) 193,615SISP Death Benefits(7) 5,529,675Disability Benefits(8) 227,839Outplacement Services 50,000280G Tax(9) 1,068,156
Total 1,834,983 1,834,983 6,008,316 2,417,333 8,500,269 1,066,855
(1) Includes the prorated annual incentive for the year of termination, which is the full annual incentive since we assume termination occurred onDecember 31, 2009, and the additional severance payment of three times the annual incentive. For each of these, we used the higher of (1) theannual incentive earned in 2009 or (2) the highest annual incentive paid in 2007, 2008, and 2009.
(2) Represents the equivalent of three additional years of service that would be provided under the Harp additional retirement benefit described followingthe Pension Benefits for 2009 table. Present value was determined using a 5.75% discount rate.
(3) Represents the present value of Mr. Harp’s vested regular SISP benefit as of December 31, 2009, which was $15,995 per month for 15 years,commencing at age 65. Present value was determined using a 5.75% discount rate. The terms of the regular SISP benefit are described following thePension Benefits for 2009 table. Also includes the additional benefit attributable to three additional years of service that would be provided under theretirement benefit agreement described following the Pension Benefits for 2009 table.
(4) Represents the present value of Mr. Harp’s vested SISP benefit described in footnote 3, adjusted to reflect the increase in the present value of hisregular SISP benefit that would result from an additional two years of vesting under the SISP. Present value was determined using a 5.75% discountrate.
(5) Represents the present value of Mr. Harp’s vested SISP benefit described in footnote 3, adjusted to reflect the increase in the present value of hisregular SISP benefit that would result if he continued employment for an additional three years. Present value was determined using a 5.75%discount rate.
(6) Represents the present value of all excess SISP benefits Mr. Harp would be entitled to, calculated with the assumption of three additional years ofemployment, as provided under Mr. Harp’s change of control agreement. Present value was determined using a 5.75% discount rate. The terms ofthe excess SISP benefit are described following the Pension Benefits for 2009 table.
(7) Represents the present value of 180 monthly payments of $45,700 per month, which would be paid as a SISP death benefit under the SISP. Presentvalue was determined using a 5.75% discount rate. The terms of the SISP death benefit are described following the Pension Benefits for 2009 table.
(8) Represents the present value of the disability benefit after reduction for amounts that would be paid as retirement benefits. Present value wasdetermined using a 5.75% discount rate.
(9) Determined applying the Internal Revenue Code section 4999 excise tax of 20% only if 110% threshold is exceeded.
PR
OXY
46 MDU Resources Group, Inc. Proxy Statement
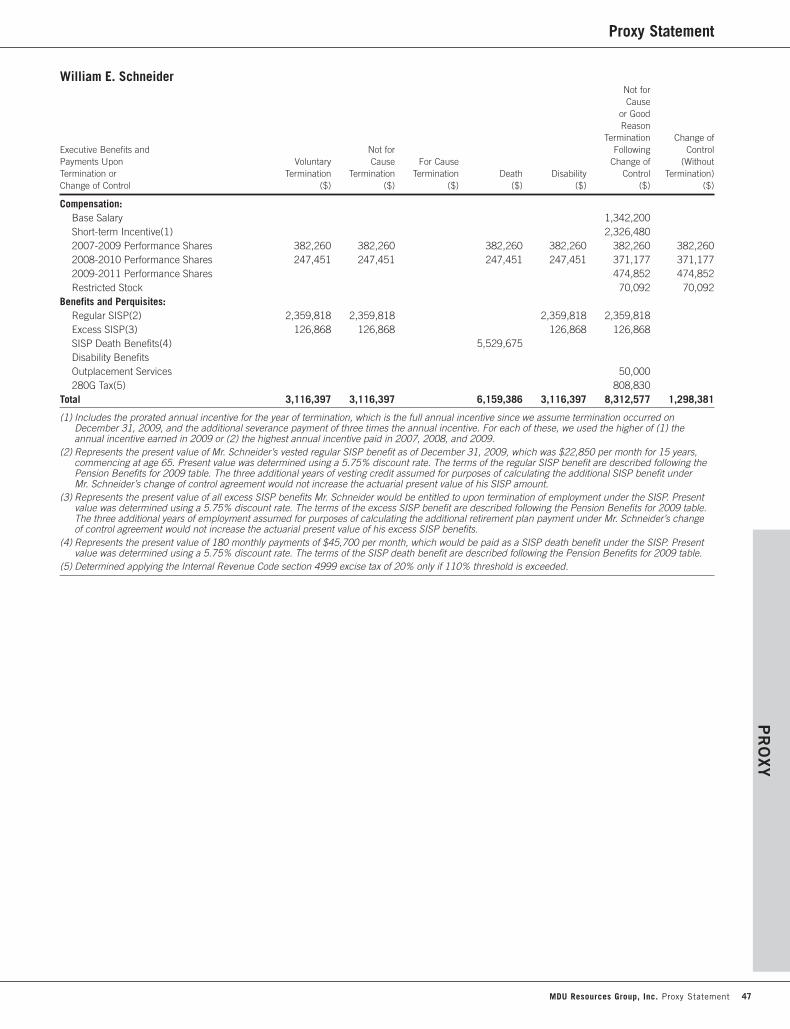
Proxy StatementP
RO
XY
William E. SchneiderNot forCause
or GoodReason
Termination Change ofExecutive Benefits and Not for Following ControlPayments Upon Voluntary Cause For Cause Change of (WithoutTermination or Termination Termination Termination Death Disability Control Termination)Change of Control ($) ($) ($) ($) ($) ($) ($)
Compensation:Base Salary 1,342,200Short-term Incentive(1) 2,326,4802007-2009 Performance Shares 382,260 382,260 382,260 382,260 382,260 382,2602008-2010 Performance Shares 247,451 247,451 247,451 247,451 371,177 371,1772009-2011 Performance Shares 474,852 474,852Restricted Stock 70,092 70,092
Benefits and Perquisites:Regular SISP(2) 2,359,818 2,359,818 2,359,818 2,359,818Excess SISP(3) 126,868 126,868 126,868 126,868SISP Death Benefits(4) 5,529,675Disability BenefitsOutplacement Services 50,000280G Tax(5) 808,830
Total 3,116,397 3,116,397 6,159,386 3,116,397 8,312,577 1,298,381
(1) Includes the prorated annual incentive for the year of termination, which is the full annual incentive since we assume termination occurred onDecember 31, 2009, and the additional severance payment of three times the annual incentive. For each of these, we used the higher of (1) theannual incentive earned in 2009 or (2) the highest annual incentive paid in 2007, 2008, and 2009.
(2) Represents the present value of Mr. Schneider’s vested regular SISP benefit as of December 31, 2009, which was $22,850 per month for 15 years,commencing at age 65. Present value was determined using a 5.75% discount rate. The terms of the regular SISP benefit are described following thePension Benefits for 2009 table. The three additional years of vesting credit assumed for purposes of calculating the additional SISP benefit underMr. Schneider’s change of control agreement would not increase the actuarial present value of his SISP amount.
(3) Represents the present value of all excess SISP benefits Mr. Schneider would be entitled to upon termination of employment under the SISP. Presentvalue was determined using a 5.75% discount rate. The terms of the excess SISP benefit are described following the Pension Benefits for 2009 table.The three additional years of employment assumed for purposes of calculating the additional retirement plan payment under Mr. Schneider’s changeof control agreement would not increase the actuarial present value of his excess SISP benefits.
(4) Represents the present value of 180 monthly payments of $45,700 per month, which would be paid as a SISP death benefit under the SISP. Presentvalue was determined using a 5.75% discount rate. The terms of the SISP death benefit are described following the Pension Benefits for 2009 table.
(5) Determined applying the Internal Revenue Code section 4999 excise tax of 20% only if 110% threshold is exceeded.
MDU Resources Group, Inc. Proxy Statement 47
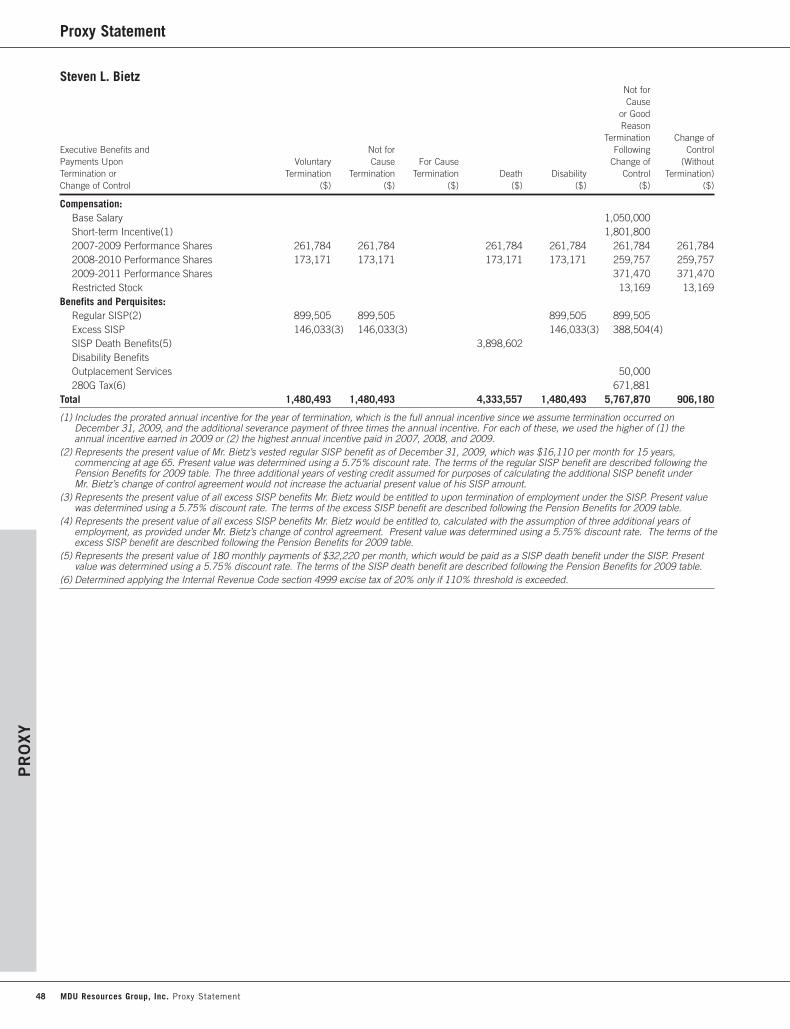
Proxy Statement
Steven L. BietzNot forCause
or GoodReason
Termination Change ofExecutive Benefits and Not for Following ControlPayments Upon Voluntary Cause For Cause Change of (WithoutTermination or Termination Termination Termination Death Disability Control Termination)Change of Control ($) ($) ($) ($) ($) ($) ($)
Compensation:Base Salary 1,050,000Short-term Incentive(1) 1,801,8002007-2009 Performance Shares 261,784 261,784 261,784 261,784 261,784 261,7842008-2010 Performance Shares 173,171 173,171 173,171 173,171 259,757 259,7572009-2011 Performance Shares 371,470 371,470Restricted Stock 13,169 13,169
Benefits and Perquisites:Regular SISP(2) 899,505 899,505 899,505 899,505Excess SISP 146,033(3) 146,033(3) 146,033(3) 388,504(4)SISP Death Benefits(5) 3,898,602Disability BenefitsOutplacement Services 50,000280G Tax(6) 671,881
Total 1,480,493 1,480,493 4,333,557 1,480,493 5,767,870 906,180
(1) Includes the prorated annual incentive for the year of termination, which is the full annual incentive since we assume termination occurred onDecember 31, 2009, and the additional severance payment of three times the annual incentive. For each of these, we used the higher of (1) theannual incentive earned in 2009 or (2) the highest annual incentive paid in 2007, 2008, and 2009.
(2) Represents the present value of Mr. Bietz’s vested regular SISP benefit as of December 31, 2009, which was $16,110 per month for 15 years,commencing at age 65. Present value was determined using a 5.75% discount rate. The terms of the regular SISP benefit are described following thePension Benefits for 2009 table. The three additional years of vesting credit assumed for purposes of calculating the additional SISP benefit underMr. Bietz’s change of control agreement would not increase the actuarial present value of his SISP amount.
(3) Represents the present value of all excess SISP benefits Mr. Bietz would be entitled to upon termination of employment under the SISP. Present valuewas determined using a 5.75% discount rate. The terms of the excess SISP benefit are described following the Pension Benefits for 2009 table.
(4) Represents the present value of all excess SISP benefits Mr. Bietz would be entitled to, calculated with the assumption of three additional years ofemployment, as provided under Mr. Bietz’s change of control agreement. Present value was determined using a 5.75% discount rate. The terms of theexcess SISP benefit are described following the Pension Benefits for 2009 table.
(5) Represents the present value of 180 monthly payments of $32,220 per month, which would be paid as a SISP death benefit under the SISP. Presentvalue was determined using a 5.75% discount rate. The terms of the SISP death benefit are described following the Pension Benefits for 2009 table.
(6) Determined applying the Internal Revenue Code section 4999 excise tax of 20% only if 110% threshold is exceeded.
PR
OXY
48 MDU Resources Group, Inc. Proxy Statement
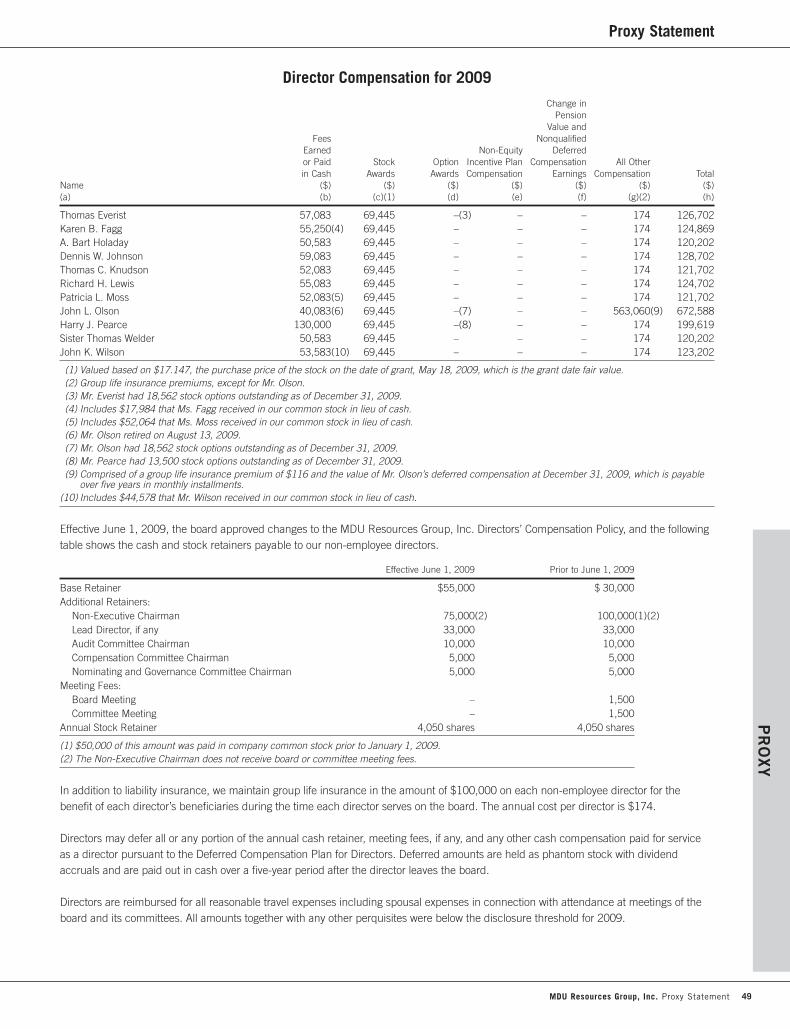
Proxy StatementP
RO
XY
Director Compensation for 2009Change in
PensionValue and
Fees NonqualifiedEarned Non-Equity Deferredor Paid Stock Option Incentive Plan Compensation All Otherin Cash Awards Awards Compensation Earnings Compensation Total
Name ($) ($) ($) ($) ($) ($) ($)(a) (b) (c)(1) (d) (e) (f) (g)(2) (h)
Thomas Everist 57,083 69,445 –(3) – – 174 126,702Karen B. Fagg 55,250(4) 69,445 – – – 174 124,869A. Bart Holaday 50,583 69,445 – – – 174 120,202Dennis W. Johnson 59,083 69,445 – – – 174 128,702Thomas C. Knudson 52,083 69,445 – – – 174 121,702Richard H. Lewis 55,083 69,445 – – – 174 124,702Patricia L. Moss 52,083(5) 69,445 – – – 174 121,702John L. Olson 40,083(6) 69,445 –(7) – – 563,060(9) 672,588Harry J. Pearce 130,000 69,445 –(8) – – 174 199,619Sister Thomas Welder 50,583 69,445 – – – 174 120,202John K. Wilson 53,583(10) 69,445 – – – 174 123,202
(1) Valued based on $17.147, the purchase price of the stock on the date of grant, May 18, 2009, which is the grant date fair value.(2) Group life insurance premiums, except for Mr. Olson.(3) Mr. Everist had 18,562 stock options outstanding as of December 31, 2009.(4) Includes $17,984 that Ms. Fagg received in our common stock in lieu of cash.(5) Includes $52,064 that Ms. Moss received in our common stock in lieu of cash.(6) Mr. Olson retired on August 13, 2009.(7) Mr. Olson had 18,562 stock options outstanding as of December 31, 2009.(8) Mr. Pearce had 13,500 stock options outstanding as of December 31, 2009.(9) Comprised of a group life insurance premium of $116 and the value of Mr. Olson’s deferred compensation at December 31, 2009, which is payable
over five years in monthly installments.(10) Includes $44,578 that Mr. Wilson received in our common stock in lieu of cash.
Effective June 1, 2009, the board approved changes to the MDU Resources Group, Inc. Directors’ Compensation Policy, and the followingtable shows the cash and stock retainers payable to our non-employee directors.
Effective June 1, 2009 Prior to June 1, 2009
Base Retainer $55,000 $ 30,000Additional Retainers:
Non-Executive Chairman 75,000(2) 100,000(1)(2)Lead Director, if any 33,000 33,000Audit Committee Chairman 10,000 10,000Compensation Committee Chairman 5,000 5,000Nominating and Governance Committee Chairman 5,000 5,000
Meeting Fees:Board Meeting – 1,500Committee Meeting – 1,500
Annual Stock Retainer 4,050 shares 4,050 shares
(1) $50,000 of this amount was paid in company common stock prior to January 1, 2009.(2) The Non-Executive Chairman does not receive board or committee meeting fees.
In addition to liability insurance, we maintain group life insurance in the amount of $100,000 on each non-employee director for thebenefit of each director’s beneficiaries during the time each director serves on the board. The annual cost per director is $174.
Directors may defer all or any portion of the annual cash retainer, meeting fees, if any, and any other cash compensation paid for serviceas a director pursuant to the Deferred Compensation Plan for Directors. Deferred amounts are held as phantom stock with dividendaccruals and are paid out in cash over a five-year period after the director leaves the board.
Directors are reimbursed for all reasonable travel expenses including spousal expenses in connection with attendance at meetings of theboard and its committees. All amounts together with any other perquisites were below the disclosure threshold for 2009.
MDU Resources Group, Inc. Proxy Statement 49

Proxy Statement
Our post-retirement income plan for directors was terminated in May 2001 for current and future directors. The net present value of eachdirector’s benefit was calculated and converted into phantom stock. Payment is deferred pursuant to the Deferred Compensation Plan forDirectors and will be made in cash over a five-year period after the director’s retirement from the board.
The board adopted stock ownership guidelines for directors in November 2005. Each director is expected to own our common stock equalin value to five times the director’s base retainer. A director, with good cause and with the knowledge of the board, may donate or assign allof the director’s company common stock to a charitable, religious, or non-profit organization in lieu of ownership. Shares acquired throughpurchases on the open market and participation in our director stock plans will be considered in ownership calculations as will ownershipof our common stock by a spouse. A director is allowed five years commencing January 1 of the year following the year of that director’sinitial election to the board to meet the guideline requirements. The level of common stock ownership is monitored with an annual reportmade to the compensation committee of the board. For stock ownership, please see “Security Ownership.”
In our Director Compensation Policy, we prohibit our directors from hedging their ownership of company common stock. Directors may notenter into transactions that allow the director to benefit from devaluation of our stock or otherwise own stock technically but without the fullbenefits and risks of such ownership.
Narrative Disclosure of our Compensation Policies and Practicesas They Relate to Risk ManagementWe have reviewed our compensation policies and practices for all employees and concluded that any risks arising from our policies andprograms are not reasonably likely to have a material adverse effect on our company.
PR
OXY
50 MDU Resources Group, Inc. Proxy Statement
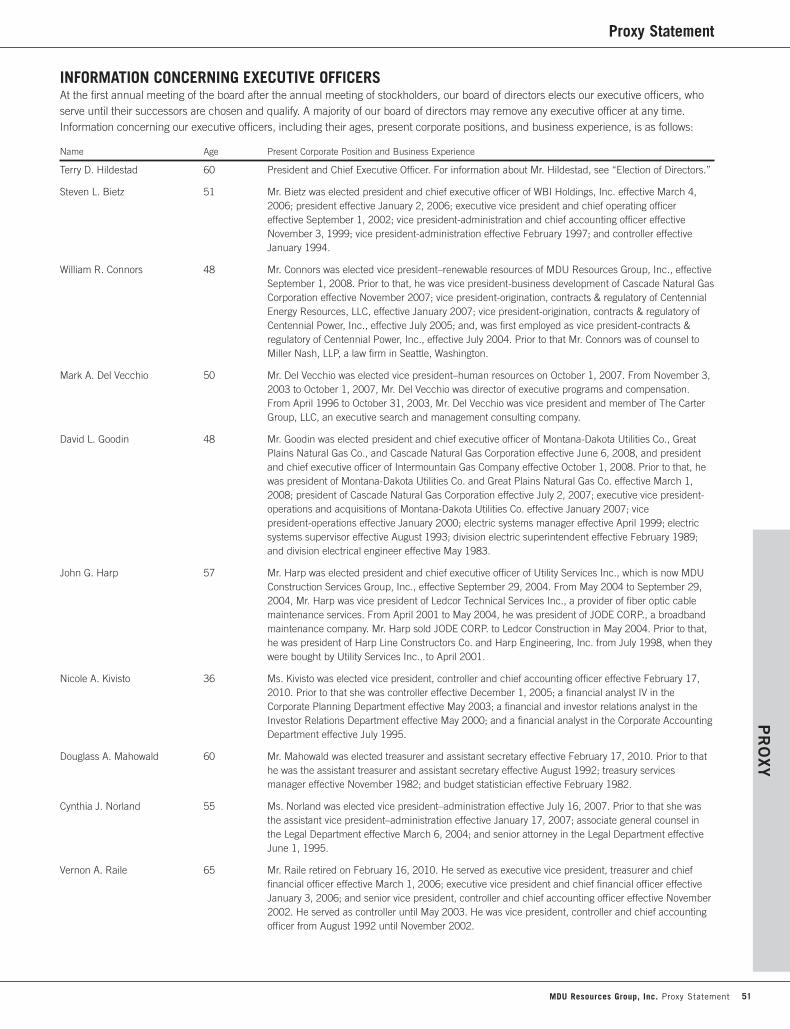
Proxy StatementP
RO
XY
INFORMATION CONCERNING EXECUTIVE OFFICERSAt the first annual meeting of the board after the annual meeting of stockholders, our board of directors elects our executive officers, whoserve until their successors are chosen and qualify. A majority of our board of directors may remove any executive officer at any time.Information concerning our executive officers, including their ages, present corporate positions, and business experience, is as follows:
Name Age Present Corporate Position and Business Experience
Terry D. Hildestad 60 President and Chief Executive Officer. For information about Mr. Hildestad, see “Election of Directors.”
Steven L. Bietz 51 Mr. Bietz was elected president and chief executive officer of WBI Holdings, Inc. effective March 4,2006; president effective January 2, 2006; executive vice president and chief operating officereffective September 1, 2002; vice president-administration and chief accounting officer effectiveNovember 3, 1999; vice president-administration effective February 1997; and controller effectiveJanuary 1994.
William R. Connors 48 Mr. Connors was elected vice president–renewable resources of MDU Resources Group, Inc., effectiveSeptember 1, 2008. Prior to that, he was vice president-business development of Cascade Natural GasCorporation effective November 2007; vice president-origination, contracts & regulatory of CentennialEnergy Resources, LLC, effective January 2007; vice president-origination, contracts & regulatory ofCentennial Power, Inc., effective July 2005; and, was first employed as vice president-contracts ®ulatory of Centennial Power, Inc., effective July 2004. Prior to that Mr. Connors was of counsel toMiller Nash, LLP, a law firm in Seattle, Washington.
Mark A. Del Vecchio 50 Mr. Del Vecchio was elected vice president–human resources on October 1, 2007. From November 3,2003 to October 1, 2007, Mr. Del Vecchio was director of executive programs and compensation.From April 1996 to October 31, 2003, Mr. Del Vecchio was vice president and member of The CarterGroup, LLC, an executive search and management consulting company.
David L. Goodin 48 Mr. Goodin was elected president and chief executive officer of Montana-Dakota Utilities Co., GreatPlains Natural Gas Co., and Cascade Natural Gas Corporation effective June 6, 2008, and presidentand chief executive officer of Intermountain Gas Company effective October 1, 2008. Prior to that, hewas president of Montana-Dakota Utilities Co. and Great Plains Natural Gas Co. effective March 1,2008; president of Cascade Natural Gas Corporation effective July 2, 2007; executive vice president-operations and acquisitions of Montana-Dakota Utilities Co. effective January 2007; vicepresident-operations effective January 2000; electric systems manager effective April 1999; electricsystems supervisor effective August 1993; division electric superintendent effective February 1989;and division electrical engineer effective May 1983.
John G. Harp 57 Mr. Harp was elected president and chief executive officer of Utility Services Inc., which is now MDUConstruction Services Group, Inc., effective September 29, 2004. From May 2004 to September 29,2004, Mr. Harp was vice president of Ledcor Technical Services Inc., a provider of fiber optic cablemaintenance services. From April 2001 to May 2004, he was president of JODE CORP., a broadbandmaintenance company. Mr. Harp sold JODE CORP. to Ledcor Construction in May 2004. Prior to that,he was president of Harp Line Constructors Co. and Harp Engineering, Inc. from July 1998, when theywere bought by Utility Services Inc., to April 2001.
Nicole A. Kivisto 36 Ms. Kivisto was elected vice president, controller and chief accounting officer effective February 17,2010. Prior to that she was controller effective December 1, 2005; a financial analyst IV in theCorporate Planning Department effective May 2003; a financial and investor relations analyst in theInvestor Relations Department effective May 2000; and a financial analyst in the Corporate AccountingDepartment effective July 1995.
Douglass A. Mahowald 60 Mr. Mahowald was elected treasurer and assistant secretary effective February 17, 2010. Prior to thathe was the assistant treasurer and assistant secretary effective August 1992; treasury servicesmanager effective November 1982; and budget statistician effective February 1982.
Cynthia J. Norland 55 Ms. Norland was elected vice president–administration effective July 16, 2007. Prior to that she wasthe assistant vice president–administration effective January 17, 2007; associate general counsel inthe Legal Department effective March 6, 2004; and senior attorney in the Legal Department effectiveJune 1, 1995.
Vernon A. Raile 65 Mr. Raile retired on February 16, 2010. He served as executive vice president, treasurer and chieffinancial officer effective March 1, 2006; executive vice president and chief financial officer effectiveJanuary 3, 2006; and senior vice president, controller and chief accounting officer effective November2002. He served as controller until May 2003. He was vice president, controller and chief accountingofficer from August 1992 until November 2002.
MDU Resources Group, Inc. Proxy Statement 51
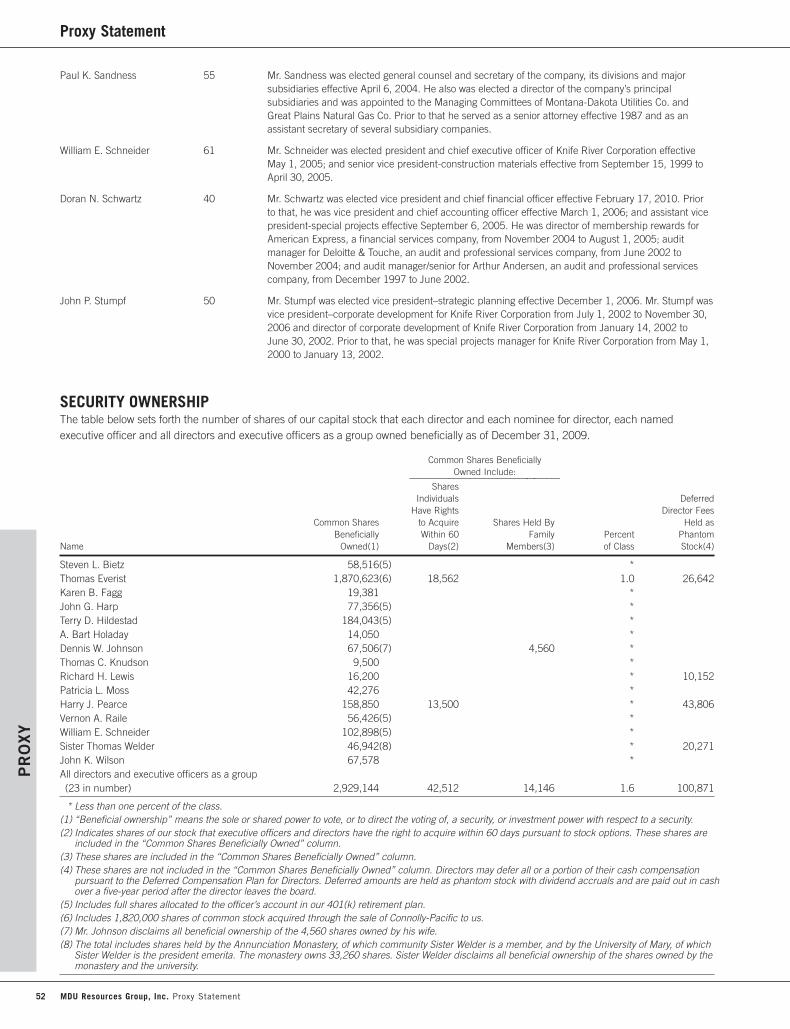
Proxy Statement
Paul K. Sandness 55 Mr. Sandness was elected general counsel and secretary of the company, its divisions and majorsubsidiaries effective April 6, 2004. He also was elected a director of the company’s principalsubsidiaries and was appointed to the Managing Committees of Montana-Dakota Utilities Co. andGreat Plains Natural Gas Co. Prior to that he served as a senior attorney effective 1987 and as anassistant secretary of several subsidiary companies.
William E. Schneider 61 Mr. Schneider was elected president and chief executive officer of Knife River Corporation effectiveMay 1, 2005; and senior vice president-construction materials effective from September 15, 1999 toApril 30, 2005.
Doran N. Schwartz 40 Mr. Schwartz was elected vice president and chief financial officer effective February 17, 2010. Priorto that, he was vice president and chief accounting officer effective March 1, 2006; and assistant vicepresident-special projects effective September 6, 2005. He was director of membership rewards forAmerican Express, a financial services company, from November 2004 to August 1, 2005; auditmanager for Deloitte & Touche, an audit and professional services company, from June 2002 toNovember 2004; and audit manager/senior for Arthur Andersen, an audit and professional servicescompany, from December 1997 to June 2002.
John P. Stumpf 50 Mr. Stumpf was elected vice president–strategic planning effective December 1, 2006. Mr. Stumpf wasvice president–corporate development for Knife River Corporation from July 1, 2002 to November 30,2006 and director of corporate development of Knife River Corporation from January 14, 2002 toJune 30, 2002. Prior to that, he was special projects manager for Knife River Corporation from May 1,2000 to January 13, 2002.
SECURITY OWNERSHIPThe table below sets forth the number of shares of our capital stock that each director and each nominee for director, each namedexecutive officer and all directors and executive officers as a group owned beneficially as of December 31, 2009.
Common Shares BeneficiallyOwned Include:___________________________________
SharesIndividuals Deferred
Have Rights Director FeesCommon Shares to Acquire Shares Held By Held as
Beneficially Within 60 Family Percent PhantomName Owned(1) Days(2) Members(3) of Class Stock(4)
Steven L. Bietz 58,516(5) *Thomas Everist 1,870,623(6) 18,562 1.0 26,642Karen B. Fagg 19,381 *John G. Harp 77,356(5) *Terry D. Hildestad 184,043(5) *A. Bart Holaday 14,050 *Dennis W. Johnson 67,506(7) 4,560 *Thomas C. Knudson 9,500 *Richard H. Lewis 16,200 * 10,152Patricia L. Moss 42,276 *Harry J. Pearce 158,850 13,500 * 43,806Vernon A. Raile 56,426(5) *William E. Schneider 102,898(5) *Sister Thomas Welder 46,942(8) * 20,271John K. Wilson 67,578 *All directors and executive officers as a group (23 in number) 2,929,144 42,512 14,146 1.6 100,871
* Less than one percent of the class.(1) “Beneficial ownership” means the sole or shared power to vote, or to direct the voting of, a security, or investment power with respect to a security.(2) Indicates shares of our stock that executive officers and directors have the right to acquire within 60 days pursuant to stock options. These shares are
included in the “Common Shares Beneficially Owned” column.(3) These shares are included in the “Common Shares Beneficially Owned” column.(4) These shares are not included in the “Common Shares Beneficially Owned” column. Directors may defer all or a portion of their cash compensation
pursuant to the Deferred Compensation Plan for Directors. Deferred amounts are held as phantom stock with dividend accruals and are paid out in cashover a five-year period after the director leaves the board.
(5) Includes full shares allocated to the officer’s account in our 401(k) retirement plan.(6) Includes 1,820,000 shares of common stock acquired through the sale of Connolly-Pacific to us.(7) Mr. Johnson disclaims all beneficial ownership of the 4,560 shares owned by his wife.(8) The total includes shares held by the Annunciation Monastery, of which community Sister Welder is a member, and by the University of Mary, of which
Sister Welder is the president emerita. The monastery owns 33,260 shares. Sister Welder disclaims all beneficial ownership of the shares owned by themonastery and the university.
PR
OXY
52 MDU Resources Group, Inc. Proxy Statement
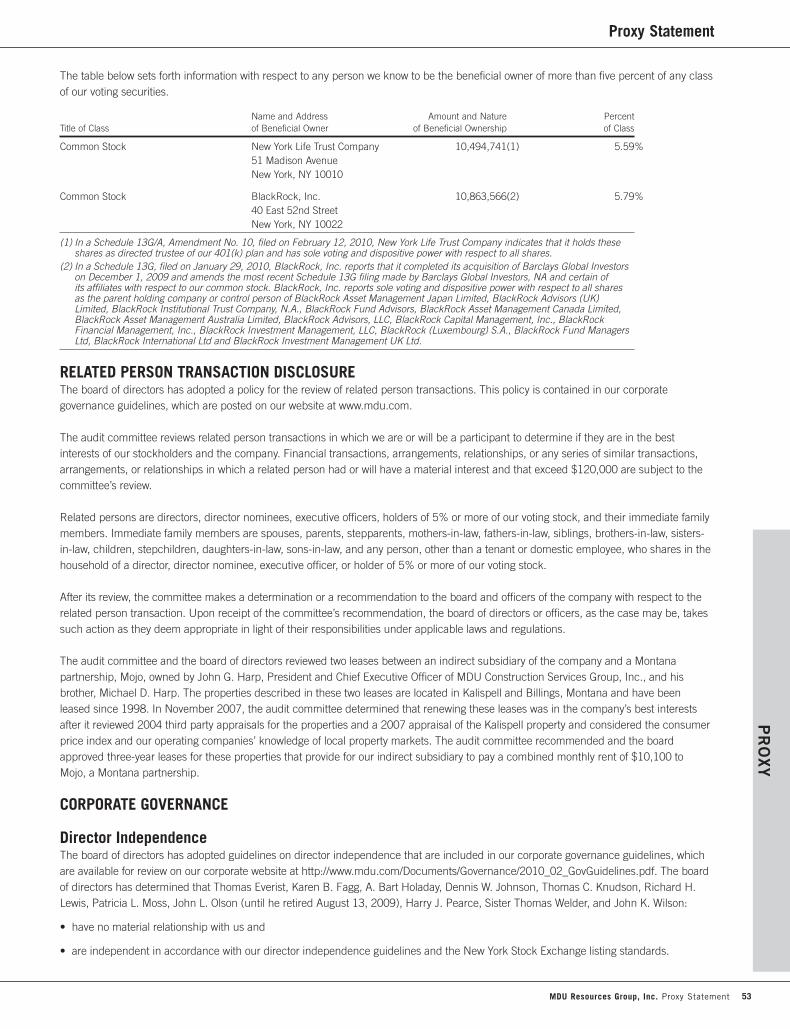
Proxy StatementP
RO
XY
The table below sets forth information with respect to any person we know to be the beneficial owner of more than five percent of any classof our voting securities.
Name and Address Amount and Nature PercentTitle of Class of Beneficial Owner of Beneficial Ownership of Class
Common Stock New York Life Trust Company 10,494,741(1) 5.59%51 Madison AvenueNew York, NY 10010
Common Stock BlackRock, Inc. 10,863,566(2) 5.79%40 East 52nd StreetNew York, NY 10022
(1) In a Schedule 13G/A, Amendment No. 10, filed on February 12, 2010, New York Life Trust Company indicates that it holds theseshares as directed trustee of our 401(k) plan and has sole voting and dispositive power with respect to all shares.
(2) In a Schedule 13G, filed on January 29, 2010, BlackRock, Inc. reports that it completed its acquisition of Barclays Global Investorson December 1, 2009 and amends the most recent Schedule 13G filing made by Barclays Global Investors, NA and certain ofits affiliates with respect to our common stock. BlackRock, Inc. reports sole voting and dispositive power with respect to all sharesas the parent holding company or control person of BlackRock Asset Management Japan Limited, BlackRock Advisors (UK) Limited, BlackRock Institutional Trust Company, N.A., BlackRock Fund Advisors, BlackRock Asset Management Canada Limited,BlackRock Asset Management Australia Limited, BlackRock Advisors, LLC, BlackRock Capital Management, Inc., BlackRockFinancial Management, Inc., BlackRock Investment Management, LLC, BlackRock (Luxembourg) S.A., BlackRock Fund ManagersLtd, BlackRock International Ltd and BlackRock Investment Management UK Ltd.
RELATED PERSON TRANSACTION DISCLOSUREThe board of directors has adopted a policy for the review of related person transactions. This policy is contained in our corporategovernance guidelines, which are posted on our website at www.mdu.com.
The audit committee reviews related person transactions in which we are or will be a participant to determine if they are in the bestinterests of our stockholders and the company. Financial transactions, arrangements, relationships, or any series of similar transactions,arrangements, or relationships in which a related person had or will have a material interest and that exceed $120,000 are subject to thecommittee’s review.
Related persons are directors, director nominees, executive officers, holders of 5% or more of our voting stock, and their immediate familymembers. Immediate family members are spouses, parents, stepparents, mothers-in-law, fathers-in-law, siblings, brothers-in-law, sisters-in-law, children, stepchildren, daughters-in-law, sons-in-law, and any person, other than a tenant or domestic employee, who shares in thehousehold of a director, director nominee, executive officer, or holder of 5% or more of our voting stock.
After its review, the committee makes a determination or a recommendation to the board and officers of the company with respect to therelated person transaction. Upon receipt of the committee’s recommendation, the board of directors or officers, as the case may be, takessuch action as they deem appropriate in light of their responsibilities under applicable laws and regulations.
The audit committee and the board of directors reviewed two leases between an indirect subsidiary of the company and a Montanapartnership, Mojo, owned by John G. Harp, President and Chief Executive Officer of MDU Construction Services Group, Inc., and hisbrother, Michael D. Harp. The properties described in these two leases are located in Kalispell and Billings, Montana and have beenleased since 1998. In November 2007, the audit committee determined that renewing these leases was in the company’s best interestsafter it reviewed 2004 third party appraisals for the properties and a 2007 appraisal of the Kalispell property and considered the consumerprice index and our operating companies’ knowledge of local property markets. The audit committee recommended and the boardapproved three-year leases for these properties that provide for our indirect subsidiary to pay a combined monthly rent of $10,100 toMojo, a Montana partnership.
CORPORATE GOVERNANCE
Director IndependenceThe board of directors has adopted guidelines on director independence that are included in our corporate governance guidelines, whichare available for review on our corporate website at http://www.mdu.com/Documents/Governance/2010_02_GovGuidelines.pdf. The boardof directors has determined that Thomas Everist, Karen B. Fagg, A. Bart Holaday, Dennis W. Johnson, Thomas C. Knudson, Richard H.Lewis, Patricia L. Moss, John L. Olson (until he retired August 13, 2009), Harry J. Pearce, Sister Thomas Welder, and John K. Wilson:
• have no material relationship with us and
• are independent in accordance with our director independence guidelines and the New York Stock Exchange listing standards.
MDU Resources Group, Inc. Proxy Statement 53

Proxy Statement
In determining director independence for 2009, the board of directors considered the following transactions or relationships:
• Mr. Everist’s ownership at that time of approximately 1.8 million shares of our common stock
• charitable contributions to the City of Dickinson in the amount of $20,000 – Mr. Johnson was president of the City of Dickinson board ofcommissioners; payment to the company for utility line relocation done by our division, Montana-Dakota Utilities Co., in the regularcourse of business at the request of TMI Systems Design Corporation in the amount of $71,530 – Mr. Johnson was Chairman and ChiefExecutive Officer of TMI Systems Design Corporation
• charitable contributions to Colorado UpLift in the amount of $25,000 – Mr. Lewis was a director and member of Colorado UpLift’sexecutive committee
• charitable contributions to St. Alexius Medical Center in the amount of $6,000 – Sister Welder was a director of St. Alexius; payment ofour employees’ tuition and education-related expenses and charitable contributions in the amount of $62,500 to the University of Mary– Sister Welder was the president of the University of Mary in 2008; and charitable contributions to Missouri Slope Areawide United Wayin the amount of $20,500 – Sister Welder was a director of the Missouri Slope Areawide United Way and
• public utility services provided by our utility operations to entities with which directors are affiliated at rates fixed by the regulatory bodieshaving jurisdiction.
Director Resignation Upon Change of Job ResponsibilityOur corporate governance guidelines require a director to tender his or her resignation after a material change in job responsibility. In2009, no directors submitted resignations under this requirement.
Code of ConductWe have a code of conduct and ethics, which we refer to as the Leading With Integrity Guide, which applies to all employees, directors,and officers.
We intend to satisfy our disclosure obligations regarding:
• amendments to, or waivers of, any provision of the code of conduct that applies to our principal executive officer, principalfinancial officer, and principal accounting officer and that relates to any element of the code of ethics definition in Regulation S-K, Item406(b) and
• waivers of the code of conduct for our directors or executive officers, as required by New York Stock Exchange listing standards
by posting such information on our website at http://www.mdu.com/Documents/Governance/IntegrityGuide.pdf.
Board Leadership Structure and Board’s Role in Risk OversightThe board separated the positions of chairman of the board and chief executive officer in 2006 and elected Harry J. Pearce, a non-employee independent director, as our chairman, and Terry D. Hildestad as our president and chief executive officer. Separating thesepositions allows our chief executive officer to focus on our day-to-day business, while allowing the chairman of the board to lead the boardin its fundamental role of providing advice to and independent oversight of management. The board recognizes the time, effort, and energythat the chief executive officer is required to devote to his position in the current business environment, as well as the commitmentrequired to serve as our chairman, particularly as the board’s oversight responsibilities continue to grow. While our bylaws and corporategovernance guidelines do not require that our chairman and chief executive officer positions be separate, the board believes that havingseparate positions and having an independent outside director serve as chairman is the appropriate leadership structure for the companyat this time and demonstrates our commitment to good corporate governance.
Risk is inherent with every business, and how well a business manages risk can ultimately determine its success. We face a number ofrisks, including economic risks, environmental and regulatory risks, and others, such as the impact of competition and weather conditions.Management is responsible for the day-to-day management of risks the company faces, while the board, as a whole and through itscommittees, has responsibility for the oversight of risk management. In its risk oversight role, the board of directors has the responsibility tosatisfy itself that the risk management processes designed and implemented by management are adequate and functioning as designed.
The board believes that establishing the right “tone at the top” and that full and open communication between management and theboard of directors are essential for effective risk management and oversight. Our chairman meets regularly with our president and chiefexecutive officer and other senior officers to discuss strategy and risks facing the company. Senior management attends the quarterlyboard meetings and is available to address any questions or concerns raised by the board on risk management-related and any other
PR
OXY
54 MDU Resources Group, Inc. Proxy Statement

Proxy StatementP
RO
XY
matters. Each quarter, the board of directors receives presentations from senior management on strategic matters involving our operations.The board holds strategic planning sessions with senior management to discuss strategies, key challenges, and risks and opportunities forthe company.
While the board is ultimately responsible for risk oversight at our company, our three board committees assist the board in fulfilling itsoversight responsibilities in certain areas of risk. The audit committee assists the board in fulfilling its oversight responsibilities with respectto risk management in the areas of financial reporting, internal controls and compliance with legal and regulatory requirements, and,in accordance with New York Stock Exchange requirements, discusses policies with respect to risk assessment and risk management.Risk assessment reports are regularly provided by management to the audit committee. The compensation committee assists the boardin fulfilling its oversight responsibilities with respect to the management of risks arising from our compensation policies and programs.The nominating and governance committee assists the board in fulfilling its oversight responsibilities with respect to the managementof risks associated with board organization, membership and structure, succession planning for our directors and executive officers, andcorporate governance.
Board Meetings and CommitteesDuring 2009, the board of directors held five meetings. Each incumbent director attended at least 75% of the combined total meetings ofthe board and the committees on which the director served during 2009. Director attendance at our annual meeting of stockholders is leftto the discretion of each director. Four directors attended our 2009 annual meeting of stockholders.
Harry J. Pearce was elected non-employee chairman of the board on August 17, 2006. Mr. Pearce served as lead director fromFebruary 15, 2001 to August 17, 2006. He presides at the executive session of the non-employee directors held in connection witheach regularly scheduled quarterly board of directors meeting. The non-employee directors also meet in executive session with thechief executive officer at each regularly scheduled quarterly board of directors meeting. All of our non-employee directors areindependent directors.
The board has a standing audit committee, compensation committee, and nominating and governance committee. These committees arecomposed entirely of independent directors.
The audit, compensation, and nominating and governance committees have charters, which are available for review on our websiteat http://www.mdu.com/Governance/Pages/BoardChartersandCommittees.aspx. Our corporate governance guidelines are available athttp://www.mdu.com/Documents/Governance/2010_02_GovGuidelines.pdf, and our Leading With Integrity Guide is also on our websiteat http://www.mdu.com/Documents/Governance/IntegrityGuide.pdf.
Nominating and Governance CommitteeThe nominating and governance committee met three times during 2009. The committee members were John L. Olson, chairman, KarenB. Fagg, Richard H. Lewis, and Sister Thomas Welder. John L. Olson served as chairman of the committee until he retired from the boardon August 13, 2009, and Karen B. Fagg became chairman. A. Bart Holaday joined the committee effective February 11, 2010.
The nominating and governance committee provides recommendations to the board with respect to:
• board organization, membership, and function
• committee structure and membership
• succession planning for our executive management and directors and
• corporate governance guidelines applicable to us.
The nominating and governance committee assists the board in overseeing the management of risks in the committee’s areasof responsibility.
The committee identifies individuals qualified to become directors and recommends to the board the nominees for director for thenext annual meeting of stockholders. The committee also identifies and recommends to the board individuals qualified to become ourprincipal officers and the nominees for membership on each board committee. The committee oversees the evaluation of the boardand management.
In identifying nominees for director, the committee consults with board members, our management, consultants, and other individualslikely to possess an understanding of our business and knowledge concerning suitable director candidates.
MDU Resources Group, Inc. Proxy Statement 55

Proxy Statement
Our corporate governance guidelines include our policy on consideration of director candidates recommended to us. We will considercandidates that our stockholders recommend. In November 2008, we amended our policy to include additional information stockholdersmust provide regarding their recommended candidates. Stockholders may submit director candidate recommendations to the nominatingand governance committee chairman in care of the secretary at MDU Resources Group, Inc., P.O. Box 5650, Bismarck, ND 58506-5650.Please include the following information:
• the candidate’s name, age, business address, residence address, and telephone number
• the candidate’s principal occupation
• the class and number of shares of our stock owned by the candidate
• a description of the candidate’s qualifications to be a director
• whether the candidate would be an independent director and
• any other information you believe is relevant with respect to the recommendation.
These guidelines provide information to stockholders who wish to recommend candidates for director for consideration by thenominating and governance committee. Stockholders who wish to actually nominate persons for election to our board at an annualmeeting of stockholders must follow the procedures set forth in section 2.08 of our bylaws. You may obtain a copy of the bylawsby writing to the secretary of MDU Resources Group, Inc. at the address above. Our bylaws are also available on our website athttp://www.mdu.com/Documents/Governance/MDU%20ResourcesBylaws.pdf. See also the section entitled “2011 Annual Meetingof Stockholders” later in the proxy statement.
There are no differences in the manner by which the committee evaluates director candidates recommended by stockholders and thoserecommended by other sources.
In evaluating director candidates, the committee considers an individual’s:
• background, character, and experience
• skills and experience which complement the skills and experience of current board members
• success in the individual’s chosen field of endeavor
• skill in the areas of accounting and financial management, banking, general management, human resources, marketing, operations,public affairs, law, and operations abroad
• background in publicly traded companies
• geographic area of residence
• independence, including affiliations or relationships with other groups, organizations, or entities and
• prior and future compliance with applicable law and all applicable corporate governance, code of conduct and ethics, conflict ofinterest, corporate opportunities, confidentiality, stock ownership and trading policies, and our other policies and guidelines.
On February 11, 2010, the board, upon recommendation of the nominating and governance committee, amended our corporategovernance guidelines to include diversity as a consideration in identifying nominees for director. When identifying nominees to serveas director, the nominating and governance committee will consider candidates with diverse business and professional experience,skills, gender, and ethnic background, as appropriate, in light of the current composition and needs of the board. The nominating andgovernance committee will assess the effectiveness of this policy annually in connection with the nomination of directors for election atthe annual meeting of stockholders. The composition of the current board reflects diversity in business and professional experience,skills, and gender.
The committee generally will hire an outside firm to perform a background check on potential nominees.
Audit CommitteeThe audit committee is a separately-designated standing committee established in accordance with section 3(a)(58)(A) of the SecuritiesExchange Act of 1934.
The audit committee met seven times during 2009. The audit committee members are Dennis W. Johnson, chairman, A. Bart Holaday,Richard H. Lewis, and John K. Wilson. John L. Olson served on the committee until he retired from the board on August 13, 2009. The
PR
OXY
56 MDU Resources Group, Inc. Proxy Statement

Proxy StatementP
RO
XY
board of directors has determined that Messrs. Johnson, Holaday, Lewis, Olson (until he retired), and Wilson are “audit committee financialexperts” as defined by Securities and Exchange Commission regulations and Messrs. Johnson, Holaday, Lewis, Olson (until he retired), andWilson meet the independence standard for audit committee members under our director independence guidelines and the New York StockExchange listing standards, including the Securities and Exchange Commission’s audit committee member independence requirements.
The audit committee assists the board of directors in fulfilling its oversight responsibilities to the stockholders and serves as acommunication link among the board, management, the independent auditors, and the internal auditors. The audit committee:
• assists the board’s oversight of
•• the integrity of our financial statements and system of internal controls
•• our compliance with legal and regulatory requirements
•• the independent auditors’ qualifications and independence
•• the performance of our internal audit function and independent auditors and
•• risk management in the audit committee’s areas of responsibility and
• prepares the report that Securities and Exchange Commission rules require we include in our annual proxy statement.
Audit Committee ReportIn connection with our financial statements for the year ended December 31, 2009, the audit committee has (1) reviewedand discussed the audited financial statements with management; (2) discussed with the independent auditors thematters required to be discussed by statement on Auditing Standards No. 61, as amended, (AICPA, ProfessionalStandards, Vol. 1, AU section 380), as adopted by the Public Company Accounting Oversight Board in Rule 3200T;(3) received the written disclosures and the letter from the independent accountants required by applicable requirementsof the Public Company Accounting Oversight Board regarding the independent accountant’s communications with theaudit committee concerning independence, and discussed with the independent accountant the independentaccountant’s independence.
Based on the review and discussions referred to in items (1) through (3) of the above paragraph, the audit committeerecommended to the board of directors that the audited financial statements be included in our Annual Report onForm 10-K for the year ended December 31, 2009 for filing with the Securities and Exchange Commission.
Dennis W. Johnson, ChairmanA. Bart HoladayRichard H. LewisJohn K. Wilson
Compensation CommitteeThe compensation committee met four times during 2009. The compensation committee members are Thomas Everist, chairman,Karen B. Fagg, Thomas C. Knudson, and Patricia L. Moss.
The compensation committee’s responsibilities, as set forth in its charter, include:
• review and recommend changes to the board regarding our executive compensation policies for directors and executives
• evaluate the chief executive officer’s performance and, either as a committee or together with other independent directors as directed bythe board, determine his or her compensation
• recommend to the board the compensation of our other Section 16 officers and directors
• establish goals, make awards, review performance and determine, or recommend to the board, awards earned under our annual andlong-term incentive compensation plans
• review and discuss with management the compensation discussion and analysis and based upon such review and discussion,determine whether to recommend to the board that the compensation discussion and analysis be included in our proxy statementand/or our Annual Report on Form 10-K
• arrange for the preparation of and approve the compensation committee report to be included in our proxy statement and/or AnnualReport on Form 10-K and
• assist the board in overseeing the management of risk in the committee’s areas of responsibility.
MDU Resources Group, Inc. Proxy Statement 57

Proxy Statement
The compensation committee and the board of directors have sole and direct responsibility for determining compensation for ourSection 16 officers and directors. The compensation committee makes recommendations to the board regarding compensation of allSection 16 officers, and the board then approves the recommendations. The compensation committee and the board may not delegatetheir authority. They may, however, use recommendations from outside consultants, the chief executive officer, and the human resourcesdepartment. The chief executive officer, the chief financial officer, the vice president-human resources, and general counsel regularlyattend compensation committee meetings. The committee meets in executive session as needed.
We discuss our processes and procedures for consideration and determination of compensation of our Section 16 officers in theCompensation Discussion and Analysis. We also discuss in the Compensation Discussion and Analysis the role of our executive officersand compensation consultants in determining or recommending compensation for our Section 16 officers.
The compensation committee has sole authority to retain, discharge, and approve fees and other terms and conditions for retention ofcompensation consultants to assist in consideration of the compensation of the chief executive officer, the other Section 16 officers, andthe board of directors. The compensation committee charter requires the committee’s pre-approval of the engagement of the committee’scompensation consultants by the company for any other purpose.
In February 2009, the compensation committee approved the retention of Towers Perrin as its compensation consultant for 2009 toperform duties to be identified in an engagement letter. In an engagement letter dated March 3, 2009 and signed by the chairman of thecompensation committee, the compensation committee requested Towers Perrin to provide an executive compensation review similar tothose prepared in prior years.
The review was to:
• match company positions to survey data
• develop 2010 competitive estimates on base salaries and targeted short-term and long-term incentives
• compare company base salaries and targeted short-term and long-term incentives, by position, to market estimates
• construct a recommended 2010 salary grade structure, salary grade changes, and changes in base salaries and incentive targetsbased on competitive data and
• address general trends in executive compensation, such as overall salary movement and the recession’s impact onexecutive compensation.
In May 2009, upon recommendation of the chairman, the committee decided not to continue the consultant’s engagement for 2009due to budget concerns and the company’s ability to access data through other sources.
The compensation committee did authorize the company to participate in compensation and employee benefits surveys sponsoredby Towers Perrin.
The board of directors determines compensation for our non-employee directors based upon recommendations from the compensationcommittee. In February 2009, the compensation committee decided that the compensation review for the board of directors would beundertaken internally by the company, rather than by an outside consultant. At its May 2009 meeting, the committee reviewed the analysisof competitive data and recent trends in director compensation prepared by the company. The company’s analysis was based on proxydata from our performance graph peer group companies compiled by Equilar and on data from the National Association of CorporateDirectors 2008/2009 Director Compensation Report. The committee compared this data to our directors’ compensation and each of itscomponents. After review and discussion of the market data, which indicated that aggregate director compensation was at the median ofthe National Association of Corporate Directors 2008/2009 Director Compensation Report companies and above the median – 65thpercentile – of the peer group companies, the compensation committee recommended, and the board approved, that the annual retainerbe increased by $25,000 to $55,000 and that the monthly fees be eliminated, effective June 1, 2009.
Stockholder CommunicationsStockholders and other interested parties who wish to contact the board of directors or an individual director, including our non-employeechairman or non-employee directors as a group, should address a communication in care of the secretary at MDU Resources Group, Inc.,P.O. Box 5650, Bismarck, ND 58506-5650. The secretary will forward all communications.
PR
OXY
58 MDU Resources Group, Inc. Proxy Statement
Proxy StatementP
RO
XY
SECTION 16(a) BENEFICIAL OWNERSHIP REPORTING COMPLIANCESection 16 of the Securities Exchange Act of 1934, as amended, requires that officers, directors, and holders of more than 10% of ourcommon stock file reports of their trading in our equity securities with the Securities and Exchange Commission. Based solely on a reviewof Forms 3, 4, and 5 and any amendments to these forms furnished to us during and with respect to 2009 or written representations thatno Forms 5 were required, we believe that all such reports were timely filed.
OTHER BUSINESSNeither the board of directors nor management intends to bring before the meeting any business other than the matters referred to in thenotice of annual meeting and this proxy statement. In addition, other than as described under Item 6 above and in the following sentences,we have not been informed that any other matter will be presented to the meeting by others. One stockholder proposal was submitted forinclusion in the proxy statement, which we have omitted pursuant to Rule 14a-8 of the Securities and Exchange Commission’s proxy rules.If this stockholder complies with our advance notice bylaw provisions and properly presents the proposal at the annual meeting, it is theintention of the persons named in the proxy to vote against this proposal. If any other matter requiring a vote of the stockholders shouldarise, the persons named in the enclosed proxy will vote in accordance with their best judgment.
SHARED ADDRESS STOCKHOLDERSIn accordance with a notice sent to eligible stockholders who share a single address, we are sending only one annual report tostockholders and one proxy statement to that address unless we received instructions to the contrary from any stockholder at that address.This practice, known as “householding,” is designed to reduce our printing and postage costs. However, if a stockholder of record wishesto receive a separate annual report to stockholders and proxy statement in the future, he or she may contact the office of the treasurerat MDU Resources Group, Inc., P.O. Box 5650, Bismarck, ND 58506-5650, Telephone Number: (701) 530-1000. Eligible stockholdersof record who receive multiple copies of our annual report to stockholders and proxy statement can request householding by contactingus in the same manner. Stockholders who own shares through a bank, broker, or other nominee can request householding by contactingthe nominee.
We hereby undertake to deliver promptly, upon written or oral request, a separate copy of the annual report to stockholders and proxystatement to a stockholder at a shared address to which a single copy of the document was delivered.
2011 ANNUAL MEETING OF STOCKHOLDERSDirector Nominations: Our bylaws provide that director nominations may be made only by (i) the board at any meeting of stockholdersor (ii) at an annual meeting by a stockholder entitled to vote for the election of directors and who has complied with the proceduresestablished by the bylaws. For a nomination to be properly brought before an annual meeting by a stockholder, the stockholder intendingto make the nomination must have given timely and proper notice of the nomination in writing to the corporate secretary in accordancewith and containing all information and the completed questionnaire provided for in the bylaws. To be timely, such notice must bedelivered to or mailed to the corporate secretary and received at our principal executive offices not later than 90 days prior to the firstanniversary of the preceding year’s annual meeting of stockholders. For purposes of our annual meeting of stockholders expected to beheld April 26, 2011, any stockholder who wishes to submit a nomination must submit the required notice to the corporate secretary on orbefore January 27, 2011.
Other Meeting Business: Our bylaws also provide that no business may be brought before an annual meeting except (i) as specified in themeeting notice given by or at the direction of the board, (ii) as otherwise properly brought before the meeting by or at the direction of theboard or (iii) properly brought before the meeting by a stockholder entitled to vote who has complied with the procedures established bythe bylaws. For business to be properly brought before an annual meeting by a stockholder (other than nomination of a person for electionas a director which is described above) the stockholder must have given timely and proper notice of such business in writing to thecorporate secretary, in accordance with, and containing all information provided for in the bylaws and such business must be a propermatter for stockholder action under the General Corporation Law of Delaware. To be timely, such notice must be delivered or mailed to thecorporate secretary and received at our principal offices not later than the close of business 90 days prior to the first anniversary of thepreceding year’s annual meeting of stockholders. For purposes of our annual meeting expected to be held April 26, 2011, any stockholderwho wishes to bring business before the meeting (other than nomination of a person for election as a director which is described above)must submit the required notice to the corporate secretary on or before January 27, 2011.
Discretionary Voting: Rule 14a-4 of the Securities and Exchange Commission’s proxy rules allows us to use discretionary voting authorityto vote on matters coming before an annual stockholders’ meeting if we do not have notice of the matter at least 45 days before theanniversary date on which we first mailed our proxy materials for the prior year’s annual stockholders’ meeting or the date specified by anadvance notice provision in our bylaws. Our bylaws contain an advance notice provision that we have described above. For our annualmeeting of stockholders expected to be held on April 26, 2011, stockholders must submit such written notice to the corporate secretary onor before January 27, 2011.
MDU Resources Group, Inc. Proxy Statement 59
Proxy Statement
Stockholder Proposals: The requirements we describe above are separate from and in addition to the Securities and ExchangeCommission’s requirements that a stockholder must meet to have a stockholder proposal included in our proxy statement under Rule 14a-8 of the Exchange Act. For purposes of our annual meeting of stockholders expected to be held on April 26, 2011, anystockholder who wishes to submit a proposal for inclusion in our proxy materials must submit such proposal to the corporate secretaryon or before November 12, 2010.
Bylaw Copies: You may obtain a copy of the full text of the bylaw provisions discussed above by writing to the corporate secretary. Ourbylaws are also available on our website at: http://www.mdu.com/Documents/Governance/MDU%20ResourcesBylaws.pdf.
We will make available to our stockholders to whom we furnish this proxy statement a copy of our Annual Report on Form 10-K, excludingexhibits, for the year ended December 31, 2009, which is required to be filed with the Securities and Exchange Commission. You may obtaina copy, without charge, upon written or oral request to the Office of the Treasurer of MDU Resources Group, Inc., 1200 West Century Avenue,Mailing Address: P.O. Box 5650, Bismarck, ND 58506-5650, Telephone Number: (701) 530-1000. You may also access our Annual Report onForm 10-K through our website at www.mdu.com.
By order of the Board of Directors,
Paul K. SandnessSecretaryMarch 12, 2010
PR
OXY
60 MDU Resources Group, Inc. Proxy Statement

Proxy StatementP
RO
XY
EXHIBIT A
MDU Resources Group, Inc.’s Proposed Amendmentsto Its Restated Certificate of Incorporation
RESOLVED, that the Board of Directors of MDU Resources Group, Inc. (the “Corporation”) hereby declares it advisable:
(A) That the provisions requiring a supermajority vote by stockholders set forth in Articles TWELFTH and FIFTEENTH of the RestatedCertificate of Incorporation of the Corporation be repealed, and that certain technical amendments to the provisions of ArticlesTHIRTEENTH and FOURTEENTH of the Restated Certificate of Incorporation of the Corporation be adopted in connection with the repealof such supermajority vote provisions and the declassification of the Board of Directors of the Corporation effected in 2007, effective at theclose of business on the date on which the appropriate Certificate of Amendment to the Corporation’s Restated Certificate of Incorporationis filed in the office of the Secretary of State of the State of Delaware;
(B) That, in order to effect the foregoing, the Restated Certificate of Incorporation of the Corporation, as heretofore amended, be furtheramended by amending Articles TWELFTH, THIRTEENTH, FOURTEENTH and FIFTEENTH as follows:
TWELFTH. [RESERVED]
Part I. For the purposes of this Article TWELFTH, the following terms shall have the meaning hereinafter set forth:
(a) “Affiliate” or “Associate” shall have the respective meanings ascribed to such terms in the General Rules and Regulations underthe Securities Exchange Act of 1934 as in effect on January 1, 1985.
(b) A person shall be a “Beneficial Owner” of any Voting Stock:
(i) which such person or any of its Affiliates or Associates (as herein defined) beneficially owns, directly or indirectly; or
(ii) which such person or any of its Affiliates or Associates has (A) the right to acquire (whether such right is exercisableimmediately or only after the passage of time), pursuant to any agreement, arrangement or understanding or upon theexercise of conversion rights, exchange rights, warrants or options, or other wise, or (B) the right to vote pursuant to anyagree ment, arrangement or understanding; or
(iii) which are beneficially owned, directly or indirectly, by any other person with which such person or any of its Affiliates orAssociates has any agree ment, arrangement or understanding for the purpose of acquiring, holding, voting or disposing ofany shares of Voting Stock.
(c) “Business Combination” shall mean any of the following:
(i) any merger or consolidation of the Corporation or any Subsidiary with (A) any Interested Stockholder or (B) any othercorporation (whether or not itself an Interested Stockholder) which is, or after such merger or consolidation would be, anAffiliate of an Interested Stockholder; or
(ii) any sale, lease, exchange, mortgage, pledge, transfer or other disposition (in one transaction or a series of transactions) toor with any Interested Stock holder or any Affiliate of any Interested Stockholder of any assets of the Corporation or anySubsidiary having an aggregate Fair Market Value of $5,000,000 or more but shall not include transactions between theCorporation and its Subsidiaries; or
(iii) the issuance or transfer by the Corporation or any subsidiary (in one transaction or a series of transactions) of any securitiesof the Corporation or any subsidiary to any Interested Stockholder or any Affiliate of any Interested Stockholder in exchangefor cash, securities or other property (or a combination thereof) having an aggregate Fair Market Value of $5,000,000 ormore; or,
(iv) the adoption of any plan or proposal for the liquidation or dissolution of the Corporation proposed by or on behalf of anInterested Stockholder or any Affiliate of any Interested Stockholder; or
MDU Resources Group, Inc. Proxy Statement A-1
Proxy Statement
(v) any reclassification of securities (including any reverse stock split), or recapitalization of the Corporation, statutory shareexchange, or any merger or consolidation of the Corporation with any of its Subsidiaries or any other transaction (whether ornot with or into or otherwise involving an Interested Stock holder) which has the effect, directly or indirectly, of increasing theproportionate share of the outstanding shares of any class of equity or convertible securities of the Corporation or anySubsidiary which is directly or indirectly owned by any Interested Stockholder or any Affiliate of any Interested Stockholder.
(d) “Continuing Director” shall mean any member of the Board of Directors of the Corporation (the “Board”) who is unaffiliated with,and not a nominee of, the Interested Stockholder (as such term is used in the context of a Business Combination) and was amember of the Board prior to the time that the Interested Stockholder became an Interested Stockholder and any successor of aContinuing Director who is unaffiliated with, and not a nominee of, the Interested Stockholder and is designated to succeed aContinuing Director by two-thirds of Continuing Directors then on the Board.
(e) “Fair Market Value” means:
(i) in the case of stock, the highest closing sale price during the thirty-day period immediately preceding the date in questionof a share of such stock on the Composite Tape for the New York Stock Exchange-Listed Stocks, or, if such stock is notquoted on the Composite Tape for the New York Stock Exchange, or, if such stock is not listed on such Exchange, on theprincipal United States securities exchange registered under the Secu rities Exchange Act of 1934 on which such stock islisted, or, if such stock is not listed on any such exchange, the highest closing bid quotation with respect to a share of suchstock during the thirty-day period preceding the date in question on the National Association of Securities Dealers, Inc.Automated Quotations System (“NASDAQ”) or, if NASDAQ is not then in use, any other system then in use, or, if no suchquotations are available, the fair market value on the date in question of a share of such stock as determined by two-thirdsof the Continuing Directors in good faith; and
(ii) in the case of property other than cash or stock, the fair market value of such property on the date in question asdetermined by a majority of the Continuing Directors in good faith.
(f) “Institutional Voting Stock” shall mean any class of Voting Stock which was issued to and continues to be held solely by one ormore insurance companies, pension funds, commercial banks, savings banks and/or similar financial institutions or institutionalinvestors.
(g) “Interested Stockholder” shall mean any person (other than the Corporation or any Subsidiary) who or which:
(i) is the Beneficial Owner, directly or indirectly, of more than 10 percent of the voting power of the then outstanding VotingStock; or
(ii) is an Affiliate of the Corporation and at any time within the two-year period immediately prior to the date in question,became the Beneficial Owner, directly or indirectly, of 10 percent or more of the voting power of the then outstanding VotingStock; or
(iii) is an assignee of or has otherwise succeeded to any shares of Voting Stock which were at any time within the two-yearperiod immediately prior to the date in question beneficially owned by any Interested Stockholder, if such assignment orsuccession shall have occurred in the course of a transaction or series of transactions not involving a public offering withinthe meaning of the Securities Act of 1933.
For the purpose of determining whether a person is an Interested Stockholder pursuant to this paragraph (g), the number ofshares of Voting Stock deemed to be outstanding shall include shares deemed owned through application of paragraph (b) ofthis Part I but shall not include any other shares of Voting Stock which may be issuable pursuant to any agreement, arrangementor understanding, or upon exercise of conversion rights, warrants or options, or otherwise.
(h) In the event of any Business Combination in which the Corporation survives the phrase “consideration other than cash to bereceived” as used in Sections (a) and (b) of Part II of this Article TWELFTH shall include the shares of Common Stock and/or theshares of any other class of outstanding Voting Stock retained by the holders of such shares.
(i) A “person” shall mean any individual, firm, partner ship, trust, corporation or other entity.
PR
OXY
A-2 MDU Resources Group, Inc. Proxy Statement

Proxy StatementP
RO
XY
(j) “Subsidiary” means any corporation of which a majority of any class of equity security is owned, directly or indirectly, by theCorporation; provided, however, that for the purposes of the definition of Interested Stockholder set forth in paragraph (g) of thisPart I, the term “Subsidiary” shall mean only a corporation of which a majority of each class of equity security is owned, directlyor indirectly, by the Corporation.
(k) “Voting Stock” shall mean each share of stock of the Corporation generally entitled to vote in elections of directors.
The Continuing Directors of the Corporation shall have the power and duty to determine, for the purposes of this Article TWELFTH, onthe basis of information known to them after reason able inquiry, all facts necessary to determine the applicability of the variousprovisions of this Article TWELFTH, including (a) whether a person is an Interested Stockholder, (b) the number of shares of VotingStock beneficially owned by any person, (c) whether a person is an Affiliate or Associate of another, and (d) whether a class of VotingStock is Institutional Voting Stock. Any such determination made in good faith shall be binding and conclusive on all parties.
PART II.
Except as otherwise expressly provided in Part III of this Article TWELFTH and in addition to any other provision of law and as mayotherwise be set forth in the Certificate of Incorporation, the consummation of any Business Combination shall require that all of thefollowing conditions shall have been met:
(a) The aggregate amount of the cash and the Fair Market Value as of the date of the consummation of the Business Combination ofconsideration other than cash to be received per share by holders of Common Stock in such Business Combination shall be atleast equal to the highest of the following:
(i) (if applicable) the highest per share price (including any brokerage commissions, transfer taxes and soliciting dealers’fees) paid by the Interested Stockholder for any shares of Common Stock acquired by it (A) within the two-year periodimmediately prior to the first public announcement of the proposal of the Business Combination (the “AnnouncementDate”) or (B) in the transaction in which it became an Interested Stockholder, whichever is highest;
(ii) the Fair Market Value per share of Common Stock on the Announcement Date or on the date on which the InterestedStockholder became an Interested Stock holder (such latter date is referred to in this Article TWELFTH as the“Determination Date”), whichever is higher; and
(iii) (if applicable) the price per share equal to the Fair Market Value per share of Common Stock determined pursuant toparagraph (ii) above, multiplied by the ratio of (A) the highest per share price (includ ing any brokerage commissions,transfer taxes and soliciting dealers’ fees) paid by the Interested Stockholder for any shares of Common Stock acquired byit within the two-year period immediately prior to the Announcement Date to (B) the Fair Market Value per share ofCommon Stock on the first day in such two-year period upon which the Interested Stockholder acquired any shares ofCommon Stock.
(b) The aggregate amount of the cash and the Fair Market Value as of the date of the consummation of the Business Combination ofconsideration other than cash to be received per share by holders of shares of any class of outstanding Voting Stock other thanCommon Stock (and other than Institutional Voting Stock), shall be at least equal to the highest of the following (it being intendedthat the require ments of this paragraph (b) shall be required to be met with respect to every class of outstanding Voting Stock,whether or not the Interested Stockholder has previously acquired any shares of a particular class of Voting Stock):
(i) (if applicable) the highest per share price (including any brokerage commissions, transfer taxes and soliciting dealers’ fees)paid by the Interested Stockholder for any shares of such class of Voting Stock acquired by it (A) within the two-year periodimmedi ately prior to the Announcement Date or (B) in the transaction in which it became an Interested Stock holder,whichever is higher;
(ii) (if applicable) the highest preferential amount per share to which the holders of shares of such class of Voting Stock areentitled in the event of any voluntary or involuntary liquidation, dissolution or winding up of the Corporation;
(iii) the Fair Market Value per share of such class of Voting Stock on the Announcement Date or on the Determination Date,whichever is higher; and
MDU Resources Group, Inc. Proxy Statement A-3
Proxy Statement
(iv) (if applicable) the price per share equal to the Fair Market Value per share of such class of Voting Stock determinedpursuant to paragraph (b)(iii) above, multiplied by the ratio of (A) the highest per share price (including any brokeragecommissions, transfer taxes and soliciting dealers’ fees) paid by the Inter ested Stockholder for any shares of such class ofVoting Stock acquired by it within the two-year period immediately prior to the Announcement Date to (B) the Fair MarketValue per share of such class of Voting Stock on the first day in such two-year period upon which the InterestedStockholder acquired any shares of such class of Voting Stock.
(c) The consideration to be received by holders of a particular class of outstanding Voting Stock (including Common Stock) shall bein cash or in the same form as the Interested Stockholder has previously paid for shares of such class of Voting Stock. If theInterested Stockholder has paid for shares of any class of Voting Stock with varying forms of consideration, the form ofconsideration for such class of Voting Stock shall be either cash or the form used to acquire the largest number of shares ofsuch class of Voting Stock previously acquired by it.
(d) After such Interested Stockholder has become an Interested Stockholder and prior to the consummation of such BusinessCombination:
(i) except as approved by two-thirds of the Continuing Directors, there shall have been no failure to declare and pay at theregular date therefor any full quarterly dividends (whether or not cumulative) on the outstanding Preferred Stock;
(ii) there shall have been (A) no reduction in the annual rate of dividends paid on the Common Stock (except as necessary toreflect any subdivision of the Common Stock), except as approved by two-thirds of the Continuing Directors, and (B) anincrease in such annual rate of dividends as necessary to reflect any reclassi fication (including any reverse stock split),recapital ization, reorganization or any similar transaction which has the effect of reducing the number of outstanding sharesof the Common Stock, unless the failure so to increase such annual rate is approved by two-thirds of the ContinuingDirectors; and
(iii) such Interested Stockholder shall have not become the beneficial owner of any additional shares of Voting Stock except aspart of the transaction which results in such Interested Stockholder becoming an Interested Stockholder.
(e) After such Interested Stockholder has become an Interested Stockholder, such Interested Stockholder shall not have receivedthe benefit, directly or indirectly (except proportionately as a stockholder), of any loans, advances, guarantees, pledges or otherfinancial assistance or any tax credits or other tax advantages provided by the Corporation, whether in anticipation of or inconnection with such Business Combination or otherwise.
(f) A proxy or information statement describing the proposed Business Combination and containing the information specified forproxy or information statements under the Securities Exchange Act of 1934 and the rules and regulations thereunder (or anysubsequent provisions replacing such Act, rules or regulations) shall be mailed to stockholders of the Corporation at least thirtydays prior to the consummation of such Business Combination (whether or not such proxy or information statement is requiredto be mailed pursuant to such Act or subsequent provisions).
PART III.
Unless the Business Combination shall have been approved by two-thirds of the Continuing Directors, (a) the provisions of Part II ofthis Article TWELFTH shall be applicable to each particular Business Combination, and (b) any such Business Combination shall beapproved by the affirmative vote of at least four-fifths of the voting power of all shares of Voting Stock (considered for pur poses of thisArticle TWELFTH as one class, it being understood that for purposes of this Article TWELFTH, each share of Voting Stock shall havethe number of votes granted to it pursuant to Article FOURTH of the Certificate of Incorporation).
PART IV.
Nothing contained in this Article TWELFTH shall be construed to relieve any Interested Stockholder from any fiduciary obliga tionimposed by law.
THIRTEENTH.
(a) The business and affairs of the Corporation shall be managed by the Board of Directors consisting of not less than six nor morethan fifteen persons. The exact number of directors within the limitations specified in the preceding sentence shall be fixed from
PR
OXY
A-4 MDU Resources Group, Inc. Proxy Statement

Proxy StatementP
RO
XY
time to time by the Board of Directors pursuant to a resolution adopted by two-thirds of the Continuing Directors. The directorsneed not be elected by ballot unless required by the By-Laws of the Corporation.
At each annual meeting of stockholders, the directors shall be elected for terms expiring at the next annual meeting ofstockholders; provided, however, that each director elected at the annual meetings of stockholders held in 2005, 2006 and 2007shall serve for the full three-year term to which such director was elected. Each director shall hold office for the term for whichhe is elected or appointed and until his successor shall be elected and qualified or until his earlier resignation, removal fromoffice or death, or until he shall resign or be removed.
In the event of any increase or decrease in the authorized number of directors, each director then serving as such shallnevertheless continue as director until the expiration of his current term, or until his earlier resignation, removal from officeor death.
(b) Newly created directorships resulting from any increase in the authorized number of directors or any vacancies in the Board ofDirectors resulting from death, resignation, retirement, disqualification, removal from office or other cause shall be filled by atwo-thirds vote of the Continuing Directors then in office, or a sole remaining director, although less than a quorum, and directorsso chosen shall hold office for a term expiring at the next annual meeting of stockholders. If one or more directors shall resignfrom the Board effective as of a future date, such vacancy or vacancies shall be filled pursuant to the provisions hereof, andsuch new directorship(s) shall become effective when such resignation or resignations shall become effective, and each directorso chosen shall hold office for a term expiring at the next annual meeting of stockholders.
(c) [RESERVED]
Any director or the entire Board of Directors may be removed; however, such removal must be for cause and must be approvedas set forth in this Section. Except as may otherwise be provided by law, cause for removal shall be construed to exist only if: (i)the director whose removal is proposed has been convicted, or where a director was granted immunity to testify where anotherhas been convicted, of a felony by a court of competent jurisdiction and such conviction is no longer subject to direct appeal; (ii)such director has been grossly negligent in the performance of his duties to the Corporation; or (iii) such director has beenadjudicated by a court of competent jurisdiction to be mentally incompetent, which mental incompetency directly affects hisability as a director of the Corporation, and such adjudication is no longer subject to direct appeal.
Removal for cause, as cause is defined above, must be approved by at least a majority vote of the shares of the Corporation thenentitled to be voted at an election for that director, and the action for removal must be brought within three months of suchconviction or adjudication.
Notwithstanding the foregoing, and except as otherwise provided by law, in the event that Preferred Stock of the Corporation isissued and holders of any one or more series of such Preferred Stock are entitled, voting separately as a class, to elect one ormore directors of the Corporation to serve for such terms as set forth in the Certificate of Incorporation, the provisions of thisArticle THIRTEENTH, Section (c), shall also apply, in respect to the removal of a director or directors so elected to the vote of theholders of the outstanding shares of that class and not to the vote of the outstanding shares as a whole.
(d) Any directors elected pursuant to special voting rights of one or more series of Preferred Stock, voting as a class, shall beexcluded from, and for no purpose be counted in, the scope and operation of the foregoing provisions, unless expressly stated.
(e) For purposes of this Article THIRTEENTH, the following terms shall have the meanings hereinafter set forth:
(i) “Affiliate” or “Associate” shall have the respective meanings ascribed to such terms in the General Rules and Regulationsunder the Securities Exchange Act of 1934 as in effect on January 1, 1985.
(ii) A person shall be a “Beneficial Owner” of any Voting Stock:
(A) which such person or any of its Affiliates or Associates beneficially owns, directly or indirectly; or
(B) which such person or any of its Affiliates or Associates has (1) the right to acquire (whether such right is exercisableimmediately or only after the passage of time), pursuant to any agreement, arrangement or understanding or upon theexercise of conversion rights, exchange rights, warrants or options, or otherwise, or (2) the right to vote pursuant toany agreement, arrangement or understanding; or
MDU Resources Group, Inc. Proxy Statement A-5
Proxy Statement
(C) which are beneficially owned, directly or indirectly, by any other person with which such person or any of its Affiliatesor Associates has any agreement, arrangement or understanding for the purpose of acquiring, holding, voting ordisposing of any shares of Voting Stock.
(iii) “Continuing Director” shall mean any member of the Board of Directors of the Corporation who is unaffiliated with, and nota nominee of, any Interested Stockholder and was a member of the Board of Directors prior to the time that anyInterested Stockholder became an Interested Stockholder and any successor of a Continuing Director who is unaffiliatedwith, and not a nominee of, any Interested Stockholder and is designated to succeed a Continuing Director by two-thirds ofthe Continuing Directors then on the Board of Directors.
(iv) “Interested Stockholder” shall mean any person (other than the Corporation or any Subsidiary) who or which:
(A) is the Beneficial Owner, directly or indirectly, of more than 10 percent of the voting power of the then outstandingVoting Stock; or
(B) is an Affiliate of the Corporation and at any time within the two-year period immediately prior to the date in question,became the Beneficial Owner, directly or indirectly, of more than 10 percent of the voting power of the thenoutstanding Voting Stock; or
(C) is an assignee of or has otherwise succeeded to any shares of Voting Stock which were at any time within the two-yearperiod immediately prior to the date in question beneficially owned by any Interested Stockholder, if such assignmentor succession shall have occurred in the course of a transaction or series of transactions not involving a public offeringwithin the meaning of the Securities Act of 1933.
For the purpose of determining whether a person is an Interested Stockholder pursuant to this Article THIRTEENTH,Section (e)(iv), the number of shares of Voting Stock deemed to be outstanding shall include shares deemed ownedthrough application of Section (e)(ii) of this Article THIRTEENTH but shall not include any other shares of Voting Stockwhich may be issuable pursuant to any agreement, arrangement or understanding, or upon exercise of conversion rights,warrants or options, or otherwise.
(v) A “person” shall mean any individual, firm, partnership, trust, corporation or other entity.
(vi) “Subsidiary” means any corporation of which a majority of any class of equity security is owned, directly or indirectly, by theCorporation; provided, however, that for the purposes of the definition of Interested Stockholder set forth in Section (e)(iv)of this Article THIRTEENTH, the term “Subsidiary” shall mean only a corporation of which a majority of each class ofequity security is owned, directly or indirectly, by the Corporation.
(vii) “Voting Stock” shall mean each share of stock of the Corporation generally entitled to vote in elections of directors.
The Continuing Directors of the Corporation shall have the power and duty to determine, on the basis of information known tothem after reasonable inquiry, all facts necessary to determine the applicability of the various provisions of this ArticleTHIRTEENTH, including (A) whether a person is an Interested Stockholder, (B) the number of shares of Voting Stockbeneficially owned by any person, and (C) whether a person is an Affiliate or Associate of another. Any such determination madein good faith shall be binding and conclusive on all parties.
(f) Capitalized terms used and not defined in Article FOURTEENTH or in Article SIXTEENTH of the Certificate ofIncorporation which are defined in Section (e) of this Article THIRTEENTH shall have the meanings, for purposes ofArticle FOURTEENTH and Article SIXTEENTH of the Certificate of Incorporation, ascribed to such terms in Section (e)of this Article THIRTEENTH.
FOURTEENTH. The Board of Directors, in evaluating any proposal by another party to (a) make a tender or exchange offer for anysecurities of the Corporation, (b) effect a Business Combination (as defined in Article TWELFTH),merger, consolidation or otherbusiness combination of the Corporation or (c) effect any other transaction having an effect upon the properties, operations orcontrol of the Corporation similar to a tender or exchange offer or Business Combination for any securities of the Corporation or amerger, consolidation or other business combination of the Corporation, as the case may be, whether by an Interested Stockholder
PR
OXY
A-6 MDU Resources Group, Inc. Proxy Statement
Proxy StatementP
RO
XY
(as defined in Article TWELFTH) or otherwise, may, in connection with the exercise of its judgment as to what is in the best interestsof the Corporation and its stockholders, give due consideration to the following:
(i) the consideration to be received by the Corporation or its stockholders in connection with such transaction in relation notonly to the then current market price for the outstanding capital stock of the Corporation, but also to the market price forthe capital stock of the Corporation over a period of years, the estimated price that might be achieved in a negotiated sale ofthe Corporation as a whole or in part through orderly liquidation, the premiums over market price for the securities of othercorporations in similar transactions, current political, economic and other factors bearing on securities prices and theCorporation’s financial condition, future prospects and future value as an independent Corporation;
(ii) the character, integrity and business philosophy of the other party or parties to the transaction and the management of suchparty or parties;
(iii) the business and financial conditions and earnings prospects of the other party or parties to the transaction, including, butnot limited to, debt service and other existing or likely financial obligations of such party or parties, the intention of the otherparty or parties to the transaction regarding the use of the assets of the Corporation to finance the acquisition, and thepossible effect of such conditions upon the Corporation and its Subsidiaries and the other elements of the communities inwhich the Corporation and its Subsidiaries operate or are located;
(iv) the projected social, legal and economic effects of the proposed action or transaction upon the Corporation or itsSubsidiaries, its employees, suppliers, customers and others having similar relationships with the Corporation, and thecommunities in which the Corporation and its Subsidiaries do business;
(v) the general desirability of the continuance of the Corporation as an independent entity; and
(vi) such other factors as the Continuing Directors may deem relevant.
FIFTEENTH. [RESERVED] Notwithstanding anything to the contrary contained in this Certificate of Incorporation or the By-Laws ofthe Corporation (and notwithstanding the fact that a lesser percentage may be specified by law, this Certificate of Incorpora tion or theBy-Laws of the Corporation), the affirmative vote of the holders of at least four-fifths of the voting power of the then outstanding VotingStock shall be required to amend, alter, change or repeal, or to adopt any provision inconsistent with, Articles TWELFTH,THIRTEENTH, FOURTEENTH, FIFTEENTH and SIXTEENTH of this Certificate of Incorporation, provided that such four -fifths voteshall not be required for any amendment, alteration, change or repeal recommended to the stockholders by two-thirds of theContinuing Directors, as defined in Article TWELFTH.
FURTHER RESOLVED, that the Board of Directors hereby directs that this resolution and above proposed amendments be attached as anexhibit to the proxy statement for the Corporation’s 2010 Annual Meeting of Stockholders for consideration by the stockholders entitled tovote in respect thereof;
FURTHER RESOLVED, that upon approval of the proposed amendments to the Restated Certificate of Incorporation by the stockholders,the proper officers of the Corporation be, and each of them hereby is, authorized and directed to file a Certificate of Amendment to theCorporation’s Restated Certificate of Incorporation with the Secretary of State of the State of Delaware, to amend the Corporation’sRegistration Statement on Form 8-A relating to the common stock of the Corporation, and to file any and all other documents and to takeany and all such further action as they deem necessary or appropriate to reflect such amendments.
MDU Resources Group, Inc. Proxy Statement A-7
Proxy StatementP
RO
XY
A-8 MDU Resources Group, Inc. Proxy Statement

Fidelity Exploration & Production Co. is engaged in natural gas and oil acquisition, exploration, development and production activities in the Rocky Mountain and Mid-Continent regions of the United States and in and around the Gulf of Mexico.
The pipeline and energy services segment provides natural gas transportation, underground storage and gathering services through regulated and nonregulated pipeline systems primarily in the Rocky Mountain and northern Great Plains regions of the United States. It also provides cathodic protection and other energy-related services.
Montana-Dakota Utilities Co. generates, transmits and distributes electricity and distributes natural gas in Montana, North Dakota, South Dakota and Wyoming. Cascade Natural Gas Corp. distributes natural gas in Oregon and Washington. Intermountain Gas Co. distributes natural gas in Idaho. Great Plains Natural Gas Co. distributes natural gas in western Minnesota and southeastern North Dakota. These operations also supply related value-added products and services.
The construction services segment specializes in constructing and maintaining electric and communication lines, gas pipelines, fire suppression systems, and external lighting and traffic signalization equipment. This segment also provides utility excavation services and inside electrical wiring, cabling and mechanical services, sells and distributes electrical materials, and manufactures and distributes specialty equipment.
Knife River Corp. mines aggregates and markets crushed stone, sand, gravel and related construction materials, including ready-mix concrete, cement, asphalt, liquid asphalt and other value-added products. It also performs integrated contracting services. Knife River operates in the central, southern and western United States and Alaska and Hawaii.
Natural Gas and Oil Production
Pipeline and Energy Services
Electric and Natural Gas Utilities
Construction Services
Construction Materials and Contracting
SD
MO
NE
TX
CO
WY
MT
IDOR
HI
WA
NV
AK
CA
MN
IA
ND
Construction materials locations
States of operations
NE
SD
MT
ID
AK
HI
WY
COUT
NV
CA
OR
WA
AZNM
NDMN
IA
MO
AR
LA
TN
MS
NC
VA MD
DE
WVKY
IN OHPA
NY
ME
AL GA
FL
SC
IL
MIWI
KS
OK
TX
Construction services offices
Authorized states of operations
SD
MTID
WY
OR
WA
ND MN
Electric and natural gas utility areas
Electric generating stations
States of operations
Areas of production and reserves
States of operations
Pipeline gathering systems
Company storage fields
States of operations
Pipeline systems
Interconnecting pipelines
> Federal stimulus dollars boosted earnings for many Knife River divisions and increased the company’s public works portfolio.
> Knife River expanded its presence in the renewable energy market, especially wind farm projects.
> Knife River marked its 11th year of safety performance improvements.
> Asphalt production and asphalt oil sales increased with a push from federal stimulus spending.
> The utility operations posted record earnings.
> Growth continues despite challenging economic conditions, with this business segment now serving more than 950,000 customers.
> Montana-Dakota Utilities experienced its best safety record in company history.
> Electric generation is expanding with a heat-recovery facility, two wind farms and a partnership in a Wyoming facility.
> WBI Holdings acquired a cathodic-protection business, expanding the company’s energy services portfolio.
> Higher demand for natural gas storage services increased revenues and boosted transportation volumes to record levels.
> Williston Basin Interstate Pipeline completed its final incremental expansion of the Grasslands Pipeline, putting it at full capacity of 213,000 Mcf per day.
> Rocky Mountain Contractors finished the Glacier Wind Farm project in Ethridge, Montana.
> Desert Fire Protection completed work on the 18 million-square-foot City Center in Las Vegas.
> Capital Electric Construction keeps the lights on for the Chiefs, doing the Arrowhead Stadium renovation in Kansas City, Missouri.
> Oil production was up 11 percent, spurred by involvement in the prolific Bakken Formation.
> Fidelity Exploration & Production continues to be the largest producer of natural gas in Montana.
> Fidelity Exploration & Production ranks 52nd in total assets out of 141 American oil and gas companies.
> Fidelity Exploration & Production realized lower lease operating costs.
Revenues (millions) $439.7Earnings (millions)* $87.7Production Natural gas (Bcf) 56.6 Oil (million barrels) 3.1Proved reserves Natural gas (Bcf) 448.4 Oil (million barrels) 34.2Corporate earnings contribution 34%
* Excludes the effects of a $384.4 million after-tax noncash charge relating to the write-down of natural gas and oil properties.
Revenues (millions) $307.8Earnings (millions) $37.8Pipeline (MMdk) Transportation 163.3 Gathering 92.6Corporate earnings contribution 15%
Revenues (millions) $819.0Earnings (millions) $25.6Corporate earnings contribution 10%
Revenues (millions) $1,515.1Earnings (millions) $47.1Sales (millions) Aggregates (tons) 24.0 Asphalt (tons) 6.4 Ready-mix concrete (cubic yards) 3.0Aggregate reserves (billion tons) 1.1Corporate earnings contribution 18%
Revenues (millions) Electric $196.2 Natural gas $1,072.8Earnings (millions) Electric $24.1 Natural gas $30.8Electric sales (million kWh) Retail 2,663.5 Sales for resale 90.8Natural gas distribution (MMdk) Sales 102.7 Transportation 132.7Corporate earnings contribution Electric 9% Natural gas 12%
Company description
> Fidelity expects to invest $375 million in its business in 2010.
> The company has active drilling on 16,000 net acres of leaseholds in the Bakken Formation.
> Fidelity is pursuing additional exploratory and reserve acquisition opportunities.
> An active hedging program helps mitigate risk.
> The company is looking to increase firm deliverability and transportation capacity from its Baker storage field, the largest storage field in North America.
> The company will pursue expanding facilities and energy-related services.
> Additional natural gas takeaway capacity from the Bakken area will be pursued.
> This segment will realize even greater efficiencies and continue to enhance service levels through the ongoing integration of its four utility companies.
> Possible investments in high-voltage transmission opportunities are being considered.
> Under an agreement with the city of Billings, Montana, Montana-Dakota Utilities expects to begin extracting natural gas in 2010 from the Billings Regional Landfill to send to customers.
> The construction services segment continues to focus on improving safety.
> Rocky Mountain Contractors will begin constructing the 214-mile, 230-kilovolt Montana Alberta Tie Line transmission line.
> Renewable energy markets continue to present opportunities for the construction services segment.
> Preconstruction design-assist services add value for customers.
> Knife River is focused on expanding its Energy Services business into its existing asphalt markets.
> Public infrastructure funding is expected to be strong for the next 24 months because of stimulus spending and potential federal jobs legislation.
> Wind energy development throughout the western United States continues to present material and construction opportunities.
looking Forward Key Statistics Highlights territory
Notes:• Corporateearningscontributionpercentagesexcludetheeffectsofa$384.4millionafter-taxnoncashchargerelatingtothewrite-downofnaturalgasandoilproperties.• TheOthercategorycontributed2percentofcorporateearningswithrevenuesof$9.5millionandearningsof$7.3million.•Consolidatedrevenuesreflectintersegmenteliminationsof$183.6million.
Corporate HeadquartersMDU Resources Group, Inc. Street Address: 1200 W. Century Ave. Bismarck, ND 58503
Mailing Address: P.O. Box 5650 Bismarck, ND 58506-5650
Telephone: (701) 530-1000 Toll-Free Telephone: (866) 760-4852 www.mdu.com
The company has filed as exhibits to its Annual Report on Form 10-K the CEO and CFO certifications as required by Section 302 of the Sarbanes-Oxley Act.
The company also submitted the required annual CEO certification to the New York Stock Exchange.
Common StockMDU Resources’ common stock is listed on the NYSE under the symbol MDU. The stock began trading on the NYSE in 1948 and is included in the Standard & Poor’s MidCap 400 index. Average daily trading volume in 2009 was 909,899 shares.
Common Stock Prices High Low Close
2009 First Quarter $22.89 $12.79 $16.14Second Quarter 19.76 15.70 18.97Third Quarter 21.16 17.44 20.85Fourth Quarter 24.22 19.96 23.60
2008First Quarter $27.83 $23.08 $24.55Second Quarter 35.25 24.70 34.86Third Quarter 35.34 26.03 29.00Fourth Quarter 29.50 15.50 21.58
Dividend Reinvestment and Direct Stock Purchase PlanThe company’s plan provides interested investors the opportunity to purchase shares of the company’s common stock and to reinvest dividends without incurring brokerage commissions. For complete details, including an enrollment form, contact the stock transfer agent. Plan information also is available on the Wells Fargo Shareowner Services Web site: www.wellsfargo.com/shareownerservices.
2010 Key Dividend Dates Ex-Dividend Date Record Date Payment Date
First Quarter March 9 March 11 April 1Second Quarter June 8 June 10 July 1Third Quarter September 7 September 9 October 1Fourth Quarter December 7 December 9 January 1, 2011
Key dividend dates are subject to the discretion of the Board of Directors.
Annual MeetingTuesday, April 27, 2010 11 a.m. CDT Montana-Dakota Utilities Co. Service Center 909 Airport Road Bismarck, North Dakota
Shareholder Information and InquiriesRegistered shareholders have electronic access to their accounts by visiting www.shareowneronline.com. Shareowner Online allows shareholders to view their account balance, dividend information, reinvestment details and more. The stock transfer agent maintains stockholder account information.
Communications regarding stock transfer requirements, lost certificates, dividends or change of address should be directed to the stock transfer agent.
Company information, including financial reports, is available at www.mdu.com.
Shareholder ContactArlene Stillwell Telephone: (866) 866-8919 E-mail: [email protected]
Analyst ContactPhyllis A. Rittenbach Director of Investor Relations Telephone: (701) 530-1057 E-mail: [email protected]
Transfer Agent and Registrar for all Classes of Stock and Dividend Reinvestment PlanWells Fargo Bank, N.A. Stock Transfer Department P.O. Box 64856 St. Paul, MN 55164-0856 Telephone: (651) 450-4064 Toll-Free Telephone: (877) 536-3553 www.wellsfargo.com/shareownerservices
Transfer Agent and Registrar for Senior NotesThe Bank of New York Mellon Corporate Trust Department 101 Barclay St. — 12W New York, NY 10286
Independent AuditorsDeloitte & Touche LLP 50 S. Sixth St., Suite 2800 Minneapolis, MN 55402-1538
Note: This information is not given in connection with any sale or offer for sale or offer to buy any security.
Des
ign:
MD
U R
esou
rces
P
rintin
g: A
FPI
10%
Cert no. SCS-C0C-001834
The paper used in this annual report is certified by the Forest Stewardship Council and contains a minimum of 10 percent post-consumer recycled paper fibers.
Stockholder Information

Natural Gas and Oil Production
Electric and Natural Gas UtilitiesPipeline and Energy Services
Construction ServicesConstruction Materials and Contracting
MDU Resources Group, Inc.
Building a Strong America®
2009 Annual Report
Form 10-K
Proxy Statement
MDU Resources Group, Inc.
We are a Fortune 500 company and a member of the S&P MidCap 400 index. We provide
value-added natural resource products and related services that are essential to energy and
transportation infrastructure. We operate in three core lines of business: energy, utility
resources and construction materials. MDU Resources includes natural gas and oil production,
natural gas pipelines and energy services, electric and natural gas utilities, construction
services, and construction materials and contracting.
Natural Gas and Oil ProductionPipeline and Energy ServicesElectric UtilityNatural Gas UtilityConstruction Services OfficesConstruction Services Authorized States of OperationsConstruction Materials and Contracting
Natural Gas and Oil ProductionPipeline and Energy ServicesElectric UtilityNatural Gas UtilityConstruction Services OfficesConstruction Services Authorized States of OperationsConstruction Materials and Contracting
MDU Resources Group, Inc.
StReet AddReSS
1200 W. Century Ave.Bismarck, ND 58503
mAiling AddReSS
P.O. Box 5650Bismarck, ND 58506-5650
(701) 530-1000(866) 760-4852
Trading Symbol: MDUwww.mdu.com 00069614
Achievements2009 Fortune 500 Listn No. 473 based on total revenues.
Mergent Dividend Achievern Honor based on more than 10 consecutive years
of dividend increases. MDU Resources has increased dividends 19 consecutive years.
Platts Top 250 Global Energy Companies Listn Based on outstanding financial performance
using asset worth, revenues, profits and return on invested capital.
MD
U R
esources Group, Inc.
20
09 A
nnual Report
![Mdu Course Detail[1]](https://static.fdocuments.us/doc/165x107/543ca75aafaf9fc2618b46be/mdu-course-detail1.jpg)