
Natural Environment Change, Vol. 2, No. 2, Summer & … · Natural Environment Change, Vol. 2, No....
12
Natural Environment Change, Vol. 2, No. 2, Summer & Autumn 2016, pp. 153- 164 An Investigation and assessment of meteorological drought in Lake Urmia Basin using drought indices and probabilistic methods Khadijeh Javan; Professor, Climatology, Urmia University, Iran Mohammad Reza Azizzadeh ; Lecturer, Department of Geography, Payame Noor University, PO Box 3697-19395, Tehran, Iran Saadi Yousefi; M.A in Physical Geography, Payame Noor University. Urmia, Iran Received: Aug. 8, 2016 Accepted: Jan. 15, 2017 Abstract Drought is one of the most important weather-induced phenomena which may have severe impacts on different areas such as agriculture, economy, energy production, and society. A number of drought indices have been introduced and used in various countries to date. In the current study, four meteorological drought indices including Percent of Normal Precipitation Index (PNPI), Standard Index of Annual Precipitation (SIAP), Rainfall Anomaly Index (RAI), and Standardized Precipitation Index (SPI) are compared and evaluated for monitoring droughts in Lake Urmia Basin in Iran. The comparison of indices was carried out based on drought classes that were monitored in the study area using 40 years of data (1966-2005). Two well- known probability approaches including Runs theory and Markov chain model, were used to estimate the probability of wet and dry periods. The frequency matrix is formed and the transition probability matrix of wet- dry spells is created accordingly based on maximum likelihood method. The equilibrium probability is calculated based on succeed power on probability matrix. The results demonstrated that among the drought indices, PNPI is not an appropriate index in annual estimates and SPI and RAI are better than other indices and their results are nearer to reality. The results indicated the equilibrium probability of very dry, dry, normal, wet and very wet periods is obtained 0.23, 0.27, 0.23, 0.17 and 0.1, respectively. Keywords drought, Lake Urmia basin, Markov chain, PNPI, RAI, runs theory, SIAP, SPI. 1. Introduction Climate change is one of the most significant issues facing the world because it is predicted to alter climate patterns and increase the frequency of extreme weather events (IPCC, 2012). In recent years, the frequency of droughts that are due to global warming-related climate change has increased and is accompanied by a rise in the severity of these phenomena (IPCC, 2013). Droughts are natural hazards that cause enormous damage to social and economic sectors all around the world, and their devastating effects to eco-environmental systems are still hard to determine. Droughts are complex events best characterized by a series of properties including their frequency, duration and intensity (Mishra & Singh, 2010). Droughts can be defined from various perspectives including meteorological, hydrological, agricultural, and socio-economical. In general, a drought is defined as a dry weather period that lasts over several weeks to months, with no or little accumulated rainfall. Such dry weather events have significant impacts on water resources, agriculture, forestry, hydro-power, health, and socioeconomic activities. A reduced Corresponding Author: [email protected]
Transcript of Natural Environment Change, Vol. 2, No. 2, Summer & … · Natural Environment Change, Vol. 2, No....
Natural Environment Change, Vol. 2, No. 2, Summer & Autumn 2016, pp. 153- 164
An Investigation and assessment of meteorological
drought in Lake Urmia Basin using drought indices
and probabilistic methods Khadijeh Javan; Professor, Climatology, Urmia University, Iran
Mohammad Reza Azizzadeh; Lecturer, Department of Geography, Payame Noor
University, PO Box 3697-19395, Tehran, Iran
Saadi Yousefi; M.A in Physical Geography, Payame Noor University. Urmia, Iran
Received: Aug. 8, 2016 Accepted: Jan. 15, 2017
Abstract Drought is one of the most important weather-induced phenomena which may have
severe impacts on different areas such as agriculture, economy, energy production,
and society. A number of drought indices have been introduced and used in various
countries to date. In the current study, four meteorological drought indices including
Percent of Normal Precipitation Index (PNPI), Standard Index of Annual
Precipitation (SIAP), Rainfall Anomaly Index (RAI), and Standardized Precipitation
Index (SPI) are compared and evaluated for monitoring droughts in Lake Urmia
Basin in Iran. The comparison of indices was carried out based on drought classes
that were monitored in the study area using 40 years of data (1966-2005). Two well-
known probability approaches including Runs theory and Markov chain model, were
used to estimate the probability of wet and dry periods. The frequency matrix is
formed and the transition probability matrix of wet- dry spells is created accordingly
based on maximum likelihood method. The equilibrium probability is calculated
based on succeed power on probability matrix. The results demonstrated that among
the drought indices, PNPI is not an appropriate index in annual estimates and SPI and
RAI are better than other indices and their results are nearer to reality. The results
indicated the equilibrium probability of very dry, dry, normal, wet and very wet
periods is obtained 0.23, 0.27, 0.23, 0.17 and 0.1, respectively.
Keywords
drought, Lake Urmia basin, Markov chain, PNPI, RAI, runs theory, SIAP, SPI.
1. Introduction Climate change is one of the most significant issues facing the world because it is predicted to
alter climate patterns and increase the frequency of extreme weather events (IPCC, 2012). In
recent years, the frequency of droughts that are due to global warming-related climate change
has increased and is accompanied by a rise in the severity of these phenomena (IPCC, 2013).
Droughts are natural hazards that cause enormous damage to social and economic sectors all
around the world, and their devastating effects to eco-environmental systems are still hard to
determine. Droughts are complex events best characterized by a series of properties including
their frequency, duration and intensity (Mishra & Singh, 2010). Droughts can be defined from
various perspectives including meteorological, hydrological, agricultural, and socio-economical.
In general, a drought is defined as a dry weather period that lasts over several weeks to months,
with no or little accumulated rainfall. Such dry weather events have significant impacts on water
resources, agriculture, forestry, hydro-power, health, and socioeconomic activities. A reduced
Corresponding Author: [email protected]
154 Natural Environment Change, Vol. 2, No. 2, Summer & Autumn 2016
amount of accumulated rainfall leads to low soil moisture and river flows, reduced storage in
reservoirs and less groundwater recharge (Tallaksen & van Lanen, 2004). Thus, drought
monitoring and prediction are of critical importance for developing measures to mitigate the
impacts of droughts (Hao & Aghakouchak, 2014).
The preparedness and planning for a drought depend on the information about its areal
extent, severity and duration (Mishra & Singh, 2011). This information can be obtained through
drought monitoring that is usually done with the use of drought indices which provide
information to decision makers about drought characteristics. Thus, these indices can be used to
initiate drought action plans. Prediction of droughts is useful for early warning that may reduce
the response time and consequently the impact of a drought.
Palmer (1965) introduced probably the first comprehensive drought index, known as the
Palmer drought severity index (PDSI). Earlier drought indices were drought-definition specific
but PDSI involves precipitation, temperature and soil moisture in a water balance model. PDSI
gained prominence from the 1960s to the 1990s. Since then many other drought indices have
been developed to quantify drought conditions throughout the world.
Keyantash and Dracup (2002) reviewed 14 well-known drought indices which have been used
for assessing the severity of meteorological, hydrological, and agricultural droughts. Barua et al.
(2011) also applied the same set of evaluation criteria except for dimensionality. Moreira et al.
(2008) studied the drought at two regions of Alninjo and Agra in Southern Portugal and concluded
that the drought extended during autumn and only in two months, SPI variants became near to
severe drought class. Buntgen et al. (2010) studied the summer droughts in Germany, and stated
that from a synoptic view, the positioning of an anticyclone system in the middle section of the
atmosphere over the North Sea and a cyclone system over southeast Europe caused summer
droughts. Mishra and Singh (2010) have pointed advantages and limitations of different indices.
He et al. (2011) detected and assessed the spatial characteristics of drought in China using 3-
month SPI and the phenology data of main grain crops. Their results revealed that the areas with
high risk of drought hazard mainly are scattered in the southeast portion and the eastern
agricultural area of Qinghai. Hao and AghaKouchak (2014) developed the multivariate
standardized drought index (MSDI) through parametric and nonparametric copula approaches,
which probabilistically combines the standardized precipitation index (SPI) and the standardized
soil moisture index (SSI) for characterizing droughts.
In Iran, drought conditions have been documented in several studies. For example, Ramazani
(2005) used standardized precipitation index as well as other indices which are used in studying
drought with determination of deviation from long-term precipitation average. He also
introduced numbers, which are dimensionless and are used in annual humid and drought
analyses. Vafakhah and Rajabi (2005) have compared SPI with other indices including
Percentage of normal precipitation (PNPI), Precipitation Deciles (DPI), Precipitation
Abnormality and Z index in Bakhtegan basin and have reported DPI and PNPI indices that have
less standardized deviation and more average. Morid et al. (2006) compared seven indices for
drought monitoring in Tehran province of Iran. Percent of Normal (PN), Rainfall Deciles (RDs),
Statistical Z Score (Z-Score), Standardized Precipitation Index (SPI), China-Z Index (CZI),
Modified China-Z Index (MCZI), and Effective Drought Index (EDI) were used. These indices
are all rainfall-based and are able to quantify both dry and wet cycles. Comparisons showed that
SPI and EDI performed better in detecting the onset of drought, and these were recommended to
the Tehran drought monitoring system. This study is enlightening and currently one of the most
exhaustive comparison studies. Karimpour Reyhan et al. (2009) analyzed drought event and its
emerging regions using Standardized Precipitation Index (SPI) in Markazi desert, with focus on
Semnan province. The results showed that there was drought condition in 17 studied stations.
Also among 44 stations with no drought condition, there was one humid year in 20 cases.
Asefjah et al. (2014) compared drought indices including the standardized precipitation index
(SPI), China-Z index (CZI), modified CZI (MCZI) and Z-Score (Z) for monitoring droughts in
Salt Lake Basin in Iran. They concluded that by considering the advantages and disadvantages
of the mentioned drought predictors in Iran, the CZI and Z-Score could be used as good
meteorological drought predictors.

An Investigation and assessment of meteorological drought in Lake Urmia Basin using … 155
Droughts are considered to be multi-faceted extreme events that can inflict considerable
damage to the human society in many ways. Therefore, proper understanding of the spatial and
temporal characteristics of historical droughts is needed for many water resources and agriculture
planning and management related activities in order to mitigate their harmful effects on
communities. This study is focused specifically on the Lake Urmia Basin (Fig. 1) that is located in
Northwest of Iran, where agricultural activities are concentrated. In this regard, the purpose of this
paper was to compare the performance of several rainfall-based drought indices and assess the
drought conditions using Markov chain and Runs approach for Lake Urmia Basin.
2. Study area The Lake Urmia Basin is located between 37°4′ to 38°17′ latitude and 45°13′ to 46° longitude in
northwest Iran and covers an area of 51,800 km2 which covers 3.15 % of the entire country and
includes 7% of the total surface water in Iran (Fig. 1). The Lake Urmia is the largest lake in the
country and is also the second hyper saline lake (before September 2010) in the world. The lake
basin includes 14 main sub basins that surround the lake with the areas varying from 431 to
11,759 km2. The most important rivers in this basin are Zarrineh Roud, Simineh Roud, and Aji
Chai (Fathian et al., 2015). Climate in the Urmia Lake Basin is continental, affected mainly by
the mountains surrounding the lake. The Lake Urmia is located between two provinces, namely
West-Azararbayjan and East Azarbayjan. The difference between the highest and lowest parts
of the basin is about 2,576 m. The average of rainfall on the basin is about 398 mm. This basin
had the second rank in receiving large annual rainfall among all main watersheds in Iran.
In this study, six weather stations listed in Table 1 are selected to provide a broad range of
coverage in the region in terms of data length, homogeneity, and geographical distribution. For
this study, data was obtained from the database of the Islamic Republic of Iran Meteorological
Organization (IRIMO) and annual precipitation (1966- 2005) were used to compute drought
indices.
Table 1. List of stations with latitude, longitude, altitude and time period in the study area
station Longitude (E) Latitude (N) Altitude(m)
Mahabad 45° 43´ 36° 46´ 1500
Maragheh 46° 16´ 37° 24´ 1477.7
Oroomieh 45° 05´ 37° 32´ 1316
Saghez 46° 16´ 36° 14´ 1552.8
Sarab 47° 32´ 37° 56´ 1682
Tabriz 46° 17´ 38° 05´ 1361
Fig. 1. The DEM and location of meteorological stations in the Lake Urmia Basin
156 Natural Environment Change, Vol. 2, No. 2, Summer & Autumn 2016
3. Materials and Methods
3.1. Drought indices A good number of indices have been suggested and used for detection and monitoring of
meteorological, agricultural, hydrological and socio-economical drought. These indices include
the PDSI (Palmer, 1965), Palmer Hydrological Drought Index (Palmer, 1965), Z-Index (Palmer,
1965), Rainfall Anomaly Index (RAI) (Van Rooy, 1965), the Drought Severity Index (DSI)
(Bryant et al., 1992), SPI (McKee et al., 1993), the Reconnaissance Drought Index (RDI)
(Tsakiris et al., 2007), Standardized Runoff Index (SRI) (Shukla & Wood, 2008), SPEI
(Vicente-Serrano et al., 2010), Rainfall Variability Index (RVI) (Oguntunde et al., 2011),
Multivariate Standardized Drought Index (Hao & AghaKouchak, 2013), and other variants of
some commonly used drought indices. As already indicated, there is no consensus among the
scientific community engaged in drought research on the selection of a drought index.
Generally, the choice of an index is driven by the availability of relevant observed data and ease
of computation and interpretation of the results obtained. Also, to some extent, the choice of the
index is driven by the desired targets of a given project (Mishra & Singh, 2010). In the present
study, four drought indices, namely the PNPI, SIAP, RAI and SPI, are used. All indices
represent the so called meteorological drought.
3.1.1. Percentage of normal precipitation index (PNPI) The percent of normal precipitation is a simple measurement of precipitation for a given
location. Identification of the trend of drought by the percent of normal is very descriptive for a
single region or a single season. This index can be calculated for a variety of time scales (a
single month, a group of months representing a particular season and annual or water year).
Normal precipitation for any given location is considered to be 100%. This index is calculated
as Equation (1).
100iPPN
P (1)
where Pi is actual precipitation and �̅� is normal precipitation. Table 2 shows the PNPI
thresholds by Willeke et al. (1994).
3.1.2. Standardized index annual precipitation (SIAP) The best method for transferring raw data of precipitation to relative amounts is that the
deviation of precipitation from mean shall be divided to standard deviation. In this regard, Khalili
(1991, 1998) provided the standard index precipitation is as followed for studying the process of
drought and wet periods in Iran. This index, in addition to the mean, considers the standard
deviation. The SIAP may be negative (dry) in some stations, and positive (wet) in others, due to
the different pluvial systems in various parts of the country.
The values of Standard Index of Annual Precipitation (SIAP) can be computed by using
Equation (2).
Pi PSIAP
SD
(2)
where Pi is the annual rainfall in ith year; �̅� is the average rainfall; and SD is the standard
deviation observed for rainfall during study period. The SIAP index is without dimensions and
its value ranges between -3 and +3. A smaller value of SIAP indicates a more severe drought
and as it becomes larger, the drought is less severe. Table 2 shows the drought categories in
relation to the SIAP index.
3.1.3. Rainfall anomaly index (RAI) Among different indices of drought monitoring, rainfall anomaly is the most effective and
simple meteorological drought index. This index was introduced by Van Rooy (1965). This
index is based on the calculation of the rainfall in comparison to accidental numbers from -3 to
+3. The only parameter to calculate this index is rainfall. In RAI, the data is sorted from the
largest to the smallest, then by calculating the average of the ten largest and the ten smallest
values of rainfall during the statistical period, the drought is described according to the

An Investigation and assessment of meteorological drought in Lake Urmia Basin using … 157
following relations. In this method RAI > -0.3 shows a normal condition and RAI ≤ -0.3 shows
drought with varying severities (Van Rooy, 1965)
3 : P P
RAI if P Pm P
(3)
3 : P P
RAI if P PX P
(4)
where X is the average of the ten smallest values of rainfall, M is the average of the ten largest
values of rainfall, �̅� is the long-term average rainfall, and P is the value of rainfall. The
categorization of drought based on RAI is given in Table 2.
3.1.4. Standardized precipitation index (SPI) The standardized precipitation index (SPI) was developed for the purpose of defining and
monitoring droughts (McKee et al., 1993). It is based on the long-term monthly precipitation
data at a given period. After fitting a Gamma distribution and transforming it to a normal
distribution by an equal probability transformation, the SPI is computed as the precipitation
anomaly of the transformed data, divided by the standard deviation of the transformed data
(Huang et al., 2014). SPI is calculated using the following equation (McKee et al., 1993):
Pi PSPI
S
(5)
where Pi is the annual rainfall amount, �̅� is the average long-term rainfall, and S is standard
deviation of the rainfall.
Once the SPI is calculated, the intensities of dry and wet events are classified as displayed in
Table 2. The SPI can track dry/wet events on different time-scales, i.e. 1-, 3-, 6-, 12-, and 24-
months, and is flexible with respect to the period chosen (Bordi et al., 2004; Raziei et al., 2009).
In 2009, WMO recommended SPI as the main meteorological drought index that countries
should use to monitor and follow drought conditions (Hayes, 2011). By identifying SPI as an
index for broad use, WMO provided direction for countries trying to establish a level of drought
early warning.
Table 2. Drought categories in PNPI, SIAP, RAI and SPI
SPI RAI SIAP PNPI Category
-0.99 to 0.99 -0.3 to 0.3 -0.25 to 0.25 More than 80
% Near normal
- -1.2 to -0.3 -0.52 to -0.25 70 - 80 % Slight drought -1.00 to -1.49 -2.1 to -1.2 -0.84 to -0.52 55 - 70 % Moderate drought
-1.5 to -1.99 -3 to -2.1 -1.28 to -0.84 40 – 55 % Severe drought
-2.00 and less -3 and less -1.28 and less Less than 40 % Extreme drought
3.2. Probabilistic methods
3.2.1. Runs theory Runs theory is the threshold-level method presented by Yevjevich (1967), which defines droughts
as periods during which the flow is below a certain threshold level. The method is based on the
statistical theory of Runs for analyzing a sequential time series. Yevjevich (1967) proposed this
theory for identifying drought parameters and investigating their statistical properties of the
distributions of water deficits: (a) run-length (drought duration), (b) run-sum (deficit volume) or
magnitude, and (c) severity or intensity. The most basic element for deriving these parameters is
the truncation, or threshold level, which may be a constant or a function of time. A run is defined
as a portion of the time series of a drought variable, Xt, in which all values are either below or
above the selected truncation level of X0, accordingly called either a negative run or a positive run.
The timing of a drought has several different definitions; it can be defined based on the starting
date of the drought, the mean onset of the drought, the termination date of the drought, or the date

158 Natural Environment Change, Vol. 2, No. 2, Summer & Autumn 2016
of minimum drought index value. The drought duration is considered to be the time period
between the initiation and termination of a drought. The theory of runs has received considerable
attention in the study of droughts (Yevjevich, 1967; Panu & Sharma, 2009; Nam et al., 2015).
Categorization of dry periods based on this index is shown in Table 3.
Table 3. The amounts of thresholds based on the Runs theory
Category Symbol Threshold
Very Wet VW 409 and above Wet W 346.5 – 409.5
Normal N 283.5- 346.5 Dry D 220.5- 283.5
Very Dry VD 220.5 and below
3.2.2. Markov chain A Markov chain (Çinlar, 1975) is a stochastic process X, such as at any time t, Xt+1 is
conditionally independent from X0, X1, X2, ..., Xt−1, given Xt; the probability that Xt+1 takes a
particular value j depends on the past only through its most recent value Xt.
The most common form of Markov chain is the first-order Markov chain, where the
transition probabilities controlling the next state of the system depend only on the current state
of the system. This characteristic of first-order Markov chains is known as the Markovian
property, which can be expressed more formally as (Wilks, 2011):
Pr{Xt+1|Xt,Xt−1,Xt−2, … ,X1} = Pr{Xt+1|Xt}
The occurrence of wet or dry day is influenced by the status of previous day. The first-order
Markov chain is used here to describe the occurrence of wet and dry days and its transition
frequency matrix (N) and transition probability matrix (P) is represented as follows.
11 12 13 14 15
21 22 23 24 25
31 32 33 34 35
41 42 43 44 45
51 52 53 54 55
N N N N N
N N N N N
N N N N N N
N N N N N
N N N N N
11 12 13 14 15
21 22 23 24 25
31 32 33 34 35
41 42 43 44 45
51 52 53 54 55
P P P P P
P P P P P
P P P P P P
P P P P P
P P P P P
with P11 + P12 +…+ P15= 1 and etc.
The transition probabilities are estimated using the method of maximum likelihood (Kannan
& Farook, 2015).
0,1
ij
ij
ijj
nP
f
(6)
where nij is the historical frequency of transition from state i to state j.
4. Results and Discussion
4.1. Drought indices The results of drought monitoring in Lake Urmia Basin using Percentage of Normal
Precipitation Index (PNPI) are given in Table 4 and the time series of PNPI values are given in
Figure 2. Table 4 shows that the drought has occurred in Lake Urmia basin with various
severities in 8 years (20%). In 1989 and 2005 slight drought and in 1970, 1973, 1990, 1999,

An Investigation and assessment of meteorological drought in Lake Urmia Basin using … 159
2000, and 2001 moderate drought has happened. It is notable that PNPI has not estimated any
kind of extreme and severe drought that is far from the reality. The most severe drought
occurred in 1999 with the PNPI value of 61.3% and the weakest drought occurred in 2005 with
a PNPI value of 73.4% (Fig. 2).
The results of Standardized index annual precipitation (SIAP) show that in the Lake Urmia
basin 16 droughts periods (40%) have occurred with various severities in 1966-2005. SIAP
show four slight droughts (1983, 1985, 1997 and 2003), four moderate droughts (1971, 1975,
1995 and 1998), three severe droughts (1973, 1989 and 2005) and five extreme droughts (1970,
1990, 1999, 2000 and 2001) in Lake Urmia basin. The most severe drought occurred in 1999
with the SIAP value of -1.57 and the weakest drought occurred in 1985 with a SIAP value of -
0.27. The longest drought duration has occurred for 4 years from 1998 to 2001, that in 1998, the
slight drought and in the other years has happened the extreme drought (Table 5, Fig. 3).
The results of drought monitoring in Lake Urmia Basin using Rainfall Anomaly Index (RAI)
are given in Table 6 and the time series of RAI values are given in Figure 4. The results show
that the drought has occurred in 19 years (47.5%) in Lake Urmia basin. RAI show seven slight
droughts (1966, 1978, 1983, 1985, 1996, 1997 and 2003), four moderate droughts (1971, 1975,
1995 and 1998), three severe droughts (1973, 1989 and 2005) and five extreme droughts (1970,
1990, 1999, 2000 and 2001) in the study area. The most severe drought occurred in 1999 with
the RAI value of -3.84 and the weakest drought occurred in 1978 with a RAI value of -0.36.
Based on RAI, the longest drought duration has occurred for seven years from 1995 to 2001,
that in 1996 and 1997, the slight drought, in 1995 and 1998 the Moderate drought and in 1999,
2000 and 2001 the extreme drought has happened (Table 6 and Fig. 4).
Table 4. Drought monitoring in Lake Urmia basin using PNPI
Frequency (%) Frequency PNPI (%) Category
80 32 More than 80 Near normal
5 2 70-80 Slight drought
15 6 55-70 Moderate drought
0 0 40-55 Severe drought
0 0 Less than 40 Extreme drought
Fig. 2. Time series of PNPI values in Lake Urmia basin
Table 5. Drought monitoring in Lake Urmia basin using SIAP
Frequency (%) Frequency SIAP Category 60 24 -0.25 to 0.25 Near normal 10 4 -0.52 to -0.25 Slight drought 10 4 -0.84 to -0.52 Moderate drought
7.5 3 -1.28 to -0.84 Severe drought
12.5 5 -1.28 and less Extreme drought

160 Natural Environment Change, Vol. 2, No. 2, Summer & Autumn 2016
Table 6. Drought monitoring in Lake Urmia basin using RAI
Frequency (%) Frequency RAI Category 52.5 21 -0.3 to 0.3 Near normal 17.5 7 -1.2 to -0.3 Slight drought 10 4 -2.1 to -1.2 Moderate drought
7.5 3 -3 to -1.2 Severe drought
12.5 5 -3 and less Extreme drought
Fig. 3. Time series of SIAP values in Lake Urmia basin
Fig. 4. Time series of RAI values in Lake Urmia basin
The results from the Standard Precipitation Index (SPI) show that there were 19 dry periods
with different severities in Lake Urmia basin for 1966-2005. Based on SPI, there were seven
slight droughts (1966, 1978, 1983, 1985, 1996, 1997 and 2003), four moderate droughts (1971,
1975, 1995 and 1998), six severe droughts (1970, 1973, 1989, 2000, 2001 and 2005) and two
extreme droughts (1990 and 1999). The most severe drought occurred in 2001 with the SPI
value of -1.97 and the weakest drought occurred in 1978 with a SPI value of -0.57. As RAI, the
longest drought duration has occurred for seven years from 1995 to 2001, with the difference
that the extreme drought can be seen only in 1999 and in 2000 and 2000 the severe drought has
occurred (Table 7 and Fig. 5).
An Investigation and assessment of meteorological drought in Lake Urmia Basin using … 161
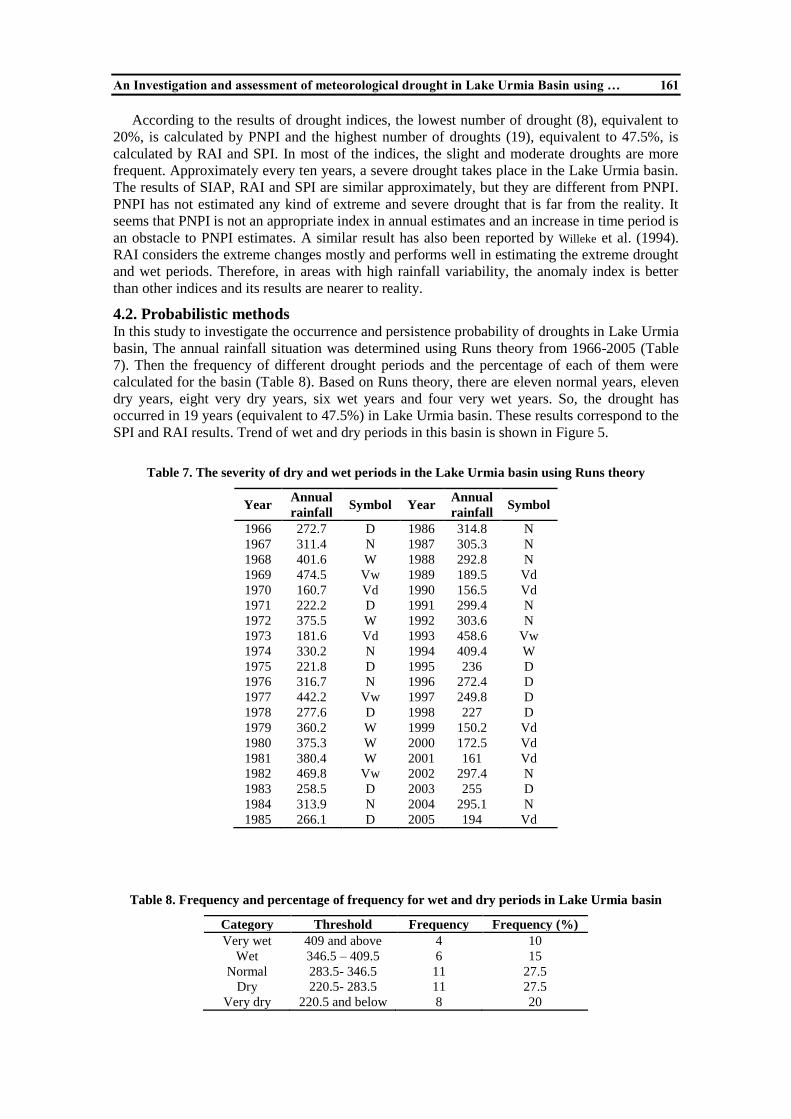
According to the results of drought indices, the lowest number of drought (8), equivalent to
20%, is calculated by PNPI and the highest number of droughts (19), equivalent to 47.5%, is
calculated by RAI and SPI. In most of the indices, the slight and moderate droughts are more
frequent. Approximately every ten years, a severe drought takes place in the Lake Urmia basin.
The results of SIAP, RAI and SPI are similar approximately, but they are different from PNPI.
PNPI has not estimated any kind of extreme and severe drought that is far from the reality. It
seems that PNPI is not an appropriate index in annual estimates and an increase in time period is
an obstacle to PNPI estimates. A similar result has also been reported by Willeke et al. (1994).
RAI considers the extreme changes mostly and performs well in estimating the extreme drought
and wet periods. Therefore, in areas with high rainfall variability, the anomaly index is better
than other indices and its results are nearer to reality.
4.2. Probabilistic methods In this study to investigate the occurrence and persistence probability of droughts in Lake Urmia
basin, The annual rainfall situation was determined using Runs theory from 1966-2005 (Table
7). Then the frequency of different drought periods and the percentage of each of them were
calculated for the basin (Table 8). Based on Runs theory, there are eleven normal years, eleven
dry years, eight very dry years, six wet years and four very wet years. So, the drought has
occurred in 19 years (equivalent to 47.5%) in Lake Urmia basin. These results correspond to the
SPI and RAI results. Trend of wet and dry periods in this basin is shown in Figure 5.
Table 7. The severity of dry and wet periods in the Lake Urmia basin using Runs theory
Year Annual
rainfall Symbol Year
Annual
rainfall Symbol
1966 272.7 D 1986 314.8 N
1967 311.4 N 1987 305.3 N
1968 401.6 W 1988 292.8 N
1969 474.5 Vw 1989 189.5 Vd
1970 160.7 Vd 1990 156.5 Vd
1971 222.2 D 1991 299.4 N
1972 375.5 W 1992 303.6 N
1973 181.6 Vd 1993 458.6 Vw
1974 330.2 N 1994 409.4 W
1975 221.8 D 1995 236 D
1976 316.7 N 1996 272.4 D
1977 442.2 Vw 1997 249.8 D
1978 277.6 D 1998 227 D
1979 360.2 W 1999 150.2 Vd
1980 375.3 W 2000 172.5 Vd
1981 380.4 W 2001 161 Vd
1982 469.8 Vw 2002 297.4 N
1983 258.5 D 2003 255 D
1984 313.9 N 2004 295.1 N
1985 266.1 D 2005 194 Vd
Table 8. Frequency and percentage of frequency for wet and dry periods in Lake Urmia basin
Category Threshold Frequency Frequency (%)
Very wet 409 and above 4 10
Wet 346.5 – 409.5 6 15
Normal 283.5- 346.5 11 27.5
Dry 220.5- 283.5 11 27.5
Very dry 220.5 and below 8 20

162 Natural Environment Change, Vol. 2, No. 2, Summer & Autumn 2016
Fig. 5. Trend of wet and dry periods in Lake Urmia basin Using Runs theory
Table 9. Frequency distribution for first order transition counts
VD D N W VW
VD 3 1 3 0 0
D 1 3 5 2 0
N 2 3 3 0 3
W 1 1 0 2 2
VW 1 2 0 1 0
Table 10. Annual transition probability matrix
VD D N W VW
VD 0.43 0.14 0.43 0.00 0.00
D 0.09 0.273 0.455 0.182 0.00
N 0.182 0.273 0.273 0.09 0.182
W 0.167 0.167 0.00 0.333 0.333
VW 0.25 0.50 0.00 0.25 0.00
Table 11. Annual equilibrium probability
VD D N W VW
0.23 0.27 0.23 0.17 0.1
For Markov chain analysis, we assume that the rainfall in this year depends on the rainfall in the
previous year. Therefore, Based on five categories of Runs theory (very dry, dry, normal, wet, and
very wet), the frequency matrix is formed during 40 years (1996-2005) in Lake Urmia basin. The
transition frequency from dry state to normal state is slightly larger than those from other states. The
transition probability matrix represents the weather model in which the trend of the following year is
estimated. Transition probability matrix of wet- dry spells is created accordingly based on maximum
likelihood method (Table 10).
To find the equilibrium probabilities we compute the n-step transition probabilities, which
mean that for example the probability of dry periods occurrence regardless of the weather
conditions of the previous year is 0.27 for Lake Urmia Basin. The equilibrium probabilities of
very dry, normal, wet and very wet periods are 0.23, 0.23, 0.17 and 0.1, respectively.
5. Conclusions This study focused on the application of four known drought indices (PNPI, SIAP, RAI ans SPI)
for drought detection and monitoring in Lake Urmia Basin in Iran for 40 years (1966-2005). In
most of the indices, the slight and moderate droughts are more frequent. Approximately every ten
years, a severe drought takes place in the Lake Urmia basin. The results of SIAP, RAI and SPI are
similar approximately, but they are different from PNPI. PNPI has not estimated any kind of
extreme and severe drought that is far from the reality. It seems that PNPI is not an appropriate
An Investigation and assessment of meteorological drought in Lake Urmia Basin using … 163
index in annual estimates and an increase in time period is an obstacle to PNPI estimates. RAI
considers the extreme changes mostly and performs well in estimating the extreme drought and
wet periods. Therefore, in areas with high rainfall variability, the anomaly index is better than
other indices and its results are nearer to reality. The SPI method gives best result without other
climatic parameters as it uses only precipitation data and gives accurate result.
Two probability approaches including Runs theory and Markov chain model, used to
estimate the probability of wet and dry periods in Lake Urmia Basin. The frequency matrix is
formed and the transition probability matrix of wet- dry spells is created accordingly based on
maximum likelihood method. The equilibrium probability is calculated based on succeed power
on probability matrix. The equilibrium probability of very dry, dry, normal, wet and very wet
periods is obtained as 0.23, 0.27, 0.23, 0.17 and 0.1, respectively.
References 1. Asefjaha, B., Faniana, F., Feizia, Z., Abolhasania, A., Paktinatb, H., Naghiloua, M., Molaei Atanic,
A., Asadollahia, M., Babakhania, M., Kouroshni, A., Salehia, F. (2014). Meteorological drought
monitoring using several drought indices (case study: Salt Lake Basin in Iran). Desert, 19(2): 155-165.
2. Barua, S., Ng, A.W.M., Perera, B.J.C. (2011). Comparative evaluation of drought indexes: case study
on the Yarra River catchment in Australia. J. Water Resour. Plann. Manage. ASCE, 37: 215-226.
3. Bordi, I., Fraedrich, K., Gerstengarbe, F.W., Werner, P.C., Sutera, A. (2004). Potential predictability
of dry and wet periods: sicily and Elbe-Basin (Germany). Theoretical and Applied Climatology 77,
125e138.
4. Bryant S.J., Arnell N.W., Law F.M. (1992). The long-term context for the current hydrological
drought. Proceedings of IWEM Conference on the Management of Scarce Water Resources, Scotland;
13–14 October.
5. Buntgen, UV., Trouet, D., Frank, H.H., Leuschnr, D., Friedrichs (2010). Tree -ring indices of German
summer drought over the last millennium . Quaternary Science Reviews, 29: 1005-1016.
6. Çinlar, E. (1975). Introduction to stochastic processes Prentice-Hall. Englewood Cliffs, New Jersey
(420p).
7. Fathian, F., Morid, S., Kahya, E. (2015). Identification of trends in hydrological and climatic variables
in Urmia Lake basin, Iran. Theoretical and Applied Climatology, 119(3-4): 443-464.
8. Hao, Z., AghaKouchak, A. (2014). A nonparametric multivariate multi-index drought monitoring
framework. J. Hydrometeorol, 15(1): 89-101.
9. Hao, Z., AghaKouchak, A. (2013). Multivariate standardized drought index: a parametric multi-index
model. Adv. Water Resour. 57: 12-18.
10. Hayes, M., Svoboda, M., Wall, N., Widhalm, M. (2011). The Lincoln Declaration on Drought Indices:
universal meteorological drought index recommended. Bulletin of the American Meteorological
Society, 92(4): 485-488.
11. He, B., Lü, A.F., Wu, J.J., Zhao, L., Liu, M. (2011). Drought hazard assessment and spatial
characteristics analysis in China. J. Geog. Sci., 21(2): 235-249.
12. Huang, J., Sun, S.L., Xue, Y., Li, J.J., Zhang, J.C. (2014). Spatial and temporal variability of
precipitation and dryness/wetness during 1961e2008 in Sichuan province, west China. Water
Resources Management 28: 1655-1670.
13. IPCC (2012). Managing the risks of extreme events and disasters to advance climate change
adaptation. In: Field, C.B., V. Barros, T.F., Stocker, D., Qin, D.J., Dokken, K.L., Ebi, M.D.,
Mastrandrea, K.J., Mach, G.-K. Plattner, Allen, S.K., Tignor, M., Midgley, P.M. (Eds.), A special
report of working groups I and II of the Intergovernmental Panel on Climate Change. Cambridge
University Press, Cambridge, UK, and New York, NY, USA.
14. IPCC (2013). Climate change 2013: the physical science basis. In: Stocker, T.F., Qin, D., Plattner, M.,
Tignor, S.K., Allen, J., Boschung, A., Nauels, Y., Bex, V., Midgley, P.M. (Eds.), Working group I
contribution to the fifth assessment report of the Intergovernmental Panel on Climate Change.
Cambridge University Press, Cambridge, United Kingdom and New York, NY, USA.
15. Kannan, S.K., Farook, J.A. (2015). Stochastic Simulation of Precipitation Using Markov Chain-Mixed
Exponential Model. Applied Mathematical Sciences, 65(9): 3205-3212.
16. Karimpour Reyhan, M., Esmaeilpour, Y., Malekian, A.R.M.E.N., Mashhadi, N., Kamali, N. (2009).
Spatio-Temporal Analysis of Drought Vulnerability using the Standardized Precipitation Index (Case
study: Semnan Province, Iran). Desert, 14(2): 133-140.
17. Keyantash, J., Dracup, J.A. (2002). The quantification of drought: an evaluation of drought indices.
Bull. Am. Meteorol. Soc., 83: 1167-1180.
164 Natural Environment Change, Vol. 2, No. 2, Summer & Autumn 2016
18. Khalili, A. (1998). Publication of the country comprehensive water plan-Making timely. Ministry of
Energy. Jamab, Tehran: 1-5 [In Persian].
19. Khalili, A. (1991). Meteorological basin report of comprehensive water plan. Ministry of Energy,
Jamab, Tehran [In Persian].
20. McKee, T.B., Doesken, N.J., Kleist, J. (1993). The relationship of drought frequency and duration to
time steps. preprints. In: 8th Conference on Applied Climatology, Anaheim, CA, 17e, 22 January:
179-184.
21. Mishra, A.K., Singh, V.P. (2011). Drought modeling – a review. J. Hydrol,. 403: 157-175.
22. Mishra, A.K., Singh, V.P. (2010). A review of drought concepts. J. Hydrol., 391: 202-216.
23. Moreira, E.E., Coelho, C.A., Paulo, A.A., Pereira, L.S., Mexia, J.T. (2008). SPI-based drought
category prediction using log linear models, J. Hydrology, 345: 116-130.
24. Morid, S., Smakhtin, V., Moghaddasi, M. (2006). Comparison of seven meteorological indices for
drought monitoring in Iran. Int. J. Climatol., 26: 971-985.
25. Nam, W.H., Hayes, M.J., Svoboda, M.D., Tadesse, T., Wilhite, D.A. (2015). Drought hazard assessment
in the context of climate change for South Korea. Agricultural Water Management, 160: 106-117.
26. Oguntunde, P.G., Abiodun, J.B., Gunnar, L.G. (2011). Rainfall trends in Nigeria, 1901–2000.
27. Palmer, W.C. (1965). Meteorological Drought. Research Paper No. 45. Weather Bureau, Washington,
DC.
28. Panu, U.S., Sharma, T.C. (2009). Analysis of annual hydrological droughts: the case of northwest
Ontario, Canada. Hydrological Sciences Journal, 54(1): 29-42.
29. Ramazani Gourabi, B. (2005). Studying drought event using precipitation normal percentage index in
Gilan central regions, desert, 10(2).
30. Raziei, T., Saghafian, B., Paulo, A.A., Pereira, L.S., Bordi, I. (2009). Spatial patterns and temporal
variability of drought in western Iran. Water Resources Management, 23(3): 439-455.
31. Shukla, S., Wood, A.W. (2008). Use of a standardized runoff index for characterizing hydrologic
drought. Geophys. Res. Lett. 35, L02405.
32. Tallaksen, L.M., van Lanen, H.A.J. (2004). Hydrological Drought: Processes and estimation methods for
stream flow and groundwater. Developments in Water Science, Vol. 48. Elsevier, Amsterdam. p. 579.
33. Tsakiris, G., Pangalou, D., Vangelis, H. (2007). Regional drought assessment based on the
reconnaissance drought Index (RDI). Water Resour. Manag. 21: 821-833.
34. Vafakhah, M., Rajabi, M. (2005). Climatology drought index effectiveness for evaluation of
watershed area droughts of Bakhtegan lagoon, Tashak and Maharlou, Desert, 10(2).
35. Van Rooy, M.P. (1965). A rainfall anomaly index independent of time and space. Notos 14, 43.
36. Vicente-Serrano, S.M., Beguera, S., Lopez-Moreno, J.I. (2010). A multi-scalar drought index
sensitive to global warming: the standardized precipitation evapotranspiration index. J. Clim., 23(7):
1696-1718.
37. Wilks, D.S. (2011). Statistical methods in the atmospheric sciences, Vol. 100, Academic press, USA.
38. Willeke, G., Hosking, J.R M., Wallis, J.R., Guttman, N.B. (1994). The National Drought Atlass,
Institute for water resources report 94- NDS-4, U. S Army Corps of Engineers: 582-587.
39. Yevjevich, V. (1967). An objective approach to definition and investigations of continental hydrologic
droughts. In: Hydrology Paper No. 23. Colorado State University, Fort Collins, USA.