Native CDFI Financial and Lending Performance Report
52
OWEESTA Native CDFI Financial and Lending Performance Report
Transcript of Native CDFI Financial and Lending Performance Report

OWEESTA
Native CDFI Financial and Lending
Performance Report
2 Side-by-Side Report
AcknowledgementsThis snapshot was written by Alexandra Shaughnessy and Florence Sterling Ludka from Oweesta Corpo-ration. We believe in widely sharing best practices, key findings and successful or promising models with practitioners in Indian Country, government entities (federal, state, local and tribal), mainstream philanthro-py, and the public at large. For more information, or to order additional copies of this report, please email [email protected].
Oweesta would like to thank Northwest Area Foundation for funding this report. Northwest Area Foundation has been a tireless supporter of the economic, social, and cultural prosperity of Indian Country.
Oweesta Corporation 3
4 Side-by-Side Report
About CDFIs and Oweesta CorporationA Community Development Financial Institution (CDFI) is a specialized financial institution dedicated to ser-vicing low-income, low-wealth, and other disadvantaged peoples in communities underserved by tradition-al financial institutions. CDFIs provide affordable loan products and development services (financial educa-tion, entrepreneurship training, homeownership counseling, etc.) not easily accessible in rural and persistent poverty communities. CDFIs can be structured in many ways and include for-profit and nonprofit entities. They include regulated institutions like community development banks and community development credit unions, and unregulated institutions such as loan funds and venture capital funds. A Native CDFI is a CDFI providing at least half of its financing products and development services to Native peoples. Though there are many kinds of Native CDFIs, this report focuses on Native CDFI revolving loan funds (RLFs).
Oweesta Corporation (Oweesta) is a national nonprofit organization located in Longmont, Colorado. Owees-ta is a Native CDFI intermediary offering financial products and development services exclusively to Native CDFIs and Native communities. Specifically, Oweesta provides training, technical assistance, investments, and research to help Native communities develop an integrated range of asset-building products and ser-vices. To learn more about Oweesta, visit www.oweesta.org.
Oweesta’s mission is to provide opportunities for Native people to develop financial assets and create wealth by assisting in the establishment of strong, permanent institutions and programs contributing to economic independence and strengthening sovereignty for all Native communities. Embedded in our strategy is the belief that when armed with the appropriate resources, Native peoples hold the capacity and ingenuity to ensure the sustainable, economic, spiritual, and cultural well-being of their communities.
Overview of Industry SnapshotOweesta Corporation will be producing the Native CDFI Financial and Lending Performance Report annually. It is based on the analysis of source data collected from reporting required by participants in Oweesta’s loan portfolio. Oweesta collects this data to evaluate the overall effectiveness of our lending activities in meeting our objectives and to measure the financial, economic and social impacts on communities, target markets and underserved Native populations.
This industry snapshot is a reference guide for Native CDFIs and all stakeholders in the Native CDFI industry. In this report, we focused on 28 Native CDFI revolving loan funds and one Native CDFI banking institution. The data presented is from calendar year 2020.

Oweesta Corporation 5
Geographic AreaThe 28 Native CDFI revolving loan funds and one Native CDFI banking institution represented in this report are located across the lower 48 Unites States, Alaska and Hawaii. Most of these loan funds serve target mar-kets consisting of small rural Native communities located in persistent poverty zones. The above map show-ing locations of Native CDFIs and the communities they serve indicates Native people are clustered in cer-tain regions, counties, and neighborhoods rather than spread evenly across the Nation. Native Americans in these persistently poor areas face many barriers including poor housing and health conditions, higher crime and school dropout rates, and employment dislocations.
6 Side-by-Side Report
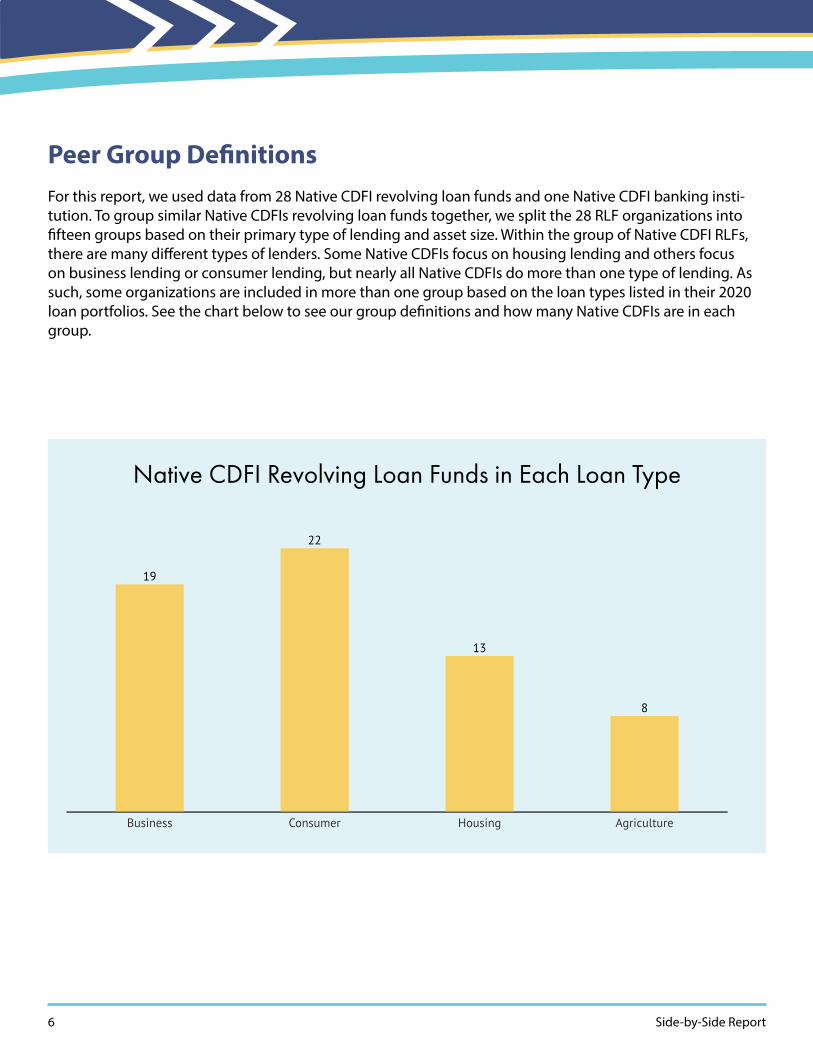
Peer Group DefinitionsFor this report, we used data from 28 Native CDFI revolving loan funds and one Native CDFI banking insti-tution. To group similar Native CDFIs revolving loan funds together, we split the 28 RLF organizations into fifteen groups based on their primary type of lending and asset size. Within the group of Native CDFI RLFs, there are many different types of lenders. Some Native CDFIs focus on housing lending and others focus on business lending or consumer lending, but nearly all Native CDFIs do more than one type of lending. As such, some organizations are included in more than one group based on the loan types listed in their 2020 loan portfolios. See the chart below to see our group definitions and how many Native CDFIs are in each group.
Business Consumer Housing Agriculture
19
22
13
8
Made with
Native CDFI Revolving Loan Funds in Each Loan Type

Oweesta Corporation 7
Native CDFI Revolving Loan Funds in Each Category
Business more than $10M in assets
Business $3M to $9.99M in assets
Business less than $3M in assets
Consumer more than $10M in assets
Consumer $3M to $9.99M in assets
Consumer less than $3M in assets
Housing more than $10M in assets
Housing less than $10M in assets
Agriculture more than $5M in assets
Agriculture less than $5M in assets
6
8
5
5
9
8
6
7
5
3
Total number of employees over time
Made with

8 Side-by-Side Report
Ratio Definitions
Net Asset RatioNet Assets / Total Assets. This ratio shows the amount of equity anOrganization has as a percentage of its total assets. A general guideline is that a financially healthy CDFI RLF has a net asset ratio of at least 20%.
Net Asset without Donor Restrictions Ratio
Net Assets w/o Donor Restrictions / Total Assets. This ratio shows what percentage of an organization’s total assets are composed of unrestricted net assets.
Leverage RatioTotal Debt / Total Net Assets. This ratio shows the rate at which anorganization is leveraging its net assets. A ratio of 100% would show that for every $1 in net assets, an organization is leveraging $1 in debt.
90+ Delinquency Ratio Total $ Amount of Loans 90+ Delinquent / Portfolio Balance. This ratio shows the per-centage of the portfolio that is 90 days or more delinquent.
Charge-Off Ratio Total Loans Charged Off / Portfolio Balance. This ratio shows thepercentage of the year end portfolio balance that was charged off during the year.
Loan Loss Reserve Ratio This ratio shows the percentage by which the value of the portfolio has been re-duced to account for expected loan losses.
Self-Sufficiency Ratio Earned Revenue / Total Expenses. This ratio shows the percentage of operating ex-penses covered by earned revenue.
Earned Revenue
The average amount, in dollars, of earned revenue generated over the year. Earned revenue is defined as income generated from operations. Typically earned revenue is generated from loan interest and fees or a contract to provide development ser-vices.
Net Income Total Income – Total Expenses. The difference between income and expenses.
# Loans Closed to FTE # Loans Closed / # FTE. This ratio shows how many loans were closed per FTE1 over the year.
$ Loans Closed to FTE $ Loans Closed / # FTE. This ratio shows how many dollars inloans were closed per FTE over the year.
Operating Expenses to # Loans Closed
Operating Expenses / # Loans Closed. This ratio shows how many dollars, on average, it costs the organization to close a loan.
Operating Liquidity Operating Cash & Cash Equivalents / (Total Expenses / 12). This ratio shows how many months of operating cash the organization had at calendar year-end 2020.
1. FTE (Full-time equivalent) employee.
Oweesta Corporation 9
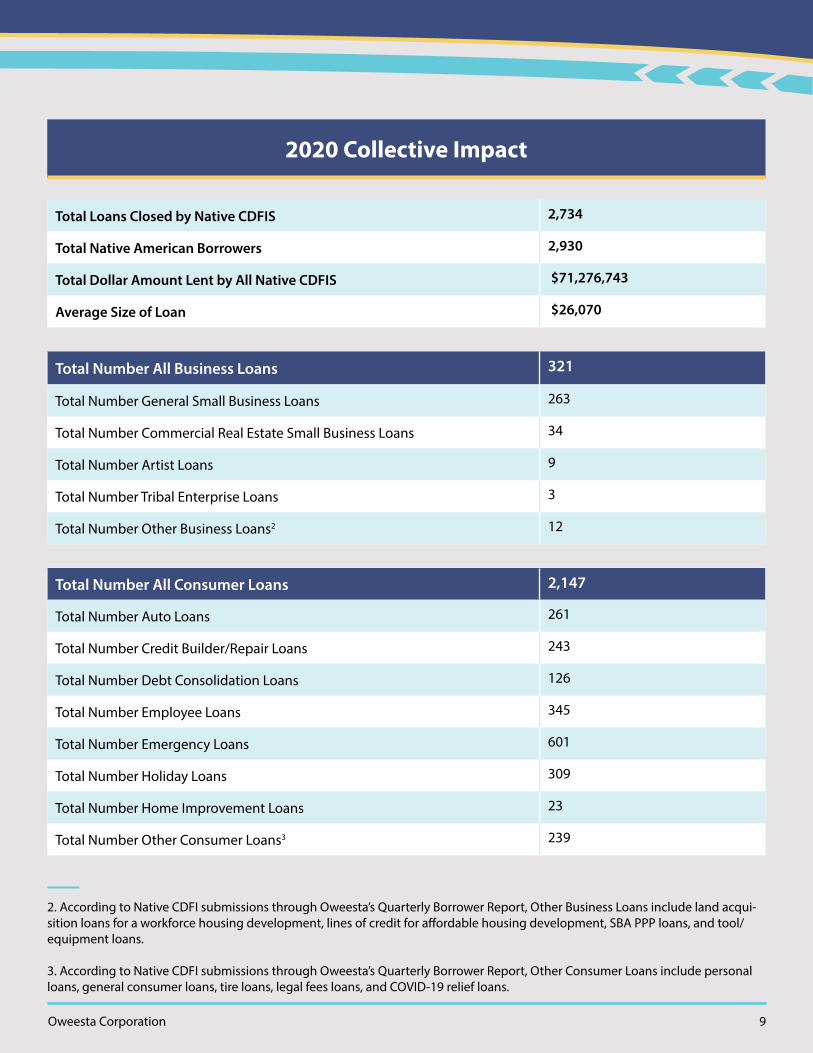
2020 Collective Impact
Total Loans Closed by Native CDFIS 2,734
Total Native American Borrowers 2,930
Total Dollar Amount Lent by All Native CDFIS $71,276,743
Average Size of Loan $26,070
Total Number All Business Loans 321
Total Number General Small Business Loans 263
Total Number Commercial Real Estate Small Business Loans 34
Total Number Artist Loans 9
Total Number Tribal Enterprise Loans 3
Total Number Other Business Loans2 12
Total Number All Consumer Loans 2,147
Total Number Auto Loans 261
Total Number Credit Builder/Repair Loans 243
Total Number Debt Consolidation Loans 126
Total Number Employee Loans 345
Total Number Emergency Loans 601
Total Number Holiday Loans 309
Total Number Home Improvement Loans 23
Total Number Other Consumer Loans3 239
2. According to Native CDFI submissions through Oweesta’s Quarterly Borrower Report, Other Business Loans include land acqui-sition loans for a workforce housing development, lines of credit for affordable housing development, SBA PPP loans, and tool/equipment loans.
3. According to Native CDFI submissions through Oweesta’s Quarterly Borrower Report, Other Consumer Loans include personal loans, general consumer loans, tire loans, legal fees loans, and COVID-19 relief loans.

10 Side-by-Side Report
2020 Collective Impact
Total Number All Housing Loans 174
Total Number Single-Family Home Purchase Loans 75
Total Number Single-Family New Construction Loans 16
Total Number Single-Family Refinance Loans 1
Total Number Single-Family Rehab Loans 12
Total Number Single-Family Other Loans4 5
Total Number Multi-Family Home Purchase Loans 1
Total Number Multi-Family New Construction Loans 1
Total Number Multi-Family Refinance Loans 1
Total Number Closing Cost Assistance Loans 28
Total Number Down Payment Assistance Loans 28
Total Number Other Assistance Loans5 4
Total Number Agriculture Loans 92
Total Amount All Business Loans $38,211,136
Total Amount General Small Business Loans $26,247,416
Total Amount Commercial Real Estate Small Business Loans $11,112,261
Total Amount Artist Loans $301,793
Total Amount Tribal Enterprise Loans $275,000
Total Amount Other Business Loans $274,665
4. According to Native CDFI submissions through Oweesta’s Quarterly Borrower Report, Single-Family Other Loans include manu-factured home loans, builder loans, and other rehabilitation loans.
5. According to Native CDFI submissions through Oweesta’s Quarterly Borrower Report, Other Assistance Loans include mortgage reinstatement loans, mortgage packaging loans, land clearing loans, and building loans.

Oweesta Corporation 11
2020 Collective Impact
Total Amount All Consumer Loans $9,468,430
Total Amount Auto Loans $3,915,417
Total Amount Credit Builder/Repair Loans $810,272
Total Amount Debt Consolidation Loans $1,361,461
Total Amount Employee Loans $608,920
Total Amount Emergency Loans $1,123,385
Total Amount Holiday Loans $176,370
Total Amount Home Improvement Loans $183,964
Total Amount Other Consumer Loans $1,288,642
Total Amount All Housing Loans $19,509,440
Total Amount Single-Family Home Purchase Loans $13,435,612
Total Amount Single-Family New Construction Loans $2,280,172
Total Amount Single-Family Refinance Loans $139,750
Total Amount Single-Family Rehab Loans $181,619
Total Amount Single-Family Other Loans $242,811
Total Amount Multi-Family Home Purchase Loans $30,000
Total Amount Multi-Family New Construction Loans $216,000
Total Amount Multi-Family Refinance Loans $60,000
Total Amount Closing Cost Assistance Loans $1,205,594
Total Amount Down Payment Assistance Loans $1,205,594
Total Amount Other Assistance Loans $421,087
Total Amount Agriculture Loans $4,087,738
12 Side-by-Side Report
Revolving Loan Fund Breakdown by Type of Lending and Asset Size
There are fifteen sections below. The first section shows figures for all 28 Native CDFI RLFs together. These figures represent an average Native CDFI Loan Fund without controlling for asset size or type of lending. All figures are based on financial statements and required reporting for each organization as of calendar year-end 2020.

Oweesta Corporation 13
All Loan Types and Native CDFIs Twenty-eight organizations are included in the data below.
Characteristics Average6 Low High
Age of Organization (Years) 14 1 34
Number of FTE 5 1 22
Capital Structure
Asset Size $8,061,005 $105,207 $48,892,121
Net Asset Ratio 65.6% 23.8% 100.3%
Net Asset w/o Donor Restric-tions Ratio
46.2% (22.8)%7 100.3%
Leverage Ratio 44.0% 0.0% 90.6%
Portfolio
Portfolio Size $4,393,042 $11,520 $32,700,977
90+ Days Delinquency Ratio 3.9% 0.0% 28.9%
Charge-Off Ratio 1.0% 0.0% 7.9%
Loan Loss Reserve Ratio 5.6% 0.0% 27.7%
6. The low and high outlier was removed from the Self-Sufficiency ratio and Operating Liquidity averages to provide a more accu-rate figure. The outlier was skewing the averages significantly to the point of inaccuracy.
7. The low figure is negative because two of the Native CDFI RLFs included had negative net assets without donor restrictions at year-end.

14 Side-by-Side Report
Characteristics Average Low High
Earnings
Net Income $916,735 $(897,537) $4,616,654
Earned Revenue $419,472 $378 $1,867,932
Operating Expenses $1,613,936 $25 $14,544,964
Self-Sufficiency Ratio 42.3% 0.9% 1512.0%
Operating Liquidity (Months)
22.0 0.9 42,470
Fiscal Year 2020 Lending
Number of Loans Closed 131 2 2,072
Amount of Loans Closed $1,397,438 $12,109 $11,515,972
Efficiency
# Loans Closed / FTE 23.3 - -
$ Loans Closed / FTE $271,976 - -
Operating Expenses / # Loans Closed
$92,906 - -
Operating Expenses / $ Loans Closed
$5 - -
Oweesta Corporation 15
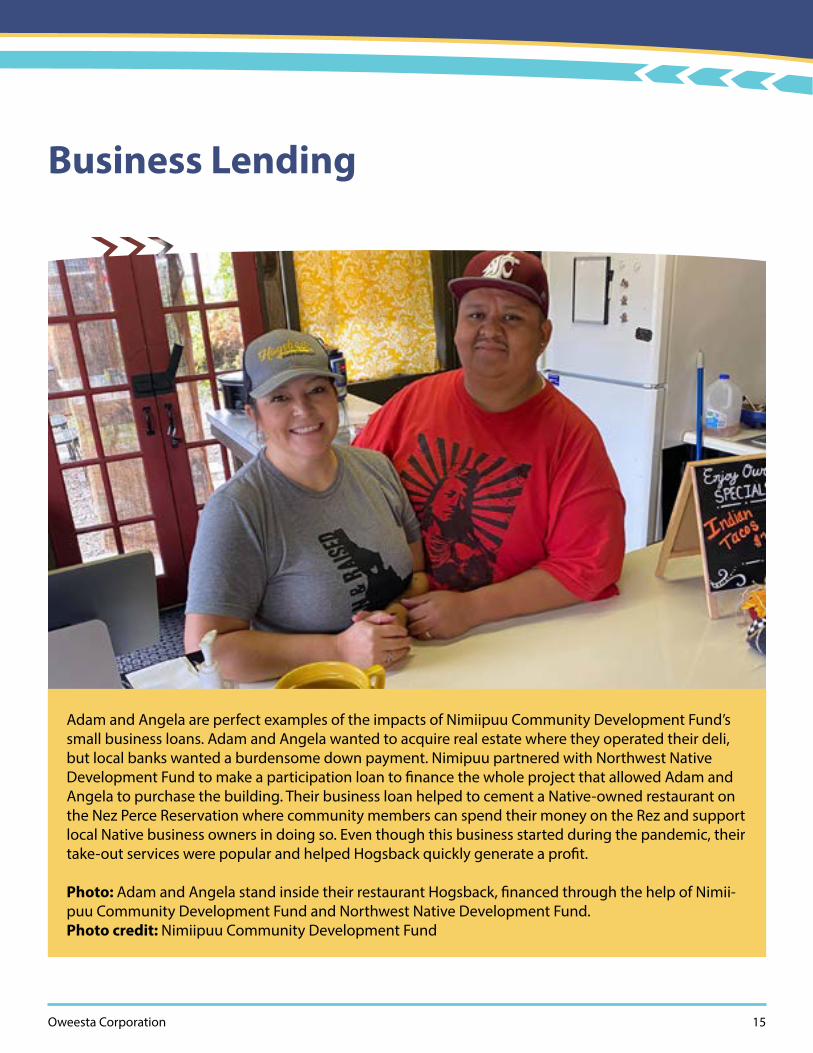
Adam and Angela are perfect examples of the impacts of Nimiipuu Community Development Fund’s small business loans. Adam and Angela wanted to acquire real estate where they operated their deli, but local banks wanted a burdensome down payment. Nimipuu partnered with Northwest Native Development Fund to make a participation loan to finance the whole project that allowed Adam and Angela to purchase the building. Their business loan helped to cement a Native-owned restaurant on the Nez Perce Reservation where community members can spend their money on the Rez and support local Native business owners in doing so. Even though this business started during the pandemic, their take-out services were popular and helped Hogsback quickly generate a profit.
Photo: Adam and Angela stand inside their restaurant Hogsback, financed through the help of Nimii-puu Community Development Fund and Northwest Native Development Fund. Photo credit: Nimiipuu Community Development Fund
Business Lending

16 Side-by-Side Report
All Business Lenders Nineteen organizations are included in the data below.
Characteristics Average8 Low High
Age of Organization (Years) 15 1 34
Number of FTE 6 1 22
Capital Structure
Asset Size $9,596,221 $105,207 $48,892,121
Net Asset Ratio 64.4% 45.9% 85.1%
Net Asset w/o Donor Restrictions Ratio
43.7% (14.2)%9 85.1%
Leverage Ratio 49.8% 15.1% 90.6%
Portfolio
Portfolio Size $5,136,349 $11,520 $32,700,977
90+ Days Delinquency Ratio 4.6% 0.0% 28.9%
Charge-Off Ratio 0.6% 0.0% 3.0%
Loan Loss Reserve Ratio 4.9% 0.0% 11.5%
8. The low and high outlier was removed from the Self-Sufficiency ratio and Operating Liquidity averages to provide a more accu-rate figure. The high outlier was removed from the Operating Expenses/$ Loans Closed average to provide a more accurate figure. The outliers were skewing the averages significantly to the point of inaccuracy.
9. The low figure is negative because one of the Native CDFI RLFs included had negative net assets without donor restrictions at year-end.

Oweesta Corporation 17
Characteristics Average Low High
Earnings
Net Income $1,140,855 $(60,448) $4,616,654
Earned Revenue $448,859 $378 $1,867,932
Operating Expenses $1,976,348 $25 $14,544,964
Self-Sufficiency Ratio 38.8% 2.2% 1512.0%
Operating Liquidity (Months)
24.8 0.9 42,470
Fiscal Year 2020 Lending
Fiscal Year 2020 Lending 64 2 395
$ Loans Closed / FTE $1,663,933 $18 $11,515,972
Efficiency
# Loans Closed / FTE 12.2 - -
$ Loans Closed / FTE $293,562 - -
Operating Expenses / # Loans Closed
$110,475 - -
Operating Expenses / $ Loans Closed
$1,830 - -

18 Side-by-Side Report
Business Lenders with Less than $3 Million in Assets Five organizations are included in the data below.
Characteristics Average10 Low High
Age of Organization (Years) 8.4 1 14
Number of FTE 3.4 1 8
Capital Structure
Asset Size $986,994 $105,207 $2,275,031
Net Asset Ratio 59.7% 47.9% 85.1%
Net Asset w/o Donor Restrictions Ratio
46.4% (14.2)%11 85.1%
Leverage Ratio 53.0% 15.1% 90.6%
Portfolio
Portfolio Size $239,251 $11,520 $709,292
90+ Days Delinquency Ratio 6.2% 0.0% 28.9%
Charge-Off Ratio 0.0% 0.0% 0.2%
Loan Loss Reserve Ratio 0.9% 0.0% 3.0%
10. The low and high outlier was removed from the Self-Sufficiency ratio and Operating Liquidity averages to provide a more accu-rate figure. The outlier was skewing the averages significantly to the point of inaccuracy.
11. The low figure is negative because one of the Native CDFI RLFs included had negative net assets without donor restrictions at year-end.
Oweesta Corporation 19
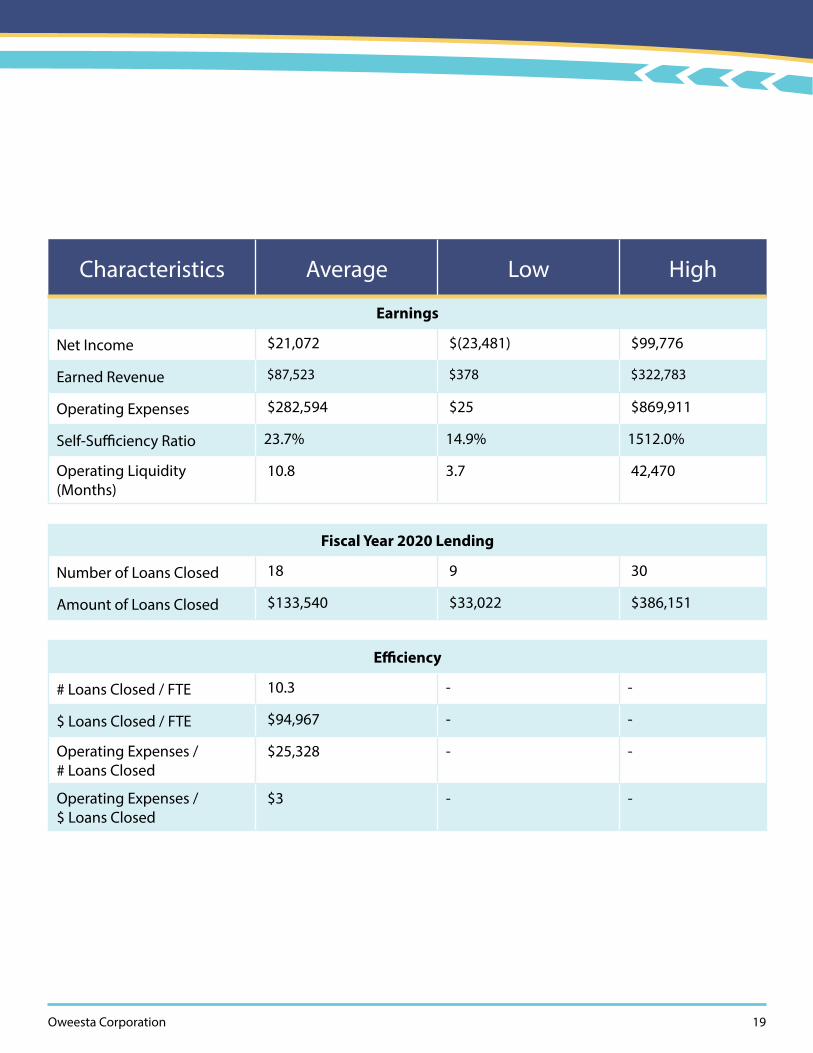
Characteristics Average Low High
Earnings
Net Income $21,072 $(23,481) $99,776
Earned Revenue $87,523 $378 $322,783
Operating Expenses $282,594 $25 $869,911
Self-Sufficiency Ratio 23.7% 14.9% 1512.0%
Operating Liquidity (Months)
10.8 3.7 42,470
Fiscal Year 2020 Lending
Number of Loans Closed 18 9 30
Amount of Loans Closed $133,540 $33,022 $386,151
Efficiency
# Loans Closed / FTE 10.3 - -
$ Loans Closed / FTE $94,967 - -
Operating Expenses / # Loans Closed
$25,328 - -
Operating Expenses / $ Loans Closed
$3 - -

20 Side-by-Side Report
Business Lenders with Between $3 Million and $9.99 Million in AssetsEight organizations are included in the data below.
Characteristics Average Low High
Age of Organization (Years) 14.5 9 19
Number of FTE 7 2 22
Capital Structure
Asset Size $5,392,663 $3,211,573 $6,659,983
Net Asset Ratio 68.8% 53.8% 83.0%
Net Asset w/o Donor Restrictions Ratio
41.3% 10.3% 72.7%
Leverage Ratio 43.5% 17.3% 66.8%
Portfolio
Portfolio Size $2,416,928 $222,777 $3,431,337
90+ Days Delinquency Ratio 4.6% 0.0% 19.5%
Charge-Off Ratio 1.0% 0.0% 2.9%
Loan Loss Reserve Ratio 6.6% 2.5% 11.5%
Oweesta Corporation 21
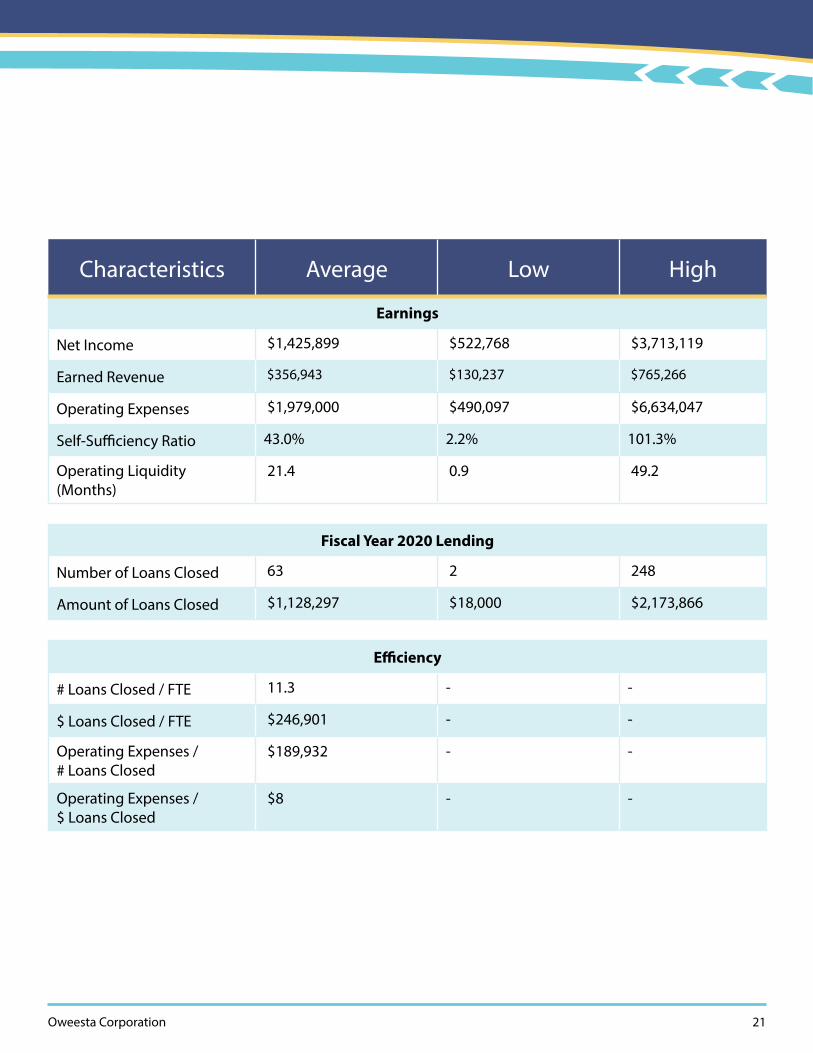
Characteristics Average Low High
Earnings
Net Income $1,425,899 $522,768 $3,713,119
Earned Revenue $356,943 $130,237 $765,266
Operating Expenses $1,979,000 $490,097 $6,634,047
Self-Sufficiency Ratio 43.0% 2.2% 101.3%
Operating Liquidity (Months)
21.4 0.9 49.2
Fiscal Year 2020 Lending
Number of Loans Closed 63 2 248
Amount of Loans Closed $1,128,297 $18,000 $2,173,866
Efficiency
# Loans Closed / FTE 11.3 - -
$ Loans Closed / FTE $246,901 - -
Operating Expenses / # Loans Closed
$189,932 - -
Operating Expenses / $ Loans Closed
$8 - -

22 Side-by-Side Report
Business Lenders with More than $10 Million in AssetsSix organizations are included in the data below.
Characteristics Average Low High
Age of Organization (Years) 20 12 34
Number of FTE 8 4 13
Capital Structure
Asset Size $22,375,320 $10,554,000 $48,892,121
Net Asset Ratio 62.3% 45.9% 77.8%
Net Asset w/o Donor Restrictions Ratio
44.5% 21.3% 55.8%
Leverage Ratio 55.6% 35.4% 77.3%
Portfolio
Portfolio Size $12,843,157 $4,739,411 $32,700,977
90+ Days Delinquency Ratio 3.2% 0.5% 7.1%
Charge-Off Ratio 0.7% 0.0% 3.0%
Loan Loss Reserve Ratio 6.0% 1.9% 10.2%

Oweesta Corporation 23
Characteristics Average Low High
Earnings
Net Income $1,693,949 $(60,448) $4,616,654
Earned Revenue $872,526 $294,983 $1,867,932
Operating Expenses $3,384,273 $564,742 $14,544,964
Self-Sufficiency Ratio 43.3% 12.1% 111.2%
Operating Liquidity (Months)
38.6 6.1 88.0
Fiscal Year 2020 Lending
Number of Loans Closed 106 9 395
Amount of Loans Closed $3,656,439 $853,370 $11,515,972
Efficiency
# Loans Closed / FTE 15.0 - -
$ Loans Closed / FTE $521,273 - -
Operating Expenses / # Loans Closed
$75,489 - -
Operating Expenses / $ Loans Closed
$2 - -

24 Side-by-Side Report
Averages for Business Revolving Loan Funds
Averages for Business Revolving Loan Funds
0
5M
10M
15M
20M
25M
0
16%
32%
48%
64%
80%
Less than $3M in Assets $3M to $9.99M in Assets More than $10M in Assets
Tota
l Ass
ets
Net
Ass
et R
atio
Total Assets Net Asset Ratio
Made with
0
0.2M
0.4M
0.6M
0.8M
1M
1.2M
0
13%
27%
40%
53%
67%
80%
Less than $3M in Assets $3M to $9.99M in Assets More than $10M in Assets
Earn
ed R
even
ue
Self-
Suf
cien
cy R
atio
Earned Revenue Self-Sufciency Ratio
Made with
Oweesta Corporation 25
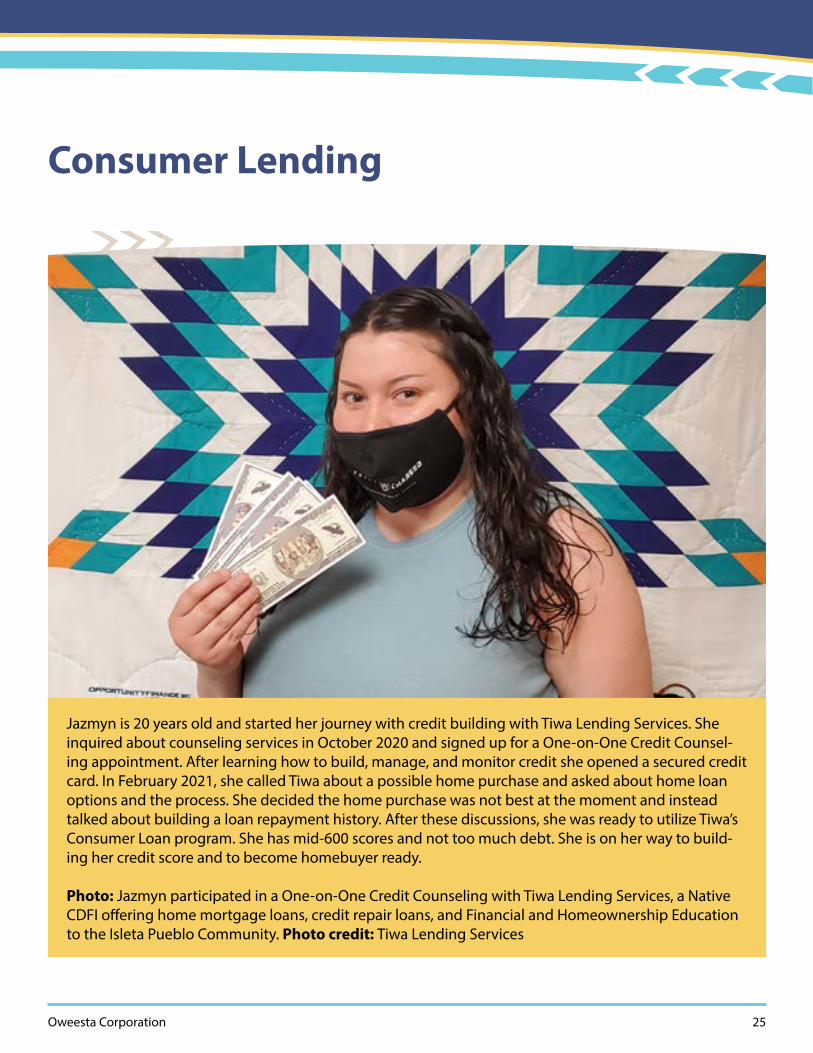
Jazmyn is 20 years old and started her journey with credit building with Tiwa Lending Services. She inquired about counseling services in October 2020 and signed up for a One-on-One Credit Counsel-ing appointment. After learning how to build, manage, and monitor credit she opened a secured credit card. In February 2021, she called Tiwa about a possible home purchase and asked about home loan options and the process. She decided the home purchase was not best at the moment and instead talked about building a loan repayment history. After these discussions, she was ready to utilize Tiwa’s Consumer Loan program. She has mid-600 scores and not too much debt. She is on her way to build-ing her credit score and to become homebuyer ready.
Photo: Jazmyn participated in a One-on-One Credit Counseling with Tiwa Lending Services, a Native CDFI offering home mortgage loans, credit repair loans, and Financial and Homeownership Education to the Isleta Pueblo Community. Photo credit: Tiwa Lending Services
Consumer Lending

26 Side-by-Side Report
Consumer Lenders for All EntitiesTwenty-two organizations are included in the data below.
Characteristics Average12 Low High
Age of Organization (Years) 13 1 34
Number of FTE 5 1 22
Capital Structure
Asset Size $7,081,760 $105,207 $48,892,121
Net Asset Ratio 65.4% 23.8% 100.3%
Net Asset w/o Donor Restrictions Ratio
45.7% (22.8)%13 100.3%
Leverage Ratio 43.8% 0.0% 90.6%
Portfolio
Portfolio Size $3,950,616 $11,520 $32,700,977
90+ Days Delinquency Ratio 3.7% 0.0% 28.9%
Charge-Off Ratio 1.2% 0.0% 7.9%
Loan Loss Reserve Ratio 5.8% 0.0% 27.7%
12. The low and high outlier was removed from the Self-Sufficiency ratio and Operating Liquidity averages to provide a more accu-rate figure. The outlier was skewing the averages significantly to the point of inaccuracy.
13. The low figure is negative because two of the Native CDFI RLFs included had negative net assets without donor restrictions at year-end.

Oweesta Corporation 27
Characteristics Average Low High
Earnings
Net Income $987,394 $(897,537) $4,616,654
Earned Revenue $377,146 $378 $1,867,932
Operating Expenses $1,222,502 $25 $6,634,047
Self-Sufficiency Ratio 39.8% 0.9% 1512.0%
Operating Liquidity (Months)
22.8 0.9 42,470
Fiscal Year 2020 Lending
Number of Loans Closed 157 6 2,072
Amount of Loans Closed $1,476,376 $12,109 $11,515,972
Efficiency
# Loans Closed / FTE 27.8 - -
- $289,490 - -
Operating Expenses / # Loans Closed
$80,328 - -
Operating Expenses / $ Loans Closed
$4 - -
28 Side-by-Side Report
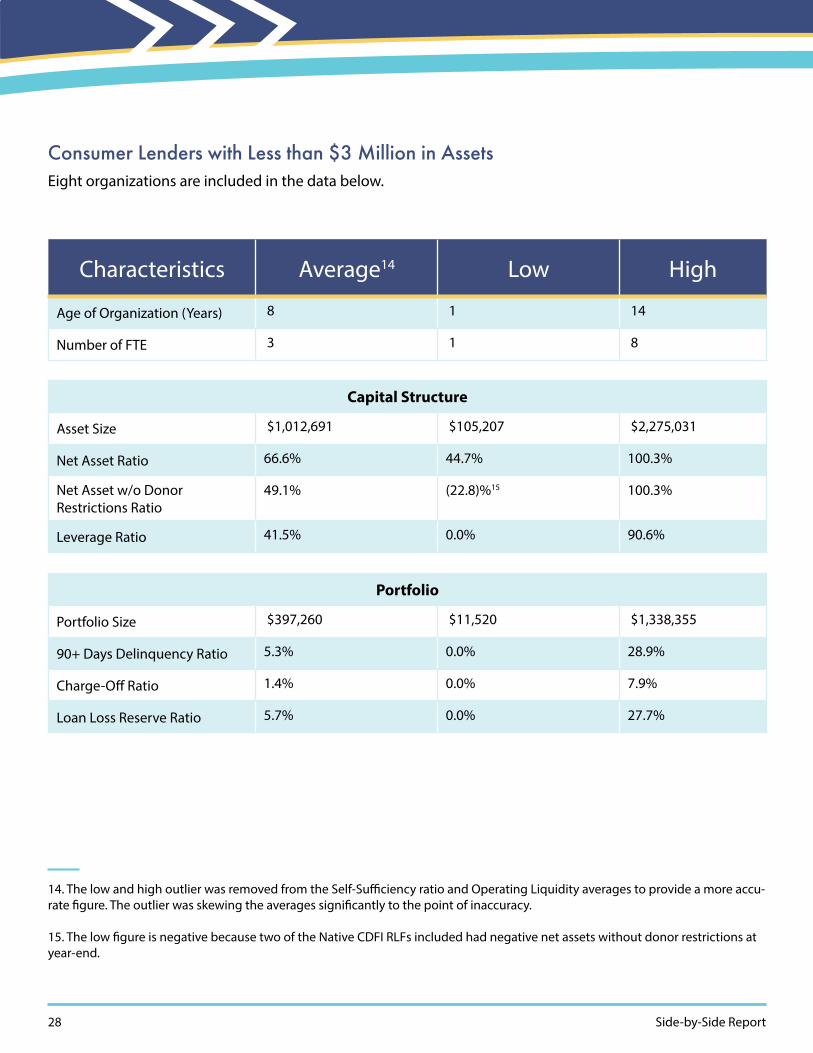
Consumer Lenders with Less than $3 Million in AssetsEight organizations are included in the data below.
Characteristics Average14 Low High
Age of Organization (Years) 8 1 14
Number of FTE 3 1 8
Capital Structure
Asset Size $1,012,691 $105,207 $2,275,031
Net Asset Ratio 66.6% 44.7% 100.3%
Net Asset w/o Donor Restrictions Ratio
49.1% (22.8)%15 100.3%
Leverage Ratio 41.5% 0.0% 90.6%
Portfolio
Portfolio Size $397,260 $11,520 $1,338,355
90+ Days Delinquency Ratio 5.3% 0.0% 28.9%
Charge-Off Ratio 1.4% 0.0% 7.9%
Loan Loss Reserve Ratio 5.7% 0.0% 27.7%
14. The low and high outlier was removed from the Self-Sufficiency ratio and Operating Liquidity averages to provide a more accu-rate figure. The outlier was skewing the averages significantly to the point of inaccuracy.
15. The low figure is negative because two of the Native CDFI RLFs included had negative net assets without donor restrictions at year-end.

Oweesta Corporation 29
Characteristics Average Low High
Earnings
Net Income $191,966 $(23,481) $682,640
Earned Revenue $65,977 $378 $322,783
Operating Expenses $298,666 $25 $869,911
Self-Sufficiency Ratio 18.5% 0.9% 1512%
Operating Liquidity (Months)
9.8 3.7 42,470
Fiscal Year 2020 Lending
Number of Loans Closed 31 7 78
Amount of Loans Closed $118,015 $12,109 $386,151
Efficiency
# Loans Closed / FTE 14.5 - -
$ Loans Closed / FTE $72,455 - -
Operating Expenses / # Loans Closed
$21,031 - -
Operating Expenses / $ Loans Closed
$5 - -

30 Side-by-Side Report
Consumer Lenders with Between $3 Million and $9.99 Million in AssetsNine organizations are included in the data below.
Characteristics Average Low High
Age of Organization (Years) 15 9 24
Number of FTE 7 2 22
Capital Structure
Asset Size $5,479,476 $3,000,676 $8,300,015
Net Asset Ratio 61.9% 23.8% 81.3%
Net Asset w/o Donor Restrictions Ratio
41.3% 10.3% 63.5%
Leverage Ratio 46.8% 22.6% 66.8%
Portfolio
Portfolio Size $2,724,965 $1,410,961 $5,496,466
90+ Days Delinquency Ratio 3.2% 0.0% 19.5%
Charge-Off Ratio 1.2% 0.0% 2.9%
Loan Loss Reserve Ratio 5.8% 2.5% 10.8%

Oweesta Corporation 31
Characteristics Average Low High
Earnings
Net Income $1,098,765 $(897,537) $3,713,119
Earned Revenue $474,462 $130,237 $1,606,779
Operating Expenses $2,139,921 $443,236 $6,634,047
Self-Sufficiency Ratio 38.5% 2.2% 88.6%
Operating Liquidity (Months)
22.7 0.9 54.7
Fiscal Year 2020 Lending
Number of Loans Closed 288 6 2,072
Amount of Loans Closed $1,324,914 $246,167 $2,173,866
Efficiency
# Loans Closed / FTE 43.3 - -
$ Loans Closed / FTE $271,569 - -
Operating Expenses / # Loans Closed
$169,054 - -
Operating Expenses / $ Loans Closed
$4 - -

32 Side-by-Side Report
Consumer Lenders with More than $10 Million in AssetsFive organizations are included in the data below.
Characteristics Average Low High
Age of Organization (Years) 18 9 34
Number of FTE 5 2 8
Capital Structure
Asset Size $19,676,382 $10,375,263 $48,892,121
Net Asset Ratio 69.6% 57.5% 77.8%
Net Asset w/o Donor Restrictions Ratio
48.1% 21.3% 73.4%
Leverage Ratio 42.3% 19.1% 73.6%
Portfolio
Portfolio Size $11,842,156 $4,739,411 $32,700,977
90+ Days Delinquency Ratio 2.1% 0.0% 4.7%
Charge-Off Ratio 0.8% 0.0% 3.0%
Loan Loss Reserve Ratio 6.0% 0.9% 10.2%
Oweesta Corporation 33
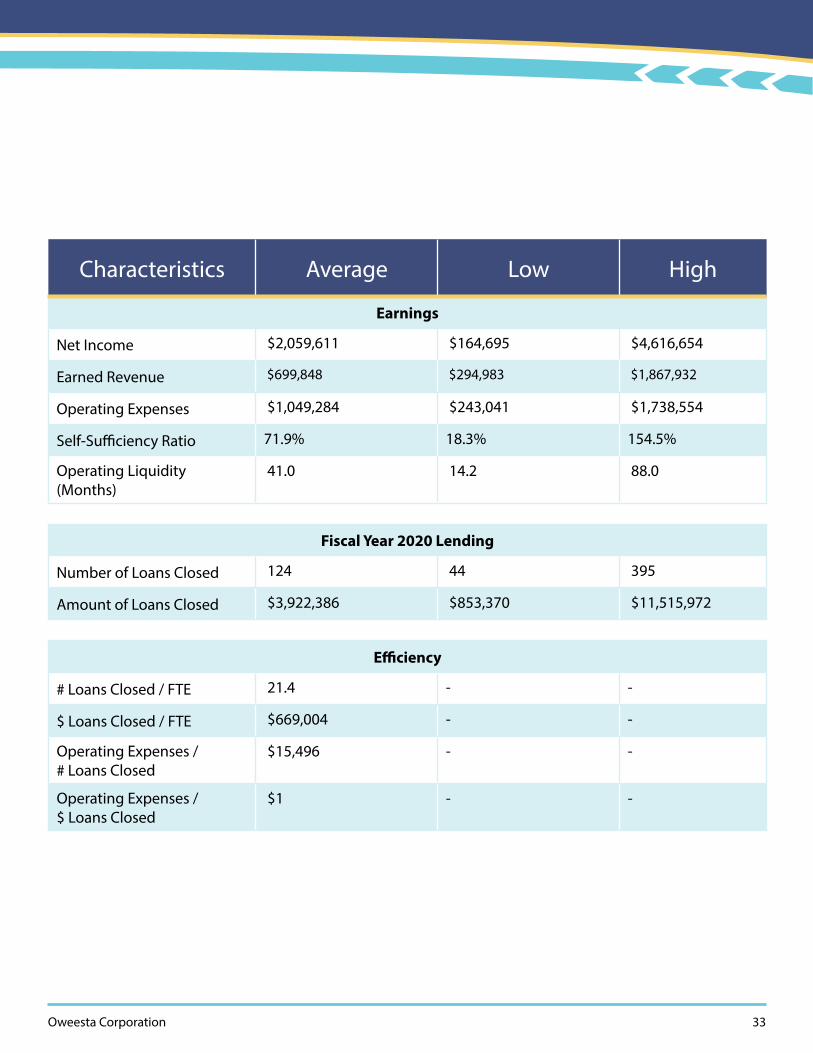
Characteristics Average Low High
Earnings
Net Income $2,059,611 $164,695 $4,616,654
Earned Revenue $699,848 $294,983 $1,867,932
Operating Expenses $1,049,284 $243,041 $1,738,554
Self-Sufficiency Ratio 71.9% 18.3% 154.5%
Operating Liquidity (Months)
41.0 14.2 88.0
Fiscal Year 2020 Lending
Number of Loans Closed 124 44 395
Amount of Loans Closed $3,922,386 $853,370 $11,515,972
Efficiency
# Loans Closed / FTE 21.4 - -
$ Loans Closed / FTE $669,004 - -
Operating Expenses / # Loans Closed
$15,496 - -
Operating Expenses / $ Loans Closed
$1 - -
34 Side-by-Side Report
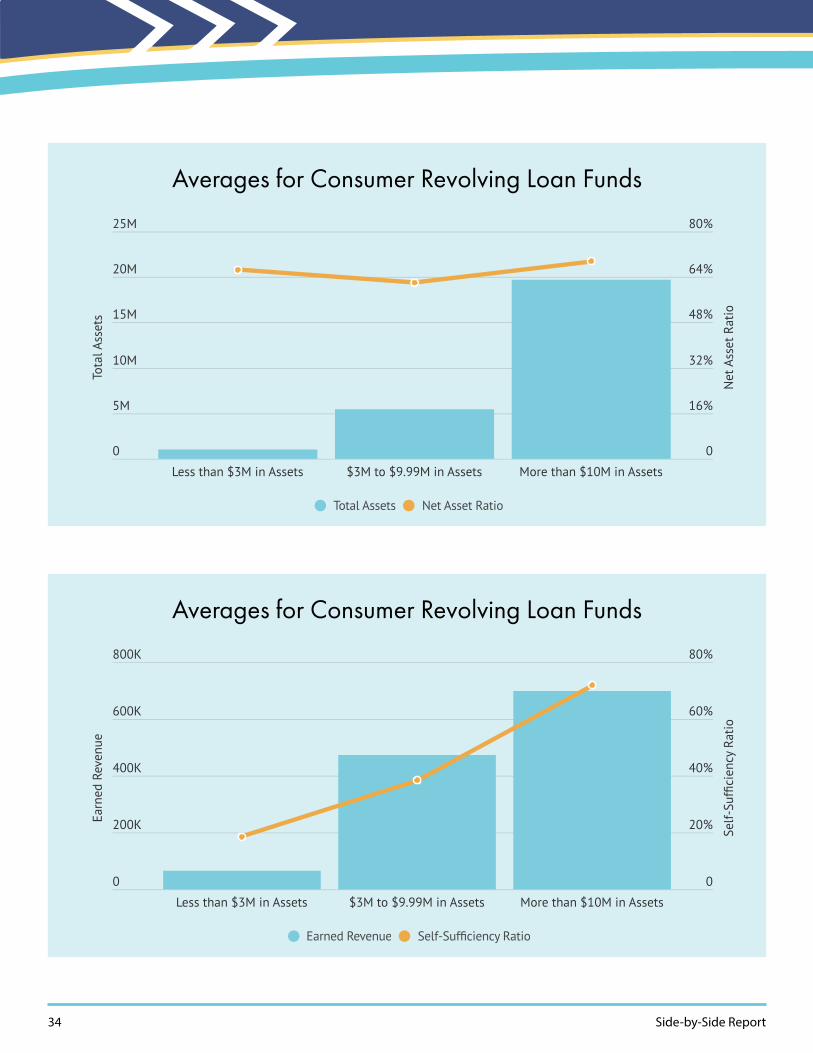
Averages for Consumer Revolving Loan Funds
Averages for Consumer Revolving Loan Funds
0
5M
10M
15M
20M
25M
0
16%
32%
48%
64%
80%
Less than $3M in Assets $3M to $9.99M in Assets More than $10M in Assets
Tota
l Ass
ets
Net
Ass
et R
atio
Total Assets Net Asset Ratio
Made with
0
200K
400K
600K
800K
0
20%
40%
60%
80%
Less than $3M in Assets $3M to $9.99M in Assets More than $10M in Assets
Earn
ed R
even
ue
Self-
Suf
cien
cy R
atio
Earned Revenue Self-Sufciency Ratio
Made with

Oweesta Corporation 35
In response to the overwhelming lack of housing on the Colville Indian Reservation, Northwest Native Development Fund (NNDF) addressed the issue by undertaking a project like they never had. A lot in Elmer City was purchased and a 1500 sqft. home was built. The new homebuyers worked closely with NNDF receiving homeowner direct technical assistance. They became homeowners on March 24, 2021.
Photo: NNDF’s Executive Director Ted Piccolo helps in the construction of their first affordable home. Photo credit: Northwest Native Development Fund
Housing Lending
36 Side-by-Side Report
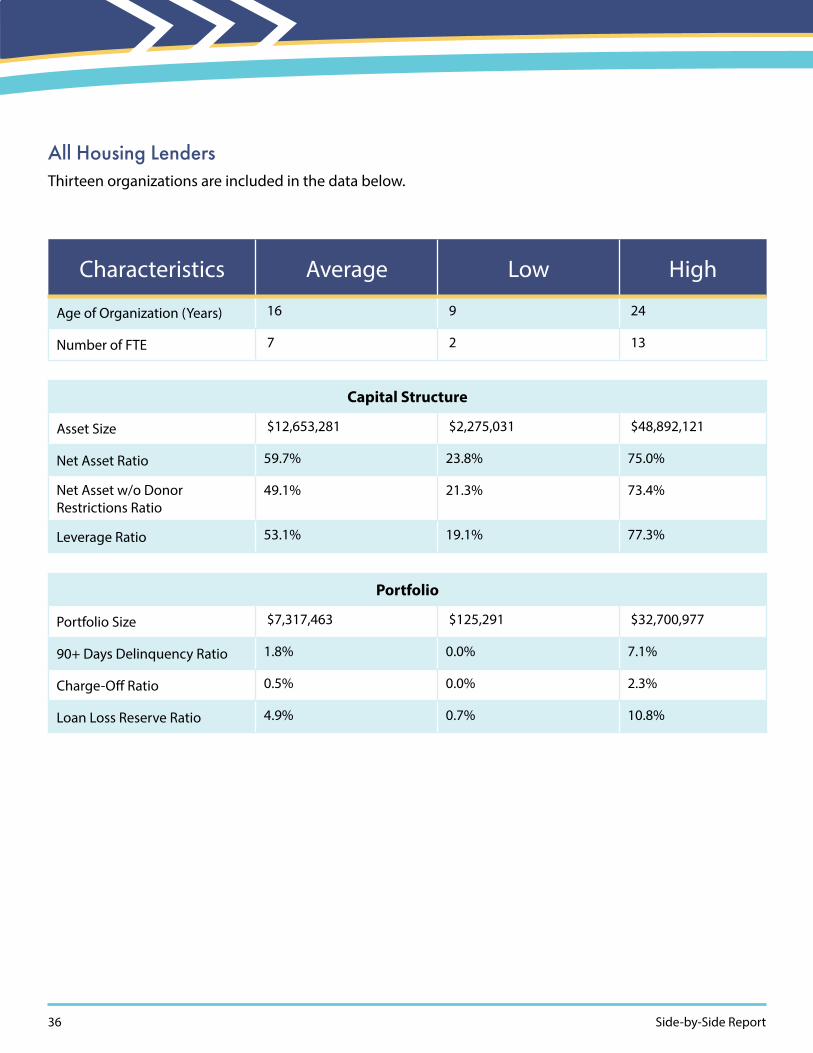
All Housing LendersThirteen organizations are included in the data below.
Characteristics Average Low High
Age of Organization (Years) 16 9 24
Number of FTE 7 2 13
Capital Structure
Asset Size $12,653,281 $2,275,031 $48,892,121
Net Asset Ratio 59.7% 23.8% 75.0%
Net Asset w/o Donor Restrictions Ratio
49.1% 21.3% 73.4%
Leverage Ratio 53.1% 19.1% 77.3%
Portfolio
Portfolio Size $7,317,463 $125,291 $32,700,977
90+ Days Delinquency Ratio 1.8% 0.0% 7.1%
Charge-Off Ratio 0.5% 0.0% 2.3%
Loan Loss Reserve Ratio 4.9% 0.7% 10.8%

Oweesta Corporation 37
Characteristics Average Low High
Earnings
Net Income $681,579 $(897,537) $2,181,872
Earned Revenue $649,093 $130,237 $1,867,932
Operating Expenses $2,400,816 $243,041 $14,544,964
Self-Sufficiency Ratio 50.3% 2.2% 154.5%
Operating Liquidity (Months)
27.0 0.9 88.0
Fiscal Year 2020 Lending
Number of Loans Closed 237 9 2,072
Amount of Loans Closed $2,404,938 $93,010 $11,515,972
Efficiency
# Loans Closed / FTE 34.6 - -
$ Loans Closed / FTE $382,865 - -
Operating Expenses / # Loans Closed
$70,889 - -
Operating Expenses / $ Loans Closed
$2 - -

38 Side-by-Side Report
Housing Lenders with Less than $10 Million in AssetsSeven organizations are included in the data below.
Characteristics Average Low High
Age of Organization (Years) 15 10 24
Number of FTE 7 4 9
Capital Structure
Asset Size $4,721,194 $2,275,031 $8,300,015
Net Asset Ratio 57.9% 23.8% 66.7%
Net Asset w/o Donor Restrictions Ratio
47.9% 23.7% 63.5%
Leverage Ratio 53.3% 24.7% 66.3%
Portfolio
Portfolio Size $2,303,367 $125,291 $5,496,466
90+ Days Delinquency Ratio 1.2% 0.0% 4.6%
Charge-Off Ratio 0.7% 0.0% 2.3%
Loan Loss Reserve Ratio 5.2% 0.7% 10.8%

Oweesta Corporation 39
Characteristics Average Low High
Earnings
Net Income $449,828 $(897,537) $1,524,227
Earned Revenue $451,452 $130,237 $1,606,779
Operating Expenses $1,771,498 $443,236 $5,776,196
Self-Sufficiency Ratio 36.8% 2.2% 51.2%
Operating Liquidity (Months)
17.4 0.9 54.7
Fiscal Year 2020 Lending
Number of Loans Closed 352 9 2,072
Amount of Loans Closed $1,294,433 $93,010 $2,173,866
Efficiency
# Loans Closed / FTE 50.1 - -
$ Loans Closed / FTE $208,762 - -
Operating Expenses / # Loans Closed
$69,809 - -
Operating Expenses / $ Loans Closed
$3 - -

40 Side-by-Side Report
Housing Lenders with More than $10 Million in AssetsSix organizations are included in the data below.
Characteristics Average Low High
Age of Organization (Years) 16 9 20
Number of FTE 7 2 13
Capital Structure
Asset Size $21,907,382 $10,375,263 $48,892,121
Net Asset Ratio 61.9% 45.9% 75.0%
Net Asset w/o Donor Restrictions Ratio
50.5% 21.3% 73.4%
Leverage Ratio 52.9% 19.1% 77.3%
Portfolio
Portfolio Size $13,167,242 $4,739,411 $32,700,977
90+ Days Delinquency Ratio 2.5% 0.0% 7.1%
Charge-Off Ratio 0.2% 0.0% 0.8%
Loan Loss Reserve Ratio 4.5% 0.9% 7.9%

Oweesta Corporation 41
Characteristics Average Low High
Earnings
Net Income $951,955 $(60,448) $2,181,872
Earned Revenue $879,674 $294,983 $1,867,932
Operating Expenses $3,135,021 $243,041 $14,544,964
Self-Sufficiency Ratio 66.0% 12.1% 154.5%
Operating Liquidity (Months)
38.2 6.1 88.0
Fiscal Year 2020 Lending
Number of Loans Closed 102 9 395
Amount of Loans Closed $3,700,526 $1,117,895 $11,515,972
Efficiency
# Loans Closed / FTE 16.4 - -
$ Loans Closed / FTE $585,986 - -
Operating Expenses / # Loans Closed
$72,149 - -
Operating Expenses / $ Loans Closed
$1 - -

42 Side-by-Side Report
Averages for Housing Revolving Loan Funds
Averages for Housing Revolving Loan Funds
0
5M
10M
15M
20M
25M
0
16%
32%
48%
64%
80%
Less than $10 in Assets More than $10M in Assets
Tota
l Ass
ets
Net
Ass
et R
atio
Total Assets Net Asset Ratio
Made with
0
0.2M
0.4M
0.6M
0.8M
1M
0
16%
32%
48%
64%
80%
Less than $10 in Assets More than $10M in Assets
Earn
ed R
even
ue
Self-
Suf
cien
cy R
atio
Earned Revenue Self-Sufciency Ratio
Made with
Oweesta Corporation 43
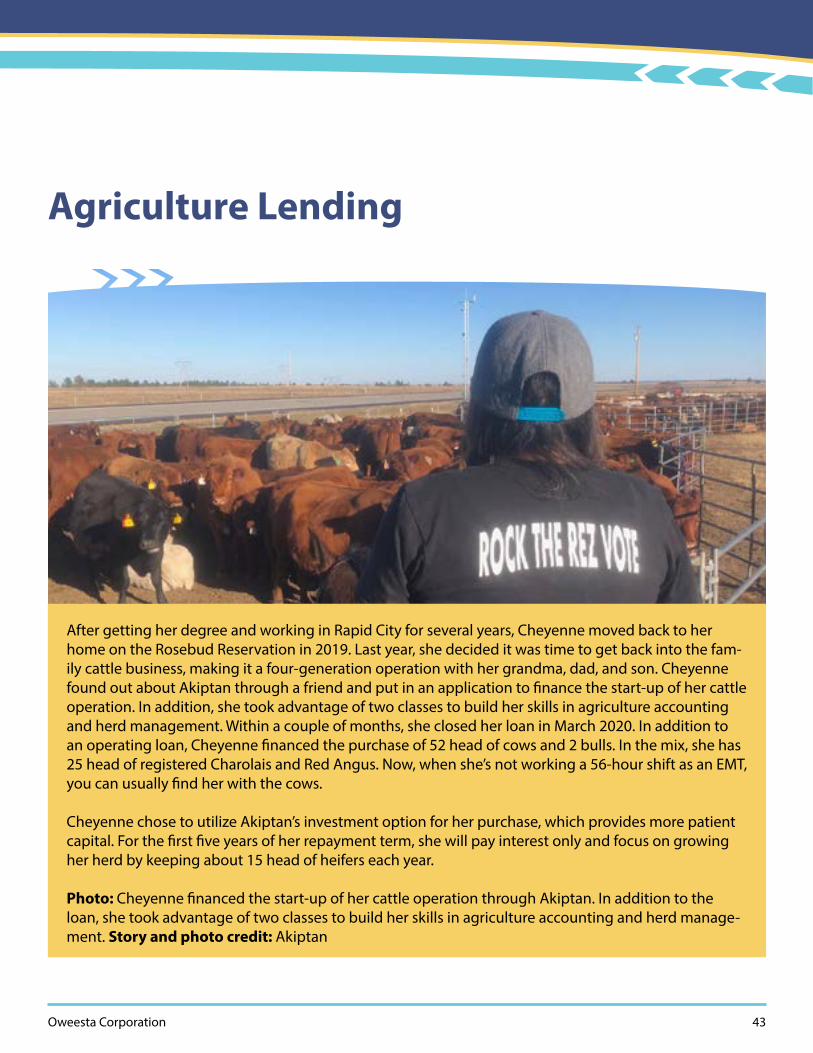
After getting her degree and working in Rapid City for several years, Cheyenne moved back to her home on the Rosebud Reservation in 2019. Last year, she decided it was time to get back into the fam-ily cattle business, making it a four-generation operation with her grandma, dad, and son. Cheyenne found out about Akiptan through a friend and put in an application to finance the start-up of her cattle operation. In addition, she took advantage of two classes to build her skills in agriculture accounting and herd management. Within a couple of months, she closed her loan in March 2020. In addition to an operating loan, Cheyenne financed the purchase of 52 head of cows and 2 bulls. In the mix, she has 25 head of registered Charolais and Red Angus. Now, when she’s not working a 56-hour shift as an EMT, you can usually find her with the cows.
Cheyenne chose to utilize Akiptan’s investment option for her purchase, which provides more patient capital. For the first five years of her repayment term, she will pay interest only and focus on growing her herd by keeping about 15 head of heifers each year.
Photo: Cheyenne financed the start-up of her cattle operation through Akiptan. In addition to the loan, she took advantage of two classes to build her skills in agriculture accounting and herd manage-ment. Story and photo credit: Akiptan
Agriculture Lending

44 Side-by-Side Report
All Agriculture LendersEight organizations are included in the data below.
Characteristics Average Low High
Age of Organization (Years) 14 1 34
Number of FTE 5 1 8
Capital Structure
Asset Size $6,223,470 $388,928 $15,377,631
Net Asset Ratio 69.3% 47.9% 85.1%
Net Asset w/o Donor Restrictions Ratio
41.0% (14.2)%16 85.1%
Leverage Ratio 42.1% 15.1% 64.3%
Portfolio
Portfolio Size $2,993,214 $108,511 $8,526,059
90+ Days Delinquency Ratio 6.3% 0.0% 28.9%
Charge-Off Ratio 0.7% 0.0% 3.0%
Loan Loss Reserve Ratio 3.9% 0.0% 10.2%
16. The low figure is negative because one of the Native CDFI RLFs included had negative net assets without donor restrictions at year-end.
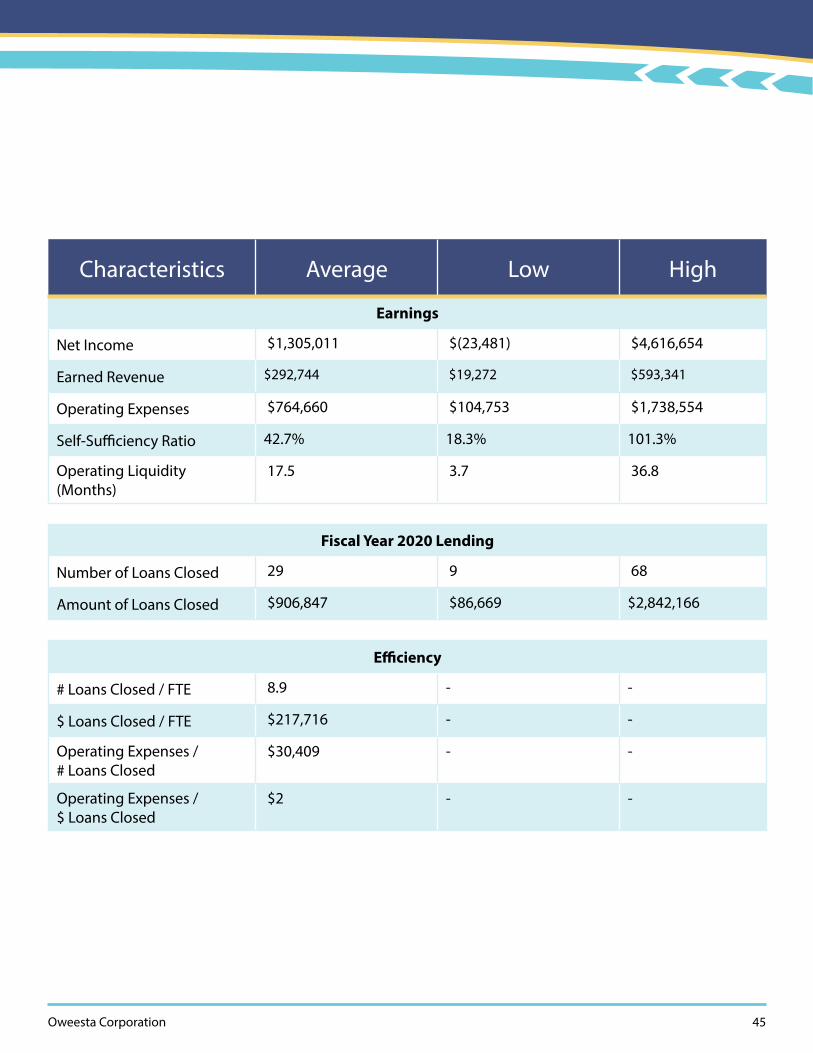
Oweesta Corporation 45
Characteristics Average Low High
Earnings
Net Income $1,305,011 $(23,481) $4,616,654
Earned Revenue $292,744 $19,272 $593,341
Operating Expenses $764,660 $104,753 $1,738,554
Self-Sufficiency Ratio 42.7% 18.3% 101.3%
Operating Liquidity (Months)
17.5 3.7 36.8
Fiscal Year 2020 Lending
Number of Loans Closed 29 9 68
Amount of Loans Closed $906,847 $86,669 $2,842,166
Efficiency
# Loans Closed / FTE 8.9 - -
$ Loans Closed / FTE $217,716 - -
Operating Expenses / # Loans Closed
$30,409 - -
Operating Expenses / $ Loans Closed
$2 - -
46 Side-by-Side Report
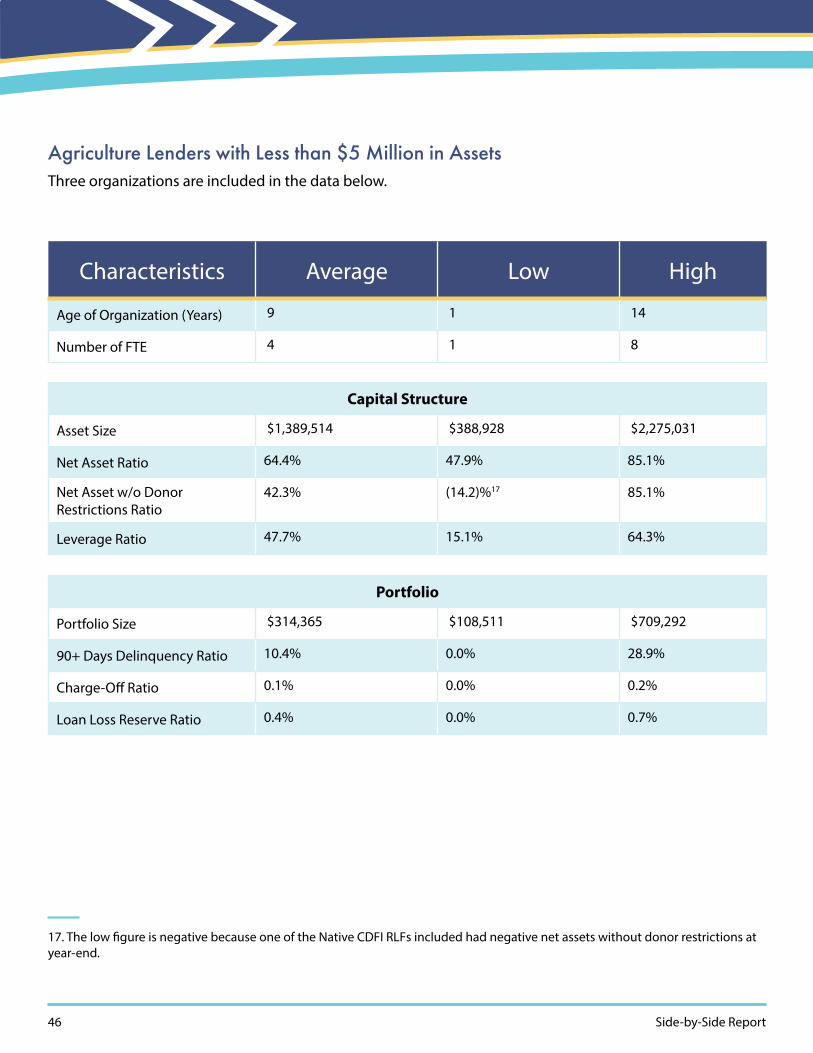
Agriculture Lenders with Less than $5 Million in AssetsThree organizations are included in the data below.
Characteristics Average Low High
Age of Organization (Years) 9 1 14
Number of FTE 4 1 8
Capital Structure
Asset Size $1,389,514 $388,928 $2,275,031
Net Asset Ratio 64.4% 47.9% 85.1%
Net Asset w/o Donor Restrictions Ratio
42.3% (14.2)%17 85.1%
Leverage Ratio 47.7% 15.1% 64.3%
Portfolio
Portfolio Size $314,365 $108,511 $709,292
90+ Days Delinquency Ratio 10.4% 0.0% 28.9%
Charge-Off Ratio 0.1% 0.0% 0.2%
Loan Loss Reserve Ratio 0.4% 0.0% 0.7%
17. The low figure is negative because one of the Native CDFI RLFs included had negative net assets without donor restrictions at year-end.
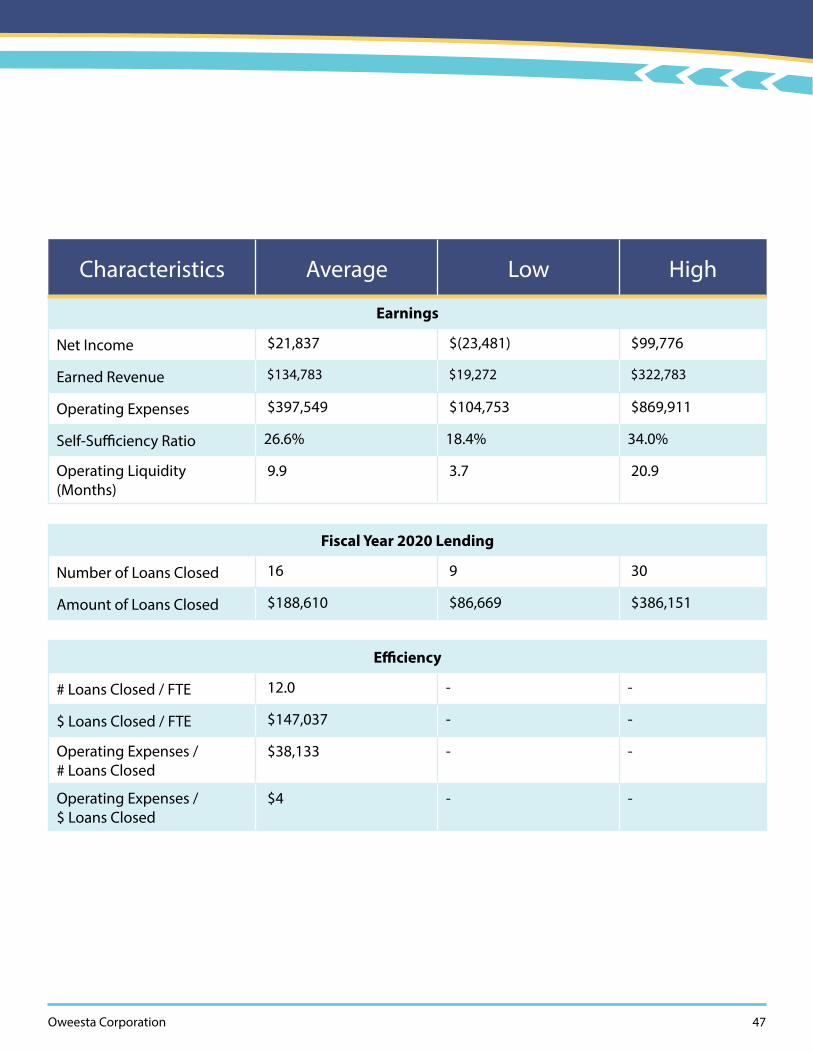
Oweesta Corporation 47
Characteristics Average Low High
Earnings
Net Income $21,837 $(23,481) $99,776
Earned Revenue $134,783 $19,272 $322,783
Operating Expenses $397,549 $104,753 $869,911
Self-Sufficiency Ratio 26.6% 18.4% 34.0%
Operating Liquidity (Months)
9.9 3.7 20.9
Fiscal Year 2020 Lending
Number of Loans Closed 16 9 30
Amount of Loans Closed $188,610 $86,669 $386,151
Efficiency
# Loans Closed / FTE 12.0 - -
$ Loans Closed / FTE $147,037 - -
Operating Expenses / # Loans Closed
$38,133 - -
Operating Expenses / $ Loans Closed
$4 - -
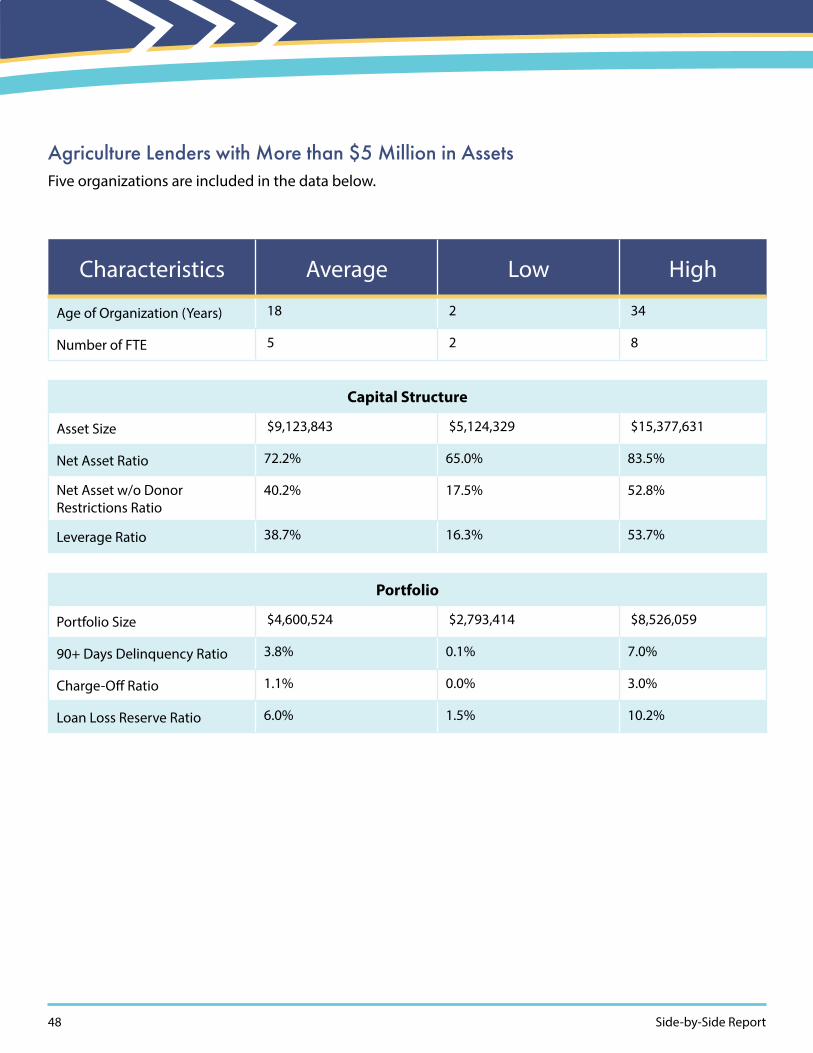
48 Side-by-Side Report
Agriculture Lenders with More than $5 Million in AssetsFive organizations are included in the data below.
Characteristics Average Low High
Age of Organization (Years) 18 2 34
Number of FTE 5 2 8
Capital Structure
Asset Size $9,123,843 $5,124,329 $15,377,631
Net Asset Ratio 72.2% 65.0% 83.5%
Net Asset w/o Donor Restrictions Ratio
40.2% 17.5% 52.8%
Leverage Ratio 38.7% 16.3% 53.7%
Portfolio
Portfolio Size $4,600,524 $2,793,414 $8,526,059
90+ Days Delinquency Ratio 3.8% 0.1% 7.0%
Charge-Off Ratio 1.1% 0.0% 3.0%
Loan Loss Reserve Ratio 6.0% 1.5% 10.2%

Oweesta Corporation 49
Characteristics Average Low High
Earnings
Net Income $2,074,916 $818,848 $4,616,654
Earned Revenue $387,521 $171,750 $593,341
Operating Expenses $984,927 $263,889 $1,738,554
Self-Sufficiency Ratio 52.3% 18.3% 101.3%
Operating Liquidity (Months)
22.0 11.8 36.8
Fiscal Year 2020 Lending
Number of Loans Closed 37 12 68
Amount of Loans Closed $1,337,789 $708,000 $2,842,166
Efficiency
# Loans Closed / FTE 7.0 - -
$ Loans Closed / FTE $260,123 - -
Operating Expenses / # Loans Closed
$25,775 - -
Operating Expenses / $ Loans Closed
$1 - -

50 Side-by-Side Report
Averages for Agriculture Revolving Loan Funds
Averages for Agriculture Revolving Loan Funds
0
2M
4M
6M
8M
10M
0
16%
32%
48%
64%
80%
Less than $5 in Assets More than $5M in Assets
Tota
l Ass
ets
Net
Ass
et R
atio
Total Assets Net Asset Ratio
Made with
0
0.2M
0.4M
0.6M
0.8M
1M
0
16%
32%
48%
64%
80%
Less than $5 in Assets More than $5M in Assets
Earn
ed R
even
ue
Self-
Suf
cien
cy R
atio
Earned Revenue Self-Sufciency Ratio
Made with

Oweesta Corporation 51
Oweesta CorporationRedefining Equity. Reclaiming Native Sovereignty. Together
Mission StatementOweesta Corporation’s mission is to provide opportunities for Native people to develop financial assets and create wealth by assisting in the establishment of strong, permanent institutions and programs contributing to economic independence and strengthening sovereignty for all Native communities.
ValuesWe believe that when armed with the appropriate resources, Native peoples hold the capacity and ingenuity to ensure the sustainable, economic, spiritual and cultural well-being of their communities.
Contact Us2432 Main Street, 1st Floor | Longmont, Colorado 80501 | 303.774.8838
[email protected] | www.oweesta.org
OWEESTA