
NATIVE AQUATIC SPECIES MANAGEMENT PLAN AND ADAPTIVE ...
171
NATIVE AQUATIC SPECIES MANAGEMENT PLAN AND ADAPTIVE MANAGEMENT PLAN 2013 DATA COLLECTION REPORT DRAFT Southern California Edison Company Big Creek No. 4 Hydroelectric Project FERC Project No. 2017 2013
Transcript of NATIVE AQUATIC SPECIES MANAGEMENT PLAN AND ADAPTIVE ...

NATIVE AQUATIC SPECIES MANAGEMENT PLAN
AND
ADAPTIVE MANAGEMENT PLAN
2013 DATA COLLECTION REPORT
DRAFT
Southern California Edison Company
Big Creek No. 4 Hydroelectric Project
FERC Project No. 2017
2013

Draft NASMP and AMP – Big Creek No. 4 Hydroelectric Project, FERC No. 2017 2013 Data Collection Report
TABLE OF CONTENTS
Page List of Tables .................................................................................................................. vi
List of Figures ............................................................................................................ viii
List of Acronyms/Abbreviations ................................................................................. xi
Executive Summary ................................................................................................... xiii
1.0 Introduction ...................................................................................................... 1-1
1.1 Study Area Description ........................................................................... 1-1
1.2 2013 Data Collection Objectives ............................................................. 1-1
1.3 2013 Physical Data Monitoring Objectives .............................................. 1-4
1.3.1 2013 Physical Data Monitoring .................................................... 1-4
1.3.2 Physical Data Monitoring during Out-of-Season Experimental Whitewater Flow Releases ..................................... 1-5
1.4 Biological Monitoring During Out-of-Season Experimental Whitewater Flow Releases Objectives .................................................... 1-5
2.0 Method .............................................................................................................. 2-1
2.1 Physical Data .......................................................................................... 2-1
2.1.1 Stream Flow ................................................................................. 2-1
2.1.2 Air Temperature ........................................................................... 2-1
2.1.3 Water Temperature ...................................................................... 2-1
2.1.3.1 Water Temperature Locations ...................................... 2-1
2.1.3.2 Water Temperature Recorders .................................... 2-5
2.1.3.3 Redinger Lake Profiles ................................................. 2-5
2.1.4 Physical Conditions During Out-of-season Experimental Whitewater Flow Releases ........................................................... 2-5
Copyright 2013 by Southern California Edison Company i Draft 2013

Draft NASMP and AMP – Big Creek No. 4 Hydroelectric Project, FERC No. 2017 2013 Data Collection Report
2.2 Monitoring of Biological Effects of Out-of-season Experimental Whitewater Flow Releases ..................................................................... 2-6
2.2.1 Displacement Monitoring .............................................................. 2-6
2.2.1.1 Western Pond Turtle Displacement ............................. 2-6
2.2.1.2 Methods ....................................................................... 2-6
2.2.1.3 Fish Displacement ....................................................... 2-8
2.2.1.4 Methods ....................................................................... 2-8
2.2.2 Stranding Studies ......................................................................... 2-9
2.2.2.1 Methods ....................................................................... 2-9
2.3 Status of Native Aquatic Species .......................................................... 2-10
2.3.1 Western Pond Turtle .................................................................. 2-10
2.3.1.1 Abundance and Population Structure Surveys ........... 2-11
2.3.2 Molluscs ..................................................................................... 2-12
2.3.3 Fish ............................................................................................ 2-12
2.3.3.1 Fish Populations ........................................................ 2-12
3.0 Results ............................................................................................................. 3-1
3.1 Physical Data .......................................................................................... 3-1
3.1.1 Stream Flow ................................................................................. 3-1
3.1.2 Air Temperature ........................................................................... 3-4
3.1.3 Water Temperature Results ......................................................... 3-4
3.1.3.1 Overwinter Water Temperatures, 2012–2013 .............. 3-4
3.1.3.2 Spring-Summer 2013 Water Temperatures ................. 3-4
3.1.3.3 Redinger Lake Profiles ............................................... 3-10
Copyright 2013 by Southern California Edison Company ii Draft 2013
Draft NASMP and AMP – Big Creek No. 4 Hydroelectric Project, FERC No. 2017 2013 Data Collection Report
3.2 Physical Conditions During Out-of-season Experimental Whitewater Flow Releases ...................................................................................... 3-14
3.2.1 First Out-of-season Experimental Whitewater Flow Release August 2013 ............................................................................... 3-14
3.2.1.1 Flow ........................................................................... 3-14
3.2.1.2 Water Temperature .................................................... 3-14
3.2.2 Second Out-of-season Experimental Whitewater Flow Release September 2013 .......................................................... 3-16
3.2.2.1 Flow ........................................................................... 3-16
3.2.2.2 Water Temperature .................................................... 3-16
3.2.3 Stranding Results ....................................................................... 3-16
3.2.3.1 Stranding Following First Out-of-season Experimental Whitewater Flow Release..................... 3-18
3.2.3.2 Stranding Following Second Out-of-season Experimental Whitewater Flow Release..................... 3-21
3.2.4 Displacement Monitoring ............................................................ 3-21
3.2.4.1 Western Pond Turtle Displacement Results ............... 3-21
3.2.4.2 Fish Displacement Results ......................................... 3-26
3.3 Status of Native Aquatic Species .......................................................... 3-43
3.3.1 Western Pond Turtle .................................................................. 3-43
3.3.1.1 Abundance and Population Structure Surveys ........... 3-43
3.3.1.2 Habitat Characterization ............................................. 3-47
3.3.2 Molluscs ..................................................................................... 3-49
3.3.2.1 Mussel Site 5 ............................................................. 3-49
3.3.2.2 Mussel Site 6 ............................................................. 3-49
3.3.2.3 Mussel Site 7 ............................................................. 3-52
3.3.3 Fish ............................................................................................ 3-55
Copyright 2013 by Southern California Edison Company iii Draft 2013
Draft NASMP and AMP – Big Creek No. 4 Hydroelectric Project, FERC No. 2017 2013 Data Collection Report
3.3.3.1 Species Composition and Density ............................. 3-55
3.3.3.2 Population Characteristics ......................................... 3-62
4.0 Discussion ....................................................................................................... 4-1
4.1 Effects of Out-of-season Experimental Whitewater Flow Releases on Native Aquatic Species ...................................................................... 4-1
4.1.1 Amphibians .................................................................................. 4-1
4.1.2 Western Pond Turtles .................................................................. 4-1
4.1.3 Fish Community ........................................................................... 4-1
4.1.3.1 Stranding ...................................................................... 4-1
4.1.3.2 Displacement ............................................................... 4-1
4.2 Status of Native Aquatic Species ............................................................ 4-3
4.2.1 Western Pond Turtle Populations................................................. 4-3
4.2.1.1 Population Level .......................................................... 4-3
4.2.2 Mussel Community ....................................................................... 4-4
4.2.3 Fish Community Characteristics and Comparisons ...................... 4-4
4.2.3.1 Fish Community and Abundance ................................. 4-4
4.2.3.2 Individual Level ............................................................ 4-9
4.2.3.3 Community Level ....................................................... 4-13
4.2.3.4 Resilience in Response to Stochastic Events ............ 4-13
5.0 Whitewater Boating Monitoring .................................................................... 5-15
5.1 Introduction ........................................................................................... 5-15
5.2 Methods ................................................................................................ 5-15
5.3 Results .................................................................................................. 5-16
6.0 Literature Cited ................................................................................................ 6-1
Copyright 2013 by Southern California Edison Company iv Draft 2013
Draft NASMP and AMP – Big Creek No. 4 Hydroelectric Project, FERC No. 2017 2013 Data Collection Report
APPENDICES
Appendix A Detailed Methods Appendix B Temperature, Meteorology, and Hydrology Data Appendix C Western Pond Turtle Capture Data Appendix D Larval Fish Dip Net Data Appendix E Displacement Study Snorkel Observations Appendix F Example Data Sheet for BC4 Horseshoe Bend Whitewater Boating
Recreational Use Log
Copyright 2013 by Southern California Edison Company v Draft 2013

Draft NASMP and AMP – Big Creek No. 4 Hydroelectric Project, FERC No. 2017 2013 Data Collection Report
LIST OF TABLES Page
Table 1. Summer and Winter Water Temperature Monitoring Locations and Unit Serial Numbers (2012-2013). ................................................... 2-4
Table 2. Monthly Mean, Minimum, and Maximum Water Temperature and Average Monthly Flows from November 1, 2012 to April 30, 2013 (Overwinter). .................................................................................. 3-2
Table 3. Monthly Mean, Minimum, and Maximum Water Temperature and Average Monthly Flows from May 1, 2013 to October 31, 2013. ....................................................................................................... 3-3
Table 4. Monthly Mean Temperatures for 2013 at Fresno International Airport Compared with Percentage Exceedance for Historical Record (1931–2013) and Temperatures Measured at Dam 7. ............... 3-5
Table 5. Stranding Results during Ramp Down at Willow Creek Confluence Pool, August 19, 2013. ...................................................... 3-19
Table 6. Stranding Results during Ramp Down at Backbone Creek Confluence Pool, August 19, 2013. ...................................................... 3-19
Table 7. Stranding Results during Ramp Down at Fish Population Sampling Site 4, August 19, 2013. ........................................................ 3-20
Table 8. Stranding Results during Ramp Down at Fish Population Sampling Site 5, August 19, 2013. ........................................................ 3-20
Table 9. Stranding Results during Ramp Down at Willow Creek Confluence Pool, September 9, 2013. .................................................. 3-22
Table 10. Stranding Results during Ramp Down at Backbone Creek Confluence Pool, September 9, 2013. .................................................. 3-22
Table 11. Stranding Results during Ramp Down at Fish Population Sampling Site 4, September 9, 2013. ................................................... 3-23
Table 12. Stranding Results during Ramp Down at Fish Population Sampling Site 5, September 9, 2013. ................................................... 3-23
Table 13. Western Pond Turtle Radio Tracking. ................................................... 3-24
Table 14. Adult Hardhead Movement Detected by Radio Tracking. ..................... 3-27
Copyright 2013 by Southern California Edison Company vi Draft 2013

Draft NASMP and AMP – Big Creek No. 4 Hydroelectric Project, FERC No. 2017 2013 Data Collection Report
Table 15. Summary of Larval Trapping Results from Before to After Out-of-season Experimental Whitewater Flow Release, August and September 2013. .................................................................................. 3-38
Table 16. Summary of Larval Dip Netting Results from Before to After First Out-of-season Experimental Whitewater Flow Release, August 2013. ..................................................................................................... 3-39
Table 17. Summary of Larval Dip Netting Results from Before to After Second Out-of-season Experimental Whitewater Flow Release, September 2013. .................................................................................. 3-40
Table 18. Western Pond Turtle Capture Data in 2013. ......................................... 3-44
Table 19. Growth Rates for Recaptured Western Pond Turtles Captured in 2013. ..................................................................................................... 3-46
Table 20. Summary of Mollusc Survey Data for Three Locations (Sandbar to Site 5, Site 5, and Site 6) Collected in 20101, 20112, 20123, and 20134. ............................................................................................ 3-50
Table 21. Summary of Mollusc Survey Data at Mussel Site 7 Collected in 2010, 2011, 2012 and 2013. ................................................................. 3-53
Table 22. Population and Density Estimates for Electrofishing and Snorkeling Sampling, October 2013. .................................................... 3-58
Table 23. Density Estimates and Percentage Composition by Species for Combined Sites, 2013........................................................................... 3-61
Table 24. Population and Biomass Estimates at Electrofishing Sampling Sites, 2013 (based on fish collected). ................................................... 3-63
Table 25. Condition Factors and 95 Percent Confidence Intervals by Species Collected by Electrofishing, October 2013. ............................. 3-70
Table 26. Comparison of Fish Density Estimates and Percentage Composition. ........................................................................................... 4-5
Table 27. Comparison of Observed ”Unidentified Cyprinids”1 (<75 mm) Yearly Densities and Water Year Types on the San Joaquin River 2008, 2010, 2011, 2012, and 2013. ............................................. 4-14
Table 28. Summary of Whitewater Boating Use: Video Monitoring and On-site Boating Counts Schedule Flow Release August 18, 2013. ............ 5-17
Copyright 2013 by Southern California Edison Company vii Draft 2013

Draft NASMP and AMP – Big Creek No. 4 Hydroelectric Project, FERC No. 2017 2013 Data Collection Report
LIST OF FIGURES Page
Figure 1. Location Map. ......................................................................................... 1-2
Figure 2. Map of the Vicinity of the Big Creek No. 4 Project. ................................. 1-3
Figure 3. Winter 2012-2013 Water Temperature Data Collection Sites. ................ 2-2
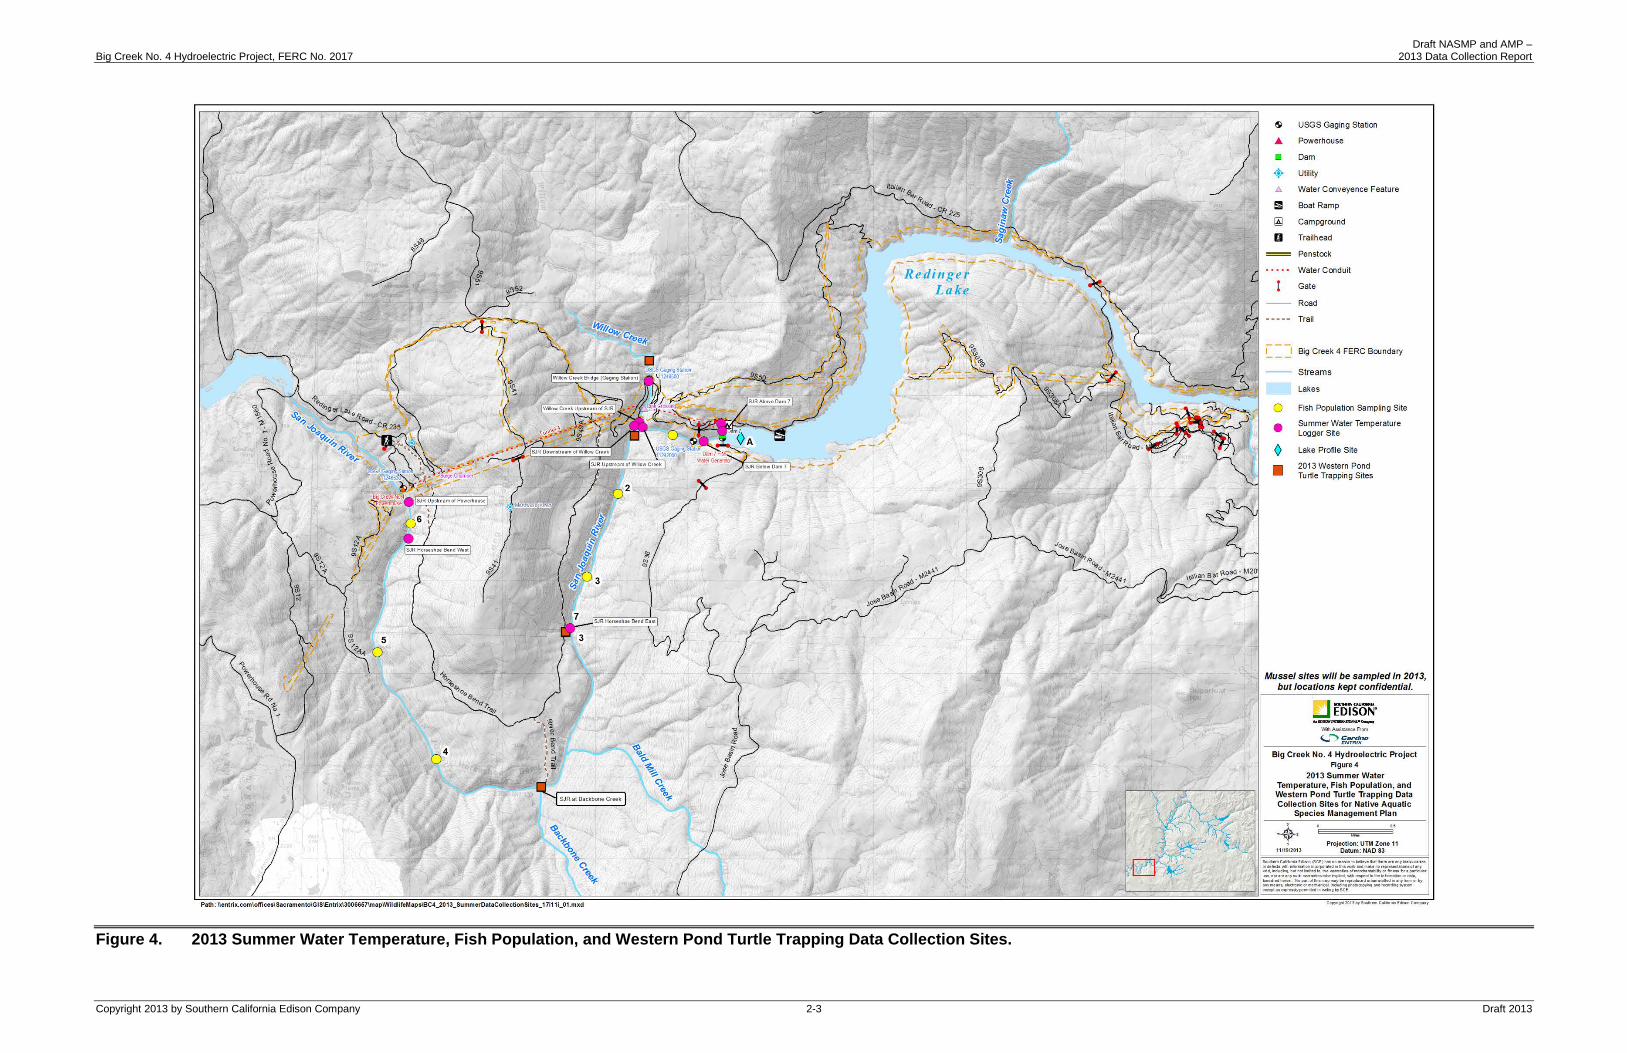
Figure 4. 2013 Summer Water Temperature, Fish Population, and Western Pond Turtle Trapping Data Collection Sites. ............................. 2-3
Figure 5. 2013 Out-of-season Experimental Whitewater Flows Releases, Displacement and Stranding Survey Locations for the Adaptive Management Plan. .................................................................................. 2-7
Figure 6. Mean Daily Overwinter Temperatures in the San Joaquin River and Willow Creek with Flows in the San Joaquin River, 2012–2013. ....................................................................................................... 3-6
Figure 7. Mean Daily Overwinter Temperatures and Flows in Willow Creek, 2012-2013. .................................................................................. 3-7
Figure 8. Mean Daily Spring-Summer Temperatures and Flows in the San Joaquin River, May 1 through October 31, 2013. ................................... 3-8
Figure 9. Mean Daily Spring-Summer Temperature and Flows in Willow Creek, May 1 through October 31, 2013. ................................................ 3-9
Figure 10. Redinger Lake Water Temperature Profile for Sites A, 2013. ............... 3-11
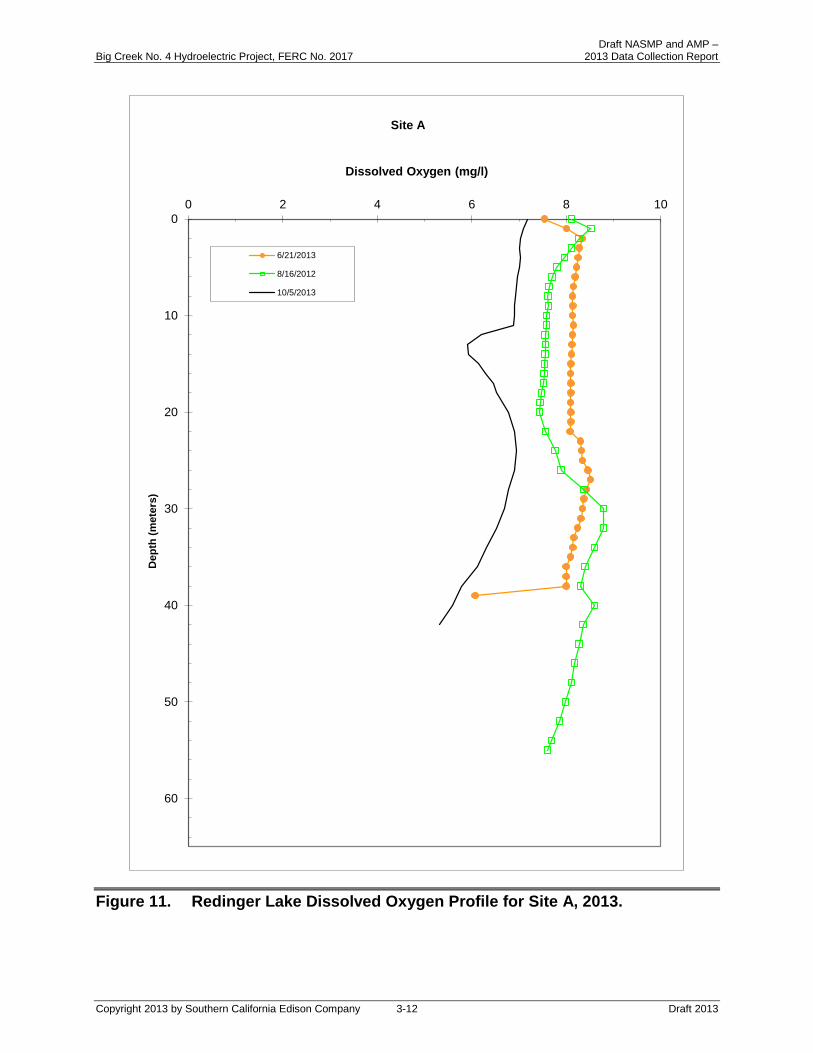
Figure 11. Redinger Lake Dissolved Oxygen Profile for Site A, 2013. ................... 3-12
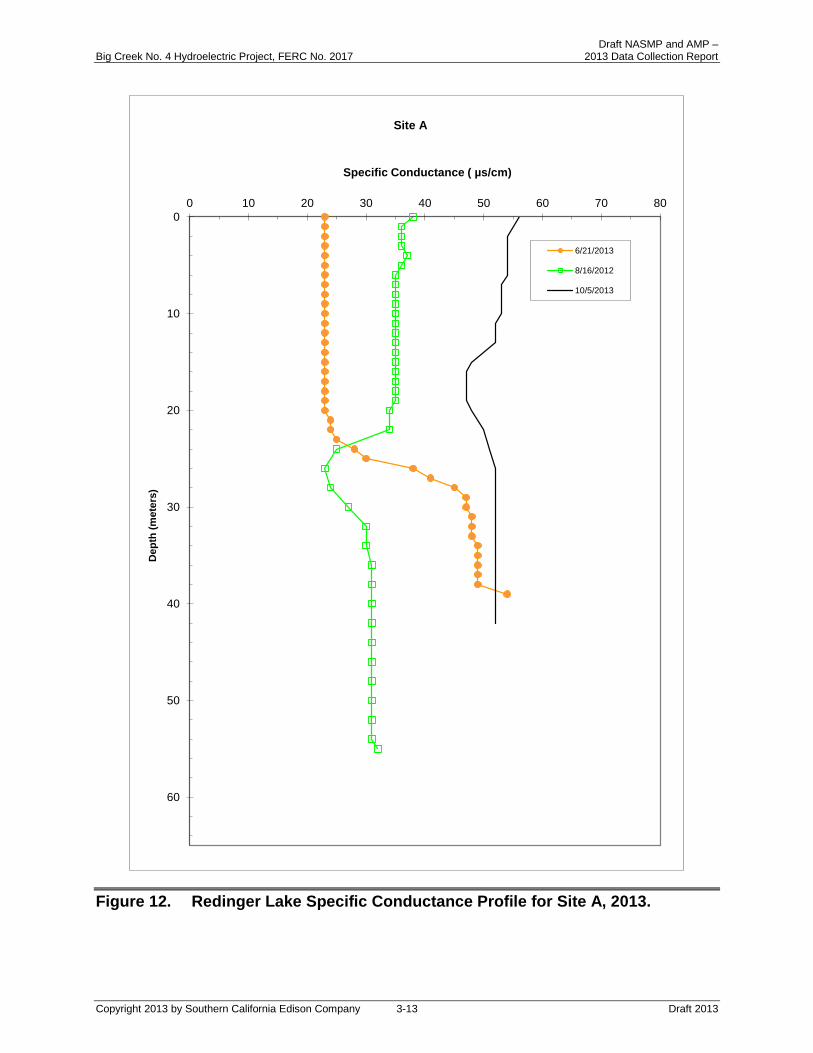
Figure 12. Redinger Lake Specific Conductance Profile for Site A, 2013. ............. 3-13
Figure 13. The Effect of Out-of-season Experimental Whitewater Flow Release on Water Temperature in the Horseshoe Bend Reach of the San Joaquin River, at Six Sites between August 18 and August 19, 2013. ................................................................................... 3-15
Figure 14. The Effect of Out-of-season Experimental Whitewater Flow Release on Water Temperature in the Horseshoe Bend Reach of the San Joaquin River, at Six Sites between September 8 and September 9, 2013. ...................................................................... 3-17
Copyright 2013 by Southern California Edison Company viii Draft 2013

Draft NASMP and AMP – Big Creek No. 4 Hydroelectric Project, FERC No. 2017 2013 Data Collection Report
Figure 15. Fish Movement and Displacement in Response to the First and Second Out-of-season Experimental Whitewater Flow Releases, as Determined from Radio Tracking for Hardhead No. 7. .................................................................................................... 3-28
Figure 16. Fish Movement and Displacement in Response to the First and Second Out-of-season Experimental Whitewater Flow Releases, as Determined from Radio Tracking for Hardhead No. 9. .................................................................................................... 3-29
Figure 17. Fish Movement and Displacement in Response to the First and Second Out-of-season Experimental Whitewater Flow Releases, as Determined from Radio Tracking for Hardhead No. 10. .................................................................................................. 3-30
Figure 18. Fish Displacement Monitoring for Hardhead and “Unidentified Cyprinids” by Site for Both Flow Releases, 2013. ................................. 3-31
Figure 19. Fish Displacement Monitoring for Sacramento Pikeminnow by Site for Both Flow Releases, 2013. ....................................................... 3-32
Figure 20. Fish Displacement Monitoring for Sacramento Sucker by Site for Both Flow Releases, 2013. ................................................................... 3-33
Figure 21. Fish Displacement Monitoring for Rainbow Trout by Site for Both Flow Releases, 2013. ................................................................... 3-34
Figure 22. Fish Displacement Monitoring for Spotted Bass by Site for Both Flow Releases, 2013. ........................................................................... 3-35
Figure 23. Fish Larvae Captured by Dip Net Before and After First Out-of-season Experimental Whitewater Flow Release for Each Site, August 2013. ......................................................................................... 3-41
Figure 24. Fish Larvae Captured by Dip Net Before and After Second Out-of-season Experimental Whitewater Flow Release for Each Site, September 2013. .................................................................................. 3-42
Figure 25. Dry Channel in Backbone Creek in July during the 2013 VES. ............. 3-48
Figure 26. Suitable Western Pond Turtle habitat in Willow Creek. ......................... 3-48
Figure 27. Site 5 Mussel Cluster Locations Anchored Beneath Boulders. ............. 3-51
Figure 28. Species Composition – Electroshocking and Snorkel Data not including “Unidentified Cyprinids,” 2013................................................ 3-56
Figure 29. Species Composition for All Sites in 2013 based on Snorkeling. .......... 3-57
Copyright 2013 by Southern California Edison Company ix Draft 2013

Draft NASMP and AMP – Big Creek No. 4 Hydroelectric Project, FERC No. 2017 2013 Data Collection Report
Figure 30. Species Composition by Site based on Snorkeling Observations (not including “Unidentified Cyprinids”), 2013. ...................................... 3-64
Figure 31. Species Composition by Site based on Electrofishing Surveys, 2013. ..................................................................................................... 3-65
Figure 32. Length Frequency of “Unidentified Cyprinids” Observed by Snorkeling, All Sites Combined, October 2013 (*Young of the Year hardhead and Sacramento pikeminnow. **Yearling hardhead and Sacramento pikeminnow). ............................................. 3-66
Figure 33. Length Frequency of Hardhead Observed by Snorkeling, All Sites Combined, October 2013 (not showing ”Unidentified Cyprinids”) (*Hardhead in this age category are included in the Unidentified Cyprinid data). ................................................................... 3-67
Figure 34. Length Frequency of Sacramento Pikeminnow Observed by Snorkeling, All Sites Combined, October 2013 (*Sacramento pikeminnow in this age category are included in the “Unidentified Cyprinid” data). ................................................................ 3-68
Figure 35. Length Frequency of Sacramento Sucker Observed by Snorkeling, All Sites Combined, October 2013. .................................... 3-69
Figure 36. Comparison of Hardhead Length Frequencies for 2010-2013. ............. 4-10
Figure 37. Comparison of Sacramento Sucker Length Frequencies for 2010-2013. ............................................................................................ 4-11
Figure 38. Comparison of Sacramento Pikeminnow Length Frequencies for 2010-2013. ............................................................................................ 4-12
Copyright 2013 by Southern California Edison Company x Draft 2013

Draft NASMP and AMP – Big Creek No. 4 Hydroelectric Project, FERC No. 2017 2013 Data Collection Report
LIST OF ACRONYMS/ABBREVIATIONS
°C degrees Celsius
AMP Adaptive Management Plan
BC4 Big Creek No. 4
cfs cubic feet per second
cm centimeter(s)
cm/sec centimeters per second
DO dissolved oxygen
FERC Federal Energy Regulatory Commission
FYLF Foothill Yellow-Legged Frog
ft foot
g gram(s)
GPS Global Positioning System
HSB Horseshoe Bend
km kilometer(s)
m meter(s)
mg/l milligrams per liter
mm millimeter(s)
msl mean sea level
NASMP Native Aquatic Species Management Plan
PH4 Big Creek Powerhouse 4
SC Specific Conductance
SCE Southern California Edison Company
SJR San Joaquin River
Copyright 2013 by Southern California Edison Company xi Draft 2013

Draft NASMP and AMP – Big Creek No. 4 Hydroelectric Project, FERC No. 2017 2013 Data Collection Report
State Water Board State Water Resources Control Board
TRG Technical Review Group
USDA-FS United States Department of Agriculture - Forest Service
USGS United States Geological Survey
UTM Universal Transverse Mercator
VES Visual Encounter Surveys
WPT Western Pond Turtle
Copyright 2013 by Southern California Edison Company xii Draft 2013

Draft NASMP and AMP – Big Creek No. 4 Hydroelectric Project, FERC No. 2017 2013 Data Collection Report
EXECUTIVE SUMMARY
This report summarizes the results of the first year of studies to evaluate the effects of out-of-season experimental whitewater flow releases to the native aquatic species of the Horseshoe Bend (HSB) reach of the San Joaquin River under the Adaptive Management Plan (AMP) and Native Aquatic Species Management Plan (NASMP). In addition, this report summarizes and compares the monitoring data for native fish, western pond turtle, and mollusc populations collected in 2013 to previous years’ baseline data collected under the NASMP.
The NASMP management area includes Redinger Lake and the San Joaquin River (SJR) between Dam 7 and Big Creek Powerhouse 4 (PH4), also known as the HSB reach. Under the AMP, Water Year 2013 was characterized as a non-spill year similar to Water Year 2012, also a non-spill year.
The studies included biological monitoring to: (1) evaluate the effect of out-of-season experimental whitewater flow releases to the native aquatic species of the HSB based on before and after flow release monitoring; and (2) determine status of the native aquatic species and whether they remain in “good condition.” The following summarizes the physical and biological conditions observed during the 2013 studies.
Out-of-season Experimental Whitewater Flow Releases
Two out-of-season experimental whitewater flow releases were conducted in August and in early September.
Physical Conditions during Out-of-season Experimental Whitewater Flow Releases:
• During the August release, the peak flow was 1,670 cfs and the average ramp up and ramp down rates were 200 cfs/hr and 167 cfs/hr, respectively.
• During the September release, the peak flow was 1,750 cfs and the average ramp up and ramp down rates were 170 cfs/hr and 130 cfs/hr, respectively.
Western Pond Turtle Displacement:
• Ten adult and three juvenile western pond turtles (Emys marmorata) were tracked before and after each release to determine potential displacement. No displacement was detected for adult turtles. One juvenile turtle appeared to be displaced a short distance.
Stranding:
• Overall, little stranding of fish and amphibians was observed.
Copyright 2013 by Southern California Edison Company xiii Draft 2013

Draft NASMP and AMP – Big Creek No. 4 Hydroelectric Project, FERC No. 2017 2013 Data Collection Report
Fish Displacement:
• Ten adult hardhead (Mylopharodon conocephalus) were tracked before and after each release to determine potential displacement. Little downstream displacement was observed.
• Snorkeling surveys indicate that there were changes in the numbers of fish from before to after each of the whitewater releases. Changes varied by species, site, and lifestage.
• Study results indicate that there was downstream displacement of juvenile fish, particularly “unidentified cyprinids,” which consist of mostly hardhead and some Sacramento pikeminnow.
• Larval fish collections were too low to determine trends.
Status of Native Aquatic Species
Western Pond Turtle:
• There were 41 captures of 28 different WPTs in 2013. Ten turtles were recaptures from previous years. There were two recaptures from turtles originally captured during 2010, two from 2011, and six from 2012. Eighteen turtles were new captures and marked (notched) in 2013.
• All the turtles appeared to be in good health.
Mollusc:
• Three sites were evaluated for the presence of western pearlshell (Margaritifera falcata) mussels. Mussel densities were comparable to previous years.
Fish:
• The native fish community is in good health and densities generally fell within the range of current and historical monitoring over a 26-year period.
• There was less recruitment of young of the year minnows and Sacramento suckers than expected.
Whitewater Boating Monitoring:
• SCE installed a video monitoring system at Big Creek Powerhouse No. 4 to monitor whitewater boating use in the Horseshoe Bend Reach. As required by the AMP, SCE successfully verified the accuracy of the video monitoring system through on-site boat counts.
Copyright 2013 by Southern California Edison Company xiv Draft 2013
Draft NASMP and AMP – Big Creek No. 4 Hydroelectric Project, FERC No. 2017 2013 Data Collection Report
1.0 INTRODUCTION
1.1 STUDY AREA DESCRIPTION
The Management Area is located in the foothills on the western slope of the Sierra Nevada Mountains, approximately 26 miles northeast of the City of Fresno, California (Figure 1). A dominant feature of the Management Area is the Big Creek No. 4 (BC4) Hydroelectric Project owned and operated by Southern California Edison Company (SCE). The major components of the Project consist of Dam 7; a water conveyance system, which includes a tunnel, conduit and a penstock; and Big Creek Powerhouse 4 (PH4). The Management Area includes (1) Redinger Lake; (2) the San Joaquin River (SJR) downstream from Redinger Lake to the tailrace of PH4, also known as the Horseshoe Bend (HSB) reach; and (3) lower portions of tributary streams (Willow Creek and Backbone Creek flowing into the SJR). The Management Area is situated in an 11.55-mile (18.6-kilometer [km]) long, narrow canyon at elevations ranging between 985 feet (ft) above mean sea level (msl) at PH4 to 1,414 ft above msl at Redinger Lake (Figure 2). The surrounding hillsides and canyon walls rise quickly from the river canyon to an elevation between approximately 2,500 and 3,000 ft (762 meters (m) and 914 m).
1.2 2013 DATA COLLECTION OBJECTIVES
During 2013, data collection was completed consistent with the Native Aquatic Species Management Plan (NASMP) and the Adaptive Management Plan (AMP) objectives. The monitoring objectives were identified in the Fourth-Year Proposal NASMP and AMP (SCE 2013a), which was prepared in consultation with the Technical Review Group (TRG), approved by the United States Department of Agriculture - Forest Service (USDA-FS) and State Water Resources Control Board (State Water Board), and subsequently filed with the Federal Energy Regulatory Commission (FERC).
For 2013, biological monitoring consisted of two components:
• Evaluate the effect of out-of-season experimental whitewater flow releases on the native aquatic species of the HSB reach; and
• Determine the status of the native aquatic species.
Copyright 2013 by Southern California Edison Company 1-1 Draft 2013

Draft NASMP and AMP – Big Creek No. 4 Hydroelectric Project, FERC No. 2017 2013 Data Collection Report
Figure 1. Location Map.
Copyright 2013 by Southern California Edison Company 1-2 Draft 2013

Draft NASMP and AMP – Big Creek No. 4 Hydroelectric Project, FERC No. 2017 2013 Data Collection Report
Figure 2. Map of the Vicinity of the Big Creek No. 4 Project.
Copyright 2013 by Southern California Edison Company 1-3 Draft 2013

Draft NASMP and AMP – Big Creek No. 4 Hydroelectric Project, FERC No. 2017 2013 Data Collection Report
The AMP requires that out-of-season experimental whitewater flow releases be provided in a spill and a non-spill year and that data are collected prior to and subsequent to each of the releases. Year 2013 was a non-spill year. Two out-of-season experimental whitewater flow releases were provided in 2013. The first release was originally scheduled for August 4 and the second for August 18, 2013. The first release was re-scheduled for August 18 due to the Aspen Fire that occurred near the Management Area, which made flight operations to access the sampling sites unsafe due to smoky conditions (Allen 2013a). The first release was made on August 18, 2013, with ramp down occurring on August 19. The second release was then planned to occur on August 25 or September 1, however, smoky conditions resulted in an additional delay and the second release took place on September 8, 2013, with ramp down on September 9 (Allen 2013b).
1.3 2013 PHYSICAL DATA MONITORING OBJECTIVES
1.3.1 2013 PHYSICAL DATA MONITORING
The objectives for physical data collection in 2013 included the following:
• Monitor water temperatures in the SJR between Dam 7 and PH4, as well as lower Willow Creek;
- Collect overwinter water temperatures in the SJR between Dam 7 and PH4, and lower Willow Creek from November 2012 through April 2013 at four sites to characterize winter and spring water temperatures conditions;
- Collect summer-fall water temperatures at six sites in the SJR between Dam 7 and PH4 and two sites in lower Willow Creek from May 1 to October 31, 2013;
• Monitor water temperature, dissolved oxygen (DO), and specific conductance (SC) profiles in Redinger Lake during June, August, and October;
• Monitor air temperature and relative humidity at Dam 7;
- Collect air temperature and relative humidity at Dam 7 for the summer-fall period; and
• Characterize flow in the SJR and in lower Willow Creek.
Each of these objectives was met.
Copyright 2013 by Southern California Edison Company 1-4 Draft 2013

Draft NASMP and AMP – Big Creek No. 4 Hydroelectric Project, FERC No. 2017 2013 Data Collection Report
1.3.2 PHYSICAL DATA MONITORING DURING OUT-OF-SEASON EXPERIMENTAL WHITEWATER FLOW RELEASES
The objectives of monitoring of physical data during out-of-season experimental whitewater flow releases were to:
• Monitor the flows that occurred during the releases;
• Characterize the ramp up and ramp down rates for each release; and
• Evaluate water temperatures during the releases.
Each of these objectives was met.
1.4 BIOLOGICAL MONITORING DURING OUT-OF-SEASON EXPERIMENTAL WHITEWATER FLOW RELEASES OBJECTIVES
The objectives for monitoring the biological effects of out-of-season experimental whitewater flow releases consisted of assessing the displacement of western pond turtles (WPT) and fish and the stranding of native aquatic biota. An additional objective was to identify the overall effects of the releases on the status/health of the fish community. These objectives were met.
Copyright 2013 by Southern California Edison Company 1-5 Draft 2013

Draft NASMP and AMP – Big Creek No. 4 Hydroelectric Project, FERC No. 2017 2013 Data Collection Report
2.0 METHODS
2.1 PHYSICAL DATA
2.1.1 STREAM FLOW
The BC4 Project diverts water from an approximately 6.3-mile stretch of the SJR between Redinger Lake and PH4. Instream flows are monitored downstream of Dam 7 and in Willow Creek near the mouth by stream gages (United States Geological Survey [USGS] Gage Nos. 11242000 and 11246500, respectively) operated by SCE. Provisional daily mean flow data for Water Year 2013 provided by SCE were used for this report. As shown in Figure 2, USGS Gage No. 11241950 records lake levels in Redinger Lake.
2.1.2 AIR TEMPERATURE
Air temperature and relative humidity were recorded between May 1 and October 31, 2013 adjacent to Dam 7. A HOBO air temperature and relative humidity recorder was installed at this location and functioned normally throughout the monitoring period.
2.1.3 WATER TEMPERATURE
2.1.3.1 Water Temperature Locations
Water temperature recorders were installed and operated at four locations in the SJR and one in Willow Creek from November 1, 2012 through April 30, 2013 to characterize overwinter water temperature conditions in the same locations as past studies (SCE 2009b). Water temperature monitoring locations are shown in Figure 3 for the overwinter data collection period.
Water temperatures were also monitored from May 1 to October 31, 2013 at nine sites to characterize summer 2013 conditions. Figure 4 shows the locations monitored during the summer period. The water temperature monitoring sites and serial numbers for the temperature loggers used are identified in Table 1.
In 2013, temperature profiles were measured in Redinger Lake during June, August, and October at one location near Dam 7, the deepest area of the lake. The location of this temperature profile station in Redinger Lake is shown in Figure 4.
Copyright 2013 by Southern California Edison Company 2-1 Draft 2013

Draft NASMP and AMP – Big Creek No. 4 Hydroelectric Project, FERC No. 2017 2013 Data Collection Report
Figure 3. Winter 2012-2013 Water Temperature Data Collection Sites.
Copyright 2013 by Southern California Edison Company 2-2 Draft 2013
Draft NASMP and AMP – Big Creek No. 4 Hydroelectric Project, FERC No. 2017 2013 Data Collection Report
Figure 4. 2013 Summer Water Temperature, Fish Population, and Western Pond Turtle Trapping Data Collection Sites.
Copyright 2013 by Southern California Edison Company 2-3 Draft 2013

Draft NASMP and AMP – Big Creek No. 4 Hydroelectric Project, FERC No. 2017 2013 Data Collection Report
Table 1. Summer and Winter Water Temperature Monitoring Locations and Unit Serial Numbers (2012-2013).
Physical Location
GPS Coordinates (UTM Zone 11S NAD 83, Meters)
Unit A (Serial No.)
Unit B (Serial No.)
Summer Monitoring
Sites (X)
Winter Monitoring
Sites (X)
SJR Above Dam 7 (Redinger Lake) 0282287/4113819 10035067 10015850 X
SJR Below Dam 7 / (USGS Gage site) 0281956/4113704 10035072 10035070 X X
SJR Upstream of Willow Creek 0281429/4113858 10127656 10035071 X X
SJR Downstream of Willow Creek 0281337/4113847 2306279 2306274 X
SJR Horseshoe Bend East (approximately 1.5 miles downstream of Willow Creek confluence) 0280643/4111691 10127657 10127660 X
SJR Horseshoe Bend West (approximately 0.5 miles upstream of PH4) 0278902/4112654 2306267 2306273 X
SJR Upstream of Powerhouse (approximately 0.1 miles upstream of PH4) 0278905/4113049 2306276 2306272 X X
Willow Creek Upstream of San Joaquin River 0281393/4113915 9701214 10127659 X
Willow Creek Bridge (Gauging Station) 0281493/4114357 2306278 10127658 X X
Copyright 2013 by Southern California Edison Company 2-4 Draft 2013

Draft NASMP and AMP – Big Creek No. 4 Hydroelectric Project, FERC No. 2017 2013 Data Collection Report
2.1.3.2 Water Temperature Recorders
Stream water temperatures in the SJR were recorded at hourly intervals using Onset temperature recorders over the winter of 2012–2013 and at 10-minute intervals from May 1 to October 31, 2013. Redundant recorders were installed at all locations. Each recorder was checked for proper function within seven days of being placed in operation. A calibration check was made by measuring water temperature at the location of the instrument transducer with a calibrated thermometer. The date, time, and temperature were recorded at each location and compared to the corresponding temperature measured by the electronic recorder. Recorders were well hidden and examined for evidence of tampering during checks. Water temperature loggers and the meteorology station were checked periodically to reduce potential data loss from equipment malfunction and tampering. The data were downloaded onto a laptop computer and exported to spreadsheets for analysis. Daily mean, maximum, and minimum temperatures were calculated.
Temperature loggers were operated at all four overwinter sites (Figure 3) during the 2012-2013 overwinter period without data loss.
During the summer-fall monitoring period, May to October 2013, all temperature loggers in the San Joaquin River downstream of Dam 7 (Figure 4) operated without data loss. However, temperature data from Redinger Lake at Dam 7 (SJR above Dam 7) were lost between September 29 and October 31 due to the loggers becoming exposed to air, as the elevation of the reservoir water surface dropped below the elevation of the loggers.
2.1.3.3 Redinger Lake Profiles
To characterize Redinger Lake conditions, temperature, DO, and SC vertical profile measurements were taken from a boat in late spring, summer, and fall (June 21, August 23, and October 4, 2013, respectively). The profiles were taken near Dam 7, which is the deepest area of the lake (Figure 4, Site A). Profile data were collected using a YSI 600-XLM DO/temperature meter and recorded at one meter (3.3 ft) increments.
2.1.4 PHYSICAL CONDITIONS DURING OUT-OF-SEASON EXPERIMENTAL WHITEWATER FLOW RELEASES
SCE recorded flow in the SJR above Willow Creek and in Willow Creek prior to, during, and after the August 18 and September 8, 2013 out-of-season experimental whitewater flow releases. These data were used to evaluate the average, maximum and minimum ramp up rates, flow release between 10 AM and 4 PM on the day of the release, and ramp down rates. Water temperatures were characterized during the flow releases. Data were tabulated and plotted.
Copyright 2013 by Southern California Edison Company 2-5 Draft 2013

Draft NASMP and AMP – Big Creek No. 4 Hydroelectric Project, FERC No. 2017 2013 Data Collection Report
2.2 MONITORING OF BIOLOGICAL EFFECTS OF OUT-OF-SEASON EXPERIMENTAL WHITEWATER FLOW RELEASES
2.2.1 DISPLACEMENT MONITORING
Displacement monitoring included monitoring the abundance of native aquatic species before and after each out-of-season experimental whitewater flow release in four fish population sampling sites, and tracking the movement of radio tagged hardhead and WPTs. The purpose is to determine if the flow releases resulted in movement or transport of the aquatic species.
2.2.1.1 Western Pond Turtle Displacement
2.2.1.2 Methods
Radio Tagging of WPTs Two to three baited standard turtle traps (SCE 2009b) were installed at three study sites located on SJR at the confluences with Willow and Backbone creeks and the HSB reach east summer temperature monitoring site (Figure 5) to collect turtles for the installation of radio tags. Two to three additional traps of a smaller design also were deployed at the mouths of Willow and Backbone creeks in the confluence pools in shallow, slow, and warm water with emergent cover, the preferred habitat of juvenile turtles (Reese 1986). The additional traps for juveniles had trap entrances of less than 7 centimeters (cm) so that reproductively viable (larger) turtles were excluded from entering the traps.
Prior to the out-of-season experimental flow releases, three events of up to one week of trapping were conducted to radio tag WPTs. Collapsible nylon net traps were staked or tied in water of sufficient depth to submerge the entries. These traps were only operated during the day, when they could be attended. Floating traps were operated and baited during the day and operated at night. These traps were checked during the day on the same schedule as the nylon net traps, but were left in place to trap at night and checked the following morning. Visual Encounter Surveys (VES) for juvenile WPTs was performed near trapping sites and in flowing tributaries in conjunction with trapping.
Radio tags were attached to the carapaces of 10 adult and three juvenile WPTs in 2013. Radio tags were equipped with internal helical antennae and had an expected battery life of approximately six weeks to two months, depending upon tag size and use (for juvenile or adult WPTs). Due to a delay in the second release flow, the battery life for some tags was exceeded. Tags for juvenile WPTs weighed less than one gram (g) and comprised less than one percent of the body weight of yearling and older juvenile turtles. Radio tags were attached to the carapace over the right shoulder on of WPTs with the moldable surfboard epoxy (Board Dough) textured with sand and colored black (Rathbun et al. 2002). WPTs were tracked within 24-48 hours of the flow releases from the air and/or ground in conjunction with tracking of radio tagged adult hardhead.
Copyright 2013 by Southern California Edison Company 2-6 Draft 2013

Draft NASMP and AMP – Big Creek No. 4 Hydroelectric Project, FERC No. 2017 2013 Data Collection Report
Figure 5. 2013 Out-of-season Experimental Whitewater Flows Releases, Displacement and Stranding Survey Locations for the Adaptive Management Plan.
Copyright 2013 by Southern California Edison Company 2-7 Draft 2013

Draft NASMP and AMP – Big Creek No. 4 Hydroelectric Project, FERC No. 2017 2013 Data Collection Report
The location of each turtle was noted including global positioning system (GPS) coordinates. Biologists recorded data on physical habitat conditions at sites where tagged turtles were located prior to and after the flow releases.
2.2.1.3 Fish Displacement
Three methods were used to evaluate fish displacement: (1) hardhead radio tracking, (2) larval fish sampling, and (3) snorkel observations. Radio tracking provides direct evidence of displacement, if it occurs. Sampling and observation techniques for fish displacement are based on observing net changes in numbers of fish at sampling sites from before to after the out-of-season experimental whitewater flow releases. Large changes in numbers of fish present, particularly juvenile fish, are attributed to movement. Since juvenile fish, especially young of the year fish, have limited ability to swim upstream against currents, most movement of these fish is downstream, and if associated with a flow release, attributed to downstream displacement.
2.2.1.4 Methods
Hardhead Radio Tracking Ten adult hardhead were collected by hook and line, and radio tagged two to three weeks prior to the first release flow. A detailed methodology for hardhead capture and tagging, preparation for implanting tags, attaching external radio transmitters, data recorded and tracking methodology is provided by SCE (2009b) (also see Appendix A).
Data to be collected from each tagged hardhead included physical dimensions, condition, and location. Radio tagged hardhead were tracked by helicopter prior to each flow release and within 24-48 hours following return to prerelease flows. Monitoring of hardhead radio tags took place in conjunction with monitoring of radio tagged WPTs.
The location of each radio tagged hardhead was noted including GPS location before and after each flow releases.
Larval Fish Sampling Displacement of larval fish was assessed by deploying larval light traps and performing systematic dip netting before, and after each scheduled flow release. Four sites were sampled Willow Creek Confluence Pool (WCCP), Backbone Creek Confluence Pool (BCCP), and Fish Population Sampling Sites 5 and 6 (Figure 5). Larval sampling took place no more than 48 hours prior to each scheduled release and within 48 hours after the completion of the releases and return to pre-release flow levels. Detailed larval trapping methods are provided in Appendix A.
Snorkel Observations Displacement of juvenile and adult fish was assessed by snorkeling surveys, before and after each flow release at four sampling sites established during NASMP baseline studies. Fish Population Sampling Sites 3, 4, 5, and 6 were snorkeled by a team of at
Copyright 2013 by Southern California Edison Company 2-8 Draft 2013

Draft NASMP and AMP – Big Creek No. 4 Hydroelectric Project, FERC No. 2017 2013 Data Collection Report
least six fish biologists experienced at counting native fish (Figure 5). Detailed snorkeling methods are provided in Appendix A.
The Aspen fire that occurred during summer 2013 resulted in heavy smoke in the Project area and high levels of activity by numerous firefighting aircraft. Due to safety concerns, this resulted in a suspension of SCE flight operations. Suspension of SCE flight operations prevented access to sections of the HSB and suspension of data collection. This took place following the collection of snorkel data immediately following the first flow release, but before the second scheduled flow release. The suspension also resulted in a delay and rescheduling of the second release. Therefore, there was a longer period than planned, which occurred between sampling after the first release and sampling after the second release.
2.2.2 STRANDING STUDIES
2.2.2.1 Methods
The assessment of stranding was conducted through visual searches for stranded aquatic species. Sampling sites were divided into two groups, two sites with higher potential for stranding and two sites that are more representative of the HSB reach. The two sites selected for the stranding surveys with higher potential for stranding are the WCCP and BCCP areas (Figure 5). The two sites selected for the surveys that are representative of the reach are Fish Population Sampling Sites 4 and 5 (Figure 5).
Areas on both sides of the river were assessed for stranding. Study area sites were about 100 m in length and were inspected and documented prior to stranding studies. The areas were walked where possible or were surveyed using rafts. Photographs and GPS locations were recorded for each area that had the potential to trap or strand fish. The following characteristics were used to describe the areas examined for trapping or stranding:
Primary 1. Bed slope is generally less than four percent in any direction. 2. Pot holes, scour holes, and other trapping depressions (evident by temporary or
prolonged ponding as the water recedes).
Secondary 1. Debris piles. 2. General substrate texture on exposed surfaces (e.g., patches of predominantly
sand, fine gravel, coarse gravel, cobble, boulder, or bedrock). 3. Embeddedness on same surfaces (mapped as zero, 1-33 percent, 34-66
percent, 67-100 percent classes; reflects subsurface and surface stranding potential).
Copyright 2013 by Southern California Edison Company 2-9 Draft 2013

Draft NASMP and AMP – Big Creek No. 4 Hydroelectric Project, FERC No. 2017 2013 Data Collection Report
Field teams recorded locations where trapping and stranding occurred during down ramping; identified the number, species, lifestage, and size of fish, amphibians, and reptiles found stranded or trapped; and indicated mortalities or injuries.
In order to maximize the daylight hours available to monitor stranding safely, experimental whitewater flow releases were maintained until after sunrise on the day following each release. Down ramping and monitoring began after sunrise. Stranding observations were made during each hourly step of the ramp-down during daylight hours. At a downstream site, Fish Population Sampling Site 4, the site was inspected the following morning. This allowed the field team to assess whether any additional stranding occurred at the downstream site, in which the decrease of flow lagged upstream sites by several hours.
Surveyors randomly lifted surface cobbles to look for animals. Surveyors recorded for each search area, the area length and survey search time for each ramp-down event (approximately hourly). If encountered, representative photographs were taken to document stranded organisms, along with the time and date.
Stranded biota (if present) were characterized according to one of the following four categories:
1. Killed by direct stranding as the water level receded;
2. Trapped first as the water level receded and then stranded as the water subsequently percolated through the riverbed;
3. Dying, trapped biota found in micro-depressions or small pools still containing water; and
4. Biota found trapped in a relatively large pool with a water surface elevation, and is not expected to dry up for at least several days, or is permanent (e.g., bedrock scour pools).
If no stranded organisms were found for a time period or location, it was noted.
2.3 STATUS OF NATIVE AQUATIC SPECIES
The overall approach to collecting data and assessing the status of the native aquatic species was to collect data using the same methodology used during the baseline studies. The data collection consisted of characterizing WPT populations, freshwater mussel populations, and fish populations and community composition.
2.3.1 WESTERN POND TURTLE
WPT population abundance and population structure were assessed based on trapping and marking turtles, which included data collected prior to the out-of-season experimental whitewater flow releases and trapping conducted after the flow releases were completed in September. Data for the studies were obtained during three trapping
Copyright 2013 by Southern California Edison Company 2-10 Draft 2013

Draft NASMP and AMP – Big Creek No. 4 Hydroelectric Project, FERC No. 2017 2013 Data Collection Report
events. These were scheduled at least one to two weeks apart to allow sufficient time for the population to recover from investigator-caused disturbances. The WPT capture methodology used for this study was the same as used during the baseline studies.
2.3.1.1 Abundance and Population Structure Surveys
Two to three traps were installed at each of the three study sites located on SJR at the confluences with Willow and Backbone Creeks, and the HSB reach east summer temperature monitoring site (Figure 4). Trapping was conducted at each trapping site on multiple occasions by deploying collapsible nylon net traps that were staked or tied in water of sufficient depth to submerge the entries. The turtle traps were baited with sardines, set in the morning, and checked at least once every two hours during the day (i.e. trapping day). Floating traps were operated and baited during the day and checked on the same schedule as the nylon net traps, and were left in place to trap at night and checked the following morning. Traps for capture of juvenile turtles also were set close to each site. These traps consisted of small mesh floating traps with restricted entry widths to prevent capture of larger turtles. Juvenile traps were set in habitat preferentially used by juveniles at each site. Trapping data included date, time, crew, location, general water and weather conditions, sex, determination if females are gravid, weight, age, and maximum carapace length, height, width, external signs of disease and lesions and photographs of each individual turtle captured or recaptured. Age was estimated by counting annuli on one or more scutes of the plastron and/or carapace (Bury and Germano 1998). Captured turtles were individually marked with a numerical identification code, notched into the marginal scutes, and released at the point of capture (adapted from Holland 1994) as a means to document movement of individuals.
Habitat Characterization WPT habitat was characterized using methods previously reported (SCE 2009a) and based on descriptions by Abel (2010). Aquatic habitat for WPTs is addressed in this section.
Aquatic habitat for WPTs was characterized based on literature descriptions as follows: adult turtles require habitat with slow-moving water that is moderately deep (1 m (3.3 ft) to 1.5 m (4.9 ft)), secure basking sites (i.e., rocks, logs, etc. with immediate access to deep water, undercut banks, or other submerged refuges) and abundant aquatic invertebrate and plant forage. Basking generally increases in frequency throughout the spring and peaks in June, followed by a decline throughout the summer (Holland 1994). Hatchlings (individuals less than one year old) require shallow water, less than 0.3 m (1 ft) with adjacent dense submerged or emergent vegetation for refuge (Jennings and Hayes 1994), which are found in streams such as Willow Creek. Like many aquatic emydid turtles, WPTs can swallow food only under water, so they are restricted to aquatic habitat for all foraging.
Copyright 2013 by Southern California Edison Company 2-11 Draft 2013

Draft NASMP and AMP – Big Creek No. 4 Hydroelectric Project, FERC No. 2017 2013 Data Collection Report
2.3.2 MOLLUSCS
Mussel surveys were conducted in the HSB Reach of the SJR during September 17–18, 2013 after the conclusion of out-of-season experimental whitewater flow releases. The three locations where mussels were surveyed in 2012 were resurveyed in 2013. The locations of mussels are kept confidential at the request of the Native Americans.
Two surveyors searched the three sites where western pearlshell (Margaritifera falcata) mussels had been observed during the 2010, 2011, and 2012 surveys. A series of five transects were established at two mussel sampling sites where continuous mussel bed were present. Ten transects were used at the third site where the mussel beds were discontinuous. Three of the five additional transects were located in the high-density area and two were located in the low-density area. The increase in survey effort was necessary to estimate mussel abundance more accurately. The monitoring method is a modification of the two-phase approach of Villella and Smith (2005). The two-phase approach is used to locate concentrations of mussels using timed-effort. This is followed by sampling high and low density areas to derive a quantitative density estimate.
Each transect was sampled using 10 0.25 m² quadrats along each transect. During each survey, data were collected at each location where molluscs were found. Areas in the vicinity of each site were also examined to identify the presence of any concentrations of mussels not previously found.
Data included species, number, and size of individuals, depth, and water temperature. Water velocities were measured at the substrate where the molluscs were found. Percentages of dominant and subdominant substrates were visually estimated within a 1 m diameter circle at each site. GPS coordinates were recorded and photographs taken of representative habitats.
2.3.3 FISH
Fish monitoring components to characterize the status of SJR fish populations and community characteristics are discussed below.
2.3.3.1 Fish Populations
Field Methods Fish population sampling was conducted according to the methods of the NASMP (SCE 2009b) and as implemented in the baseline data collections (SCE 2013b, Appendix A). Information collected as part of baseline monitoring, as well as information from previous studies in the HSB reach (BioSystems 1987, SCE 1997, SCE 2009a, b) was used for comparisons, to the extent appropriate.
Fish sampling was conducted during September 30 to October 4, 2013 in the HSB reach at six sampling locations (Figure 4) used in previous studies (BioSystems 1987; SCE 1997, SCE 2009a, b, SCE 2011, and SCE 2012a) and identified in the NASMP. Data were collected after the conclusion of scheduled out-of-season experimental
Copyright 2013 by Southern California Edison Company 2-12 Draft 2013

Draft NASMP and AMP – Big Creek No. 4 Hydroelectric Project, FERC No. 2017 2013 Data Collection Report
whitewater flow releases. Snorkel survey sites were selected at each of the fish sampling locations. Visual (snorkel) surveys were conducted in deeper water. Deep water (pools and deep runs) was visually surveyed at a similar length or to the end of the habitat unit being surveyed. This methodology was the same employed for snorkel surveys associated with fish displacement studies.
Small cyprinids in large schools that could not be adequately identified during snorkel surveys as either hardhead or Sacramento pikeminnow during snorkeling were classified as “unidentified minnows.” Captures were made using cast nets to sample the relative composition of portions of these “unidentified cyprinids” and obtain information on the relative abundance of the species present. The captures enable the survey crews to distinguish between small Sacramento pikeminnow and hardhead.
Quantitative fish population surveys were conducted at sampling locations by electrofishing shallower riffle habitats. Multiple pass removal population estimates were made. All fish species present were identified to species and life stage, and abundance was estimated.
Electrofishing sampling enabled the collection of data on fish length, weight, and scales. From these, information on standing crop, and condition factors were analyzed. Observation of collected fish provided information on disease or injury, if present.
The detailed methods are presented in Appendix A.
Copyright 2013 by Southern California Edison Company 2-13 Draft 2013

Draft NASMP and AMP – Big Creek No. 4 Hydroelectric Project, FERC No. 2017 2013 Data Collection Report
3.0 RESULTS
3.1 PHYSICAL DATA
3.1.1 STREAM FLOW
Water Year 2013 in the San Joaquin Valley was classified as a critical water year (CDWR 2013a). Daily mean flows in the SJR downstream of Dam 7 during the winter months ranged between 40 and 60 cubic feet per second (cfs) (Appendix B). A minor spill occurred between December 7 and 18 with flow below Dam 7 increasing to a daily mean of 563 cfs on December 10 and an average flow of 458 cfs over the eleven-day spill period. The monthly mean flow for the SJR downstream of Dam 7 ranged from 42 cfs to 58 cfs, not including December (Table 2). The mean flow for December was 190 cfs.
Monthly mean flows in Willow Creek increased from 11 cfs in November up to 36 cfs in December. Mean flows in January through April 2013 were similar with a range of 15 to 21 cfs (Table 2).
Daily mean summer flows in the SJR downstream of Dam 7 between May 1 and October 31 ranged between 40 and 60 cfs with the exception of a 567 cfs spill on May 18. Due to the short duration and low magnitude of the spill, Water Year 2013 was classified as a non-spill year for the purposes of the AMP and NASMP. Summer flows included the two out-of-season experimental whitewater flow releases in August and September, which influenced the monthly mean flows. Table 3 presents the monthly mean flows for summer 2013. The first out-of-season experimental whitewater flow release occurred on August 18 and 19 while the second release occurred on September 8 and 9. Daily mean flow during the August release ramped up from 43 cfs on August 17 to 1,279 cfs on August 18, and ramped down to 43 cfs on August 19. Daily mean flow during the September release ramped up from 59 cfs on September 7 to 1,323 cfs on September 8, and ramped down to 63 cfs on September 8. The scheduled out-of-season experimental whitewater flow releases are described in detail in Section 3.2.
The average monthly flow in the SJR upstream of Willow Creek ranged from 44 to 63 cfs in the months without out of season experimental whitewater flow releases. The mean monthly flows for the same reach in August and September were 110 and 131 cfs, respectively. The average monthly flow for Willow Creek during the monitoring period decreased from seven cfs in May and June, down to 3 cfs in July and one cfs in August and September (Table 3).
Copyright 2013 by Southern California Edison Company 3-1 Draft 2013

Draft NASMP and AMP – Big Creek No. 4 Hydroelectric Project, FERC No. 2017 2013 Data Collection Report
Table 2. Monthly Mean, Minimum, and Maximum Water Temperature and Average Monthly Flows from November 1, 2012 to April 30, 2013 (Overwinter).
San Joaquin River Downstream of Dam 7
(°C)
San Joaquin River Upstream of Willow Creek Confluence
(°C)
San Joaquin River Upstream of
Powerhouse 4 (°C)
Willow Creek Bridge (°C)
Willow Creek
Flow (cfs) at USGS Gauge
No. 11246500
San Joaquin
River Flow (cfs) at USGS Gauge
No. 11242000 Month Mean Min Max Mean Min Max Mean Min Max Mean Min Max
November 14.7 12.1 16.5 14.7 11.9 16.5 14.4 11.0 15.9 11.8 6.8 14.1 11 47
December 9.6 6.1 12.1 9.7 6.0 12.1 9.4 6.0 12.1 7.4 2.8 11.4 36 190
January 5.8 5.3 6.6 5.8 5.3 6.7 5.8 4.4 8.2 4.6 1.1 9.3 17 42
February 5.7 5.2 6.7 5.7 5.2 6.7 6.5 5.4 8.0 6.1 3.6 8.3 17 58
March 6.5 5.5 8.3 6.4 5.5 7.7 9.2 6.8 12.4 10.3 6.0 15.0 21 54
April 8.1 6.4 9.7 8.4 6.4 10.3 12.1 9.1 14.8 14.8 8.4 20.0 15 55
Copyright 2013 by Southern California Edison Company 3-2 Draft 2013

Draft NASMP and AMP – Big Creek No. 4 Hydroelectric Project, FERC No. 2017 2013 Data Collection Report
Table 3. Monthly Mean, Minimum, and Maximum Water Temperature and Average Monthly Flows from May 1, 2013 to October 31, 2013.
Redinger Lake Upstream of Dam 7
(°C) 1
San Joaquin River Downstream of
Dam 7 (°C)
San Joaquin River Upstream of Willow Creek Confluence
(°C)
San Joaquin River Downstream of Willow Creek Confluence
(°C)
San Joaquin River Horseshoe Bend
East (°C)
San Joaquin River Horseshoe Bend
West (°C)
San Joaquin River Upstream of
Powerhouse 4 (°C)
Willow Creek Bridge Gauging
Station (°C)
Willow Creek 200 m Upstream of
SJR Confluence (°C)
Willow Creek Flow
(cfs) at USGS Gauge
No. 11246500
San Joaquin
River Flow
(cfs) at USGS Gauge
No. 11242000 Month Mean Min Max Mean Min Max Mean Min Max Mean Min Max Mean Min Max Mean Min Max Mean Min Max Mean Min Max Mean Min Max
May 12.9 9.9 16.9 10.2 7.9 12.5 10.6 8.3 12.8 10.8 8.8 13.0 12.8 10.1 15.0 14.8 11.9 17.5 14.8 11.9 17.7 17.9 13.6 21.7 18.0 13.6 22.4 7 63
June 14.6 12.6 22.6 12.1 10.6 13.6 12.3 10.8 14.2 12.7 11.1 14.4 15.3 13.3 17.6 17.9 16.1 20.8 18.0 16.1 21.0 22.1 17.9 27.5 22.1 17.9 27.9 7 44
July 17.9 14.2 22.5 14.1 12.2 16.7 14.3 12.5 16.8 14.5 12.7 16.5 16.5 14.7 18.3 19.2 17.4 21.3 19.2 17.2 21.4 24.8 21.5 29.1 24.6 21.5 28.4 3 53
August 20.8 17.6 22.9 17.3 15.3 20.9 17.3 15.1 21.0 17.3 15.4 21.2 18.6 16.6 21.7 20.4 18.1 23.6 20.4 18.1 23.4 23.3 20.4 26.7 22.9 20.4 25.7 1 110
September 21.5 18.0 23.8 19.0 17.3 22.3 19.0 17.3 22.3 19.1 17.4 22.2 19.5 17.0 22.3 20.2 17.1 22.7 20.2 17.1 22.7 20.8 14.3 26.1 20.5 14.3 25.2 1 131
October - - - 16.3 14.8 18.2 16.4 14.7 18.6 16.3 14.2 18.7 16.3 14.1 18.9 16.1 13.7 19.0 16.1 13.8 18.8 13.7 10.0 18.7 13.6 10.1 17.4 3 54 1 Redinger Lake near surface water temperatures, data are unavailable after September 29 due to lowered lake level.
Copyright 2013 by Southern California Edison Company 3-3 Draft 2013

Draft NASMP and AMP – Big Creek No. 4 Hydroelectric Project, FERC No. 2017 2013 Data Collection Report
3.1.2 AIR TEMPERATURE
A comparison of monthly mean air temperatures for May through October at Dam 7 and Fresno International Airport, with a percent exceedance based on an 83 year historical record of monthly mean air temperatures at Fresno International Airport (NCDC 2013) are presented in Table 4. Air temperatures for May through September were warmer than average. Based on the historical records from the Fresno International Airport, July 2013 was the warmest July on record while June 2013, and August 2013 were ranked as third warmest in the 83-year historical records for those months. September 2013 was the tenth warmest September, and May 2013 was ranked as the 21st warmest in the 83-year historical record. October 2013 was one of the coolest Octobers on record.
3.1.3 WATER TEMPERATURE RESULTS
Average water temperatures for the four overwinter monitoring locations, along with flows in the SJR and Willow Creek, are reported by month in Table 2. Overwinter mean daily water temperatures and flows in the SJR and Willow Creek are plotted on Figures 6 and 7, respectively, for November 2012 through April 2013.
Spring-summer average water temperatures for the nine monitoring locations, along with flows in the SJR and Willow Creek, are reported by month, for May 2013 through October 2013, in Table 3. Daily mean water temperatures and flows for the SJR during the spring-summer months are plotted on Figure 8. Daily mean water temperatures and flows for Willow Creek for the spring-summer months are plotted together on Figure 9.
3.1.3.1 Overwinter Water Temperatures, 2012–2013
Overwinter water temperatures in the SJR directly upstream of the Willow Creek Confluence decreased from a monthly mean of 14.7°C in November to 5.7°C in February, before gradually warming to 8.1°C in April (Table 2). Overwinter water temperatures in Willow Creek decreased from a monthly mean of 11.8°C in November to 4.6°C in January before warming to 14.8°C in April (Table 2). Overwinter monthly mean water temperatures upstream of PH4 decreased from 14.4°C in November to 5.8°C in January, before warming to 12.1°C in April (Table 2).
3.1.3.2 Spring-Summer 2013 Water Temperatures
Spring-summer water temperatures in the SJR ranged from a monthly mean of 10.2°C directly downstream of Dam 7 in May up to monthly means of 20.4°C recorded at the SJR HSB west site and just upstream of PH4 in August (Table 3). With the exception of October, monthly mean temperatures were coolest directly downstream of Dam 7 and gradually increased downstream. Monthly mean water temperatures from May to September directly downstream of Dam 7 showed a range of 8.8°C, increasing from May (10.2°C) to 19°C in September (Table 3). A similar warming pattern was observed at the other SJR sites, but with temperatures increasing to a lesser extent at SJR HSB east (6.7°C) and the two sites further downstream, SJR HSB west and SJR upstream of PH4, both warming 5.4°C from May to September.
Copyright 2013 by Southern California Edison Company 3-4 Draft 2013

Draft NASMP and AMP – Big Creek No. 4 Hydroelectric Project, FERC No. 2017 2013 Data Collection Report
Table 4. Monthly Mean Temperatures for 2013 at Fresno International Airport Compared with Percentage Exceedance for Historical Record (1931–2013) and Temperatures Measured at Dam 7.
Month 2013 Fresno Intl Airport Air Temperature (ºC)1
Fresno Intl Airport 2013 Percent Air Temperature
Exceeded (1931-2012) 2013 Dam No. 7 HOBO Air Temperature (ºC)
May 22.8 25.3 20.8
June 27.2 2.4 26.5
July 30.6 0.1 30.1
August 28.3 2.4 27.4
September 25.8 12.0 23.7
October 18.9 97.6 17.6 1 Climate data obtained from NOAA from May to September 2013 is preliminary and subject to final review.
Copyright 2013 by Southern California Edison Company 3-5 Draft 2013

Draft NASMP and AMP – Big Creek No. 4 Hydroelectric Project, FERC No. 2017 2013 Data Collection Report
Figure 6. Mean Daily Overwinter Temperatures in the San Joaquin River and Willow Creek with Flows in the San Joaquin River, 2012–2013.
0
100
200
300
400
500
600
0
2
4
6
8
10
12
14
16
18
20
Flow
(cfs
)
Tem
pera
ture
(oC
)
DateSJR Downstream of Dam 7 SJR Upstream Willow Creek Willow Creek
SJR Upstream Powerhouse 4 SJR Flow
Copyright 2013 by Southern California Edison Company 3-6 Draft 2013

Draft NASMP and AMP – Big Creek No. 4 Hydroelectric Project, FERC No. 2017 2013 Data Collection Report
Figure 7. Mean Daily Overwinter Temperatures and Flows in Willow Creek, 2012-2013.
0
20
40
60
80
100
120
140
160
180
200
0
2
4
6
8
10
12
14
16
18
20
Flow
(cfs
)
Tem
pera
ture
(o C)
Date
Willow Creek Bridge Temperature Willow Creek Flow
Copyright 2013 by Southern California Edison Company 3-7 Draft 2013

Draft NASMP and AMP – Big Creek No. 4 Hydroelectric Project, FERC No. 2017 2013 Data Collection Report
Figure 8. Mean Daily Spring-Summer Temperatures and Flows in the San Joaquin River, May 1 through October 31, 2013.
0
500
1,000
1,500
2,000
6
8
10
12
14
16
18
20
22
24
Flow
(cfs
)
Tem
pera
ture
(°C
)
Date
Downstream of Dam 7 Upstream of Willow Creek Downstream of Willow Creek Horseshoe Bend East
Horseshoe Bend West Upstream of Powerhouse 4 SJR Flow
Copyright 2013 by Southern California Edison Company 3-8 Draft 2013

Draft NASMP and AMP – Big Creek No. 4 Hydroelectric Project, FERC No. 2017 2013 Data Collection Report
Figure 9. Mean Daily Spring-Summer Temperature and Flows in Willow Creek, May 1 through October 31, 2013.
0
10
20
30
40
50
60
70
80
90
100
8
10
12
14
16
18
20
22
24
26
28
Flow
(cfs
)
Tem
pera
ture
(°C
)
DateWillow Creek Bridge Temperature Willow Creek upstream of SJR Temperature Willow Creek Flow
Copyright 2013 by Southern California Edison Company 3-9 Draft 2013

Draft NASMP and AMP – Big Creek No. 4 Hydroelectric Project, FERC No. 2017 2013 Data Collection Report
Mean monthly temperatures at all sites decreased from September to October. The warmest spring-summer water temperatures in the SJR were recorded at the furthest downstream station, directly upstream of PH4.
Monthly mean water temperatures in Willow Creek, upstream of the confluence with the SJR, showed a range of just over 11°C, increasing from 17.9°C during May to 24.8°C in July before gradually declining through August (23.3°C) and September (20.8°C) into October, 13.7°C (Table 3).
Water flowing from Willow Creek from May through September was generally warmer than that of the SJR (Table 3). The temperature differential between Willow Creek upstream of the confluence with the SJR and SJR upstream of Willow Creek increased from approximately 7.4°C in May up to 10.5°C in July dropping to a difference of 6°C warmer in August and approximately 1.5°C warmer in September (Table 3). The mean monthly temperature in October was 2.8°C cooler in Willow Creek than in the SJR.
3.1.3.3 Redinger Lake Profiles
Temperature, DO and SC profiles were measured during June, August, and October at Site A (Figure 4). Cool water temperatures were generally present below 30 m depth, despite surface heating (Figure 10). Surface heating was observed in the upper 6 meters during June and August, but not in October. Evidence of thermal stratification occurred below 20 m depth in June and August, but was located closer to the surface during October. DO levels remained relatively high throughout most of the water column (Figure 11).
During June, the water temperature profile indicated surficial warming with the warmest temperatures observed at the surface and quickly dropping approximately 5°C within the first 3 m (Figure 10). Below that depth, temperatures were essentially isothermal with a thermal discontinuity apparent between 20-28 m.
DO concentrations in June exceeded 8 mg/L throughout the water column except for the surface measurement (7.5 mg/L) and the deepest measurement, which was likely affected by sediment being stirred up by the unit at the bottom of the water column (Figure 11). SC was unchanged from the surface to a depth of 22 m with readings of 23 µS/cm. SC then increased with depth to a reading of 49 µS/cm at 56 m (Figure 12).
During August, surface waters had warmed; exceeding 23°C at Site A (Figure 10). Temperatures decreased quickly down to about 5 m, which rested on a 10 m column of isothermal (20°C) water. Thermal stratification was observed with the thermocline at 26 to 30 m depth (Figure 10), with a hypolimnion below those depths.
DO concentrations in August were slightly lower than those measured in June, except at the surface and at depths below 28 m. SC measurements were greater in August from the surface down to a depth of 22 m (Figure 12). Apart from a dip in SC between 22 and 30 m, SC was relatively similar throughout the water column in August.
Copyright 2013 by Southern California Edison Company 3-10 Draft 2013

Draft NASMP and AMP – Big Creek No. 4 Hydroelectric Project, FERC No. 2017 2013 Data Collection Report
Figure 10. Redinger Lake Water Temperature Profile for Sites A, 2013.
0
10
20
30
40
50
60
0 5 10 15 20 25
Dep
th (m
eter
s)
Water Temperature (°C)
Site A
6/21/2013
8/16/2012
10/5/2013
Copyright 2013 by Southern California Edison Company 3-11 Draft 2013
Draft NASMP and AMP – Big Creek No. 4 Hydroelectric Project, FERC No. 2017 2013 Data Collection Report
Figure 11. Redinger Lake Dissolved Oxygen Profile for Site A, 2013.
0
10
20
30
40
50
60
0 2 4 6 8 10
Dep
th (m
eter
s)
Dissolved Oxygen (mg/l)
Site A
6/21/2013
8/16/2012
10/5/2013
Copyright 2013 by Southern California Edison Company 3-12 Draft 2013
Draft NASMP and AMP – Big Creek No. 4 Hydroelectric Project, FERC No. 2017 2013 Data Collection Report
Figure 12. Redinger Lake Specific Conductance Profile for Site A, 2013.
0
10
20
30
40
50
60
0 10 20 30 40 50 60 70 80
Dep
th (m
eter
s)
Specific Conductance ( µs/cm)
Site A
6/21/2013
8/16/2012
10/5/2013
Copyright 2013 by Southern California Edison Company 3-13 Draft 2013

Draft NASMP and AMP – Big Creek No. 4 Hydroelectric Project, FERC No. 2017 2013 Data Collection Report
During October, water temperatures at the lake surface had decreased to those measured in June (18.3°C). However in October, the lake was isothermal (Figure 10) from the surface down to 11 m. The thermocline was observed at a depth of approximately 15 m.
DO concentrations in October were lower throughout the water column than those recorded in June and August and were generally between 6 and 7 mg/L (Figure 11) to a depth of about 40 m. The highest levels of SC were recorded in October throughout the water column and remained fairly stable (between 52 and 56 µS/cm) throughout except for a slight dip that was present at the thermocline (Figure 12).
3.2 PHYSICAL CONDITIONS DURING OUT-OF-SEASON EXPERIMENTAL WHITEWATER FLOW RELEASES
3.2.1 FIRST OUT-OF-SEASON EXPERIMENTAL WHITEWATER FLOW RELEASE AUGUST 2013
3.2.1.1 Flow
Before the August whitewater release, flow in the SJR downstream of Willow Creek was approximately 44 cfs. The release was initiated on August 18 with flows ramping up beginning at 1 AM at an average rate of approximately 200 cfs per hour (range of 109-440 cfs per hour) for an eight-hour period. The release increased flow in the SJR downstream of Willow Creek to approximately 1,670 cfs (Figure 13). Flow remained at this level for approximately 24 hours before it was ramped back down to pre-release levels. The ramp-down rate was approximately 167 cfs per hour (range of 25-606 cfs per hour). Flow measured below Dam 7 was back to pre-release levels by 7 PM on August 19.
3.2.1.2 Water Temperature
Before the August whitewater release, water temperature in the SJR was 17.1°C directly downstream of Dam 7, increasing to 20.3°C at the warmest station, just upstream of PH4 (Figure 13). At the start of the release, water temperature downstream of Dam 7 decreased slightly (-0.4°C) as cooler water from the lake was released into the SJR. The release gate at Dam 7 withdraws water from the lower part of the lake’s epilimnion. The initial release of cooler water can be tracked downstream by observing the short dips in temperature at the downstream temperature monitoring stations. For example the cooler water was evident at the HSB East site approximately one and a half to four hours after it was recorded downstream of Dam 7 (Figure 13) and was evident just upstream of Powerhouse 4 (the most downstream site) approximately five to nine hours after it was recorded downstream of Dam 7 (Figure 13).
Copyright 2013 by Southern California Edison Company 3-14 Draft 2013

Draft NASMP and AMP – Big Creek No. 4 Hydroelectric Project, FERC No. 2017 2013 Data Collection Report
Figure 13. The Effect of Out-of-season Experimental Whitewater Flow Release on Water Temperature in the Horseshoe Bend Reach of the San Joaquin River, at Six Sites between August 18 and August 19, 2013.
Copyright 2013 by Southern California Edison Company 3-15 Draft 2013

Draft NASMP and AMP – Big Creek No. 4 Hydroelectric Project, FERC No. 2017 2013 Data Collection Report
Warmer lake surface water quickly replaced the cooler water as the release continued. Water temperatures downstream of Dam 7 increased to 19°C within 40 minutes of the start of the release and to 20°C within 80 minutes following the start of the release. Directly downstream of Dam 7, water temperature increased over 3°C in just over one hour. This 3°C increase in temperature meant that for the remainder of the release, water temperatures in the HSB Reach were similar throughout (Figure 13).
As the release flows were ramped-down, water temperatures directly downstream of Dam 7 quickly decreased to those recorded prior to the release, while water temperatures at the most downstream sites increased slightly (Figure 13).
3.2.2 SECOND OUT-OF-SEASON EXPERIMENTAL WHITEWATER FLOW RELEASE SEPTEMBER 2013
3.2.2.1 Flow
Before the September whitewater release, flow in the SJR downstream of Willow Creek was approximately 60 cfs. The release was initiated on September 8 with flows ramping up beginning at 1 AM at a rate of approximately 170 cfs per hour (range: 25-313 cfs per hour) over a ten-hour period. The release increased flow in the SJR downstream of Willow Creek to approximately 1,750 cfs (Figure 14). Flow remained at this level for approximately 24 hours before it was ramped back down to pre-release levels. The ramp-down rate was at a rate of approximately 130 cfs per hr (range: 18-270 cfs/hr). Flow was back to normal by 7 PM on September 9.
3.2.2.2 Water Temperature
Before the September whitewater release, water temperature in the SJR was 18.6°C, directly downstream of Dam 7 increasing to 21.2°C at the warmest station, just upstream of PH4 (Figure 14). Water temperatures directly downstream of Dam 7 increased almost 3.5°C in the first three hours (Figure 14) following the start of the release. Following this initial water temperature increase, water temperature at the SJR HSB East site decreased by more than 1°C about four hours after the start of the release (Figure 14), and water temperature just upstream of Powerhouse 4 (the most downstream site) decreased by almost 2°C approximately eight hours after the start of the release. As the release flows were ramped-down, water temperatures directly downstream of Dam 7 quickly decreased to near those present prior to the release (Figure 14).
3.2.3 STRANDING RESULTS
The potential for stranding of fish and amphibians was examined through sampling four areas of the SJR during down ramping of flows following each out-of-season experimental whitewater flow release. The results for each release are discussed by monitoring location. Overall, very few fish or amphibians were found to be stranded.
Copyright 2013 by Southern California Edison Company 3-16 Draft 2013

Draft NASMP and AMP – Big Creek No. 4 Hydroelectric Project, FERC No. 2017 2013 Data Collection Report
Figure 14. The Effect of Out-of-season Experimental Whitewater Flow Release on Water Temperature in the Horseshoe Bend Reach of the San Joaquin River, at Six Sites between September 8 and September 9, 2013.
Copyright 2013 by Southern California Edison Company 3-17 Draft 2013

Draft NASMP and AMP – Big Creek No. 4 Hydroelectric Project, FERC No. 2017 2013 Data Collection Report
3.2.3.1 Stranding Following First Out-of-season Experimental Whitewater Flow Release
Hourly surveys for stranded biota were conducted on August 19, 2013, during the ramp down of the first release. The surveys were conducted from 0800 to 1800 hours. Results are presented in Tables 5 through 8.
Willow Creek Confluence Pool At WCCP, a single adult Sacramento sucker was encountered, which had been injured and had washed up into a small willow lined side channel where it had become entrapped in the vegetation (Table 5). A total of seven fish larvae, four hardhead and three unidentified species, were found stranded during the survey period. All fish larvae were found trapped in isolated pools on the right bank, immediately downstream of the WCCP tail-out. Two bullfrog tadpoles were also observed stranded in these isolated pools. All trapped animals were observed between 1400 and 1700 hours.
Backbone Creek Confluence Pool No biota were observed stranded or trapped at BCCP during the survey (Table 6).
Fish Population Sampling Site 4 At Fish Population Sampling Site 4, two fish were encountered during the survey (Table 7). A single young of the year hardhead was found trapped in a small isolated pool at the upstream end of the survey reach, on the left bank. The fish was captured alive but was observed to be lethargic and injured (bruised). The fish expired during handling. A young of the year Sacramento sucker also was observed trapped in an isolated pool on the left bank. The sucker was captured and released, but was observed to have a severe fungal infection on its body. Both entrapments were observed between 1200 and 1400 hours.
Additional larval fish entrapment was observed, when the site was revisited the following morning, August 20. Some additional isolated pools were observed to be present on the left bank that were submerged at the end of the survey on August 19. As discussed in Section 3.2.1, there was a lag time between changes at the flow gage upstream of Willow Creek and sites in the lower river. Two of these pools contained fish larvae, although one of these pools was outside of the survey reach, four larvae, two in each pool, were observed to be trapped. The fish were not identified to species.
Fish Population Sampling Site 5 No fish were observed stranded or trapped at Fish Population Sampling Site 5 during the survey (Table 8). Two Pacific chorus frog larvae were encountered, one in the morning and one in the afternoon, in small isolated pools on the right bank.
Copyright 2013 by Southern California Edison Company 3-18 Draft 2013

Draft NASMP and AMP – Big Creek No. 4 Hydroelectric Project, FERC No. 2017 2013 Data Collection Report
Table 5. Stranding Results during Ramp Down at Willow Creek Confluence Pool, August 19, 2013.
Time¹ Flow (cfs)²
Number of Animals Species Lifestage Notes
800 1,371 0 -- -- -- 900 1,239 0 -- -- -- 1000 1,544 0 -- -- -- 1100 938 0 -- -- -- 1200 771 0 -- -- -- 1300 691 0 -- -- --
1400 500 1 Sacramento Sucker Adult Trapped/Injured
1500 377 5 4 Hardhead, 1 unidentified Larvae Trapped/Stranded
1600 374 4 2 unidentified 2 Bullfrog Larvae Trapped/Stranded
1700 98 0 -- -- -- 1800 73 0 -- -- --
¹ Results are cumulative from the bottom to the top of each hourly increment. ² Average flows by hour, as calculated downstream of Willow Creek.
Table 6. Stranding Results during Ramp Down at Backbone Creek Confluence Pool, August 19, 2013.
Time¹ Flow (cfs)²
Number of Animals Species Lifestage Notes
800 1,371 0 -- -- -- 900 1,239 0 -- -- -- 1000 1,544 0 -- -- -- 1100 938 0 -- -- -- 1200 771 0 -- -- -- 1300 691 0 -- -- -- 1400 500 0 -- -- -- 1500 377 0 -- -- -- 1600 374 0 -- -- -- 1700 98 0 -- -- -- 1800 73 0 -- -- --
¹ Results are cumulative from the bottom to the top of each hourly increment. ² Average flows by hour, as calculated downstream of Willow Creek.
Copyright 2013 by Southern California Edison Company 3-19 Draft 2013

Draft NASMP and AMP – Big Creek No. 4 Hydroelectric Project, FERC No. 2017 2013 Data Collection Report
Table 7. Stranding Results during Ramp Down at Fish Population Sampling Site 4, August 19, 2013.
Time¹ Flow (cfs)²
Number of Animals Species Lifestage Notes
800 1,371 0 -- -- -- 900 1,239 0 -- -- -- 1000 1,544 0 -- -- -- 1100 938 0 -- -- --
1200 771 1 Hardhead Young of Year Injured and later died/Trapped/Small Pool
1300 691 1 Sacramento Sucker Young of Year Injured/Trapped/Small
Pool 1400 500 0 -- -- -- 1500 377 0 -- -- -- 1600 374 0 -- -- -- 1700 98 0 -- -- -- 1800 73 0 -- -- --
¹ Results are cumulative from the bottom to the top of each hourly increment. ² Average flows by hour, as calculated downstream of Willow Creek. Note: On the morning of August 20, two isolated pools that were connected to the SJR on August 19 contained unidentified fish larvae. Four larvae, two in each pool, were observed. One of these pools was outside of the survey reach.
Table 8. Stranding Results during Ramp Down at Fish Population Sampling Site 5, August 19, 2013.
Time¹ Flow (cfs)²
Number of Animals Species Lifestage Notes
800 1,371 0 -- -- --
900 1,239 1 Pacific Chorus Frog Larvae Trapped/Stranded
1000 1,544 0 -- -- -- 1100 938 0 -- -- -- 1200 771 0 -- -- -- 1300 691 0 -- -- -- 1400 500 0 -- -- -- 1500 377 0 -- -- -- 1600 374 0 -- -- --
1700 98 1 Pacific Chorus Frog Larvae Trapped/Stranded
1800 73 0 -- -- -- ¹ Results are cumulative from the bottom to the top of each hourly increment. ² Average flows by hour, as calculated downstream of Willow Creek.
Copyright 2013 by Southern California Edison Company 3-20 Draft 2013

Draft NASMP and AMP – Big Creek No. 4 Hydroelectric Project, FERC No. 2017 2013 Data Collection Report
3.2.3.2 Stranding Following Second Out-of-season Experimental Whitewater Flow Release
Hourly surveys for stranded biota were conducted on September 9, 2013 during the ramp down of the second out-of-season experimental whitewater flow. The surveys were conducted from 0800 to 1800 hours. Results are presented in Tables 9 through 12.
Willow Creek Confluence Pool At WCCP, no fish was observed to be trapped or stranded during the survey (Table 9). Two bullfrog larvae and two Pacific chorus frog larvae were found trapped in isolated pools.
Backbone Creek Confluence Pool
No biota were observed stranded at BCCP during the ramp down survey (Table 10).
Fish Population Sampling Site 4 No biota were observed stranded at Fish Population Sampling Site 4 during the ramp down survey (Table 11).
Fish Population Sampling Site 5 No biota were observed stranded at Fish Population Sampling Site 5 during the ramp down survey (Table 12).
3.2.4 DISPLACEMENT MONITORING
3.2.4.1 Western Pond Turtle Displacement Results
Twenty eight turtles were captured and ten adults and three juveniles were fitted with radio tags (Table 13). Five of the ten adult turtles were tagged at WCCP, and the other five tagged at the BCCP. All three juvenile turtles were tagged at the BCCP. Adult turtles ranged in length from 124 to 153 millimeter (mm), and juveniles from 105 to 120 mm (Table 13).
Turtles were tracked at the BCCP on August 14 and at the WCCP on August 15, 2013 prior to the first flow release on August 18, 2013. All thirteen turtles were located. The results are presented in Table 13 and Appendix C).
For the second flow release, WPTs were tracked at the WCCP and at the BCCP on September 6, 2013. Three WPTs could not be located during pre-release tracking. These undetected tags were likely due to depleted batteries. The results for pre-release movements are presented in Table 13 and Appendix C. Turtles were tracked at the WCCP and at the BCCP on September 10, 2013 after the second release. Five turtles could not be located during post-release tracking. As stated above, undetected tags were likely due to depleted batteries. The results are presented in Table 13 and Appendix C.
Copyright 2013 by Southern California Edison Company 3-21 Draft 2013

Draft NASMP and AMP – Big Creek No. 4 Hydroelectric Project, FERC No. 2017 2013 Data Collection Report
Table 9. Stranding Results during Ramp Down at Willow Creek Confluence Pool, September 9, 2013.
Time¹ Flow (cfs)²
Number of Animals Species Lifestage Notes
800 1,599 2 Pacific Chorus Frog Larvae Trapped/Stranded
900 1,487 0 -- -- -- 1000 1,340 0 -- -- -- 1100 1,189 0 -- -- -- 1200 1,021 0 -- -- -- 1300 904 0 -- -- -- 1400 857 0 -- -- -- 1500 611 0 -- -- -- 1600 400 2 Bullfrog Larvae Trapped/Stranded 1700 187 0 -- -- -- 1800 100 0 -- -- --
¹ Results are cumulative from the bottom to the top of each hourly increment. ² Average flows by hour, as calculated downstream of Willow Creek.
Table 10. Stranding Results during Ramp Down at Backbone Creek Confluence Pool, September 9, 2013.
Time¹ Flow (cfs)²
Number of Animals Species Lifestage Notes
800 1,599 0 -- -- -- 900 1,487 0 -- -- -- 1000 1,340 0 -- -- -- 1100 1,189 0 -- -- -- 1200 1,021 0 -- -- -- 1300 904 0 -- -- -- 1400 857 0 -- -- -- 1500 611 0 -- -- -- 1600 400 0 -- -- -- 1700 187 0 -- -- -- 1800 100 0 -- -- --
¹ Results are cumulative from the bottom to the top of each hourly increment. ² Average flows by hour, as calculated downstream of Willow Creek.
Copyright 2013 by Southern California Edison Company 3-22 Draft 2013

Draft NASMP and AMP – Big Creek No. 4 Hydroelectric Project, FERC No. 2017 2013 Data Collection Report
Table 11. Stranding Results during Ramp Down at Fish Population Sampling Site 4, September 9, 2013.
Time¹ Flow (cfs)²
Number of Animals Species Lifestage Notes
800 1,599 0 -- -- -- 900 1,487 0 -- -- -- 1000 1,340 0 -- -- -- 1100 1,189 0 -- -- -- 1200 1,021 0 -- -- -- 1300 904 0 -- -- -- 1400 857 0 -- -- -- 1500 611 0 -- -- -- 1600 400 0 -- -- -- 1700 187 0 -- -- -- 1800 100 0 -- -- --
¹ Results are cumulative from the bottom to the top of each hourly increment. ² Average flows by hour, as calculated downstream of Willow Creek.
Table 12. Stranding Results during Ramp Down at Fish Population Sampling Site 5, September 9, 2013.
Time¹ Flow (cfs)²
Number of Animals Species Lifestage Notes
800 1,599 0 -- -- -- 900 1,487 0 -- -- -- 1000 1,340 0 -- -- -- 1100 1,189 0 -- -- -- 1200 1,021 0 -- -- -- 1300 904 0 -- -- -- 1400 857 0 -- -- -- 1500 611 0 -- -- -- 1600 400 0 -- -- -- 1700 187 0 -- -- -- 1800 100 0 -- -- --
¹ Results are cumulative from the bottom to the top of each hourly increment. ² Average flows by hour, as calculated downstream of Willow Creek.
Copyright 2013 by Southern California Edison Company 3-23 Draft 2013

Draft NASMP and AMP – Big Creek No. 4 Hydroelectric Project, FERC No. 2017 2013 Data Collection Report
Table 13. Western Pond Turtle Radio Tracking.
Capture Data Movement Before First Out-of-season
Experimental Whitewater Flow Release
Downstream Displacement after First Out-of-season Experimental Whitewater
Flow Release
Movement Before Second Out-of-season Experimental Whitewater Flow
Release
Downstream Displacement after Second Out-of-season Experimental Whitewater
Flow Release
Tag # Length (mm) Date Location Date Yes/No
Distance Meters Date Yes/No
Distance Meters Date Yes/No
Distance (Meters) Date Yes/No
Distance (Meters)
Adult WPT 8.940 124 7/9/13 WCCP¹ 8/15/13 No - 8/21/13 No - 9/6/2013 No - 9/10/13 No -
8.970 125 7/9/13 WCCP 8/15/13 Yes 50* 8/21/13 No - 9/6/2013 Yes 50** 9/10/13 No -
8.991 144 7/10/13 WCCP 8/15/13 No - 8/21/13 No - 9/6/2013 n/a - 9/10/13 n/a n/a
8.930 123 7/10/13 WCCP 8/15/13 No - 8/21/13 No - 9/6/2013 No - 9/10/13 No -
8.872 124 7/10/13 WCCP 8/15/13 Yes 250* 8/21/13 No - 9/6/2013 Yes 250** 9/10/13 n/a n/a
8.961 150 7/17/13 BCCP² 8/14/13 No - 8/20/13 No - 9/6/2013 No - 9/10/13 No -
8.881 125 7/17/13 BCCP 8/14/13 No - 8/20/13 No - 9/6/2013 No - 9/10/13 No -
8.850 132 7/17/13 BCCP 8/14/13 No - 8/20/13 No - 9/6/2013 No - 9/10/13 No -
8.903 153 7/17/13 BCCP 8/14/13 No - 8/20/13 No - 9/6/2013 No - 9/10/13 No -
8.911 131 7/17/13 BCCP 8/14/13 No - 8/20/13 No - 9/8/2013 No - 9/10/13 No -
Juvenile WPT 8.841 120 7/17/13 BCCP 8/14/13 No - 8/20/13 Yes 85-ds 9/6/2013 n/a - 9/10/13 n/a n/a
8.818 105 7/17/13 BCCP 8/14/13 No - 8/20/13 No - 9/6/2013 n/a - 9/10/13 n/a n/a
8.789 114 7/17/13 BCCP 8/14/13 No - 8/20/13 No - 9/7/2013 No - 9/10/13 n/a n/a
¹ WCCP = Willow Creek Confluence Pool. 2 BCCP = Backbone Creek Confluence Pool (-) no movement detected *Movement from confluence pool upstream into Willow Creek before first out-of-season experimental whitewater flow. **Movement from Willow Creek downstream into confluence pool before second out-of-season experimental whitewater flow. (n/a) tag not detected, likely from battery expiration. Bold indicates downstream displacement from pre-release habitat unit.
Copyright 2013 by Southern California Edison Company 3-24 Draft 2013

Draft NASMP and AMP – Big Creek No. 4 Hydroelectric Project, FERC No. 2017 2013 Data Collection Report
Willow Creek Confluence Pool Adult Western Pond Turtle
Prior to the first release on August 15, 2013, all five turtles captured and tagged at WCCP were located. Three of the five turtles were found in approximately the same location they were tagged in before the release. The other two turtles had moved into Willow Creek before the first flow release. Turtle Tag No. 8.970 was located 50 meters upstream in Willow Creek and turtle Tag No. 8.872 250 meters upstream (Table 13) of the SJR. The locations of both turtles were outside the influence of the flow release, and they remained there following the first flow release. After the first flow release, all five turtles were located on August 21, 2013. No movement was detected among these turtles.
Four of the five adult turtles tagged in the WCCP were located prior to the second flow release. The fifth turtle could not be located. The two turtles located in Willow Creek during the previous flow release moved back to their previous locations in the WCCP. No movement was detected for the other two turtles. After the second flow release, three of the five adult turtles tagged in the WCCP were located. No movement was detected among these turtles after the release.
Backbone Creek Confluence Pool Adult Western Pond Turtle
All five adult turtles at the BCCP were located prior to the first flow release. No movement was detected among these turtles prior to the release. All five adult turtles were located after the first flow release. No movement was detected among these turtles at that time.
All five adult turtles were located prior to the second flow release. No movement was detected among these turtles prior to the release. All of these turtles were located after the second flow release. No movement was detected from where WPTs were located prior to the second release flow.
Backbone Creek Confluence Pool Juvenile Western Pond Turtle
All three juvenile turtles were located prior to the first flow release. No movement was detected among these turtles prior to the release. All three juvenile turtles were located on August 20, 2013 after the first flow release; one of the juvenile turtles (8.841) was located 85 meters downstream in the next pool. No movement was detected for the other two juvenile turtles.
Only one of three juvenile turtles was located prior to the second flow release. No movement was detected for this turtle prior to the second release. None of the juvenile turtles were located during tracking after the second flow release. However, two of these turtles (tag Nos. 8.818 and 8.789) were captured in subsequent trapping events for WPT demography in September and were captured in the same location in which they were tagged and detected during previous tracking events, indicating that they were not displaced.
Copyright 2013 by Southern California Edison Company 3-25 Draft 2013

Draft NASMP and AMP – Big Creek No. 4 Hydroelectric Project, FERC No. 2017 2013 Data Collection Report
3.2.4.2 Fish Displacement Results
Potential effects of the out-of-season experimental whitewater flow releases on the fish community were examined through a combination of hardhead radio tracking and fish sampling (snorkel surveys and larval fish trapping).
Hardhead Radio Tracking
Ten adult hardhead, captured and tagged with radio tags before the first flow release, were tracked before and after the release to determine potential displacement downstream (Table 14). Some movement was detected during tracking after the first release. Seven fish did not move either before or after the flow release. Two adults appeared to be displaced downstream (Figures 15 through 17), and one hardhead moved upstream. After the second flow release, no radio tagged adult hardhead was displaced downstream from the habitat unit it was occupying prior to the release (Table 14, Figures 15 through 17), and one adult moved a short distance upstream. Overall, only four of the 10 adult hardhead exhibited discernible upstream or downstream movement.
Snorkel Results
Snorkel observations were made at four of the fish population sampling sites (Fish Population Sampling Sites 3, 4, 5, and 6) prior to and after the flow releases. The tabular results for the fish species found by size range are presented for each site by survey in Appendix E. The results for major species are presented in Figures 18 through 22 and discussed below. The results indicate considerable variability in response by species, location, and flow release.
HARDHEAD
Hardhead adult counts (fish greater than six inches in length) are presented in Figure 18. The figure shows that the numbers of hardhead exhibited considerable variability before and after the releases. Adults generally declined after the first release and increased after the second at Fish Population Sampling Sites 3 and 4, while numbers at Fish Population Sampling Site 5 declined after each release, and no adults were observed at Fish Population Sampling Site 6. Results from radio tracking suggest that adult hardhead may have responded to the first flow release by taking cover deep within the habitats in which they were found. This behavior would result in those fish being hidden under cover or too deep to be counted.
At all four sites, the numbers of juvenile hardhead (fish less than six inches in length) increased after the first release and decreased to zero after the second release. The results suggest that juvenile hardhead may have been entering and leaving the sites, which indicates potential displacement.
Copyright 2013 by Southern California Edison Company 3-26 Draft 2013
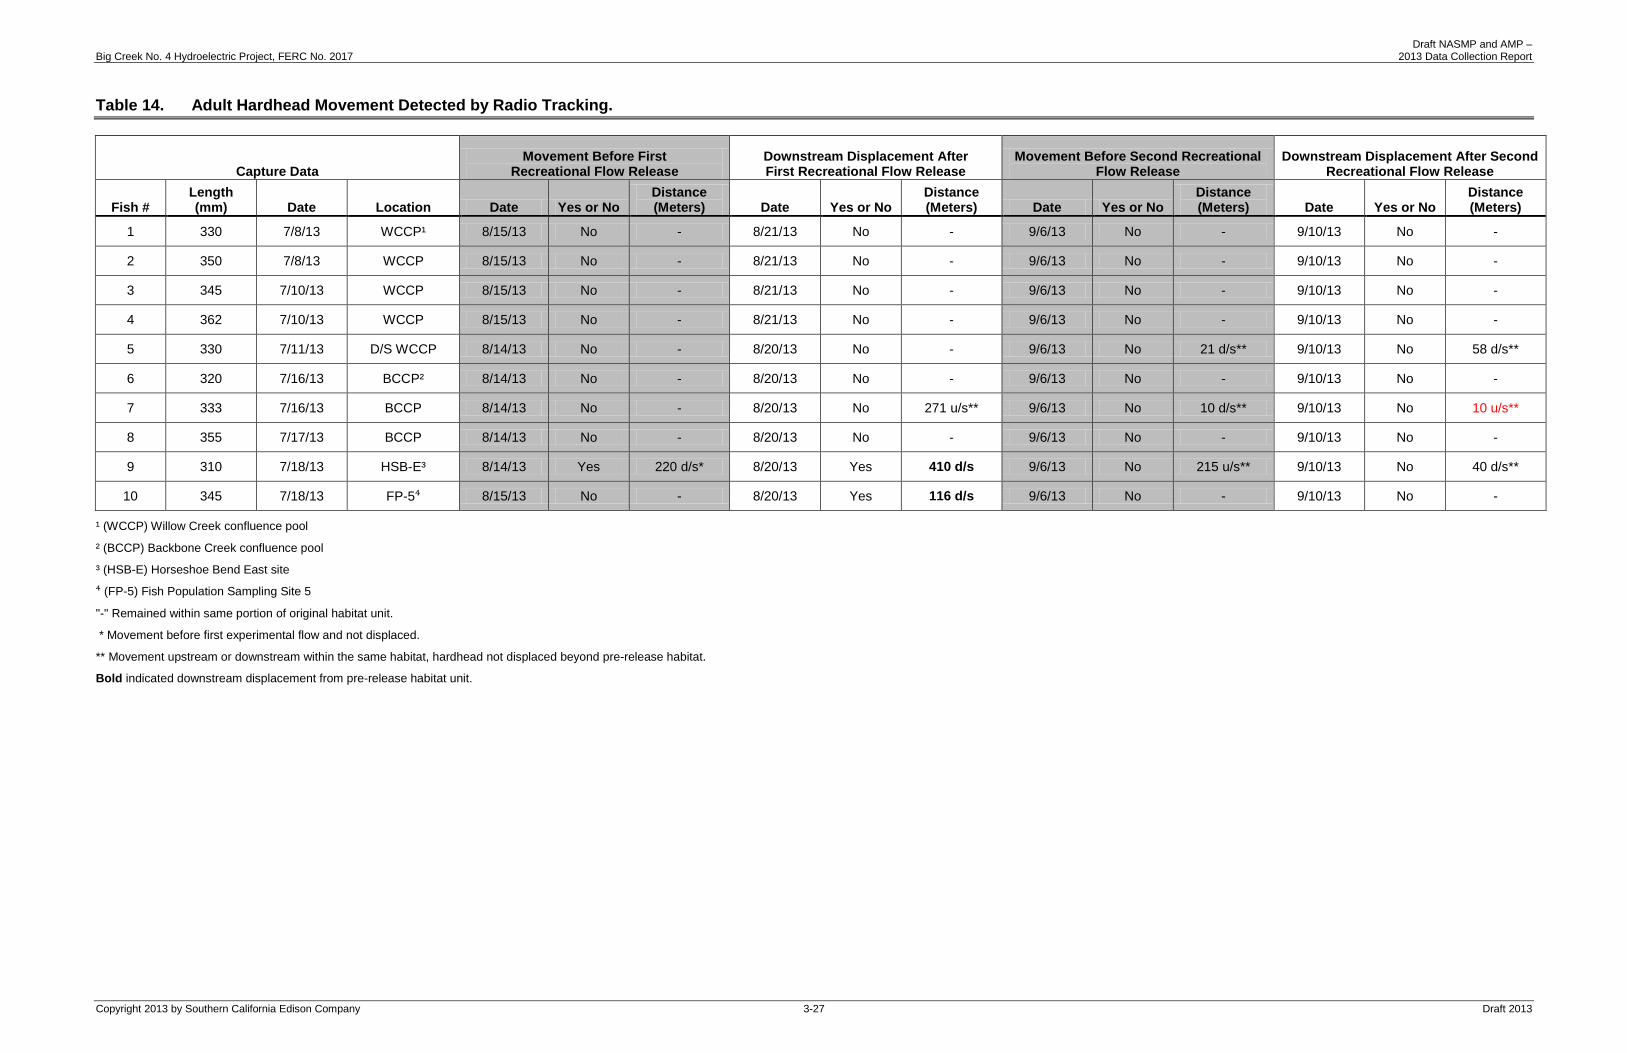
Draft NASMP and AMP – Big Creek No. 4 Hydroelectric Project, FERC No. 2017 2013 Data Collection Report
Table 14. Adult Hardhead Movement Detected by Radio Tracking.
Capture Data Movement Before First
Recreational Flow Release Downstream Displacement After First Recreational Flow Release
Movement Before Second Recreational Flow Release
Downstream Displacement After Second Recreational Flow Release
Fish # Length (mm) Date Location Date Yes or No
Distance (Meters) Date Yes or No
Distance (Meters) Date Yes or No
Distance (Meters) Date Yes or No
Distance (Meters)
1 330 7/8/13 WCCP¹ 8/15/13 No - 8/21/13 No - 9/6/13 No - 9/10/13 No -
2 350 7/8/13 WCCP 8/15/13 No - 8/21/13 No - 9/6/13 No - 9/10/13 No -
3 345 7/10/13 WCCP 8/15/13 No - 8/21/13 No - 9/6/13 No - 9/10/13 No -
4 362 7/10/13 WCCP 8/15/13 No - 8/21/13 No - 9/6/13 No - 9/10/13 No -
5 330 7/11/13 D/S WCCP 8/14/13 No - 8/20/13 No - 9/6/13 No 21 d/s** 9/10/13 No 58 d/s**
6 320 7/16/13 BCCP² 8/14/13 No - 8/20/13 No - 9/6/13 No - 9/10/13 No -
7 333 7/16/13 BCCP 8/14/13 No - 8/20/13 No 271 u/s** 9/6/13 No 10 d/s** 9/10/13 No 10 u/s**
8 355 7/17/13 BCCP 8/14/13 No - 8/20/13 No - 9/6/13 No - 9/10/13 No -
9 310 7/18/13 HSB-E³ 8/14/13 Yes 220 d/s* 8/20/13 Yes 410 d/s 9/6/13 No 215 u/s** 9/10/13 No 40 d/s**
10 345 7/18/13 FP-5⁴ 8/15/13 No - 8/20/13 Yes 116 d/s 9/6/13 No - 9/10/13 No -
¹ (WCCP) Willow Creek confluence pool
² (BCCP) Backbone Creek confluence pool
³ (HSB-E) Horseshoe Bend East site
⁴ (FP-5) Fish Population Sampling Site 5
"-" Remained within same portion of original habitat unit.
* Movement before first experimental flow and not displaced.
** Movement upstream or downstream within the same habitat, hardhead not displaced beyond pre-release habitat.
Bold indicated downstream displacement from pre-release habitat unit.
Copyright 2013 by Southern California Edison Company 3-27 Draft 2013

Draft NASMP and AMP – Big Creek No. 4 Hydroelectric Project, FERC No. 2017 2013 Data Collection Report
Figure 15. Fish Movement and Displacement in Response to the First and Second Out-of-season Experimental Whitewater Flow Releases, as Determined from Radio Tracking for Hardhead No. 7.
Copyright 2013 by Southern California Edison Company 3-28 Draft 2013

Draft NASMP and AMP – Big Creek No. 4 Hydroelectric Project, FERC No. 2017 2013 Data Collection Report
Figure 16. Fish Movement and Displacement in Response to the First and Second Out-of-season Experimental Whitewater Flow Releases, as Determined from Radio Tracking for Hardhead No. 9.
Copyright 2013 by Southern California Edison Company 3-29 Draft 2013

Draft NASMP and AMP – Big Creek No. 4 Hydroelectric Project, FERC No. 2017 2013 Data Collection Report
Figure 17. Fish Movement and Displacement in Response to the First and Second Out-of-season Experimental Whitewater Flow Releases, as Determined from Radio Tracking for Hardhead No. 10.
Copyright 2013 by Southern California Edison Company 3-30 Draft 2013

Draft NASMP and AMP – Big Creek No. 4 Hydroelectric Project, FERC No. 2017 2013 Data Collection Report
Figure 18. Fish Displacement Monitoring for Hardhead and “Unidentified Cyprinids” by Site for Both Flow Releases, 2013.
0
5
10
15
20
25
30
35
40Site 3
Site 4
Site 5
Site 6
Num
ber o
f Obs
erva
tions
Date
Hardhead Adults
0
5
10
15
20
25
30
35
40
Site 3
Site 4
Site 5
Site 6
Num
ber o
f Obs
erva
tions
Date
Hardhead Juveniles
0
500
1000
1500
2000
2500
3000
3500
4000
Site 3
Site 4
Site 5
Site 6
Num
ber o
f Obs
erva
tions
Date
Unidentified Cyprinids
Copyright 2013 by Southern California Edison Company 3-31 Draft 2013

Draft NASMP and AMP – Big Creek No. 4 Hydroelectric Project, FERC No. 2017 2013 Data Collection Report
Figure 19. Fish Displacement Monitoring for Sacramento Pikeminnow by Site for Both Flow Releases, 2013.
0
5
10
15
20
25
Site 3
Site 4
Site 5
Site 6
Num
ber o
f Obs
erva
tions
Date
Sacramento Pikeminnow Adults
0
5
10
15
20
25
Site 3
Site 4
Site 5
Site 6
Num
ber o
f Obs
erva
tions
Date
Sacramento Pikeminnow Juveniles
Copyright 2013 by Southern California Edison Company 3-32 Draft 2013
Draft NASMP and AMP – Big Creek No. 4 Hydroelectric Project, FERC No. 2017 2013 Data Collection Report
Figure 20. Fish Displacement Monitoring for Sacramento Sucker by Site for Both Flow Releases, 2013.
0
5
10
15
20
25
Site 3
Site 4
Site 5
Site 6
Num
ber o
f Obs
erva
tions
Date
Sacramento Sucker Adults
0
20
40
60
80
100
120
140
Site 3
Site 4
Site 5
Site 6
Num
ber o
f Obs
erva
tions
Date
Sacramento Sucker Juveniles
Copyright 2013 by Southern California Edison Company 3-33 Draft 2013
Draft NASMP and AMP – Big Creek No. 4 Hydroelectric Project, FERC No. 2017 2013 Data Collection Report
Figure 21. Fish Displacement Monitoring for Rainbow Trout by Site for Both Flow Releases, 2013.
0
2
4
6
8
10
12
14
16
Site 3
Site 4
Site 5
Site 6
Num
ber o
f Obs
erva
tions
Date
Rainbow Trout Adults
0
1
2
3
4
Site 3
Site 4
Site 5
Site 6
Date
Num
ber o
f Obs
erva
tions
Rainbow Trout Juveniles
Copyright 2013 by Southern California Edison Company 3-34 Draft 2013
Draft NASMP and AMP – Big Creek No. 4 Hydroelectric Project, FERC No. 2017 2013 Data Collection Report
Figure 22. Fish Displacement Monitoring for Spotted Bass by Site for Both Flow Releases, 2013.
0
2
4
6
8
10
12
14
Site 3
Site 4
Site 5
Site 6Num
ber o
f Obs
erva
tions
Date
Spotted Bass Adults
0
1
2
3
4
Site 3
Site 4
Site 5
Site 6
Num
ber o
f Obs
erva
tions
Date
Spotted Bass Juveniles
Copyright 2013 by Southern California Edison Company 3-35 Draft 2013

Draft NASMP and AMP – Big Creek No. 4 Hydroelectric Project, FERC No. 2017 2013 Data Collection Report
“UNIDENTIFIED CYPRINIDS”
“Unidentified cyprinids” include a mix of schooling small young of the year hardhead and Sacramento pikeminnow, largely hardhead. Figure 18 presents the snorkel counts for “unidentified cyprinids” before and after the flow releases. Abundances changed variably depending upon site and release flow. There were increases of differing magnitudes after the first release. After the second release, abundances decreased at Fish Population Sampling Sites 3 and 6, but increased at Fish Population Sampling Sites 4 and 5. These abundances suggest that “unidentified cyprinids” may have been entering and leaving the sites during the course of the releases, which suggests potential displacement.
SACRAMENTO PIKEMINNOW
Sacramento pikeminnow adult abundances are presented in Figure 19. The pattern of change in abundances for Fish Population Sampling Sites 4-6 were similar; abundances decreased after the first release and increased to near pre-release abundances after the second release. The trend was similar to that for adult hardhead. The trend at Fish Population Sampling Site 3 differed, and increased after each release.
Sacramento pikeminnow juvenile abundances exhibited differing patterns of response to the releases; Fish Population Sampling Site 3, the most upstream site, and the two downstream sites, Fish Population Sampling Sites 5 and 6, had similar abundance trends, differing in magnitude. There were no juveniles present prior to the first release, but there were juveniles present afterwards. After the second release, there again, were no juveniles at these sites. At Fish Population Sampling Site 4, no juveniles were present until after the second release. The trends in abundance suggest potential displacement of juveniles.
SACRAMENTO SUCKER
Sacramento sucker adult abundances are presented in Figure 20. There were two trends present in response to the releases. For the upstream and downstream sites (Fish Population Sampling Sites 3 and 6), abundance decreased after the first flow release, and decreased (Fish Population Sampling Site 3) or remained at zero fish (Fish Population Sampling Site 6), after the second release. For the intermediate sites (Fish Population Sampling Sites 4 and 5), there were increases after each release.
Juvenile Sacramento sucker abundances exhibited two trends in response to the releases. At Fish Population Sampling Sites 3, 5, and 6, there was a reduction in abundance after the first release, for Fish Population Sampling Sites 3 and 5 there also were decreases after the second release. At Fish Population Sampling Site 6, there were no juveniles present after the first release. Fish Population Sampling Site 4, abundance increased after the first release and decreased after the second release. The trends in abundance suggest potential displacement of juveniles.
Copyright 2013 by Southern California Edison Company 3-36 Draft 2013
Draft NASMP and AMP – Big Creek No. 4 Hydroelectric Project, FERC No. 2017 2013 Data Collection Report
RAINBOW TROUT
Rainbow trout adult abundances are presented in Figure 21. Adult rainbow trout were only present at the two upstream sites (Fish Population Sampling Sites 3 and 4). Fish Population Sampling Sites 3 and 4 indicated differing responses to the release flows. At Fish Population Sampling Site 3, abundance decreased after the first release and increased after the second release, while at Fish Population Sampling Site 4 one trout was present before and after both flow releases.
Juvenile rainbow trout were absent at Fish Population Sampling Sites 4 and 6. There were few trout present at the other sites. The abundances were too low to determine trends.
SPOTTED BASS
Spotted bass adult abundances are presented in Figure 22. Trends in abundance, before and after the releases, varied by site. Fish Population Sampling Sites 3 and 5 had increased abundance after the first flow release, and decreased abundance after the second flow release. Fish Population Sampling Sites 4 and 6 had relatively few adults present. Abundance at Fish Population Sampling Site 6 increased after each flow release. Fish Population Sampling Site 4 had too few adults present to indicate a trend.
Juvenile spotted bass were present in low abundance (Figure 22). The numbers were too low to indicate trends.
Larval Fish
The following section presents the results of larval fish trapping and systematic dip netting at the study sites, before and after the flow releases. Data are summarized and presented as the average number of fish larvae collected per trap and per replicate for each site for both larval traps and dip net collections, respectively. The results are tabulated in Table 15 for larval trapping and Tables 16 and 17 for dip net collections. Ten dip net replicates were collected at each site before and after each flow release. In addition, the results are summarized to provide the frequency, or number of dip net replicates that contained larvae of each species. Changes in frequency can represent changes in the longitudinal distribution of larval fish along the shoreline, and whether the distribution is sporadic, clumped, or uniform. Length-frequencies of the larval fish are presented in Figures 23 and 24 to examine potential larval fish displacement from flow releases by size range at each sampling location. This can provide an indication of differential displacement by size or an indication of downstream movement of fish larvae of a different size distribution. The raw results of larval fish collections are presented in Appendix D.
Copyright 2013 by Southern California Edison Company 3-37 Draft 2013
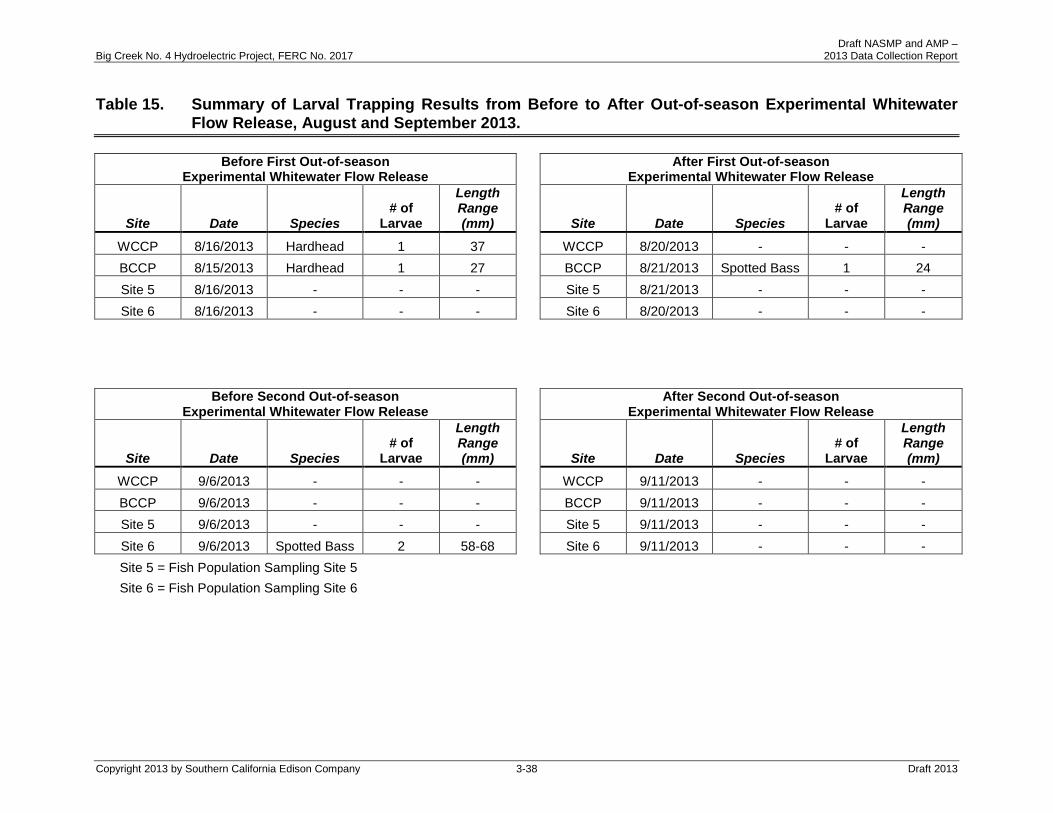
Draft NASMP and AMP – Big Creek No. 4 Hydroelectric Project, FERC No. 2017 2013 Data Collection Report
Table 15. Summary of Larval Trapping Results from Before to After Out-of-season Experimental Whitewater Flow Release, August and September 2013.
Before First Out-of-season Experimental Whitewater Flow Release
After First Out-of-season Experimental Whitewater Flow Release
Site Date Species # of
Larvae
Length Range (mm)
Site Date Species
# of Larvae
Length Range (mm)
WCCP 8/16/2013 Hardhead 1 37
WCCP 8/20/2013 - - - BCCP 8/15/2013 Hardhead 1 27 BCCP 8/21/2013 Spotted Bass 1 24 Site 5 8/16/2013 - - - Site 5 8/21/2013 - - - Site 6 8/16/2013 - - - Site 6 8/20/2013 - - -
Before Second Out-of-season Experimental Whitewater Flow Release
After Second Out-of-season Experimental Whitewater Flow Release
Site Date Species # of
Larvae
Length Range (mm)
Site Date Species
# of Larvae
Length Range (mm)
WCCP 9/6/2013 - - - WCCP 9/11/2013 - - - BCCP 9/6/2013 - - - BCCP 9/11/2013 - - - Site 5 9/6/2013 - - - Site 5 9/11/2013 - - - Site 6 9/6/2013 Spotted Bass 2 58-68 Site 6 9/11/2013 - - - Site 5 = Fish Population Sampling Site 5 Site 6 = Fish Population Sampling Site 6
Copyright 2013 by Southern California Edison Company 3-38 Draft 2013

Draft NASMP and AMP – Big Creek No. 4 Hydroelectric Project, FERC No. 2017 2013 Data Collection Report
Table 16. Summary of Larval Dip Netting Results from Before to After First Out-of-season Experimental Whitewater Flow Release, August 2013.
Willow Creek Confluence Pool Before First Out-of-season Experimental
Whitewater Flow Release After First Out-of-season Experimental
Whitewater Flow Release
Species Frequency1
Dip Net Average
(fish/replicate) Species Frequency
Dip Net Average
(fish/replicate)
Hardhead 0 0 Hardhead 0 0 Sacramento Pikeminnow 0 0
Sacramento Pikeminnow 0 0
Backbone Creek Confluence Pool Before First Out-of-season Experimental
Whitewater Flow Release After First Out-of-season Experimental
Whitewater Flow Release
Species Frequency
Dip Net Average
(fish/replicate) Species Frequency
Dip Net Average
(fish/replicate)
Hardhead 4 0.6 Hardhead 3 1.7 Sacramento Pikeminnow 1 0.4
Sacramento Pikeminnow 5 1.1
Fish Population Sampling Site 5 Before First Out-of-season Experimental
Whitewater Flow Release After First Out-of-season Experimental
Whitewater Flow Release
Species Frequency
Dip Net Average
(fish/replicate) Species Frequency
Dip Net Average
(fish/replicate)
Hardhead 5 1.4 Hardhead 1 0.1 Sacramento Pikeminnow 1 0.1
Sacramento Pikeminnow 0 0
Fish Population Sampling Site 6 Before First Out-of-season Experimental
Whitewater Flow Release After First Out-of-season Experimental
Whitewater Flow Release
Species Frequency
Dip Net Average
(fish/replicate) Species Frequency
Dip Net Average
(fish/replicate)
Hardhead 5 2 Hardhead 3 1.2 Sacramento Pikeminnow 1 0.1
Sacramento Pikeminnow 1 0.1
1 Out of 10 replicates.
Copyright 2013 by Southern California Edison Company 3-39 Draft 2013

Draft NASMP and AMP – Big Creek No. 4 Hydroelectric Project, FERC No. 2017 2013 Data Collection Report
Table 17. Summary of Larval Dip Netting Results from Before to After Second Out-of-season Experimental Whitewater Flow Release, September 2013.
Willow Creek Confluence Pool Before Second Out-of-season Experimental
Whitewater Flow Release After Second Out-of-season Experimental
Whitewater Flow Release
Species Frequency1
Dip Net Average
(fish/replicate) Species Frequency
Dip Net Average
(fish/replicate)
Hardhead 0 0 Hardhead 0 0 Sacramento Pikeminnow 0 0
Sacramento Pikeminnow 0 0
Backbone Creek Confluence Pool Before Second Out-of-season Experimental
Whitewater Flow Release After Second Out-of-season Experimental
Whitewater Flow Release
Species Frequency
Dip Net Average
(fish/replicate) Species Frequency
Dip Net Average
(fish/replicate)
Hardhead 4 1 Hardhead 3 0.3 Sacramento Pikeminnow 2 0.6
Sacramento Pikeminnow 0 0
Fish Population Sampling Site 5 Before Second Out-of-season Experimental
Whitewater Flow Release After Second Out-of-season Experimental
Whitewater Flow Release
Species Frequency
Dip Net Average
(fish/replicate) Species Frequency
Dip Net Average
(fish/replicate)
Hardhead 1 0.2 Hardhead 1 0.1 Sacramento Pikeminnow 1 0.1
Sacramento Pikeminnow 0 0
Fish Population Sampling Site 6 Before Second Out-of-season Experimental
Whitewater Flow Release After Second Out-of-season Experimental
Whitewater Flow Release
Species Frequency
Dip Net Average
(fish/replicate) Species Frequency
Dip Net Average
(fish/replicate)
Hardhead 0 0 Hardhead 1 0.1 Sacramento Pikeminnow 0 0
Sacramento Pikeminnow 0 0
1 Out of 10 replicates.
Copyright 2013 by Southern California Edison Company 3-40 Draft 2013

Draft NASMP and AMP – Big Creek No. 4 Hydroelectric Project, FERC No. 2017 2013 Data Collection Report
Figure 23. Fish Larvae Captured by Dip Net Before and After First Out-of-season Experimental Whitewater Flow Release for Each Site, August 2013.
0123456789
1011121314
Larvae Captured before First Out of Season Experimental Whitewater Flow Release at Backbone Creek Confluence Pool
Freq
uenc
y
Length Range (mm)
Hardhead Sacramento Pikeminnow Spotted Bass
0123456789
101112
Larvae Captured before First Out of Season Experimental Whitewater Flow Release at Fish Population Sampling Site 5
Freq
uenc
y
Length Range (mm)
0123456789
1011121314
Larvae Captured after First Out of Season Experimental Whitewater Flow Release at Backbone Creek Confluence Pool
Freq
uenc
y
Length Range (mm)
0123456789
101112
Length Range (mm)
Freq
uenc
y
Larvae Captured after First Out of Season Experimental Whitewater Flow Release at Fish Population Sampling Site 5
02468
101214161820
Freq
uenc
y
Length Range (mm)
Larvae Captured before First Out of Season Experimental Whitewater Flow Release at Fish Population Sampling Site 6
02468
101214161820
Length Range (mm)
Freq
uenc
y
Larvae Captured after First Out of Season Experimental Whitewater Flow Release at Fish Population Sampling Site 6
Copyright 2013 by Southern California Edison Company 3-41 Draft 2013
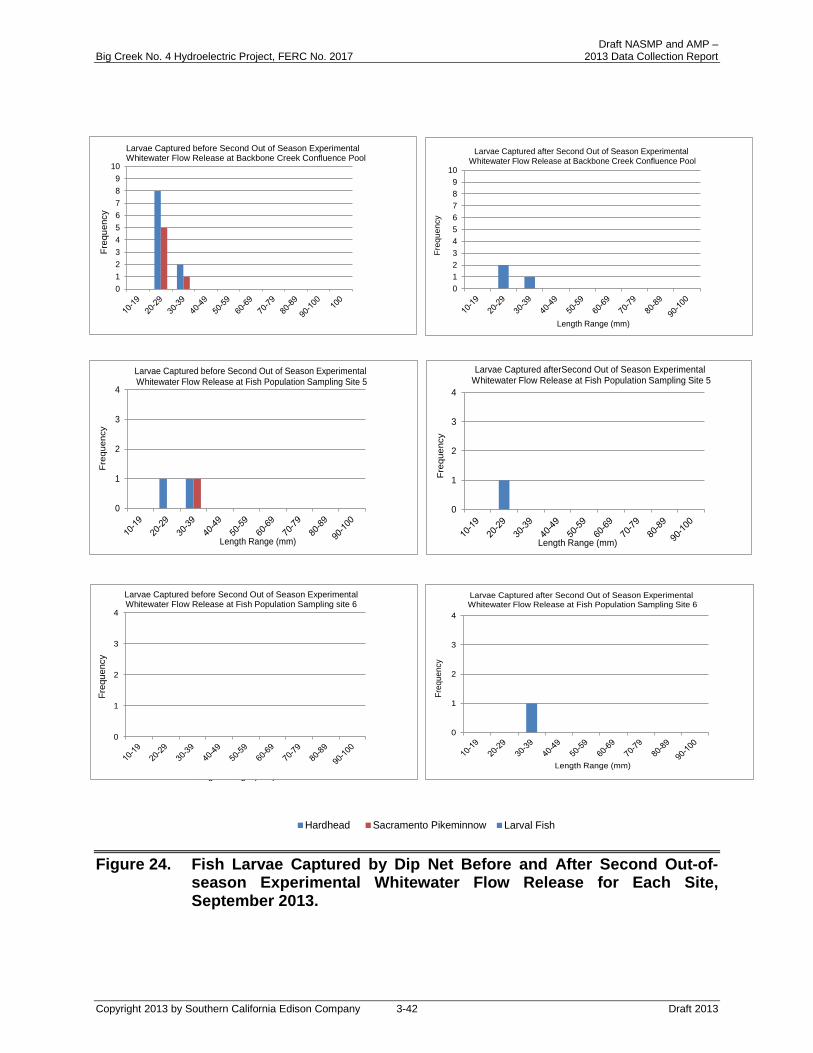
Draft NASMP and AMP – Big Creek No. 4 Hydroelectric Project, FERC No. 2017 2013 Data Collection Report
Figure 24. Fish Larvae Captured by Dip Net Before and After Second Out-of-season Experimental Whitewater Flow Release for Each Site, September 2013.
Length Range (mm)
Length Range (mm)
0
1
2
3
4
Freq
uenc
y
Length Range (mm)
Larvae Captured afterSecond Out of Season Experimental Whitewater Flow Release at Fish Population Sampling Site 5
0
1
2
3
4
Length Range (mm)
Freq
uenc
y
Larvae Captured before Second Out of Season Experimental Whitewater Flow Release at Fish Population Sampling Site 5
Larval FishHardhead Sacramento Pikeminnow
0123456789
10
Freq
uenc
y
Larvae Captured before Second Out of Season Experimental Whitewater Flow Release at Backbone Creek Confluence Pool
0
1
2
3
4
Freq
uenc
y
Larvae Captured before Second Out of Season Experimental Whitewater Flow Release at Fish Population Sampling site 6
0123456789
10
Length Range (mm)
Freq
uenc
y
Larvae Captured after Second Out of Season Experimental Whitewater Flow Release at Backbone Creek Confluence Pool
0
1
2
3
4
Freq
uenc
y
Length Range (mm)
Larvae Captured after Second Out of Season Experimental Whitewater Flow Release at Fish Population Sampling Site 6
Copyright 2013 by Southern California Edison Company 3-42 Draft 2013

Draft NASMP and AMP – Big Creek No. 4 Hydroelectric Project, FERC No. 2017 2013 Data Collection Report
Relatively few larval fish were collected during sampling. Larval sampling took place after mid-August, when larval fish are much less abundant than earlier in the summer during non-spill years. Although there were indications of changes in larval fish abundance, numbers are too low to provide definitive trends in response to the releases.
3.3 STATUS OF NATIVE AQUATIC SPECIES
3.3.1 WESTERN POND TURTLE
Data collected during trapping for radio tagging and additional trapping conducted for population status are discussed in this section.
3.3.1.1 Abundance and Population Structure Surveys
There were 41 captures of 28 different WPTs in 2013 (Table 18). Ten turtles were recaptured from previous years. Eighteen turtles were new captures and marked (notched) in 2013. There were 12 different adult/subadult females, 14 adult/subadult males, and two juvenile turtles of undetermined sex. Turtles identified as female ranged in size from 116 to 141 mm. Identified males ranged in size from 110 to 180 mm. All turtles were captured at study locations in Willow Creek, WCCP, and BCCP. None of the 12 adult/subadult females was gravid.
All captured turtles, appeared to be in good health, and did not have active lesions or critical (life-threatening) damage. Most all the turtles had scute chips in their carapaces and scrapes on their plastrons. Several larger males had large chips and cracks that encompassed multiple scutes. All external damage found, appeared to be healed and not adversely affecting the turtle’s health.
Carapace growth in recaptured females ranged from 0 to 7 mm/year (Table 19). The largest increase in growth (7 mm) was found in a female initially captured in 2012. This turtle was estimated to be seven years old in 2013. The lowest amount of growth was found in two females, one captured in 2010, and another in 2012, where no growth was evident. One of these females was estimated at nine years old; the other could not be determined. Carapace growth in male turtles ranged from 5 to 6 mm/year. The largest increase in growth was observed in a male first captured in 2012, which grew 6 mm. The age of this turtle could not be determined. A second male first captured in 2011, grew 10 mm between 2011 and 2013, at an average rate of 5 mm/year. This male’s age was estimated at 11 years old in 2013.
Copyright 2013 by Southern California Edison Company 3-43 Draft 2013

Draft NASMP and AMP – Big Creek No. 4 Hydroelectric Project, FERC No. 2017 2013 Data Collection Report
Table 18. Western Pond Turtle Capture Data in 2013.
Date Site Gender Age
(years) Notch Loc. Lifestage Weight
(g) Carapace
(mm) Recapture 7/9/13 WCCP¹ Male n/a 1211 Adult 350 124 No 7/9/13 WC2 Female 9 106 Adult 225 116 Yes-2010 7/9/13 WCCP Male n/a 1200 Adult 450 144 No 7/9/13 WCCP Male n/a 1201 Adult 325 125 No 7/10/13 WCCP Female n/a 40 Adult 375 129 Yes-2012 7/10/13 WCCP Female n/a 301 Adult 410 137 Yes-2010 7/10/13 WCCP Male n/a 805 Adult 275 123 No 7/10/13 WCCP Male n/a 1200 Adult 450 144 Yes-2013 7/10/13 WCCP Male n/a 1206 Adult 400 141 No 7/10/13 WCCP Female n/a 837* Adult 400 141 Yes-2012 7/10/13 WCCP Male n/a 1207 Adult 300 124 No 7/17/13 BCCP3 Female 8 9 Adult 250 131 Yes-2012 7/17/13 BCCP Female n/a 10 Adult 300 125 Yes-2011 7/17/13 BCCP Male n/a 821 Adult 450 150 No 7/17/13 BCCP Female 9 822 Adult 300 124.5 No 7/17/13 BCCP Female n/a 825 Adult 325 131.5 No 7/17/13 BCCP Male n/a 837*M Adult 500 153 No 7/17/13 BCCP Unknown n/a 29 Juvenile 150 105.1 Yes-2012 7/17/13 BCCP Male 9 806 Juvenile 150 120 No 7/17/13 BCCP Male 8 826 Juvenile 150 114 No 7/23/13 BCCP Unknown 7 n/a Juvenile n/a 110 No 7/24/13 BCCP Female n/a 10 Adult 300 125 Yes-2011 7/24/13 BCCP Female 9 822 Adult 300 124.5 Yes-2013
Copyright 2013 by Southern California Edison Company 3-44 Draft 2013

Draft NASMP and AMP – Big Creek No. 4 Hydroelectric Project, FERC No. 2017 2013 Data Collection Report
Table 18. Western Pond Turtle Capture Data in 2013 (continued).
Date Site Gender Age
(years) Notch Loc. Lifestage Weight
(g) Carapace
(mm) Recapture 7/24/13 BCCP Female n/a 825 Adult 325 131.5 Yes-2013
7/24/13 BCCP Male n/a 837*M Adult 500 153 Yes-2013
7/24/13 BCCP Male n/a n/a Adult 400 153 No
7/24/13 WCCP Male n/a 447 Adult 400 144.5 Yes-2012
8/15/13 BCCP Female 8 9 Adult 250 131 Yes-2012
8/15/13 BCCP Male 11 28 Adult 450 180 Yes-2011
8/15/13 BCCP Female n/a 100 Adult 400 134 No
8/15/13 BCCP Female 6 to 7 102 Adult 350 134 No
8/15/13 BCCP Female 7 to 8 103 Adult 375 134.5 No
8/15/13 BCCP Female 7 420 Adult 300 123 Yes?
8/15/13 BCCP Male 9 806 Juvenile 150 120 Yes-2013
9/24/13 WC Male n/a 1200 Adult 500 145 Yes-2013
9/25/13 BCCP Male n/a 821 Adult 425 150 Yes-2013
9/25/13 BCCP Unknown 7-8 years 29 Juvenile 225 107 Yes-2012
9/25/13 WC Male n/a 1207 Adult 350 124 Yes -2013
9/25/13 WC Female n/a 837* Adult 450 140 Yes-2012
9/26/13 BC4 Male n/a 110 Sub-Adult 250 110 No
9/26/13 BCCP Male 8 826 Juvenile 250 115 Yes-2013
* Turtles share same scute notch number ¹ WCCP = Willow Creek Confluence Pool ² WC = Willow Creek ³ BCCP = Backbone Creek Confluence Pool 4 BC = Backbone Creek
Copyright 2013 by Southern California Edison Company 3-45 Draft 2013

Draft NASMP and AMP – Big Creek No. 4 Hydroelectric Project, FERC No. 2017 2013 Data Collection Report
Table 19. Growth Rates for Recaptured Western Pond Turtles Captured in 2013.
Notch # Gender Initial Capture
Year Length Change
(mm) Length Change
(mm/year) 106 Female 2010 10 3.3
40 Female 2012 2 2.0
837 Female 2012 2 2.0
301 Female 2010 0 0.0
9 Female 2012 0 0.0
447 Male 2012 6 6.0
10 Female 2011 8 4.0
28 Male 2011 10 5.0
29 Undetermined 2012 7 7.0
420 Female 2012 7 7.0
Lengths for 2008-2012 can be found in SCE (2009b, 2011, 2012b, and 2013b)
Copyright 2013 by Southern California Edison Company 3-46 Draft 2013

Draft NASMP and AMP – Big Creek No. 4 Hydroelectric Project, FERC No. 2017 2013 Data Collection Report
On multiple occasions, turtles were observed to have moved between habitats. Movements were determined from a combination of radio tracking and identification of marked WPTs from multiple trap captures (associated with both the radio tagging captures and the WPT abundance and population structure study). The movements observed primarily occurred between habitats in Willow Creek and the WCCP (Appendix C). Most movements were within 250 m and consisted of turtles moving between the WCCP and the three pools furthest downstream in Willow Creek. However, one male turtle captured in the WCCP on July 17 was later captured on September 10, in a pool in Willow Creek 850 meters upstream from its previous capture location. This movement represents the longest turtle movement recorded between all captures in the study area.
3.3.1.2 Habitat Characterization
No major changes to WPT habitat in the HSB were observed in 2013. The most suitable habitats remain the confluence pools at WCCP and BCCP. Characteristics at these locations include; undercut banks with adventitious roots, steep banks adjacent to deep water (>1.2 m [4 ft]), and overhanging willows and/or alders for concealment and escape cover. The sites all have some algal growth and aquatic plants for forage and safe basking sites adjacent to escape cover. In addition, the adjacent terrestrial habitat has riparian ground cover and trees for additional concealment cover. Aside from the confluence pools, the majority of the mainstem SJR contains habitat of marginal value to WPTs, mainly due to; little or no escape cover, lack of algae and aquatic plants, narrow channel widths, excessive bank steepness, and swift water velocities
The critical water year in 2013 resulted in lack of surface flows in HSB tributaries sooner than has been typical. During WPT VES in July, Backbone and Bald Mill creeks had dry channels and could not support WPTs (Figure 25). Willow Creek maintained flows all year, as usual. Habitat characteristics found in Willow Creek were similar to past years and included shallow water riffles and pools, large woody piles, banks with adventitious roots, and overhanging willows and/or alders for concealment and escape cover (Figure 26). Willow Creek also has a wide variety of food sources and safe basking sites adjacent to escape cover. In addition, the adjacent terrestrial habitat has riparian ground cover and trees for additional concealment cover.
Copyright 2013 by Southern California Edison Company 3-47 Draft 2013
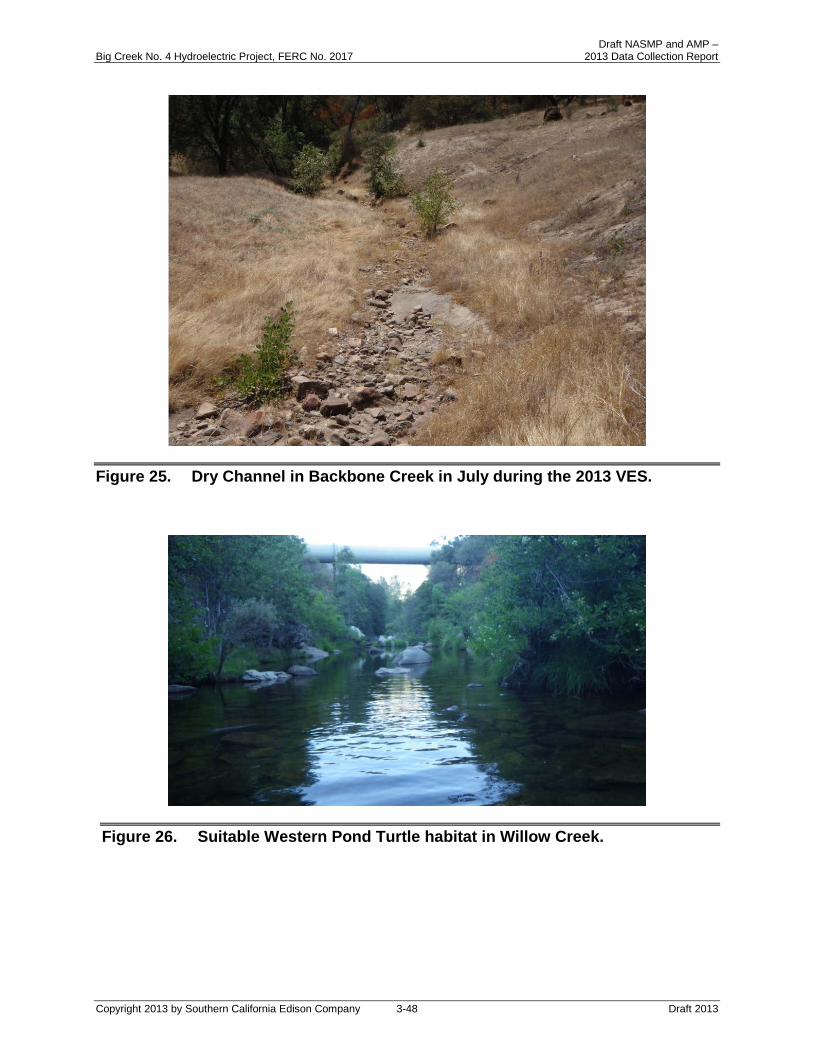
Draft NASMP and AMP – Big Creek No. 4 Hydroelectric Project, FERC No. 2017 2013 Data Collection Report
Figure 25. Dry Channel in Backbone Creek in July during the 2013 VES.
Figure 26. Suitable Western Pond Turtle habitat in Willow Creek.
Copyright 2013 by Southern California Edison Company 3-48 Draft 2013

Draft NASMP and AMP – Big Creek No. 4 Hydroelectric Project, FERC No. 2017 2013 Data Collection Report
3.3.2 MOLLUSCS
The results of the 2013 mussel monitoring differed from previous years’ results in estimated abundance, but not in spatial distribution. Mussel surveys were conducted at the three sites sampled in 2010 through 2012. These were Mussel Sites 5 (including Sandbar to Mussel Site 5), 6, and 7, the only sites containing molluscs of the seven sites originally investigated for their presence in the HSB.
3.3.2.1 Mussel Site 5
SANDBAR TO MUSSEL SITE 5
A total of 128 mussels was counted from the Sandbar to Mussel Site 5 during 2013 (Table 20). Fewer mussels were found in this stretch of river in 2012 (29 mussels), 2011 (six mussels), and 2010 (nine mussels) (SCE 2013b, 2012b, 2011). Of the 128 mussels counted in 2013, 107 were found in gravel patches located underneath several huge (~2 to 8 meters in diameter) boulders that create a constriction in the river about 250 meters upstream from the sandbar pool (Figure 27). The river flows underneath these large bedrock-boulders, creating unique cave or tunnel-like habitats. One of these tunnel habitats was searched in 2012 and 2013, but not in previous years; it contained a grouping of 11 live mussels and five shells in 2012, and 10 live mussels and five shells in 2013. Three new tunnel habitats were discovered in 2013; these contained groupings of 20, 50, and 27 mussels, respectively. These cryptic habitats were not thoroughly searched during previous survey years, because they are in deeper water and difficult to access under typical summer flow conditions.
MUSSEL SITE 5
Six mussels and two shells were counted in 2013. Mussel counts within Mussel Site 5 were similar among survey years; nine mussels were counted in 2012, compared to 11 mussels in 2011 and 10 mussels in 2010 (Table 20). The mussels were found in the same general locations each year.
3.3.2.2 Mussel Site 6
Mussel counts within Mussel Site 6 were similar to earlier survey years (Table 20). The mussels observed in 2013 were located in the same locations and were anchored in the same substrates as they were in previous survey years.
Copyright 2013 by Southern California Edison Company 3-49 Draft 2013

Draft NASMP and AMP – Big Creek No. 4 Hydroelectric Project, FERC No. 2017 2013 Data Collection Report
Table 20. Summary of Mollusc Survey Data for Three Locations (Sandbar to Site 5, Site 5, and Site 6) Collected in 20101, 20112, 20123, and 20134.
Survey Location Survey
Year
Length of Survey Area
(m) Habitat Type(s) Number of
Shells
Number of Live
Mussels
Sandbar to Mussel Site 5:
2010 430
Open Sand/Gravel Patches Covered
Sand/Gravel Patches (tunnels)
0 9
2011 430 Channel Rock Crevices 2 6
2012 430 Channel Rock Crevices 5 29
2013 430 Bank Crevices 10 128
Mussel Site 5:
2010 100 Open Sand/Gravel Patches 0 10
2011 100 Channel Rock Crevices 0 11
2012 100 Channel Rock Crevices 0 9
2013 100 Bank Crevices 2 6
Mussel Site 6:
2010 34 Channel Rock Crevices 0 17
2011 34 Channel Rock Crevices 2 16
2012 34 Bank Crevices 1 14
2013 34 Bank Crevices 0 16 1 SCE 2011. 2 SCE 2012b. 3 SCE 2013b. 4 This report.
Copyright 2013 by Southern California Edison Company 3-50 Draft 2013
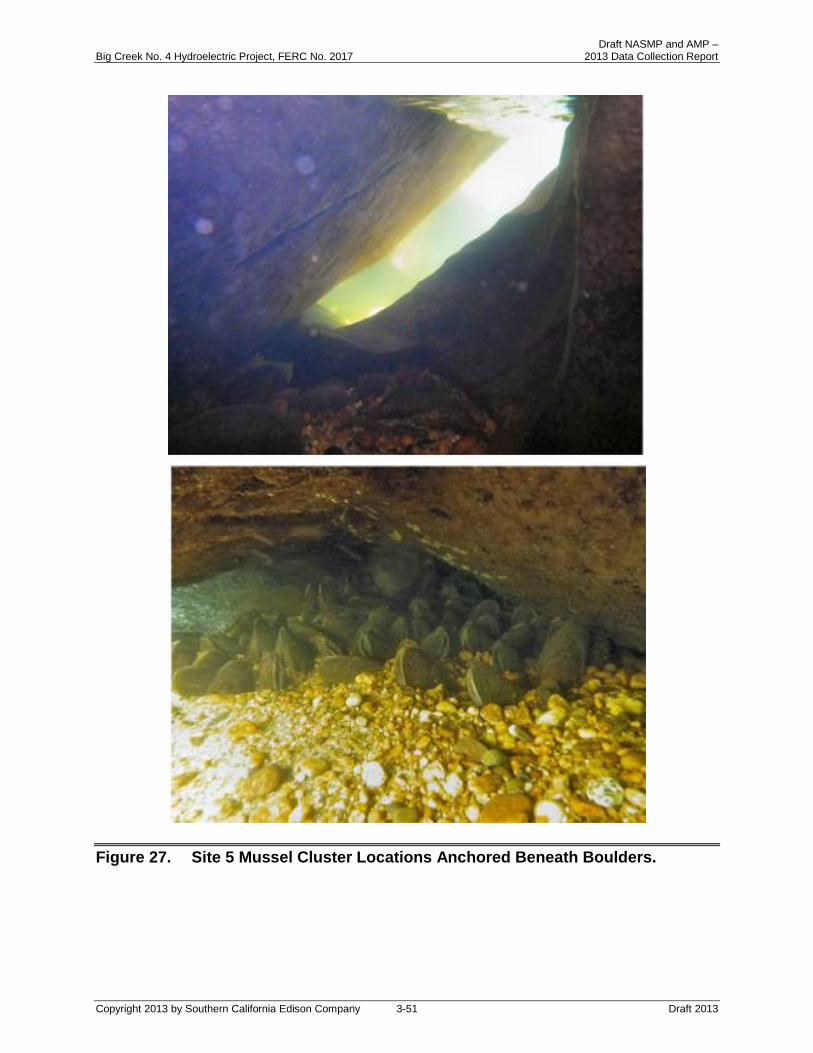
Draft NASMP and AMP – Big Creek No. 4 Hydroelectric Project, FERC No. 2017 2013 Data Collection Report
Figure 27. Site 5 Mussel Cluster Locations Anchored Beneath Boulders.
Copyright 2013 by Southern California Edison Company 3-51 Draft 2013

Draft NASMP and AMP – Big Creek No. 4 Hydroelectric Project, FERC No. 2017 2013 Data Collection Report
3.3.2.3 Mussel Site 7
The total number of mussels at Mussel Site 7 was estimated to be between 639 and 1,235 in 2013, and between 905 and 1,471 during the baseline survey years, based on the calculated densities and the total area surveyed. The mussel bed at Mussel Site 7 was located within a 438 m2 (4,715 ft²) area at the downstream end of a long, deep pool. The headpin (0 m [0 ft] mark) that was established in 2010 was located at the pool tail crest, along the river-left bank. This longitudinal distribution (from downstream to upstream) of mussels within the site did not appear to differ among survey years. In all years, the area of high density was located between 4 m (13 ft) and 17 m (56 ft) upstream from the headpin, and the area of low density was located between 17 m (56 ft) and 34 m (112 ft) upstream from the headpin. The discontinuous and highly clumped distribution of mussels (areas of high and low density) in this site resulted in relatively large uncertainty in the estimates of mussel abundance. The Fourth Year Proposal Native Aquatic Species Management Plan-Adaptive Management Plan (SCE 2013a) included a modification of the methodology to include increased sampling to compensate for the distribution and result in improved estimates.
The overall mean density (number per square meter [m2]) of mussels within Mussel Site 7, which was based on counts within 100 sample quadrats in 2013 and 50 sample quadrats in all other years, varied greatly among years with no increasing or decreasing trend (Table 21). Mean density (mussels/m2) ± standard error (SE) was 2.2 ± 0.70 in 2013, compared to 1.36 ± 0.60 in 2012, 4.24 ± 1.50 in 2011, and 2.72 ± 1.14 in 2010. Standard error was reduced by combining the baseline data sets to yield an overall baseline density of 2.77 ± 0.66 mussels/m2. Differences in mean density between the 2013 data set and the baseline data set (2012, 2011, and 2010 combined) were not found to be statistically significantly different (p = 0.563) using ANOVA, although the sample size may be too small to detect a statistically significant difference, if one were present.
Based on the calculated densities and the total area surveyed each year, which was slightly variable, the total number of mussels at Mussel Site 7 was estimated to be between 639 and 1,235 in 2013, and between 905 and 1,471 during the baseline survey years. Mean density for all years combined was 2.54 ± 0.48 mussels/m2; when multiplied by a mean site area of 427.5 m2, this equates to an estimated abundance of 881–1291 mussels.
Mean water depth and substrate characteristics were similar among years during sampling. In all years, a thin layer of dead algae (likely Cladophora sp.) coated in silt/detritus covered most of the larger substrate (i.e., boulders and cobbles). Although the mussels at Site 7 also were coated with a thin layer of algae/silt/detritus, they were easily distinguished from the surrounding substrate in all survey years.
Copyright 2013 by Southern California Edison Company 3-52 Draft 2013
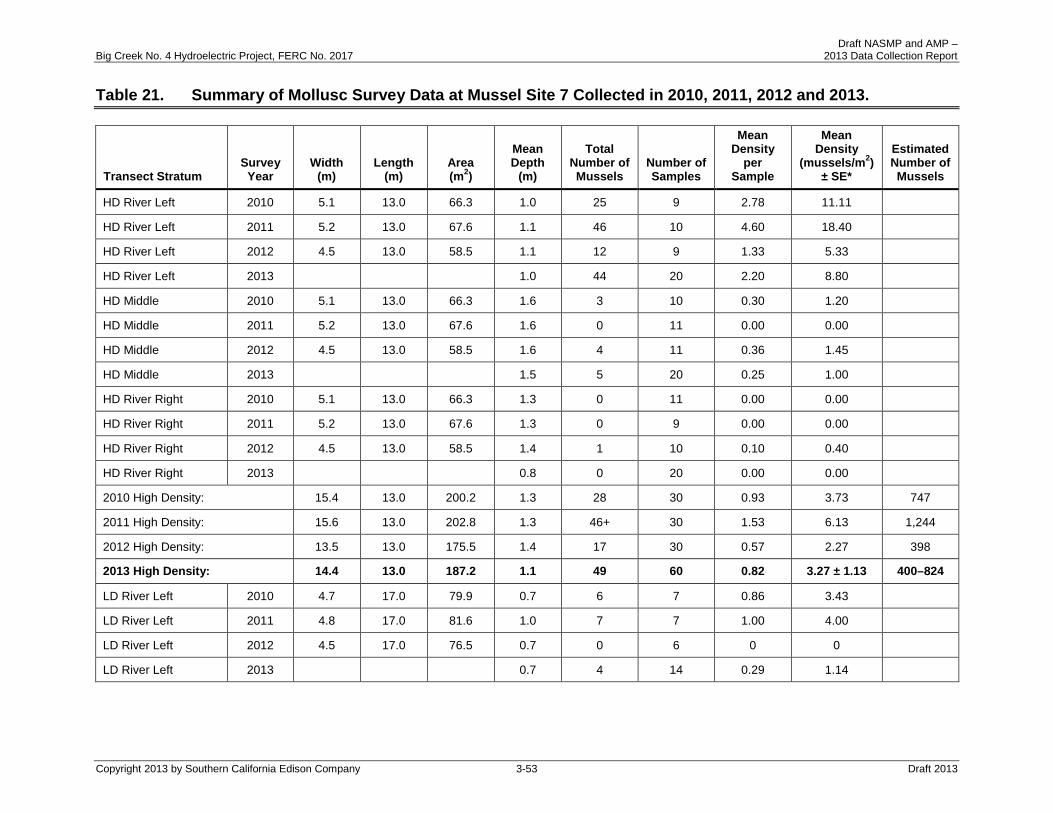
Draft NASMP and AMP – Big Creek No. 4 Hydroelectric Project, FERC No. 2017 2013 Data Collection Report
Table 21. Summary of Mollusc Survey Data at Mussel Site 7 Collected in 2010, 2011, 2012 and 2013.
Transect Stratum Survey
Year Width
(m) Length
(m) Area (m2)
Mean Depth
(m)
Total Number of Mussels
Number of Samples
Mean Density
per Sample
Mean Density
(mussels/m2) ± SE*
Estimated Number of Mussels
HD River Left 2010 5.1 13.0 66.3 1.0 25 9 2.78 11.11
HD River Left 2011 5.2 13.0 67.6 1.1 46 10 4.60 18.40
HD River Left 2012 4.5 13.0 58.5 1.1 12 9 1.33 5.33
HD River Left 2013 1.0 44 20 2.20 8.80
HD Middle 2010 5.1 13.0 66.3 1.6 3 10 0.30 1.20
HD Middle 2011 5.2 13.0 67.6 1.6 0 11 0.00 0.00
HD Middle 2012 4.5 13.0 58.5 1.6 4 11 0.36 1.45
HD Middle 2013 1.5 5 20 0.25 1.00
HD River Right 2010 5.1 13.0 66.3 1.3 0 11 0.00 0.00
HD River Right 2011 5.2 13.0 67.6 1.3 0 9 0.00 0.00
HD River Right 2012 4.5 13.0 58.5 1.4 1 10 0.10 0.40
HD River Right 2013 0.8 0 20 0.00 0.00
2010 High Density: 15.4 13.0 200.2 1.3 28 30 0.93 3.73 747
2011 High Density: 15.6 13.0 202.8 1.3 46+ 30 1.53 6.13 1,244
2012 High Density: 13.5 13.0 175.5 1.4 17 30 0.57 2.27 398
2013 High Density: 14.4 13.0 187.2 1.1 49 60 0.82 3.27 ± 1.13 400–824
LD River Left 2010 4.7 17.0 79.9 0.7 6 7 0.86 3.43
LD River Left 2011 4.8 17.0 81.6 1.0 7 7 1.00 4.00
LD River Left 2012 4.5 17.0 76.5 0.7 0 6 0 0
LD River Left 2013 0.7 4 14 0.29 1.14
Copyright 2013 by Southern California Edison Company 3-53 Draft 2013
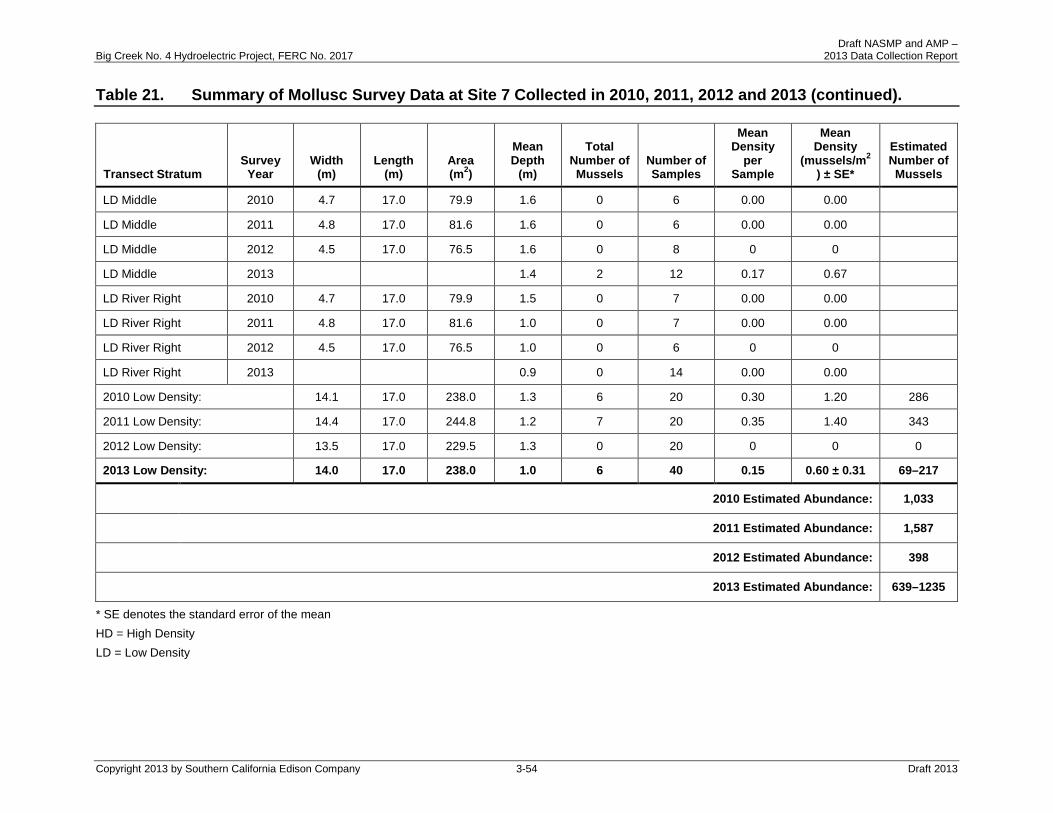
Draft NASMP and AMP – Big Creek No. 4 Hydroelectric Project, FERC No. 2017 2013 Data Collection Report
Table 21. Summary of Mollusc Survey Data at Site 7 Collected in 2010, 2011, 2012 and 2013 (continued).
Transect Stratum Survey
Year Width
(m) Length
(m) Area (m2)
Mean Depth
(m)
Total Number of Mussels
Number of Samples
Mean Density
per Sample
Mean Density
(mussels/m2
) ± SE*
Estimated Number of Mussels
LD Middle 2010 4.7 17.0 79.9 1.6 0 6 0.00 0.00
LD Middle 2011 4.8 17.0 81.6 1.6 0 6 0.00 0.00
LD Middle 2012 4.5 17.0 76.5 1.6 0 8 0 0
LD Middle 2013 1.4 2 12 0.17 0.67
LD River Right 2010 4.7 17.0 79.9 1.5 0 7 0.00 0.00
LD River Right 2011 4.8 17.0 81.6 1.0 0 7 0.00 0.00
LD River Right 2012 4.5 17.0 76.5 1.0 0 6 0 0
LD River Right 2013 0.9 0 14 0.00 0.00
2010 Low Density: 14.1 17.0 238.0 1.3 6 20 0.30 1.20 286
2011 Low Density: 14.4 17.0 244.8 1.2 7 20 0.35 1.40 343
2012 Low Density: 13.5 17.0 229.5 1.3 0 20 0 0 0
2013 Low Density: 14.0 17.0 238.0 1.0 6 40 0.15 0.60 ± 0.31 69–217
2010 Estimated Abundance: 1,033
2011 Estimated Abundance: 1,587
2012 Estimated Abundance: 398
2013 Estimated Abundance: 639–1235
* SE denotes the standard error of the mean HD = High Density LD = Low Density
Copyright 2013 by Southern California Edison Company 3-54 Draft 2013

Draft NASMP and AMP – Big Creek No. 4 Hydroelectric Project, FERC No. 2017 2013 Data Collection Report
3.3.3 FISH
The results of the 2013 fish sampling (species composition, density, and population characteristics) are discussed below.
3.3.3.1 Species Composition and Density
There were 313 fish identified to species and counted through electrofishing and snorkeling combined. This does not include large numbers of unidentified age 0 cyprinids (discussed below). The fish community in the SJR between Dam 7 and PH4, based on population estimates from electrofishing and fish observed, consisted of 29.7 percent hardhead, 22 percent Sacramento sucker, 15 percent Sacramento pikeminnow, 14.4 percent rainbow trout, 10.2 percent prickly sculpin, and 8.6 percent spotted bass (Figure 28). In addition, large numbers (approximately 2,503) of small (0 to 3 inches [76 mm]) cyprinids were found in the margins of the snorkeled pool habitat. These small fish were designated as “unidentified cyprinids,” and were largely hardhead with some Sacramento pikeminnow, based on their morphological features and qualitative sampling.
Qualitative captures made using cast nets and spot electrofishing were used to examine the composition of portions of these “unidentified cyprinids.” Captures indicated that the “unidentified cyprinids” appear to consist mostly of hardhead with smaller numbers of Sacramento pikeminnow present. Based on the sizes observed, they were nearly all young-of-the-year (age 0) fish. The “unidentified cyprinids” outnumbered all other fish found (Figure 29) and when included in the community composition, made up 95 percent of the fish composition.
Estimates for fish densities by site are provided in Table 22. These densities are based on the combined densities for both population estimates from electrofishing and snorkel counts. Fish species densities for all sites combined were as follows: hardhead 48.5 fish/km, Sacramento suckers 36 fish/km, Sacramento pikeminnow 24.5 fish/km, rainbow trout 23.5 fish/km, and “unidentified cyprinids” (age 0 and age 1 hardhead and Sacramento pikeminnow) 1,305.7 fish/km (Table 23). Although not abundant, spotted bass, a non-native species of the sunfish family (Centrarchidae), was present at many of the sites. Estimates for biomass by species are based on weights measured from electrofishing only. Biomass estimates for each site are given in Table 24. Results for each site are discussed below. Species compositions at each site, without “unidentified cyprinids,” are provided in Figures 30 and 31.
Copyright 2013 by Southern California Edison Company 3-55 Draft 2013

Draft NASMP and AMP – Big Creek No. 4 Hydroelectric Project, FERC No. 2017 2013 Data Collection Report
Figure 28. Species Composition – Electroshocking and Snorkel Data not including “Unidentified Cyprinids,” 2013.
Rainbow Trout14.4%
Sacramento Sucker22.0%
Hardhead29.7%
Sacramento Pikeminnow
15.0%
Spotted Bass8.6%
Prickly Sculpin10.2%
Rainbow Trout
Sacramento Sucker
Hardhead
Sacramento Pikeminnow
Spotted Bass
Prickly Sculpin
Copyright 2013 by Southern California Edison Company 3-56 Draft 2013
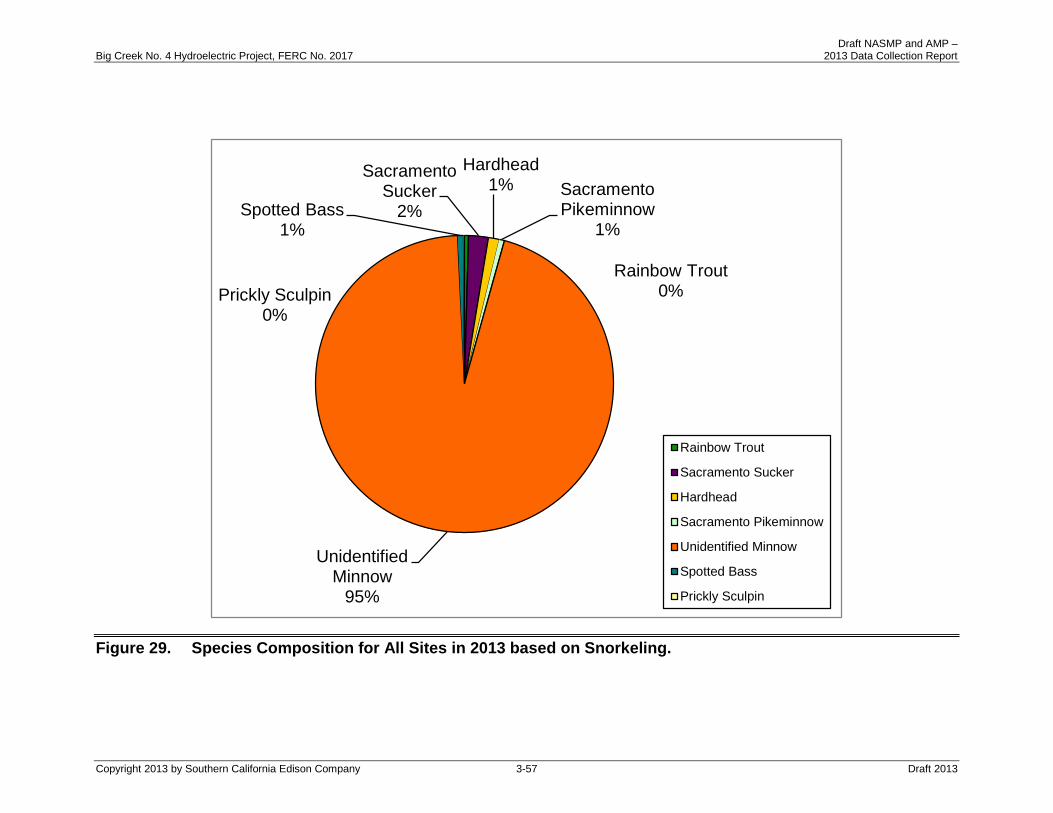
Draft NASMP and AMP – Big Creek No. 4 Hydroelectric Project, FERC No. 2017 2013 Data Collection Report
Figure 29. Species Composition for All Sites in 2013 based on Snorkeling.
Rainbow Trout0%
Sacramento Sucker
2%
Hardhead1% Sacramento
Pikeminnow1%
Unidentified Minnow
95%
Spotted Bass1%
Prickly Sculpin0%
Rainbow Trout
Sacramento Sucker
Hardhead
Sacramento Pikeminnow
Unidentified Minnow
Spotted Bass
Prickly Sculpin
Copyright 2013 by Southern California Edison Company 3-57 Draft 2013

Draft NASMP and AMP – Big Creek No. 4 Hydroelectric Project, FERC No. 2017 2013 Data Collection Report
Table 22. Population and Density Estimates for Electrofishing and Snorkeling Sampling, October 2013.
Site Unit² Species
Estimated Fish Population
Size Range (millimeters)
Number of Fish Captured or Observed³
Population Estimate⁴
Lower 95 Percent
Confidence Limit⁵
Upper 95 Percent
Confidence Limit
Density Estimate
Number per Kilometer
1¹
Sacramento Sucker 160-240 0(1) 1 1 - 2
Sacramento Pikeminnow >240 0(2) 2 2 - 5
Spotted Bass 160-240+ 0(2) 2 2 - 5
Prickly Sculpin <80 0(1) 1 1 - 2
”Unidentified Cyprinids” <80 0(1) 1 1 - 2
2
15 Hardhead 160-240+ 0(3) 3 3 - 6
Sacramento Sucker 232-240+ 1(2) 3 3 - 6
Sacramento Pikeminnow >240 0(2) 2 2 - 4
Rainbow Trout 160-240+ 4(4) 8 8 10 15
Prickly Sculpin <80 23(1) 25 24 29 46
Spotted Bass 80-240+ 0(12) 12 12 - 22
3
Sacramento Sucker 80-240+ 1(21) 22 22 - 139
Sacramento Pikeminnow >240 0(3) 3 3 - 19
Rainbow Trout 160-267 2(4) 6 6 30 38
Prickly Sculpin 105-108 2(0) 2 2 7 13
”Unidentified Cyprinids” <80 0(5) 5 5 - 32
Copyright 2013 by Southern California Edison Company 3-58 Draft 2013

Draft NASMP and AMP – Big Creek No. 4 Hydroelectric Project, FERC No. 2017 2013 Data Collection Report
Table 22. Population and Density Estimates for Electrofishing and Snorkeling Sampling Sites, October 2013 (continued).
Site Unit² Species
Estimated Fish Population
Size Range (millimeters)
Number of Fish Captured or Observed³
Population Estimate⁴
Lower 95 Percent
Confidence Limit⁵
Upper 95 Percent
Confidence Limit
Density Estimate
Number per Kilometer
4
69 Hardhead 80-240+ 2(9) 11 11 16 42
Sacramento Sucker 60-320 7(22) 29 29 32 112
Sacramento Pikeminnow 80-240+ 2(5) 7 7 12 27
Rainbow Trout 80-252 3(3) 6 6 9 23
”Unidentified Cyprinids” <160 876 876 876 - 3,381
5
81 Hardhead 34-240+ 23(9) 35 32 43 154
Sacramento Sucker 51-240+ 3(9) 12 12 - 53
Sacramento Pikeminnow 49-240+ 4(2) 6 6 7 26
Rainbow Trout 65-115 7 24 7 200 106
Prickly Sculpin 65-99 3 3 3 4 13
Spotted Bass 160-240 0(1) 1 1 - 4
”Unidentified Cyprinids” <80-160 0(822) 822 822 - 3,625
Copyright 2013 by Southern California Edison Company 3-59 Draft 2013

Draft NASMP and AMP – Big Creek No. 4 Hydroelectric Project, FERC No. 2017 2013 Data Collection Report
Table 22. Population and Density Estimates for Electrofishing and Snorkeling Sampling Sites, October 2013 (continued).
Site Unit² Species
Estimated Fish Population
Size Range (millimeters)
Number of Fish Captured or Observed³
Population Estimate⁴
Lower 95 Percent
Confidence Limit⁵
Upper 95 Percent
Confidence Limit
Density Estimate
Number per Kilometer
6
109 Hardhead 35-240 33(9) 44 42 49 146
Sacramento Pikeminnow 38-240+ 16(2) 27 18 57 90
Sacramento Sucker 240+ 0(2) 2 2 - 7
Rainbow Trout 160-240 0(1) 1 1 - 3
Prickly Sculpin 95 1 1 1 - 3
Spotted Bass 46-86 2(2) 12 4 277 40
”Unidentified Cyprinids” <80 0(799) 799 799 - 2,653
1 Site was too swift and turbulent to block off and shock safely. ² Unit numbers represent habitat units identified during 1997 habitat mapping by Cardno ENTRIX. These habitat units were electrofished. ³ Number of fish collected (number of fish enumerated from direct observation [snorkeling] in habitats too deep for electrofishing methods in parentheses). ⁴ Fish population estimates were calculated from electrofishing data plus the number of fish observed by direct observation. ⁵ The calculated lower confidence interval for the population was lower than the number of fish captured/observed; the lower confidence interval was therefore set
equal to the total number of fish captured plus the number of fish observed.
Copyright 2013 by Southern California Edison Company 3-60 Draft 2013

Draft NASMP and AMP – Big Creek No. 4 Hydroelectric Project, FERC No. 2017 2013 Data Collection Report
Table 23. Density Estimates and Percentage Composition by Species for Combined Sites, 2013.
Species
Density Estimate
Number per Kilometer
Percentage of Total Fish Observed and Captured
with Cyprinids <75 mm
Percentage of Total Fish Observed and Captured
without Cyprinids <75 mm
Hardhead 48.5 3.3 29.7
Sacramento Sucker 36.0 2.5 22.0
Sacramento Pikeminnow 24.5 1.7 15.0
Rainbow Trout 23.5 1.6 14.4
Prickly Sculpin 16.7 1.1 10.2
Spotted bass 14.1 1.0 8.6
”Unidentified Cyprinids” <75 mm 1,305.7 88.9 -
Copyright 2013 by Southern California Edison Company 3-61 Draft 2013

Draft NASMP and AMP – Big Creek No. 4 Hydroelectric Project, FERC No. 2017 2013 Data Collection Report
3.3.3.2 Population Characteristics
Length Frequency and Condition Factors Length-frequency histograms for fish observed during snorkeling are presented in Figures 32 through 35. Multiple year classes of hardhead, Sacramento sucker, and Sacramento pikeminnow were observed among the combined fish population sampling sites in 2013. “Unidentified cyprinids” were observed primarily in the 0- to 3-inch (0- to 76-mm) size range and a small number in the 3- to 6-inch (76- to 152-mm) size range (Figure 32). These fish were a mixture of hardhead and Sacramento pikeminnow based on qualitative captures made to examine the composition of “unidentified cyprinids.”
The distribution of size classes of hardhead (Figure 33), Sacramento pikeminnow (Figure 34), and Sacramento sucker (Figure 35) suggest that multiple age classes are present. Age 1+ hardhead was more abundant than older age classes present, and relatively more abundant in comparison to older age classes than found during 2012, particularly age 3+ hardhead. Age 1+ Sacramento pikeminnow were far less abundant than in 2012. No age 2+ Sacramento pikeminnow were observed in 2013. However, the abundance of age 3+ Sacramento pikeminnow was the same as 2012. There were few age 0+ Sacramento suckers present in contrast to over six hundred counted in 2012. Few ages 1+ and 2+ Sacramento suckers were counted, and numbers of age 3+ fish were similar to those observed in 2012.
Condition factors by species are provided in Table 25.
Copyright 2013 by Southern California Edison Company 3-62 Draft 2013

Draft NASMP and AMP – Big Creek No. 4 Hydroelectric Project, FERC No. 2017 2013 Data Collection Report
Table 24. Population and Biomass Estimates at Electrofishing Sampling Sites, 2013 (based on fish collected).
Site Species
Size Range (mm)
Number of Fish
Captured Population Estimate
Biomass
Biomass per Site
(kg)
Biomass per
Kilometer (kg/km)
Biomass per
Hectare (kg/ha)
1¹ - - - - - -
2
Prickly Sculpin 56-114 23 24 0.235 8.843 3.673
Rainbow Trout 93-192 4 4 0.306 11.539 4.792
Sacramento Sucker 232 1 n/a (1) 0.236 8.900 3.696
3
Prickly Sculpin 105-108 2 2 0.036 1.440 2.487
Rainbow Trout 225-267 2 2 0.290 11.603 20.035
Sacramento Sucker 136 1 n/a (1) 0.026 1.040 1.796
4
Rainbow Trout 195-252 3 3 0.765 13.210 9.421
Sacramento Sucker 60-340 7 7 2.372 40.950 29.206
Sacramento Pikeminnow 76-90 2 2 0.007 0.112 0.080
Hardhead 85-87 2 2 0.009 0.147 0.105
5
Prickly Sculpin 65-99 3 3 0.014 0.540 0.209
Rainbow Trout 65-115 7 24 0.033 1.274 0.492
Sacramento Sucker 51-138 3 3 0.030 1.158 0.447
Sacramento Pikeminnow 49-75 4 4 0.007 0.270 0.104
Hardhead 34-94 23 26 0.034 1.312 0.507
6
Prickly Sculpin 95 1 n/a (1) 0.012 0.562 1.025
Sacramento Pikeminnow 35-74 16 25 0.018 0.820 1.495
Hardhead 35-60 33 35 0.023 1.078 1.965
Spotted Bass 46-86 2 10 0.009 0.422 0.769
¹ Site was too deep and turbulent to electrofish safely. () Insufficient information for multiple pass population estimate, actual catch used for population estimate.
Copyright 2013 by Southern California Edison Company 3-63 Draft 2013
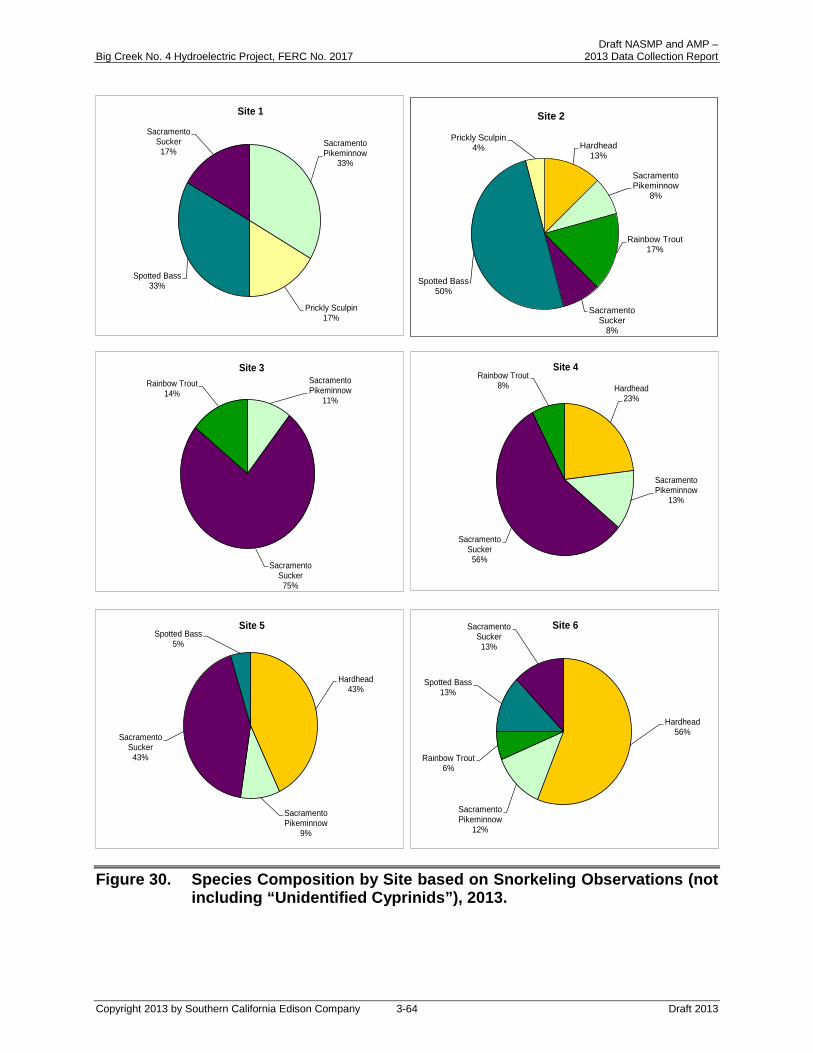
Draft NASMP and AMP – Big Creek No. 4 Hydroelectric Project, FERC No. 2017 2013 Data Collection Report
Figure 30. Species Composition by Site based on Snorkeling Observations (not including “Unidentified Cyprinids”), 2013.
Hardhead43%
Sacramento Pikeminnow
9%
Sacramento Sucker
43%
Spotted Bass5%
Site 5
Sacramento Pikeminnow
33%
Prickly Sculpin17%
Spotted Bass33%
Sacramento Sucker
17%
Site 1
Sacramento Pikeminnow
11%
Sacramento Sucker
75%
Rainbow Trout14%
Site 3
Hardhead23%
Sacramento Pikeminnow
13%
Sacramento Sucker
56%
Rainbow Trout8%
Site 4
Hardhead56%
Sacramento Pikeminnow
12%
Rainbow Trout6%
Spotted Bass13%
Sacramento Sucker
13%
Site 6
Hardhead13%
Sacramento Pikeminnow
8%
Rainbow Trout17%
Sacramento Sucker
8%
Spotted Bass50%
Prickly Sculpin4%
Site 2
Copyright 2013 by Southern California Edison Company 3-64 Draft 2013
Draft NASMP and AMP – Big Creek No. 4 Hydroelectric Project, FERC No. 2017 2013 Data Collection Report
Figure 31. Species Composition by Site based on Electrofishing Surveys, 2013.
Rainbow Trout14%
Sacramento Sucker
3%
Prickly Sculpin83%
Site 2
Rainbow Trout40%
Sacramento Sucker
20%
Prickly Sculpin40%
Site 3
Rainbow Trout22%
Sacramento Sucker
50%
Hardhead14%
Sacramento Pikeminnow
14%
Site 4
Rainbow Trout40%
Sacramento Sucker
5%
Hardhead43%
Sacramento Pikeminnow
7%
Prickly Sculpin5%
Site 5
Hardhead49%
Sacramento Pikeminnow
35%
Prickly Sculpin2%
Spotted Bass14%
Site 6
Copyright 2013 by Southern California Edison Company 3-65 Draft 2013
Draft NASMP and AMP – Big Creek No. 4 Hydroelectric Project, FERC No. 2017 2013 Data Collection Report
Figure 32. Length Frequency of “Unidentified Cyprinids” Observed by Snorkeling, All Sites Combined, October 2013 (*Young of the Year hardhead and Sacramento pikeminnow. **Yearling hardhead and Sacramento pikeminnow).
0
500
1,000
1,500
2,000
2,500
3,000
0-3" 3-6" 6-9" 9+
Freq
uenc
y
Length (inches TL)
* **
Copyright 2013 by Southern California Edison Company 3-66 Draft 2013

Draft NASMP and AMP – Big Creek No. 4 Hydroelectric Project, FERC No. 2017 2013 Data Collection Report
Figure 33. Length Frequency of Hardhead Observed by Snorkeling, All Sites Combined, October 2013 (not showing ”Unidentified Cyprinids”) (*Hardhead in this age category are included in the Unidentified Cyprinid data).
0
2
4
6
8
10
12
14
16
18
20
0-3" 3-6" 6-9" 9"+
Freq
uenc
y
Length (inches TL)
0+ 1+ 2+ 3+
*
Copyright 2013 by Southern California Edison Company 3-67 Draft 2013
Draft NASMP and AMP – Big Creek No. 4 Hydroelectric Project, FERC No. 2017 2013 Data Collection Report
Figure 34. Length Frequency of Sacramento Pikeminnow Observed by Snorkeling, All Sites Combined, October 2013 (*Sacramento pikeminnow in this age category are included in the “Unidentified Cyprinid” data).
0
2
4
6
8
10
12
14
16
0-3" 3-6" 6-9" 9"+
Freq
uenc
y
Length (inches TL)
0+ 1+ 2+
*
Copyright 2013 by Southern California Edison Company 3-68 Draft 2013
Draft NASMP and AMP – Big Creek No. 4 Hydroelectric Project, FERC No. 2017 2013 Data Collection Report
Figure 35. Length Frequency of Sacramento Sucker Observed by Snorkeling, All Sites Combined, October 2013.
0
5
10
15
20
25
30
35
40
45
0-3" 3-6" 6-9" 9"+
Freq
uenc
y
Length (inches TL)
Copyright 2013 by Southern California Edison Company 3-69 Draft 2013

Draft NASMP and AMP – Big Creek No. 4 Hydroelectric Project, FERC No. 2017 2013 Data Collection Report
Table 25. Condition Factors and 95 Percent Confidence Intervals by Species Collected by Electrofishing, October 2013.
Species Lifestage
Average Condition
Factor
Upper 95 Percent Confidence
Interval
Lower 95 Percent
Confidence Interval
Hardhead 0+ 0.82 0.83 0.40
Juveniles 0.76 0.80 0.61
Sacramento Sucker
0+ 0.87 1.04 0.69
Juveniles 0.99 1.05 0.93
Adults 1.73 1.79 1.42
Sacramento Pikeminnow 0+ 0.88 0.90 0.34
Juveniles1 0.69 - -
Rainbow Trout Juveniles 0.92 1.17 0.66
Adults 2.02 2.26 0.89
Prickly Sculpin 1.20 1.23 0.55
1 Only one juvenile Sacramento pikeminnow captured
Copyright 2013 by Southern California Edison Company 3-70 Draft 2013

Draft NASMP and AMP – Big Creek No. 4 Hydroelectric Project, FERC No. 2017 2013 Data Collection Report
4.0 DISCUSSION
4.1 EFFECTS OF OUT-OF-SEASON EXPERIMENTAL WHITEWATER FLOW RELEASES ON NATIVE AQUATIC SPECIES
Potential effects of whitewater flow releases to the native aquatic species of the management area were studied using two out-of-season experimental whitewater flow releases in August and September 2013.
4.1.1 AMPHIBIANS
Among all sites studied for both releases, eight tadpoles were found to be trapped or stranded during down ramping. These consisted of two non-native bullfrog and two Pacific chorus frog tadpoles, after the first release, and the same numbers and species of tadpoles, after the second release. Bullfrogs are non-native and are generally abundant throughout the HSB.
4.1.2 WESTERN POND TURTLES
No stranding of WPTs was observed after the flow releases. No significant displacement of radio tagged adult or juvenile WPTs was found.
4.1.3 FISH COMMUNITY
Potential effects of the flow releases on the fish community were examined through a combination of sampling and radio tracking.
4.1.3.1 Stranding
The potential for stranding of fish was examined through sampling four areas of the SJR during down ramping of flows following each of the flow releases. Overall, very few fish were stranded.
In August, WCCP had seven trapped fish larvae observed during the survey (four hardhead larvae and three unidentified larvae) and one adult sucker. Fish Population Sampling Site 4 was the only other site where young of the year fish (one hardhead, one Sacramento sucker) became entrapped by receding flows. The September release did not result in fish stranding at the four study sites.
4.1.3.2 Displacement
The potential displacement of adult hardhead due to each flow release was monitored through tracking of radio tagged adult hardhead before and after both flow releases. Adult and juvenile fish were monitored through snorkel observations before and after flow releases. Larval fish were monitored through trapping and dip netting before and
Copyright 2013 by Southern California Edison Company 4-1 Draft 2013

Draft NASMP and AMP – Big Creek No. 4 Hydroelectric Project, FERC No. 2017 2013 Data Collection Report
after each flow release. As identified in Section 2.2.1.2, large changes in fish abundance from before to after a flow release at a site was considered evidence of potential displacement. This was particularly the case for juveniles and especially young of the year fish, who have limited swimming capabilities and are most subject to downstream transport by high velocity currents. Decreased numbers suggest downstream transport of fish without replacement from upstream locations. Increased numbers suggest that additional fish have been transported to the location under study.
Adult Displacement Ten adult hardhead, captured and tagged with radio tags before the first flow release, were tracked before and after the release to determine potential displacement. Little movement was detected during tracking after the first out-of-season experimental whitewater flow release. Most of the fish (seven of ten) did not move either before or after the flow release. Three fish did exhibit some movement during the course of the study but no trend could be detected in their movement (either direction or association with the flow releases). There appeared to be little vulnerability to substantial displacement on the part of adult hardhead.
Fish counted by snorkeling in the 6-9 inch (152 to 229 mm) and greater than nine inch (>229 mm) classes were combined in the discussion of adult fish. Adult hardhead (>6 inches) abundances changed at all sites, where hardhead were observed after the first out-of-season experimental whitewater flow release. There were both increases and decreases in abundance following the first release. However, after the second flow release, there were net gains at all of the sites, where they were present. It is unclear whether the data are actually indicating displacement, or if some adult fish were seeking cover in deeper water and not being counted by the snorkelers after the first release, or a combination of both. The information provided by radio tracking of hardhead, strongly suggests adult fish seeking cover in deeper water for hardhead, since these fish had not moved (or had limited movement) and were not observed during snorkel observation suggesting that they took cover in deeper water. A similar pattern was observed for Sacramento pikeminnow. Trends in response varied for adults of other species.
Juvenile including Young of the Year Displacement
Juvenile fish were considered to be young of the year and older juveniles in the less than six inch (<152 mm) length range, but of greater length than larvae (which are generally smaller than two inches [51 mm]). The “unidentified cyprinids” discussed in this section were primarily young of the year fish less than 3 inches (76 mm) in length (Figure 32). Abundance was determined through snorkel counts before and after the flow releases.
After the first flow release, there were increased numbers of juvenile fish of all species found at most sites (Figures 18 through 22). After the second flow release, there were many more decreases in juvenile fish at the various sites. Frequently, the decreases were of similar magnitude to the increases that occurred after the first flow release, resulting in nearly no or small net change for several of the species and sites. An exception to this was for “unidentified cyprinids,” which had increases at Fish Population
Copyright 2013 by Southern California Edison Company 4-2 Draft 2013

Draft NASMP and AMP – Big Creek No. 4 Hydroelectric Project, FERC No. 2017 2013 Data Collection Report
Sampling Sites 4 and 5, and a decrease at Fish Population Sampling Site 6 (Figure 18). The net changes for “unidentified cyprinids” were larger than for other taxa. The data suggest that there was movement of juvenile fish and young of the year fish among sites. Small fish, especially “unidentified cyprinids,” have limited swimming capability, and therefore limited ability to move upstream. The conclusion is that the changes in numbers were due to downstream movement, downstream displacement.
It is unclear whether the minimal net change for several other species indicated movement by fish that were passing downstream through the sites over the course of the study or displacement associated with the release flows. The larger changes in the abundance of the “unidentified cyprinids” suggest greater levels of displacement for this group.
Displacement of Larval Fish
Displacement effects on larval fish were studied through larval trapping and dip netting, as well as through snorkel surveys before and after each flow release. In general, there were too few fish larvae captured to characterize trends. Larval fish tend to be less abundant after mid-August in non-spill years, contributing to low captures.
4.2 STATUS OF NATIVE AQUATIC SPECIES
In this section, the status of native aquatic species is discussed based on sampling following the completion of the out-of-season experimental whitewater flow releases. The sampling conducted was similar to that carried out to collect baseline data for the native aquatic species, and took place at similar times of year. The principal purpose of this sampling was to evaluate changes to the status of these species and to examine whether populations were in good condition (Moyle et al. 1998).
4.2.1 WESTERN POND TURTLE POPULATIONS
Both male and female WPT in the HSB reach of SJR have a diverse age structure and appear to be in good health. Twenty eight different turtles were caught in 2013 (Table 18), which is down slightly from the thirty three turtles captured in 2012. All turtles captured in 2011, 2012, and 2013 appeared to be healthy with no visible signs of disease or serious recent injuries.
4.2.1.1 Population Level
Ages varied from young-of-the-year to over twenty years old. The WPT population on the HSB Reach of the SJR is not aged biased towards large old individuals as is observed in many populations below reservoirs (Reese 1986). Reese (1986) suggested that populations that are adult biased lack critical habitat components such as suitable nesting habitat upland and nursery habitat. Many of the populations in the nearby San Joaquin Valley are heavily biased towards older adults with little or no juvenile recruitment (Bury and Germano 2008).
Copyright 2013 by Southern California Edison Company 4-3 Draft 2013
Draft NASMP and AMP – Big Creek No. 4 Hydroelectric Project, FERC No. 2017 2013 Data Collection Report
4.2.2 MUSSEL COMMUNITY
The mussel abundance in HSB in 2013 indicated no trends in abundance in comparison to previous years. Additional mussels were discovered in the Sandbar to Mussel Site 5 area in a previously unexplored habitat in bank crevices. At Mussel Site 7, the increased number of transects resulted in a higher density estimate than found in 2012, with little increase in the standard error of the mean.
4.2.3 FISH COMMUNITY CHARACTERISTICS AND COMPARISONS
The NASMP (SCE 2009b) describes using data to evaluate whether the native aquatic community is in good condition. Data collected as part of the NASMP are to be compared to data from previous studies conducted in 1985, 1995, 2008, 2010, 2011, and 2012 to assess the condition of the native fishes.
4.2.3.1 Fish Community and Abundance
Quantitative electrofishing surveys of the fish community in the HSB reach conducted in the fall of 1985 (a dry year, CDWR 2013b) found the fish community was composed primarily of native species (BioSystems 1987). In November 1995 (a wet year, CDWR 2013b), resampling of these stations found the relative abundances of most species were similar (SCE 1997). These stations were resampled to gather initial data to contribute to baseline monitoring in 2008, 2010, 2011, and 2012 (SCE 2009b, 2011, 2012b, and 2013b), which were critical, above normal, wet, and dry water years, respectively (CDWR 2013b). Comparisons of fish community characteristics between years for 1985 through 2012 were discussed below.
In 2013, a critical water year, hardhead densities were very similar to those observed in 2012 (Table 26). However, densities of Sacramento sucker declined from 293/km in 2012 to 36/km in 2013 (about 12 percent of those in 2012), and were the lowest densities collected since 1995 (Table 26). This was largely due to a decrease in the number of young of the year observed. Sacramento pikeminnow, rainbow trout, and prickly sculpin had 2013 densities comparable to those of 2012. Observed length frequencies in 2013 showed distinct age classes for all native species, as they did in 2008, 2010, 2011, and 2012.
Spotted bass, a non-native species, increased in density from 11.5/km in 2012 to 14.1/km in 2013 (about 23 percent). Due to the reduced overall abundance of fish in 2013, the contribution of spotted bass to the percentage of the total fish observed, without “unidentified cyprinids,” increased by 5.9 percent.
There was a decrease in density for zero to three inch (76 mm) “unidentified cyprinids” from 4851.9/km in 2012 to 1305.7 in 2013, a 73 percent decrease (Table 26). This was about 36 percent of the number of fish observed in 2010 and 25 percent more than 2011. There were some 3-6 inch (76 to 152 mm) “unidentified cyprinids” observed in 2013 (Table 26), in contrast to 2012 when none was observed.
Copyright 2013 by Southern California Edison Company 4-4 Draft 2013
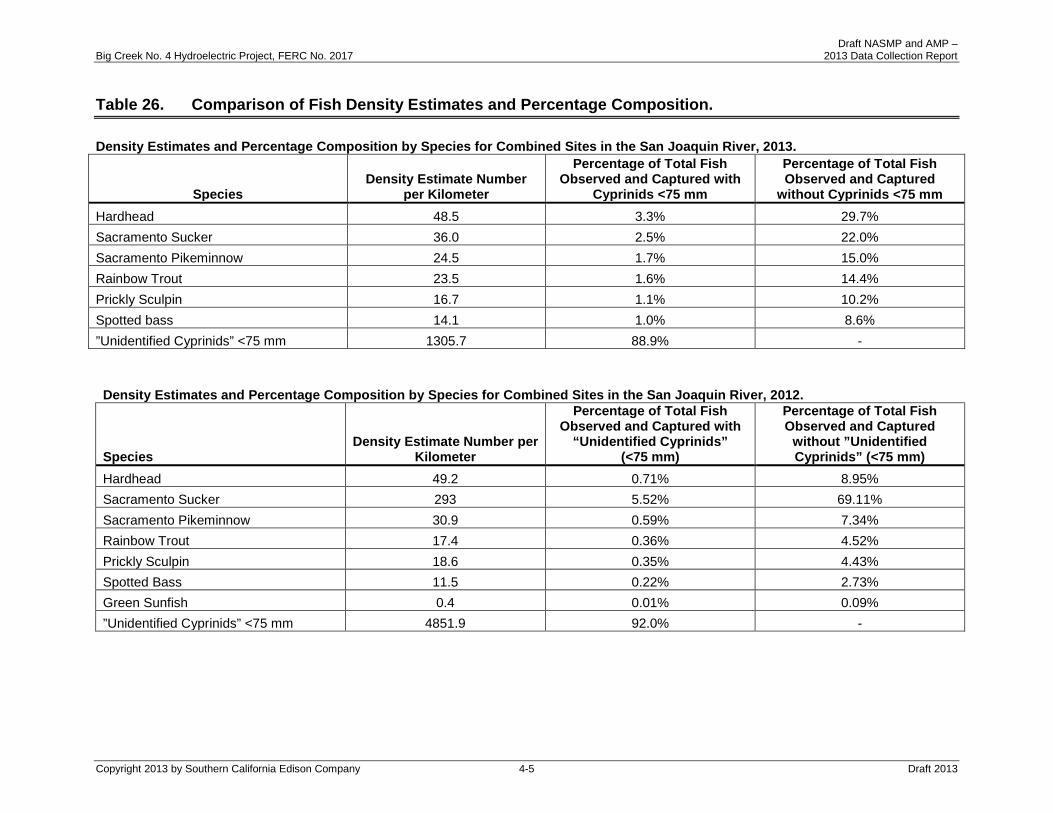
Draft NASMP and AMP – Big Creek No. 4 Hydroelectric Project, FERC No. 2017 2013 Data Collection Report
Table 26. Comparison of Fish Density Estimates and Percentage Composition.
Density Estimates and Percentage Composition by Species for Combined Sites in the San Joaquin River, 2013.
Species Density Estimate Number
per Kilometer
Percentage of Total Fish Observed and Captured with
Cyprinids <75 mm
Percentage of Total Fish Observed and Captured
without Cyprinids <75 mm Hardhead 48.5 3.3% 29.7% Sacramento Sucker 36.0 2.5% 22.0% Sacramento Pikeminnow 24.5 1.7% 15.0% Rainbow Trout 23.5 1.6% 14.4% Prickly Sculpin 16.7 1.1% 10.2% Spotted bass 14.1 1.0% 8.6% ”Unidentified Cyprinids” <75 mm 1305.7 88.9% -
Density Estimates and Percentage Composition by Species for Combined Sites in the San Joaquin River, 2012.
Species Density Estimate Number per
Kilometer
Percentage of Total Fish Observed and Captured with
“Unidentified Cyprinids” (<75 mm)
Percentage of Total Fish Observed and Captured
without ”Unidentified Cyprinids” (<75 mm)
Hardhead 49.2 0.71% 8.95% Sacramento Sucker 293 5.52% 69.11% Sacramento Pikeminnow 30.9 0.59% 7.34% Rainbow Trout 17.4 0.36% 4.52% Prickly Sculpin 18.6 0.35% 4.43% Spotted Bass 11.5 0.22% 2.73% Green Sunfish 0.4 0.01% 0.09% ”Unidentified Cyprinids” <75 mm 4851.9 92.0% -
Copyright 2013 by Southern California Edison Company 4-5 Draft 2013

Draft NASMP and AMP – Big Creek No. 4 Hydroelectric Project, FERC No. 2017 2013 Data Collection Report
Table 26. Comparison of Fish Density Estimates and Percentage Composition (continued).
Density Estimates and Percentage Composition by Species for Combined Sites in the San Joaquin River, 2011.
Species Density Estimate Number per
Kilometer
Percentage of Total Fish Observed and Captured with
”Unidentified Cyprinids” (<75 mm)
Percentage of Total Fish Observed and Captured
without “Unidentified Cyprinids” (<75 mm)
Hardhead 23 2% 15% Sacramento Sucker 76 5.60% 47% Sacramento Pikeminnow 6 0.04% 3% Rainbow Trout 12 1.60% 14% Spotted bass 2 0% 2% ”Unidentified Cyprinids” <75 mm 1,045 90.20% -
Density Estimates and Percentage Composition by Species for Combined Sites in the San Joaquin River, 2010.
Species Density Estimate Number per
Kilometer
Percentage of Total Fish Observed and Captured with
Cyprinids (<75 mm)
Percentage of Total Fish Observed and Captured
without Cyprinids (<75 mm) Hardhead 30 1% 14% Sacramento Sucker 164 4.5% 75% Sacramento Pikeminnow 7 ‘0.1% 3% Rainbow Trout 16 ‘0.4% 7% Spotted bass 2 0% - ”Unidentified Cyprinids” <75 mm 3,592 94% -
Copyright 2013 by Southern California Edison Company 4-6 Draft 2013

Draft NASMP and AMP – Big Creek No. 4 Hydroelectric Project, FERC No. 2017 2013 Data Collection Report
Table 26. Comparison of Fish Density Estimates and Percentage Composition (continued).
Density Estimates and Percentage Composition by Species for Combined Sites in the San Joaquin River, 2008.
Species Density Estimate Number per
Kilometer
Percentage of Total Fish Observed and Captured with
”Unidentified Cyprinids” (<75 mm)
Percentage of Total Fish Observed and Captured
without ”Unidentified Cyprinids” (<75 mm)
Hardhead 189 4% 47% Sacramento Sucker 157 3% 39% Sacramento Pikeminnow 48 1% 12% Rainbow Trout 5 0% 1% ”Unidentified Cyprinids” <75 mm 4,532 92% -
Density Estimates and Percentage Composition by Species for Combined Sites in the San Joaquin River, 1995 (SCE 1997).
Species Density Estimate Number per
Kilometer
Percentage of Total Fish Observed and Captured with
Cyprinids (<75 mm)
Percentage of Total Fish Observed and Captured
without Cyprinids (<75 mm) Hardhead 87 14% 55% Sacramento Sucker 26 4% 16% Sacramento Pikeminnow 3 0.50% 2% Rainbow Trout 43 7% 27% Cyprinids <75 mm 448 74% -
Copyright 2013 by Southern California Edison Company 4-7 Draft 2013

Draft NASMP and AMP – Big Creek No. 4 Hydroelectric Project, FERC No. 2017 2013 Data Collection Report
Table 26. Comparison of Fish Density Estimates and Percentage Composition (continued).
Density Estimates and Percentage Composition by Species for Combined Sites in the San Joaquin River, 1985 (BioSystems 1987).
Species Density Estimate Number per
Kilometer
Percentage of Total Fish Observed and Captured with
Cyprinids (<75 mm)
Percentage of Total Fish Observed and Captured
without Cyprinids (<75 mm)
Hardhead 54 6% 27% Sacramento Sucker 66 7% 33% Sacramento Pikeminnow 58 6.40% 29% Rainbow Trout 22 2% 11% Cyprinids <75 mm 708 78% -
Copyright 2013 by Southern California Edison Company 4-8 Draft 2013

Draft NASMP and AMP – Big Creek No. 4 Hydroelectric Project, FERC No. 2017 2013 Data Collection Report
As in years since 2008, there were little sign of disease or other indications of poor health during the 2013 study (other than the Sacramento sucker observed during the stranding study), which suggests these fish, are generally in good health.
4.2.3.2 Individual Level
Condition Factors Adult hardhead observed in 1985, 1995, 2008, 2010, 2011, 2012, and 2013 were generally characterized as healthy and robust. All native species in 2013 were characterized as being healthy and robust in appearance. Average condition factors for adult rainbow trout, adult Sacramento sucker, and prickly sculpin exceeded 1.0 (Table 25). Condition factors for all juvenile fish, hardhead and Sacramento pikeminnow were less than one, but they are based on relatively small numbers. Condition factors for 2013 were slightly lower than 2012 and less than those measured in 2010 by species and lifestage.
Growth Length frequency distributions from 2013 sampling (Figures 33 through 35) were compared with those of 2010-20121 during the baseline monitoring studies in Figures 36 through 38 for hardhead, Sacramento sucker, and Sacramento pikeminnow, respectively. “Unidentified cyprinids” less than 76 mm length were excluded from species comparisons, since these fish were not identified to species. A separate comparison was made for hardhead, not including fish of less than three inches (76 mm) (Figure 36). There were far fewer hardhead greater than nine inches (229 mm) observed than in all previous years. The length frequency distribution of hardhead in 2013 indicated a decrease in fish of all older age classes compared with 2012, as well as 2010 and 2011.
Young-of-the-year Sacramento sucker (0-3 inch [76-152 mm]) were far less abundant in 2013 than all previous years since 2008 (Figure 37). As were older age classes compared to all other years except 2011, a wet water year.
Sacramento pikeminnow were not abundant and have not been in earlier monitoring. Sacramento pikeminnow length frequencies for 2013 indicated a decrease in age 1+ fish (3 to 6 inch range) compared to 2012, but nearly the same relative abundance as 2010 and 2011 (Figure 38). There was no age 2+ fish in the 6- to 9-inch range in contrast to 2010–2012. However, there was the same number of age 3+ fish in the 6- to 9-inch range as 2012 and relatively similar numbers to 2010 and 2011. There was the same number of older (9+ inch) fish as in 2013 as in 2012.
1 Length frequencies from 2008 were not included, since length intervals used during snorkeling differed from those used in 2010-2013.
Copyright 2013 by Southern California Edison Company 4-9 Draft 2013

Draft NASMP and AMP – Big Creek No. 4 Hydroelectric Project, FERC No. 2017 2013 Data Collection Report
Figure 36. Comparison of Hardhead Length Frequencies for 2010-2013.
0
57
1523
0102030405060708090
100
0-3" 3-6" 6-9" 9"+
Freq
uenc
y
Length (inches TL)
Hardhead-2012
0
35
11
26
0102030405060708090
100
0 - 3" 3 - 6" 6 - 9 " 9"+
Freq
uenc
y
Length (inches TL)
Hardhead-2010
011 11
33
0102030405060708090
100
0-3" 3-6" 6-9" 9"+
Freq
uenc
y
Length (inches TL)
Hardhead-2011
0
186 5
0102030405060708090
100
0-3" 3-6" 6-9" 9"+
Freq
uenc
y
Length (inches TL)
Hardhead-2013
Copyright 2013 by Southern California Edison Company 4-10 Draft 2013
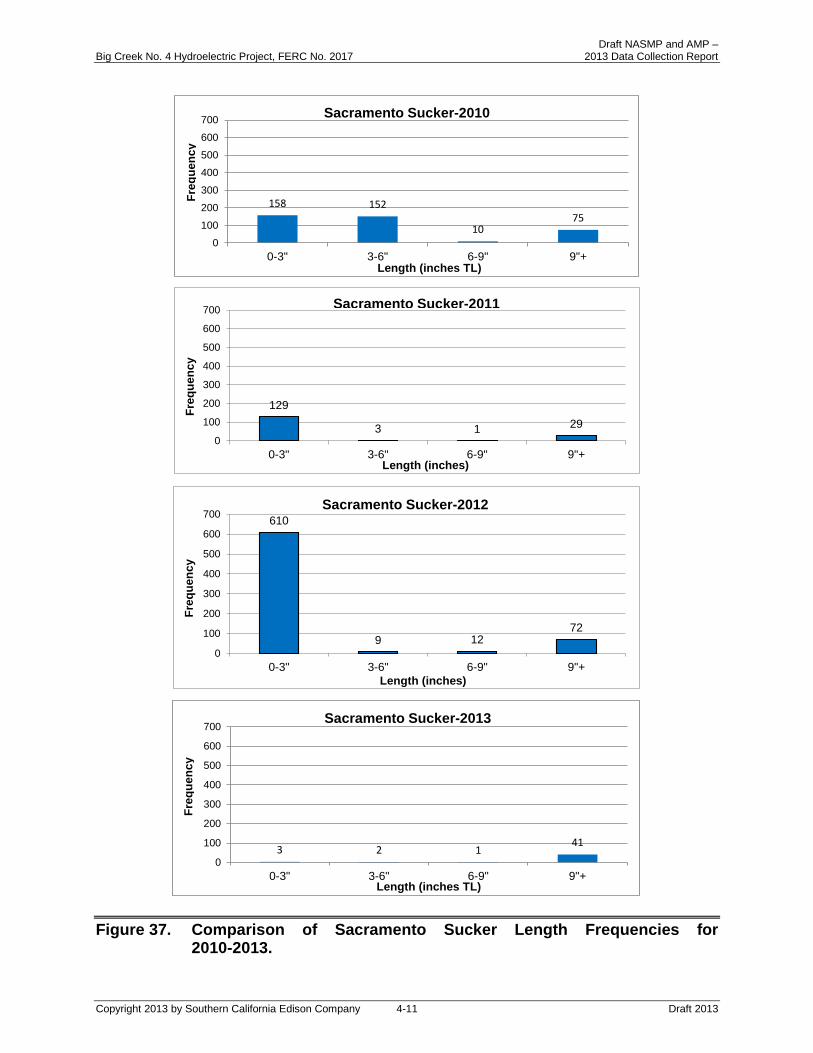
Draft NASMP and AMP – Big Creek No. 4 Hydroelectric Project, FERC No. 2017 2013 Data Collection Report
Figure 37. Comparison of Sacramento Sucker Length Frequencies for 2010-2013.
158 152
1075
0
100
200
300
400
500
600
700
0-3" 3-6" 6-9" 9"+
Sacramento Sucker-2010
Freq
uenc
y
Length (inches TL)
129
3 1 290
100
200
300
400
500
600
700
0-3" 3-6" 6-9" 9"+
Freq
uenc
y
Length (inches)
Sacramento Sucker-2011
610
9 1272
0
100
200
300
400
500
600
700
0-3" 3-6" 6-9" 9"+
Freq
uenc
y
Length (inches)
Sacramento Sucker-2012
3 2 141
0
100
200
300
400
500
600
700
0-3" 3-6" 6-9" 9"+
Freq
uenc
y
Length (inches TL)
Sacramento Sucker-2013
Copyright 2013 by Southern California Edison Company 4-11 Draft 2013

Draft NASMP and AMP – Big Creek No. 4 Hydroelectric Project, FERC No. 2017 2013 Data Collection Report
Figure 38. Comparison of Sacramento Pikeminnow Length Frequencies for 2010-2013.
02
4
9
02468
10121416
0-3" 3-6" 6-9" 9"+
Sacramento Pikeminnow-2010
Freq
uenc
y
Length (inches TL)
01
3
8
02468
10121416
0-3" 3-6" 6-9" 9"+
Freq
uenc
y
Length (inches TL)
Sacramento Pikeminnow-2011
10
5
14
02468
10121416
0-3" 3-6" 6-9" 9"+
Freq
uenc
y
Length (inches TL)
Sacramento Pikeminnow-2012
20
14
02468
10121416
0-3" 3-6" 6-9" 9"+
Freq
uenc
y
Length (inches TL)
Sacramento Pikeminnow-2013
Copyright 2013 by Southern California Edison Company 4-12 Draft 2013
Draft NASMP and AMP – Big Creek No. 4 Hydroelectric Project, FERC No. 2017 2013 Data Collection Report
4.2.3.3 Community Level
Species Composition Native fish continue to dominate the fish community in 2013, between Dam 7 and PH4 as in all the past years surveyed since 1985. However, spotted bass increased in density for the second straight year. Spotted bass represented less than nine percent of the fish community in 2013 compared with less than three percent in 2011 and two percent in 2010 (Table 26). The percentage contribution of rainbow trout to the fish community in 2013 was slightly higher than 2011 and the second highest since 1985.
4.2.3.4 Resilience in Response to Stochastic Events
The native fish community was persistent and appeared to maintain itself successfully over the 27-year period represented by sampling events in 1985, 1995, 2008, 2010, 2011, 2012, and 2013. However, recruitment of young-of-the-year native cyprinids and Sacramento sucker in 2013 was the lowest observed since 2008. This is in contrast to dry water year 2012, when the largest numbers of young of the year “unidentified cyprinids” and Sacramento sucker were observed.
Since 2008, four Water Year types with different spill durations and magnitudes have occurred. There have been critical, dry, above normal, and wet Water Year classifications. During that same period, the densities of small “unidentified cyprinids” (<76 mm) have been carefully examined as indications of the successful reproduction of hardhead (primarily) and Sacramento pikeminnow. Prior to 2013 (Table 27), the highest densities observed for these fish occurred during dry and critical water years, with an average density of 4,692 fish/km. Lower densities were observed in above normal and wet water years, 3,592 and 1,045 fish/km, respectively. During 2013, a critical water year, densities would have been expected to be similar to recent dry and critical water years. However, density of these young of the year fish was much lower, 1,306 fish/km, which is similar to the density observed during 2011, a wet water year. It is unclear as to the principal mechanism for the decreased recruitment. However, a principal difference in river conditions between summer 2013 and the previous dry and critical water year types is the release of the out-of-season experimental whitewater flow releases in 2013. Further study of the abundance of age 1+ native minnows and Sacramento suckers in 2014, resulting from the current age 0+ cohort, should provide additional insight into the implications of the current data to population recruitment.
Copyright 2013 by Southern California Edison Company 4-13 Draft 2013
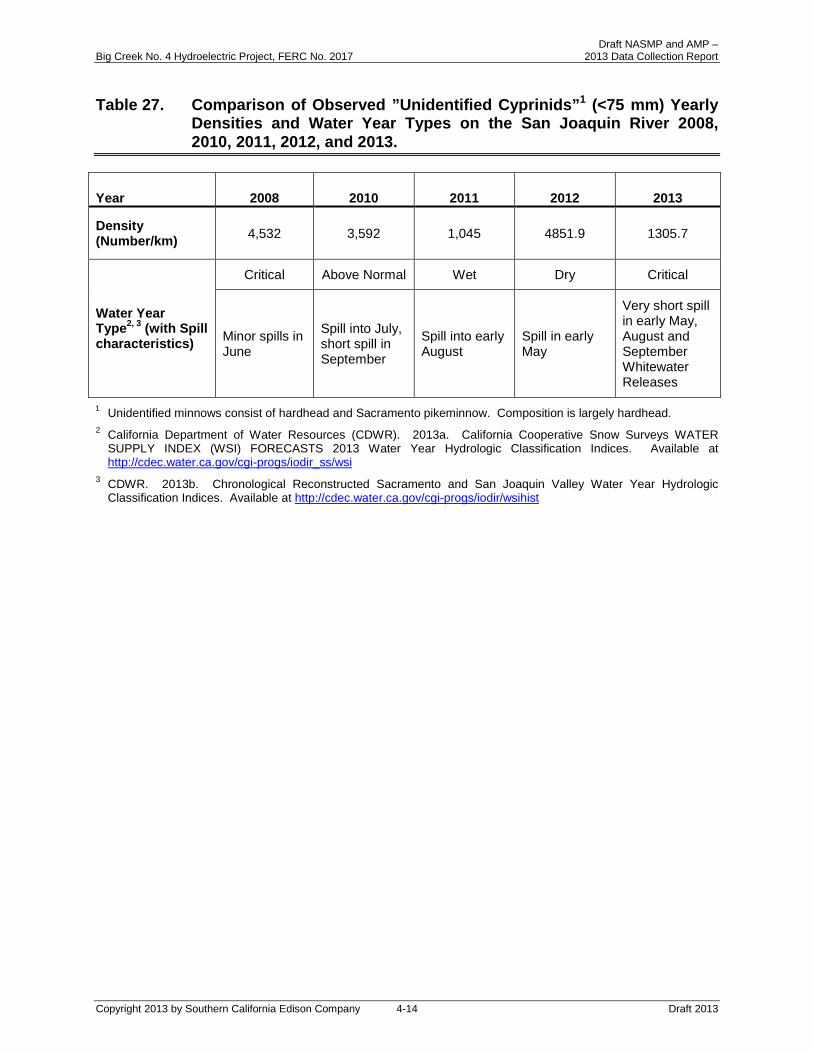
Draft NASMP and AMP – Big Creek No. 4 Hydroelectric Project, FERC No. 2017 2013 Data Collection Report
Table 27. Comparison of Observed ”Unidentified Cyprinids”1 (<75 mm) Yearly Densities and Water Year Types on the San Joaquin River 2008, 2010, 2011, 2012, and 2013.
Year 2008 2010 2011 2012 2013
Density (Number/km) 4,532 3,592 1,045 4851.9 1305.7
Water Year Type2, 3 (with Spill characteristics)
Critical Above Normal Wet Dry Critical
Minor spills in June
Spill into July, short spill in September
Spill into early August
Spill in early May
Very short spill in early May, August and September Whitewater Releases
1 Unidentified minnows consist of hardhead and Sacramento pikeminnow. Composition is largely hardhead. 2 California Department of Water Resources (CDWR). 2013a. California Cooperative Snow Surveys WATER
SUPPLY INDEX (WSI) FORECASTS 2013 Water Year Hydrologic Classification Indices. Available at http://cdec.water.ca.gov/cgi-progs/iodir_ss/wsi
3 CDWR. 2013b. Chronological Reconstructed Sacramento and San Joaquin Valley Water Year Hydrologic Classification Indices. Available at http://cdec.water.ca.gov/cgi-progs/iodir/wsihist
Copyright 2013 by Southern California Edison Company 4-14 Draft 2013
Draft NASMP and AMP – Big Creek No. 4 Hydroelectric Project, FERC No. 2017 2013 Data Collection Report
5.0 WHITEWATER BOATING MONITORING
5.1 INTRODUCTION
SCE installed a video monitoring system at the PH4 to monitor whitewater boating use in the Horseshoe Bend Reach. In accordance with the requirements of the AMP, SCE conducted a study to verify the accuracy of the video monitoring system through on-site boat counts. The AMP (SCE 2008, Section 3.3.4) describes the requirements for this study:
“The video monitoring system will be verified with on-site boat counts during the first managed spill or scheduled release, whichever occurs first. Surveyors will conduct on-site boat counts to monitor whitewater recreation use at the PH4, including counts of users and types of craft.
The on-site survey data and video monitoring data will be individually compiled, then compared to determine the accuracy of the video monitoring equipment. The data will be summarized and included in the annual report following the study. If discrepancies occur between the two methods, the potential causes will be identified and addressed, and the two monitoring methods will continue concurrently until reliability in the video monitoring system is achieved, or another accurate monitoring method is adopted.”
On-site boat counts were conducted during the first scheduled spill release on August 18, 2013. The following describes the methods used to document whitewater boating use during the release and summarizes the results that verify the accuracy of the video monitoring system.
5.2 METHODS
A field technician was stationed at PH4 from 11:00 am to 6:00 pm to observe and record whitewater boating use passing by the powerhouse during the flow release. Observations of whitewater boaters were recorded and categorized by the time of sighting, type of vessel, number of people per vessel, and total recreational users per group. A copy of the completed field data sheet, “BC4 Horseshoe Bend Whitewater Boating Recreational Use Log” is provided in Appendix F.
Video recorded by the monitoring system during the flow release was reviewed to also document whitewater boaters passing by the powerhouse. Observations of whitewater boaters on the video also were documented and categorized by time of observation, type of vessel, number of people per vessel, and total number of recreational users per group. The whitewater boating use observation recorded by on-site boat counts and the video system were compared to verify the accuracy of the video monitoring system.
Copyright 2013 by Southern California Edison Company 5-15 Draft 2013

Draft NASMP and AMP – Big Creek No. 4 Hydroelectric Project, FERC No. 2017 2013 Data Collection Report
5.3 RESULTS
The on-site boater counts verify that the video monitoring equipment is accurately recording the number of whitewater boaters passing by PH4. The number of vessels and the number of boaters recorded on the video during the scheduled releases on August 18, 2013 between 11 am and 6 pm were consistent with observations made during the on-site boating counts. Ninety people in a variety of crafts (six rafts, 64 hard shell kayaks, and one inflatable kayak) were documented by both the video documentation and on-site boating counts. Table 28 provides a summary of the whitewater boating observations recorded by the video monitoring system during the release and includes the time of the visual observation of the same boaters during the on-site counts. For several observations there is a slight variance in timing between the video recording and the on-site observations because the visual observations were recorded prior to or after boaters passed through the video camera recording view field. Also observed by both the video recording and the on-site boating counts were seven motorized personal watercraft that traveled up river from Kerckhoff Reservoir. These personal water craft are not included in the total number of whitewater boaters that utilized the schedule flow release in the Horseshoe Bend Reach.
Copyright 2013 by Southern California Edison Company 5-16 Draft 2013

Draft NASMP and AMP – Big Creek No. 4 Hydroelectric Project, FERC No. 2017 2013 Data Collection Report
Table 28. Summary of Whitewater Boating Use: Video Monitoring and On-site Boating Counts Schedule Flow Release August 18, 2013.
# of People
Observed
Number and Type of Vessel Observed
Video Time
Stamp Time of Field Observation(1) Comments Raft Kayak
Inflatable Kayak Other
1 1 12:12 12:12 Personal Watercraft(2) 1 1 12:15 12:15 Personal Watercraft(2)
2 2 12:36 12:36
1 1 1:35 1:35 Personal Watercraft(2) 8 8 1:37 1:35 4 4 1:39 1:39 7 7 1:42 1:41 2 2 2:05 2:05 Personal Watercraft(2) 2 2 2:12 2:12 5 5 2:49 2:49 5 1 3:02 3:02 5 1 3:02 3:02 5 1 3:02 3:02 1 1 3:02 3:02 6 1 3:02 3:02 8 8 3:04 3:07 2 2 3:15 3:14 9 9 3:23 3:26 13 13 4:11 4:11 2 1 4:11 4:11 2 1 4:11 4:11 4 4 5:48 5:48 2 2 4:12 3:50 Personal Watercraft(2)
7 7 6:19 NA(3) field hours 11 am-6 pm(3)
90 6 71 1 7 Notes: Gray shaded values are not included in the total number of whitewater boaters observed.
(1) There is a variance in timing for some observations between the video recording and the on-site observations because the visual observations were recorded prior to or after boaters passed through the video camera recording view field.
(2) Personal watercrafts were observed traveling up river from Kerckhoff Reservoir and are not included in the total number of whitewater boaters utilizing the scheduled flow release on the Horseshoe Bend Reach.
(3) On-site boating counts were completed at 6 pm. Although these boaters were recorded on the video, they were not observed by on-site boating counts. They are not included in the total number of boaters verified by on-site boating counts.
Copyright 2013 by Southern California Edison Company 5-17 Draft 2013

Draft NASMP and AMP – Big Creek No. 4 Hydroelectric Project, FERC No. 2017 2013 Data Collection Report
6.0 LITERATURE CITED
Abel, J. 2010. Western Pond Turtle Summer Habitat Use in a Coastal Watershed. Master’s Thesis. San Jose State University. San Jose, California.
Allen, W. 2013a. Email to BC4 Technical Review Group (TRG) on rescheduling of whitewater releases.
Allen, W. 2013b. Email to BC4 Technical Review Group (TRG) on rescheduling of second whitewater release to September 8.
BioSystems Analysis, Inc. 1987. A technical report on riverine fishery studies conducted in support of the Big Creek Expansion Project. Submitted to Southern California Edison Co., Rosemead, California.
Bury, R.B. and D.J. Germano. 1998. Annual deposition of scute rings in the western pond turtle (Clemmys marmorata). Chelonian Conservation and Biology 3:108–109.
California Department of Water Resources (CDWR). 2013a. California Cooperative Snow Surveys WATER SUPPLY INDEX (WSI) FORECASTS 2013 Water Year Hydrologic Classification Indices. Available at http://cdec.water.ca.gov/cgi-progs/iodir_ss/si
CDWR. 2013b. Chronological Reconstructed Sacramento and San Joaquin Valley Water Year Hydrologic Classification Indices. Available at http://cdec.water.ca.gov/cgi-progs/iodir/wsihist
Deventer, J.S., and W.S. Platts. 1989. Microcomputer Software System for Generating Population Statistics from Electrofishing Data–User’s Guide for MicroFish 3.0. USDA-Forest Service Intermountain Research Station General Technical Report INT-254.
Fausch, K.D., and R.J. White. 1981. Competition between brook trout (Salvelinus fontinalis) and brown trout (Salmo trutta) for positions in a Michigan stream. Canadian Journal of Fisheries and Aquatic Sciences 38:1220-1227.
Hankin, D.G., and G.H. Reeves. 1988. Estimation total fish abundance and total habitat area in small streams based on visual estimation methods. Canadian Journal of Fisheries and Aquatic Sciences 45:834-844.
Hicks, B.J., and N.R.N. Watson. 1985. Seasonal changes in abundance of brown trout (Salmo trutta) and rainbow trout (S. gairdnerii) assessed by drift diving in the Rangitikei River, New Zealand. New Zealand Journal of Marine and Freshwater Research 19:1-10.
Copyright 2013 by Southern California Edison Company 6-1 Draft 2013
Draft NASMP and AMP – Big Creek No. 4 Hydroelectric Project, FERC No. 2017 2013 Data Collection Report
Holland, D.C. 1994. The western pond turtle: habitat and history. U.S. Department of Energy, Bonneville Power Administration, Portland, Oregon.
Kissick, L.A. 1993. Comparison of traps lighted by photochemical or electric bulbs for sampling warm water populations of young fish. North American Journal of Fisheries Management 13:864–867.
Marchetti, M., P.E. Esteban, M. Limm, and R. Kurth. 2004. Evaluating aspects of larval light trap bias and specificity in the northern Sacramento River system. Do size and color matter? American Fisheries Society Symposium 39:269–279.
Moyle, P.B., M.P. Marchetti, J. Baldrige, and T.L. Taylor. 1998. Fish health and diversity: Justifying flows for a California stream. Fisheries 23(7):6-15.
National Climatic Data Center. 2012. Available at http://www1.ncdc.noaa.gov/pub
Platts, W.S., W.F. Megahan, and G.W. Minshall. 1983. Methods for evaluating stream, riparian, and biotic conditions. USDA Forest Service General Technical Report INT-138.
Rathbun, G.B., N.J. Scott Jr., and T.G. Murphey. 2002. Terrestrial habitat use by pacific pond turtles in a Mediterranean climate. Southwestern Naturalist 47:225-235.
Reese, D.A. 1986. Comparative demography and habitat use of western pond turtles in Northern California: The effects of damming and related alterations. Unpublished Ph.D. Dissertation, University of California, Berkeley. 253 pp.
Ricker, W.E. 1975. Computation and interpretation of biological statistics of fish populations. Bulletin of the Fisheries Research Board of Canada 191:1-382.
Southern California Edison (SCE). 1997. Big Creek No. 4 Water Power Project (FERC Project No. 2017), Application for New Licensee for Major Project – Existing Dam, Volume 2, Exhibit E. Rosemead, California.
SCE. 2008. Final Native Aquatic Species Management Plan (NASMP). Big Creek, California.
SCE. 2009a. Draft 2007 Data Collection Report. Native Aquatic Species Management Plan (NASMP). Big Creek, California.
SCE. 2009b. Draft 2008 Data Collection Report. Native Aquatic Species Management Plan (NASMP). Big Creek, California.
SCE. 2011. 2010 Data Collection Report. Native Aquatic Species Management Plan (NASMP). Big Creek, California.
Copyright 2013 by Southern California Edison Company 6-2 Draft 2013

Draft NASMP and AMP – Big Creek No. 4 Hydroelectric Project, FERC No. 2017 2013 Data Collection Report
SCE. 2012a Third Year Proposal Native Aquatic Species Management Plan-Adaptive Management Plan. Big Creek, California.
SCE. 2012b. 2011 Data Collection Report. Native Aquatic Species Management Plan (NASMP). Big Creek, California.
SCE. 2013a. Fourth Year Proposal Native Aquatic Species Management Plan-Adaptive Management Plan. Big Creek, California.
SCE. 2013b. 2012 Data Collection and Baseline Report. Native Aquatic Species Management Plan (NASMP). Big Creek, California.
Villella, R.F. and D.R. Smith. 2005. Two-phase sampling to estimate river-wide populations of freshwater mussels. Journal of North American Benthological Society 24(2):357–368.
Zippin, C. 1958. The removal method of population estimation. Journal of Wildlife Management 22(1):82-90.
Copyright 2013 by Southern California Edison Company 6-3 Draft 2013

Draft NASMP and AMP – Big Creek No. 4 Hydroelectric Project, FERC No. 2017 2013 Data Collection Report
APPENDIX A
DETAILED METHODS
Copyright 2013 by Southern California Edison Company Draft 2013

Draft NASMP and AMP – Big Creek No. 4 Hydroelectric Project, FERC No. 2017 2013 Data Collection Report
APPENDIX A – DETAILED METHODS
WESTERN POND TURTLE DISPLACEMENT CAPTURE AND RADIO TAGGING Two to three baited standard turtle traps (SCE 2008) were installed at each of the three study sites located on SJR at the confluences with Willow and Backbone creeks and the HSB reach east summer temperature monitoring site. Two to three additional traps of a smaller design than used in previous trapping events were deployed at the mouths of Willow and Backbone creeks in the confluence pools in shallow, slow, and warm water with emergent cover, which is the preferred habitat of juvenile turtles (Reese 1996). Traps for juvenile turtles were only deployed in locations with preferred habitat for juveniles. The additional traps included both floating and basking traps, with trap entrances of less than 7 cm so that reproductively viable (larger) turtles were excluded from entering the traps. The additional traps included both floating and basking traps, with trap entrances of less than 7 cm so that reproductively viable (larger) turtles were excluded from entering the traps. Two events of one week of trapping were conducted to radio tag WPTs, when needed. Collapsible nylon net traps were staked or tied in water of sufficient depth to submerge the entries. The turtle traps were baited with sardines, set in the morning, and checked at least once every two hours during the day (i.e. trapping day). Floating traps were operated and baited during the day, and in addition, operated at night. These traps were checked during the day on the same schedule as the nylon net traps, but were left in place to trap at night and checked the following morning. The same data were collected during displacement studies for western pond turtles, as those collected as part of the population and demography studies. VES for juvenile WPTs were performed near trapping sites and in flowing tributaries in conjunction with trapping. Detailed methods and data collected are provided in (SCE 2008). Radio tags were attached to the carapaces of a target of up to 10 adult and five juvenile WPTs during the two years of displacement studies, in order to track WPTs and determine if displacement occurred. Radio tags with internal helical antennae were used. The battery life was expected to last from about six weeks to two months, depending upon tag size and use (for juvenile or adult WPTs). Tags for juvenile WPTs weighed less than one gram and comprised less than one percent of the body weight of yearling and older juvenile turtles. Radio tags were removed from the turtles when recaptured during trapping for the population and demography studies later in the year. Radio tags were glued onto the middle of the carapace of WPTs with epoxy and molded to the shell with dental acrylic colored black with copy machine toner (Rathbun et al. 2002). WPTs were tracked within 24-48 hours of out-of-season experimental whitewater flow releases from the air in conjunction with tracking of radio tagged adult hardhead. The location of each turtle was noted including GPS location. Biologist recorded data on physical habitat conditions at sites where tagged turtles were located prior to and after the releases. These data was analyzed to determine if WPTs moved to new locations after the out-of-season experimental whitewater flow releases, and documented microhabitat changes that resulted in those movements.
Copyright 2013 by Southern California Edison Company A-1 Draft 2013
Draft NASMP and AMP – Big Creek No. 4 Hydroelectric Project, FERC No. 2017 2013 Data Collection Report
RADIO TAGGING AND MONITORING OF ADULT HARDHEAD A target of 10 adult hardhead was collected by hook and line, and radio tagged two to three weeks prior to the first whitewater release flow. The same sites used to radio tag hardhead during 2011 (SCE 2012a) were sampled to obtain adult hardhead for tagging and tracking in 2013. All equipment used during tag implantation, and processing was sterilized prior to use. Adult hardhead ≥185 g were anesthetized before processing and attaching tags. Data collected for each individual included the physical dimensions, apparent condition, and location. A radio tag was secured just below the dorsal fin, and a Floy tag inserted on the opposite side of each fish. The radio tag apparatus weighed less than two percent of the body weight of each hardhead. All fish were allowed to recover in an aerated cooler and released at the point of capture.
Detailed radio tag implementation methods were as follows:
Preparation of Implantation Gear 1. All containers and tools for processing fish were disinfected and/or sterilized.
Tubing, attachment wires, plastic disks, and beads used to attach the tags were sterilized with isopropyl alcohol. Items small enough were submerged in isopropyl alcohol and air dried after submersion and larger items were wiped down with aquarium wipes and allowed to air dry.
2. Radio tags that were used were checked and confirmed functional. The deactivation magnet was removed from the radio tag, frequency dials set on the receiver, and then the receiver was turned on to listen for the signal. Magnets were placed back on radio tags after tag confirmation until needed for implantation.
3. All surgical tools were sterilized after each use and measure boards and weighing containers rinsed with water and wiped down with aquarium wipes. Larger items such as coolers, tubs, etc. were sterilized daily before use at a new site.
Processing Fish Fish were weighed, length measured (fork length), and inspected for injuries and signs of disease.
Implantation of Radio Tags 1. Two holes were punched all the way through the musculature a few (mm)
below the dorsal fin using a tapered surgical pick. The hole was enlarged to accommodate the surgical tubing by running through the tapered surgical pick from the other side. A template was used to determine where the holes were made with the tapered surgical pick to ensure proper spacing of holes. The template was lined up and fin rays identified and written down before holes were punched.
Copyright 2013 by Southern California Edison Company A-2 Draft 2013

Draft NASMP and AMP – Big Creek No. 4 Hydroelectric Project, FERC No. 2017 2013 Data Collection Report
2. Surgical tubing was placed on a non-tapered surgical pick and slid through holes in the fish musculature. The surgical pick was carefully withdrawn from the surgical tubing, so that the surgical tubing remained in the musculature.
3. The radio tag attachment wires were run through the surgical tubing. The tags were attached to the left side of the fish. Once the attachment wires were all the way through, the surgical tubing was carefully pushed out of the musculature with a surgical pick. The surgical tubing used was discarded and not reused. Betadine was applied to the puncture wounds on the fish prior to securing the transmitter.
4. A plastic disc was secured on each attachment wire followed by a bead crimp. Concentration and care was taken at this step, because this could result in a mistake that could greatly increase the time required to complete the process. The bead crimp was crimped with a bead crimper.
5. The attachment wires were tied in a knot, but not too tight to cause pulling on the bead/disc apparatus. Excess wire was trimmed off after tying the knot.
6. Marine epoxy was applied to the knot in the attachment wires and the bead crimp and hole on each plastic disc.
7. A Floy tag was inserted on the right side of the fish below the dorsal fish opposite of the radio tag using a Floy tagging gun. The Floy tag was inserted approximately half way between the anterior end and middle of the dorsal fin in the musculature. Care was taken to avoid damaging the spine of the fish when implanting the Floy tag.
8. All tagged fish were photographed immediately after tags were attached.
9. Fish were placed in recovery cooler with recirculating water from river and checked periodically to ensure recovery.
*Fish were irrigated with river water with a wash bottle as was necessary during the tag implantation process making sure to irrigate through the mouth to ensure gill irrigation. Also, the fish were irrigated with the MS-222 solution with a wash bottle during the implantation process when fish started moving making the process difficult. All tools used during the implantation were sterilized between fish.
Fish Recovery and Release All tagged fish were placed in a recovery cooler and allowed to recover to the point that the fish had recovered equilibrium on its own and was active inside the cooler when being checked. The recovery cooler was kept closed in between fish transfers and checks. The recovery cooler was placed in the shade when possible.
Radio tagged hardhead were located from the air prior to each out-of-season experimental whitewater flow release and within 24-48 hours following return to
Copyright 2013 by Southern California Edison Company A-3 Draft 2013

Draft NASMP and AMP – Big Creek No. 4 Hydroelectric Project, FERC No. 2017 2013 Data Collection Report
prerelease flows. Monitoring of hardhead radio tags took place in conjunction with monitoring of radio tagged WPTs.
The location of each radio tagged hardhead adult was noted including GPS location. These data were analyzed to determine if radio tagged adult hardhead were transported to new locations after the out-of-season experimental whitewater flow releases.
STRANDING
Stranding and Trapping Potential Sites for this study element were generally about 100 m in length. Each site was inspected and documented prior to stranding studies. The areas were walked where possible. Other areas that could not be walked were surveyed using kayaks. Areas on both sides of the river were assessed. The survey crews described geomorphic characteristics conducive to trapping and stranding on site base maps. Photographs were taken and GPS locations recorded for each area that had the potential to trap or strand fish. The following characteristics were used to describe the potential area for trapping or stranding:
Primary 1. Areas where the bed slope is generally less than four percent in any direction;
and
2. Pot holes, scour holes, and other trapping depressions (evident by temporary or prolonged ponding as the water recedes).
Secondary 1. Debris piles;
2. General substrate texture on exposed surfaces (e.g., patches of predominantly sand, fine gravel, coarse gravel, cobble, boulder, or bedrock); and
3. Embeddedness on same surfaces (mapped as zero, 1-33 percent, 34-66 percent, 67-100 percent classes; reflects subsurface and surface stranding potential).
Stranding and Trapping Incidence The study areas were surveyed by two teams by walking or floating in kayaks in areas that could not be walked as the water level receded during down ramping. Particular attention was given to areas with higher potential for stranding. Teams of two biologists each surveyed each bank of each site. Biologists conducted VES in locations where organisms could be stranded. The field teams recorded locations where trapping and stranding occurred during down ramping. The field teams identified the number, species, lifestage, and size of fish, amphibians, and reptiles found stranded or trapped, and indicated mortalities and likely causes for each occurrence. In stranding locations, biologists searched for fish, amphibians and turtles stranded in previously inundated
Copyright 2013 by Southern California Edison Company A-4 Draft 2013

Draft NASMP and AMP – Big Creek No. 4 Hydroelectric Project, FERC No. 2017 2013 Data Collection Report
bushes and dry land. Systematic searches for stranded or trapped fish was conducted in established survey areas. Monitoring did not extend past sunset, including the time it took to leave the monitoring site for safety considerations. In order to maximize the daylight hours available to monitor stranding, out-of-season experimental whitewater flow releases were maintained until after sunrise of the day following each release. Down ramping and monitoring began after sunrise. Flows were ramped down by hourly adjustments of releases at Dam 7. Sites at which flows had not returned to prerelease levels by sunset were completed the following day. Monitoring sites were visually assessed for fish stranded after each out-of-season experimental whitewater flow release. Stranding observations were made during each hourly step of the ramp-down during daylight hours. The surfaces of the exposed substrates were surveyed for stranded or trapped aquatic biota. Fish, amphibians, and reptiles were identified to species level where possible and fish fork lengths measured to assess size-dependent stranding effects. Surveyors randomly lifted surface cobbles to look for animals. Surveyors also recorded the length of the search area, and search time at each survey area and for each ramp-down survey event (approximately hourly). When possible, survey areas were marked and locations recorded with a GPS unit. Representative photographs were taken to document stranded organisms, along with records of time and date. Data were recorded on data sheets.
Mapping documented where organisms were found and their physical condition was recorded. Fish (and amphibians and WPTs, if present) were characterized according to one of the following four categories:
1. Killed by direct stranding as the water level receded;
2. Trapped first as the water level receded and then stranded as the water subsequently percolated through the riverbed;
3. Dying, trapped biota found in micro-depressions or small pools still containing water; and
4. Biota found trapped in a relatively large pool with a water surface elevation approximating the local groundwater/ channel water surface elevation, and is not expected to dry up for at least several days, or is permanent (e.g. bedrock scour pools).
The limits of distribution of heavy concentrations of stranded organisms were marked on maps. Alternatively, locations of individuals were marked if there were no other aquatic organisms found in the vicinity.
Sub-sampling of the exposed substrate survey area was conducted near the locations of stranded biota. The surficial substrate layer in non-embedded substrate areas was manually removed (if feasible) within a subsample area of one square meter. This information was used to assess the degree to which stranded biota escaped detection in the more extensive surface surveys, and defined the extent to which fish may have move down within relatively non-embedded substrate as water levels receded.
Copyright 2013 by Southern California Edison Company A-5 Draft 2013

Draft NASMP and AMP – Big Creek No. 4 Hydroelectric Project, FERC No. 2017 2013 Data Collection Report
ELECTROFISHING FOR FISH POPULATION MONITORING Electrofishing surveys were conducted in shallower habitats. Multiple removal population estimates were made (for baseline monitoring only). All fish species present were identified to species, lifestage and abundance was estimated. Electrofishing sampling enabled the collection of fish length, weight, and scales. These provided information on standing crop, fish age, condition factor, and growth for native fish species. Observation of collected fish provided information on disease or injury, if present. Electrofishing was used to estimate the proportion of hardhead to Sacramento pikeminnow juveniles (“unidentified cyprinids”) observed during snorkeling.
Electrofishing was conducted using Smith-Root Type 12B or Type 21 backpack electrofishing units. This sampling technique was used in habitats sufficiently shallow (under normal Project operating conditions) to allow adequate sampling. The upstream and downstream ends of each site were blocked using 0.25-inch mesh block nets (for baseline monitoring only). Sampling was conducted using multiple pass depletion, in which fish were stunned and removed from the site in multiple sequential passes (for baseline monitoring only). In this case, population estimates were based on the maximum likelihood technique of Zippin (1958) using the Microfish computer program (Deventer and Platts 1989). Sampling was performed in an upstream direction beginning at the downstream block net and finishing at the upstream block net.
Data from electrofishing were used to compute Fulton’s condition factor (Ricker 1975) for fish captured and measured during population surveys.
Fulton’s Condition Factor: K= W * X L3
Where: K = Fulton’s Condition Factor W = Weight (g) L = Total length (mm) X = 100,000 (a scaling constant)
Fish Measurement and Handling All captured fish² were identified to species, measured for length to the nearest mm fork length, and weighed to the nearest 0.1 g for fish up to 2 kg, or to the nearest gram for fish over two kg. Each fish processed was examined for disease or injury and its condition noted on the field sheets. Scale samples were collected from native cyprinids, catastomids, and wild rainbow trout for age and growth determinations. When very large numbers (>100) of a species were captured, the measurements were collected from 10 fish within each 25-mm size range.
Scales were collected from the backs of the fish above the lateral line and below and slightly behind the dorsal fin. Scales were stored in envelopes and the date, stream, site, species, length, weight and a data sheet reference code recorded on the envelope. Scale analyses was conducted to determine the age of sampled fish and to assess the age structure of sampled populations. To determine the age of the fish, scales were
Copyright 2013 by Southern California Edison Company A-6 Draft 2013

Draft NASMP and AMP – Big Creek No. 4 Hydroelectric Project, FERC No. 2017 2013 Data Collection Report
mounted on standard glass microscope slides and either directly viewed through a microscope.
Fish observed during snorkeling were not captured and so were not subject to the measurements and analyses described in this subsection.
Snorkeling Direct observation of fish by snorkel surveys were conducted in habitats that were too deep (pools and deep runs) for effective sampling by electrofishing. Both techniques provide information on fish abundance and length. However, direct observation yielded lower resolution length information, since lengths were visually estimated in comparison to a target. The snorkeled habitat units were divided into one or more swimming lanes parallel to the direction of stream flow. Methods generally were similar to those presented in Griffith (1972), Platts et al. (1983), Hicks and Watson (1985), Hankin and Reeves (1988), and Hillman et al. (1992). Underwater visibility was measured and determined lane width (Hillman et al. 1992). Surveys were performed between 0900 to 1600 hours (Hankin and Reeves 1988) to maximize the likelihood that light intensities were suitable for observing fish. Direct observation surveys were not conducted on overcast days (Platts et al. 1983).
Divers entered the water slightly below the downstream end of the sample unit (Hankin and Reeves 1988) and moved directly across and slightly below the lowermost boundary of the sample unit into their designated swimming lane. When in position, the divers moved upstream to the lowermost boundary of the sample unit. From a fixed position and prior to moving upstream, the divers looked upstream to locate fish on the fringe of vision (Platts et al. 1983). Divers then identified and counted fish species in their lane, while moving slowly upstream at a uniform, even, pace with no abrupt movements. Fish were counted as they pass below or to the side of an observer. Cover for fish, such as interstitial spaces between substrate particles, woody debris, bubble screens, crannies in bedrock, and along stream margins were inspected closely for concealed fish to the best of the divers’ abilities (Fausch and White 1981; Hicks and Watson 1985). A bank-side observer was employed and stationed to monitor and verbally direct diver distribution and sampling rate when possible. Fish lengths were estimated by comparison with a fish length calibration cord. The calibration cord was a piece of small-diameter rope with size length categories marked on it. In addition to the fish length calibration cord, divers were trained in estimating fish lengths, so estimates of fish length were consistent and as accurate as possible.
Abiotic Measurements for Fish Population Monitoring Routine observations were made of habitat and physical conditions in the specific areas sampled. These observations included physical measurements of water temperature, specific conductance, and DO. These measurements were made using a Quanta water quality meter (or equivalent). The Quanta were calibrated at least once a day prior to use, to correct for altitude and DO saturation among sites.
Copyright 2013 by Southern California Edison Company A-7 Draft 2013
Draft NASMP and AMP – Big Creek No. 4 Hydroelectric Project, FERC No. 2017 2013 Data Collection Report
LARVAL FISH SAMPLING FOR DISPLACEMENT The light traps were operated to check for the presence of larval fish. Light traps constructed following the general design of Kissick (1993) were used with modifications similar to those described by Marchetti et al. (2004). Light was used to attract larval fish. Based on the work of Marchetti et al. (2004) green chemical light sticks (8-in glow sticks) were used. Two traps were operated in each location overnight. Collections started before sunset and operated until after sunrise.
After retrieval of the traps, the contents were transferred to a sample jar and preserved in 95 percent ethanol. Labels were placed in and on the sample jars. Labels identified the date, time, location, and duration of sampling. Water temperature, turbidity, and dissolved oxygen were measured before setting the light traps and after retrieving the traps. Each sample was sorted and larval fish identified to the lowest feasible taxon. The length and stage of development were recorded. Voucher specimens were sent for to a qualified larval fish taxonomist for independent verification.
Copyright 2013 by Southern California Edison Company A-8 Draft 2013

Draft NASMP and AMP – Big Creek No. 4 Hydroelectric Project, FERC No. 2017 2013 Data Collection Report
APPENDIX B
TEMPERATURE, METEOROLOGY, AND HYDROLOGY DATA
Copyright 2013 by Southern California Edison Company Draft 2013
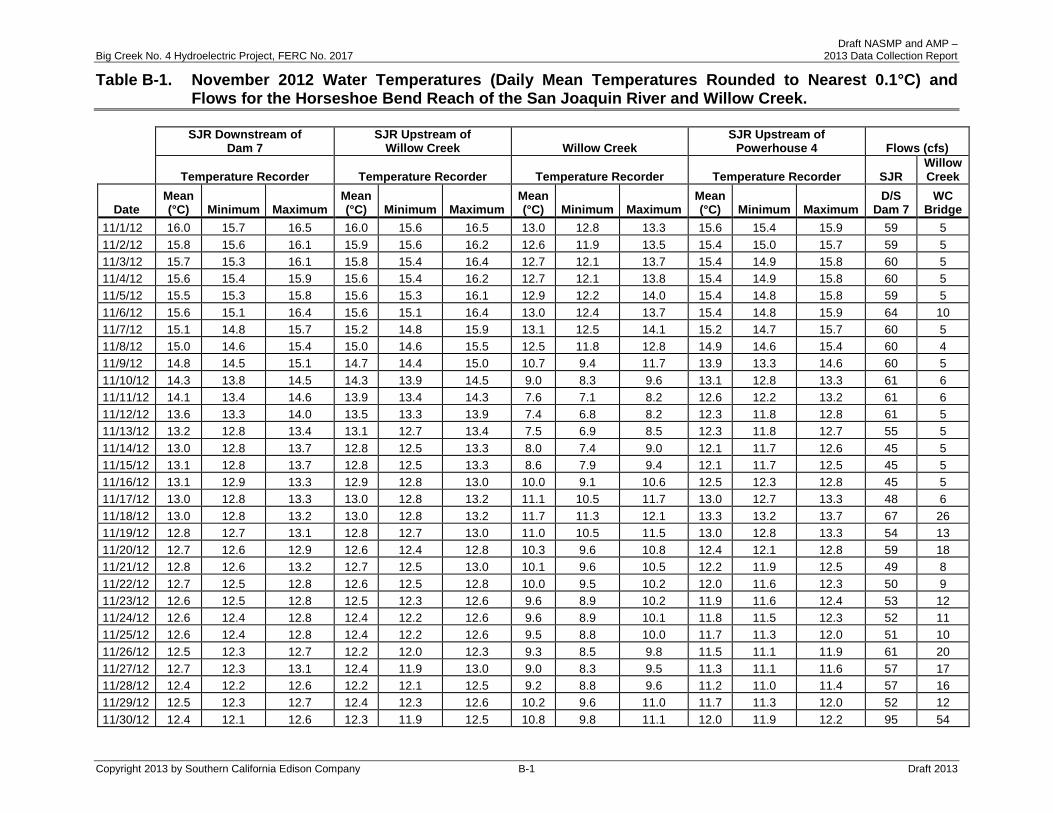
Draft NASMP and AMP – Big Creek No. 4 Hydroelectric Project, FERC No. 2017 2013 Data Collection Report
Table B-1. November 2012 Water Temperatures (Daily Mean Temperatures Rounded to Nearest 0.1°C) and Flows for the Horseshoe Bend Reach of the San Joaquin River and Willow Creek.
SJR Downstream of
Dam 7 SJR Upstream of
Willow Creek Willow Creek SJR Upstream of
Powerhouse 4 Flows (cfs)
Temperature Recorder Temperature Recorder Temperature Recorder Temperature Recorder SJR Willow Creek
Date Mean (°C) Minimum Maximum
Mean (°C) Minimum Maximum
Mean (°C) Minimum Maximum
Mean (°C) Minimum Maximum
D/S Dam 7
WC Bridge
11/1/12 16.0 15.7 16.5 16.0 15.6 16.5 13.0 12.8 13.3 15.6 15.4 15.9 59 5 11/2/12 15.8 15.6 16.1 15.9 15.6 16.2 12.6 11.9 13.5 15.4 15.0 15.7 59 5 11/3/12 15.7 15.3 16.1 15.8 15.4 16.4 12.7 12.1 13.7 15.4 14.9 15.8 60 5 11/4/12 15.6 15.4 15.9 15.6 15.4 16.2 12.7 12.1 13.8 15.4 14.9 15.8 60 5 11/5/12 15.5 15.3 15.8 15.6 15.3 16.1 12.9 12.2 14.0 15.4 14.8 15.8 59 5 11/6/12 15.6 15.1 16.4 15.6 15.1 16.4 13.0 12.4 13.7 15.4 14.8 15.9 64 10 11/7/12 15.1 14.8 15.7 15.2 14.8 15.9 13.1 12.5 14.1 15.2 14.7 15.7 60 5 11/8/12 15.0 14.6 15.4 15.0 14.6 15.5 12.5 11.8 12.8 14.9 14.6 15.4 60 4 11/9/12 14.8 14.5 15.1 14.7 14.4 15.0 10.7 9.4 11.7 13.9 13.3 14.6 60 5 11/10/12 14.3 13.8 14.5 14.3 13.9 14.5 9.0 8.3 9.6 13.1 12.8 13.3 61 6 11/11/12 14.1 13.4 14.6 13.9 13.4 14.3 7.6 7.1 8.2 12.6 12.2 13.2 61 6 11/12/12 13.6 13.3 14.0 13.5 13.3 13.9 7.4 6.8 8.2 12.3 11.8 12.8 61 5 11/13/12 13.2 12.8 13.4 13.1 12.7 13.4 7.5 6.9 8.5 12.3 11.8 12.7 55 5 11/14/12 13.0 12.8 13.7 12.8 12.5 13.3 8.0 7.4 9.0 12.1 11.7 12.6 45 5 11/15/12 13.1 12.8 13.7 12.8 12.5 13.3 8.6 7.9 9.4 12.1 11.7 12.5 45 5 11/16/12 13.1 12.9 13.3 12.9 12.8 13.0 10.0 9.1 10.6 12.5 12.3 12.8 45 5 11/17/12 13.0 12.8 13.3 13.0 12.8 13.2 11.1 10.5 11.7 13.0 12.7 13.3 48 6 11/18/12 13.0 12.8 13.2 13.0 12.8 13.2 11.7 11.3 12.1 13.3 13.2 13.7 67 26 11/19/12 12.8 12.7 13.1 12.8 12.7 13.0 11.0 10.5 11.5 13.0 12.8 13.3 54 13 11/20/12 12.7 12.6 12.9 12.6 12.4 12.8 10.3 9.6 10.8 12.4 12.1 12.8 59 18 11/21/12 12.8 12.6 13.2 12.7 12.5 13.0 10.1 9.6 10.5 12.2 11.9 12.5 49 8 11/22/12 12.7 12.5 12.8 12.6 12.5 12.8 10.0 9.5 10.2 12.0 11.6 12.3 50 9 11/23/12 12.6 12.5 12.8 12.5 12.3 12.6 9.6 8.9 10.2 11.9 11.6 12.4 53 12 11/24/12 12.6 12.4 12.8 12.4 12.2 12.6 9.6 8.9 10.1 11.8 11.5 12.3 52 11 11/25/12 12.6 12.4 12.8 12.4 12.2 12.6 9.5 8.8 10.0 11.7 11.3 12.0 51 10 11/26/12 12.5 12.3 12.7 12.2 12.0 12.3 9.3 8.5 9.8 11.5 11.1 11.9 61 20 11/27/12 12.7 12.3 13.1 12.4 11.9 13.0 9.0 8.3 9.5 11.3 11.1 11.6 57 17 11/28/12 12.4 12.2 12.6 12.2 12.1 12.5 9.2 8.8 9.6 11.2 11.0 11.4 57 16 11/29/12 12.5 12.3 12.7 12.4 12.3 12.6 10.2 9.6 11.0 11.7 11.3 12.0 52 12 11/30/12 12.4 12.1 12.6 12.3 11.9 12.5 10.8 9.8 11.1 12.0 11.9 12.2 95 54
Copyright 2013 by Southern California Edison Company B-1 Draft 2013

Draft NASMP and AMP – Big Creek No. 4 Hydroelectric Project, FERC No. 2017 2013 Data Collection Report
Table B-2. December 2012 Water Temperatures (Daily Mean Temperatures Rounded to Nearest 0.1°C) and Flows for the Horseshoe Bend Reach of the San Joaquin River and Willow Creek.
SJR Downstream of
Dam 7 SJR Upstream of
Willow Creek Willow Creek SJR Upstream of
Powerhouse 4 Flows (cfs)
Temperature Recorder Temperature Recorder Temperature Recorder Temperature Recorder SJR Willow Creek
Date Mean (°C) Minimum Maximum
Mean (°C) Minimum Maximum
Mean (°C) Minimum Maximum
Mean (°C) Minimum Maximum
D/S Dam 7
WC Bridge
12/1/12 11.9 11.6 12.1 11.9 11.7 12.0 9.8 9.2 10.3 10.7 10.3 12.0 118 77 12/2/12 11.7 11.7 11.8 11.7 11.6 11.8 10.6 10.2 11.2 10.9 10.4 11.6 215 174 12/3/12 11.3 11.0 11.7 11.4 11.0 11.7 10.6 10.1 11.2 10.7 10.5 11.0 183 141 12/4/12 11.1 10.9 11.3 11.1 10.9 11.3 10.3 9.7 10.8 11.1 10.8 11.4 81 39 12/5/12 11.1 11.0 11.6 11.2 11.0 11.5 10.6 10.2 11.0 11.3 11.1 11.4 64 22 12/6/12 11.0 10.9 11.2 11.0 10.9 11.2 10.9 10.4 11.4 11.4 11.1 11.9 60 18 12/7/12 11.9 11.0 12.1 11.9 11.0 12.1 11.2 10.9 11.4 11.7 11.5 12.1 281 15 12/8/12 11.9 11.7 12.0 11.9 11.7 12.1 10.4 9.9 11.3 11.8 11.6 12.1 280 13 12/9/12 11.8 11.7 11.9 11.8 11.7 11.9 10.1 9.8 10.5 11.8 11.7 12.0 380 12 12/10/12 11.6 11.5 11.8 11.7 11.5 11.8 8.9 8.3 9.7 11.6 11.4 11.9 574 12 12/11/12 11.5 11.3 11.6 11.5 11.3 11.6 8.3 7.7 8.9 11.4 11.1 11.6 556 11 12/12/12 11.3 11.1 11.5 11.3 11.1 11.5 8.2 7.9 8.4 11.3 11.1 11.4 543 11 12/13/12 11.1 10.9 11.2 11.2 10.9 11.3 7.9 7.6 8.1 11.1 10.9 11.3 536 13 12/14/12 10.9 10.8 11.0 10.9 10.8 11.1 7.3 6.8 7.7 10.8 10.6 11.0 524 12 12/15/12 10.7 10.5 10.8 10.7 10.6 10.8 6.7 6.3 7.2 10.6 10.4 10.8 511 11 12/16/12 10.5 10.3 10.5 10.5 10.3 10.6 6.0 5.3 6.5 10.3 10.0 10.5 496 11 12/17/12 10.6 10.5 10.6 10.6 10.5 10.7 7.0 6.5 7.7 10.5 10.4 10.7 485 11 12/18/12 9.8 9.2 10.6 10.0 9.4 10.6 7.2 5.7 7.8 10.6 10.1 10.8 111 51 12/19/12 9.2 8.8 9.7 9.0 8.7 9.3 4.4 3.9 5.5 8.5 7.5 10.0 67 26 12/20/12 8.8 8.2 9.4 8.7 8.4 9.0 3.4 2.8 3.8 7.2 6.9 7.6 59 18 12/21/12 8.4 8.0 8.8 8.4 8.1 8.7 3.6 2.8 4.5 6.9 6.6 7.2 57 15 12/22/12 7.9 7.7 8.1 8.0 7.8 8.1 5.1 4.5 5.9 7.3 7.2 7.5 59 18 12/23/12 7.6 7.5 7.7 7.7 7.6 7.8 5.9 5.7 6.2 7.5 7.4 7.6 89 48 12/24/12 7.4 7.1 7.6 7.5 7.2 7.7 6.9 6.5 7.2 7.2 7.0 7.4 143 101 12/25/12 7.2 7.0 7.8 7.2 7.1 7.4 6.1 5.7 6.4 7.2 7.0 7.3 95 54 12/26/12 7.1 6.9 7.8 7.3 7.0 7.8 6.3 6.1 6.7 7.0 6.9 7.2 96 55 12/27/12 6.8 6.7 7.0 6.9 6.8 7.0 5.7 5.2 6.1 7.1 6.8 7.3 85 44 12/28/12 7.0 6.5 7.4 6.9 6.5 7.3 5.0 4.3 5.9 6.5 6.3 6.8 68 26 12/29/12 6.8 6.4 7.2 6.9 6.5 7.2 5.3 4.8 5.8 6.5 6.3 6.7 65 23 12/30/12 6.4 6.2 6.6 6.5 6.3 6.6 5.5 5.0 5.8 6.6 6.4 6.9 62 21 12/31/12 6.4 6.1 6.7 6.3 6.0 6.6 4.7 4.0 5.5 6.4 6.0 6.7 60 18
Copyright 2013 by Southern California Edison Company B-2 Draft 2013

Draft NASMP and AMP – Big Creek No. 4 Hydroelectric Project, FERC No. 2017 2013 Data Collection Report
Table B-3. January 2013 Water Temperatures (Daily Mean Temperatures Rounded to Nearest 0.1°C) and Flows for the Horseshoe Bend Reach of the San Joaquin River and Willow Creek.
SJR Downstream of
Dam 7 SJR Upstream of
Willow Creek Willow Creek SJR Upstream of
Powerhouse 4 Flows (cfs)
Temperature Recorder Temperature Recorder Temperature Recorder Temperature Recorder SJR Willow Creek
Date Mean (°C) Minimum Maximum
Mean (°C) Minimum Maximum
Mean (°C) Minimum Maximum
Mean (°C) Minimum Maximum
D/S Dam 7
WC Bridge
1/1/13 6.1 6.0 6.3 6.2 6.0 6.5 4.6 4.2 5.0 6.2 6.0 6.5 59 18 1/2/13 5.9 5.8 6.1 5.9 5.8 6.0 3.7 3.1 4.4 5.9 5.6 6.2 58 17 1/3/13 5.8 5.7 5.9 5.8 5.7 5.9 3.5 2.8 4.0 5.4 5.1 5.8 58 16 1/4/13 5.9 5.8 5.9 5.8 5.7 5.9 3.6 3.0 4.1 5.2 4.9 5.7 57 16 1/5/13 6.0 5.8 6.2 5.9 5.8 6.1 4.0 3.4 4.8 5.2 4.9 5.6 57 15 1/6/13 6.1 5.8 6.2 6.1 5.9 6.3 5.1 4.7 5.6 5.6 5.5 5.8 57 16 1/7/13 5.9 5.8 6.1 5.9 5.8 6.1 4.6 4.1 5.2 5.9 5.6 6.1 56 15 1/8/13 5.9 5.8 6.0 5.9 5.8 6.1 4.4 3.7 4.8 6.0 5.7 6.3 56 15 1/9/13 6.2 6.0 6.6 6.2 6.0 6.6 5.0 4.3 6.1 5.9 5.6 6.3 56 15 1/10/13 6.1 5.8 6.3 6.1 5.8 6.3 5.7 5.0 6.1 6.2 6.0 6.4 58 16 1/11/13 5.8 5.7 6.0 5.8 5.6 6.0 3.7 3.0 4.8 5.9 5.6 6.3 55 14 1/12/13 5.9 5.7 6.1 5.8 5.7 6.1 2.6 1.9 3.4 5.4 5.1 5.8 55 14 1/13/13 5.9 5.7 6.0 5.8 5.7 5.9 2.2 1.5 2.7 5.1 4.7 5.4 55 14 1/14/13 5.8 5.7 6.0 5.8 5.6 5.9 1.8 1.1 2.3 4.8 4.5 5.1 55 13 1/15/13 5.8 5.7 5.9 5.7 5.6 5.9 1.9 1.3 2.4 4.7 4.4 5.1 54 13 1/16/13 5.8 5.7 5.9 5.7 5.6 5.9 2.2 1.3 2.9 4.7 4.4 5.2 54 13 1/17/13 5.8 5.7 5.9 5.8 5.6 5.9 2.8 1.9 3.7 4.8 4.4 5.3 55 13 1/18/13 5.7 5.5 5.9 5.7 5.5 5.8 3.6 2.8 4.2 5.0 4.6 5.6 55 14 1/19/13 5.6 5.4 5.8 5.6 5.5 5.8 4.0 3.2 4.6 5.2 4.8 5.8 56 14 1/20/13 5.8 5.3 6.0 5.7 5.3 6.0 4.4 3.6 4.8 5.4 5.0 6.0 56 13 1/21/13 5.5 5.3 5.8 5.5 5.3 5.8 4.4 3.5 4.9 5.5 5.1 6.0 56 13 1/22/13 5.5 5.4 5.7 5.5 5.3 5.7 4.8 3.9 5.4 5.7 5.3 6.2 57 14 1/23/13 6.0 5.4 6.4 5.9 5.3 6.4 5.4 4.7 6.5 5.8 5.5 6.2 57 14 1/24/13 6.2 5.7 6.6 6.3 5.8 6.7 7.5 6.6 8.5 6.5 6.3 6.8 65 21 1/25/13 5.6 5.5 5.8 5.8 5.6 5.9 8.7 8.2 9.3 7.5 6.9 8.0 74 30 1/26/13 5.6 5.5 5.8 5.7 5.5 5.8 8.7 8.3 9.0 8.0 7.9 8.2 71 28 1/27/13 5.7 5.6 6.0 5.8 5.6 5.9 7.9 6.9 8.6 7.8 7.5 8.2 69 26 1/28/13 5.7 5.5 6.0 5.7 5.4 5.9 5.7 4.9 6.7 7.3 7.0 7.7 66 23 1/29/13 5.5 5.4 5.8 5.6 5.3 5.8 4.8 4.0 5.5 6.5 6.2 6.9 67 24 1/30/13 5.6 5.4 5.8 5.6 5.4 5.8 5.0 4.1 5.6 6.0 5.6 6.6 66 23 1/31/13 5.6 5.5 5.7 5.6 5.4 5.9 5.4 4.3 6.5 6.0 5.5 6.6 62 19
Copyright 2013 by Southern California Edison Company B-3 Draft 2013
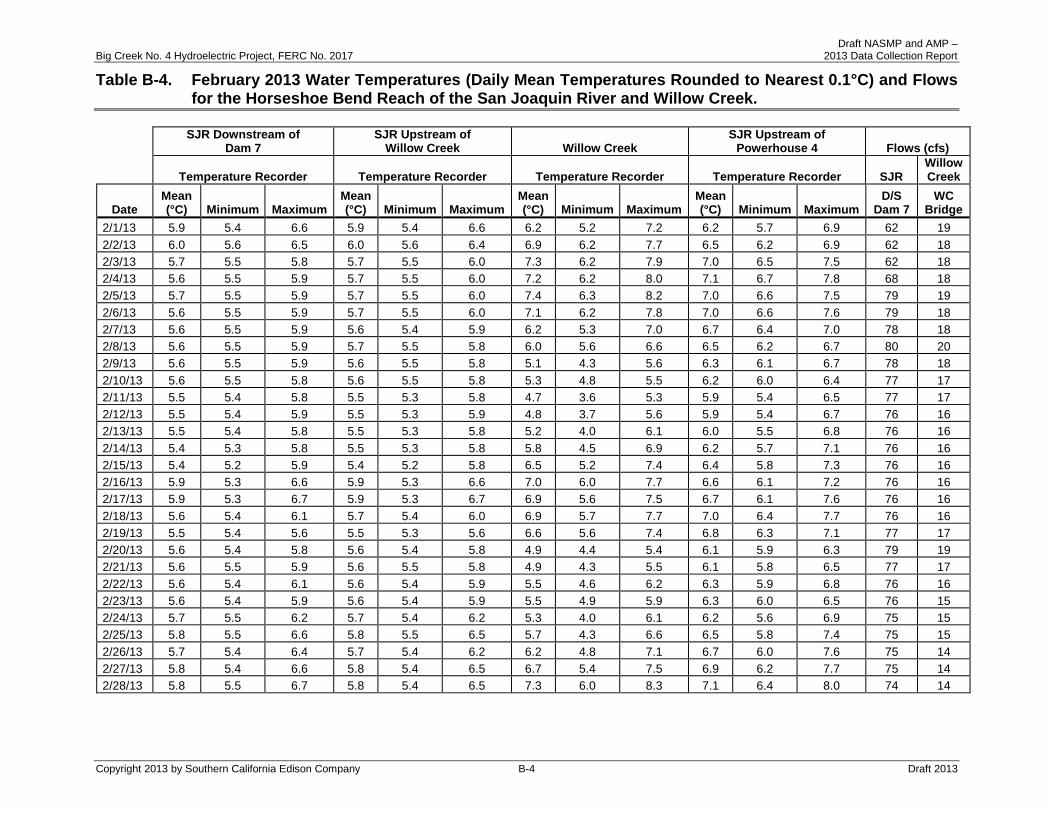
Draft NASMP and AMP – Big Creek No. 4 Hydroelectric Project, FERC No. 2017 2013 Data Collection Report
Table B-4. February 2013 Water Temperatures (Daily Mean Temperatures Rounded to Nearest 0.1°C) and Flows for the Horseshoe Bend Reach of the San Joaquin River and Willow Creek.
SJR Downstream of
Dam 7 SJR Upstream of
Willow Creek Willow Creek SJR Upstream of
Powerhouse 4 Flows (cfs)
Temperature Recorder Temperature Recorder Temperature Recorder Temperature Recorder SJR Willow Creek
Date Mean (°C) Minimum Maximum
Mean (°C) Minimum Maximum
Mean (°C) Minimum Maximum
Mean (°C) Minimum Maximum
D/S Dam 7
WC Bridge
2/1/13 5.9 5.4 6.6 5.9 5.4 6.6 6.2 5.2 7.2 6.2 5.7 6.9 62 19 2/2/13 6.0 5.6 6.5 6.0 5.6 6.4 6.9 6.2 7.7 6.5 6.2 6.9 62 18 2/3/13 5.7 5.5 5.8 5.7 5.5 6.0 7.3 6.2 7.9 7.0 6.5 7.5 62 18 2/4/13 5.6 5.5 5.9 5.7 5.5 6.0 7.2 6.2 8.0 7.1 6.7 7.8 68 18 2/5/13 5.7 5.5 5.9 5.7 5.5 6.0 7.4 6.3 8.2 7.0 6.6 7.5 79 19 2/6/13 5.6 5.5 5.9 5.7 5.5 6.0 7.1 6.2 7.8 7.0 6.6 7.6 79 18 2/7/13 5.6 5.5 5.9 5.6 5.4 5.9 6.2 5.3 7.0 6.7 6.4 7.0 78 18 2/8/13 5.6 5.5 5.9 5.7 5.5 5.8 6.0 5.6 6.6 6.5 6.2 6.7 80 20 2/9/13 5.6 5.5 5.9 5.6 5.5 5.8 5.1 4.3 5.6 6.3 6.1 6.7 78 18 2/10/13 5.6 5.5 5.8 5.6 5.5 5.8 5.3 4.8 5.5 6.2 6.0 6.4 77 17 2/11/13 5.5 5.4 5.8 5.5 5.3 5.8 4.7 3.6 5.3 5.9 5.4 6.5 77 17 2/12/13 5.5 5.4 5.9 5.5 5.3 5.9 4.8 3.7 5.6 5.9 5.4 6.7 76 16 2/13/13 5.5 5.4 5.8 5.5 5.3 5.8 5.2 4.0 6.1 6.0 5.5 6.8 76 16 2/14/13 5.4 5.3 5.8 5.5 5.3 5.8 5.8 4.5 6.9 6.2 5.7 7.1 76 16 2/15/13 5.4 5.2 5.9 5.4 5.2 5.8 6.5 5.2 7.4 6.4 5.8 7.3 76 16 2/16/13 5.9 5.3 6.6 5.9 5.3 6.6 7.0 6.0 7.7 6.6 6.1 7.2 76 16 2/17/13 5.9 5.3 6.7 5.9 5.3 6.7 6.9 5.6 7.5 6.7 6.1 7.6 76 16 2/18/13 5.6 5.4 6.1 5.7 5.4 6.0 6.9 5.7 7.7 7.0 6.4 7.7 76 16 2/19/13 5.5 5.4 5.6 5.5 5.3 5.6 6.6 5.6 7.4 6.8 6.3 7.1 77 17 2/20/13 5.6 5.4 5.8 5.6 5.4 5.8 4.9 4.4 5.4 6.1 5.9 6.3 79 19 2/21/13 5.6 5.5 5.9 5.6 5.5 5.8 4.9 4.3 5.5 6.1 5.8 6.5 77 17 2/22/13 5.6 5.4 6.1 5.6 5.4 5.9 5.5 4.6 6.2 6.3 5.9 6.8 76 16 2/23/13 5.6 5.4 5.9 5.6 5.4 5.9 5.5 4.9 5.9 6.3 6.0 6.5 76 15 2/24/13 5.7 5.5 6.2 5.7 5.4 6.2 5.3 4.0 6.1 6.2 5.6 6.9 75 15 2/25/13 5.8 5.5 6.6 5.8 5.5 6.5 5.7 4.3 6.6 6.5 5.8 7.4 75 15 2/26/13 5.7 5.4 6.4 5.7 5.4 6.2 6.2 4.8 7.1 6.7 6.0 7.6 75 14 2/27/13 5.8 5.4 6.6 5.8 5.4 6.5 6.7 5.4 7.5 6.9 6.2 7.7 75 14 2/28/13 5.8 5.5 6.7 5.8 5.4 6.5 7.3 6.0 8.3 7.1 6.4 8.0 74 14
Copyright 2013 by Southern California Edison Company B-4 Draft 2013

Draft NASMP and AMP – Big Creek No. 4 Hydroelectric Project, FERC No. 2017 2013 Data Collection Report
Table B-5. March 2013 Water Temperatures (Daily Mean Temperatures Rounded to Nearest 0.1°C) and Flows for the Horseshoe Bend Reach of the San Joaquin River and Willow Creek.
SJR Downstream of
Dam 7 SJR Upstream of
Willow Creek Willow Creek SJR Upstream of
Powerhouse 4 Flows (cfs)
Temperature Recorder Temperature Recorder Temperature Recorder Temperature Recorder SJR Willow Creek
Date Mean (°C) Minimum Maximum
Mean (°C) Minimum Maximum
Mean (°C) Minimum Maximum
Mean (°C) Minimum Maximum
D/S Dam 7
WC Bridge
3/1/13 5.8 5.5 6.8 5.8 5.5 6.5 8.2 6.8 9.3 7.4 6.8 8.3 75 14 3/2/13 6.3 5.6 7.3 6.4 5.6 7.2 9.0 7.7 10.1 7.8 7.1 8.6 76 15 3/3/13 5.8 5.6 6.0 5.9 5.7 6.1 9.8 9.4 10.1 8.2 7.7 8.7 77 16 3/4/13 6.0 5.6 6.8 6.0 5.6 6.7 9.2 7.8 10.0 8.0 7.4 8.7 80 19 3/5/13 6.1 5.8 6.8 6.1 5.7 6.8 9.2 7.6 10.3 8.2 7.5 9.2 77 17 3/6/13 5.9 5.7 6.1 6.0 5.8 6.2 9.3 8.8 9.9 8.3 8.0 8.6 78 19 3/7/13 5.9 5.7 6.1 5.9 5.8 6.1 8.1 7.7 8.9 7.7 7.5 8.2 81 21 3/8/13 5.9 5.8 6.5 5.9 5.7 6.2 7.1 6.7 7.7 7.4 7.2 7.5 81 21 3/9/13 6.0 5.8 6.4 6.0 5.8 6.4 7.0 6.5 7.5 7.4 7.1 7.7 83 22 3/10/13 6.1 5.7 7.0 6.1 5.7 6.7 7.5 6.0 8.7 7.6 6.9 8.4 82 21 3/11/13 6.3 5.9 7.3 6.2 5.8 6.9 8.2 6.4 9.8 7.9 7.2 8.9 81 20 3/12/13 6.3 5.9 7.4 6.2 5.8 6.9 9.4 7.5 11.0 8.3 7.5 9.3 81 21 3/13/13 6.3 5.8 7.4 6.3 5.8 7.0 10.3 8.3 11.9 8.8 8.0 9.8 87 27 3/14/13 6.5 6.0 7.6 6.5 6.0 7.3 11.3 9.6 12.5 9.1 8.4 9.7 106 46 3/15/13 6.4 5.9 7.1 6.4 6.0 6.9 11.8 10.3 13.1 10.1 9.4 11.1 85 24 3/16/13 6.5 6.1 7.7 6.5 6.1 7.3 12.2 10.6 13.5 10.0 9.2 10.8 85 24 3/17/13 6.5 6.2 7.4 6.5 6.1 7.1 11.7 10.2 12.7 9.9 9.2 10.9 84 23 3/18/13 6.5 6.2 7.3 6.5 6.2 7.0 10.8 9.2 12.0 9.7 9.0 10.4 82 22 3/19/13 6.6 6.1 7.6 6.5 6.2 7.2 11.4 9.8 12.7 9.6 8.8 10.5 81 20 3/20/13 6.5 6.3 7.0 6.5 6.3 6.9 11.8 11.2 12.4 9.8 9.4 10.2 76 22 3/21/13 6.8 6.3 8.0 6.7 6.2 7.4 11.3 9.8 12.6 9.7 8.9 10.5 65 22 3/22/13 6.8 6.3 7.9 6.7 6.2 7.4 11.1 9.5 12.3 10.1 9.4 11.0 64 20 3/23/13 6.8 6.3 8.1 6.6 6.3 7.4 10.1 8.5 11.2 10.2 9.6 10.8 63 19 3/24/13 6.9 6.3 8.1 6.7 6.3 7.5 10.2 8.3 11.7 10.0 9.3 10.7 62 18 3/25/13 6.8 6.3 7.6 6.7 6.3 7.2 10.8 9.3 12.1 10.0 9.4 10.4 62 18 3/26/13 7.0 6.4 8.1 6.8 6.4 7.4 11.3 9.8 12.6 10.1 9.5 10.8 61 17 3/27/13 7.0 6.4 7.9 6.8 6.4 7.4 11.6 10.1 12.9 10.3 9.7 11.1 61 17 3/28/13 6.9 6.5 7.6 6.8 6.4 7.2 12.0 10.7 12.9 10.5 10.1 10.9 60 17 3/29/13 7.1 6.4 8.3 6.9 6.4 7.6 12.1 10.3 13.5 10.6 9.9 11.4 60 16 3/30/13 7.1 6.6 8.2 7.0 6.6 7.7 12.9 11.2 14.3 11.0 10.2 11.8 59 16 3/31/13 7.1 6.6 8.1 7.0 6.7 7.6 13.9 12.9 15.0 11.7 11.1 12.4 66 22
Copyright 2013 by Southern California Edison Company B-5 Draft 2013

Draft NASMP and AMP – Big Creek No. 4 Hydroelectric Project, FERC No. 2017 2013 Data Collection Report
Table B-6. April 2013 Water Temperatures (Daily Mean Temperatures Rounded to Nearest 0.1°C) and Flows for the Horseshoe Bend Reach of the San Joaquin River and Willow Creek.
SJR Downstream of
Dam 7 SJR Upstream of
Willow Creek Willow Creek SJR Upstream of
Powerhouse 4 Flows (cfs)
Temperature Recorder Temperature Recorder Temperature Recorder Temperature Recorder SJR Willow Creek
Date Mean (°C) Minimum Maximum
Mean (°C) Minimum Maximum
Mean (°C) Minimum Maximum
Mean (°C) Minimum Maximum
D/S Dam 7
WC Bridge
4/1/13 7.2 6.5 8.6 7.0 6.5 7.8 12.7 11.5 13.7 11.6 11.0 12.1 68 24 4/2/13 7.1 6.4 8.1 7.0 6.4 7.6 11.3 9.5 12.6 11.4 10.7 11.9 66 22 4/3/13 7.3 6.6 8.3 7.2 6.6 7.8 12.1 10.3 13.8 11.3 10.6 11.9 62 19 4/4/13 7.1 6.8 7.9 7.0 6.8 7.5 12.5 11.6 13.3 11.0 10.7 11.4 61 17 4/5/13 7.3 6.7 8.1 7.2 6.7 7.8 12.7 11.0 14.0 10.9 10.4 11.4 63 19 4/6/13 7.5 6.8 8.7 7.4 6.9 8.1 12.9 11.2 14.2 11.0 10.1 12.0 61 17 4/7/13 7.5 6.8 8.8 7.5 6.8 8.4 13.1 11.3 14.4 11.7 10.9 12.5 59 16 4/8/13 7.2 6.9 7.8 7.2 6.9 7.5 12.3 11.4 13.9 11.6 11.3 12.1 61 17 4/9/13 7.6 6.7 9.5 7.4 6.6 8.9 10.7 8.7 12.0 10.9 10.2 11.6 62 18 4/10/13 7.6 6.7 8.8 7.5 6.6 8.5 11.3 9.1 13.1 10.8 9.9 11.7 69 16 4/11/13 7.8 7.1 8.9 7.7 7.1 8.6 12.9 10.8 14.6 11.2 10.4 12.1 76 15 4/12/13 7.8 7.1 8.9 7.8 7.2 8.7 14.1 12.2 15.6 11.4 10.4 12.5 76 15 4/13/13 8.0 7.3 9.3 7.9 7.4 8.9 14.7 13.0 15.9 11.7 10.9 12.6 76 15 4/14/13 8.1 7.3 9.2 8.0 7.3 9.0 14.8 13.0 16.1 11.8 10.9 12.8 76 15 4/15/13 7.9 7.1 8.7 8.1 7.2 8.7 13.7 12.2 14.8 11.7 10.8 12.5 75 14 4/16/13 7.8 7.3 8.3 7.9 7.6 8.3 11.6 10.6 13.4 10.7 10.2 11.4 75 14 4/17/13 7.8 6.8 8.7 8.0 7.0 9.1 10.3 8.4 11.6 10.0 9.1 11.0 76 15 4/18/13 7.8 7.2 8.6 8.0 7.5 8.9 10.6 8.5 12.2 10.3 9.3 11.4 76 15 4/19/13 8.0 7.6 8.4 8.2 7.8 8.8 11.6 9.7 13.3 10.7 9.7 11.8 75 14 4/20/13 8.1 7.8 8.4 8.3 7.9 8.9 13.3 11.3 14.8 11.3 10.1 12.5 74 13 4/21/13 8.1 7.7 8.6 8.4 8.0 8.8 14.8 12.9 16.2 11.9 10.9 13.1 73 12 4/22/13 8.2 7.7 8.7 8.4 8.1 8.9 16.0 14.2 17.2 12.4 11.4 13.6 74 12 4/23/13 8.2 7.7 8.8 8.5 8.1 9.0 16.6 15.0 17.7 12.8 11.8 13.9 73 12 4/24/13 8.2 7.6 8.7 8.5 8.1 9.0 16.5 14.7 17.5 12.9 11.9 13.9 70 12 4/25/13 8.4 8.0 8.9 8.7 8.2 9.4 16.8 15.3 17.8 13.0 12.0 14.0 72 11 4/26/13 8.4 7.9 9.0 8.7 8.2 9.5 16.8 15.2 18.0 13.0 11.9 14.0 72 11 4/27/13 8.5 8.2 9.1 8.8 8.3 9.6 17.3 15.6 18.4 13.1 12.0 14.1 72 11 4/28/13 8.7 8.2 9.4 9.0 8.5 9.8 18.1 16.5 19.4 13.3 12.2 14.4 71 10 4/29/13 8.7 8.2 9.4 9.0 8.5 9.8 18.5 17.0 19.8 13.6 12.5 14.7 70 9 4/30/13 8.9 8.3 9.7 9.2 8.5 10.3 18.8 17.4 20.0 13.8 12.7 14.8 60 9
Copyright 2013 by Southern California Edison Company B-6 Draft 2013

Draft NASMP and AMP – Big Creek No. 4 Hydroelectric Project, FERC No. 2017 2013 Data Collection Report
Table B-7. May 2013 Air Temperature and Relative Humidity, Water Temperatures (Daily Mean are Rounded to Nearest 0.1°C) and Flows for the Horseshoe Bend Reach of the San Joaquin River and Willow Creek.
Redinger Lake at Dam 7 SJR Downstream of Dam 7 SJR Upstream of Willow Creek Willow Creek Willow Creek Bridge SJR Downstream of Willow Creek
Temperature Recorder Temperature Recorder Temperature Recorder Temperature Recorder Temperature Recorder Temperature Recorder
Date Mean (°C) Minimum Maximum
Mean (°C) Minimum Maximum
Mean (°C) Minimum Maximum
Mean (°C) Minimum Maximum
Mean (°C) Minimum Maximum
Mean (°C) Minimum Maximum
5/1/13 12.8 9.9 16.2 8.8 8.1 9.8 9.3 8.5 10.7 18.3 16.7 20.0 18.3 16.8 19.3 9.6 9.0 10.6 5/2/13 12.1 10.1 14.2 8.9 8.3 9.4 9.3 8.6 10.3 17.9 16.1 19.6 17.8 16.2 19.0 9.5 8.8 10.5 5/3/13 12.5 10.9 13.8 9.0 7.9 9.7 9.4 8.3 10.2 18.2 16.6 20.1 18.1 16.6 19.4 9.7 9.3 10.3 5/4/13 12.6 11.5 14.1 9.2 8.6 9.7 9.5 8.9 10.3 18.3 16.8 20.1 18.2 16.8 19.4 9.7 9.1 10.4 5/5/13 12.6 11.9 13.4 9.2 8.6 9.7 9.5 8.9 10.3 17.7 16.8 18.9 17.7 16.9 18.4 9.8 9.2 10.5 5/6/13 12.7 11.4 13.8 9.5 8.9 10.3 9.9 9.2 11.1 17.4 16.7 19.0 17.4 16.7 18.4 10.1 9.5 11.0
5/7/13 12.9 11.4 14.1 9.5 9.0 10.0 9.7 9.3 10.1 15.8 14.9 16.8 15.8 14.9 16.9 9.8 9.6 10.1 5/8/13 12.0 11.4 12.8 9.7 9.5 10.0 9.8 9.6 10.1 14.6 14.2 14.9 14.6 14.2 14.9 9.9 9.6 10.3 5/9/13 11.6 10.6 12.4 9.7 9.4 10.4 10.0 9.6 10.6 14.6 13.6 15.2 14.6 13.6 15.2 10.2 9.7 10.8 5/10/13 11.7 10.5 13.2 10.0 9.5 10.8 10.4 9.6 11.9 16.0 14.1 18.1 15.9 14.1 17.6 10.6 9.8 11.7 5/11/13 12.2 10.6 15.8 10.1 9.6 10.9 10.6 9.8 11.9 18.3 16.6 20.3 18.2 16.5 19.7 10.8 10.0 11.8 5/12/13 13.2 10.8 15.9 10.1 9.6 10.7 10.6 9.8 11.8 19.7 18.1 21.7 19.6 18.1 21.0 10.8 10.0 11.7
5/13/13 13.2 11.0 15.9 10.1 9.6 10.8 10.6 9.9 12.0 20.3 18.6 22.4 20.2 18.6 21.7 10.8 10.0 11.8 5/14/13 12.9 11.2 15.8 10.2 9.5 11.0 10.7 9.9 12.1 20.4 18.9 22.3 20.3 19.0 21.6 10.8 10.1 11.8 5/15/13 13.7 11.3 16.0 10.1 9.6 10.9 10.7 9.9 12.1 20.3 18.7 22.3 20.2 18.8 21.6 10.8 10.0 11.9 5/16/13 12.8 11.6 14.6 10.0 9.5 10.4 10.2 9.8 10.6 18.4 17.5 19.7 18.4 17.5 19.8 10.4 10.1 10.7 5/17/13 12.3 11.6 13.4 10.2 9.6 11.0 10.7 9.8 12.2 18.0 16.5 20.2 18.0 16.6 19.5 10.8 10.0 11.9 5/18/13 12.6 12.0 13.7 11.0 9.7 12.5 11.1 9.9 12.5 17.8 16.2 19.9 17.8 16.4 19.1 11.3 10.1 12.7
5/19/13 13.2 11.6 15.3 10.5 10.0 11.6 11.3 10.4 12.2 17.9 16.3 20.1 17.9 16.4 19.3 11.6 10.9 12.1 5/20/13 13.1 11.8 15.5 10.5 9.9 11.2 10.9 10.1 12.5 18.5 16.7 20.8 18.4 16.8 20.0 11.2 10.2 12.3 5/21/13 13.9 11.6 16.4 10.6 10.0 11.4 11.1 10.2 12.5 19.0 17.5 21.4 18.9 17.6 20.5 11.3 10.4 12.4 5/22/13 13.1 11.8 15.1 10.6 10.1 11.5 11.1 10.2 12.6 18.3 16.9 20.5 18.3 17.2 19.7 11.3 10.4 12.4 5/23/13 13.2 11.8 14.7 10.6 10.0 11.4 10.9 10.1 12.5 16.7 15.1 19.0 16.7 15.3 18.1 11.2 10.3 12.2 5/24/13 13.2 11.7 15.0 10.8 10.2 12.3 11.0 10.2 12.6 16.5 14.7 18.9 16.4 14.9 18.2 11.3 10.4 12.7
5/25/13 13.7 11.6 15.4 10.9 10.1 12.0 11.1 10.2 12.2 16.9 15.2 19.3 16.8 15.3 18.6 11.5 10.6 12.5 5/26/13 13.3 11.9 15.0 10.9 10.2 12.1 11.1 10.2 12.3 17.2 15.4 19.4 17.1 15.5 18.8 11.6 10.7 12.5 5/27/13 13.2 12.0 15.3 10.9 10.3 12.1 11.1 10.4 12.2 17.3 15.9 19.3 17.2 16.1 18.7 11.4 10.7 12.3 5/28/13 13.1 11.7 15.3 11.2 10.4 12.4 11.4 10.5 12.6 18.2 16.7 20.6 18.1 16.7 20.0 11.7 10.8 12.9 5/29/13 13.4 12.4 15.3 11.2 10.5 12.5 11.5 10.7 12.7 19.1 17.8 21.1 19.0 17.7 20.5 11.8 11.0 12.8 5/30/13 13.5 12.1 15.6 11.3 10.5 12.4 11.5 10.6 12.8 19.5 17.8 21.8 19.4 17.9 21.2 11.9 11.0 13.0
5/31/13 14.4 12.4 16.9 11.3 10.4 12.4 11.5 10.6 12.7 19.8 18.0 22.3 19.7 18.1 21.6 11.9 11.1 13.0
Copyright 2013 by Southern California Edison Company B-7 Draft 2013

Draft NASMP and AMP – Big Creek No. 4 Hydroelectric Project, FERC No. 2017 2013 Data Collection Report
Table B-7. May 2013 Air Temperature and Relative Humidity, Water Temperatures (Daily Means are Rounded to Nearest 0.1°C) and Flows for the Horseshoe Bend Reach of the San Joaquin River and Willow Creek (continued).
SJR Horseshoe Bend (East) SJR Horseshoe Bend (West) SJR Upstream of Powerhouse 4 Flows (cfs) Dam 7 Dam 7 Redinger Lake
Temperature Recorder Temperature Recorder Temperature Recorder SJR Willow Creek Air Temperature Recorder Relative Humidity
Surface Water Elevation
Date Mean (°C) Minimum Maximum
Mean (°C) Minimum Maximum
Mean (°C) Minimum Maximum
D/S Dam 7 WC Bridge
Mean (°C) Minimum Maximum Mean Minimum Maximum (Feet)
5/1/13 12.1 11.2 13.1 13.9 12.9 14.8 13.9 13.0 14.7 51 8 23.3 14.9 30.2 27.1 13.6 60.1 1,400
5/2/13 11.4 10.1 12.6 14.3 13.4 15.2 14.2 13.4 15.1 61 8 24.7 17.9 31.2 23.7 14.2 50.1 1,400 5/3/13 11.5 10.3 12.8 13.8 12.6 14.7 13.7 12.7 14.6 61 8 24.5 16.5 32.6 28.8 15.3 47.8 1,398 5/4/13 11.5 10.2 12.7 13.7 12.7 14.8 13.7 12.7 14.7 61 7 23.2 15.9 31.5 31.4 14.5 47.9 1,399 5/5/13 11.3 10.5 12.1 13.5 12.7 14.2 13.5 12.7 14.1 55 8 17.9 12.4 23.1 46.6 33.6 64.2 1,399 5/6/13 12.0 11.2 13.0 13.5 12.8 14.2 13.4 12.8 14.1 44 8 16.4 12.0 22.9 59.4 31.9 93.4 1,399 5/7/13 11.5 11.2 12.3 13.3 13.2 13.6 13.3 13.1 13.6 44 10 13.2 11.0 15.8 90.0 76.4 97.5 1,398
5/8/13 11.2 10.9 11.5 12.8 12.4 13.3 12.8 12.4 13.2 44 11 15.0 11.1 20.1 82.2 57.8 97.3 1,398 5/9/13 11.5 10.8 12.1 12.4 11.9 12.8 12.4 11.9 12.8 44 10 16.8 9.9 23.0 70.7 46.6 91.8 1,398 5/10/13 12.3 10.9 13.6 13.3 12.2 14.5 13.3 12.3 14.5 44 10 21.0 12.1 30.7 59.4 31.1 86.1 1,399 5/11/13 13.3 12.1 14.3 14.7 13.7 15.7 14.7 13.8 15.8 44 9 25.0 16.6 34.8 47.6 22.0 76.4 1,399 5/12/13 13.6 12.6 14.6 15.8 15.0 16.7 15.9 15.1 16.9 44 8 28.4 21.3 36.5 31.6 16.0 51.9 1,399 5/13/13 13.6 12.6 14.6 16.3 15.5 17.2 16.4 15.6 17.3 44 7 28.5 21.9 36.6 29.2 17.6 49.1 1,399
5/14/13 13.6 12.7 14.4 16.5 15.7 17.3 16.5 15.9 17.3 44 7 25.1 18.3 32.1 34.0 19.4 48.8 1,399 5/15/13 13.6 12.6 14.4 16.5 15.7 17.3 16.5 15.8 17.3 44 7 24.5 16.6 31.5 34.8 17.5 54.0 1,399 5/16/13 12.5 12.1 13.7 15.5 15.0 16.3 15.6 15.0 16.3 44 7 17.7 11.8 21.1 51.5 38.8 71.2 1,400 5/17/13 12.6 11.6 13.8 15.0 14.3 16.0 15.0 14.4 15.9 44 7 18.8 11.8 26.0 50.1 23.1 82.0 1,400 5/18/13 12.5 12.0 13.2 14.0 12.3 15.4 14.0 12.3 15.3 567 7 19.2 10.8 27.4 40.7 20.0 63.7 1,401 5/19/13 13.2 11.8 15.0 13.2 12.0 14.6 13.1 12.0 14.6 44 7 20.9 12.7 29.2 37.2 21.0 55.2 1,400
5/20/13 13.4 12.4 14.1 14.9 13.7 16.3 14.8 13.7 16.2 44 6 22.8 12.9 31.8 35.0 18.4 55.4 1,400 5/21/13 13.5 12.6 14.3 15.9 15.2 16.8 16.0 15.3 16.8 44 6 24.2 15.6 31.7 29.0 12.6 47.3 1,400 5/22/13 13.2 12.5 13.8 15.7 15.1 16.5 15.7 15.2 16.5 45 6 15.9 9.1 22.5 39.6 17.3 66.5 1,399 5/23/13 12.8 11.9 13.5 15.1 14.3 16.0 15.1 14.4 15.9 45 6 15.4 5.9 24.3 33.7 15.4 58.0 1,398 5/24/13 12.8 11.9 13.7 14.8 14.0 15.7 14.8 14.1 15.7 45 6 17.8 7.5 27.1 35.7 19.4 60.6 1,398 5/25/13 13.1 12.2 13.9 14.9 14.1 15.8 15.0 14.2 15.9 45 6 19.8 12.2 27.2 31.4 17.5 50.3 1,398
5/26/13 13.2 12.3 14.0 15.2 14.4 15.9 15.2 14.5 16.1 44 6 19.1 10.9 26.7 37.8 25.2 60.7 1,398 5/27/13 13.1 12.5 13.6 15.2 14.6 15.7 15.2 14.7 15.8 44 6 18.7 11.0 26.2 46.6 25.1 69.2 1,398 5/28/13 13.5 12.5 14.6 15.4 14.7 16.2 15.4 14.8 16.3 44 7 20.2 14.3 28.0 50.6 29.6 68.6 1,399 5/29/13 14.1 13.1 15.0 15.9 15.2 16.9 16.0 15.2 17.0 44 7 21.4 14.7 29.0 46.7 29.1 66.4 1,399 5/30/13 14.1 13.2 15.0 16.4 15.7 17.4 16.5 15.8 17.6 44 6 22.1 13.5 30.7 42.6 20.3 72.8 1,399 5/31/13 14.1 13.2 14.9 16.6 15.9 17.5 16.7 16.0 17.7 44 6 23.7 15.0 32.2 36.0 20.9 56.9 1,399
Copyright 2013 by Southern California Edison Company B-8 Draft 2013

Draft NASMP and AMP – Big Creek No. 4 Hydroelectric Project, FERC No. 2017 2013 Data Collection Report
Table B-8. June 2013 Air Temperature and Relative Humidity, Water Temperatures (Daily Means are Rounded to Nearest 0.1°C) and Flows for the Horseshoe Bend Reach of the San Joaquin River and Willow Creek.
Redinger Lake at Dam 7 SJR Downstream of Dam 7 SJR Upstream of Willow Creek Willow Creek Willow Creek Bridge SJR Downstream of Willow Creek
Temperature Recorder Temperature Recorder Temperature Recorder Temperature Recorder Temperature Recorder Temperature Recorder
Date Mean (°C) Minimum Maximum
Mean (°C) Minimum Maximum
Mean (°C) Minimum Maximum
Mean (°C) Minimum Maximum
Mean (°C) Minimum Maximum
Mean (°C) Minimum Maximum
6/1/13 14.6 12.8 17.1 11.4 10.7 12.5 11.6 10.8 12.8 20.5 18.5 23.2 20.4 18.6 22.6 12.0 11.1 13.1 6/2/13 15.4 13.0 18.6 11.4 10.7 12.5 11.7 10.9 12.8 21.3 19.2 24.0 21.2 19.3 23.4 12.0 11.1 13.0 6/3/13 14.9 12.7 19.0 11.4 10.6 12.6 11.7 10.9 12.9 21.7 19.7 24.2 21.6 19.8 23.7 12.1 11.3 13.2 6/4/13 14.1 13.1 16.1 11.5 10.7 12.6 11.7 10.8 12.8 22.3 20.5 24.5 22.3 20.7 24.1 12.1 11.2 13.0 6/5/13 14.3 13.2 15.9 11.6 10.9 12.7 11.8 11.0 12.9 22.8 20.8 25.3 22.7 20.9 24.8 12.2 11.2 13.3 6/6/13 14.5 13.6 15.7 11.7 11.0 12.9 11.9 11.1 13.1 23.2 21.1 25.8 23.2 21.3 25.3 12.3 11.3 13.4
6/7/13 14.5 13.5 16.3 11.8 11.0 13.0 12.0 11.2 13.1 23.8 21.6 26.5 23.8 21.7 26.2 12.4 11.4 13.4 6/8/13 14.3 13.4 16.5 11.9 11.2 13.2 12.2 11.3 13.5 24.5 22.6 26.2 24.4 22.6 26.0 12.5 11.5 13.7 6/9/13 14.1 13.2 16.3 12.1 11.2 13.2 12.3 11.5 13.4 25.1 24.0 26.1 25.0 24.0 25.8 12.7 11.8 13.7 6/10/13 14.3 13.0 16.7 12.1 11.2 13.4 12.2 11.4 13.3 23.6 22.7 24.8 23.6 22.8 24.9 12.6 11.7 13.5 6/11/13 14.4 12.9 19.6 12.1 11.4 13.4 12.3 11.5 13.5 22.5 20.9 24.2 22.4 20.8 23.7 12.7 11.8 13.9 6/12/13 14.5 12.7 19.1 12.2 11.3 13.5 12.4 11.6 13.5 22.4 20.8 24.1 22.3 20.8 23.7 12.8 11.9 13.8
6/13/13 14.0 12.9 16.0 12.2 11.3 13.4 12.2 11.4 13.5 21.5 20.0 22.9 21.4 20.0 22.4 12.7 11.7 13.9 6/14/13 14.0 12.6 15.8 12.2 11.3 13.5 12.3 11.4 13.6 20.9 19.2 22.5 20.9 19.2 22.0 12.7 11.8 13.9 6/15/13 14.6 12.7 18.1 12.2 11.3 13.5 12.3 11.6 13.5 20.9 19.2 22.6 20.9 19.2 22.2 12.8 11.8 13.8 6/16/13 14.7 12.6 17.7 12.2 11.3 13.6 12.3 11.4 13.5 20.9 19.2 22.6 20.9 19.2 22.2 12.8 11.8 14.0 6/17/13 14.0 12.8 16.0 12.2 11.4 13.6 12.3 11.5 13.6 21.2 19.6 23.1 21.1 19.7 22.6 12.8 11.8 14.0 6/18/13 13.9 12.9 15.9 12.2 11.5 13.5 12.3 11.6 13.5 20.9 19.4 22.7 20.8 19.4 22.2 12.8 11.9 13.9
6/19/13 14.3 13.1 16.3 12.3 11.5 13.5 12.3 11.5 13.6 20.1 18.6 21.7 20.0 18.7 21.2 12.8 12.0 13.8 6/20/13 14.5 12.7 16.4 12.3 11.5 13.5 12.4 11.6 13.5 19.6 17.9 21.3 19.6 17.9 20.8 12.8 11.9 13.8 6/21/13 14.9 12.8 17.2 12.4 11.7 13.6 12.5 11.7 13.6 19.9 18.2 21.7 19.9 18.2 21.2 12.9 12.0 14.0 6/22/13 15.4 12.9 17.5 12.2 11.8 13.3 12.5 11.8 13.7 20.5 18.7 22.5 20.7 18.8 22.7 12.9 12.1 13.9 6/23/13 15.0 13.1 16.8 12.1 11.8 12.8 12.4 11.9 13.1 20.5 19.5 21.4 20.4 19.6 21.1 12.7 12.1 13.4 6/24/13 14.7 13.6 17.0 12.1 11.8 12.4 12.3 11.9 12.8 19.8 19.3 20.2 19.8 19.2 20.2 12.4 12.1 12.9
6/25/13 13.9 13.1 14.8 12.4 12.0 13.1 12.8 12.1 14.0 20.9 19.3 23.0 20.9 19.3 22.7 13.0 12.1 14.1 6/26/13 15.2 12.9 19.1 12.4 12.0 13.1 12.9 12.2 13.8 22.5 20.9 24.5 22.5 20.9 24.1 13.2 12.3 14.2 6/27/13 14.9 13.4 17.7 12.5 12.1 13.2 12.9 12.2 14.1 23.7 22.1 25.6 23.7 22.1 25.2 13.2 12.3 14.3 6/28/13 15.0 13.9 16.3 12.6 12.2 13.1 13.0 12.3 14.2 24.6 23.0 26.7 24.8 23.2 26.7 13.3 12.5 14.3 6/29/13 15.5 13.5 19.5 12.6 12.2 13.3 13.1 12.4 14.1 25.4 23.8 27.6 25.5 23.9 27.2 13.4 12.5 14.4 6/30/13 16.6 13.8 22.6 12.6 12.2 13.4 13.1 12.5 14.0 25.9 24.5 27.9 26.0 24.5 27.5 13.4 12.6 14.4
Copyright 2013 by Southern California Edison Company B-9 Draft 2013

Draft NASMP and AMP – Big Creek No. 4 Hydroelectric Project, FERC No. 2017 2013 Data Collection Report
Table B-8. June 2013 Air Temperature and Relative Humidity, Water Temperatures (Daily Means are Rounded to Nearest 0.1°C) and Flows for the Horseshoe Bend Reach of the San Joaquin River and Willow Creek (continued).
SJR Horseshoe Bend (East) SJR Horseshoe Bend (West) SJR Upstream of Powerhouse 4 Flows (cfs) Dam 7 Dam 7 Redinger Lake
Temperature Recorder Temperature Recorder Temperature Recorder SJR Willow Creek Air Temperature Recorder Relative Humidity
Surface Water Elevation
Date Mean (°C) Minimum Maximum
Mean (°C) Minimum Maximum
Mean (°C) Minimum Maximum
D/S Dam 7 WC Bridge
Mean (°C) Minimum Maximum Mean Minimum Maximum (Feet)
6/1/13 14.2 13.3 15.1 16.9 16.1 17.7 17.0 16.2 18.0 44 5 27.0 17.7 36.9 32.2 16.2 50.1 1,399 6/2/13 14.5 13.5 15.3 17.1 16.4 17.9 17.2 16.5 18.2 44 5 29.0 21.2 37.6 24.9 13.9 41.5 1,399 6/3/13 14.5 13.6 15.3 17.3 16.7 18.1 17.5 16.8 18.4 44 5 27.2 18.4 34.8 33.8 23.4 58.6 1,400 6/4/13 14.5 13.7 15.2 17.6 17.0 18.3 17.8 17.1 18.6 44 5 26.1 19.2 33.8 41.9 26.2 59.5 1,401 6/5/13 14.6 13.7 15.5 17.7 17.0 18.5 17.9 17.2 18.8 44 4 26.6 18.3 34.9 42.8 25.6 66.6 1,400
6/6/13 14.8 13.9 15.7 17.9 17.1 18.6 18.0 17.3 19.0 44 4 27.7 18.6 36.7 41.4 24.1 63.5 1,400 6/7/13 15.0 14.1 15.8 18.2 17.4 19.0 18.3 17.6 19.3 44 4 29.9 20.1 40.1 37.6 22.2 57.8 1,400 6/8/13 15.4 14.2 16.9 18.5 17.8 19.4 18.7 18.0 19.6 44 9 32.0 20.6 42.3 36.3 20.0 59.8 1,400 6/9/13 16.3 15.3 17.0 18.6 18.0 19.2 18.8 18.2 19.3 44 10 30.1 23.1 37.4 39.0 22.5 61.5 1,400 6/10/13 15.9 15.3 16.7 18.7 18.3 19.1 18.8 18.5 19.2 44 10 23.3 17.8 28.1 49.9 34.7 65.4 1,400 6/11/13 15.5 14.6 16.3 18.3 17.6 19.0 18.4 17.7 19.2 44 8 25.8 17.7 34.9 38.8 19.0 59.2 1,400
6/12/13 15.5 14.5 16.4 18.2 17.4 19.0 18.2 17.5 19.1 44 8 26.9 19.4 34.7 28.8 12.6 42.5 1,400 6/13/13 15.3 14.5 16.0 17.9 17.2 18.6 18.0 17.3 18.7 44 9 23.4 14.9 31.5 27.2 12.6 45.3 1,400 6/14/13 15.2 14.2 16.0 17.7 16.9 18.4 17.8 17.1 18.5 44 9 23.9 14.7 32.5 29.4 17.1 47.3 1,400 6/15/13 15.3 14.3 16.1 17.6 16.8 18.4 17.6 16.9 18.5 44 9 25.5 16.8 33.9 25.0 12.3 43.2 1,400 6/16/13 15.2 14.3 16.1 17.7 16.9 18.5 17.7 17.0 18.6 44 9 25.6 17.9 33.4 26.0 16.5 42.4 1,398 6/17/13 15.2 14.4 16.0 17.8 17.0 18.5 17.8 17.1 18.7 43 7 24.2 15.5 33.3 32.5 14.8 56.3 1,399
6/18/13 15.1 14.2 15.8 17.7 16.9 18.4 17.7 17.1 18.6 43 7 22.2 15.4 29.4 34.1 17.8 47.8 1,399 6/19/13 14.9 14.0 15.6 17.3 16.6 18.1 17.4 16.7 18.2 43 8 19.6 10.7 28.1 38.5 20.5 62.4 1,399 6/20/13 14.8 13.9 15.7 17.1 16.3 17.8 17.1 16.4 17.9 43 8 21.5 12.2 30.3 32.5 17.4 51.3 1,399 6/21/13 15.0 14.1 16.0 17.2 16.4 18.1 17.2 16.5 18.2 43 8 23.8 15.8 31.8 29.4 16.7 44.8 1,399 6/22/13 15.2 14.2 16.1 17.5 16.6 18.4 17.5 16.7 18.4 43 5 25.5 17.0 33.9 28.8 15.8 43.9 1,398 6/23/13 14.7 14.2 15.4 17.5 17.1 17.9 17.5 17.2 17.9 43 7 23.7 17.3 29.3 34.6 21.6 52.2 1,399
6/24/13 14.4 14.0 14.9 16.8 16.5 17.3 16.8 16.5 17.3 43 8 21.2 16.9 26.1 52.6 43.8 69.1 1,400 6/25/13 15.2 14.0 16.5 17.0 16.2 18.1 17.0 16.1 18.2 44 8 25.4 18.4 33.1 48.3 30.5 71.6 1,401 6/26/13 16.0 14.9 17.2 17.9 16.9 19.0 17.9 17.0 19.1 44 8 28.0 20.6 35.3 41.8 28.4 59.2 1,401 6/27/13 16.3 15.3 17.3 18.9 18.1 19.9 19.0 18.2 20.1 43 8 29.6 22.0 37.7 40.4 25.0 58.0 1,400 6/28/13 16.5 15.6 17.2 19.5 18.7 20.3 19.6 18.9 20.5 44 5 31.4 22.8 39.5 37.8 23.0 56.6 1,400 6/29/13 16.4 15.4 17.5 19.9 19.1 20.8 20.0 19.3 21.0 43 6 33.3 24.8 41.4 32.7 18.0 50.5 1,400
6/30/13 16.7 15.8 17.6 19.9 19.2 20.7 20.0 19.4 20.8 43 6 34.4 26.3 42.6 29.2 16.7 45.3 1,400
Copyright 2013 by Southern California Edison Company B-10 Draft 2013

Draft NASMP and AMP – Big Creek No. 4 Hydroelectric Project, FERC No. 2017 2013 Data Collection Report
Table B-9. July 2013 Air Temperature and Relative Humidity, Water Temperatures (Daily Means are Rounded to Nearest 0.1°C) and Flows for the Horseshoe Bend Reach of the San Joaquin River and Willow Creek.
Redinger Lake at Dam 7 SJR Downstream of Dam 7 SJR Upstream of Willow Creek Willow Creek Willow Creek Bridge SJR Downstream of Willow Creek
Temperature Recorder Temperature Recorder Temperature Recorder Temperature Recorder Temperature Recorder Temperature Recorder
Date Mean (°C) Minimum Maximum
Mean (°C) Minimum Maximum
Mean (°C) Minimum Maximum
Mean (°C) Minimum Maximum
Mean (°C) Minimum Maximum
Mean (°C) Minimum Maximum
7/1/13 16.9 14.2 22.5 12.6 12.3 13.2 13.0 12.5 13.8 25.9 24.6 27.5 25.9 24.6 27.1 13.3 12.7 14.1 7/2/13 15.7 14.7 16.8 12.6 12.3 13.2 13.0 12.5 13.8 25.9 24.6 27.4 26.0 24.8 27.1 13.3 12.7 13.9 7/3/13 15.9 14.8 18.4 12.8 12.2 13.5 13.2 12.6 14.2 26.1 24.5 28.1 26.1 24.6 27.8 13.5 12.7 14.5 7/4/13 16.1 15.0 20.3 12.9 12.3 13.5 13.3 12.6 14.3 26.0 25.0 27.1 27.0 25.1 29.1 13.6 12.9 14.6 7/5/13 16.4 15.3 18.7 13.0 12.2 13.7 13.4 12.8 14.4 26.9 25.6 28.4 27.2 25.7 28.9 13.7 13.0 14.6 7/6/13 16.5 15.1 19.5 13.0 12.3 13.8 13.4 12.6 14.3 25.8 24.3 27.1 26.2 24.4 28.2 13.7 13.0 14.6
7/7/13 17.0 15.5 21.4 13.1 12.4 14.1 13.5 12.7 14.4 24.9 23.3 26.1 25.6 23.4 27.9 13.8 13.0 14.6 7/8/13 17.6 15.6 20.9 13.2 12.4 13.9 13.5 12.7 14.5 24.7 22.8 26.5 24.6 22.7 26.3 13.8 13.0 14.8 7/9/13 19.1 15.8 21.2 13.3 12.2 14.0 13.6 12.7 14.6 24.0 22.3 25.8 24.1 22.2 26.3 13.8 13.2 14.8 7/10/13 18.8 15.6 20.8 13.4 12.5 14.0 13.7 13.0 14.3 23.7 22.2 25.1 23.8 22.1 25.3 13.9 13.4 14.6 7/11/13 17.1 15.8 19.2 13.7 13.1 14.5 14.0 13.5 14.7 24.6 23.4 26.2 24.8 23.4 26.9 14.3 13.7 15.0 7/12/13 17.7 16.1 19.9 13.7 12.7 14.4 14.0 13.1 15.1 24.1 22.5 25.7 24.3 22.5 26.3 14.3 13.7 15.3
7/13/13 18.5 15.9 20.3 13.8 12.8 14.6 14.1 13.2 15.2 23.7 22.0 25.3 23.8 22.0 26.0 14.3 13.6 15.3 7/14/13 18.6 16.2 20.2 13.8 12.9 14.5 14.1 13.2 14.8 23.5 21.8 25.2 23.7 21.8 25.9 14.4 13.8 15.1 7/15/13 18.3 16.3 20.2 13.9 13.1 14.7 14.2 13.3 15.2 23.6 22.1 25.3 23.9 22.1 26.1 14.5 13.9 15.3 7/16/13 18.6 17.2 20.5 14.0 13.1 14.8 14.2 13.3 15.2 23.4 21.7 25.0 23.7 21.8 25.8 14.5 13.9 15.4 7/17/13 19.0 16.7 20.7 14.1 13.4 15.1 14.3 13.5 15.5 23.1 21.5 24.7 23.4 21.5 25.6 14.6 13.9 15.6 7/18/13 18.1 16.8 19.9 14.2 13.3 15.1 14.5 13.5 15.5 23.2 21.5 24.7 23.5 21.6 25.8 14.7 14.0 15.6
7/19/13 18.2 17.2 19.6 14.3 13.5 15.1 14.6 13.7 15.6 23.7 21.8 26.0 23.9 21.8 26.2 14.7 14.0 15.4 7/20/13 18.2 17.0 20.3 14.4 13.5 15.4 14.6 13.7 15.7 24.3 22.4 26.5 24.5 22.5 26.6 14.7 14.0 15.5 7/21/13 18.1 17.4 19.7 14.5 13.7 15.5 14.8 13.8 15.8 25.1 23.2 27.3 25.2 23.4 27.4 14.8 14.1 15.6 7/22/13 18.4 17.1 21.1 14.5 13.9 15.3 14.7 14.1 15.6 25.3 24.1 26.7 25.2 24.1 26.6 14.7 14.2 15.3 7/23/13 18.1 17.2 19.5 14.6 13.9 15.5 14.8 14.0 15.6 25.1 24.1 26.5 25.1 24.2 26.8 14.7 14.2 15.3 7/24/13 18.2 17.2 19.9 14.9 14.2 15.6 15.0 14.2 15.9 24.9 23.3 26.6 24.9 23.3 26.8 15.0 14.4 15.6
7/25/13 18.2 17.3 20.1 15.0 14.5 15.6 15.0 14.4 15.5 24.9 23.8 26.2 24.9 23.8 26.3 15.0 14.7 15.4 7/26/13 18.7 17.0 22.3 15.2 14.7 16.0 15.3 14.7 16.1 25.2 23.7 27.0 25.1 23.8 27.0 15.3 14.9 15.7 7/27/13 18.3 17.3 21.2 15.4 15.0 16.0 15.5 15.0 16.1 25.1 23.7 26.8 25.1 23.8 26.7 15.5 15.1 16.0 7/28/13 18.8 17.3 21.7 15.5 15.0 16.3 15.5 14.9 16.3 24.7 23.3 26.4 24.7 23.3 26.5 15.6 15.2 16.1 7/29/13 18.6 17.5 20.8 15.7 15.1 16.5 15.7 15.0 16.6 24.3 22.6 26.2 24.4 22.7 26.5 15.7 15.2 16.3 7/30/13 18.5 17.5 20.1 15.7 15.0 16.5 15.7 14.9 16.7 24.0 22.4 25.7 24.1 22.5 26.0 15.7 15.2 16.2
7/31/13 18.3 17.6 19.8 15.9 15.1 16.7 15.9 15.0 16.8 23.8 22.2 25.3 24.0 22.3 26.2 15.9 15.2 16.5
Copyright 2013 by Southern California Edison Company B-11 Draft 2013

Draft NASMP and AMP – Big Creek No. 4 Hydroelectric Project, FERC No. 2017 2013 Data Collection Report
Table B-9. July 2013 Air Temperature and Relative Humidity, Water Temperatures (Daily Means are Rounded to Nearest 0.1°C) and Flows for the Horseshoe Bend Reach of the San Joaquin River and Willow Creek (continued).
SJR Horseshoe Bend (East) SJR Horseshoe Bend (West) SJR Upstream of Powerhouse 4 Flows (cfs) Dam 7 Dam 7 Redinger Lake
Temperature Recorder Temperature Recorder Temperature Recorder SJR Willow Creek Air Temperature Recorder Relative Humidity
Surface Water Elevation
Date Mean (°C) Minimum Maximum
Mean (°C) Minimum Maximum
Mean (°C) Minimum Maximum
D/S Dam 7 WC Bridge
Mean (°C) Minimum Maximum Mean Minimum Maximum (Feet)
7/1/13 16.5 15.7 17.2 19.9 19.3 20.5 20.0 19.5 20.7 43 6 34.7 27.9 41.9 26.5 18.3 42.6 1,399 7/2/13 16.2 15.6 16.8 19.8 19.2 20.3 19.9 19.3 20.4 43 5 32.3 23.5 40.8 35.3 18.8 58.0 1,400 7/3/13 16.3 15.2 17.4 19.7 19.0 20.5 19.8 19.2 20.6 43 5 33.3 25.3 40.8 32.9 20.7 47.8 1,400 7/4/13 16.7 15.8 17.5 19.8 19.1 20.6 19.9 19.2 20.8 43 3 33.7 25.4 41.4 33.4 22.0 49.5 1,400 7/5/13 16.4 15.6 17.3 20.3 19.7 21.3 20.4 19.8 21.4 43 3 32.8 25.0 39.6 32.7 16.1 52.3 1,400
7/6/13 16.3 15.5 17.2 20.0 19.4 20.8 20.1 19.5 20.8 43 3 29.4 21.1 37.5 29.5 16.6 47.1 1,400 7/7/13 16.0 15.1 16.8 19.6 18.9 20.5 19.7 19.0 20.5 43 1 30.1 21.3 38.9 24.6 11.1 42.7 1,400 7/8/13 15.9 14.7 17.2 19.4 18.7 20.2 19.4 18.8 20.1 43 5 30.8 21.8 39.4 17.8 8.7 29.9 1,400 7/9/13 16.3 15.3 17.3 19.1 18.3 20.0 19.0 18.3 19.8 43 4 32.6 25.0 40.4 15.4 8.3 27.0 1,399 7/10/13 16.2 15.3 16.9 19.1 18.5 19.6 19.1 18.5 19.7 43 4 32.6 26.4 40.1 18.9 11.0 34.8 1,400 7/11/13 16.6 15.5 17.7 19.3 18.7 20.2 19.4 18.8 20.2 43 4 30.3 22.7 36.8 28.1 15.2 45.4 1,400
7/12/13 16.6 15.6 17.5 19.3 18.6 20.2 19.3 18.6 20.2 43 4 28.3 20.4 36.5 25.5 14.9 39.2 1,400 7/13/13 16.5 15.6 17.5 19.4 18.7 20.2 19.4 18.7 20.3 50 4 29.5 21.4 37.5 21.4 10.0 34.1 1,399 7/14/13 16.0 14.8 17.2 19.1 18.3 19.8 19.1 18.3 19.8 60 4 30.4 22.2 37.9 20.3 12.9 36.5 1,399 7/15/13 16.0 14.9 17.2 18.6 17.7 19.5 18.6 17.6 19.5 60 3 29.2 21.8 37.1 24.4 13.6 42.5 1,400 7/16/13 16.0 14.9 17.1 18.4 17.5 19.3 18.4 17.4 19.2 60 3 26.4 17.5 35.1 30.0 15.4 50.0 1,399 7/17/13 16.0 14.8 17.2 18.3 17.4 19.2 18.3 17.2 19.2 60 3 26.9 19.2 35.0 28.9 18.4 43.3 1,399
7/18/13 16.1 14.9 17.3 18.4 17.4 19.2 18.3 17.3 19.2 60 3 28.0 18.9 37.2 29.1 15.7 44.8 1,400 7/19/13 16.3 15.2 17.4 18.6 17.6 19.5 18.5 17.5 19.4 60 3 29.6 19.7 39.0 26.8 15.5 42.2 1,400 7/20/13 16.5 15.4 17.5 18.8 17.7 19.7 18.8 17.8 19.7 60 3 30.9 21.7 39.5 28.7 16.5 49.1 1,400 7/21/13 16.6 15.6 17.7 19.0 18.0 19.9 19.1 18.2 19.9 60 3 31.8 23.7 39.8 28.2 15.2 50.8 1,401 7/22/13 16.5 15.6 17.1 19.1 18.3 19.6 19.1 18.4 19.6 60 3 29.2 24.3 36.2 37.4 18.9 68.7 1,401 7/23/13 16.3 15.5 17.0 18.8 18.1 19.5 18.9 18.2 19.4 59 3 28.2 23.5 36.3 48.2 23.4 74.5 1,400
7/24/13 16.6 15.7 17.6 18.6 17.7 19.4 18.6 17.8 19.4 59 3 29.4 21.5 37.4 36.9 19.6 62.3 1,399 7/25/13 16.6 15.9 17.3 18.8 18.1 19.4 18.8 18.2 19.5 59 3 30.3 23.8 37.8 36.0 23.0 52.5 1,400 7/26/13 16.9 15.9 18.1 19.0 18.2 19.8 19.0 18.2 19.9 59 3 30.9 24.6 38.6 34.7 17.5 54.5 1,399 7/27/13 17.1 16.1 18.1 19.2 18.3 20.1 19.2 18.4 20.1 59 3 30.0 23.5 37.9 31.0 15.1 56.0 1,399 7/28/13 17.1 16.1 18.1 19.2 18.3 20.1 19.3 18.4 20.1 59 3 30.0 24.0 37.4 27.5 15.2 40.6 1,400 7/29/13 17.1 16.0 18.3 19.2 18.2 20.2 19.2 18.3 20.2 59 3 28.2 20.8 36.7 31.3 18.8 45.2 1,400
7/30/13 17.2 16.2 18.1 19.1 18.2 20.0 19.2 18.3 20.0 59 3 27.5 19.9 35.9 32.7 17.8 48.8 1,400 7/31/13 17.2 16.2 18.2 19.1 18.2 20.1 19.2 18.3 20.0 54 2 27.1 19.1 36.0 34.6 15.2 54.0 1,401
Copyright 2013 by Southern California Edison Company B-12 Draft 2013

Draft NASMP and AMP – Big Creek No. 4 Hydroelectric Project, FERC No. 2017 2013 Data Collection Report
Table B-10. August 2013 Air Temperature and Relative Humidity, Water Temperatures (Daily Means are Rounded to Nearest 0.1°C) and Flows for the Horseshoe Bend Reach of the San Joaquin River and Willow Creek.
Redinger Lake at Dam 7 SJR Downstream of Dam 7 SJR Upstream of Willow Creek Willow Creek Willow Creek Bridge SJR Downstream of Willow Creek
Temperature Recorder Temperature Recorder Temperature Recorder Temperature Recorder Temperature Recorder Temperature Recorder
Date Mean (°C) Minimum Maximum
Mean (°C) Minimum Maximum
Mean (°C) Minimum Maximum
Mean (°C) Minimum Maximum
Mean (°C) Minimum Maximum
Mean (°C) Minimum Maximum
8/1/13 18.8 17.6 20.4 16.2 15.3 17.3 16.1 15.1 17.2 23.4 21.7 24.8 23.6 21.8 25.8 16.0 15.4 16.6 8/2/13 19.3 17.9 21.0 16.2 15.5 17.1 16.0 15.2 16.9 22.3 20.6 23.7 22.6 20.7 24.6 16.0 15.4 16.5 8/3/13 19.7 18.3 20.7 16.3 15.7 17.4 16.2 15.5 17.2 22.2 20.4 23.7 22.4 20.4 24.6 16.1 15.6 16.6 8/4/13 19.9 18.5 20.5 16.4 15.7 17.5 16.3 15.6 17.2 22.3 20.4 23.8 22.5 20.5 24.4 16.2 15.7 16.7 8/5/13 19.5 18.3 20.6 16.4 15.8 17.3 16.3 15.6 17.1 22.5 20.9 23.6 22.9 21.0 24.8 16.3 15.8 16.7 8/6/13 19.8 18.4 20.5 16.5 15.8 17.4 16.4 15.7 17.1 22.7 21.1 23.8 23.1 21.2 24.8 16.4 15.9 16.8
8/7/13 19.9 18.5 20.8 16.6 15.7 17.6 16.4 15.6 17.5 22.5 20.9 23.6 22.9 21.1 24.4 16.4 15.8 16.9 8/8/13 20.2 18.6 21.1 16.6 15.7 17.6 16.4 15.4 17.5 22.2 20.6 23.4 22.7 20.9 24.3 16.4 15.7 16.9 8/9/13 20.2 18.7 21.1 16.7 15.8 17.8 16.5 15.7 17.5 22.1 20.4 23.3 22.5 20.7 24.1 16.4 15.8 17.1 8/10/13 20.3 18.7 21.2 16.8 15.8 18.0 16.5 15.6 17.4 22.0 20.4 23.2 22.5 20.7 24.0 16.5 15.9 17.1 8/11/13 20.7 19.7 21.1 16.8 15.9 18.0 16.5 15.7 17.4 22.1 20.4 23.2 22.5 20.8 24.2 16.5 15.9 17.0 8/12/13 20.7 19.9 21.1 16.9 16.0 18.2 16.6 15.7 17.7 22.3 20.6 23.5 22.8 21.0 24.5 16.6 16.0 17.2
8/13/13 20.7 19.6 21.2 16.9 15.8 18.1 16.7 15.6 17.7 22.4 20.7 23.6 23.1 21.2 24.8 16.6 16.0 17.2 8/14/13 20.7 19.5 21.3 16.9 15.7 18.1 16.7 15.6 17.8 22.6 20.9 23.7 23.2 21.3 24.9 16.6 16.0 17.2 8/15/13 20.8 19.6 21.3 17.0 16.0 18.3 16.7 15.7 17.9 22.4 20.6 23.5 23.1 21.2 24.8 16.6 16.0 17.3 8/16/13 20.9 19.6 21.4 17.0 15.9 18.2 16.8 15.6 17.8 22.5 20.9 23.7 23.2 21.4 24.8 16.6 16.1 17.3 8/17/13 20.8 20.0 21.3 17.1 16.0 18.1 17.0 15.8 18.0 23.0 21.6 24.1 23.5 21.8 25.0 16.8 16.2 17.4 8/18/13 20.9 20.0 21.7 20.0 16.7 20.5 20.0 16.8 20.6 23.2 22.0 24.1 23.8 22.2 25.3 19.9 16.8 20.6
8/19/13 21.3 20.4 22.2 20.0 17.0 20.9 20.4 18.6 21.0 24.1 22.8 25.3 24.8 23.0 26.7 20.6 19.4 21.2 8/20/13 21.4 20.5 21.9 17.1 16.3 18.3 17.6 16.7 18.5 24.7 23.3 25.7 25.3 23.5 26.7 17.7 16.8 19.4 8/21/13 21.5 20.6 22.1 17.1 16.2 18.2 17.3 16.4 18.2 24.8 23.7 25.6 25.1 24.0 26.1 17.2 16.6 17.7 8/22/13 21.2 20.2 21.9 17.3 16.3 18.3 17.4 16.4 18.6 23.5 21.9 24.8 24.2 22.5 25.7 17.2 16.5 18.0 8/23/13 21.3 20.3 22.1 17.4 16.4 18.6 17.6 16.5 18.6 23.0 21.3 24.1 23.7 22.0 25.6 17.5 16.7 18.6 8/24/13 21.4 20.4 22.0 17.5 16.6 18.7 17.6 16.7 18.7 22.8 21.1 23.9 23.4 21.3 25.5 17.7 16.8 18.5
8/25/13 21.4 20.6 22.0 17.7 16.9 18.9 17.8 17.0 18.8 22.7 21.0 23.8 23.2 21.2 25.4 17.8 17.1 18.6 8/26/13 21.5 20.4 21.9 17.9 16.9 18.9 18.0 17.2 18.9 22.4 20.6 23.6 22.9 21.1 24.7 18.0 17.3 18.7 8/27/13 21.5 20.7 22.1 18.0 16.5 19.2 18.1 16.8 19.0 22.6 21.1 23.8 23.1 21.3 24.7 18.2 17.3 18.9 8/28/13 21.5 20.6 22.4 18.3 17.4 19.1 18.4 17.7 19.3 23.5 22.0 24.8 23.9 22.0 25.7 18.5 17.8 19.2 8/29/13 21.7 20.7 22.6 18.4 17.4 19.5 18.5 17.6 19.4 23.7 22.0 24.9 24.1 22.3 25.8 18.6 17.8 19.3 8/30/13 22.0 21.1 22.6 18.5 17.9 19.4 18.6 17.9 19.4 23.5 21.9 24.7 24.0 22.0 25.8 18.7 18.0 19.3
8/31/13 22.2 21.2 22.9 18.4 17.7 19.2 18.4 17.9 19.1 23.1 22.0 24.2 23.3 22.0 24.4 18.5 18.1 19.0
Copyright 2013 by Southern California Edison Company B-13 Draft 2013

Draft NASMP and AMP – Big Creek No. 4 Hydroelectric Project, FERC No. 2017 2013 Data Collection Report
Table B-10. August 2013 Air Temperature and Relative Humidity, Water Temperatures (Daily Means are Rounded to Nearest 0.1°C) and Flows for the Horseshoe Bend Reach of the San Joaquin River and Willow Creek (continued).
SJR Horseshoe Bend (East) SJR Horseshoe Bend (West) SJR Upstream of Powerhouse 4 Flows (cfs) Dam 7 Dam 7 Redinger Lake
Temperature Recorder Temperature Recorder Temperature Recorder SJR Willow Creek Air Temperature Recorder Relative Humidity
Surface Water Elevation
Date Mean (°C) Minimum Maximum
Mean (°C) Minimum Maximum
Mean (°C) Minimum Maximum
D/S Dam 7 WC Bridge
Mean (°C) Minimum Maximum Mean Minimum Maximum (Feet)
8/1/13 17.6 16.7 18.6 19.2 18.3 20.2 19.2 18.4 20.2 43 2 25.9 18.9 35.0 27.5 11.1 43.8 1,400
8/2/13 17.4 16.7 18.1 19.3 18.5 20.2 19.3 18.6 20.2 43 1 24.7 16.8 33.8 26.7 16.3 41.0 1,400 8/3/13 17.5 16.6 18.3 19.3 18.6 20.3 19.4 18.7 20.3 43 1 26.5 19.2 35.1 26.2 14.7 40.9 1,400 8/4/13 17.7 16.8 18.6 19.4 18.6 20.4 19.4 18.7 20.4 43 1 27.7 20.5 35.9 24.4 14.9 40.7 1,399 8/5/13 17.9 17.0 18.8 19.7 18.9 20.7 19.7 19.0 20.7 43 1 27.1 19.5 36.0 27.5 16.6 43.0 1,399 8/6/13 17.9 16.9 18.7 19.8 19.1 20.8 19.9 19.2 20.8 43 1 26.4 19.3 34.8 29.4 18.0 46.0 1,398 8/7/13 17.9 16.9 18.7 19.9 19.2 20.8 19.9 19.3 20.8 43 1 24.0 16.3 31.8 36.5 21.6 50.4 1,399
8/8/13 17.8 17.0 18.6 19.8 19.1 20.8 19.8 19.2 20.7 43 1 23.5 15.7 31.5 36.9 22.7 54.8 1,399 8/9/13 17.8 16.9 18.6 19.7 18.9 20.7 19.7 19.0 20.7 43 1 24.6 16.8 32.2 32.3 20.8 47.4 1,399 8/10/13 17.9 17.1 18.7 19.7 18.9 20.7 19.7 19.0 20.6 43 1 25.2 18.8 32.7 31.0 18.5 45.1 1,400 8/11/13 18.0 17.1 18.8 19.7 19.0 20.7 19.8 19.0 20.7 43 1 26.0 18.9 34.1 30.1 19.7 45.8 1,400 8/12/13 18.0 17.1 18.9 19.9 19.1 20.9 19.9 19.2 20.9 44 1 27.0 19.4 35.6 29.1 16.6 42.9 1,400 8/13/13 18.2 17.3 19.1 20.0 19.2 21.1 20.1 19.3 21.1 43 1 28.5 20.7 37.3 25.5 14.0 41.2 1,400
8/14/13 18.2 17.3 19.1 20.1 19.3 21.2 20.2 19.4 21.2 43 1 29.5 22.1 38.0 20.0 11.0 31.3 1,401 8/15/13 18.2 17.3 19.0 20.1 19.3 21.2 20.2 19.4 21.1 43 1 29.1 20.7 38.7 18.2 10.1 35.7 1,400 8/16/13 18.2 17.4 19.0 20.1 19.3 21.2 20.2 19.4 21.1 43 1 30.1 22.8 38.5 19.7 13.0 37.4 1,400 8/17/13 18.4 17.6 19.3 20.3 19.5 21.2 20.3 19.6 21.2 43 1 29.4 21.6 37.8 25.9 14.1 47.7 1,400 8/18/13 19.9 17.3 20.9 20.4 18.1 21.4 20.4 18.1 21.4 1,279 1 29.8 20.9 39.7 30.1 14.8 52.6 1,400 8/19/13 21.0 20.5 21.7 21.3 20.3 22.2 21.2 20.3 22.2 887 1 31.3 23.3 41.3 31.6 16.1 57.2 1,399
8/20/13 20.7 19.9 21.2 22.3 21.4 23.4 22.3 21.5 23.3 43 1 32.2 26.2 38.6 29.8 19.5 40.9 1,399 8/21/13 19.2 18.7 19.9 22.7 22.1 23.6 22.7 22.2 23.4 43 1 28.8 21.6 38.6 31.9 9.9 55.7 1,400 8/22/13 18.7 17.8 19.4 21.8 21.1 22.5 22.0 21.3 22.7 43 1 27.4 18.5 36.7 27.5 14.4 51.0 1,400 8/23/13 18.8 17.9 19.4 20.7 19.9 21.6 20.8 20.1 21.5 43 1 26.6 19.2 35.1 27.1 18.0 45.8 1,400 8/24/13 18.8 18.0 19.6 20.5 19.7 21.4 20.5 19.8 21.3 43 1 26.2 17.9 35.1 30.7 16.3 46.3 1,400 8/25/13 18.9 18.0 19.7 20.4 19.7 21.4 20.4 19.7 21.2 43 1 26.1 19.3 34.1 31.9 19.0 48.6 1,400
8/26/13 19.0 18.1 19.9 20.5 19.7 21.4 20.5 19.8 21.3 43 1 26.6 19.2 34.7 30.8 18.2 53.2 1,400 8/27/13 19.3 18.4 20.3 20.7 19.9 21.5 20.7 20.0 21.5 42 1 27.6 19.7 35.7 32.3 22.1 46.9 1,399 8/28/13 19.8 18.9 20.6 21.2 20.4 22.2 21.2 20.5 22.0 43 1 28.4 21.5 36.3 38.1 22.5 54.6 1,399 8/29/13 19.8 18.9 20.6 21.5 20.7 22.4 21.5 20.8 22.3 43 1 28.9 22.0 37.3 33.7 21.2 52.0 1,399 8/30/13 19.9 19.0 20.6 21.6 20.8 22.4 21.6 20.9 22.3 43 1 28.2 19.9 37.0 34.7 21.1 48.6 1,399 8/31/13 19.5 19.1 20.2 21.3 20.9 21.8 21.3 21.0 21.7 49 1 27.4 20.4 36.4 35.8 20.8 53.7 1,399
Copyright 2013 by Southern California Edison Company B-14 Draft 2013

Draft NASMP and AMP – Big Creek No. 4 Hydroelectric Project, FERC No. 2017 2013 Data Collection Report
Table B-11. September 2013 Air Temperature and Relative Humidity, Water Temperatures (Daily Mean Temperatures Rounded to Nearest 0.1°C) and Flows for the Horseshoe Bend Reach of the San Joaquin River and Willow Creek.
Redinger Lake at Dam 71 SJR Downstream of Dam 7 SJR Upstream of Willow Creek Willow Creek Willow Creek Bridge SJR Downstream of Willow Creek
Temperature Recorder Temperature Recorder Temperature Recorder Temperature Recorder Temperature Recorder Temperature Recorder
Date Mean (°C) Minimum Maximum
Mean (°C) Minimum Maximum
Mean (°C) Minimum Maximum
Mean (°C) Minimum Maximum
Mean (°C) Minimum Maximum
Mean (°C) Minimum Maximum
9/1/13 21.8 20.9 22.8 18.4 17.8 18.9 18.5 17.9 19.3 23.1 21.7 24.3 23.3 21.6 25.0 18.6 18.0 19.4 9/2/13 22.1 21.2 23.1 18.7 18.0 19.6 18.8 18.2 19.6 23.7 22.2 25.0 24.0 22.2 25.9 18.9 18.3 19.7 9/3/13 22.3 21.4 23.4 18.6 18.0 19.8 18.8 18.1 19.6 24.2 23.1 25.2 24.3 23.0 25.7 18.9 18.2 19.6 9/4/13 22.2 21.1 23.6 18.8 18.2 19.7 18.9 18.2 19.9 24.0 22.4 25.2 24.3 22.5 26.1 19.0 18.3 19.9 9/5/13 22.3 21.1 23.7 18.9 18.2 20.0 19.0 18.3 20.0 23.8 22.2 24.9 24.1 22.3 25.9 19.1 18.4 20.0 9/6/13 22.5 21.0 23.6 19.1 18.3 20.0 19.1 18.3 20.1 23.3 21.7 24.5 23.7 21.8 25.5 19.2 18.4 20.1
9/7/13 22.0 20.8 23.4 19.1 18.4 20.0 19.1 18.4 20.1 22.8 21.2 24.0 23.3 21.3 25.2 19.2 18.5 20.1 9/8/13 22.5 20.8 23.5 21.2 18.6 22.3 21.1 18.6 22.3 22.4 20.8 23.4 22.9 21.0 24.7 21.0 18.7 22.2 9/9/13 22.1 20.5 22.8 20.8 19.0 21.8 21.0 19.3 21.8 22.6 21.2 23.6 22.8 21.2 24.3 21.2 19.8 21.8 9/10/13 21.7 20.6 22.4 19.1 18.5 19.6 19.2 18.6 19.8 22.1 20.5 23.1 22.4 20.5 24.1 19.3 18.7 19.8 9/11/13 21.9 20.8 22.5 19.1 18.5 19.8 19.2 18.6 19.8 22.0 20.7 22.9 22.1 20.6 23.5 19.3 18.7 19.8 9/12/13 21.9 20.8 22.3 19.2 18.6 20.1 19.3 18.6 20.2 21.9 20.4 23.0 22.1 20.3 23.7 19.3 18.7 20.2
9/13/13 22.1 21.0 22.6 19.2 18.7 20.0 19.3 18.7 20.2 21.9 20.4 23.1 22.2 20.4 24.0 19.4 18.8 20.1 9/14/13 22.4 21.3 23.0 19.3 18.8 20.2 19.4 18.8 20.3 22.2 20.8 23.3 22.6 20.7 24.4 19.5 18.9 20.3 9/15/13 22.5 21.1 23.4 19.4 18.9 20.2 19.4 18.9 20.4 22.5 21.1 23.6 22.8 21.1 24.6 19.5 18.9 20.3 9/16/13 22.3 20.1 23.8 19.3 18.8 20.2 19.4 18.8 20.4 21.9 20.2 22.9 22.2 20.3 23.9 19.4 18.9 20.3 9/17/13 21.7 20.4 23.3 19.4 19.0 20.2 19.4 19.0 20.5 21.5 20.0 22.6 21.7 20.1 23.2 19.5 18.9 20.3 9/18/13 21.6 20.9 22.4 19.3 18.8 20.3 19.3 18.8 20.5 20.2 18.5 21.4 20.5 18.7 22.0 19.3 18.7 20.2
9/19/13 21.8 21.4 23.7 19.3 18.7 20.2 19.3 18.7 20.3 19.8 18.2 21.0 20.2 18.4 22.1 19.3 18.7 20.1 9/20/13 21.2 20.1 22.1 19.2 18.7 20.0 19.2 18.7 19.9 19.6 18.1 20.6 20.0 18.2 21.6 19.2 18.7 19.9 9/21/13 20.4 19.6 21.6 19.0 18.7 19.5 18.9 18.7 19.5 19.0 17.9 20.3 19.1 17.8 20.0 19.0 18.6 19.7 9/22/13 20.2 19.9 20.3 18.9 18.5 19.3 18.9 18.5 19.5 18.0 16.5 19.0 18.3 16.7 19.9 19.0 18.6 19.6 9/23/13 20.2 19.9 20.4 18.8 18.5 19.3 18.9 18.5 19.5 17.8 16.5 18.8 18.3 16.6 20.1 18.9 18.4 19.7 9/24/13 20.1 19.7 20.3 18.7 18.4 19.2 18.7 18.4 19.4 17.8 16.4 18.7 18.3 16.5 20.2 18.8 18.3 19.6
9/25/13 19.9 19.3 20.2 18.5 18.4 18.9 18.6 18.3 19.1 18.1 16.9 19.0 18.2 17.1 19.6 18.7 18.2 19.4 9/26/13 19.5 19.1 19.7 18.3 18.0 18.7 18.3 18.0 18.7 16.7 15.3 18.0 17.0 15.5 18.4 18.4 18.0 18.9 9/27/13 19.0 18.7 19.4 18.1 17.8 18.4 18.1 17.7 18.8 16.1 14.8 17.3 16.1 14.8 17.5 18.1 17.7 18.9 9/28/13 18.6 18.0 18.7 18.0 17.8 18.4 18.1 17.7 18.7 15.5 14.3 16.6 15.8 14.3 17.7 18.1 17.5 18.9 9/29/13 - - - 17.9 17.6 18.3 18.0 17.5 18.7 15.7 14.6 16.8 16.0 14.6 17.7 18.0 17.4 18.8 9/30/13 - - - 17.9 17.3 18.6 17.9 17.3 19.0 15.9 14.8 17.0 16.3 14.8 18.0 18.0 17.4 19.1
Copyright 2013 by Southern California Edison Company B-15 Draft 2013
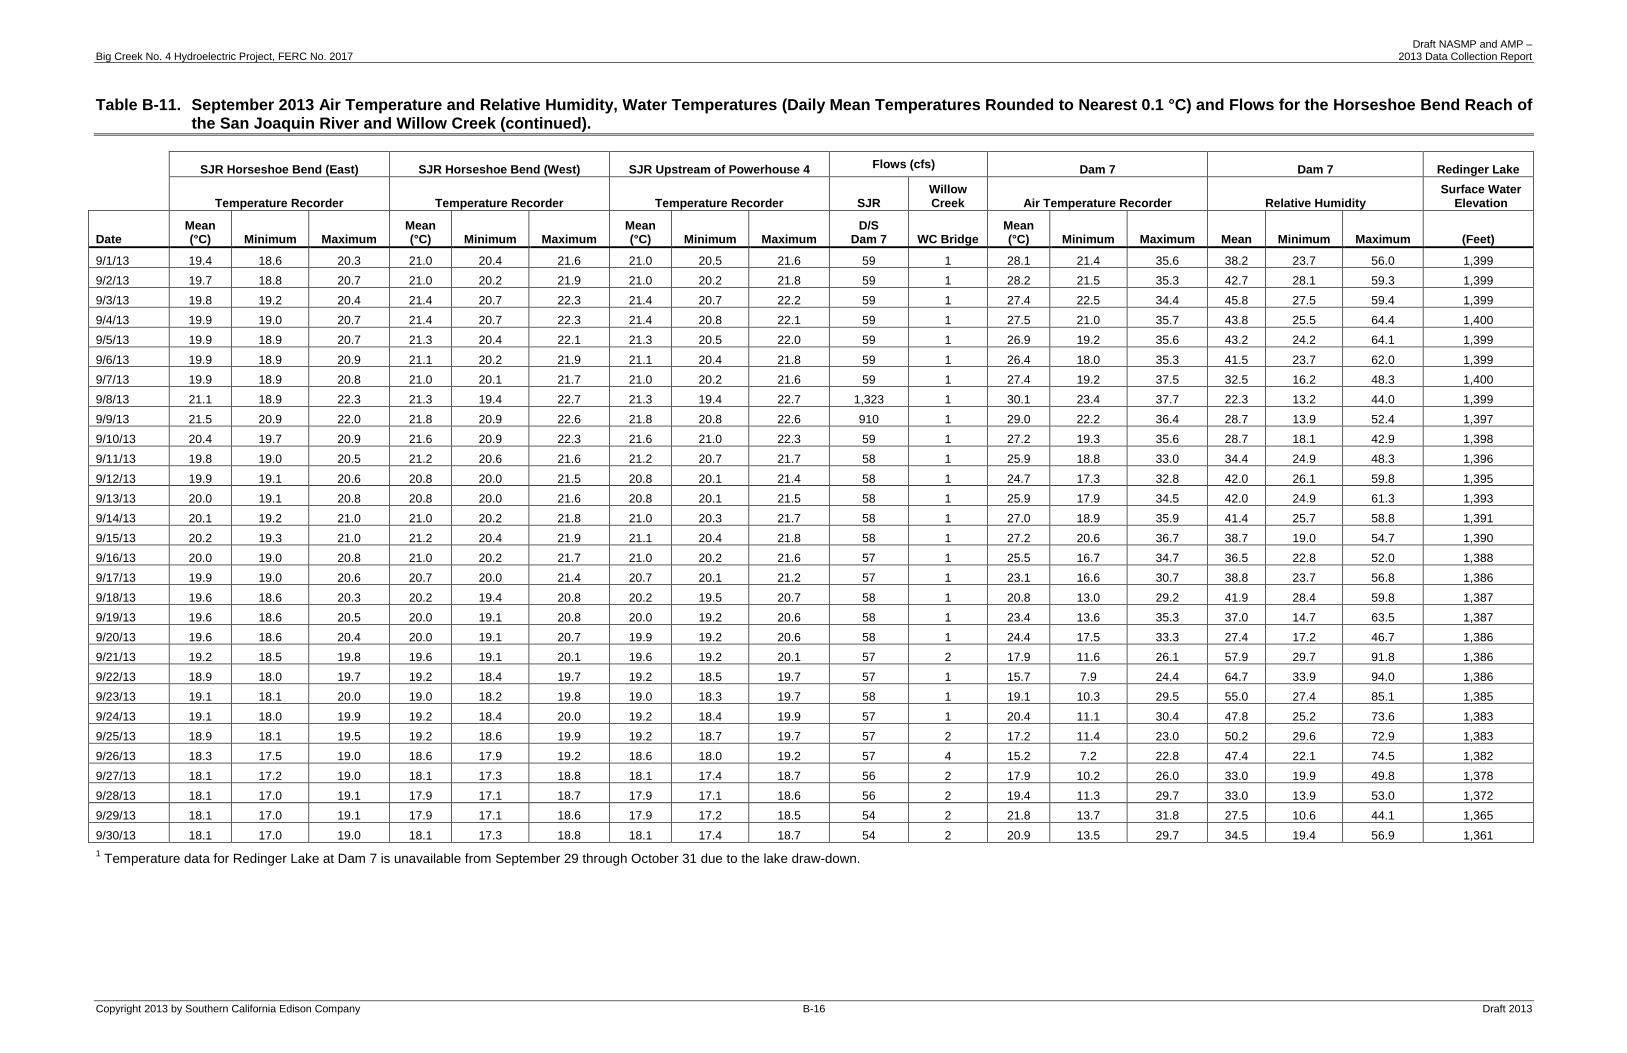
Draft NASMP and AMP – Big Creek No. 4 Hydroelectric Project, FERC No. 2017 2013 Data Collection Report
Table B-11. September 2013 Air Temperature and Relative Humidity, Water Temperatures (Daily Mean Temperatures Rounded to Nearest 0.1 °C) and Flows for the Horseshoe Bend Reach of the San Joaquin River and Willow Creek (continued).
SJR Horseshoe Bend (East) SJR Horseshoe Bend (West) SJR Upstream of Powerhouse 4 Flows (cfs) Dam 7 Dam 7 Redinger Lake
Temperature Recorder Temperature Recorder Temperature Recorder SJR Willow Creek Air Temperature Recorder Relative Humidity
Surface Water Elevation
Date Mean (°C) Minimum Maximum
Mean (°C) Minimum Maximum
Mean (°C) Minimum Maximum
D/S Dam 7 WC Bridge
Mean (°C) Minimum Maximum Mean Minimum Maximum (Feet)
9/1/13 19.4 18.6 20.3 21.0 20.4 21.6 21.0 20.5 21.6 59 1 28.1 21.4 35.6 38.2 23.7 56.0 1,399 9/2/13 19.7 18.8 20.7 21.0 20.2 21.9 21.0 20.2 21.8 59 1 28.2 21.5 35.3 42.7 28.1 59.3 1,399 9/3/13 19.8 19.2 20.4 21.4 20.7 22.3 21.4 20.7 22.2 59 1 27.4 22.5 34.4 45.8 27.5 59.4 1,399 9/4/13 19.9 19.0 20.7 21.4 20.7 22.3 21.4 20.8 22.1 59 1 27.5 21.0 35.7 43.8 25.5 64.4 1,400 9/5/13 19.9 18.9 20.7 21.3 20.4 22.1 21.3 20.5 22.0 59 1 26.9 19.2 35.6 43.2 24.2 64.1 1,399
9/6/13 19.9 18.9 20.9 21.1 20.2 21.9 21.1 20.4 21.8 59 1 26.4 18.0 35.3 41.5 23.7 62.0 1,399 9/7/13 19.9 18.9 20.8 21.0 20.1 21.7 21.0 20.2 21.6 59 1 27.4 19.2 37.5 32.5 16.2 48.3 1,400 9/8/13 21.1 18.9 22.3 21.3 19.4 22.7 21.3 19.4 22.7 1,323 1 30.1 23.4 37.7 22.3 13.2 44.0 1,399 9/9/13 21.5 20.9 22.0 21.8 20.9 22.6 21.8 20.8 22.6 910 1 29.0 22.2 36.4 28.7 13.9 52.4 1,397 9/10/13 20.4 19.7 20.9 21.6 20.9 22.3 21.6 21.0 22.3 59 1 27.2 19.3 35.6 28.7 18.1 42.9 1,398 9/11/13 19.8 19.0 20.5 21.2 20.6 21.6 21.2 20.7 21.7 58 1 25.9 18.8 33.0 34.4 24.9 48.3 1,396
9/12/13 19.9 19.1 20.6 20.8 20.0 21.5 20.8 20.1 21.4 58 1 24.7 17.3 32.8 42.0 26.1 59.8 1,395 9/13/13 20.0 19.1 20.8 20.8 20.0 21.6 20.8 20.1 21.5 58 1 25.9 17.9 34.5 42.0 24.9 61.3 1,393 9/14/13 20.1 19.2 21.0 21.0 20.2 21.8 21.0 20.3 21.7 58 1 27.0 18.9 35.9 41.4 25.7 58.8 1,391 9/15/13 20.2 19.3 21.0 21.2 20.4 21.9 21.1 20.4 21.8 58 1 27.2 20.6 36.7 38.7 19.0 54.7 1,390 9/16/13 20.0 19.0 20.8 21.0 20.2 21.7 21.0 20.2 21.6 57 1 25.5 16.7 34.7 36.5 22.8 52.0 1,388 9/17/13 19.9 19.0 20.6 20.7 20.0 21.4 20.7 20.1 21.2 57 1 23.1 16.6 30.7 38.8 23.7 56.8 1,386
9/18/13 19.6 18.6 20.3 20.2 19.4 20.8 20.2 19.5 20.7 58 1 20.8 13.0 29.2 41.9 28.4 59.8 1,387 9/19/13 19.6 18.6 20.5 20.0 19.1 20.8 20.0 19.2 20.6 58 1 23.4 13.6 35.3 37.0 14.7 63.5 1,387 9/20/13 19.6 18.6 20.4 20.0 19.1 20.7 19.9 19.2 20.6 58 1 24.4 17.5 33.3 27.4 17.2 46.7 1,386 9/21/13 19.2 18.5 19.8 19.6 19.1 20.1 19.6 19.2 20.1 57 2 17.9 11.6 26.1 57.9 29.7 91.8 1,386 9/22/13 18.9 18.0 19.7 19.2 18.4 19.7 19.2 18.5 19.7 57 1 15.7 7.9 24.4 64.7 33.9 94.0 1,386 9/23/13 19.1 18.1 20.0 19.0 18.2 19.8 19.0 18.3 19.7 58 1 19.1 10.3 29.5 55.0 27.4 85.1 1,385
9/24/13 19.1 18.0 19.9 19.2 18.4 20.0 19.2 18.4 19.9 57 1 20.4 11.1 30.4 47.8 25.2 73.6 1,383 9/25/13 18.9 18.1 19.5 19.2 18.6 19.9 19.2 18.7 19.7 57 2 17.2 11.4 23.0 50.2 29.6 72.9 1,383 9/26/13 18.3 17.5 19.0 18.6 17.9 19.2 18.6 18.0 19.2 57 4 15.2 7.2 22.8 47.4 22.1 74.5 1,382 9/27/13 18.1 17.2 19.0 18.1 17.3 18.8 18.1 17.4 18.7 56 2 17.9 10.2 26.0 33.0 19.9 49.8 1,378 9/28/13 18.1 17.0 19.1 17.9 17.1 18.7 17.9 17.1 18.6 56 2 19.4 11.3 29.7 33.0 13.9 53.0 1,372 9/29/13 18.1 17.0 19.1 17.9 17.1 18.6 17.9 17.2 18.5 54 2 21.8 13.7 31.8 27.5 10.6 44.1 1,365
9/30/13 18.1 17.0 19.0 18.1 17.3 18.8 18.1 17.4 18.7 54 2 20.9 13.5 29.7 34.5 19.4 56.9 1,361 1 Temperature data for Redinger Lake at Dam 7 is unavailable from September 29 through October 31 due to the lake draw-down.
Copyright 2013 by Southern California Edison Company B-16 Draft 2013

Draft NASMP and AMP – Big Creek No. 4 Hydroelectric Project, FERC No. 2017 2013 Data Collection Report
Table B-12. October 2012 Air Temperature and Relative Humidity, Water Temperatures (Daily Means are Rounded to Nearest 0.1°C) and Flows for the Horseshoe Bend Reach of the San Joaquin River and Willow Creek.
Redinger Lake at Dam 71 SJR Downstream of Dam 7 SJR Upstream of Willow Creek Willow Creek Willow Creek Bridge SJR Downstream of Willow Creek
Temperature Recorder Temperature Recorder Temperature Recorder Temperature Recorder Temperature Recorder Temperature Recorder
Date Mean (°C) Minimum Maximum
Mean (°C) Minimum Maximum
Mean (°C) Minimum Maximum
Mean (°C) Minimum Maximum
Mean (°C) Minimum Maximum
Mean (°C) Minimum Maximum
10/1/13 - - - 17.7 17.4 18.2 17.8 17.3 18.6 16.2 15.2 17.2 16.6 15.2 18.3 17.9 17.2 18.7 10/2/13 - - - 17.7 17.4 18.1 17.8 17.4 18.2 16.6 15.5 17.4 17.0 15.6 18.7 17.9 17.4 18.5 10/3/13 - - - 17.6 17.2 18.1 17.7 17.2 18.3 16.1 14.9 17.1 16.3 15.1 17.7 17.7 17.2 18.5 10/4/13 - - - 17.5 17.2 17.9 17.5 17.1 18.2 14.9 13.5 16.2 15.1 13.7 16.7 17.5 17.0 18.3
10/5/13 - - - 17.5 16.8 18.2 17.6 16.8 18.5 14.7 13.5 16.0 14.8 13.5 16.3 17.6 16.9 18.6 10/6/13 - - - 17.3 16.8 18.1 17.3 16.7 18.3 14.5 13.3 15.8 14.6 13.3 16.3 17.3 16.5 18.4 10/7/13 - - - 17.2 16.7 18.2 17.3 16.6 18.4 14.8 13.8 16.0 14.8 13.7 16.3 17.3 16.7 18.5 10/8/13 - - - 17.1 16.5 18.2 17.2 16.5 18.3 14.5 13.4 15.8 14.5 13.4 15.9 17.1 16.4 18.2 10/9/13 - - - 16.9 16.6 17.4 16.9 16.5 17.3 14.1 13.8 14.7 14.0 13.7 14.4 16.7 16.3 17.2 10/10/13 - - - 16.8 16.4 17.4 16.9 16.3 17.6 14.0 12.9 15.3 13.9 12.9 15.2 16.8 16.2 17.7
10/11/13 - - - 16.6 16.1 17.3 16.6 16.0 17.6 13.9 12.8 15.5 13.8 12.8 15.3 16.6 16.0 17.6 10/12/13 - - - 16.4 16.0 17.1 16.5 16.0 17.4 14.0 12.8 15.5 13.9 12.9 15.3 16.4 15.8 17.4 10/13/13 - - - 16.3 16.0 17.0 16.4 16.0 17.2 13.9 12.9 15.3 13.8 12.9 15.2 16.3 15.7 17.3 10/14/13 - - - 16.3 15.8 17.3 16.4 15.8 17.4 13.7 12.6 15.1 13.6 12.6 15.0 16.3 15.7 17.4 10/15/13 - - - 16.2 15.8 17.2 16.3 15.7 17.3 13.7 12.7 15.1 13.6 12.6 15.1 16.2 15.5 17.3 10/16/13 - - - 16.2 15.6 17.1 16.2 15.6 17.2 13.6 12.6 14.8 13.6 12.5 15.0 16.1 15.5 17.2
10/17/13 - - - 16.0 15.5 16.9 16.1 15.5 17.0 13.4 12.5 14.6 13.4 12.4 14.9 16.0 15.3 17.0 10/18/13 - - - 15.9 15.3 16.7 15.9 15.3 16.8 13.3 12.2 15.0 13.2 12.2 14.5 15.8 15.2 16.8 10/19/13 - - - 15.9 15.3 16.9 16.0 15.3 17.0 13.3 12.3 14.7 13.2 12.2 14.6 15.9 15.0 17.0 10/20/13 - - - 15.8 15.2 16.6 15.9 15.2 16.7 13.0 12.0 14.1 13.0 12.0 14.5 15.8 15.0 16.8 10/21/13 - - - 15.6 15.2 16.4 15.7 15.2 16.5 12.8 11.8 13.9 13.0 11.8 14.5 15.6 14.9 16.5 10/22/13 - - - 15.9 15.3 16.6 15.9 15.2 16.7 12.9 12.1 14.1 13.0 12.0 14.5 15.8 15.1 16.8
10/23/13 - - - 15.8 15.3 16.3 15.8 15.3 16.3 12.9 12.2 13.8 12.9 12.2 14.0 15.7 15.1 16.4 10/24/13 - - - 15.6 15.3 16.2 15.7 15.3 16.2 12.9 12.0 14.0 13.0 12.0 14.4 15.6 15.0 16.2 10/25/13 - - - 15.6 15.3 16.1 15.6 15.3 16.1 13.0 12.1 14.2 13.2 12.2 14.6 15.6 15.0 16.2 10/26/13 - - - 15.6 15.3 16.0 15.6 15.2 16.2 12.9 12.0 14.1 13.1 12.0 14.5 15.5 15.0 16.2 10/27/13 - - - 15.5 15.3 16.0 15.5 15.2 16.1 12.8 11.9 13.9 13.0 12.0 14.2 15.5 15.0 16.1 10/28/13 - - - 15.6 15.3 15.9 15.5 15.2 15.9 12.8 12.2 13.4 12.8 12.1 13.3 15.3 15.1 15.9
10/29/13 - - - 15.4 15.2 15.7 15.4 15.1 15.7 11.7 11.0 12.6 11.6 11.0 12.2 15.2 14.8 15.7 10/30/13 - - - 15.3 15.0 15.7 15.2 14.9 15.6 11.1 10.4 12.1 11.0 10.4 11.6 14.9 14.4 15.5 10/31/13 - - - 15.1 14.8 15.4 15.1 14.7 15.4 10.9 10.1 12.1 10.7 10.0 11.6 14.8 14.2 15.4
Copyright 2013 by Southern California Edison Company B-17 Draft 2013
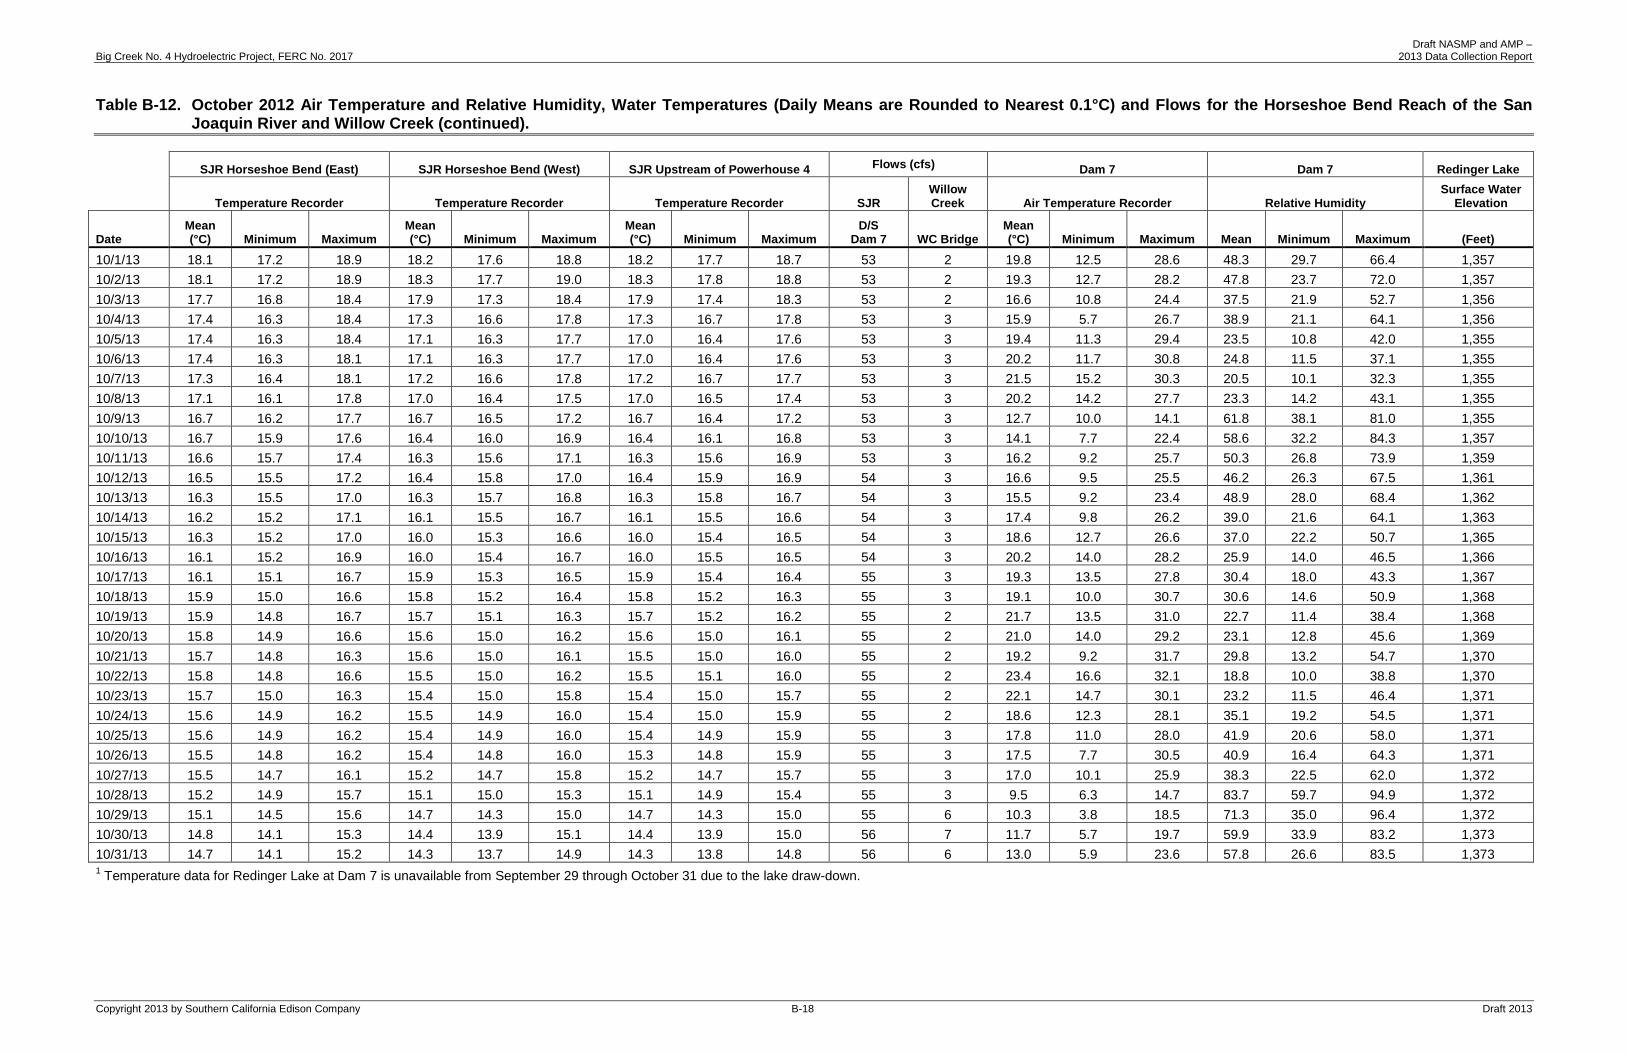
Draft NASMP and AMP – Big Creek No. 4 Hydroelectric Project, FERC No. 2017 2013 Data Collection Report
Table B-12. October 2012 Air Temperature and Relative Humidity, Water Temperatures (Daily Means are Rounded to Nearest 0.1°C) and Flows for the Horseshoe Bend Reach of the San Joaquin River and Willow Creek (continued).
SJR Horseshoe Bend (East) SJR Horseshoe Bend (West) SJR Upstream of Powerhouse 4 Flows (cfs) Dam 7 Dam 7 Redinger Lake
Temperature Recorder Temperature Recorder Temperature Recorder SJR Willow Creek Air Temperature Recorder Relative Humidity
Surface Water Elevation
Date Mean (°C) Minimum Maximum
Mean (°C) Minimum Maximum
Mean (°C) Minimum Maximum
D/S Dam 7 WC Bridge
Mean (°C) Minimum Maximum Mean Minimum Maximum (Feet)
10/1/13 18.1 17.2 18.9 18.2 17.6 18.8 18.2 17.7 18.7 53 2 19.8 12.5 28.6 48.3 29.7 66.4 1,357 10/2/13 18.1 17.2 18.9 18.3 17.7 19.0 18.3 17.8 18.8 53 2 19.3 12.7 28.2 47.8 23.7 72.0 1,357 10/3/13 17.7 16.8 18.4 17.9 17.3 18.4 17.9 17.4 18.3 53 2 16.6 10.8 24.4 37.5 21.9 52.7 1,356 10/4/13 17.4 16.3 18.4 17.3 16.6 17.8 17.3 16.7 17.8 53 3 15.9 5.7 26.7 38.9 21.1 64.1 1,356 10/5/13 17.4 16.3 18.4 17.1 16.3 17.7 17.0 16.4 17.6 53 3 19.4 11.3 29.4 23.5 10.8 42.0 1,355 10/6/13 17.4 16.3 18.1 17.1 16.3 17.7 17.0 16.4 17.6 53 3 20.2 11.7 30.8 24.8 11.5 37.1 1,355 10/7/13 17.3 16.4 18.1 17.2 16.6 17.8 17.2 16.7 17.7 53 3 21.5 15.2 30.3 20.5 10.1 32.3 1,355 10/8/13 17.1 16.1 17.8 17.0 16.4 17.5 17.0 16.5 17.4 53 3 20.2 14.2 27.7 23.3 14.2 43.1 1,355 10/9/13 16.7 16.2 17.7 16.7 16.5 17.2 16.7 16.4 17.2 53 3 12.7 10.0 14.1 61.8 38.1 81.0 1,355 10/10/13 16.7 15.9 17.6 16.4 16.0 16.9 16.4 16.1 16.8 53 3 14.1 7.7 22.4 58.6 32.2 84.3 1,357 10/11/13 16.6 15.7 17.4 16.3 15.6 17.1 16.3 15.6 16.9 53 3 16.2 9.2 25.7 50.3 26.8 73.9 1,359 10/12/13 16.5 15.5 17.2 16.4 15.8 17.0 16.4 15.9 16.9 54 3 16.6 9.5 25.5 46.2 26.3 67.5 1,361 10/13/13 16.3 15.5 17.0 16.3 15.7 16.8 16.3 15.8 16.7 54 3 15.5 9.2 23.4 48.9 28.0 68.4 1,362 10/14/13 16.2 15.2 17.1 16.1 15.5 16.7 16.1 15.5 16.6 54 3 17.4 9.8 26.2 39.0 21.6 64.1 1,363 10/15/13 16.3 15.2 17.0 16.0 15.3 16.6 16.0 15.4 16.5 54 3 18.6 12.7 26.6 37.0 22.2 50.7 1,365 10/16/13 16.1 15.2 16.9 16.0 15.4 16.7 16.0 15.5 16.5 54 3 20.2 14.0 28.2 25.9 14.0 46.5 1,366 10/17/13 16.1 15.1 16.7 15.9 15.3 16.5 15.9 15.4 16.4 55 3 19.3 13.5 27.8 30.4 18.0 43.3 1,367 10/18/13 15.9 15.0 16.6 15.8 15.2 16.4 15.8 15.2 16.3 55 3 19.1 10.0 30.7 30.6 14.6 50.9 1,368 10/19/13 15.9 14.8 16.7 15.7 15.1 16.3 15.7 15.2 16.2 55 2 21.7 13.5 31.0 22.7 11.4 38.4 1,368 10/20/13 15.8 14.9 16.6 15.6 15.0 16.2 15.6 15.0 16.1 55 2 21.0 14.0 29.2 23.1 12.8 45.6 1,369 10/21/13 15.7 14.8 16.3 15.6 15.0 16.1 15.5 15.0 16.0 55 2 19.2 9.2 31.7 29.8 13.2 54.7 1,370 10/22/13 15.8 14.8 16.6 15.5 15.0 16.2 15.5 15.1 16.0 55 2 23.4 16.6 32.1 18.8 10.0 38.8 1,370 10/23/13 15.7 15.0 16.3 15.4 15.0 15.8 15.4 15.0 15.7 55 2 22.1 14.7 30.1 23.2 11.5 46.4 1,371 10/24/13 15.6 14.9 16.2 15.5 14.9 16.0 15.4 15.0 15.9 55 2 18.6 12.3 28.1 35.1 19.2 54.5 1,371 10/25/13 15.6 14.9 16.2 15.4 14.9 16.0 15.4 14.9 15.9 55 3 17.8 11.0 28.0 41.9 20.6 58.0 1,371 10/26/13 15.5 14.8 16.2 15.4 14.8 16.0 15.3 14.8 15.9 55 3 17.5 7.7 30.5 40.9 16.4 64.3 1,371 10/27/13 15.5 14.7 16.1 15.2 14.7 15.8 15.2 14.7 15.7 55 3 17.0 10.1 25.9 38.3 22.5 62.0 1,372 10/28/13 15.2 14.9 15.7 15.1 15.0 15.3 15.1 14.9 15.4 55 3 9.5 6.3 14.7 83.7 59.7 94.9 1,372 10/29/13 15.1 14.5 15.6 14.7 14.3 15.0 14.7 14.3 15.0 55 6 10.3 3.8 18.5 71.3 35.0 96.4 1,372 10/30/13 14.8 14.1 15.3 14.4 13.9 15.1 14.4 13.9 15.0 56 7 11.7 5.7 19.7 59.9 33.9 83.2 1,373 10/31/13 14.7 14.1 15.2 14.3 13.7 14.9 14.3 13.8 14.8 56 6 13.0 5.9 23.6 57.8 26.6 83.5 1,373 1 Temperature data for Redinger Lake at Dam 7 is unavailable from September 29 through October 31 due to the lake draw-down.
Copyright 2013 by Southern California Edison Company B-18 Draft 2013

Draft NASMP and AMP – Big Creek No. 4 Hydroelectric Project, FERC No. 2017 2013 Data Collection Report
APPENDIX C
WESTERN POND TURTLE CAPTURE DATA
Copyright 2013 by Southern California Edison Company Draft 2013
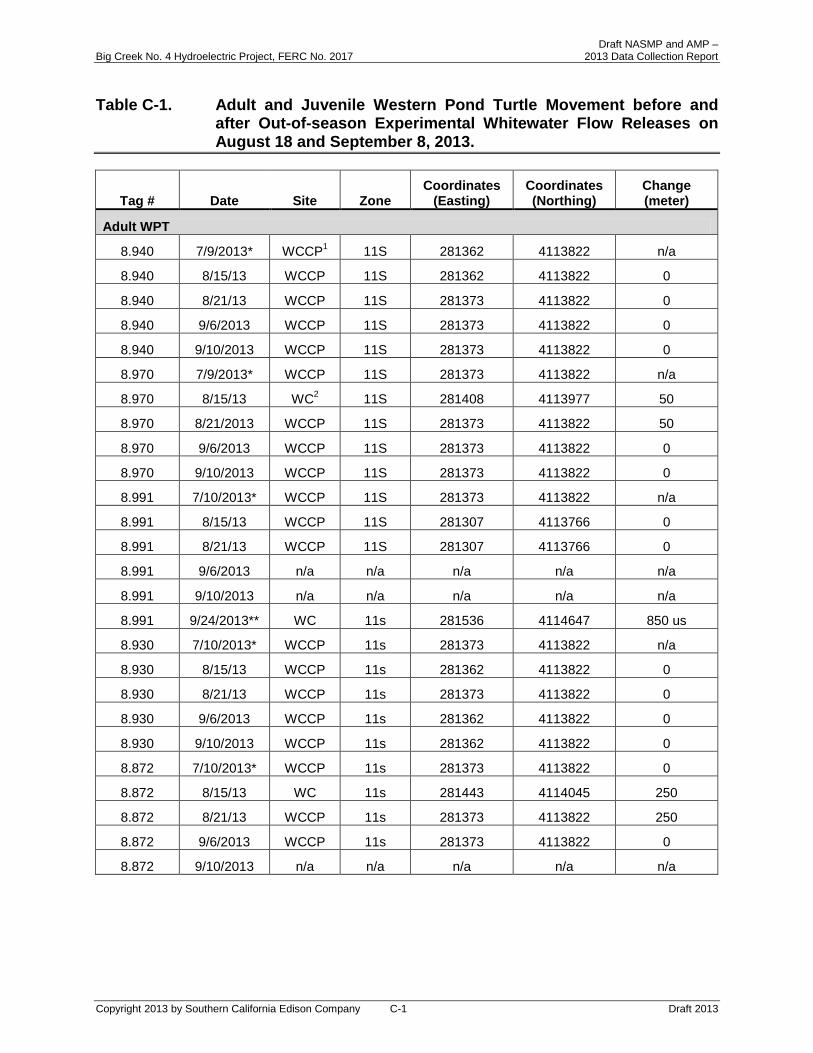
Draft NASMP and AMP – Big Creek No. 4 Hydroelectric Project, FERC No. 2017 2013 Data Collection Report
Table C-1. Adult and Juvenile Western Pond Turtle Movement before and after Out-of-season Experimental Whitewater Flow Releases on August 18 and September 8, 2013.
Tag # Date Site Zone Coordinates
(Easting) Coordinates (Northing)
Change (meter)
Adult WPT
8.940 7/9/2013* WCCP1 11S 281362 4113822 n/a
8.940 8/15/13 WCCP 11S 281362 4113822 0
8.940 8/21/13 WCCP 11S 281373 4113822 0
8.940 9/6/2013 WCCP 11S 281373 4113822 0
8.940 9/10/2013 WCCP 11S 281373 4113822 0
8.970 7/9/2013* WCCP 11S 281373 4113822 n/a
8.970 8/15/13 WC2 11S 281408 4113977 50
8.970 8/21/2013 WCCP 11S 281373 4113822 50
8.970 9/6/2013 WCCP 11S 281373 4113822 0
8.970 9/10/2013 WCCP 11S 281373 4113822 0
8.991 7/10/2013* WCCP 11S 281373 4113822 n/a
8.991 8/15/13 WCCP 11S 281307 4113766 0
8.991 8/21/13 WCCP 11S 281307 4113766 0
8.991 9/6/2013 n/a n/a n/a n/a n/a
8.991 9/10/2013 n/a n/a n/a n/a n/a
8.991 9/24/2013** WC 11s 281536 4114647 850 us
8.930 7/10/2013* WCCP 11s 281373 4113822 n/a
8.930 8/15/13 WCCP 11s 281362 4113822 0
8.930 8/21/13 WCCP 11s 281373 4113822 0
8.930 9/6/2013 WCCP 11s 281362 4113822 0
8.930 9/10/2013 WCCP 11s 281362 4113822 0
8.872 7/10/2013* WCCP 11s 281373 4113822 0
8.872 8/15/13 WC 11s 281443 4114045 250
8.872 8/21/13 WCCP 11s 281373 4113822 250
8.872 9/6/2013 WCCP 11s 281373 4113822 0
8.872 9/10/2013 n/a n/a n/a n/a n/a
Copyright 2013 by Southern California Edison Company C-1 Draft 2013

Draft NASMP and AMP – Big Creek No. 4 Hydroelectric Project, FERC No. 2017 2013 Data Collection Report
Table C-1. Adult and Juvenile Western Pond Turtle Movement before and after Out-of-season Experimental Whitewater Flow Releases on August 18 and September 8, 2013 (continued).
Tag # Date Site Zone Coordinates
(Easting) Coordinates (Northing)
Change (meter)
8.872 9/24/2013** WC 11s 281443 4114045 250
8.961 7/17/2013* BCCP3 11s 280313 4109982 n/a
8.961 8/15/13 BCCP 11s 280313 4109982 0
8.961 8/21/13 BCCP 11s 280313 4109982 0
8.961 9/6/2013 BCCP 11s 280313 4109982 0
8.961 9/10/2013 BCCP 11s 280313 4109982 0
8.881 7/17/2013* BCCP 11s 280313 4109982 n/a
8.881 8/15/13 BCCP 11s 280313 4109982 0
8.881 8/21/13 BCCP 11s 280313 4109982 0
8.881 9/6/2013 BCCP 11s 280313 4109982 0
8.881 9/10/2013 BCCP 11s 280313 4109982 0
8.850 7/17/2013* BCCP 11s 280313 4109982 n/a
8.850 8/15/13 BCCP 11s 280313 4109982 0
8.850 8/21/13 BCCP 11s 280313 4109982 0
8.850 9/6/2013 BCCP 11s 280313 4109982 0
8.850 9/10/2013 BCCP 11s 280313 4109982 0
8.903 7/17/2013* BCCP 11s 280313 4109982 n/a
8.903 8/15/13 BCCP 11s 280313 4109982 0
8.903 8/21/13 BCCP 11s 280313 4109982 0
8.903 9/6/2013 BCCP 11s 280313 4109982 0
8.903 9/10/2013 BCCP 11s 280313 4109982 0
8.911 7/17/2013* BCCP 11s 280313 4109982 n/a
8.911 8/15/13 BCCP 11s 280313 4109982 0
8.911 8/21/13 BCCP 11s 280313 4109982 0
8.911 9/6/2013 BCCP 11s 280313 4109982 0
8.911 9/10/2013 BCCP 11s 280313 4109982 0
Copyright 2013 by Southern California Edison Company C-2 Draft 2013

Draft NASMP and AMP – Big Creek No. 4 Hydroelectric Project, FERC No. 2017 2013 Data Collection Report
Table C-1. Adult and Juvenile Western Pond Turtle Movement before and after Out-of-season Experimental Whitewater Flow Releases on August 18 and September 8, 2013 (continued).
Tag # Date Site Zone Coordinates
(Easting) Coordinates (Northing)
Change (meter)
Juvenile WPT
8.841 7/17/2013* BCCP 11s 280313 4109982 n/a
8.841 8/15/13 BCCP 11s 280313 4109982 0
8.841 8/21/13 BCCP 11s 280272 4109974 85 ds
8.841 9/6/2013 n/a n/a n/a n/a n/a
8.841 9/10/2013 n/a n/a n/a n/a n/a
8.818 7/17/2013* BCCP 11s 280313 4109982 n/a
8.818 8/15/13 BCCP 11s 280313 4109982 0
8.818 8/21/13 BCCP 11s 280313 4109982 0
8.818 9/6/2013 n/a n/a n/a n/a n/a
8.818 9/10/2013 n/a n/a n/a n/a n/a
8.818 9/25/2013** BCCP 11s 280313 4109982 0
8.789 7/17/2013* BCCP 11s 280313 4109982 n/a
8.789 8/15/13 BCCP 11s 280313 4109982 0
8.789 8/21/13 BCCP 11s 280313 4109982 0
8.789 9/6/2013 BCCP 11s 11s 11s 0
8.789 9/10/2013 n/a n/a n/a n/a n/a
8.789 9/24/2013** BCCP 11s 280313 4109982 0 ¹ WCCP = Willow Creek confluence pool. 2 WC = Willow Creek 3 BCCP = Backbone Creek Confluence Pool *Initial capture date. **Captured during WPT demography study
Copyright 2013 by Southern California Edison Company C-3 Draft 2013
Draft NASMP and AMP – Big Creek No. 4 Hydroelectric Project, FERC No. 2017 2013 Data Collection Report
APPENDIX D
LARVAL FISH DIP NET DATA
Copyright 2013 by Southern California Edison Company Draft 2013

Draft NASMP and AMP – Big Creek No. 4 Hydroelectric Project, FERC No. 2017 2013 Data Collection Report
Table D-1. Larval Fish Displacement from Site Willow Creek Confluence Pool from Before to After First Experimental Whitewater Flow Release, August 16 and August 20, 2013.
Before First Experimental Whitewater Flow
Larval Trap Site Date Species # of Larvae Length Range
(mm) 1230 WCCP 8/16/2013 Hardhead 1 37 Dip Netting Site Date Species # of Larvae Length (mm) Replicate 1 WCCP 8/16/2013 - - - Replicate 2 WCCP 8/16/2013 - - - Replicate 3 WCCP 8/16/2013 - - - Replicate 4 WCCP 8/16/2013 - - - Replicate 5 WCCP 8/16/2013 - - - Replicate 6 WCCP 8/16/2013 - - - Replicate 7 WCCP 8/16/2013 - - - Replicate 8 WCCP 8/16/2013 - - - Replicate 9 WCCP 8/16/2013 - - - Replicate 10 WCCP 8/16/2013 - - -
After First Experimental Whitewater Flow
Larval Trap Site Date Species # of Larvae Length Range
(mm) - WCCP 8/20/2013 - - -
Dip Netting Site Date Species # of Larvae Length (mm) Replicate 1 WCCP 8/20/2013 - - - Replicate 2 WCCP 8/20/2013 - - - Replicate 3 WCCP 8/20/2013 - - - Replicate 4 WCCP 8/20/2013 - - - Replicate 5 WCCP 8/20/2013 - - - Replicate 6 WCCP 8/20/2013 - - - Replicate 7 WCCP 8/20/2013 - - - Replicate 8 WCCP 8/20/2013 - - - Replicate 9 WCCP 8/20/2013 - - - Replicate 10 WCCP 8/20/2013 - - -
WCCP = Willow Creek Confluence Pool
Copyright 2013 by Southern California Edison Company D-1 Draft 2013
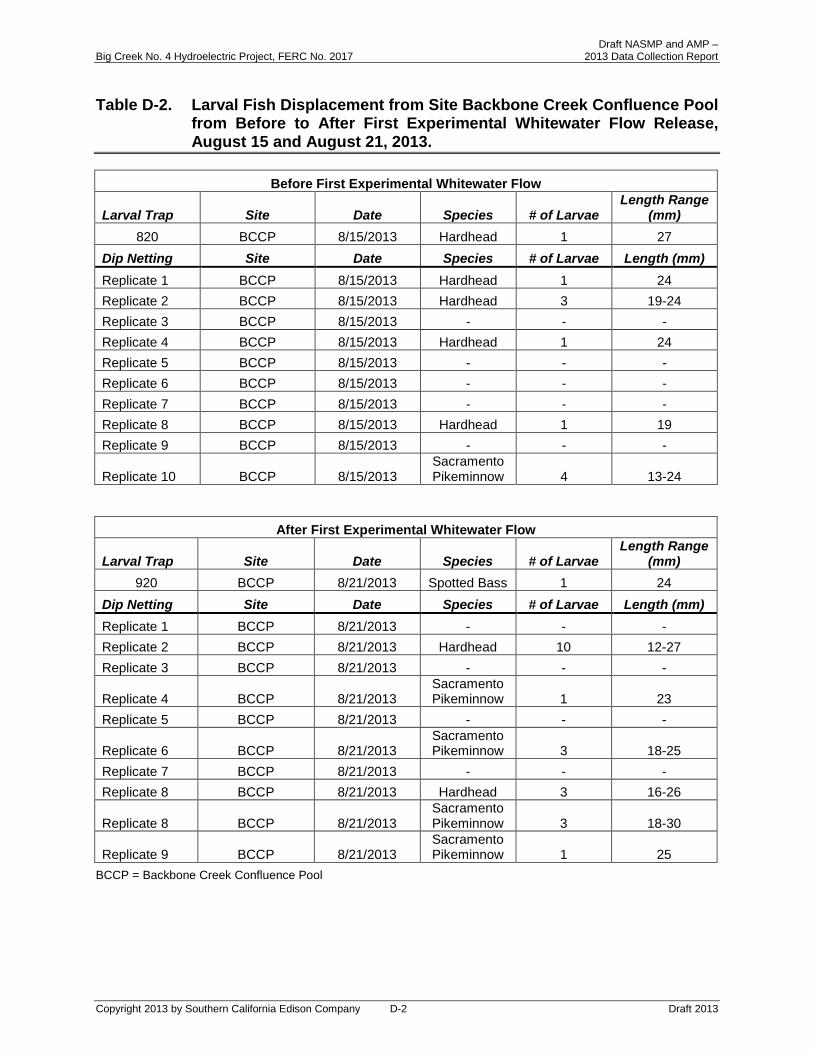
Draft NASMP and AMP – Big Creek No. 4 Hydroelectric Project, FERC No. 2017 2013 Data Collection Report
Table D-2. Larval Fish Displacement from Site Backbone Creek Confluence Pool from Before to After First Experimental Whitewater Flow Release, August 15 and August 21, 2013.
Before First Experimental Whitewater Flow
Larval Trap Site Date Species # of Larvae Length Range
(mm) 820 BCCP 8/15/2013 Hardhead 1 27
Dip Netting Site Date Species # of Larvae Length (mm) Replicate 1 BCCP 8/15/2013 Hardhead 1 24 Replicate 2 BCCP 8/15/2013 Hardhead 3 19-24 Replicate 3 BCCP 8/15/2013 - - - Replicate 4 BCCP 8/15/2013 Hardhead 1 24 Replicate 5 BCCP 8/15/2013 - - - Replicate 6 BCCP 8/15/2013 - - - Replicate 7 BCCP 8/15/2013 - - - Replicate 8 BCCP 8/15/2013 Hardhead 1 19 Replicate 9 BCCP 8/15/2013 - - -
Replicate 10 BCCP 8/15/2013 Sacramento Pikeminnow 4 13-24
After First Experimental Whitewater Flow
Larval Trap Site Date Species # of Larvae Length Range
(mm) 920 BCCP 8/21/2013 Spotted Bass 1 24
Dip Netting Site Date Species # of Larvae Length (mm) Replicate 1 BCCP 8/21/2013 - - - Replicate 2 BCCP 8/21/2013 Hardhead 10 12-27 Replicate 3 BCCP 8/21/2013 - - -
Replicate 4 BCCP 8/21/2013 Sacramento Pikeminnow 1 23
Replicate 5 BCCP 8/21/2013 - - -
Replicate 6 BCCP 8/21/2013 Sacramento Pikeminnow 3 18-25
Replicate 7 BCCP 8/21/2013 - - - Replicate 8 BCCP 8/21/2013 Hardhead 3 16-26
Replicate 8 BCCP 8/21/2013 Sacramento Pikeminnow 3 18-30
Replicate 9 BCCP 8/21/2013 Sacramento Pikeminnow 1 25
BCCP = Backbone Creek Confluence Pool
Copyright 2013 by Southern California Edison Company D-2 Draft 2013
Draft NASMP and AMP – Big Creek No. 4 Hydroelectric Project, FERC No. 2017 2013 Data Collection Report
Table D-3. Larval Fish Displacement from Site 5 from Before to After First Experimental Whitewater Flow Release, August 16 and August 21, 2013.
Before First Experimental Whitewater Flow
Larval Trap Site Date Species # of Larvae Length Range
(mm) - Site 5 8/16/2013 - - -
Dip Netting Site Date Species # of Larvae Length (mm) Replicate 1 Site 5 8/16/2013 Hardhead 1 35
Replicate 1 Site 5 8/16/2013 Sacramento Pikeminnow 1 26
Replicate 2 Site 5 8/16/2013 - - - Replicate 3 Site 5 8/16/2013 Hardhead 6 18-27 Replicate 4 Site 5 8/16/2013 Hardhead 2 17-22 Replicate 5 Site 5 8/16/2013 Hardhead 4 25-27 Replicate 6 Site 5 8/16/2013 - - - Replicate 7 Site 5 8/16/2013 - - - Replicate 8 Site 5 8/16/2013 Hardhead 1 23
Replicate 9 Site 5 8/16/2013 - - -
After First Experimental Whitewater Flow
Larval Trap Site Date Species # of Larvae Length Range
(mm) - Site 5 8/21/2013 - - -
Dip Netting Site Date Species # of Larvae Length (mm) Replicate 1 Site 5 8/21/2013 - - - Replicate 2 Site 5 8/21/2013 - - - Replicate 3 Site 5 8/21/2013 - - - Replicate 4 Site 5 8/21/2013 Hardhead 1 27 Replicate 5 Site 5 8/21/2013 - - - Replicate 6 Site 5 8/21/2013 - - - Replicate 7 Site 5 8/21/2013 - - - Replicate 8 Site 5 8/21/2013 - - - Replicate 9 Site 5 8/21/2013 - - - Replicate 10 Site 5 8/21/2013 - - -
Site 5 = Fish Population Sampling Site 5
Copyright 2013 by Southern California Edison Company D-3 Draft 2013

Draft NASMP and AMP – Big Creek No. 4 Hydroelectric Project, FERC No. 2017 2013 Data Collection Report
Table D-4. Larval Fish Displacement from Site 6 from Before to After First Experimental Whitewater Flow Release, August 16 and August 20, 2013.
Before First Experimental Whitewater Flow
Larval Trap Site Date Species # of Larvae Length Range
(mm) - Site 6 8/16/2013 - - -
Dip Netting Site Date Species # of Larvae Length (mm) Replicate 1 Site 6 8/16/2013 - - - Replicate 2 Site 6 8/16/2013 Hardhead 1 21
Replicate 2 Site 6 8/16/2013 Sacramento Pikeminnow 1 29
Replicate 3 Site 6 8/16/2013 Hardhead 13 22-28 Replicate 4 Site 6 8/16/2013 - - - Replicate 5 Site 6 8/16/2013 Hardhead 3 19-24 Replicate 6 Site 6 8/16/2013 Hardhead 2 19-24 Replicate 7 Site 6 8/16/2013 - - - Replicate 8 Site 6 8/16/2013 - - -
Replicate 9 Site 6 8/16/2013 Hardhead 1 28
After First Experimental Whitewater Flow
Larval Trap Site Date Species # of Larvae Length Range
(mm) - Site 6 8/20/2013 - - -
Dip Netting Site Date Species # of Larvae Length (mm)
Replicate 1 Site 6 8/20/2013 Sacramento Pikeminnow 1 23
Replicate 2 Site 6 8/20/2013 - - - Replicate 3 Site 6 8/20/2013 Hardhead 7 22-31 Replicate 4 Site 6 8/20/2013 - - - Replicate 5 Site 6 8/20/2013 - - - Replicate 6 Site 6 8/20/2013 Hardhead 1 20 Replicate 7 Site 6 8/20/2013 - - - Replicate 8 Site 6 8/20/2013 - - - Replicate 9 Site 6 8/20/2013 - - - Replicate 10 Site 6 8/20/2013 Hardhead 4 24-30
Site 6 = Fish Population Sampling Site 6
Copyright 2013 by Southern California Edison Company D-4 Draft 2013
Draft NASMP and AMP – Big Creek No. 4 Hydroelectric Project, FERC No. 2017 2013 Data Collection Report
Table D-5. Larval Fish Displacement from Site Willow Creek Confluence Pool from Before to After Second Experimental Whitewater Flow Release, September 9 and September 11, 2013.
Before Second Experimental Whitewater Flow
Larval Trap Site Date Species # of Larvae Length Range
(mm) - WCCP 9/6/2013 - - -
Dip Netting Site Date Species # of Larvae Length (mm) Replicate 1 WCCP 9/6/2013 - - - Replicate 2 WCCP 9/6/2013 - - - Replicate 3 WCCP 9/6/2013 - - - Replicate 4 WCCP 9/6/2013 - - - Replicate 5 WCCP 9/6/2013 - - - Replicate 6 WCCP 9/6/2013 - - - Replicate 7 WCCP 9/6/2013 - - - Replicate 8 WCCP 9/6/2013 - - - Replicate 9 WCCP 9/6/2013 - - - Replicate 10 WCCP 9/6/2013 - - -
After Second Experimental Whitewater Flow
Larval Trap Site Date Species # of Larvae Length Range
(mm) - WCCP 9/11/2013 - - -
Dip Netting Site Date Species # of Larvae Length (mm) Replicate 1 WCCP 9/11/2013 - - - Replicate 2 WCCP 9/11/2013 - - - Replicate 3 WCCP 9/11/2013 - - - Replicate 4 WCCP 9/11/2013 - - - Replicate 5 WCCP 9/11/2013 - - - Replicate 6 WCCP 9/11/2013 - - - Replicate 7 WCCP 9/11/2013 - - - Replicate 8 WCCP 9/11/2013 - - - Replicate 9 WCCP 9/11/2013 - - - Replicate 10 WCCP 9/11/2013 - - -
WCCP = Willow Creek Confluence Pool
Copyright 2013 by Southern California Edison Company D-5 Draft 2013

Draft NASMP and AMP – Big Creek No. 4 Hydroelectric Project, FERC No. 2017 2013 Data Collection Report
Table D-6. Larval Fish Displacement from Site Backbone Creek Confluence Pool from Before to After Second Experimental Whitewater Flow Release, September 6 and September 11, 2013.
Before Second Experimental Whitewater Flow
Larval Trap Site Date Species # of Larvae Length Range
(mm) - BCCP 9/6/2013 - - -
Dip Netting Site Date Species # of Larvae Length (mm) Replicate 1 BCCP 9/6/2013 - - - Replicate 2 BCCP 9/6/2013 Hardhead 6 23-33 Replicate 3 BCCP 9/6/2013 Hardhead 1 28
Replicate 4 BCCP 9/6/2013 Sacramento Pikeminnow 3 25-28
Replicate 5 BCCP 9/6/2013 - - - Replicate 6 BCCP 9/6/2013 - - - Replicate 7 BCCP 9/6/2013 Hardhead 1 21 Replicate 8 BCCP 9/6/2013 - - -
Replicate 9 BCCP 9/6/2013 Sacramento Pikeminnow 1 21
Replicate 10 BCCP 9/6/2013 Hardhead 2 24-25
Replicate 10 BCCP 9/6/2013 Sacramento Pikeminnow 2 27-34
After Second Experimental Whitewater Flow
Larval Trap Site Date Species # of Larvae Length Range
(mm) - BCCP 9/11/2013 - - -
Dip Netting Site Date Species # of Larvae Length (mm) Replicate 1 BCCP 9/11/2013 - - - Replicate 2 BCCP 9/11/2013 Hardhead 1 28 Replicate 3 BCCP 9/11/2013 Hardhead 1 32 Replicate 4 BCCP 9/11/2013 - - - Replicate 5 BCCP 9/11/2013 - - - Replicate 6 BCCP 9/11/2013 Hardhead 1 26 Replicate 7 BCCP 9/11/2013 - - - Replicate 8 BCCP 9/11/2013 - - - Replicate 9 BCCP 9/11/2013 - - - Replicate 10 BCCP 9/11/2013 - - -
BCCP = Backbone Creek Confluence Pool
Copyright 2013 by Southern California Edison Company D-6 Draft 2013

Draft NASMP and AMP – Big Creek No. 4 Hydroelectric Project, FERC No. 2017 2013 Data Collection Report
Table D-7. Larval Fish Displacement from Site 5 from Before to After Second Experimental Whitewater Flow Release, September 6 and September 11, 2013.
Before Second Experimental Whitewater Flow
Larval Trap Site Date Species # of Larvae Length Range
(mm) - Site 5 9/6/2013 - - -
Dip Netting Site Date Species # of Larvae Length (mm) Replicate 1 Site 5 9/6/2013 - - - Replicate 2 Site 5 9/6/2013 - - - Replicate 3 Site 5 9/6/2013 - - -
Replicate 4 Site 5 9/6/2013 Sacramento Pikeminnow 1 37
Replicate 5 Site 5 9/6/2013 Hardhead 2 24-34 Replicate 6 Site 5 9/6/2013 - - - Replicate 7 Site 5 9/6/2013 - - - Replicate 8 Site 5 9/6/2013 - - - Replicate 9 Site 5 9/6/2013 - - - Replicate 10 Site 5 9/6/2013 - - -
After Second Experimental Whitewater Flow
Larval Trap Site Date Species # of Larvae Length Range
(mm) - Site 5 9/11/2013 - - -
Dip Netting Site Date Species # of Larvae Length (mm) Replicate 1 Site 5 9/11/2013 - - - Replicate 2 Site 5 9/11/2013 - - - Replicate 3 Site 5 9/11/2013 - - - Replicate 4 Site 5 9/11/2013 - - - Replicate 5 Site 5 9/11/2013 Hardhead 1 27 Replicate 6 Site 5 9/11/2013 - - - Replicate 7 Site 5 9/11/2013 - - - Replicate 8 Site 5 9/11/2013 - - - Replicate 9 Site 5 9/11/2013 - - - Replicate 10 Site 5 9/11/2013 - - -
Site 5 = Fish Population Sampling Site 5
Copyright 2013 by Southern California Edison Company D-7 Draft 2013

Draft NASMP and AMP – Big Creek No. 4 Hydroelectric Project, FERC No. 2017 2013 Data Collection Report
Table D-8. Larval Fish Displacement from Site 6 from Before to After Second Experimental Whitewater Flow Release, September 6 and September 11, 2013.
Before Second Experimental Whitewater Flow
Larval Trap Site Date Species # of Larvae Length Range
(mm) 1520 Site 6 9/6/2013 Spotted Bass 2 58-68
Dip Netting Site Date Species # of Larvae Length (mm) Replicate 1 Site 6 9/6/2013 - - - Replicate 2 Site 6 9/6/2013 - - - Replicate 3 Site 6 9/6/2013 - - - Replicate 4 Site 6 9/6/2013 - - - Replicate 5 Site 6 9/6/2013 - - - Replicate 6 Site 6 9/6/2013 - - - Replicate 7 Site 6 9/6/2013 - - - Replicate 8 Site 6 9/6/2013 - - - Replicate 9 Site 6 9/6/2013 - - - Replicate 10 Site 6 9/6/2013 - - -
After Second Experimental Whitewater Flow
Larval Trap Site Date Species # of Larvae Length Range
(mm) - Site 6 9/11/2013 - - -
Dip Netting Site Date Species # of Larvae Length (mm) Replicate 1 Site 6 9/11/2013 Hardhead 1 31 Replicate 2 Site 6 9/11/2013 - - - Replicate 3 Site 6 9/11/2013 - - - Replicate 4 Site 6 9/11/2013 - - - Replicate 5 Site 6 9/11/2013 - - - Replicate 6 Site 6 9/11/2013 - - - Replicate 7 Site 6 9/11/2013 - - - Replicate 8 Site 6 9/11/2013 - - - Replicate 9 Site 6 9/11/2013 - - - Replicate 10 Site 6 9/11/2013 - - -
Site 6 = Fish Population Sampling Site 6
Copyright 2013 by Southern California Edison Company D-8 Draft 2013

Draft NASMP and AMP – Big Creek No. 4 Hydroelectric Project, FERC No. 2017 2013 Data Collection Report
APPENDIX E
DISPLACEMENT STUDY SNORKEL OBSERVATIONS
Copyright 2013 by Southern California Edison Company Draft 2013

Draft NASMP and AMP – Big Creek No. 4 Hydroelectric Project, FERC No. 2017 2013 Data Collection Report
Table E1. Visual Estimates of Fish Abundance by Species and Length Category for Fish Population Sampling Site 3 (Horseshoe Bend East) to Estimate Displacement Associated with Out-of-season Experimental Whitewater Flow Releases.
Number of fish by species and size before the first out-of-season experimental whitewater flow August 13, 2013.
Species Size (inches) 0-3 3-6 6-9 9⁺ Total Hardhead 0 0 0 9 9 Sacramento Pikeminnow 0 0 0 0 0 Sacramento Sucker 105 0 0 23 128 ”Unidentified Cyprinids” 30 0 0 0 30 Rainbow Trout 1 1 3 10 15 Spotted Bass 0 0 0 6 6
Number of fish by species and size after the first and before the second out-of-season experimental whitewater flow on August 20, 2013.
Species Size (inches) 0-3 3-6 6-9 9⁺ Total Hardhead 0 29 2 0 31 Sacramento Pikeminnow 0 20 0 2 22 Sacramento Sucker 57 0 2 18 77 ”Unidentified Cyprinids” 52 0 0 0 52 Rainbow Trout 1 2 1 1 5 Spotted Bass 0 0 3 10 13
Number of fish by species and size after the second out-of-season experimental whitewater flow on September 10, 2013.
Species Size (inches) 0-3 3-6 6-9 9⁺ Total Hardhead 0 0 6 0 6 Sacramento Pikeminnow 0 1 0 4 5 Sacramento Sucker 1 0 1 29 31 ”Unidentified Cyprinids” 24 0 0 0 24 Rainbow Trout 0 1 6 7 14 Spotted Bass 0 2 1 1 4
Copyright 2013 by Southern California Edison Company E-1 Draft 2013

Draft NASMP and AMP – Big Creek No. 4 Hydroelectric Project, FERC No. 2017 2013 Data Collection Report
Table E2. Visual Estimates of Fish Abundance by Species and Length Category for Fish Population Sampling Site 4 to Estimate Displacement Associated with Out-of-season Experimental Whitewater Flow Releases.
Number of fish by species and size before the first out-of-season experimental whitewater flow August 13, 2013.
Species Size (inches) 0-3 3-6 6-9 9⁺ Total Hardhead 3 3 5 24 35 Sacramento Pikeminnow 0 0 5 15 20 Sacramento Sucker 20 0 0 2 22 ”Unidentified Cyprinids” 875 0 0 0 875 Rainbow Trout 0 0 0 1 1 Spotted Bass 0 0 0 1 1
Number of fish by species and size after the first and before the second out-of-season experimental whitewater flow on August 20, 2013.
Species Size (inches) 0-3 3-6 6-9 9⁺ Total Hardhead 0 10 7 4 21 Sacramento Pikeminnow 0 0 7 4 11 Sacramento Sucker 41 0 0 14 55 ”Unidentified Cyprinids” 380 540 0 0 920 Rainbow Trout 0 0 1 0 1 Spotted Bass 0 0 0 0 0
Number of fish by species and size after the second out-of-season experimental whitewater flow on September 10, 2013.
Species Size (inches) 0-3 3-6 6-9 9⁺ Total Hardhead 0 0 15 7 22 Sacramento Pikeminnow 0 5 6 11 22 Sacramento Sucker 16 1 12 4 33 ”Unidentified Cyprinids” 1,330 605 0 0 1,935 Rainbow Trout 0 0 0 1 1 Spotted Bass 0 0 3 0 3
Copyright 2013 by Southern California Edison Company E-2 Draft 2013

Draft NASMP and AMP – Big Creek No. 4 Hydroelectric Project, FERC No. 2017 2013 Data Collection Report
Table E3. Visual Estimates of Fish Abundance by Species and Length Category for Fish Population Sampling Site 5 to Estimate Displacement Associated with Out-of-season Experimental Whitewater Flow Releases.
Number of fish by species and size before the first out-of-season experimental whitewater flow August 14, 2013.
Species Size (inches) 0-3 3-6 6-9 9⁺ Total Hardhead 0 0 0 3 3 Sacramento Pikeminnow 0 0 0 3 3 Sacramento Sucker 45 0 0 0 45 ”Unidentified Cyprinids” 1,290 3 0 0 1,293 Rainbow Trout 0 1 0 0 1 Spotted Bass 0 0 0 2 2
Number of fish by species and size after the first and before the second out-of-season experimental whitewater flow on August 21, 2013.
Species Size (inches) 0-3 3-6 6-9 9⁺ Total Hardhead 0 5 2 0 7 Sacramento Pikeminnow 0 3 0 0 3 Sacramento Sucker 23 0 1 2 26 ”Unidentified Cyprinids” 1,843 90 0 0 1,933 Rainbow Trout 0 1 0 0 1 Spotted Bass 1 0 0 10 11
Number of fish by species and size after the second out-of-season experimental whitewater flow on September 11, 2013.
Species Size (inches) 0-3 3-6 6-9 9⁺ Total Hardhead 0 0 0 1 1 Sacramento Pikeminnow 0 0 0 4 4 Sacramento Sucker 10 1 0 9 20 ”Unidentified Cyprinids” 1,778 407 0 0 2,185 Rainbow Trout 0 0 0 0 0 Spotted Bass 0 0 1 2 3
Copyright 2013 by Southern California Edison Company E-3 Draft 2013
Draft NASMP and AMP – Big Creek No. 4 Hydroelectric Project, FERC No. 2017 2013 Data Collection Report
Table E4. Visual Estimates of Fish Abundance by Species and Length Category for Fish Population Sampling Site 6 to Estimate Displacement Associated with Out-of-season Experimental Whitewater Flow Releases.
Number of fish by species and size before the first out-of-season experimental whitewater flow August 14, 2013.
Species Size (inches) 0-3 3-6 6-9 9⁺ Total Hardhead 0 0 0 0 0 Sacramento Pikeminnow 0 0 0 8 8 Sacramento Sucker 7 0 0 3 10 ”Unidentified Cyprinids” 1,950 150 0 0 2,100 Rainbow Trout 0 0 0 0 0 Spotted Bass 0 0 0 3 3
Number of fish by species and size after the first and before the second out-of-season experimental whitewater flow on August 21, 2013.
Species Size (inches) 0-3 3-6 6-9 9⁺ Total Hardhead 0 4 0 0 4 Sacramento Pikeminnow 0 3 0 0 3 Sacramento Sucker 3 0 0 2 5 ”Unidentified Cyprinids” 3,427 6 0 0 3,433 Rainbow Trout 0 0 0 0 0 Spotted Bass 2 0 0 4 6
Number of fish by species and size after the second out-of-season experimental whitewater flow on September 10, 2013.
Species Size (inches) 0-3 3-6 6-9 9⁺ Total Hardhead 0 0 0 0 0 Sacramento Pikeminnow 0 0 0 1 1 Sacramento Sucker 0 0 0 0 0 ”Unidentified Cyprinids” 1,161 0 0 0 1,161 Rainbow Trout 0 0 0 0 0 Spotted Bass 3 0 0 7 10
Copyright 2013 by Southern California Edison Company E-4 Draft 2013

Draft NASMP and AMP – Big Creek No. 4 Hydroelectric Project, FERC No. 2017 2013 Data Collection Report
APPENDIX F
EXAMPLE DATA SHEET FOR
BC4 HORSESHOE BEND WHITEWATER BOATING RECREATIONAL USE LOG
Copyright 2013 by Southern California Edison Company Draft 2013

Draft NASMP and AMP – Big Creek No. 4 Hydroelectric Project, FERC No. 2017 2013 Data Collection Report
Copyright 2013 by Southern California Edison Company F-1 Draft 2013